STANDARDISATION OF VANILLA CURING TECHNIQUES
By
MANJUSHA MATHEWROSHNI RAJU
SHAILESH KUMAR SINGH
Department ofPost Harvest Technology & Agricultural Processing
KELAPPAJI COLLEGE OF AGRICULTURAL ENGINEERINGAND TECHNOLOGY
TAVANUR- 679 573 , MALAPPURAMKERALA , INDIA
2005
1

STANDARDISATION OF VANILLA CURING TECHNIQUES
By MANJUSHA MATHEW
ROSHNI RAJUSHAILESH KUMAR SINGH
PROJECT REPORTSubmitted in partial fulfilment of the
requirement for the degree
Bachelor of Technologyin
Agricultural Engineering
Faculty of Agricultural Engineering
Kerala Agricultural University
Department of
Post Harvest Technology & Agricultural ProcessingKELAPPAJI COLLEGE OF AGRICULTURAL ENGINEERING
AND TECHNOLOGYTAVANUR- 679 573 , MALAPPURAM
KERALA , INDIA2005
2

CERTIFICATE
Certified that this project report entitled “Standardisation of Vanilla Curing
Techniques ” is a record of project work done jointly by Manjusha Mathew, Roshni
Raju and Shailesh Kumar Singh under my guidance and supervision and that it has
not previously formed the basis for the award of any degree, diploma, fellowship or
associate ship to them.
Dr. K. P. Sudheer Assistant Professor Dept. of PHT & AP
K.C.A.E.T, Tavanur
Place : TavanurDate :
3

DECLARATION
We hereby declare that this project report entitled “Standardisation of Vanilla
Curing Techniques ” is a bonafide record of project work done by us during the
course of project and that the report has not previously formed the basis for the award
to us of any degree, diploma, associate ship, fellowship or other similar title of any
other university or society.
Manjusha Mathew
Roshni Raju
Shailesh Kumar Singh
Place : TavanurDate :
5

ACKNOWLEDGEMENT
It gives us immense pleasure to express our deep sense of gratitude and indebtedness
to Dr. K.P Sudheer, Chairman of the project and Assistant Professor, Department of
Post Harvest Technology and Agricultural Processing, for his valuable guidance,
profound suggestions and constant encouragement and advice throughout the project
work.
We are also greatly indebted to Professor C.P Muhammad, Dean, K.C.A.E.T. and Dr.
K. I. Koshy, Professor and head of Department of SAC.
We are grateful to Dr. Santhi Mary Mathew, Associate Professor and head of
Department of PHT& AP , Er. Prince M.V., Asst. Professor, Dept. of PHT& AP, for
the valuable guidance.
We also remain indebted to all our friends at K.C.A.E.T, who helped us in completing
this work successfully.
At this moment, we thankfully acknowledge the blessings of our loving parents for
their stable support throughout the work.
Above all, we bow our head before the Almighty, whose grace has made us complete
this task successfully.
Manjusha MathewRoshni RajuShailesh Kumar Singh
6

CONTENTS
Chapter Title Page number
I
II
III
IV
V
List of Tables
List of Figures
List of Plates
Symbols and Abbreviations
Introduction
Review of Literature
Materials and Methods
Results and Discussions
Summary and Conclusion
References
Appendices
Abstract
1
4
18
34
68
71
7

LIST OF TABLES
Table No: Title Page No
4.1
4.2
4.3
4.4
4.5
4.6
4.7
4.8
4.9
4.10
4.11
Area under vanilla cultivation
Adoption of cultivation techniques
Interaction between land holding and curing
Adoption of curing techniques
Condition of curing
Physical properties of fresh beans
Moisture content of fresh beans
Observed feature of hot water killed- sun dried beans
Observed feature of alcohol killed- sun dried beans
Observed feature of hot water killed - high
temperature mechanically dried beans
Observed feature of hot water killed- low temperature
mechanically dried beans
34
36
37
38
39
40
40
65
66
66
67
8

LIST OF FIGURES
Table No: Title Page No3.1
3.2
3.3
4.1
4.2
4.3
4.4
4.5
4.6
4.7
4.8
4.9
4.10
4.11
4.12
4.13
4.14
4.15
4.16
4.17
Isometric view of wooden box
Wooden shelf
Flow chart showing vanilla curing process
Percentage of total area under cultivation
Curing practice
Moisture Vs Time during sweating for sample A
Moisture Vs Time during sweating for sample B
Moisture Vs Time during sweating for sample C
Length Vs Time during curing, for sample A
Length Vs Time during curing for sample B
Length Vs Time during curing for sample C
Breadth Vs Time during curing for sample A
Breadth Vs Time during curing for sample B
Breadth Vs Time during curing for sample C
Thickness Vs Time during curing for sample A
Thickness Vs Time during curing for sample B
Thickness Vs Time during curing for sample C
Moisture Vs Time during slow drying for sample A
Moisture Vs Time during slow drying for sample B
Moisture Vs Time during slow drying for sample C
23
24
28
35
37
41
42
43
44
45
46
47
47
48
49
49
49
53
54
55
9

4.18
4.19
4.20
Moisture Vs Time during conditioning for sample A
Moisture Vs Time during conditioning for sample B
Moisture Vs Time during conditioning for sample C
60
61
62
10

LIST OF PLATES
No. Plates Page No.
1
2
3
4
5
6
7
8
9
10
11
12
13
14
15
16
17
Vanilla Grower conducting curing
Sorting of Fresh Vanilla Beans
Sun Drying by Farmers
Fresh Vanilla Beans
Convective Drier
Wooden Box
Wooden shelf
Killing using hot Water
Killing Using Alcohol
Sun drying
Sweating in wooden box
Sample A beans after sweating and drying
Sample B Beans after sweating and drying
Sample C Beans after sweating and dryingSlow Drying of Beans on Wooden shelf
Beans after Slow Drying Followed By Bundling
Beans Wrapped in Bee-Wax Paper for Conditioning
18
19
19
20
22
23
25
29
30
31
31
51
51
52
52
59
59
13

SYMBOLS AND ABBREVIATIONS
cm - Centimetre(s)
db - Dry bulb
et al. - And others
etc. - etcetera
Fig. - figure (s)
g - gram(s)
h -hour (s)
K.C.A.E.T - Kelappaji College Of Agricultural Engineering And Technology min. - minute (s)
MC -moisture content
R.H -Relative humidity
Rs. -ruppees
s - second (s)
viz. -namely
wt -weight
& - and
% - Per cent
C - degree centigrade
@ - at the rate of
14

DEDICATED TO OUR
PROFESSION OF
AGRICULTURAL ENGINEERING
16

INTRODUCTION
17

INTRODUCTION
Vanilla, an important and popular flavoring material and spice, is the fully-
grown fruits of the orchid Vanilla planifolia. Vanilla is used extensively to flavour ice
cream, chocolate, beverages, cakes and other confectionary. It is also used in the
perfumery and to a small extent in medicine.
The fragrance and flavour of vanilla beans is due to numerous aromatic
compounds produced during the curing operation, among which vanillin is the most
abundant. The flavour of vanilla from different parts of the world varies due to
climate, soil, extent of pollination, and degree of ripeness at harvesting and method of
curing.
Vanillin was first isolated from vanilla by Gobley in 1858. It was first
produced artificially by Tiemann and Haarmann in 1874, from the glucoside
Coniferin, which occurs in the sapwood of certain conifers. Synthetic vanillin is much
cheaper than natural vanilla flavour. Synthetic vanillin is produced from the waste
sulphite liquor of paper mills, from coal-tar extracts and from eugenol obtained from
clove oil. Nevertheless, the flavour of vanilla beans from V.Fragrans is far superior to
that of synthetic vanillin, due to the presence of other flavour compounds in the
natural product. This seems to be the deciding factor in the favour of the natural
product as flavouring by the gourmet. It is necessary to use natural vanilla flavour
according to the United States Drug Administration labelling regulations for frozen
desserts, which has been strengthened and stabilized the natural vanilla industries.
World production of vanilla beans in 2001 was 5583 tonnes (Anon., 2003).
Indonesia provides about 50% of the world supply and the rest from Madagascar,
Mexico, Tonga as well as Comoro and Reunion. Mainly three countries dominate
vanilla imports viz. the United States of America, France and Germany. Importers in
Germany and France are suppliers to other countries especially in Europe.
18

India has just entered the production market of vanilla beans. Our production
in the year 2001 was 100 tonnes (Anon., 2003), which is quite insignificant in global
scenario. Karnataka occupies the largest area of vanilla cultivation in India with 1,465
hectares followed by Kerala (812 hectares) and Tamil Nadu (268 hectares)
(Anilkumar, 2004). Presently, the green beans are being sold at the rate of Rs.300 per
kg; where as the processed vanilla fetch a price of around Rs.10,000 per kg
(Anilkumar, 2004). But processing technologies for vanilla are still primitive in India,
and many farmers are satisfied with growing and supplying green beans. Considering
the fact that the cost of production is low, farmers are finding vanilla cultivation very
attractive.
Immature vanilla beans are dark green in colour. They would be ready for
harvest in about 9 to 11 months (Pruthi, 2000). When fully matured they have a pale
yellowing at the distal end. If unharvested the bean fully turns yellow and starts
splitting, giving out a small quantity of oil, reddish brown in colour called the Balsam
of vanilla. Eventually they become dry, brittle and finally become scentless.
Therefore, artificial methods are employed to cure vanilla (Pruthi, 2000).
The fresh vanilla beans do not have any flavour or aroma because vanillin and
other chemical substances responsible for imparting the peculiar fragrance and
flavour are not present in the free form at the time of harvesting. During process of
curing, free vanillin is developed in the beans as result of series of enzymatic action
on several glucosides. Simultaneously various aldehydes, aromatic ester,
protocatechic acid, benzoic acid, vanillic acid and anisic alcohol are also formed and
together gives the fragrance of natural vanilla well distinguishable from synthetic
vanillin. If proper facilities are available and training given to farmers, vanilla curing
can be done as an on-farm operation. This would ensure better returns by producing
vanilla beans with export quality.
19

With this in view, an attempt has been made at K.C.A.E.T, Tavanur with the
following objectives.
1. To conduct a survey among vanilla growers to identify the various constraints
in vanilla cultivation and processing.
2. To determine the physical properties of fresh and cured vanilla beans.
3. To standardise the parameters responsible for curing of vanilla.
4. To compare the results with traditional curing technique.
20

REVIEW OF LITERATURE
21

REVIEW OF LITERATURE
Extensive work has been done on the various processes involved in vanilla
cultivation and processing. This chapter deals with some of the works that have been
done on this subject during the past years.
2.1 Crop Management
2.1.1 Vanilla Crop:
Natural vanillin is obtained from the cured pods (fruits) of the vanilla plant
Vanilla planifolia (Family: Orchidaceae). Vanilla is a perennial climbing orchid with
sessile leaves and succulent green stems, producing aerial roots at the nodes. It is a
native of Mexico and was introduced to India as early as 1835. Karnataka has the
largest area under vanilla in the country. There are three important cultivated species
of vanilla namely, Vanilla planifolia (Mexican vanilla) V. pompona (West Indian
vanilla), and V. tahitensis (Tahitian vanilla). V. planifolia is predominantly cultivated
for production of vanillin. V. tahitensis and V. pompona also yield vanillin, apart from
V. planifolia, but of inferior quality. Some of the important commercial varieties are:
Bourbon vanilla, Seychelles and Mauritius vanilla, South American vanilla and Tahiti
vanilla (www.gnujake.med.yale.edu/herbmed).
2.1.2 Climate and Soil
Vanilla is adapted to a wide range of soil types rich in humus and having good
drainage. It thrives well in humid tropical climate with an annual rainfall of 200-300
cm from sea level to 1500 m above sea level (Anon., 2004). A warm humid climate
with temperature ranging from 21 to 32°C is ideal for the plant. The rainfall should be
well distributed for a period of 9 months and there should be a dry period of 3 months
for flowering (Purseglove et al. 1998). In India, parts of Kerala, Karnataka and Tamil
22

Nadu, northeastern region and Andaman and Nicobar Islands are suitable for vanilla
cultivation. Clayey soils and waterlogged areas are not suitable for the plant.
2.1.3 Propagation
Vanilla is usually propagated by stem cuttings. Cuttings of 60-120 cm long can be selected as planting material for direct
planting in the field (Purseglove et al. 1998). The stem cuttings after collection should be washed thoroughly and dipped in
Bordeaux mixture 1% or copper oxychloride 0.2% for killing pathogenic fungi, if any. Then the cuttings are stored in a
cool shaded place for 2-3 days for partial loss of moisture, a process that enhances rooting. Tissue cultured plantlets can
also be utilized for planting.
2.1.4 Planting and After Care
Vanilla can be raised either as mono-crop or intercrop in coconut and arecanut
gardens. It is usually trailed on low branching, rough barked trees like Glyricidia
maculata, Plumeria alba, jack (Artocarpus heterophyllus), Erythrina sp., etc. or on
dead standards. The standards have to be planted well in advance at a spacing of 1.2-
1.5 m within rows and 2.5-3.0 m between rows. The vanilla plants should be allowed
to trail horizontally on poles tied to trees after trailing to a height of 1.5- 2.0 m or
coiled around the branches so as to facilitate pollination and harvesting. The cuttings
should be planted with two nodes below the soil surface and at the rate of two
cuttings per standard. The cuttings sprout within 4-8 weeks (Pruthi, 2000).
2.1.5 Manuring
The quantity of fertilizers to be applied may vary based on the fertility status
of the soil. However, 40-60 g of N, 20-30 g of P 2O5 and 60-100 g of K2O should be
given to each vine per year besides organic manures such as vermi compost, oil
cakes, poultry manure, wood ash etc (Anon., 2001).
2.1.6 Flowering and Pollination
23

Vanilla usually starts flowering in the third year of planting. The flowers are to
be artificially pollinated (hand pollination) for fruit set. Since the flowers last only for
a day, pollination must be done on the same day. The remaining flower buds are
nipped off. In hand pollination method, a pin or needle or small piece of pointed
wood or a toothpick is ideal to apply pollen on the stigma of the flower. For
pollination, the stamen cap is removed by a needle exposing the pollinia. Then the
flap like rostellum is pushed up and the pollinia are brought into contact with the
stigma (Madhusoodanan et al.2003).
2.1.7 Plant Protection
Vanilla is susceptible to many fungal and viral diseases. Fusarium sp,
Sclerotium sp, Phytophthora sp and Collectrotricum sp cause rots of various plant
parts, namely, root, stem, leaf, bean and shoot apex which could be controlled by
spraying Bordeaux mixture (1%), Bavistin (0.2%) and Copper oxychloride (0.2%)
(Thomas et al., 2003). The disease spread can be managed by soil application of
Trychoderma @ 0.5kg/plant in the rhizospheres and foliar application of
Pseudomonads @ 0.2%. Mosaic, leaf curl and Cymbidium mosaic potex virus are the
common vanilla viral diseases. The insect pests of vanilla include beetles and weevils
(Anilkumar, 2004).
2.1.8 Harvesting
The beans or pods are ready for harvest 6-9 months after flowering. The beans
can be considered as mature when they change from green to pale yellow. At this
time, the pods may be 12-25 cm long (Pruthi, 2000). The right picking stage is when
the distal end of the pod turns yellow and fine yellow streaks appear on the pods.
Daily picking of mature pods is essential. The pods can be harvested by cutting with a
knife. A good vanillery yields 300-600 kg of cured beans per hectare per year (Pruthi,
2000).
24

2.2 Post Harvest Technology
2.2.1 Quality Requirements
The primary quality determinant for cured vanilla beans is the aroma/flavour
character. Other factors of significance in quality assessment are the general
appearance, flexibility, the length and the vanillin content. The relative importance of
these various quality attributes is dependent upon the intended end-use of the cured
beans. Traditionally, the appearance, the flexibility and size characteristics have been
of importance since there is fairly close relationship between these factors and the
aroma/flavour quality. Top quality beans are long, fleshy, supple, very dark brown to
black in colour, somewhat oily in appearance, strongly aromatic and free from scars
and blemishes. Low-quality beans are usually hard, dry, thin, brown or reddish-brown
in colour and possess a poor aroma. The moisture content of top grade beans is high
(30 to 40 per cent), whereas it may be as little as 10 per cent in the lower grades. At
one time, the presence of a surface coating of naturally exuded vanillin crystals
('frosting') is regarded as an indicator of good quality.
2.2.2 Curing
The curing of vanilla pods has been defined as their controlled ripening. It
the is process of alternatively sweating and drying of the pods until they have lost
most of their moisture as much as 80 %. It is extremely important stage in production
since during curing they undergo the enzymatic reaction responsible for the
characteristic flavour of vanilla. The full flavour of the cured pods is obtained only
towards the end of the curing process (Havkin-Frenkel et al., 2003).
A number of procedures have been evolved for the curing of vanilla but they
are all characterized by four phases (Anon., 1998):
25

1. Killing: This stops further vegetative development in the fresh bean and
initiates the onset of enzymatic reaction responsible for the production of the
aroma and flavour. Killing is indicated by the development of a brown
colouration in the bean.
2. Sweating: This involves raising the temperature of the killed beans to
promote the desired enzymatic reaction and to provoke a first, fairly rapid,
drying to prevent harmful fermentations. During this operation, the beans
acquire a deeper brown colouration and become quite supple, and the
development of an aroma becomes perceptible.
3. Slow drying: The third stage entails slow drying at ambient temperature,
usually in the shade, until the beans have reached about one third of their
original weight.
4. Conditioning: The beans are stored in closed boxes for a period of three
months or longer to permit the full development of the desired aroma and
flavour.
There are several methods of treating vanilla pods.
a) Peruvian Process
In Peruvian process (Anon., 2004) curing is done by hot water. In this process pods are dipped in boiling water. The ends
are tied and hung in the open. They are allowed to dry for 20 days. Later they are coated with castor oil and afterwards tied
up in bundles.
b) Guiana Process
In Guiana process (Anon., 2004) the pods are collected and dried in sun till
they shrivel. Later they are wiped and rubbed with olive oil. The ends are tied up to
prevent splitting and then bundled.
26

c) Alcohol Method
In alcohol method, killing is done by cutting the beans into small pieces and
soaking successively in hot alcohol having a concentration of 65 to 70%.
d) Indonesian process
In Java (Indonesia) & Uganda, (www.swsbm.com) the curing process is done much more quickly, with the beans being
cured over a smoky fire. This results in an inferior bean that is used only in lower-grade extracts, as with split beans.
e) Bourbon method
In Bourbon process (Purseglove et al., 1988) bamboo baskets with the beans
are immersed in hot water (63-65°C) for 3 minutes. After rapidly draining the water
when the beans are still hot, they are kept in wooden boxes lined with blankets. The
beans acquire chocolate brown colour the following day. They are then spread in the
sun on dark colour cotton covers for 3-4 hours and later rolled up to retain the heat
and stored in wooden boxes. This process is repeated for 6 to 8 days, during which
the beans lose some weight and become very supple. Later the beans are dried by
spreading them out in wooden trays under shade in an airy location. The duration of
drying varies according to the size of the beans and usually lasts for 15-20 days.
Properly dried beans are kept in closed containers where the fragrance is fully
developed. Finally they are graded according to size and kept in iron boxes lined with
paraffin paper. Properly cured vanilla beans contain about 2.5% vanillin.
f) Mexican Process
In the Mexican process (Anon, 2004), the two main traditional forms of curing
employed are the sun-wilting and the oven-wilting procedures. The former is the
oldest known method of curing and the latter was introduced around 1850. Both
methods are still widely used by the specialist curing firms in Mexico which process
the vast bulk of the vanilla crop.
27

Sun-wilting - On arrival at the curing house, the fresh beans may be set aside in a store for a
few days until required and during this time the beans start to shrivel. The beans are killed by exposing
them to the sun for a period of about five hours on the day after sorting. The fresh beans are spread out
on dark blankets resting on a cement ratio or on wooden racks. In the afternoon, the beans become too
hot to hold by hand and are then covered by the edges of the blanket. In the mid-to late afternoon
before the beans have begun to cool, the thick ends of the beans are laid towards the center of the
blanket and rolled up. The blanket rolls are immediately taken indoor and are placed in blanket-lined,
airtight mahogany boxes to undergo their first sweating. Blankets are placed over the sweating boxes
to prevent loss of heat. After 12 to 24 hours, the beans are removed and inspected. Most of the beans
will have begun to acquire a dark-brown colour indicating a good killing. Beans, which have retained
their original green colour or which have an uneven colouration are separated and are subjected to
oven-wilting. Those beans, which have been properly killed, are next subjected to a process involving
periodic sunning and sweating. Sunning entails spreading the beans on blankets and exposing them to
the sun for two to three hours during the hottest part of the day when weather conditions are
favourable. During the remaining part of the day, unless a sweating is to be undertaken, the beans are
stored indoors on wooden racks in a well-ventilated room.
There are two distinct phases to this sunning/sweating stage. The first phase involves a fairly rapid
drying in which the beans are given sunning virtually every day and several overnight sweating
until they become supple. This takes about five to six days. A preliminary sorting into lots
corresponding to the various grades is usually carried out at this juncture. This is followed by
further sunning and additional but less frequent sweating. In practice, sunning is not carried out
every day in this second phase since, apart from constraints imposed by the weather, too rapid
drying is considered to be detrimental to quality. Some 20 to 30 days after killing, most of the
beans become very supple and acquire characteristics close to those of the final product and are
ready for the next stage of very slow drying indoors. The total number of sweating undertaken
during the sunning/sweating' operation can vary between four and eight. Those beans, which
require a large number of sunning and sweating generally, provide a low-quality product.
Very slow drying indoors lasts for approximately one month and a further sorting into grades
is usually carried out during this time. The beans are regularly inspected and those, which have
achieved the requisite state of dryness, are immediately removed from the racks for
conditioning. The overall sweating and drying operation may take up to eight weeks
from the time of 'killing', according to the prevailing weather conditions. Small and
split beans are usually ready for conditioning earlier than perfect, large beans. Beans
28

removed for conditioning are sorted again and are straightened by drawing them
through the fingers. This operation is also useful in that it spreads the oil, which
exudes during the curing process and gives the beans their characteristic luster. The
beans are next tied into bundles of about fifty with black string. The bundles are
wrapped in waxed paper and are placed in waxed paper lined, metal conditioning
boxes. Conditioning lasts for at least three months and during this period the beans
are regularly inspected. At the end of the conditioning period, the beans are given a
final grading and are packed for shipment.
Oven-wilting- In this procedure, use is made of a specially constructed brick
or cement room, known as a calorifico, which serves as an autoclave. The room
measures approximately 4 x 4 x 4 metres and incorporates a wood-fired heater, which
is stoked from the outside. It is fitted with a small access door and has wooden racks
fitted along the walls. The beans to be killed by this method are divided into piles of
up to 1000 and are then rolled up in a blanket, which is finally covered with matting
to form a malleta. The malletas are moistened with water and are placed on the
shelves in the calorifico. Water is poured onto the solid floor to maintain a high
humidity, the door is closed and the heating fire is lit. In about 12 hours, the
temperature inside the calorifico reaches 60°C. After a further 16 hours, a temperature
of 70°C is attained and this is maintained for another 8 hours. The malletas are
removed after a total of 36 hours in the calorifico. If the temperature cannot be raised
above 65°C, then the total period of autoclaving is extended to 48 hours. On removal
from the calorifico, the matting is quickly stripped from the malletas and the blanket
wrapped beans are placed in sweating boxes. After 24 hours, the beans are removed
and inspected. The killed beans are then subjected to repeated sunning and sweating,
as described above under Sun-wilting.
2.2.1.1 Research Highlights
Balls and Arana (1941a) conducted the sweating of vanilla beans by holding
them at high humidity and high temperature (45 to 650C) for 7 to 10 days. They
29

concluded that the purpose of sweating is to retain enough moisture to allow enzymes
to catalyse various hydrolytic and oxidative processes.
Arana (1943); Theodose (1973) concluded that the stated purpose of the
various killing methods is to bring out the cessation of the vegetative life of the
vanilla bean and allow contact between enzymes and substrates.
Arana (1944) compared traditional sun-drying/sweating procedures with an
electric oven set at 45 0C in which the humidity was kept high. Oven sweating and
drying was found to have advantages in that the incidence of mould was less, a
shorter time was required and the procedure was less labour-intensive.
Arana (1944) and Jones and Vincente (1949c) showed that the common
practice of harvesting green beans does not flavour the production of cured vanilla
with a fine aroma and flavour or a high vanillin content. The best results are
obtained with beans harvested at the blossom-end yellow phase.
Arana (1944) compared traditional sun drying/sweating procedures with an
electric oven set at 45ºC in which the humidity was kept high. Oven sweating and
drying was found to have advantages in that the incidence of mould was less, a
shorter time was required and the procedure was less labour intensive. He considered
the optimum moisture content for cured beans to be 30-35%.
Cernuda and Louistalot (1948) studied the use of infrared lamps for sweating
of vanilla but found it to be a costly method of heating with no marked advantages
and as one that could initiate considerable deleterious oxidations.
Jones and Vincente (1949a) carried out a study of the conditioning
temperature effects on quality. Temperatures in the range of 35-45ºC were found to
accelerate conditioning and to provide a product, which was considered to have a
superior aroma to those, conditioned at 13ºC or 27ºC.
30

Corell (1953); Bouriquet (1954) developed a system of seven grades for
export of whole beans, in descending order of quality as: Extra, Superior, Good
Superior, Good, Medium Good, Medium and Ordinary. This was based on the
moisture content, colour, general appearance and aroma quality.
Theodose (1973) reported a curing method in which beans are not chopped
until after killing by scalding and an initial sweating. The killed beans are then sliced
into 2-3 cm in lengths and are subjected to hot-air drying at 65ºC in a tunnel drier.
Then they are sweated in boxes for 24hrs at 50ºC, for 12 days. The moisture content
of the product obtained was found to be 20-25%.
Ansaldi et al. (1990) developed a method of killing in which the beans are
frozen by dipping in liquid Nitrogen or by holding the beans for a few hones in a
freezer ( 00 C to – 80 0C).
Havkin-Frenkel et al. (2000) studied the inter-relation of curing and botany in
vanilla (v. planifolia) bean. The studies revealed that flavour precursors are found
in the bean interior, whereas hydrolytic or other degradative enzymes, which
catalyze the release of the flavour precursors to flavour compounds, are localized
mostly in the outer fruit wall region. This suggests that the objective of killing is
to disorganize the bean tissue, such that contact is created between substrates and
their respective enzymes. Sweating provides conditions for enzyme-catalyzed
production of flavour compounds and also for non-enzymatic reactions. The
objective of the final curing steps, including drying and conditioning, is to dry the
cured beans to preserve the formed flavoured compounds.
Dignum et al. (2001) conducted vanilla curing under laboratory conditions in
which the cured vanilla beans were analysed for enzyme activity and aroma. The
activity of the enzyme was highest in green beans. They concluded that the normal
31

scalding leads to inactivation of non-specific glucosidase while the prolonged
scalding also inactivates the specific glucosidase.
Dignum et al. (2001 a) proved that the storage of frozen beans must be carried
out at -70oC or below to preserve the viability of enzymes that are involved in the
curing process.
Anon. (2003) investigated the presence of β -D-glucosidase formed during the
curing process of vanilla beans. The kinetics of β-glucosidase activity from green
vanilla beans towards and glucosidase naturally occurring in vanilla and towards P-
nitrophenol were investigated.
Havkin-Frenkel et al. (2003) conducted studies on the botany of vanilla beans
which revealed that flavour precursors are found in the bean interior while the
enzymes which catalyse the release of the flavour precursors to the flavour
compounds are localized mostly in the outer fruits wall region.
Abdulla (1997) conducted studies on drying of vanilla pods using a green
house effect solar dryer, and found, at RH of 34 % and temperature range of 50 to 600C time needed for drying vanilla pod from moisture content 80.9 %(wb) initial to
37.8 % (wb) was 51.3 hours or seven days as compare to 12 to 15 days in sun drying.
Anon. (1998) analysis of moisture and vanillin content was studied at Quality Laboratory, Spices Board, Kochi, and
concluded that in high ranges, vanilla curing yield more vanillin in raised platform.
2.2.2 Constituents of Cured Vanilla
The chief constituent of vanilla is the aromatic, crystalline substance vanillin,
which is the aldehyde of methyl-protocatechuic acid; good beans contain from 2 to
2.75 %. Other constituents are vanillic acid, resin (4 %), fat (11 %), sugar (10%) etc.
(Anon, 1998).
32

2.3 Products and By-products
2.3.1 Vanilla Extract
Vanilla extract is hydro alcoholic solution containing the extracted aroma and
flavour principle of vanilla beans and may also contains added sweetening /
thickening agents such as sugar and glycerin. Conventional vanilla extract have a
minimum ethyl alcohol content of 35%. Vanilla extract is made by chopping the
beans, then immersing them in a mixture of alcohol & water, which is continuously
re-circulated through the beans until the essential flavour components are dissolved
into the liquid. Which takes about 48 hours (Pruthi, 1998). The resulting perk is then
filtered into a holding tank, where it is aged, like wine. Sugar or corn syrup is added
to mellow the alcohol and to assist in ageing. Once bottled, the ageing process can
continue for two to three years. Imitation vanilla extract is any vanilla that contains
other than natural vanilla flavours.
2.3.1.1Research Highlights
Swami (1947) suggested that vanillin is produced in the glandular hairs,
whose presence can be casually noted by previous investigators.
Childers et al. (1959) observed that vanillin crystals formed during curing
appear mostly on the blossom end of green vanilla pod (40 %).
Menory (1968) described an operation to prepare 379 litres of twofold vanilla extract with a 35% ethanol content.
Ranadive et al. (1983) conducted research on vanillin biosynthesis in vanilla
beans and found that, when protected against protrolysis, β-glucosidase activity
expressed as µg product/hr/µg protein was as follows: 75.2% in green outer fruit
tissue, 32.3 % in the placental tissue and 11.1 % in the glandular hair cells.
33

Leong et al (1989) conducted research on the glucoside fraction of vanilla
beans and found glycosyl conjugates of vanilla or other phenolic compounds
conjugated to mannose, galactose and rhamnose in trace amounts in the developing
vanilla pod.
2.3.2 Vanilla Flavouring
This is similar to vanilla extract but contains less than 35% ethyl alcohol by
volume (Pruthi, 2000).
2.3.3 Vanilla Tincture
This is prepared by maceration from one part of vanilla beans by weight to ten
parts of aqueous alcohol by volume and contains added sugar. It differs from vanilla
extract in having an ethyl alcohol content of at least 38% (Felter and Lloyd, 1898).
2.3.4 Vanilla Oleoresin
Oleoresin is the solid or semisolid residue obtained by the solvent extraction
of vanilla followed by complete removal of the solvent by distillation under vacuum.
Extraction is carried out either in a percolated vessel or in a sealed vessel. The
prepared solvents are 50% ethanol and 50% aqueous iso-propanol (Purseglove et al.,
1988).
2.3.5 Vanilla Powder
It is a mixture of vanilla oleoresin with sugar, food starch or gum acacia
(Pruthi, 2000).
2.3.6 Vanilla Absolute
34

This is prepared by direct alcohol extraction of vanilla beans followed by
solvent stripping or by alcohol washing of an oleoresin prepared by extraction with a
hydrocarbon solvent. This is most concentrated form of the vanilla aroma, being 7to
13 times stronger than good quality vanilla beans (Purseglove et al., 1988).
35

MATERIALS AND METHODS
36

MATERIALS AND METHODS
This chapter deals with the experimental set up, the methods employed for
curing and the measurement of various objective functions. Details of materials,
techniques used for measurement and test procedures have been given under different
heads.
3.1 Materials Used
3.1.1 Data Collecting Material
Schedules for data collection was prepared both in Malayalam and English,
each containing 52 questions, were used for conducting survey among vanilla
growers (Plate No.1 - 3) to identify various constraints in vanilla cultivation and
processing. The schedules contain 16,30,3 questions regarding cultivation,
processing, and marketing respectively. Format of the schedule used is given in
Appendix- I.
Plate No.1 Vanilla Growers Conducting Curing
37

Plate No.2 Sorting of Fresh Vanilla Beans
Plate No.3 Sun Drying by Farmers
38

3.1.2 Raw Material
Fully matured, fresh vanilla beans (variety V. planifolia) purchased from Kalpetta, Wayanad district were used for curing, under different treatments, maturity was justify by observing the yellow colour at tips of the beans (Plate No.4).
Plate No.4 Fresh Vanilla Beans
3.2 Experimental Setup
The experimental set up for curing vanilla beans mainly includes the following components viz. Water, Ethyl Alcohol, Black Blanket, White Cloth, Convective drier, Wooden box, Wooden Shelf, Bee-wax paper, Thermometer, Hygrometer.
3.2.1 Water
Hot water was used for killing the vanilla beans.
3.2.2 Ethyl Alcohol
39

Ethyl alcohol of concentration 65 – 70 % was used for killing of vanilla beans.
3.2.3 Black Blanket
Three black woolen blankets each having dimensions 370 x 160 cm were used
for sweating of vanilla beans. Each blanket was cut into four parts each of size 135 x
80 cm.
3.2.4 White Cloth
A white mill cloth of size 1200 x 115 cm was used for sweating of the beans.
This was cut into twelve equal parts each of dimensions 115 x 100 cm.
3.2.5 Convective Drier
The convective drier available in Agricultural Processing lab (Royal ScientificInst. Co., Chennai) was used for drying the vanilla beans (Plate No.5). Three trays each having dimensions 82 x 41.8 cm were fabricated by using wire mesh, of size 15 x 15mm. Using a vernier caliper, of LC 0.02mm, the diameter of the wire was obtained as 1.6mm.
The perforated area was calculated as follows ( Sahay and Singh,1994):
P = O 2 x 100
(O+D) 2
Where, ’P’ is the open area (%)
‘O’ is the size of opening (mm)
‘D’ is the wire diameter (mm)
40

Plate No.5 Convective Drier3.2.6 Wooden Box
A wooden box made of teak having dimensions 152 x 60 x 60 cm was used
for sweating and conditioning of beans (Plate No.6 & fig.3.1)
3.2.7 Bee-Wax Paper
Bee –Wax paper of dimensions 450x350 mm was used for bundling the
vanilla beans during the conditioning process.
41

Plate No.6 Wooden Box
3.2.8 Thermometer
A mercury thermometer with LC of 10C was used to measure the temperature
at various stages of curing.
3.2.9 Wooden Shelf
42

A wooden shelf of dimensions 122 x 30 x 182 cm was used for slow drying of
the beans. It consisted of five racks with each rack made of nylon mesh ( opening
size- 3mm & diameter of wire - .75 mm), enclosed within a wooden frame of
dimensions 122 x 30 cm (Plate No.7 & fig.3.2)
Plate No.7 Wooden Shelf
3.2.10 Hygrometer
A hair hygrometer of LC 1% was used to determine the RH at various stages
of curing.
3.2.11 Vernier caliper
A vernier caliper of LC 0.02 mm was used to measure the breadth and thickness of the vanilla beans.
43

3.3 Curing
3.3.1 Preparation of Samples
The beans were washed and sorted based on their length into three grades viz.
A, B and C. The ‘A grade’ beans were having a length greater than or equal to 20 cm.
The ‘B grade’ beans were with a length varying from 15 – 19 cm and the ‘C grade’
beans had lengths less than 15 cm. Then each of these grades was again divided into
1, 2, 3 and 4 groups for curing them with four different methods. Thus 12 samples
were prepared.
3.3.1.1 Measurement of Physical Properties
The physical properties such as length, breadth and thickness of the
representative bean from each of the 12 samples were measured using a vernier
caliper. The total weight of each sample was also measured using the electronic
balance (LC 0.01g).
3.3.1.2 Determination of Initial Moisture Content
The moisture content of three beans each from A B and C grades were
determined using oven dry method. The beans were kept in the oven at 105oC for 24h.
This process was continuing till constant weight was achieved.
Moisture content at wet basis (%) = Wm x 100 (Sahay and Singh,1994 )
(Wm + Wd)
where,
Wm = weight of moisture (gm)
Wd = weight of dry matter (gm)
44

3.3.2 Curing Procedure
3.3.2.1 Treatment Details
The curing of vanilla beans was done using different methods:
Method I: Bourbon method of curing consisting of hot water killing followed by sun
drying, slow drying and conditioning.
Method II: Curing consisting of killing of beans using alcohol followed by sun
drying slow drying and conditioning.
Method III: Curing consisting of hot water killing followed by high temperature
mechanical drying slow drying and conditioning.
Method IV: Curing consisting of hot water killing followed by low temperature
mechanical drying slow drying and conditioning.
The initial stage of curing, ie. killing was performed by two methods viz. hot
water killing and alcohol method of killing. Second step i.e drying was tried by sun
drying, mechanical drying at low temperature and mechanical drying at high
temperature. The flowchart for the entire curing procedure is shown in Fig. 3.3. The
details of the procedure are as follows:
45

Fig. 3.3 Flow Chart Showing Vanilla Curing Process3.3.2.2 Killing
Two different killing methods were adopted.
46
Fresh Beans
Washing
Sorting
Killing using Hot
water
Killing using
Alcohol
Sundrying
High Temp
Mechanical drying
Low Temp
Mechanical drying Sun drying
Slow Drying
Conditioning
Cured Beans
Quality Evaluation

3.3.2.2.1 Killing Using Hot Water
This method was adopted for killing the first (A1, B1, C1), third (A3, B3, C3)
and fourth (A4, B4, C4) sets of samples. Killing was achieved by dipping the beans in
hot water at 65oC (Plate No.8). The duration of killing was 3.5min, 3min and 2.5min
for the A, B and C grade beans respectively. After killing the excess water was wiped
off using a muslin cloth.(Purseglove et.al.1998)
Plate No.8 Killing Using Hot Water
3.3.2.2 .2Killing Using Alcohol
The second set of samples (A2, B2, C2) was killed by dipping in Ethanol of
concentration of 65-75% for 10min (Plate No.9).
47

Plate No. 9 Killing Using Alcohol
3.3.2.3 Sweating
In this step the temperature of the beans was raised by two different methods.
3.3.2.3.1 Alternate Sweating and Sun Drying
This method was adopted for the first (A1, B1, C1) and second (A2, B2, C2)
sets of samples. The beans after killing were made to sweat by wrapping in black
woolen blanket lined with white cloth and stored in air-tight wooden box for
24hr.This was then followed by exposing them to sun light for about 1-1.5hr during
day time in a raised platform erected at about 75 to 100cm above the ground (Plate
No.10 &11). This process of alternate exposure to sun and wrapping in woolen
48

blanket and storing in wooden box was repeated for 10 days. The beans were weighed
before sun drying at an interval of 24h. (Purseglove et.al.1998).
Plate No.10 Sun Drying
Plate No.11 Sweating in Wooden Box
49

3.3.2.3.2 Mechanical Drying
This process involved sweating and drying of method III and method IV
samples, on perforated trays, at different temperature. High temperature mechanical
drying was done for the samples A3, B3, C3 here the drying temperature was
increased from temperature 50-70oC with step of 10oC. While for the low temperature
mechanically dried samples A4, B4, C4, drying was done at the temperature 50,55
and 60 oC. This has been given in Appendix-II. Drying was done for one-hour
duration, at 12 hours interval. The whole process took 6 days to reduce the MC to
required level.
3.3.2.4 Slow Drying
All the four sets of beans were allowed to dry slowly by spreading them on
perforated trays fitted on to a wooden rack at ambient temperature. The relative
humidity of the room was kept above 80% by hanging moistened cloths and keeping
water in trays below the racks. The beans were checked regularly to prevent any
mould growth and turned upside down for uniform drying. They were weighed and
the dimensions were measured at every 12h interval. The duration of slow drying was
8 days for all the samples.
3.3.2.5 Conditioning
The beans were bundled and tied at both the ends using black threads. They
were then properly packed in bee wax paper and stored in air-tight containers to allow
full development of flavour and aroma. The duration of conditioning was 30 days.
The observations were taken at every one-week interval.
50

3.4 Quality Evaluation:
The quality of cured vanilla beans was analyzed based on the vanillin content
and moisture content. This was tested at the quality evaluation laboratory, Spices
Board, Cochin. The vanillin content was tested by AOAC method 990.25,2000
and the moisture content by the ASTA method 2.0,1997. The result has been
given in Appendix-XV.
51

RESULTS AND DISCUSSION
52

RESULTS AND DISCUSSION
This chapter enunciates the results of the survey and the experiments
conducted to standardize the vanilla curing techniques. The various constraints in
vanilla cultivation and curing and the different physical parameters, which in turn
affect the quality of cured beans, have been discussed in detail.
4.1 Farm -and-Home Visit
Results of the survey on constraints of vanilla cultivation and processing are
described under the following headings.
4.1.1 Constraints in Vanilla Cultivation
Vanilla planifolia is the major variety grown in all the four districts under
study. All the farmers in the sample survey are educated and own their farms. Table-
4.1 shows the classification of the farmers according to the land holding. Ten
percentage of the total farmers were in the small-scale category (< 1 acre); 62.5%
were in the medium-scale group and (1-3 acre); and 27.5% in large-scale group (> 3
acres). The table also shows an increase in area under vanilla cultivation with the
increase in total agricultural area (Figure-4.1 and Table-4.1).
Table 4.1. Area under vanilla cultivation
Area under
vanilla(acres)
Numbe
r of
Far
Total
are
a
Percentage of
total area
under
53

mer
s
(acr
es)
vanilla
cultivation<1 4 4 231-2 19 6 312-3 6 9 323-4 2 11.5 34≥4 9 16 37
Fig. 4.1: Percentage of total area under vanilla cultivation
There was no significant variation in the cropping practices from one district
to another. Planting is done in August or September. Flowering commences in the
third year after planting and is noticed from December to March. Since the natural
pollination is not possible, artificial pollination is practiced for vanilla. This is the
major constraint faced by the farmers. Artificial pollination is done on the same day
of flower opening, usually from 6 am to 12 noon.
Majority of the farmers are using bio-fertilizer (92.5%)for vanilla cultivation,
whereas a few are using chemical fertilizer (5%). The remaining farmers are not using
either bio-fertilizer or chemical fertilizer. Most of the farmers are practicing irrigation
for their cultivation, however they are facing acute water shortage in the dry spell.
The details of the irrigation systems are given in Table-4.2.
54
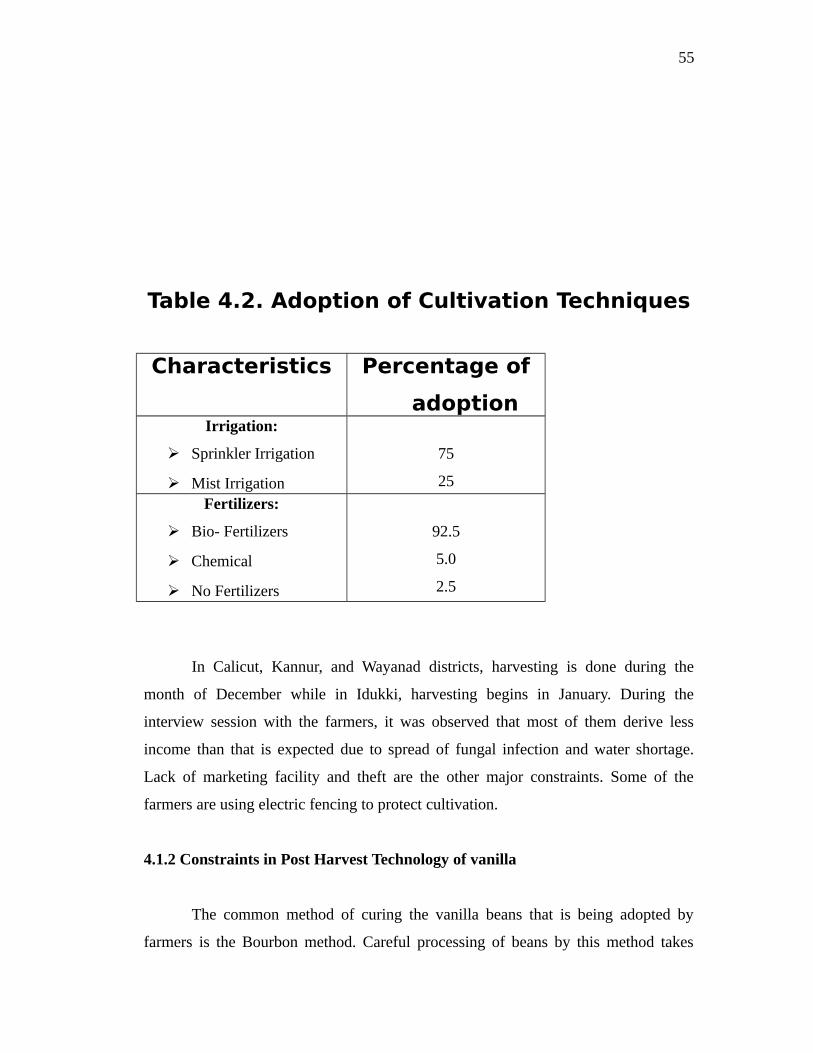
Table 4.2. Adoption of Cultivation Techniques
Characteristics Percentage of
adoptionIrrigation:
Sprinkler Irrigation
Mist Irrigation
75
25
Fertilizers:
Bio- Fertilizers
Chemical
No Fertilizers
92.5
5.0
2.5
In Calicut, Kannur, and Wayanad districts, harvesting is done during the
month of December while in Idukki, harvesting begins in January. During the
interview session with the farmers, it was observed that most of them derive less
income than that is expected due to spread of fungal infection and water shortage.
Lack of marketing facility and theft are the other major constraints. Some of the
farmers are using electric fencing to protect cultivation.
4.1.2 Constraints in Post Harvest Technology of vanilla
The common method of curing the vanilla beans that is being adopted by
farmers is the Bourbon method. Careful processing of beans by this method takes
55

nearly 4 months depending upon the climatic conditions. Curing is done within 1 to 2
days after harvesting. Labour requirement for curing process varied from 5 to 10
persons. All the farmers do curing without the help of external processing agencies.
However most of them follow the expertise from the Spices Board. Figure: 4.2 shows
that the 72.5 per cent of the farmers are practicing curing and the remaining is selling
the raw beans.
72.5%
27.5%
1 2curing not curing
Fig.4.2 Curing practices
It is also observed that the farmers with very small land holding (<1 acre)
prefer a group venture rather than processing the beans individually (Table-4.3).
However about 50 percentage of the very small land holding farmers sell the beans as
raw. The analysis also showed a positive trend in individual processing with the
increase in land area. The farmers who possess l above 3 acres of vanilla cultivation
are doing the processing individually. This is due to their financial stability. Most of
the small and medium scale farmers are also doing the curing process in groups. But
as the cultivated area increases, from small to medium, the group processing trend
decreased from 58 to 50 per cent. However the large-scale farmers (≥3 acres) are
neither interested in joint venture nor prefer to sell the beans as raw.
Table 4. 3. Interaction between land holding and curing
56

Area (acres) Individual(%) Group(%) No processing(%)<1(very small) 0 50 50
1-2(small) 5 58 372-3(Medium) 33 50 17
3-4(large) 100 0 0≥4(very large) 100 0 0
Adoption of curing technique is detailed in table-4.4. It shows that the
majority of the farmers are practicing the curing technique by sun drying (92.5%).
Only 7.5 per cent adopted mechanical drying, that too only during the monsoon
season. It is also observed that the majority of farmers prefer a group effort (67.5%)
rather than doing individually (32.5%)
Table 4.4. Adoption of Curing Techniques
Characteristics Percentage of adoption
Curing72.5
Type of processing:
Group
Individual
67.5
32.5Method of drying:
Sun Drying
Mechanical Drying
92.5
7.5
The general conditions adopted in curing are given in the table-4.5. The
duration of killing process varies from 2.5 to 3.5 min. This variation is due to the
increase in thickness of the vanilla beans. As the thickness increases the killing time
has to be increased from 2.5 to 3.5 min., so as to allow the penetration of heat to the
interior of the beans. The sweating process is practiced for 8 to 10 days depending on
the climate. The time taken and the process parameters are detailed in the Table-4.5.
57

The table shows that the entire curing process is too lengthy and laborious, which
takes almost 3.5 to 4.5 months. The farmers face difficulty in the storage of processed
vanilla due to high relative humidity. The high temperature and relative humidity of
the storage room is congenial for the growth of different microorganisms, which was
another constraint faced by the farmer in vanilla processing. Some of the farmers are
using ethyl alcohol treatment to prevent the microbial/ insect contamination.
Table 4.5. Conditions of Curing
Stage of
Curin
g
Time Temperature (oC) Relative Humidity (%)
Killing 2.5 – 3.5 min 65 -
Sweating 8 – 10 days 45 - 65 65
Slow
dryin
g
20 – 28 days 28 90 – 92
Conditio
ning
3 months 28-30 55 - 65
At present, there is no market for the processed vanilla in the state. Most of
the farmers, sell their produce through different agencies to Bangalore and this was
another major constraint faced by the vanilla grower. The study revealed that the
initial cost of infrastructure required for processing is less and the net profit gain after
processing is comparatively exorbitant. The lack of consistency of profits is another
finding of this study.
4.2 Standardization of vanilla curing
Curing was under taken in vanilla beans
using four different methods. This facilitated the enzymatic process that transforms
58

glucovanillin into vanilla and development of flavour and aroma. Subsequently the
physical properties of the beans were changed which cause a reduction in the initial
weight of the beans. The result obtained is discussed under the following headings.
4.2.1 Measurement of physical properties
Vanilla beans procured from the local
market were used for the experiments. The test samples were prepared according to
the sorting procedure discussed in chapter 3. The dimension of the fresh beans and the
initial weight of each sample were measured by standard methods. And results are
tabulated in table 4.6.
Table. 4.6 Physical properties of fresh beans
Sample Avg.Length(cm) Avg.Width(cm) Avg.Thickness(cm) Moisture(wb,%) ColourA 21.5 1.27 .90 81.65 GreenB 17.2 1.08 .85 83.43 GreenC 12 1.14 .68 83.06 Green
4.2.2 Calculation of Perforated Area
The perforated area of the drier tray was calculated as per the equation
described under 3.2.1. The perforation area is 81.65%. The perforated area of the
wooden rack was calculated using the same formula and found out as 46%
4.2.3 Initial moisture content
The moisture content of the beans was
estimated by the oven dry method and the results obtained are in table 4.7
Table.4.7 Moisture content of fresh beans
Sample Initial weight
(gm)
Final weight (gm) Moisture
content (wb,%)
Moisture
content (db, %)A 11.99 2.20 81.65 444.95
59

B 10.14 1.68 83.43 503.50C 10.51 1.78 83.06 490.32
4.2.4 Variations in Physical Properties
4.2.4.1 Sweating and Drying
The variations in the physical properties of the beans viz. moisture content,
length, breadth and thickness for different treatments, during sweating and drying, are
discussed under the following heads.
4.2.4.1.1 Moisture Content
The variations in moisture content of the beans during sweating and drying,
for the four treatments are depicted in Appendix III and fig.4.3, 4.4 and 4.5.
MC Vs Time
0
100
200
300
400
500
600
1 2 3 4 5 6 7 8 9 10 11
Time (day)
Mo
istu
re(d
b,%
) High Temp
Low Temp
Bourbonmethod
Alcoholmethod
Fig.4.3. MC Vs Time during sweating, for sample A
The moisture content of the A grade beans after high temperature
method reduced from 478.38 % to a lower value to 102.55%. However, by
low temperature method the initial MC was reduced to 208.07%and by
alcohol method MC was found to be 125.72%. The reduction in MC after
sweating was minimum in Bourbon method (200.2%).
60

The linear relationship between moisture content and drying time for
the different methods are as follows:
For Bourbon
method:
y = - 27.918x
+ 498.59 (R2 =
0.9943) -------------
(4.1)
For Alcohol method:
y = -35.443x + 525.4 (R2 = 0.9914) -------------(4.2)
For High
Temperature
method:
y = -61.885x + 479.31 (R2 = 0.9953) --------------(4.3)
For Low
Temperature
method:
y = - 42.83x + 471.73 (R2 = 0.9978) ---------------(4.4)
where, y = moisture content(db) of the beans in %
x = time for sweating in days
61
MC Vs Time
0
100
200
300
400
500
600
1 2 3 4 5 6 7 8 9 10 11
Time(day)
Mo
istu
re(d
b,%
) High Temp
Low temp
BourbonMethod
Acohol Method

Fig. 4.4. MC Vs Time during sweating, for sample B
The variation in MC for grade B is shown in figure 4.4.The variation
in MC was maximum for high temperature method and the MC after sweating
was found to be 87.05%. The variation was minimum for bourbon method
with a final MC of 203.01%. For the low temperature method the MC reduced
to 178.16% while the final MC of the alcohol method was 151.84%
The linear relationship between moisture content and drying time for
the different methods are as follows:
For Bourbon
method:
y = - 33.972x + 509.68 (R2 = 0.9985) ---------------(4.5)
For Alcohol method:
y = -29.372x + 454.33 (R2 = 0.9138) ---------------(4.6)
For High Temperature method:
y = - 75.75x + 497.41 (R2 = 0.9852) ---------------(4.7)
Low Temperature method:
y = - 59.037x + 488.95 (R2 = 0.9856) ---------------(4.8)
where, y = moisture content (db) of the beans in %
62

x = time for sweating in days
Fig. 4.5. MC Vs Time during sweating, for sample C
The variation in MC for grade C beans is shown in fig.4.5.Grade C
beans, after sweating, the percentage reduction in MC was observed as 78.5%,
68.25%, 58.6% and 57.56% for High temperature method, alcohol method,
Low temperature method and bourbon method respectively.
The linear relationship between moisture content and drying time for
the different methods are as follows:
For Bourbon
method:
y = - 28.533x + 51.11 (R2 = 0.9936) ---------------(4.9)
For Alcohol method:
y = - 33.329x + 503.23 (R2 = 0.9927) ---------------(4.10)
For High Temperature method:
y = - 75.423x + 534.89 (R2 = 0.9943) ---------------(4.11)
63
MC Vs Time
0
100
200
300
400
500
600
1 2 3 4 5 6 7 8 9 10 11
Time(day)
Mo
istu
re(d
b, %
)
High Temp
Low Temp
Bourbon Method
Alcohol method

For Low
Temperature
method:
y = - 52.324x + 497.95 (R2 = 0.9983) ---------------(4.12)
where, y = moisture content (db) of the beans in %
x = time for sweating in days
4.2.4.1.2 Length
The variations in the length of the beans, during curing process, for the four
treatments are shown in Appendix IV, VIII & XII and fig.4.6, 4.7 and 4.8.
96.5
97
97.5
98
98.5
99
99.5
100
100.5
-10 0 10 20 30 40 50 60
Days
Len
gth
(%) Bourbon Method
Alcohol Method
High Temperature Method
Low Temperature Method
Fig. 4.6. Length Vs Time during curing, for sample A
The variation in length for grade A beans, during sweating and drying, is
shown in fig.4.6.The reduction in length was maximum for beans cured by Alcohol
method ( 1%), followed by High Temperature method(0.95 %). The minimum
64

variation is seen for beans cured by Bourbon method (0.43%), preceded by Low
Temperature method (0.93%).
97
97.5
98
98.5
99
99.5
100
100.5
-10 0 10 20 30 40 50 60
Days
Bourbon Method
Alcohol Method
High Temperature Method
Low Temperature Method
Fig. 4.7. Length Vs Time during curing, for sample B
The variation in length for B grade beans, during sweating and drying, is
shown in fig.4.7. The reductions in length were observed to be 2.13%, 1.75%, 1.74%
and 1.22% for Bourbon method, High Temperature method, Alcohol method and Low
Temperature method respectively.
The variation in length for grade C beans, during sweating and drying, is shown in
fig.4.8. The maximum reduction in length was seen for High Temperature method
(2.24%) followed by, Low Temperature method (1.75%), Alcohol method
(1.72%) and Bourbon method (1.57%).
65

96.5
97
97.5
98
98.5
99
99.5
100
100.5
-10 0 10 20 30 40 50 60
Days
Len
gth
(%) Bourbon Method
Alcohol Method
High Temperature Method
Low Temperature Method
Fig. 4.8. Length Vs Time during curing , for sample C
4.2.4.1.3 Breadth
The variations in the breadth of the beans during curing, are highlighted in
Appendix V, IX, XIII and fig 4.9, 4.10 & 4.11.It was observed that the variation in
breadth was higher when compared to length.
Fig.4.9 shows the variation in breadth for grade A beans, during sweating and
drying. It is revealed that the variation in breadth during sweating is the maximum
(36.87%) for low temperature method. There, the breadth reduced from 1.41cm to
0.89cm. For the high temperature method, the reduction was 27.9%. The minimum
variation was observed for Bourbon method, the variation being 8.8%. For alcohol
method, the breadth of the beans reduced from 1.15cm to 0.79cm.(31.3%).
66

0
20
40
60
80
100
120
-10 0 10 20 30 40 50 60
Days
Bourbon Method
Alcohol Method
High Temperature Method
Low Temperature Method
Fig. 4.9. Breadth Vs Time during curing, for sample A
0
20
40
60
80
100
120
-10 0 10 20 30 40 50 60
Days
Bourbon Method
Alcohol Method
High Temperature Method
Low Temperature Method
Fig. 4.10. Breadth Vs Time during curing , for sample B
Fig.4.10 shows the variation in breadth for grade B beans, during sweating and
drying. After high temperature mechanical drying the breadth reduced from
1.09cm to 0.7cm causing a variation of (35.78%). After low temperature method
67

the breadth showed a maximum variation of 29.9%. The minimum variation in
breadth was observed in the case of Bourbon method (21.70%) preceded by
Alcohol method (26.85%).
0
20
40
60
80
100
120
-10 0 10 20 30 40 50 60
Days
Bre
adth
(%) Bourbon Method
Alcohol Method
High Temperature Method
Low Temperature Method
Fig. 4.11. Breadth Vs Time during curing, for sample C
The variations in the breadth of the C grade beans, during sweating and drying,
are given by fig.4.11and were found to be 37.61%, 45.87%, 31.86% and 60.20%
for Bourbon method, Alcohol method, high temperature method & low
temperature method respectively.
4.2.4.1.4 Thickness
There was a considerable reduction in the thickness of the beans after curing,
and the variations are depicted in Appendix VI, X, XIV and figures 4.12,4.13 and
4.14.
68

0
20
40
60
80
100
120
-10 0 10 20 30 40 50 60
Days
Th
ickn
ess(
%)
Bourbon Method
Alcohol Method
High TemperatureMethod
Low TemperatureMethod
Fig. 4.12. Thickness Vs Time during curing, for sample A
Fig.4.12 shows the variation in thickness for grade A beans, during sweating and
drying. The thickness of the beans treated by alcohol method reduced from 0.86 to
0.59cm(31.39%)while that treated by low temperature method reduced from
0.93to 0.57cm(38.7%). The percentage reduction in thickness was the maximum
in the case of Bourbon method (45.16%) and was the minimum in the case of high
temperature method (24.18%).
0
20
40
60
80
100
120
-10 0 10 20 30 40 50 60
Days
Bourbon Method
Alcohol Method
High Temperature Method
Low Temperature Method
Fig. 4.13. Thickness Vs Time during curing, for sample B
69

Fig.4.13 shows the variation in thickness for the B grade beans, during sweating
and drying. In the case of Bourbon method, the thickness reduced from 0.95 to
0.71cm(25.26%). while it reduced from 0.75cm to 0.47cm(37.33%), in the case of
alcohol method .For the high temperature method, the variation in thickness was
47.06%. The thickness reduced from 0.85cm to 0.49cm in the case of beans dried
by low temperature method, the variation being 42.35%.
0
20
40
60
80
100
120
-10 0 10 20 30 40 50 60
Days
Th
ickn
ess(
%) Bourbon Method
Alcohol Method
High Temperature Method
Low Temperature Method
Fig. 4.14. Thickness Vs Time during curing, for sample C
The variations in thickness for grade C beans, during sweating and drying, are
shown in fig.4.14.The results show that maximum variation in thickness was for
low temperature method (56.16%) and minimum variation was for bourbon
method (33.33%). For high temperature method and alcohol method the variations
were observed as 45.07% and 40.90% respectively.
The beans after sweating and drying done by the different methods are shown in
Plate No. 12- 14
70

Plate No.12 Sample A Beans after Sweating and Drying
Plate No.13 Sample B Beans after Sweating and Drying
71

Plate No.14 Sample C Beans after Sweating and Drying
4.2.4.2 Slow Drying
The variations in the physical properties of beans observed during slow drying
are given below. (Plate No.15)
72

Plate No.15 Slow Drying of Beans on Wooden Shelf
4.2.4.2.1 Moisture Content
The variations in the MC of beans during slow drying for different treatments are
described in the Appendix VII and fig 4.15,4.16,4.17.
Fig. 4.15. MC Vs Time during slow drying, for sample A
73
Moisture Vs Time
0
50
100
150
200
250
1 2 3 4 5 6 7 8
Time(day)
Mo
istu
re(d
b,%
) High Temp
Low Temp
BourbonMethod
Alcohol Method

The variation in MC for sample A beans, after slow drying, is shown in
fig.4.15. In Bourbon method , the MC was 102.16%, but in high temperature method
the MC was reduced to 50.81% and for low temperature method, the MC was found
to be 116.96% , which was the maximum . The MC was minimum in the case of
beans cured by alcohol method (43.98%).
The linear relationship between moisture content and drying time for the
different methods are as follows:
For Bourbon method:
y = - 13.289x + 208.68 (R2 = 0.9896) ---------------(4.13)
For Alcohol method:
y = - 10.861x + 128.45 (R2 = 0.9744) ---------------(4.14)
For High Temperature method:
y = - 5.0789x + 69.694 (R2 = 0.9423) ---------------(4.15)
For Low Temperature method:
y= - 17.715x + 188.5 (R2 = 0.9535) ---------------(4.16)
where, y = moisture content (db) of the beans in %
x = time for slow drying in days
74
Moisture Vs Time
0
50
100
150
200
250
1 2 3 4 5 6 7 8
Time(day)
Mo
istu
re(d
b,%
)
High Temp
Low Temp
Bourbon method
Alcohol Method

Fig. 4.16. MC Vs Time during slow drying, for sample B
From the figure 4.16, it is seen that the maximum variation in the MC was for
beans treated by high temperature method (22.66%) while MC was reduced to
116.96%, for low temperature method. In the case of alcohol method, the MC was
found to have reduced to 69.3%. For Bourbon method, MC was found to be
103.46%.
The linear relationship between moisture content and drying time for the
different methods are as follows:
For Bourbon method:
y = - 13.268x + 208.65 (R2 = 0.9824) ---------------(4.17)
For Alcohol method:
y = - 10.578x + 153.76 (R2 = 0.963) ---------------(4.18)
For High Temperature method:
y = - 11.371x + 69.806 (R2 = 0.9629) ---------------(4.19)
For Low Temperature method:
y= - 16.349x + 152.41 (R2 = 0.9941) ---------------(4.120)
where, y = moisture content (db) of the beans in %
x = time for slow drying in days
75
Moisture Vs Time
0
25
50
75
100
125
150
175
200
1 2 3 4 5 6 7 8
Time(day)
Mo
istu
re(d
b,%
)
High Temp
Low Temp
Bourbon method
Alcohol Method

Fig. 4.17. MC Vs Time during slow drying, for sample C
The figure 4.17 shows the variation in MC for grade C beans. After high
temperature method, MC was reduced to 16.06%, which is the maximum
reduction, in the case of sample C beans. The minimum reduction in MC was seen
in alcohol method (57.83%). After slow drying, the variation in MC for Bourbon
method was 65.14%.
The linear relationship between moisture content and drying time for the
different methods are as follows:
For Bourbon method:
y = - 12.723x + 149.58 (R2 = 0.9926) ---------------(4.21)
For Alcohol method:
y = - 14.123x + 185.85 (R2 = 0.9772) ---------------(4.22)
For High Temperature method:
y = - 6.0312x + 38.984 (R2 = 0.9352) ---------------(4.23)
For Low Temperature method:
y= - 10.663x + 103.41 (R2 = 0.9863) ---------------(4.24)
where, y = moisture content (db) of the beans in %
x = time for slow drying in days
4.2.4.2.2 Length
Appendix VIII and fig.4.6, 4.7 & 4.8 show the variation in length during slow
drying for the different treatments.
Fig.4.6 shows the variation in length for sample A beans. The maximum reduction
was given by low temperature method (0.483%)) while the minimum reduction
76

was 0.43%, after Bourbon method. The variations were similar for high
temperature method (0.476%) and low temperature method (0.50%)
The variation in length for grade B beans, during slow drying, is shown in
fig.4.7.The length reduced by 0.54% in Bourbon method. No variation in the
length was seen for alcohol method while for high temperature method the length
reduced by 0.59%. For low temperature method, the variation was found to be
0.62%.
The variations in length for grade C beans, during slow drying, are shown in
fig.4.8. No variation in length was observed, for Bourbon and alcohol methods but
slight variation in length (0.76%) was observed in the case of high temperature
method and low temperature method (0.89%).
4.2.4.2.3 Breadth
A slight decrease in breadth is seen after slow drying, for the four methods
and this is shown in Appendix IX and fig.4.9, 4.10,4.11
For grade A beans, the variation in breadth is shown in fig.4.9. Maximum
variation in breadth was observed in high temperature method (37.70%) and
minimum was 12.28%; seen in the case of Bourbon method. After low
temperature, the breadth reduced by26.96%. The variation after alcohol method
was found to be 36.70%.
The variation in breadth for sample B beans is given by fig.4.10. By Alcohol
method showed maximum variation of 30.3%, while minimum variation was
observed for beans treated by Bourbon method (20%). After high temperature
method, the breadth was reduced by25.7%. For low temperature method the
variation was observed to be 20.7%.
77

The variation in breadth for sample C beans is shown in fig.4.11. The beans
treated by Bourbon method showed maximum reduction of 33.82 % while it was
20.33% for alcohol method and 15.5% for high temperature method. The least
reduction was 15%, which was in the case of low temperature method.
4.2.4.2.4 Thickness
Appendix X and figures 4.12, 4.13, 4.14, depict the changes in thickness for
various samples during slow drying, subjected to the different treatments
The figure 4.12 depicts variation in thickness for grade A beans, during slow
drying. The maximum reduction in thickness after slow drying was observed as
32.75% for low temperature method .The thickness was reduced by 40.67% in the
case of both alcohol method and by 49.27for high temperature method .For Bourbon
method, the thickness reduced from 0.51cm to 0.33 cm (35.29%).
The variation in thickness for sample B beans, during slow drying, is shown in
fig.4.13. The maximum variation in thickness was observed to be 38.02%, in the
case of Bourbon method. After alcohol method the thickness was reduced by
25.53%. The variation in thickness for high temperature method was 31.11 % and
for low temperature method was 24.48 %.
Fig.4.14 shows the variation in thickness for grade C beans, during slow drying.
The reduction in thickness was the maximum in high temperature method (38.46 %)
while it was 17.64% and 15.38 % for Bourbon method and alcohol method
respectively. After low temperature method the thickness was reduced to
0.28cm(12.5%).
78

4.2.4.3 Conditioning
After slow drying, the beans were bundled and wrapped in bee-wax paper and
kept for conditioning ( Plate No.16 & 17).The variation in physical properties of
beans was less during the conditioning stage compared to the other three stages
and these are discussed below.
Plate No.16 Beans after Slow Drying Followed by Bundling
79

Plate No.17 Beans Wrapped in Bee-Wax Paper for Conditioning
4.2.4.3.1 Moisture content
80

The variation in the MC of beans during the conditioning stage is depicted in
Appendix XI and figures 4.18, 4.19 & 4.20.
Fig. 4.18 MC Vs Time during conditioning, for sample A
Fig 4.15 shows the variation in MC for sample A beans. It was maximum for
the Bourbon method (42.51%) and minimum for the low temperature method
(15.31%). For the alcohol method, the MC reduced from 43.98% to 13.77% while for
the high temperature method, MC reduced from 49.86% to 25.01%; the variation
being 24.85%.
The linear relationship between moisture content and drying time for the
different methods are as follows:
For Bourbon method:
y = - 14.138x + 115.95 (R2 = 0.9996) ---------------(4.25)
For Alcohol method:
y = - 9.849x + 54.055 (R2 = 0.9929) ---------------(4.26)
For High Temperature method:
y = - 8.6424x + 60.337 (R2 = 0.9674) ---------------(4.27)
81
Moisture Vs Time
0102030405060708090
100110
1 2 3 4 5 6
Time
Mo
istu
re (
%d
b)
Bourbon method
Alcohol method
High temp
Low temp

For Low Temperature method:
y= - 5.6054x + 56.859 (R2 = 0.9824) ---------------(4.28)
where, y = moisture content (db) of the beans in %
x = time for conditioning in days
Fig. 4.19. MC Vs Time during conditioning, for sample B
The variation in MC for the grade B beans is shown in fig.4.19. Under high
temperature method, the MC variation was minimum (7.67%)the MC of the beans
under low temperature method reduced from 38.32%to 24.29% while in case of
alcohol method it was from 43.98% to 13.77%. The variation was maximum for the
beans under Bourbon method (55.17%).
The linear relationship between moisture content and drying time for the
different methods are as follows:
For Bourbon method:
y = - 18.932x + 120.29 (R2 = 0.9743) ---------------(4.29)
82
Moisture Vs Time
0102030405060708090
100110
1 2 3 4 5
Time
Mo
istu
re (
% d
b)
Bourbon method
Alcohol method
High temp
Low temp

For Alcohol method:
y = - 16.404x + 85.726 (R2 = 0.9947) ---------------(4.30)
For High Temperature method:
y = - 2.4702x + 24.362 (R2 = 0.9397) ---------------(4.31)
For Low Temperature method:
y= - 4.7119x + 41.849 (R2 = 0.9476) ---------------(4.32)
where, y = moisture content (db) of the beans in %
x = time for conditioning in days
Fig. 4.20 MC vs. Time for sample C, conditioning
The variations in the MC for grade C beans are shown in fig.4.20. during
conditioning stage were observed as 33.48%, 48.92%11.04%and 38.62% for Bourbon
method alcohol method, high temperature method and low temperature method
respectively.
83
Moisture Vs Time
0
10
20
30
40
50
60
70
80
1 2 3 4 5
Time
Mo
istu
re (
% ,
db
)
Bourbon method
Alcohol method
High temp
Low temp

The linear relationship between moisture content and drying time for the
different methods are as follows:
For Bourbon method:
y = - 11.495x + 61.415 (R2 = 0.9913) ---------------(4.33)
For Alcohol method:
y = - 16.376x + 93.322 (R2 = 0.9958) ---------------(4.34)
For High Temperature method:
y = - 3.672x + 17.58 (R2 = 0.9966) ---------------(4.35)
For Low Temperature method:
y= - 13.118x + 69.872 (R2 = 0.9932) ---------------(4.36)
where, y = moisture content (db) of the beans in %
x = time for conditioning in days
4.2.4.3.2 Length
During conditioning stage the variation in length of the beans was observed to
be nil (given in Appendix XII). A straight-line variation was obtained in each case, as
shown in figure 4.6,4.7 and 4.8.
4.2.4.3.3 Breadth
The variation in breadth of the beans during the curing stage was insignificant
and is highlighted in Appendix XIII and figure 4.9, 4.10, 4.11.
Fig.4.9 shows the variation in breadth for grade A beans, during conditioning.
Under alcohol method, the breadth remained same. For the beans treated by Bourbon
84

method, the breadth was 1cm for the first 10 days and then reduced to 0.99cm(1%)
and no further variation was observed .The variation in breadth on conditioning was
3.77% and 3.33% for the beans cured by high temperature and low temperature
methods respectively.
The variation in breadth for grade B beans ,during conditioning, is shown in
fig.4.10.There was no variation in breadth, , for the beans cured by Bourbon method
and low temperature method. For the beans cured by high temperature method and
alcohol method, the variations in breadth were 3.84% and 1.81% respectively.
Fig.4.11 depicts the variation in breadth for grade C beans. The variation in
breadth was found to be maximum for the beans cured by high temperature method
(1.61%). The variation was 1%, 1.61% and 3.03% for the beans under Bourbon
method, alcohol method and low temperature method respectively.
4.2.4.3.4 Thickness
The variations in thickness of the beans on conditioning are depicted in
Appendix X1V and figures 4.12, 4.13 & 4.14.
The variation in thickness for grade A beans is depicted in fig.4.24. On
conditioning thickness was the same for Bourbon method and high temperature
method (6.06%). The maximum variation was seen in the case of beans cured by low
temperature method (6.45%). The variation in thickness for alcohol method was
5.71%.
Fig.4.13 gives the variation in thickness for grade B beans, during conditioning.
For the low temperature method, the thickness remained same but for the beans cured
by Bourbon method, alcohol method and high temperature, there was a reduction by
2.27%, 2.85%and 3.22% respectively.
85

The variation in thickness , during conditioning, for grade C beans is shown in
fig.4.14 . Maximum variation in thickness was observed for the beans under
alcohol method (6.06%). But for all other beans cured by Bourbon method, high
temperature method and low temperature method, the thickness was found to b
have reduced by 3.57%, 4.34%and 3.57% respectively.
4.2.5 Effect of Different Treatments on Curing
The observed features and general out look of the vanilla beans as affected by
different curing methods are shown in the tables 4.8, 4.9, 4.10 & 4.11. From the tables
it is revealed that the beans cured by alcohol method and low temperature method
have high vanillin content.
Table 4.8. Observed Features of Hot Water Killed- Sun dried Beans.
Stage
Characteristics
Colour MC Aroma Wt
(% of
original
wt)
Vanillin
Content
(% by wt)
Killing Pale green 478.37 Nil Nil
1.90
Sweating Light
Brown
181.22 Present 48.63
Slow drying Brown 84.86 Present 39.16
Conditioning Chocolate
Brown
41.14 Present 21.40
Table 4.9. Observed Features of Alcohol Killed Sun dried Beans.
Stage Characteristics
86

Colour MC Aroma Wt
(% of
original
wt)
Vanillin
Content
(% by wt)
Killing Green 478.42 Nil Nil
2.14
Sweating Light
Brown
152.34 Present 43.63
Slow drying Brown 62.98 Present 28.18Conditioning Chocolate
Brown
20.57 Present 9.21
Table 4.10. Observed Features of Hot Water Killed- High Temperature
Mechanically Dried Beans
Stage CharacteristicsColour MC Aroma Wt
(% of
original
wt)
Vanillin
Content
(% by wt)
Killing Pale green 478.37 Nil Nil
2.05
Sweating Light
Brown
82.6 Present 35.12
Slow drying Brown 29.84 Present 22.98Conditioning Chocolate
Brown
14.37 Present 13.29
Table 4.11. Observed Features of Hot Water Killed, Low Temperature
Mechanically Dried Beans
Stage Characteristics
87

Colour MC Aroma Wt
(% of
original
wt)
Vanillin
Content
(% by wt)
Killing Pale green 478.38 Nil Nil
2.17
Sweating Light
Brown
175.56 Present 50.54
Slow drying Brown 87.59 Present 26.32Conditioning Chocolate
Brown
26.77 Present 14.44
88

SUMMARY & CONCLUSION
89

SUMMARY AND CONCLUSION
Vanilla beans are one of the most expensive spices traded in the global market.
The fresh vanilla beans do not have any flavour or aroma because vanillin and other
chemical substances responsible for it are not present in the free form at the time of
harvesting. During the process of curing, free vanillin is developed in the beans as a
result of a series of enzymatic actions on several glycosides.
The traditional curing method (Bourbon method) is time consuming and
laborious. This puts off the farmers from curing beans. With this in view, an attempt
was made in KCAET, Tavanur to standardize the curing techniques.
An extensive survey was conducted among vanilla growers in different
districts viz. Calicut, Wayanad, Idukki and Kannur and the various constraints in the
vanilla cultivation and processing were identified. The constraints in vanilla
cultivation are spread of diseases, high water requirement and theft, while the
constraints in curing were high labour requirement, time consumption, improper
storage and fungal infection.
Following this, beans were procured and graded based on length into three
sets A (>20 cm), B (15-20 cm), and C (<15 cm). Each set was then divided into four
samples and subjected to four different curing techniques-
Method I: Hot water killing followed by sun drying.
Method II: Killing using alcohol followed by sun drying.
Method III: Hot water killing followed by high temperature
mechanical drying.
Method IV: Hot water killing followed by low temperature
90

mechanical drying.
Each method consists of four stages viz; killing, sweating, slow drying and
conditioning. The moisture kinetics and the physical parameters like length, breadth,
and thickness were monitored during each stage.
At the time of sweating and drying, maximum reduction in moisture content
(87.83%) was seen in beans cured by high temperature method , followed by low
temperature method (70.63%) and Bourbon method (70.63%). The reduction in
moisture content was the minimum for alcohol method (67.44%).
The percentage reductions in moisture content, during slow drying stage, were
observed as 65%, 50%, 48.97%and 43.79% for alcohol method, high temperature
method, Bourbon method and low temperature method respectively.
On conditioning, the moisture content reduced to 68.69% for alcohol method,
followed by 49.84%, 41.61% and 29.06%for high temperature method, Bourbon
method and low temperature method respectively.
No significant variations were observed in the length and breadth of the beans,
in each stage of curing. The thickness reduced significantly during each stage
and the final thickness was observed as 69%, 67.77%, 65.55%, and 63.33%, of the
initial thickness, for the high temperature method, low temperature method, Bourbon
method and alcohol method respectively.
After curing, the vanillin content and moisture content of the beans were
tested at the Quality Evaluation Laboratory, Spices Board, Cochin. The vanillin
content was found to be 2.17%, 2.14%, 2.05%, and 1.90% for low temperature
method, alcohol method, high temperature method and Bourbon method respectively.
The maximum moisture content was determined to be 39% in the case of beans cured
91

by Bourbon method, followed by alcohol method (27%), low temperature
method(24%) and high temperature method (15%).
SUGGESTIONS
Curing may be done devoid of killing stage and the quality changes may be
observed.
Sun drying may be done under shade nets to prevent over burning of beans.
Solar drying can be tried as an alternate to sun drying, to control the drying
conditions and prevent contamination of beans.
Convective drying may be performed under various low temperature ranges.
Slow drying may be tried with low temperature and low relative humidity
conditions.
Conditioning could be carried out under different conditions of temperature
and relative humidity.
92

ABSTRACT
An extensive survey was conducted among vanilla growers in four different
districts in Kerala, to identify the various constraints in vanilla cultivation and
processing. The high time consumption and labour requirement of the traditional
curing technique put off the farmers from doing the curing process. In this study,
an attempt was made to standardize the curing technique. For this purpose, the
beans were cured by four different methods. The first method adopted was the
traditional Bourbon method, which took two months and the final moisture
content was 39% and the reduction in thickness was 34.45%. The second method
consisted of killing by alcohol followed by sun drying and final moisture content
was found to be 27%and the reduction in thickness was 68.69%. The third method
consisted of killing using hot water followed by high temperature mechanical
drying and the final moisture content (15%) and reduction in thickness (31%) was
observed. Method four consisted of killing using hot water followed by low
temperature mechanical drying. For this method the final moisture content was
24% and reduction in thickness was 32.23%. The vanillin content of the beans on
completion of curing was tested at the Quality Evaluation Laboratory, Spices
Board, Cochin. The maximum vanillin content (2.17%) was found in the beans
cured by low temperature method followed by alcohol method (2.14%), high
temperature method (2.05%) and Bourbon method (1.90%).
93

REFERENCE
94

REFERENCES
Abdulla, K.M.1997. Drying of vanilla pods using green-house effect solar dryer. Drying Technology, 15(2): 685-698
Anilkumar, A.S.2004.Vanilla Cultivation-A Profile Agri-based Enterprise.Kerala Calling 26- 29.(www.kerala.gov.in/keralacalfeb04/p26-30.pdf)
Anon.1998. Vanilla. The prince of spices. Spice Board India. Cochin.pp:55-69
Anon.2001.Vanilla. Indian Institute of Spices Research.Calicut. pp:3 (www.iisr.org /atic/vanilla.pdf)
Anon.2003. http://www.thehindubusinessline.com
Anon.2004.Indian Agricultural Resources. Vanilla. Horticulture Paper. pp 5-6.
(www.indiaagronet.com/horticulture/content/vanilla.htm)
*Ansaldi, G. M., Marseille, G.G. and Aubagne, J. L. P. 1990. Process for obtaining
natural vanilla flavour by treatment of green vanilla beans and the flavour
obtained. US Patent No. 4. 1956.192.
Arana, F. E. 1943.Action of β-Glucosidase in the curing of vanilla. Food Res. 8:343-
351.
*Arana, F.E. 1944. Vanilla curing and its chemistry. USDA Fed. Expt. Station.
Mayaguez. Puerto Rico; Bulletin No. 42 (October) Washington DC: USDA.
*Balls, A. K. and Arana, F. E. 1941a. Curing of vanilla. Ind. Eng. Chem. 33: 1073-
1075.
*Balls, A. K. and Arana, F. E. 1941b. Determination and significance of phenols in
vanilla extract. Assoc. off. Agr. Chem. J. 24: 570-512.
95

*Bouriquet, G. 1954. Le vanillier et la Vanille dans le Monde. Paris:Editions Paul
Lechavalier.
*Cernuda, C. F. and Loustalot, A. J. 1948. Vanilla curing. USDA Fed. Expt
Station.Mayaguez. Puerto Rico; Report for 1947 (Oct. 1948) Washington DC:
USDA.
*Childers, N. F., Cibes, H. R. and Hernandez-Medina, E. 1959. Vanilla-The orchid of
commerce. In: C. L. Withner (Ed.).A Scientific Survey, Robert E. Krieger
Publishing company, Malabar, Florida : 477-508.
*Correll, D. S. 1953. Vanilla its botany, history, cultivation and economic import.
Econ. Bot. 7:291-358.
*Dignum, M. J. W., Kerler, J. and Verpoorte, R. 2001a. Vanilla production:
Technological, Chemical, and Biosynthetic aspects. Food Res. Inter. 17: 199-
219.
*Dignum, M. J. W., Kerler, J. and Verpoorte, R. 2001b. β-Glucosidase and
Peroxydase stability in crude enzyme extracts from grean beans of vanilla
planifolia Andrews. Phytochem. Anal. 12: 174-179.
Felter,H.W. and Lloyd,J.U.1998.Tincture of vanilla. Kings American Dispensatory.
(www.ibiblio.org/herbmed/electric/king/vanilla-tinc.html)
Havkin ,D., French ,J.C., Graft ,N.M., Pak ,F.E., Frenkel, C.and Joel, D.M. 2004.
Interrelation of Curing and Botany in Vanilla Bean. International Horticultural
Congress:The Future for Medicinal and Aromatic Plants.12: 93-96.
(www.baktoflavours.com./pdf/vanilla%20dafna %20 ishs.pdf)
96

*Havkin-Frenkel, D., French, J.C., Pak, F.E. and Frenkel, C. 2003. Botany and Curing
of vanilla. J. Arom. Med. Plants. In press.
*Jones, M. A. and Vincente, G. C. 1949a. Criteria for testing vanilla in relation to
killing and curing methods, J. Agric. Res., 78, 425-34.
*Jones, M. A. and Vincente, G. C. 1949c.Quality of cured vanilla in relation to some
natural factors, J. Agric. Res., 78, 425-50.
*Leong, G., Archavlis, A. and Derbesy, M. 1989a. Research on the glucoside fraction
of the vanilla bean. J. Essent. Oil Res. 1: 33-41.
*Leong, G., Uzio, R. and Derbesy, M. 1989b. Synthesis, identification and
determination of glucosides present in green vanilla beans vanilla fragrans
Andrews. Flavour frag. J. 4: 163-167.
Madhusoodanan, K.J. ,Radhakrishnan, V.V. and Sudarsan, M.R.2003. Botany of
Vanilla, Spice India (16): 14-15.
*Memory, G. 1968. Food flavourings. Composition, manufacture and use, West port,
Conn: Avi Publishing Co.
Pruthi, J.S. 2000.Minor Spices and Condiments. Directorate of Information and
Publications of Agriculture, New Delhi : 610-615.
Pruthi, J.S.1998. Spices and Spice Products, Allied Publishers Limited, New
Delhi.175
Purseglove,J.W; Brown,E.G., Green.C.L. and Robbins, S.R.J.1988. Spices (2),
Longman Scientific and Technical Publishing Co. ,New York:648-657
97

*Ranadive, A. S., Szkutnica, K., Guerreram, J. G. and Frenkel, C. 1983. Vanillin
biosynthesis in vanilla bean. IX International Congress of Essential Oils.
Singapore. Proceedings of the Congress, Book 147.
Sahay,K.M and Singh,K.K . 1994.Unit Operations of Agricultural Processing,Vikas
Publishing House Pvt.Ltd.,New Delhi,p:67.
Senguptha, R.2003. Vanilla: The Spice of Life for Indian Farmers.
http://www.kisanwatch.org/eng/features
Shedding kans., Fungicide application-Thomas .2003. Spice India (16): 14-25.
Subbiah,A.,Ramesh,A.,Selvarajan,M. and Chezhiyan,N.2002.Vanilla Cultivation as a
sustainable Intercrop under Coconut Plantations. Spice India (15): 2.
*Swamy, B. G. L. 1947. On the life history of vanilla planifolia. Botanical Gazette
108: 449-456.
*Theodose, R. 1973. Traditional methods of vanilla preparation and their
improvement. Trop. Sci. 15: 47-57.
Thomas,J.,Suseela,R. and Vijayan,A.K.2003.Vanilla-Diseases and Their
Management. Spice India (16): 20-25.
Thomas, J.2003.Shedding of Immature Beans in Vanilla. Spice India (16). 30-31.
Varadarasan,S.,Gopakumar,B. and Chandrasekar,S.S. 2003. Pests and their
Management in Vanilla. Spice India (16): 30-32.
www.swsbm.com ,2004, Harvesting and curing of vanilla .
98

www.gnujake.med.yale.edu/herbmed,2004, The fruit of Vanilla planifolia.
*Original not seen
99

STANDARDISATION OF VANILLA CURING TECHNIQUES
BY
Manjusha Mathew Roshni Raju
Shailesh Kumar Singh
ABSTRACT OF THE PROJECT REPORT
Submitted in partial fulfilment of the Requirement for the degree
Bachelor of TechnologyIn
Agricultural Engineering
Faculty of Agricultural EngineeringKerala Agricultural University
Department ofPost Harvest Technology & Agricultural ProcessingKELAPPAJI COLLEGE OF AGRICULTURAL ENGINEERING
AND TECHNOLOGYTAVANUR- 679 573 , MALAPPURAM
KERALA , INDIA2005
100

Appendix I
Schedule for Collecting Data from Farmers
Kerala Agricultural University
Kelappaji College of Agricultural Engineering and Technology
Tavanur-679573
Survey of Vanilla Crop for Processing
Location: Date:
1. Name : 2. District :
3. Taluk :
4. Total Area Under Cultivation: Marginal 1 2 3 4 5 Large
5. Area under Vanilla cultivation: Marginal 1 2 3 4 5 Large
6. Variety of Vanilla Cultivated: (i)
(ii) (iii)
7. Numbers of year since taking up Vanilla cultivation :
8. Source of Cultivating Materials :
9. Method of pollination adopted :
10. Method of Irrigation :
101

11. Any scientific method used for cultivation :
12. Time/Stage which harvesting is done :
13. Are the beans sold raw :
14. The reason for not curing beans :
15. Time required for curing process :
16. Numbers of days after harvest with in which curing must be done :
17 Method of killing : a. Time: b. Temperature: c. Humidity:18 Method of bundling used :
a. b.
19 Type of Thread used :
20 Type of Blanket used for sweating :
21 Time for Sweating :
22 Temperature for sweating :
23 Humidity at sweating :
24 Method of drying : a. b.
25 Temperature for drying :
26 Drying time :
27 Humidity :
28 Method of conditioning or ageing :
29 Temperature for ageing :
102

30 Time for ageing :
31 Stage at which the curing process is completed :
32 Humidity of cure bean :
33 Colour of cure bean :
34 Method adopted for the prolong storage :a. Temperature :b. Humidity :
35. Approximate cost of curing process :36. Approximate time for curing process :
37. Are doing curing by self or taking help from any organization/Institution :
38. Numbers of labour required for curing :
39. Any Machine for curing :
40. Any Aid from Government/spice board :
41. Have you received any Experts opinion :
42. If time of curing is reduced are you interested to adopting it :
43. Any suggestion for reducing time :
44. Agencies sought after for sale of beans :
45. Usual difficulties encountered during Vanilla cultivation :
46. Organic manures/fertilizer used for vanilla cultivation :
47. Are you aware of the immense profit you could make through the sale of cured vanilla beans :
48. Relative Advantage :
I. Initial cost : Cheap 1 2 3
4 5 Expensive
103

II. Net Profitability : Meagre 1 2 3 4
5 Exorbitant
III. The consistency of profits : Irregular 1 2 3 4
5 Regular
IV. Saving of time : Time consuming 1 2 3 4
5 Time saving
V. Multiple use potential : Single benenfit 1 2 3 4
5 Multiple benefits
49. Personal experience in Vanilla cultivation :
50. Any suggestion for vanilla cultivation to other farmers:Note: Relative Advantage
I. Initial Cost: Cash or capital investment required for adoption of an
innovation by farmers.
II. Net Profitability: Quantum of benefit expected due to adoption of an
innovation.
III. Consistency of profits: Regularity of net return from an innovation over a
period of time
IV. Saving of time: Efficiency of an innovation in terms of saving of time and
best utilization of opportunities.
V. Multiple use potential: Adoption of an innovation result in multiple benefits
104

APPENDIX – II
Table II-i. Temperature Adopted for Mechanical Drying
Methods High temperature Low temperatureDuration
(H)
Temp (oC) Duration of
drying (H)
Temp (oC) Duration of
drying (H)0 50 1 45 112 50 1 45 124 60 1 50 136 60 1 50 148 60 1 55 160 60 1 55 172 70 1 55 184 70 1 60 196 70 1 60 1108 70 1 60 1120 70 1 60 1132 70 1 60 1
105

Appendix III
Table III- i. Variation in Moisture Content during
Sweating
Days
Bourbon method(MC,%) Alcohol method (MC,%)
High temp method (MC,
%) Low temp method(MC,%)
A1 B1 C1 A2 B2 C2 A3 B3 C3 A4 B4 C4
1 478.39 478.39 478.33 478.43 478.34 478.48 478.38 478.37 478.38 478.38 478.38 478.38
2 435.65 452.53 444.32 453.29 431.02 401.91 397.25 444.34 419.65 411.76 428.14 421.73
3 409.00 424.63 404.92 416.50 398.16 359.38 333.8 363.59 321.61 379.91 372.49 342.46
4 375.99 394.01 366.43 380.35 363.72 318.97 275.96 281.77 239.42 335.59 321.49 283.68
5 359.35 379.59 345.84 359.92 343.74 294.30 214.35 203.71 158.84 288 275.71 237.08
6 326.52 340.19 304.48 323.77 309.04 256.02 155.37 138.42 99.72 244.43 224.47 178.77
7 291.05 321.88 276.01 277.24 268.03 207.53 102.55 87.05 58.2 208.07 178.16 140.46
8 270.13 286.16 234.29 255.23 244.90 195.19
9 236.85 239.00 198.30 218.14 189.96 187.11
10 214.75 219.68 170.90 151.49 157.10 180.73
11 200.20 203.01 140.47 125.72 151.84 179.46
Table III- ii. Duration and % Reduction in Moisture Content during Sweating
Days
A1 B1 C1 A2 B2 C2 A3 B3 C3 A4 B4 C4
10 10 10 10 10 10 6 6 6 6 6 6
%decr
ease
in mc
58.15 57.56 70.63 73.72 68.26 62.4978.5
6
81.0
8
87.8
3
56.5
0
62.7
5
70.6
3
Avg%
decrea
se in
mc
62.11 68.16 82.49 63.29
106

Appendix IV
Table IV- i. Variation in Length during Sweating
DaysBourbon (l, cm) Alcohol (l, cm) High temp (l, cm) Low temp (l, cm)
A1 B1 C1 A2 B2 C2 A3 B3 C3 A4 B4 C41 23.5 18.8 12.7 20.2 17.2 11.6 21 17.1 13.4 21.5 16.4 11.42 23.5 18.8 12.7 20.2 17.2 11.6 21 17.1 13.3 21.5 16.4 11.33 23.48 18.7 12.7 20.2 17.2 11.6 21 17.0 13.3 21.5 16.3 11.34 23.42 18.7 12.7 20.2 17.1 11.5 20.9 17.0 13.2 21.4 16.2 11.25 23.42 18.7 12.6 20.2 17.1 11.5 20.9 16.9 13.1 21.4 16.2 11.16 23.41 18.6 12.6 20.2 17 11.5 20.8 16.9 13.0 21.3 16.2 11.17 23.41 18.6 12.6 20 17 11.58 23.4 18.5 12.6 20 16.9 11.59 23.4 18.5 12.6 20 16.9 11.4
10 23.4 18.5 12.5 20 16.9 11.411 23.4 18.4 12.5 20 16.9 11.4
Table IV-ii. Duration and % Reduction inLength during Sweating
Days A1 B1 C1 A2 B2 C2 A3 B3 C3 A4 B4 C4
10 10 10 10 10 10 6 6 6 6 6 6%Decre
ase in
length
0.42 0.54 0 0.5 0 0 0.48 0.59 0.76 0.95 0.62 0.89
Avg%
decrease
in
length
0.32 0.167 0.6 0.82
Appendix V
107

Table V-i. Variation in Breadth duringSweating
DaysBourbon (b, cm) Alcohol (b, cm) High temp (b, cm) Low temp (b, cm)
A1 B1 C1 A2 B2 C2 A3 B3 C3 A4 B4 C41 1.25 1.15 1.09 1.15 1.08 1.09 1.29 1.09 1.13 1.41 1.17 0.982 1.2 1.14 0.99 1.13 1.03 1 1.17 0.98 0.98 1.3 1.05 0.793 1.17 1.12 0.95 1.09 0.98 0.98 1.14 091 0.91 0.98 0.96 0.684 1.17 1.11 0.89 1.01 0.91 0.94 1.09 0.81 0.88 0.93 0.90 0.615 1.17 1.08 0.84 0.96 0.89 0.89 1.0 0.77 0.81 0.91 0.86 0.556 1.16 1.02 0.81 0.92 0.85 0.8 0.93 0.70 0.77 0.89 0.82 0.397 1.16 1.01 0.79 0.9 0.84 0.778 1.15 0.98 0.74 0.87 0.83 0.719 1.15 0.96 0.7 0.82 0.82 0.69
10 1.14 0.92 0.69 0.8 0.8 0.6411 1.14 0.9 0.68 0.79 0.79 0.59
Table V-ii. Duration and % Reduction in Breadth during Sweating
Days
A1 B1 C1 A2 B2 C2 A3 B3 C3 A4 B4 C4
10 10 10 10 10 10 6 6 6 6 6 6
%Decre
ase in
breadth
8.84 21.7 37.6 31.3 26.85 45.87 27.90 35.7 31.85 36.9 29.9 60
Avg
%decre
ase in
breadth
22.71 34.67 31.81 42.26
Appendix VI
Table Vi-i. Variation in Thickness during Sweating and Drying
DaysBourbon (t, cm) Alcohol (t, cm) High temp (t, cm) Low temp (t, cm)
A1 B1 C1 A2 B2 C2 A3 B3 C3 A4 B4 C4
108

1 0.93 1.05 0.73 0.9 0.86 0.86 1.0 0.92 0.8 0.93 0.88 0.792 0.9 0.96 0.65 0.86 0.79 0.81 0.91 0.88 0.69 0.81 0.8 0.653 0.74 0.92 0.63 0.8 0.72 0.73 0.83 0.76 0.6 0.72 0.69 0.554 0.65 0.9 0.6 0.76 0.69 0.68 0.80 0.64 0.57 0.64 0.59 0.385 0.62 0.86 0.51 0.72 0.63 0.62 0.76 0.51 0.49 0.59 0.54 0.346 0.61 0.82 0.48 0.69 0.6 0.58 0.69 0.45 0.39 0.57 0.49 0.327 0.6 0.8 0.46 0.67 0.59 0.558 0.58 0.78 0.41 0.64 0.56 0.59 0.55 0.75 0.38 0.62 0.52 0.48
10 0.52 0.73 0.36 0.6 0.49 0.4211 0.51 0.71 0.34 0.59 0.47 0.39
Table VI-ii. Duration and % Reduction in Thickness during Sweating
Days A1 B1 C1 A2 B2 C2 A3 B3 C3 A4 B4 C4
10 10 10 10 10 10 6 6 6 6 6 6%Decrea
se in
thickness
45.16 32.38 53.42 34.44 45.34 54.65 31.0 51.1 51.3 33.3 44.3 59.5
Avg
%decrea
se in
thickness
43.62 44.81 44.44 45.71
Appendix VII
Table VII-i. Variation in Moisture Content during Slow Drying
109

DaysBourbon method (%,MC) Alcohol method II (MC,%) High temp method (MC,%) Low tempMethod(MC,%)A1 B1 C1 A2 B2 C2 A3 B3 C3 A4 B4
1 200.20 203.01 140.47 125.72 151.84 179.46 102.55 87.05 58.2 208.07 178.16 140.46
2 175.19 174.02 119.34 99.62 126.60 147.98 65.99 55.71 32.61 161.57 169.45 137.653 170.92 169.67 113.97 95.22 121.08 142.45 61.81 53.92 32.04 154.04 133.71 93.874 154.73 154.01 97.85 83.28 107.41 130.54 58.22 50.85 28.81 150.44 126.71 87.935 141.45 141.09 83.53 72.27 95.85 119.48 55 41.14 21.77 146.84 122.26 81.366 129.90 128.77 73.86 64.10 94.53 97.79 52.96 36.29 18.15 140.90 114.78 77.927 116.44 117.61 60.61 52.47 82.70 85.03 51.77 27.77 16.44 130.77 107.38 69.488 102.16 103.46 48.97 43.98 69.30 75.67 50.81 22.66 16.06 127.67 96.09 66.049 116.96 83.54 62.29
Table VII-ii. Duration and % Reduction in Moisture Content during Slow Drying.
Days
A1 B1 C1 A2 B2 C2 A3 B3 C3 A4 B4 C4
6 6 6 6 6 6 5 5 5 10 10 10
%Dec
rease
in MC
78.64 78..4 65.14 90.80 85.51 84.18 56.5 73.9 72.4 38.6 46.1 53.0
Avg%
decrea
se in
MC
74.05 86.83 65.61 45.89
110

Appendix VIII
Table VIII-i. Variation in Length during Slow Drying
DaysBourbon (l, cm) Alcohol (l, cm) High temp (l, cm) Low temp (l, cm)
A1 B1 C1 A2 B2 C2 A3 B3 C3 A4 B4 C41 23.4 18.4 12.5 20 16.9 11.4 20.7 16.9 13.1 21 16.1 11.22 23.5 18.4 12.5 20 16.9 11.4 20.7 16.9 13.1 21 16.1 11.23 23.5 18.4 12.5 20 16.9 11.4 20.7 16.9 13.1 21 16.1 11.24 23.48 18.4 12.5 20 16.9 11.4 20.6 16.9 13.1 21 16.1 11.25 23.42 18.3 12.5 19.9 16.9 11.4 20.6 16.9 13.1 21 16.1 11.26 23.42 18.3 12.5 19.9 16.9 11.4 20.6 16.8 13.1 20.9 16.1 11.27 23.41 18.3 12.5 19.9 16.9 11.4 20.6 16.8 13.1 20.9 16.1 11.18 23.3 18.3 12.5 19.9 16.9 11.4 20.6 16.8 13 20.9 16 11.19 20.9 16 11.1
Table VIII-ii. Duration and % Reduction in Lengthduring slow drying
Days A1 B1 C1 A2 B2 C2 A3 B3 C3 A4 B4 C4
6 6 6 6 6 6 5 5 5 10 10 10
%Decr
easein
length
0.42 0.53 1.57 0.99 1.74 1.7 0.95 1.16 2.98 0.93 1.21 2.63
Avg
%decre
ase in
length
0.84 1.48 1.69 1.59
111

Appendix IX
Table IX-i. Variation in Breadth during SlowDrying
DaysBourbon (b, cm) Alcohol (b, cm) High temp (b, cm) Low temp (b, cm)
A1 B1 C1 A2 B2 C2 A3 B3 C3 A4 B4 C41 1.14 0.9 0.68 0.79 0.79 0.59 0.9 0.7 0.77 0.89 0.82 0.392 1.13 0.88 0.65 0.72 0.75 0.58 0.88 0.69 0.76 0.8 0.8 0.383 1.1 0.86 0.62 0.69 0.72 0.57 0.81 0.67 0.76 0.78 0.78 0.384 1.08 0.85 0.6 0.64 0.7 0.55 0.76 0.64 0.74 0.75 0.77 0.375 1.05 0.81 0.59 0.6 0.65 0.52 0.71 0.6 0.73 0.73 0.76 0.366 1.03 0.79 0.58 0.58 0.61 0.49 0.62 0.59 0.69 0.7 0.74 0.367 1.02 0.76 0.5 0.54 0.58 0.48 0.56 0.57 0.65 0.69 0.71 0.358 1 0.72 0.45 0.5 0.55 0.47 0.53 0.52 0.62 0.65 0.68 0.349 0.60 0.65 0.33
Table IX-ii. Duration and % Reduction in Breadth during slow drying
Days A1 B1 C1 A2 B2 C2 A3 B3 C3 A4 B4 C4
6 6 6 6 6 6 5 5 5 10 10 10
%Decr
ease in
breadt
h
11.
518.18 30.76 30.55 26.67 18.96 39.77 24.63 18.42 25 35 13.15
Avg%
decrea
se in
breadt
h
20.14 25.39 27.60 16.13
112

Appendix X
Table X-i. Variation in Thickness during Slow Drying
DaysBourbon (t, cm) Alcohol (t, cm) High temp (t, cm) Low temp (t, cm)
A1 B1 C1 A2 B2 C2 A3 B3 C3 A4 B4 C41 0.51 0.71 0.34 0.59 0.47 0.39 0.69 0.45 0.39 0.58 0.49 0.322 0.48 0.68 0.33 0.55 0.46 0.38 0.64 0.41 0.38 0.58 0.48 0.323 0.46 0.62 0.32 0.5 0.45 0.38 0.6 0.39 0.37 0.56 0.46 0.324 0.41 0.6 0.32 0.48 0.43 0.37 0.58 0.37 0.34 0.51 0.44 0.325 0.39 0.58 0.31 0.44 0.4 0.36 0.5 0.35 0.3 0.49 0.43 0.316 0.37 0.52 0.3 0.4 0.39 0.36 0.46 0.33 0.27 0.47 0.41 0.37 0.35 0.46 0.29 0.38 0.37 0.35 0.4 0.32 0.25 0.43 0.4 0.298 0.33 0.44 0.28 0.35 0.35 0.33 0.35 0.31 0.24 0.4 0.39 0.299 0.39 0.37 0.28
Table X-ii. Duration and % Reduction in Thickness during Slow Drying Days A1 B1 C1 A2 B2 C2 A3 B3 C3 A4 B4 C4
6 6 6 6 6 6 5 5 5 10 10 10
%Dec
rease
in
thick
ness
31.2
527.27 15.15 36.36 23.90 13.15
48.4
3
24.3
9
39.4
7
46.5
5
35.4
112.5
Avg
%
decre
ase in
thick
ness
24.55 24.47 37.43 31.48
Appendix XI
Table XI-i. Variations in Moisture Content during Conditioning
113

DaysBourbon (MC, %) Alcohol (MC,%) High temp (MC,%) Low temp (MC,%)A1 B1 C1 A2 B2 C2 A3 B3 C3 A4 B4 C4
1 102.16 103.46 48.97 43.98 69.30 75.67 49.86 22.66 14.16 52.67 38.32 57.2910 87.22 81.97 40.38 33.92 54.05 62.06 45.97 18.40 9.97 45.73 31.34 43.8420 73.39 58.14 25.87 26.06 34.33 45.04 34.08 16.70 6.35 41.63 26.33 28.5230 59.65 48.29 15.49 13.77 21.19 26.75 25.01 14.99 3.12 37.36 24.29 18.67
Table XI-ii. Duration and % Reduction in Moisture Content during
conditioning.
Days A1 B1 C1 A2 B2 C2 A3 B3 C3 A4 B4 C4
30 30 30 30 30 30 30 30 30 30 30 30
%Decr
ease in
mc
41.61 53.32 68.37 68.69 69.42 64.6449.8
4
33.8
5
77.9
6
29.0
7
35.8
3
67.4
1
Avg%
decreas
e in mc
54.43 67.58 53.88 44.10
Appendix XII
Table XII-i. Variation in Length during Conditioning
DaysBourbon (l,cm) Alcohol (l,cm) High temp(l,cm) Low temp (l,cm)
A1 B1 C1 A2 B2 C2 A3 B3 C3 A4 B4 C4
114

1 23.3 18.3 12.5 19.9 16.9 11.4 20.6 16.8 13 20.8 16 11.110 23.3 18.3 12.5 19.9 16.9 11.4 20.6 16.8 13 20.8 16 11.120 23.3 18.3 12.5 19.9 16.9 11.4 20.6 16.8 13 20.8 16 11.130 23.3 18.3 12.5 19.9 16.9 11.4 20.6 16.8 13 20.8 16 11.1
Table XII-ii. Duration and % Reduction in Length duringConditioning
Days A1 B1 C1 A2 B2 C2 A3 B3 C3 A4 B4 C4
30 30 30 30 30 30 30 30 30 30 30 30%Decrease in
length0 0 0 0 0 0 0 0 0 0 0 0
Avg%
decrease in
length
0 0 0 0
115

Appendix XIII
Table XIII-i. Variation in Breadth duringConditioning
DaysBourbon (b, cm) Alcohol (b, cm) High temp (b, cm) Low temp (b, cm)
A1 B1 C1 A2 B2 C2 A3 B3 C3 A4 B4 C41 1 0.72 0.45 0.50 0.55 0.47 0.53 0.52 0.62 0.60 0.65 0.33
10 1 0.72 0.45 0.50 0.55 0.46 0.52 0.52 0.62 0.59 0.65 0.3320 0.99 0.72 0.44 0.50 0.54 0.46 0.51 0.51 0.61 0.58 0.65 0.3330 0.99 0.72 0.44 0.50 0.54 0.45 0.51 0.5 0.61 0.58 0.65 0.32
Table XIII-ii. Duration and % Reduction in Breadth during Conditioning
Days A1 B1 C1 A2 B2 C2 A3 B3 C3 A4 B4 C4
30 30 30 30 30 30 30 30 30 30 30 30
%Decreas
e in
breadth
1 0 2.22 0 1.81 4.22 3.77 3.84 1.61 3.33 0 3.13
Avg%
decrease
in breadth
1.07 2.02 9.22 2.15
116

Appendix XIV
Table XIV-i. Variation in Thickness during Conditioning
DaysBourbon (t, cm) Alcohol (t, cm) High temp (t, cm) Low temp (t, cm)
A1 B1 C1 A2 B2 C2 A3 B3 C3 A4 B4 C41 0.33 0.44 0.28 0.35 0.35 0.33 0.33 0.31 0.23 0.31 0.31 0.28
10 0.32 0.44 0.28 0.34 0.35 0.32 0.32 0.31 0.23 0.3 0.31 0.2820 0.32 0.43 0.27 0.34 0.34 0.32 0.32 0.31 0.23 0.3 0.31 0.2830 0.31 0.43 0.27 0.33 0.34 0.31 0.31 0.3 0.22 0.29 0.31 0.27
Table XIV-ii. Duration and % Reduction in Thickness during Conditioning
Days A1 B1 C1 A2 B2 C2 A3 B3 C3 A4 B4 C4
30 30 30 30 30 30 30 30 30 30 30 30
%Decrea
se in
thickness
6.06 2.27 3.57 5.70 2.85 6.06 6.06 3.22 0 6.45 0 3.75
Avg%
decrease
in
thickness
3.96 4.87 3.09 3.40
Appendix I
Schedule for Collecting Data from Farmers
117

Kerala Agricultural University
Kelappaji College of Agricultural Engineering and Technology
Tavanur-679573
Survey of Vanilla Crop for Processing
Location: Date:
1. Name : 2. District :
17. Taluk :
18. Total Area Under Cultivation: Marginal 1 2 3 4 5 Large
19. Area under Vanilla cultivation: Marginal 1 2 3 4 5 Large
20. Variety of Vanilla Cultivated: (i)
(ii) (iii)
21. Numbers of year since taking up Vanilla cultivation :
22. Source of Cultivating Materials :
23. Method of pollination adopted :
24. Method of Irrigation :
25. Any scientific method used for cultivation :
26. Time/Stage which harvesting is done :
27. Are the beans sold raw :
118

28. The reason for not curing beans :
29. Time required for curing process :
30. Numbers of days after harvest with in which curing must be done :
17 Method of killing : a. Time: b. Temperature: c. Humidity:18 Method of bundling used :
a. b.
35 Type of Thread used :
36 Type of Blanket used for sweating :
37 Time for Sweating :
38 Temperature for sweating :
39 Humidity at sweating :
40 Method of drying : a. b.
41 Temperature for drying :
42 Drying time :
43 Humidity :
44 Method of conditioning or ageing :
45 Temperature for ageing :
46 Time for ageing :
47 Stage at which the curing process is completed :
48 Humidity of cure bean :
119

49 Colour of cure bean :
50 Method adopted for the prolong storage :a. Temperature :b. Humidity :
35. Approximate cost of curing process :36. Approximate time for curing process :
37. Are doing curing by self or taking help from any organization/Institution :
38. Numbers of labour required for curing :
39. Any Machine for curing :
40. Any Aid from Government/spice board :
41. Have you received any Experts opinion :
42. If time of curing is reduced are you interested to adopting it :
43. Any suggestion for reducing time :
44. Agencies sought after for sale of beans :
45. Usual difficulties encountered during Vanilla cultivation :
46. Organic manures/fertilizer used for vanilla cultivation :
47. Are you aware of the immense profit you could make through the sale of cured vanilla beans :
48. Relative Advantage :
I. Initial cost : Cheap 1 2 3
4 5 Expensive
II. Net Profitability : Meagre 1 2 3 4
5 Exorbitant
120

III. The consistency of profits : Irregular 1 2 3 4
5 Regular
IV. Saving of time : Time consuming 1 2 3 4
5 Time saving
V. Multiple use potential : Single benenfit 1 2 3 4
5 Multiple benefits
49. Personal experience in Vanilla cultivation :
50. Any suggestion for vanilla cultivation to other farmers:Note: Relative Advantage
VI. Initial Cost: Cash or capital investment required for adoption of an
innovation by farmers.
VII. Net Profitability: Quantum of benefit expected due to adoption of an
innovation.
VIII. Consistency of profits: Regularity of net return from an innovation over a
period of time
IX. Saving of time: Efficiency of an innovation in terms of saving of time and
best utilization of opportunities.
X. Multiple use potential: Adoption of an innovation result in multiple benefits
121