Rev. Caatinga, Mossoró, v. 29, n. 1, p. 246 – 256, jan. – mar., 2016
Universidade Federal Rural do Semi-Árido Pró-Reitoria de Pesquisa e Pós-Graduação
http://periodicos.ufersa.edu.br/index.php/sistema
ISSN 0100-316X (impresso) ISSN 1983-2125 (online)
http://dx.doi.org/10.1590/1983-21252016v29n129rc
246
SOURSOP LIQUOR PROCESSING: INFLUENCE OF THE PROCESS VARIABLES
ON THE PHYSICAL AND CHEMICAL CHARACTERISTICS1
EMANUEL NETO ALVES DE OLIVEIRA2*, DYEGO DA COSTA SANTOS3, YVANA MARIA GOMES DOS
SANTOS3, PAULO RENATO BUCHWEITZ4, JOSIVANDA PALMEIRA GOMES3
ABSTRACT - Soursop is a well-appreciated tropical fruit, both in natura and in the form of juices and nectars.
Despite its wide acceptance, there is lack of its use in the preparation of other products, such as alcoholic
beverages. The objective of this study was to prepare soursop liquors by varying the concentrations of pulp and
sucrose syrup with different contents of total soluble solids and to evaluate the effects of these on the physical
and chemical characteristics of the beverages. In the production process, the pulp (300, 400 and 500 g) was
macerated with distilled alcohol for 20 days, after which it was filtered, added to the syrup (50, 60 and 70 °
Brix), bottled in polyethylene bottles and subjected to an accelerated aging. All drinks resulted in alcohol levels
(15.25 to 16.69% v/v) and total sugars (12.63 to 17.97%) in accordance with the standards required by law. The
experiments made with the lowest concentration of pulp showed the highest yields (84.17 and 85.25%). First-
order models with interactions and 95% confidence intervals were obtained. The pulp consisted of the most
significant factor, influencing the largest number of responses (yield, alcohol content, dry residue, titratable
acidity, titratable acidity/soluble solids ratio and luminosity). The larger coefficient of determination (R2)
values were found in the models adjusted to the data of yield, dry residue, total soluble solids, titratable acidity
and total sugars, which were significant and predictive, showing values greater than 0.97.
Keywords: Alcoholic beverage. Annona muricata L.
PROCESSAMENTO DE LICOR DE GRAVIOLA: INFLUÊNCIA DAS VARIÁVEIS DE PROCESSO
NAS CARACTERÍSTICAS FÍSICAS E QUÍMICAS
RESUMO - A graviola é uma fruta tropical muito apreciada, tanto in natura como na forma de sucos e
néctares. Apesar de sua grande aceitação, existe a carência de sua utilização na elaboração de outros produtos, a
exemplo de bebidas alcoólicas. Objetivou-se com o estudo elaborar licores de graviola variando-se as
concentrações de polpa e xarope de sacarose com diferentes teores de sólidos solúveis totais e avaliar o efeito
destas nas características físicas e químicas das bebidas. No processo produtivo, a polpa (300, 400 e 500 g) foi
macerada com destilado alcoólico durante 20 dias, sendo posteriormente filtrada e adicionada do xarope (50, 60
e 70 °Brix), envasada em garrafas de polietileno e submetida a um envelhecimento acelerado. Todas as bebidas
resultaram teores alcoólicos (15,25 a 16,69% v/v) e açúcares totais (12,63 a 17,97%) em conformidade com os
padrões exigidos pela legislação. Os experimentos elaborados com a menor concentração de polpa
apresentaram os maiores rendimentos (84,17 e 85,25%). Obtiveram-se modelos de 1ª ordem, com uma
interação e intervalo de confiança de 95%. A polpa constituiu-se no fator mais significativo, influenciando um
maior número de respostas (rendimento, teor alcoólico, resíduo seco, acidez titulável, relação entre acidez
titulável/sólidos solúveis e luminosidade). Os maiores valores de R2 foram encontrados nos modelos ajustados
aos dados de rendimento, resíduo seco, sólidos solúveis totais, acidez titulável e açúcares totais, que foram
significativos e preditivos, apresentando valores superiores a 0,97.
Palavras-chave: Annona muricata L.. Bebida alcoólica.
________________ *Corresponding author 1Received for publication in 05/20/2014; accepted in 11/04/2015.
Part of the work of completion of the specialization course in food science at the Federal University of Pelotas the first author. 2Department of Food Technology, Instituto Federal de Educação, Ciência e Tecnologia do Rio Grande do Norte; Pau dos Ferros, RN,
Brazil; [email protected]. 3Academic Unit of Agricultural Engineering, Universidade Federal de Campina Grande; Campina Grande, PB, Brazil; [email protected], [email protected], [email protected]. 4Academic Unit of Chemical Engineering, Universidade Federal de Pelotas; Pelotas, RS, Brazil; [email protected].
SOURSOP LIQUOR PROCESSING: INFLUENCE OF THE PROCESS VARIABLES ON THE PHYSICAL AND CHEMICAL CHARACTERISTICS
E. N. A. DE OLIVEIRA et al.
Rev. Caatinga, Mossoró, v. 29, n. 1, p. 246 – 256, jan. – mar., 2016 247
INTRODUCTION
The Brazilian northeastern region has
favorable conditions for the cultivation of various
fruitful species. Among these, the soursop tree
(Annona muricata L.) has real economic potential or
exploration potential (OLIVEIRA et al., 2009), due
especially to the production of fruit with a pleasant
taste and aroma, the soursop. Its great acceptability
and proven industrial demand justify its cultivation
and importance of the fruit in the producing areas
(TEIXEIRA et al., 2006). According to Samarão et
al. (2011), in addition to the consumption in natura,
the soursop is used to obtain pulp, juice, nectar,
canned goods and other processed products.
Although the commercial importance in Brazil is
considered of low expression compared to other
fruits, the growing interest from the food industry,
especially the juice industry, makes the soursop
promising for export (SAMARÃO et al., 2011).
Despite the characteristics that make the
soursop a fruit with high market potential, Lima et
al. (2010) reported that the high perishability of
soursop and the short shelf life after harvest have
been responsible for high rates of losses and
difficulties in the supply of traditional and potential
markets for fresh fruit consumption. In this sense, the
processing of the fruit is necessary for the
preparation of various products, including alcoholic
beverages, such as liquor.
According to Teixeira et al. (2007), the
definition of “liquor” varies widely, depending on
the author; however, they all mention the main
elements that make up liquor: a beverage obtained
“by mixing” that contains alcoholic components and
precursors of flavor and sweetness. Brazilian law
defines liquor as a beverage with an alcohol content
of 15 to 54% (v/v) at 20 °C and a percentage of sugar
higher than 30 g/L, prepared with potable ethyl
alcohol of agricultural origin or simple alcoholic
distillate of agricultural origin or alcoholic
beverages, with extracts or substances of vegetable
or animal origin, flavoring and coloring substances
and other additives added (BRASIL, 2009).
The handmade production of liquor is an
interesting alternative for providing increased family
income, for its processing requires simple
technology, with the final product being sold at room
temperature and with extensive shelf life
(TEIXEIRA et al., 2005). The secrets of the quality
of a fruit liquor are in the perfect combination of its
components, especially the raw material (alcohol),
the fruit used and the sugar as well as in the
processes of preparation (infusion) and maturation,
which will result in an integrated product with
harmony between color, aroma and flavor.
According to Oliveira and Santos (2011), the
maceration (infusion) is based on a unit operation,
consisting of removing and/or extracting from a
medium certain substances that are considered active
principles (aromatic compounds, pigments, nutrients,
etc.) by addition of a solvent (alcohol) during a
certain period.
In the specialized literature, a wide range of
studies can be found on fruit processing for the
preparation of liquors, such as those involving
passion fruit (DIAS et al., 2011), acerola
(NOGUEIRA; VENTURINI FILHO, 2005), açaí
(OLIVEIRA; SANTOS, 2011), pineapple (SIMÕES
et al., 2011), banana (TEIXEIRA et al., 2007),
tangerine (VIANA et al., 2011) and camu-camu
(VIERA et al., 2010), among others.
Notwithstanding, research on the use of soursop in
the preparation of this type of drink was not found in
the literature, which makes performing this work as
another soursop processing alternative important.
Based on the foregoing information, the aim
of this study was to prepare soursop liquors by
varying the concentrations of pulp and sucrose syrup
with different total soluble solids (TSS) and to
evaluate the effects of these on the physical and
chemical characteristics of the processed drinks.
MATERIAL AND METHODS
For the preparation of liquors, soursops at full
ripeness from small producers of Campina Grande-
PB (7° 13’ S latitude, 35° 52’ W longitude and
altitude of 552 m), sucrose syrups with different
TSS, prepared by concentrating a simmering solution
of crystal sugar and water, and commercial alcohol
(vodka) with an alcohol content of 39% (v/v) were
used.
The soursops were received at the Laboratory
of Storage and Processing of Agricultural Products
of the Federal University of Campina Grande,
selected for by removal of injured fruits and
sanitized in chlorine solution at a concentration of
200 ppm for 15 minutes. The peeling was manual,
using stainless steel knives, separating the pulp from
the seeds, fibers and bark. An aliquot of the obtained
pulp was subjected to physical and chemical
analyses, and the remainder was bottled in
polyethylene bags and stored at -18 °C until early
processing of the liquors.
The soursop pulp was analyzed in triplicate
regarding the parameters of water content, total
solids, ashes, lipids (Soxhlet), sugars (reducing
sugars in glucose, non-reducing sugars in sucrose
and total sugars in glucose), pH, TSS and total
titratable acidity (TTA) in citric acid according to
methodologies of the Adolfo Lutz Institute (2008);
density at 20 °C, proteins (micro Kjeldahl) and total
carbohydrates (by difference) according to the
recommendations of the AOAC (2010); calorific
value according to the Ministry of Health (BRASIL,
2005); ascorbic acid by the Tillmans method
(AOAC, 1997), modified by Benassi and Antunes
(1998); TSS/TTA ratio according to the Ministry of
SOURSOP LIQUOR PROCESSING: INFLUENCE OF THE PROCESS VARIABLES ON THE PHYSICAL AND CHEMICAL CHARACTERISTICS
E. N. A. DE OLIVEIRA et al.
Rev. Caatinga, Mossoró, v. 29, n. 1, p. 246 – 256, jan. – mar., 2016 248
Agriculture, Livestock and Supply (BRASIL, 1986);
water activity using an AQUA-LAB hygrometer,
model CX-2, Decagon Devices; and color in a
portable Hunter Lab Mini Scan XE Plus
spectrophotometer, model 4500 L, obtaining the
parameters L*, a* and b*, where L* sets the
luminosity (L* = 0 - black and L* = 100 - white) and
a* and b* are responsible for the chromaticity (+a*
red and -a* green; +b* yellow and -b* blue).
The soursop liquors were processed by a 22
factorial experimental design method, with three
experiments in the central point, resulting in a design
matrix with seven experiments (Table 1). The
objective was to evaluate the influence of the
independent variables (concentrations of pulp and
sucrose syrup with different contents of TSS) on the
response variables (physical and chemical analyses)
as well as their interactions.
In the production process of the liquors, the
pulp was previously defrosted in a refrigerator
(~4 °C) and macerated in cold vodka for 20 days,
according to recommendations of Carvalho (2007),
on previously sterilized glass containers. For the
maceration, the pulp proportions itemized in Table 1
and 500 mL of commercial alcohol for each
experiment were used.
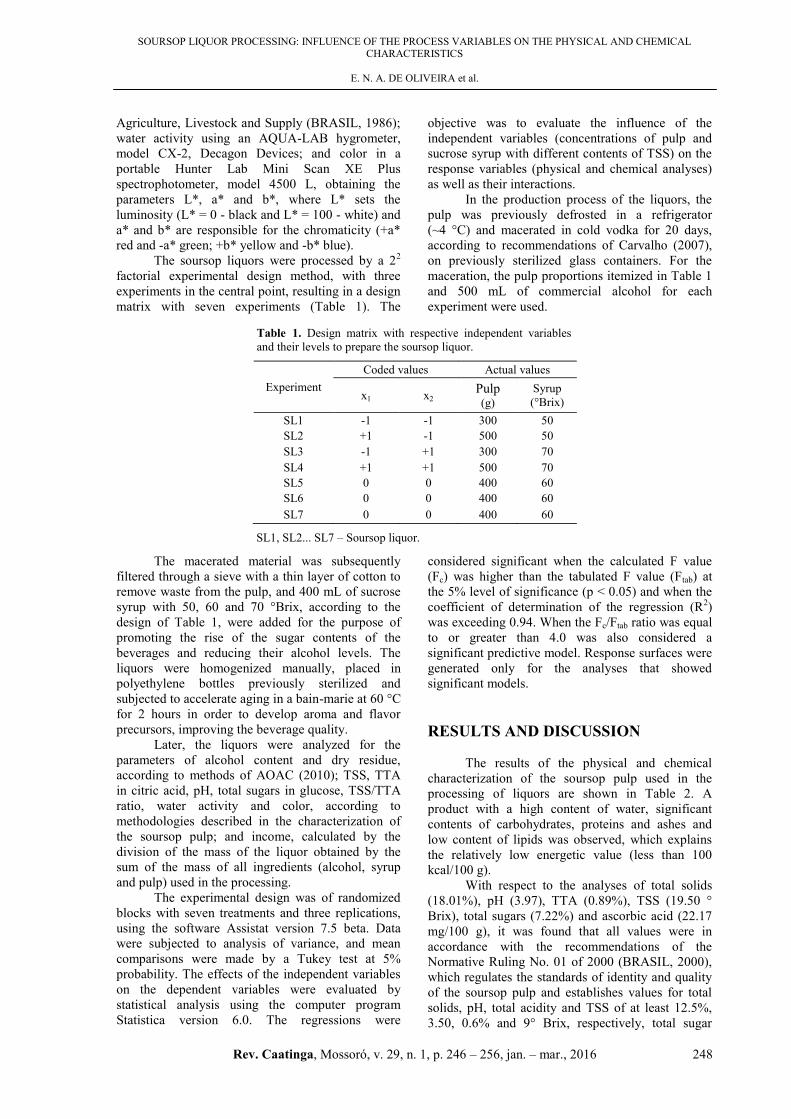
Table 1. Design matrix with respective independent variables
and their levels to prepare the soursop liquor.
Experiment
Coded values Actual values
x1 x2 Pulp
(g)
Syrup
(°Brix)
SL1 -1 -1 300 50
SL2 +1 -1 500 50
SL3 -1 +1 300 70
SL4 +1 +1 500 70
SL5 0 0 400 60
SL6 0 0 400 60
SL7 0 0 400 60
1 SL1, SL2... SL7 – Soursop liquor.
The macerated material was subsequently
filtered through a sieve with a thin layer of cotton to
remove waste from the pulp, and 400 mL of sucrose
syrup with 50, 60 and 70 °Brix, according to the
design of Table 1, were added for the purpose of
promoting the rise of the sugar contents of the
beverages and reducing their alcohol levels. The
liquors were homogenized manually, placed in
polyethylene bottles previously sterilized and
subjected to accelerate aging in a bain-marie at 60 °C
for 2 hours in order to develop aroma and flavor
precursors, improving the beverage quality.
Later, the liquors were analyzed for the
parameters of alcohol content and dry residue,
according to methods of AOAC (2010); TSS, TTA
in citric acid, pH, total sugars in glucose, TSS/TTA
ratio, water activity and color, according to
methodologies described in the characterization of
the soursop pulp; and income, calculated by the
division of the mass of the liquor obtained by the
sum of the mass of all ingredients (alcohol, syrup
and pulp) used in the processing.
The experimental design was of randomized
blocks with seven treatments and three replications,
using the software Assistat version 7.5 beta. Data
were subjected to analysis of variance, and mean
comparisons were made by a Tukey test at 5%
probability. The effects of the independent variables
on the dependent variables were evaluated by
statistical analysis using the computer program
Statistica version 6.0. The regressions were
considered significant when the calculated F value
(Fc) was higher than the tabulated F value (Ftab) at
the 5% level of significance (p < 0.05) and when the
coefficient of determination of the regression (R2)
was exceeding 0.94. When the Fc/Ftab ratio was equal
to or greater than 4.0 was also considered a
significant predictive model. Response surfaces were
generated only for the analyses that showed
significant models.
RESULTS AND DISCUSSION
The results of the physical and chemical
characterization of the soursop pulp used in the
processing of liquors are shown in Table 2. A
product with a high content of water, significant
contents of carbohydrates, proteins and ashes and
low content of lipids was observed, which explains
the relatively low energetic value (less than 100
kcal/100 g).
With respect to the analyses of total solids
(18.01%), pH (3.97), TTA (0.89%), TSS (19.50 °
Brix), total sugars (7.22%) and ascorbic acid (22.17
mg/100 g), it was found that all values were in
accordance with the recommendations of the
Normative Ruling No. 01 of 2000 (BRASIL, 2000),
which regulates the standards of identity and quality
of the soursop pulp and establishes values for total
solids, pH, total acidity and TSS of at least 12.5%,
3.50, 0.6% and 9° Brix, respectively, total sugar

SOURSOP LIQUOR PROCESSING: INFLUENCE OF THE PROCESS VARIABLES ON THE PHYSICAL AND CHEMICAL CHARACTERISTICS
E. N. A. DE OLIVEIRA et al.
Rev. Caatinga, Mossoró, v. 29, n. 1, p. 246 – 256, jan. – mar., 2016 249
between 6.5 and 17% and ascorbic acid values of at
least 10 mg/100 g. Canuto et al. (2010),
characterizing soursop from the country’s northern
region, also reported compliance of values obtained
with respect to the current legislation.
Table 2. Physical and chemical composition of the soursop pulp.
Parameter Mean value Parameter Mean value
Water content (%) 81.99 0.16 TSS/TTA ratio 21.98 0.51
Total solids (%) 18.01 0.16 Reducing sugars (%) 6.74 0.08
Ashes (%) 0.66 0.04 Non-reducing sugars (%) 0.46 0.06
Proteins (%) 1.31 0.06 Total sugars (%) 7.22 0.14
Lipids (%) 0.01 0.00 Ascorbic acid (mg/100 g) 22.17 0.09
Total carbohydrates (%) 16.12 0.34 Density at 20 °C (g/cm3) 1.1370 0.03
Calorific value (kcal/100 g) 69.80 1.25 Water activity (aw) 0.986 0.00
pH 3.97 0.05 Luminosity (L*) 63.59 0.08
Total titratable acidity (%) 0.89 0.02 Green intensity (-a*) -2.33 0.13
Total soluble solids (°Brix) 19.50 0.00 Yellow intensity (+b*) 12.49 0.24
1 TSS - Total soluble solids; TTA - Total titratable acidity in % citric acid.
The TSS/TTA ratio is similar to the value
found by Marcellini et al. (2003) in soursop pulp
(21.12) and higher than that found in other fruits,
such as acerola (MACIEL et al., 2010), caja
(CARVALHO et al., 2011) and passion fruit
(CAVICHIOLI et al., 2008), where a greater sense of
sweetness in soursop was found in relation to these
fruits. Total sugars higher than 7% accumulated
during the soursop ripening, and from that
constituent, the reducing sugars were superior in
comparison to the non-reducing sugars, which can be
explained by the hydrolysis of starch during
maturation.
A water activity greater than 0.98 attests to
the need for hygienic processing of the pulp and
storage in suitable conditions. With respect to the
color parameters, the pulp showed to be clear (L*),
with a slight yellowish tint (+b*), which may have
been influenced by high enzyme activity, and traces
of slightly deep green (-a*). Canuto et al. (2010)
found L* values of 56.00, and Pereira et al. (2006)
reported similar characteristics for color of the
soursop pulp, with L* between 45.82 and 68.14, a*
between 0.17 and 15.47 and b* between 10.54 and
14.77.
In Tables 3 and 4, the average values of the
physical and chemical analyses of the soursop
liquors are shown. It was observed that all
parameters analyzed showed significant effects at
1% probability by F tests, indicating that the syrups
with different levels of TSS and the pulp
concentrations used affected the physical and
chemical characteristics of the drinks.
Table 3. Average values of the physical and chemical characterization of the soursop liquors.
EXP
Response
I (%) AC (%v/v) DR (%) TTS (ºBrix) TTA
(%) pH aw
Relation
TTS / TTA
TS
(%)
SL1 84,17 16,69a 27,56b 29,10e 0,20d 3,90a 0,986a 147,81b 12,79c
SL2 79,64 15,03b 28,02b 29,40e 0,25b 3,75b 0,984ab 118,44d 12,63c
SL3 85,25 16,05ab 36,48a 39,00a 0,20d 3,85a 0,975bc 196,52a 17,97a
SL4 79,29 15,25b 33,40a 38,00b 0,28a 3,74b 0,970c 138,13c 17,61a
SL5 81,38 15,65ab 31,71ab 34,10c 0,24c 3,85a 0,981ab 143,51bc 15,47b
SL6 81,54 15,55ab 31,74ab 33,75cd 0,24c 3,79b 0,983ab 138,50c 15,55b
SL7 81,69 15,50b 31,37ab 33,30d 0,24c 3,78b 0,982ab 139,23c 15,56b
OA 81,85 15,67 31,47 33,81 0,23 3,81 0,980 146,02 15,37
SMD - 1,17 5,14 0,47 0,01 0,06 0,009 6,74 0,61
CV(%) - 2,67 5,85 0,50 1,24 0,54 0,33 1,66 1,42
Fcal. - 5,13** 8,27** 1494,58** 277,45** 24,87** 9,032** 298,19** 273,93**
1 EXP - Experiment; SL1...SL7 - Soursop liquor; I - Income; AC - Alcohol content; DR - dry residue; TSS - total soluble
solids; TTA - Total titratable acidity in citric acid; aw - Water activity; TS - Total sugars; Means followed by the same letter
in the column do not differ statistically at 5% probability by the Tukey test; OA - Overall average; SMD - Significant mean
deviation; CV - Coefficient of variation; Fcal. - calculated F; ** - Significant at 1% probability by the F test.

SOURSOP LIQUOR PROCESSING: INFLUENCE OF THE PROCESS VARIABLES ON THE PHYSICAL AND CHEMICAL CHARACTERISTICS
E. N. A. DE OLIVEIRA et al.
Rev. Caatinga, Mossoró, v. 29, n. 1, p. 246 – 256, jan. – mar., 2016 250
The liquors formulated with the highest pulp
concentrations (SL2 and SL4) had the lowest yields
(79.64 and 79.29%, respectively), followed by the
formulations with intermediate concentrations of
soursop (SL5 to SL7). As these drinks of the largest
pulp concentrations were added, at the end of
filtration, the highest amounts of residue were
yielded, consisting of the fruit fibers, affecting the
final mass balance of liquors and, consequently, the
yield.
All liquors had alcohol contents within the
range established by the Brazilian legislation
(BRASIL, 2009), which determines variation of 15
to 54% (v/v) alcohol. The higher alcohol levels were
obtained in liquors SL1 (16.69% v/v) and SL3
(16.05% v/v), formulated with the lowest
concentration of pulp, which can be associated with
less dilution of the alcohol promoted by minor
addition of soursop. Oliveira and Santos (2011),
studying the achievement and evaluation of açaí
liquor, found an alcohol content (16% v/v) close to
the result of this work, while Dias et al. (2011),
evaluating the physical and chemical characteristics
of yellow passion fruit liquor, obtained a higher
value (21% v/v).
The dry residue was between 27.56% (SL1)
and 36.48% (SL3), being lower than the values
obtained by Viana et al. (2011), who were
developing and characterizing tangerine peel liquors
with different alcoholic bases (42.71 to 46.53%). It
was observed that the soursop liquors formulated
with the lowest (SL1 and SL2) and highest (SL3 and
SL4) syrup TSS contents were statistically different
(p < 0.05), yet the former beverages, formulated with
syrup at 70 °Brix, had the highest dry residues (36.48
and 33.40%). This probably can be related to the
interference of sucrose. Since sucrose was present as
a solid, it dissolved in greater proportion in this
syrup, which affected the amount of solids (residue)
obtained after the alcohol evaporation.
As expected, the different TSS contents of the
syrups affected the TSS content of the drinks, where
the liquors processed with syrup at 50 °Brix were the
only ones to exhibit values below 30 °Brix. In
absolute values, the TSS ranged from 29.10 °Brix
(SL1) to 39 °Brix (SL3), similar to the values
reported by Barros et al. (2008) and Viera et al.
(2010) when characterizing liquors of milk (27 °
Brix) and camu-camu (33 °Brix), respectively.
The beverages formulated with the lowest
concentrations of pulp (SL1 and SL3) showed the
lowest values for TTA (0.20 and 0.20%). In contrast,
the formulations with the highest concentrations of
pulp (SL2 and SL4) had the highest values for this
parameter (0.25 and 0.28%). During maceration, in
addition to the drag of substances responsible for
sensory characteristics, such as pigments and volatile
compounds, there is also the solubility in the alcohol
of chemical components from the pulp, such as
sugars and organic acids. This justifies the higher
acidity values in the formulations with higher
proportions of soursop pulp. In the study by Teixeira
et al. (2005), lower TTA levels in banana liquors
(0.06 to 0.11%) was evidenced, due to the feature of
less acidity of the pulp used in the processing
compared to the pulp of soursop.
The pH values ranged between 3.74 (SL4)
and 3.90 (SL1), being mainly affected by the pulp
proportions. It was found that the liquors processed
with 500 g of soursop (Table 1) showed a stronger
acidic pH, which is related to higher extraction of
organic acids in maceration. As the acidity and the
pH are inversely proportional magnitudes, this
increased extraction led to the achievement of lower
pH values at the end of maceration. Franco and
Landgraf (2005) reported that low pH values are
important because they are a limiting factor for the
growth of pathogenic and spoilage bacteria, in
addition to favoring the stability of some
constituents, such as ascorbic acid, as this vitamin
has greater stability in acidic pH. Simões et al.
(2011) found in pineapple liquor a higher pH (4.45)
to that found for the soursop liquors in this research.
Yet, Oliveira and Santos (2011) reported a similar
pH in açaí liquor (3.52).
The water activity showed to be lower than
0.98 only in beverages processed with syrup with the
highest TSS content (SL3 and SL4), due to the
ability of sucrose to form strong bonds with the free
water, thereby not preventing its use by
microorganisms. Despite these values, there is need
for efficient thermal treatment application in all
beverages to ensure better microbiological stability
during marketing, such as the unwanted conversion
of ethyl alcohol into acetic acid.
The TSS/TTA ratio ranged from 118.44
(SL2) to 196.52 (SL3). Similar values of the TSS/
TTA ratio were found by Barros et al. (2008)
studying milk liquors (192.86). The high values for
this relationship were expected, since the drinks
exhibited high levels of TSS at the end of processing
and low levels of TTA. Knowing that the TSS/TTA
ratio is an important indicator of taste, as it relates
the dissolved solids such as sugars and acids present
in the product, it was found that the SL3 formulation
appeared to be perceptibly sweeter, due mainly to
lower values of TTA provided by the minor addition
of pulp and higher concentration of sugars of the
syrup used (70 °Brix).
The different TSS of the sucrose syrups used
in the liquor formulations also influenced the total
sugar values (Table 3), in that the beverages made
with syrup with higher TSS contents (SL3 and SL4)
showed the highest levels of total sugars, followed
by drinks with intermediate syrup TSS (SL5 to SL7).
The total sugar content of soursop liquors ranged
from 12.63 to 17.97%, in accordance with the
standards specified by the Brazilian legislation
(BRASIL, 2009), which specifies a minimum total
sugar content of 3% (30 g/L) for that drink.
SOURSOP LIQUOR PROCESSING: INFLUENCE OF THE PROCESS VARIABLES ON THE PHYSICAL AND CHEMICAL CHARACTERISTICS
E. N. A. DE OLIVEIRA et al.
Rev. Caatinga, Mossoró, v. 29, n. 1, p. 246 – 256, jan. – mar., 2016 251
Total sugars did not differ among themselves
(p < 0.05) for the formulations prepared with the
same contents of TSS of syrups, according to the
statistical test applied. Nogueira and Venturini Filho
(2005) when studying acerola liquors found values
between 30.03 and 32.05%, and Dias et al. (2011)
published an average value of 26.42% of total sugars
in liquor from cuts of the yellow passion fruit.
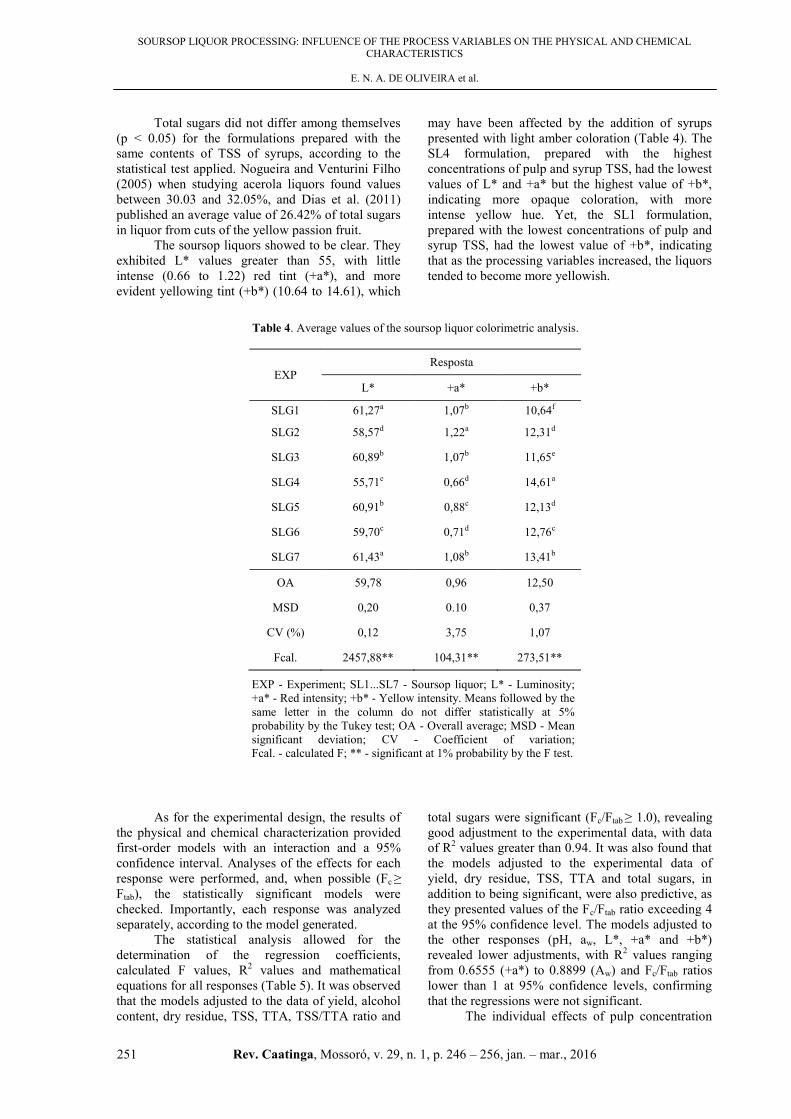
The soursop liquors showed to be clear. They
exhibited L* values greater than 55, with little
intense (0.66 to 1.22) red tint (+a*), and more
evident yellowing tint (+b*) (10.64 to 14.61), which
may have been affected by the addition of syrups
presented with light amber coloration (Table 4). The
SL4 formulation, prepared with the highest
concentrations of pulp and syrup TSS, had the lowest
values of L* and +a* but the highest value of +b*,
indicating more opaque coloration, with more
intense yellow hue. Yet, the SL1 formulation,
prepared with the lowest concentrations of pulp and
syrup TSS, had the lowest value of +b*, indicating
that as the processing variables increased, the liquors
tended to become more yellowish.
Table 4. Average values of the soursop liquor colorimetric analysis.
EXP Resposta
L* +a* +b*
SLG1 61,27a 1,07b 10,64f
SLG2 58,57d 1,22a 12,31d
SLG3 60,89b 1,07b 11,65e
SLG4 55,71e 0,66d 14,61a
SLG5 60,91b 0,88c 12,13d
SLG6 59,70c 0,71d 12,76c
SLG7 61,43a 1,08b 13,41b
OA 59,78 0,96 12,50
MSD 0,20 0.10 0,37
CV (%) 0,12 3,75 1,07
Fcal. 2457,88** 104,31** 273,51**
1 EXP - Experiment; SL1...SL7 - Soursop liquor; L* - Luminosity;
+a* - Red intensity; +b* - Yellow intensity. Means followed by the
same letter in the column do not differ statistically at 5%
probability by the Tukey test; OA - Overall average; MSD - Mean
significant deviation; CV - Coefficient of variation;
Fcal. - calculated F; ** - significant at 1% probability by the F test.
As for the experimental design, the results of
the physical and chemical characterization provided
first-order models with an interaction and a 95%
confidence interval. Analyses of the effects for each
response were performed, and, when possible (Fc ≥
Ftab), the statistically significant models were
checked. Importantly, each response was analyzed
separately, according to the model generated.
The statistical analysis allowed for the
determination of the regression coefficients,
calculated F values, R2 values and mathematical
equations for all responses (Table 5). It was observed
that the models adjusted to the data of yield, alcohol
content, dry residue, TSS, TTA, TSS/TTA ratio and
total sugars were significant (Fc/Ftab ≥ 1.0), revealing
good adjustment to the experimental data, with data
of R2 values greater than 0.94. It was also found that
the models adjusted to the experimental data of
yield, dry residue, TSS, TTA and total sugars, in
addition to being significant, were also predictive, as
they presented values of the Fc/Ftab ratio exceeding 4
at the 95% confidence level. The models adjusted to
the other responses (pH, aw, L*, +a* and +b*)
revealed lower adjustments, with R2 values ranging
from 0.6555 (+a*) to 0.8899 (Aw) and Fc/Ftab ratios
lower than 1 at 95% confidence levels, confirming
that the regressions were not significant.
The individual effects of pulp concentration

SOURSOP LIQUOR PROCESSING: INFLUENCE OF THE PROCESS VARIABLES ON THE PHYSICAL AND CHEMICAL CHARACTERISTICS
E. N. A. DE OLIVEIRA et al.
Rev. Caatinga, Mossoró, v. 29, n. 1, p. 246 – 256, jan. – mar., 2016 252
and syrup TSS content, as the effects of the
interaction thereof on the response variables, are
shown via the Pareto diagram (Figure 1). In each
diagram, the factors showing the strongest influence
for each response were verified.
The pulp concentration showed significant
effects on income, alcohol content, dry residue,
TTA, TSS/TTA ratio and luminosity. The pulp
concentration is onsidered the most significant effect
when compared with the TSS content of the syrup
that, in turn, had significant effects on the dry
residue content, the final TSS of the liquor, the aw,
the TSS/TTA ratio and the total sugars. It was also
found that the interaction between the concentration
of pulp and the TSS content of the syrup showed
significant effects only on the income, alcohol
content, dry residue and TSS/TTA ratio.
Table 5. Results of the regression analyses to data from the physical and chemical characterization of soursop liquors at
the 95% confidence interval.
Response R2 Fc Ftab Fc/Ftab Equation
I 0,9802 49,55 9,28 5,34 82,66643 - 0,00477P + 0,16125TSS - 0,00036 P/TSS
AC 0,9601 24,04 9,28 2,59 23,92429 - 0,01905P - 0,0965TSS + 0,00022P/TSS
DR 0,9967 303,23 9,28 32,68 -8,60143 + 0,04655P + 0,7115TSS - 0,00088P/TSS
TSS 0,9958 236,14 9,28 25,45 -1,04286 + 0,01775P + 0,5925TSS - 0,00033P/TSS
pH 0,8631 6,31 9,28 0,68 4,398571 - 0,00125P - 0,0055TSS + 0,00001P/TSS
aw 0,8899 8,08 9,28 0,87 1,003907 + 0,000033P - 0,000268TSS - 0,000001P/TSS
TTA 0,9798 48,48 9,28 5,22 0,240714 - 0,000125P - 0,00225TSS + 0,000007P/TSS
Relation
TSS/TTA 0,9484 18,40 9,28 1,98 -42,94 + 0,2159P + 4,612TSS - 0,0073P/SST
TS 0,9948 190,20 9,28 20,50 - 0,551429 + 0,0017P + 0,274TSS - 0,00005P/TSS
L* 0,7724 3,39 9,28 0,37 57,64286 + 0,0175P + 0,167TSS - 0,00062P/TSS
+a* 0,6555 1,90 9,28 0,21 - 1,30429 + 0,00775 P + 0,042TSS - 0,00014 P/TSS
+b* 0,8775 7,16 9,28 0,77 10,64643 - 0,00778P - 0,04625TSS + 0,00032P/TSS
1 R2 - Coefficient of determination; Fc - calculated F; Ftab - tabulated F; I - Income; AC - Alcohol content; DR - Dry
residue; TSS - Total soluble solids; aw - Water activity; TTA - Total titratable acidity in citric acid; TS - Total sugars;
L* - Luminosity; +a* - Red intensity; +b* - Yellow intensity; P – Pulp; TSS - Total soluble solids in the sucrose syrup
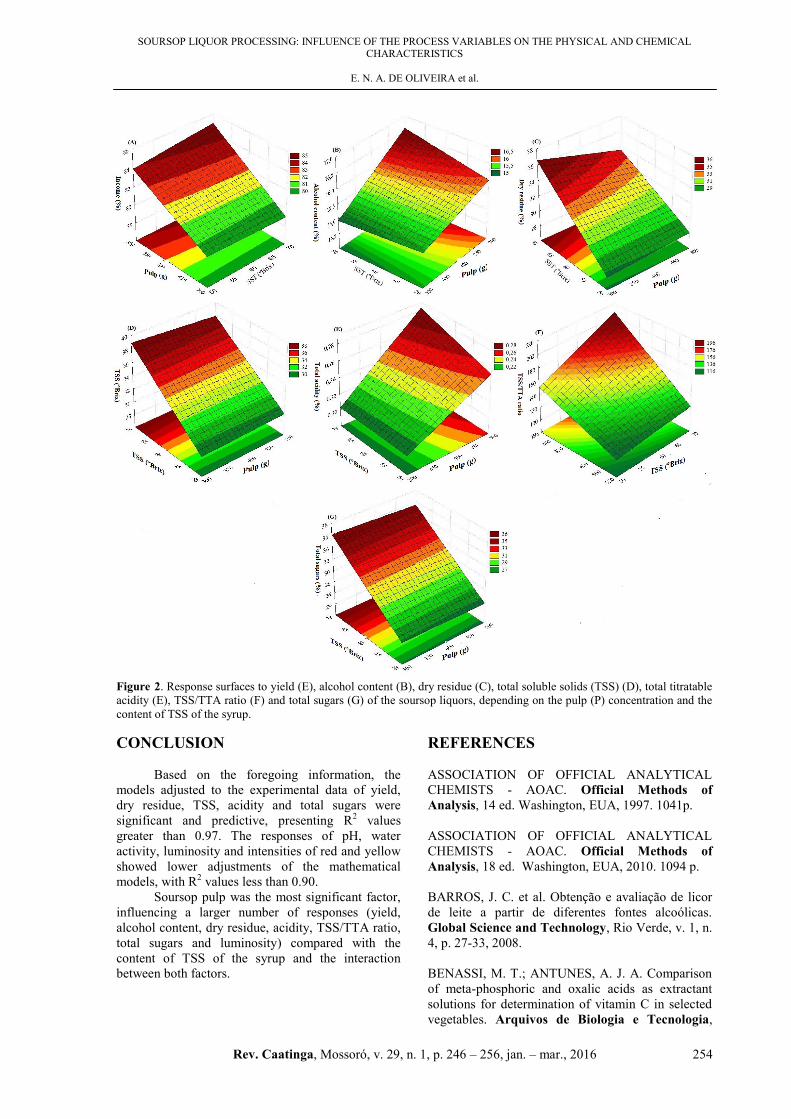
Figure 2 presents the response surfaces of the
parameters that showed significant models (Fc/Ftab ³
1.0). It was found that with the increase in the TSS
of the syrup, there were higher values of dry residue,
total sugars and TSS contents of liquors. Yet, with
increasing concentration of pulp, there were higher
TTA values. It was observed that with the increase of
syrup TSS content and the reduction in the
concentration of pulp, the highest values were in
relation to income and the TSS/TTA ratio. As for the
alcohol content, the highest values were found with
the reduction both of the pulp concentration and of
the syrup TSS content, since they promoted alcohol
dilution.

SOURSOP LIQUOR PROCESSING: INFLUENCE OF THE PROCESS VARIABLES ON THE PHYSICAL AND CHEMICAL CHARACTERISTICS
E. N. A. DE OLIVEIRA et al.
Rev. Caatinga, Mossoró, v. 29, n. 1, p. 246 – 256, jan. – mar., 2016 253
Figure 1. Pareto diagram for the influence of the factors of pulp (P), total soluble solids (TSS) of the syrup and their
interaction (P/TSS) on the income (A), alcohol content (B), dry residue (C), TSS (D), pH (E), water activity (F), total
titratable acidity (G), TSS/total titratable acidity ratio (H), total sugars (I), luminosity (J), red intensity (K) and yellow
intensity (L) of the soursop liquors.
SOURSOP LIQUOR PROCESSING: INFLUENCE OF THE PROCESS VARIABLES ON THE PHYSICAL AND CHEMICAL CHARACTERISTICS
E. N. A. DE OLIVEIRA et al.
Rev. Caatinga, Mossoró, v. 29, n. 1, p. 246 – 256, jan. – mar., 2016 254
Figure 2. Response surfaces to yield (E), alcohol content (B), dry residue (C), total soluble solids (TSS) (D), total titratable
acidity (E), TSS/TTA ratio (F) and total sugars (G) of the soursop liquors, depending on the pulp (P) concentration and the
content of TSS of the syrup.
CONCLUSION
Based on the foregoing information, the
models adjusted to the experimental data of yield,
dry residue, TSS, acidity and total sugars were
significant and predictive, presenting R2 values
greater than 0.97. The responses of pH, water
activity, luminosity and intensities of red and yellow
showed lower adjustments of the mathematical
models, with R2 values less than 0.90.
Soursop pulp was the most significant factor,
influencing a larger number of responses (yield,
alcohol content, dry residue, acidity, TSS/TTA ratio,
total sugars and luminosity) compared with the
content of TSS of the syrup and the interaction
between both factors.
REFERENCES
ASSOCIATION OF OFFICIAL ANALYTICAL
CHEMISTS - AOAC. Official Methods of
Analysis, 14 ed. Washington, EUA, 1997. 1041p.
ASSOCIATION OF OFFICIAL ANALYTICAL
CHEMISTS - AOAC. Official Methods of
Analysis, 18 ed. Washington, EUA, 2010. 1094 p.
BARROS, J. C. et al. Obtenção e avaliação de licor
de leite a partir de diferentes fontes alcoólicas.
Global Science and Technology, Rio Verde, v. 1, n.
4, p. 27-33, 2008.
BENASSI, M. T.; ANTUNES, A. J. A. Comparison
of meta-phosphoric and oxalic acids as extractant
solutions for determination of vitamin C in selected
vegetables. Arquivos de Biologia e Tecnologia,
SOURSOP LIQUOR PROCESSING: INFLUENCE OF THE PROCESS VARIABLES ON THE PHYSICAL AND CHEMICAL CHARACTERISTICS
E. N. A. DE OLIVEIRA et al.
Rev. Caatinga, Mossoró, v. 29, n. 1, p. 246 – 256, jan. – mar., 2016 255
Curitiba, v. 31, n. 4, p. 507-503, 1998.
BRASIL. Ministério da Agricultura Pecuária e
Abastecimento. Portaria n° 76, de 27 de novembro
1986. Diário Oficial [da] Republica Federativa do
Brasil, Brasília-DF, 03-12-86. Seção I, p. 18.152-
18173, 1986.
BRASIL. Ministério da Agricultura, pecuária e
Abastecimento. Instrução Normativa nº 01, de 7 de
Janeiro de 2000. Regulamento da Lei nº 8.918, de 14
julho de 1994, aprovado pelo Decreto nº 2.314, de 4
de setembro de 1997, que dispõe sobre o
regulamento técnico geral para fixação dos padrões
de identidade e qualidade para polpa de fruta. Diário
Oficial [da] Republica Federativa do Brasil.
Brasília, DF, 07 de Janeiro de 2000.
BRASIL. Ministério da Saúde. Agência Nacional de
Vigilância Sanitária-ANVISA. Rotulagem
nutricional obrigatória: manual de orientação às
indústrias de Alimentos. 2a Versão. Universidade de
Brasília, Brasília, DF, 2005.
BRASIL. Ministério da Agricultura, Pecuária e
Abastecimento. Decreto n 6.871, de 4 de Julho de
2009. Dispõe sobre a padronização, a classificação, o
registro, a inspeção, a produção e a fiscalização de
bebidas. Diário Oficial [da] Republica Federativa
do Brasil. Brasília, DF, 05 de jun. 2009.
CANUTO, G. A. B. et al. Caracterização físico-
química de polpas de frutas da amazônia e sua
correlação com a atividade anti-radical livre. Revista
Brasileira de Fruticultura, Jaboticabal, v. 32, n. 4,
p. 1196-1205, 2010.
CARVALHO, R. F. Produção de licores. 1 ed.
Dossiê técnico. Rede de Tecnologia da Bahia,
Salvador, BA, 2007. 27 p.
CARVALHO, A. V. et al. Características físicas,
químicas e atividade antioxidante de frutos de
matrizes de cajazeira no estado do Pará. Alimentos e
Nutrição, Araraquara, v. 22, n. 1, p. 45-53, 2011.
CAVICHIOLI, J. C.; RUGGIERO, C.; VOLPE, C.
A. Caracterização físico-química de frutos de
maracujazeiro-amarelo submetidos à iluminação
artificial, irrigação e sombreamento. Revista
Brasileira de Fruticultura, Jaboticabal, v. 30, n. 3,
p. 649-656, 2008.
DIAS, S. C. et al. Caracterização físico-química e
sensorial do licor de corte do maracujá amarelo.
Enciclopédia Biosfera, Goiânia, v. 7, n. 13, p. 1405-
1412, 2011.
FRANCO, B. D. G.M.; LANDGRAF, M.
Microbiologia dos alimentos. 1 ed. São Paulo, SP,
2005. 196 p.
INSTITUTO ADOLFO LUTZ - IAL. Normas
analíticas, métodos químicos e físicos para
análises de alimentos. 4 ed., 1 ed. digital, São
Paulo, SP, 2008. 1020 p.
LIMA, M. A. C.; ALVES, R. E.; FILGUEIRAS, H.
A. C. Comportamento respiratório e amaciamento de
graviola (Annona muricata L.) após tratamentos pós-
colheita com cera e 1-metilciclopropeno. Ciência e
Agrotecnologia, Lavras, v. 34, n. 1, p. 155-162,
2010.
MACIEL, M. I. S. et al. Caracterização físico-
química de frutos de genótipos de aceroleira
(Malpighia emarginata D.C.). Ciência e Tecnologia
de Alimentos, Campinas, v. 30, n. 4, p. 865-869,
2010.
MARCELLINI, P. S. et al. Comparação físico-
química e sensorial da atemóia com a pinha e a
graviola produzidas e comercializadas no estado de
Sergipe. Alimentos e Nutrição, Araraquara, v. 14, n.
2, p. 187-189, 2003.
NOGUEIRA, A. M. P.; VENTURINI FILHO, W. G.
Ultra e microfiltração de licor de acerola. Brazilian
Journal of Food Technology, Campinas, v. 8, n. 4,
p. 305-311, 2005.
OLIVEIRA, L. C. et al. Efeito de diferentes
substratos na germinação de sementes e formação
inicial de plântulas de graviola. Revista Verde de
Agroecologia e Desenvolvimento Sustentável,
Mossoró, v. 4, n. 1, p. 90-97, 2009.
OLIVEIRA, E. N. A.; SANTOS, D. C.
Processamento e avaliação da qualidade de licor de
açaí (Euterpe oleracea Mart.). Revista do Instituto
Adolfo Lutz, São Paulo, v. 70, n. 4, p. 534-41, 2011.
PEREIRA, J. M. A. T. K. et al. Avaliação da
Qualidade físico-química, microbiológica e
microscópica de polpas de frutas congeladas
comercializadas na cidade de Viçosa-MG.
Alimentos e Nutrição, Araraquara, v. 17, n. 4, p.
437-442, 2006.
SAMARÃO, S. S. et al. Desempenho de mudas de
gravioleira inoculadas com fungos micorrízicos
arbusculares em solo não-esterilizado, com
diferentes doses de fósforo. Acta Scientiarum.
Agronomy, Maringá, v. 33, n. 1, p. 81-88, 2011.
SIMÕES, L. S. et al. Estudo da cinética de extração
alcoólica do processamento do licor de abacaxi.
Enciclopédia Biosfera, Goiânia, v. 7, n. 13, p. 717-
726, 2011.
SOURSOP LIQUOR PROCESSING: INFLUENCE OF THE PROCESS VARIABLES ON THE PHYSICAL AND CHEMICAL CHARACTERISTICS
E. N. A. DE OLIVEIRA et al.
Rev. Caatinga, Mossoró, v. 29, n. 1, p. 246 – 256, jan. – mar., 2016 256
TEIXEIRA, L. J. Q. et al. Avaliação tecnológica da
extração alcoólica no processamento de licor de
banana. Boletim do Centro de Pesquisa e
Processamento de Alimentos, Curitiba, v. 23, n. 2,
p. 329-346, 2005.
TEIXEIRA, C. K. B.; NEVES, E. C. A.; PENA, R.
S. Estudo da pasteurização da polpa de graviola.
Alimentos e Nutrição, Araraquara, v. 17, n. 3, p.
251-257, 2006.
TEIXEIRA, L. J. Q. et al. Testes de aceitabilidade do
licores de banana. Revista Brasileira de
Agrociência, Pelotas, v. 13, n. 2, p. 205-209, 2007.
VIANA, L. F. et al. Development and
characterization of the tangerine peel liquor with
different alcoholic bases. Acta Scientiarum.
Technology, Maringá, v. 33, n. 1, p. 95-100, 2011.
VIERA, V. B. et al. Produção, caracterização e
aceitabilidade de licor de camu-camu (Myrciaria
dúbia (H.B.K.) McVaugh). Alimentos e Nutrição,
Araraquara, v. 21, n. 4, p. 519-522, 2010.


![Aai t a Aromat ant Medicinal Aromatic Plants · Medicinal Aromatic Plants ... Soursop fruit; Health benefits; Soursop tree; ... roots and leaves [3] (Degnon et al.). The soursop fruit](https://static.cupdf.com/doc/110x72/5ac5995e7f8b9a12608da917/aai-t-a-aromat-ant-medicinal-aromatic-plants-aromatic-plants-soursop-fruit.jpg)