Slide 1
Technical efficiency in Danish trout farms: Taking pollution into account
Implication for future growth and regulation
Rasmus NielsenEnvironmental and Natural Resource Economics unitInstitute of Food and Resource EconomicsUniversity of Copenhagen

Slide 2
Outline of presentation
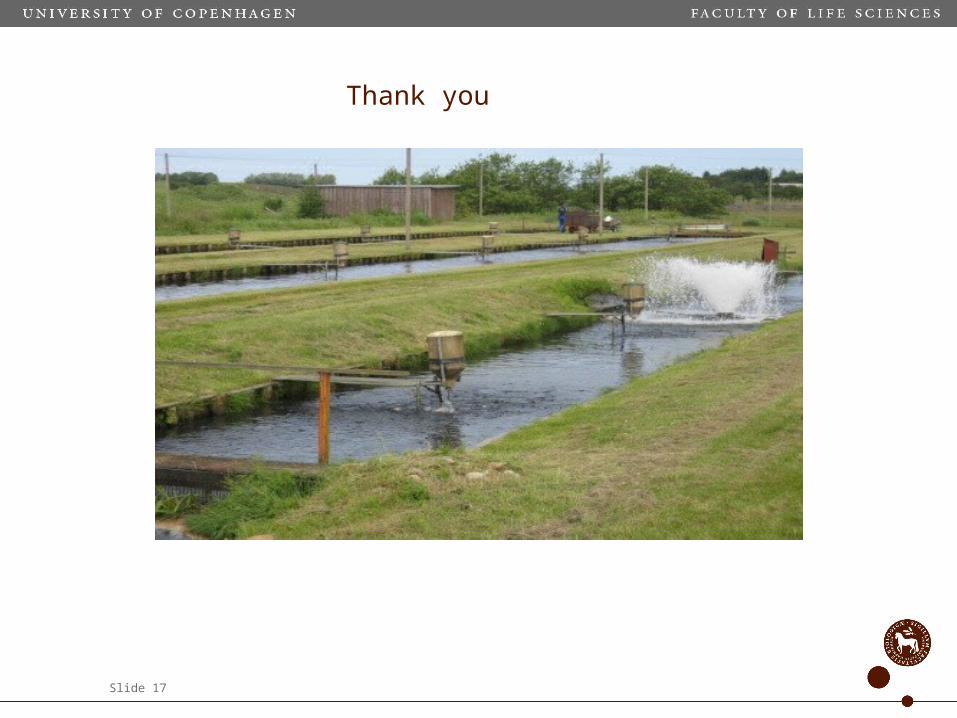
This is a study on fresh water trout production in Denmark
Technical efficiency is estimated using Data Envelopment Analysis (DEA), where pollution of nitrogen (N) and phosphorus (P) is included as an input.
A Tobit regression model is used as a second step, testing if the use of different water purification system an the size of the farms influence on technical efficiency
Policy implication: Is it possible to have sustainable growth?
Slide 3
European plans to support growth
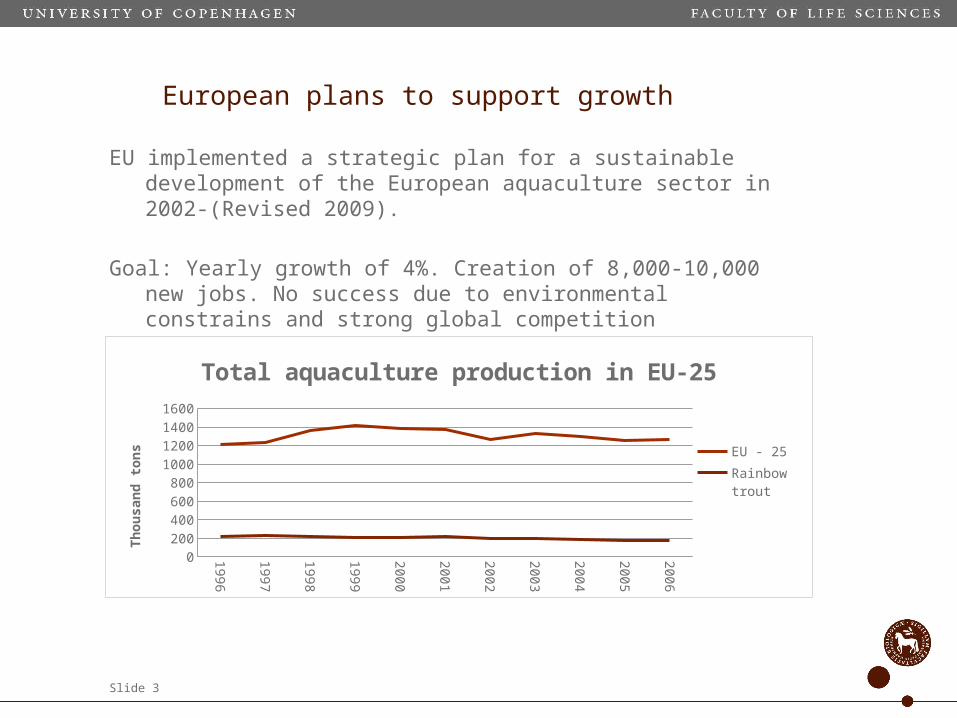
EU implemented a strategic plan for a sustainable development of the European aquaculture sector in 2002-(Revised 2009).
Goal: Yearly growth of 4%. Creation of 8,000-10,000 new jobs. No success due to environmental constrains and strong global competition
1996
1997
1998
1999
2000
2001
2002
2003
2004
2005
2006
0
200
400
600
800
1000
1200
1400
1600
Total aquaculture production in EU-25
EU - 25
Rainbow trout
Thousand t
ons

Slide 4
Danish plans to support growth
Danish strategy 2007 – 2015:• Raise production from 30,000 to 60,000 tons.• Support environmental friendly production.• Growth should be sustainable – A decrease in the existing
level of pollution per kilo of produced fish
To reach the combined goal of growth and a sustainable production, two new water purification systems, a semi-intensive and an intensive, was introduced to Danish trout farming in 2005/2006.
The most intensive water purification systems reduce pollution from nitrogen (30%), phosphor (60%), and organic material (90%).
Slide 5
Data
Data are available for 2007 (146 farms) and 2008 (146 farms). Only farms producing rainbow trout for consumption are selected.
The selected sample accounts for approximately 50% of the Danish production in value and 10% of EU production of fresh water trout
Data for the DEA model and Tobit regression1 Output: Total value of production of fish.
5 Inputs: Total cost of Fish & Feed, Labour, and Capital, and total volume of Nitrogen and Phosphorus
Categorical variables are: 3 types of - “Water purification systems” and 4 - “Size classes”
Slide 6
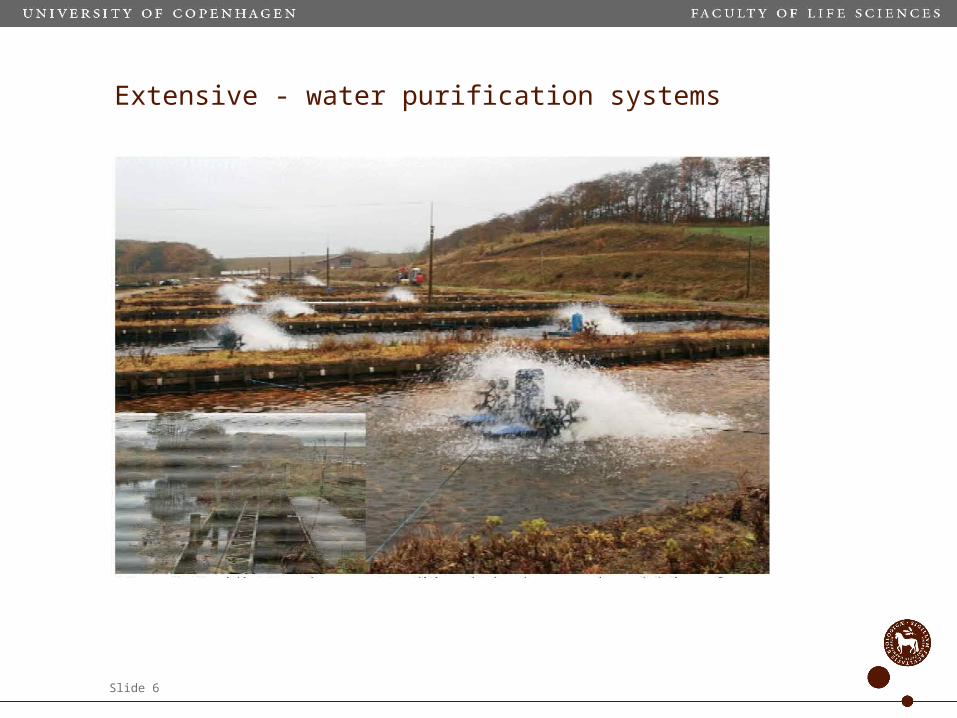
Extensive - water purification systems

Slide 7
Semi-intensive - water purification system
Slide 8
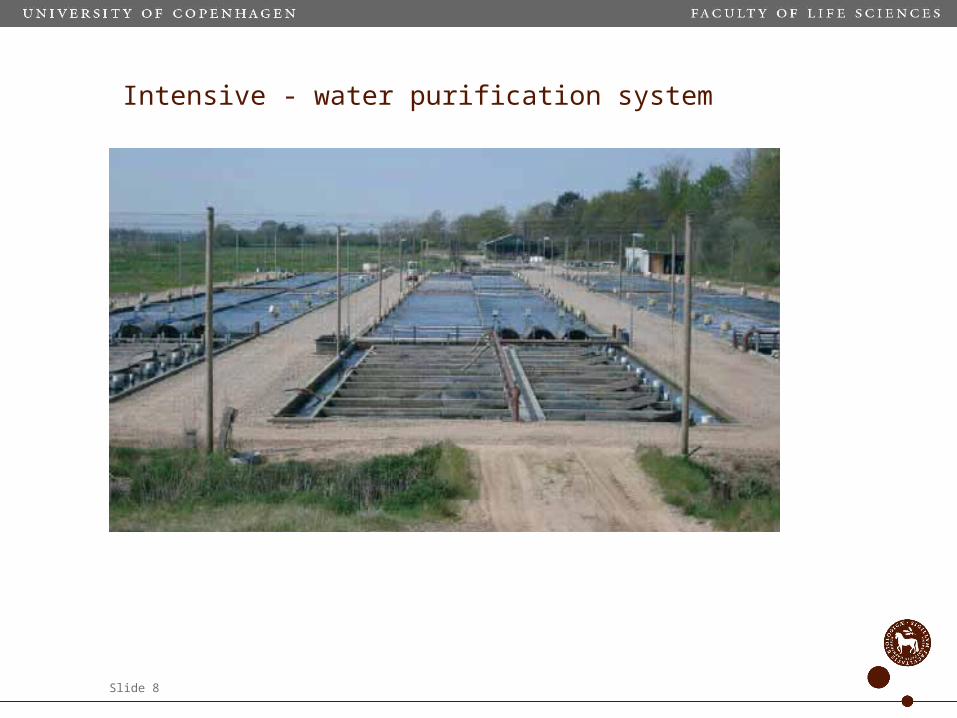
Intensive - water purification system
Slide 9
Hypotheses and model
Hypotheses:
1) Technical efficiency is the same for all farms, even though, investment are higher for farms using more intensive water purification systems
2) Size in terms of production volume influence on technical efficiency
Slide 10
DEA model
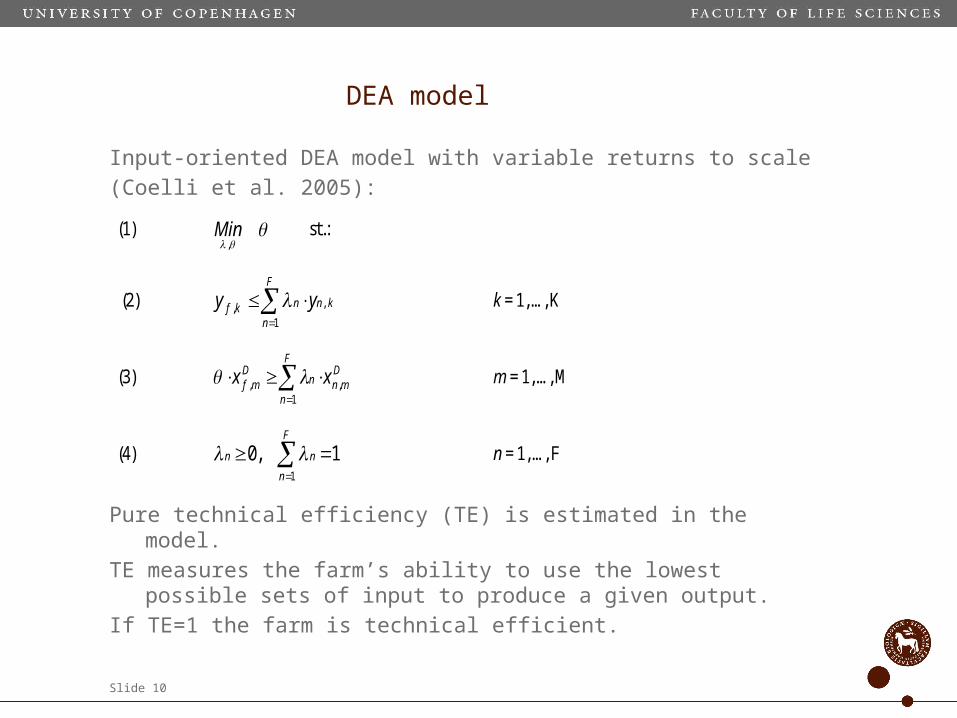
Input-oriented DEA model with variable returns to scale (Coelli et al. 2005):
Pure technical efficiency (TE) is estimated in the model. TE measures the farm’s ability to use the lowest possible sets of
input to produce a given output. If TE=1 the farm is technical efficient.
(1) ,
Min st.:
(2)
F
n
knnkf yy1
,, k = 1, …, K
(3)
F
n
Dmnn
Dmf xx
1,, m = 1, …, M
(4)
F
n
nn
1
1,0 n = 1, …, F

Slide 11
Tobit model
Tobit regression model (Hoff 2007)
Theta is the efficiency scores from the DEA analysis
Beta is the regression parameters
D is the exogenous variables that influence on farm efficiency - in this case, dummy variables describing 3 water purification
systems and 4 size classes
(6) =
*
*
**
1;1
0;0
10;
;
j
J
jjD
10
*

Slide 12
Results: DEA model (Average TE-scores )
DEA scores All farms Water purification system Size classes 2007 Extensive Semi-intensive Intensive 0-99 100-199 200-299 300-
Mean TE-score 0.83 0.82 0.86 0.89 0.81 0.79 0.86 0.92 No. of farms 146 126 10 10 68 33 29 16 Efficient farms 25 19 1 5 10 1 7 7
DEA scores All farms Water purification system Size classes 2008 Extensive Semi-intensive Intensive 0-99 100-199 200-299 300-
Mean TE-score 0.84 0.83 0.86 0.91 0.81 0.79 0.90 0.94 No. of farms 146 126 10 10 66 42 18 20 Efficient farms 37 28 4 5 16 5 5 11

Slide 13
Results: Tobit model
Tobit regression Water purification system Size classes 2007 Extensive Semi-intensive Intensive 0-99 100-199 200-299 300-
Intercept 0.83 0.83 0.83 0.96 0.96 0.96 0.96 Parameter estimater . 0.04 0.11** -0.14*** -0.16*** -0.08* . Note: Level of significance: ***=1% , **=5% and *=10% .
Tobit regression Water purification system Size classes 2008 Extensive Semi-intensive Intensive 0-99 100-199 200-299 300-
Intercept 0.85 0.85 0.85 1.02 1.02 1.02 1.02 Parameter estimater . 0.05 0.12* -0.18*** -021*** -0.09 . Note: Level of significance: ***=1% , **=5% and *=10% .
Slide 14
Implication
Intensive and semi-intensive farms are just as technical efficient as extensive farms, but they pollute less per kilo of produced fish
It is, therefore, possible to have growth without increasing pollution and without reducing technical efficiency if farms invest in more intensive water purification systems
Why doesn’t everybody use the new water purification systems? • Higher investment cost• Risk and uncertainty (future prices, production volume,
regulation etc.)• Farmers have no incentive to reduce pollution • The existing regulation does not ensure that the fish farmer
can produce more, even though, they pollute less

Slide 15
Implications
What is done to support sustainable production?
The Danish regulation today is an input regulation based on feed quotas
Changing the regulation to an output based regulation on nitrogen can create an incentive for producers to reduce nitrogen pollution per kg of produced fish, if they are allowed to produce more, keeping the existing level of pollution constant

Slide 16
New regulation
A new regulation is about to be implemented in Denmark
“Green growth” • Implementation of output regulation on nitrogen, and• Introduction of Individual Tradable Quotas (ITQ) on nitrogen
Calculation show that production could be increased by 8-15%, and welfare gains by 40-50% keeping the existing level of pollution constant, if the most efficient farms in terms of production and water purification is the ones producing
Future research: Effect of new regulation on production and welfare
Who will win the rights to pollute (Aquaculture vs. Agriculture)
Slide 17
Thank you