www.sciforum.net/conference/ecea-2
Conference Proceedings Paper – Entropy
Shannon’s entropy usage as statistic in assessment of distribution
Lorentz Jäntschi 1,2 and Sorana D. Bolboacă 3,*
1 Technical University of Cluj-Napoca, Department of Physics and Chemistry, Muncii Blvd. 103-
105, 400641 Cluj-Napoca, Romania; E-Mail: [email protected] (LJ) 2 Babeş-Bolyai University, Institute for Doctoral Studies, Kogălniceanu Street no. 1, 400084 Cluj-
Napoca, Romania; 3 Iuliu Haţieganu University of Medicine and Pharmacy, Department of Medical Informatics and
Biostatistics, Louis Pasteur Street no. 6, 400349 Cluj-Napoca, Romania; E-Mail:
[email protected] (SDB)
* Author to whom correspondence should be addressed; E-Mail: [email protected] (S.D.B.);
Tel.: +4-0750-774-506; Fax: +4-0246-593-847.
Published: 13 November 2015
Abstract: Investigation of how data are distributed is mandatory for proper statistical
analysis. Different statistics are use to assess a general null hypothesis (H0): data follow a
specific distribution. The Shannon’s entropy (H1) is introduced as statistic and its
evaluation was conducted compared with Anderson-Darling (AD), Kolmogorov-Smirnov
(KS), Cramér-von Mises (CM), Kuiper V (KV), and Watson U2 (WU) statistics. A
contingency containing four continuous distributions (error function, generalized extreme
value, lognormal, and normal), six statistics (including Shannon’s entropy as statistic), and
fifty measured activities/properties was constructed. Fisher's combined probability test
(FCP) was applied to obtain the overall p-value from different tests bearing upon the same
null hypothesis for each data set. Two scenarios were analyzed, one without (Scenario 1:
AD & KS & CM & KV & WU) and one with (Scenario 2: AD & KS & CM & KV & WU
& H1) inclusion of Shannon’s entropy as statistic. The Shannon’s entropy (H1) was the
statistic with smallest number of H0 rejections. The FCP showed identical results in
assessment of Error, Generalized Extreme Value and Normal distributions on both
scenarios. In the case of Lognormal distribution, inclusion of Shannon’s statistic decreases
the number of rejections for null hypothesis from 20 to 18.
Keywords: distribution; Shannon’s entropy; statistic
OPEN ACCESS

2
PACS Codes: 02.50.Cw (Probability theory), 02.50.Ng (Distribution theory and Monte
Carlo studies), 02.50.Tt (Inference methods)
1. Introduction
Different statistical tests are used to assess the agreement between theoretical probability models
and measured data as an early step in statistical analysis of experimental data. Kolmogorov-Smirnov
[1, 2], Anderson-Darling [3,4], Pearson’s Chi-square [5,6], Cramér-von-Mises [7,8], Shapiro-Wilk [9],
Jarque-Bera [10,11,12], D’Agostino-Pearson [13], Lilliefors [14], or Shapiro-Francia [15] are just
several tests that are frequently used and implemented in commercial statistical software. Monte Carlo
experiments conducted on different sample sizes showed that Shapiro-Wilks test is the most powerful
test in assessment of normal distribution while Kolmogorov-Smirnov test is less powerful [16]. Tui
proved that Anderson-Darling assure validity and inference based on t-statistic compared with Jarque-
Bera, Shapiro-Francia, D’Agostino & Pearson, Anderson-Darling & Lilliefors [17]. Note that, the test
for assessment of normal distribution was under more attention of researchers since the normality
assumption led to application of a parametric or non-parametric test [18,19].
The general idea that it (or would) a statistic able to provide always with highest confidence the
correct classification (rejection of the null hypothesis - H0 - when it is expected to be rejected, for
instance) exist can be easily contradicted by taking a simple example of a dataset containing an outlier
[20]. By following the same example given in [20] it is easily to see that if the sample is cleaned by
outliers, all statistics dramatically arrive to provide much closer probabilities associated with the H0. It
is possible to raise a simple question, even stronger than the previous one: It is possible to construct a
statistic able to provide the best expected answer regarding the testing of the H0? There is no definitely
answer, but the solution to this problem was provided some time ago by Fisher [21] and discussed in
the context of combining probability from multiple statistics recently [22]. Is no need for such kind of
statistic when are available a battery of statistics, and this is actually the expected result since most of
the distributions have more than one degree of freedom, and using of a battery of statistics may cover
the variation in full induced by these degrees of freedom. On this context, introducing a new statistic
seems justified. The aim of this research was to introduce and to assess the Shannon’s entropy (H1),
which generally refers to disorders or uncertainties [23], as statistics for evaluation of distribution of
experimental data.
2. Methods
2.1. Computational Approach Four statistical null hypotheses (H0) were evaluated:
1. H0: The experimental data follow error distribution
2. H0: The experimental data follow generalized extreme value distribution
3. H0: The experimental data follow lognormal distribution
4. H0: The experimental data follow normal distribution

3
Five statistical tests previously used to test distribution of data were used for each null hypothesis:
Anderson-Darling (AD) [3,4], Kolmogorov-Smirnov (KS) [1,2], Cramér-von Mises (CM) [7], Kuiper
V (KV) [24], and Watson U2 (WU) [25] statistics.
Figure 1. Flowchart illustrating the steps involved in assessment of Shannon’s entropy as
statistic for evaluation of distribution.
The formulas used for each statistic are given in equations (1)-(6):
• Anderson-Darling statistic:
−
=
−⋅⋅+⋅−−=1n
0iii ))f1(fln()1i2(
n
1nAD (1)
• Kolmogorov-Smirnov statistic:
)fn
i,
n
1if(maxnKS ii
ni0−−−⋅=
<≤ (2)
• Kuiper V statistic:
))fn
i(max)
n
1if(max(nKV i
ni0i
ni0−+−−⋅=
<≤<≤ (3)
• Cramér-von Mises statistic:
−
=
−++=1n
0i
2i )f
n2
1i2(
n12
1CM (4)
• Watson U2 statistic:
INPUT DATA Measured property/activity
CDF COMPUTATION Error function & Generalized
Extreme Value & Lognormal & Normal
COMPUTE STATISTICS & P-VALUES Anderson-Darling (AD) & Kolmogorov-
Smirnov (KS) & Cramér-von Mises (CM) & Kuiper V (KV) & Watson U2
(WU) & Shannon’s entropy (H1)
SCENARIO 1 AD & KS & CM & KV & WU
SCENARIO 2 AD & KS & CM & KV & WU & H1
Fisher's combined probability test
AD: http://l.academicdirect.org/Statistics/tests/AD/ KS: http://l.academicdirect.org/Statistics/tests/KS/ CM: http://l.academicdirect.org/Statistics/tests/CM/ KV: http://l.academicdirect.org/Statistics/tests/KV/ WU: http://l.academicdirect.org/Statistics/tests/WU/ H1: http://l.academicdirect.org/Statistics/tests/H1/
EasyFit software

4
21n
0ii
1n
0i
2i )f
n
1
2
1(n)f
n2
1i2(
n12
1WU
−
=
−
=−−−++= (5)
• H1 entropy as statistic:
−
=
−⋅−+⋅−=1n
0iiiii )f1ln()f1()fln(f1H (6)
where n is the sample size, i iterates (in ascending order) the observations in the sample, fi is the
cumulative distribution function associated with the observation (sorted in ascending order).
For each statistic, the following algorithm was applied (where K is set to a large numeric value, e.g.
10,000 as presented below, k iterates the domain defined by 0 and K, and j iterates the control points of
probability thresholds pj = j/1,000, e.g. 0.001, 0.002, …, 0.999):
Figure 2. The steps involved in building of the statistic-probability association map.
In Figure 2, the algorithm is provided for a fixed value of the sample size (n) and can be used
iterating successively the value of n starting with n = 2.
In the above algorithm, large K and eventually repeated resampling are used for increasing the
resolution of the statistic's values. For the same purpose, for a value 0 ≤ x ≤ 1 the random is conducted
in two steps, first for mantissa ((10,000+Random(90,000))/100,000), and second for exponent (repeat
k:=Random(10); if(k=0)then p[i]:=p[i]/10; until(k>0)). Furthermore, Mersenne Twister method [26]
was involved to simulate randomness.
The inverse of the Statisticprobability function from the above-provided algorithm was used to answer
to the H0 hypotheses.
2.2. Datasets Measured properties or activities on a series of a series of chemical compounds with sample size
from 13 to 1714 were used to assess of the H1 as statistics in evaluation of distribution (Table 1).
For 0 ≤ k ≤ 1000·K ni0for,Randomf ]1,0[Uniformi <≤←
))f((Sort)f( ni0iASCni0i <≤<≤ ←
))f((FormulaObserved ni0ik <≤←
EndFor ))Observed((Sort)Observed( Kk0kASCKk0k <≤<≤ ←
For 1 ≤ j ≤ 999 )Observed,Observed(MeanStatistic jK10001jK10001000/j ⋅⋅−⋅⋅←
EndFor
The formula of each
statistic enters here

5
Table 1. Characteristics of datasets used in assessment.
Set Compounds Property/Activity n Ref 01 phenols antioxidant activity 42 [27,28]02 drug-like compounds blood-brain barrier permeability 129 [29] 03 estrogen receptors binders binding activity 144 [30] 04 pure chemicals heat of combustion 1714 [31] 05 different active compounds carcinogenicity (LD50) 39 [32] 06 nitrocompounds carcinogenic potency 55 [33] 07 substituted anilines and phenols toxicity to V. fischeri 57 [34] 08 toxicity to P. subcapitata 58 09 phenols toxicity to Tetrahymena pyriformis 250 [35] 10 deacetylase LpxC-2-aryloxazolines,
aroylserines, and 2-arylthiazolines inhibitors on Pseudomonas aeruginosa 51 [36]
11 LpxC inhibitors inhibitory activity on gram-negative 41 [37] 12 drug-like compounds aqueous solubility 166 [38] 13 sulfonamide inhibition activity on carbonic anhydrase I 40 [39] 14 inhibition activity on carbonic anhydrase II 40 15 inhibition activity on carbonic anhydrase IV 40 16 sulfonamides pKa 29 [40] 17 aromatic sulfonamides inhibition activity on carbonic anhydrase II 43 [41] 18 sulfonamides inhibition activity on carbonic anhydrase II 47 [42] 19 aromatic/heterocyclic sulfonamides inhibition activity on carbonic anhydrase 38 [43-45]20 paclitaxel antimitotic activity - B16 melanoma 18 [46] 21 antimitotic activity - MCF-7 17 22 antimitotic activity - MCF7-ADR 16 23 taxoids to MCF-7 cell lines 63 [47] 24 cell growth inhibitory activity 35 [48] 25 c-Src inhibitors anticancer activity 80 [49] 26 different compounds boiling points 196 [50] 27 heats of vaporization 19 28 carboquinone derivative minimum effective dose 37 [51] 29 cyclic peroxy ketals half maximal inhibitory concentration 18 [52] 30 organic pollutants oxidative degradation 33 [53] 31 degradation 33 [54] 32 (benzo)triazoles fish toxicity 97 [55] 33 thiophene and imidazopyridine derivatives inhibition activity of the Polo-Like Kinase 1 136 [56] 34 substituted phenylaminoethanones average antibacterial activity 17 [57] 35 average antifungal activity 17 36 average antimicrobial activity 17 37 acetylcholinesterase inhibitors inhibition activity 110 [58] 38 antimony(III) complexes glutathione reductase inhibitor 14 [59] 39 polychlorinated diphenyl ethers 298 K supercooled liquid vapor pressures 107 [60] 40 aqueous solubility 107 41 hexahydroquinoline derivatives calcium channel antagonist activity 13 [61] 42 volatile organic compounds draize eye score 126 [62,63]43 polychlorinated biphenyls relative retention times 209 [64] 44 drug-like compounds blood-brain barrier permeability 122 [29] 45 protein kinase inhibitors inhibitory activity 77 [65] 46 curcumin analogs IL6 inhibition activity 23 [66] 47 TNF inhibition activity 23 48 4-aminoquinoline analogues antiplasmodial activity against chloroquine-susceptible
Plasmodium falciparum 68 [67]
49 antiplasmodial activity chloroquine- resistant Plasmodium falciparum
68
50 nitrofuranyls antitubercular agents 110 [68]

6
3. Results and Discussion
The investigation of 50 datasets using four distributions and 5 (scenario 1) or respectively 6
(scenario 2) statistics led to a matrix 200 rows (50 data sets × 4 distributions) by 5 (scenario 1) or 6
(scenario 2) columns (according with the number of statistics used) that represents the input data. The
number of H0 rejections varied from 0 to 21 and proved smallest when Shennon’s entropy was used as
statistics (Table 2). On average, the highest percentage of rejections was observed on Kuiper V
statistic closely follows by Watson U2 statistic.
Table 2. Rejection H0? Number of rejections and associated percentage by statistics (at 5% risk being
in error).
Distribution AD KS CM KV WU H1
no. % no. % no. % no. % no. % no. % Error 9 18.75 12 24.00 11 22.00 19 38.00 17 34.00 0 0.00Generalized Extreme Value 6 13.33 5 10.00 4 8.00 13 26.00 11 22.00 3 6.67Lognormal 4 8.00 7 14.00 4 8.00 18 36.00 16 32.00 3 6.00Normal 8 16.67 14 28.00 10 20.00 21 42.00 20 40.00 0 0.00
The values of failing to reject the null hypothesis (p>0.05) by investigated tests varied from 2 to 5
while the median value was without any exception equal with the sum of tests in both investigated
scenarios (Table 3). The characteristics of the summary statistics were similar for Error and
Lognormal distribution in the scenario without Shanon’s entropy. However, the inclusion of Shanon’s
entropy as statistic in assessment of distribution uniformizes the characteristics in summary statistics
for Error, Generalized Extreme Value, and Lognormal distributions (see Table 3).
Table 3. Failed to reject H0: median, inter-quartile ranges, and perfect concordance between scenarios.
Distribution Scenario 1
median (Q1−Q3) Scenario 2
median (Q1−Q3) Perfect concordance between scenario*
no. (%) Error 5 (3−5) 6 (4−6) 30 (60) Generalized Extreme Value 5 (4−5) 6 (4−6) 32 (60) Lognormal 5 (3−5) 6 (4−6) 31 (62) Normal 5 (2−5) 6 (3−6) 29 (58) * perfect concordance was obtained when an agreement on H0 was obtained between all tests in both scenario (5 tests in scenario 1 and 6 tests in scenario 2)
To identify the behavior of Shanon’s statistic, the absolute difference between p-value of Shanon’s
statistic and respectively p-value of all other statistics were counted. The Shanon’s p-value proved
closest to Anderson-Darling p-value for Error and Normal distributions (Figure 3). In the assessment
of Generalized Extreme Value distribution, the Shannon’s p-value proved closest to Kuiper V statistic.
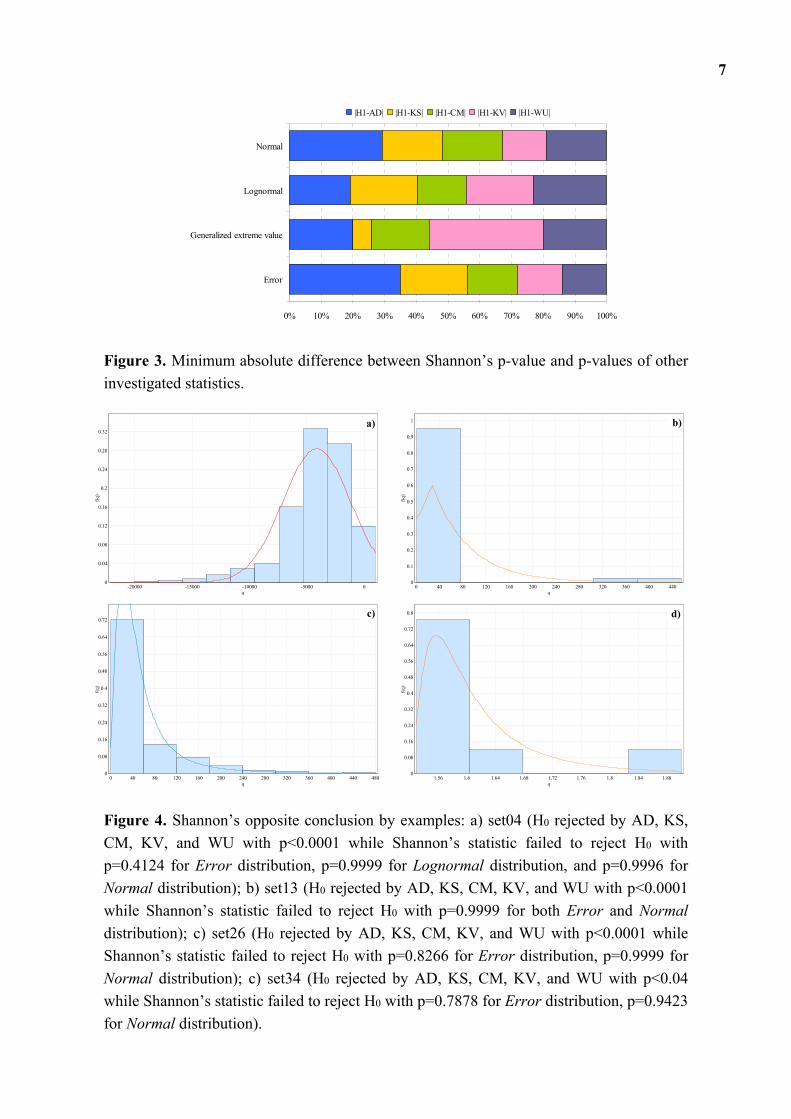
With the exception of Generalized Extreme Value distribution, for several datasets opposite
conclusions regarding H0 was drawn by Shannon’s statistic compared to all other statistics (see Figure
4):
• Error distribution: set04, set26, and set34.
• Lognormal distribution: set04
• Normal distribution: set04, set13, set14, set15, set26, and set34.
7
0% 10% 20% 30% 40% 50% 60% 70% 80% 90% 100%
Error
Generalized extreme value
Lognormal
Normal
|H1-AD| |H1-KS| |H1-CM| |H1-KV| |H1-WU|
Figure 3. Minimum absolute difference between Shannon’s p-value and p-values of other
investigated statistics.
q0-5000-10000-15000-20000
f(q)
0.32
0.28
0.24
0.2
0.16
0.12
0.08
0.04
0
q44040036032028024020016012080400
f(q)
1
0.9
0.8
0.7
0.6
0.5
0.4
0.3
0.2
0.1
0
q48044040036032028024020016012080400
f(q)
0.72
0.64
0.56
0.48
0.4
0.32
0.24
0.16
0.08
0
q1.881.841.81.761.721.681.641.61.56
f(q)
0.8
0.72
0.64
0.56
0.48
0.4
0.32
0.24
0.16
0.08
0
Figure 4. Shannon’s opposite conclusion by examples: a) set04 (H0 rejected by AD, KS,
CM, KV, and WU with p<0.0001 while Shannon’s statistic failed to reject H0 with
p=0.4124 for Error distribution, p=0.9999 for Lognormal distribution, and p=0.9996 for
Normal distribution); b) set13 (H0 rejected by AD, KS, CM, KV, and WU with p<0.0001
while Shannon’s statistic failed to reject H0 with p=0.9999 for both Error and Normal
distribution); c) set26 (H0 rejected by AD, KS, CM, KV, and WU with p<0.0001 while
Shannon’s statistic failed to reject H0 with p=0.8266 for Error distribution, p=0.9999 for
Normal distribution); c) set34 (H0 rejected by AD, KS, CM, KV, and WU with p<0.04
while Shannon’s statistic failed to reject H0 with p=0.7878 for Error distribution, p=0.9423
for Normal distribution).
a) b)
c) d)

8
The overall combine test showed identical results in assessment of Error, Generalized Extreme
Value and Normal distributions in both investigated scenarios when the analysis was conducted at a
significance level of 5% (Table 4).
Table 4. Reject H0? Results of overall combine test at a significance level of 5%
Distribution Scenario 1 Scenario 2
no. % no. % Error 19 38.00 19 38.00 Generalized Extreme Value 13 26.00 13 26.00 Lognormal 20 40.00 18 36.00 Normal 21 42.00 21 42.00
The inclusion of Shannon’s statistic in the overall combine test decreases the number of H0
rejections with 4% in assessment of Lognormal distribution (Table 4). Lognormal distribution is
known to fit skewed distribution [69] but did it is not always the best model for such data [70].
Lognormal distribution is mainly seen in biological or life science experiments [71,72,73], but also in
environmental sciences [74,75], material science [76], or economics [77,78]. Furthermore, lognormal
distribution found its usefulness in new derived research fields such as scientometry where Breuer and
Bowen proposed a formula based on log-normal distribution to predict the expected number of
citations [79]. According with the obtained results
4. Conclusions
Even if the Shannon’s statistic seems to have the tendency to fail to reject H0 more often than all
another investigated statistics, its use in a battery of statistics in testing the H0 hypothesis, as was
resulted from this study conducted in two scenarios, it changes the outcome not significantly (2 out of
73 less rejections of H0).
Author Contributions
L.J. and S.D.B. wrote the paper; L.J. developed and implemented the algorithm, S.D.B.
collected the investigated data sets; L.J. and S.D.B. run the experiments and analyze the obtained
results. Both authors have read and approved the final manuscript.
Conflicts of Interest
The authors declare no conflict of interest.
References and Notes
1. Kolmogorov, A. Sulla determinazione empirica di una legge di distribuzione. Giornale
dell'Istituto Italiano degli Attuari 1933, 4, 83-91.
2. Smirnov, N. Table for estimating the goodness of fit of empirical distributions. Annals of
Mathematical Statistics 1948, 19, 279-281.

9
3. Anderson, T. W.; Darling, D. A. Asymptotic theory of certain "goodness-of-fit" criteria based on
stochastic processes. Annals of Mathematical Statistics 1952, 23, 193-212.
4. Anderson, T.W.; Darling, D.A. A Test of Goodness-of-Fit. Journal of the American Statistical
Association 1954, 49, 765-769.
5. Pearson, K. Contribution to the mathematical theory of evolution, II. Skew variation in
homogenous material. Philosophical Transactions of the Royal Society of London 1895, 91, 343-
414.
6. Pearson, K. On the criterion that a given system of deviations from the probable in the case of a
correlated system of variables is such that it can be reasonably supposed to have arisen from
random sampling. Philosophical Magazine Series 5 1900, 50(302), 157-175.
7. Cramér, H. On the composition of elementary errors. Skand. Akt. 1928, 11, 141-180.
8. von Mises, R.E. Wahrscheinlichkeit, Statistik und Wahrheit. Julius Springer: Vienna, Austria;
1928.
9. Shapiro, S.S.; Wilk, M.B. An analysis of variance test for normality (complete samples).
Biometrika 1965, 52(3-4), 591-611.
10. Jarque, C.M.; Bera, A.K. Efficient tests for normality, homoscedasticity and serial independence
of regression residuals. Economics Letters 1980, 6(3), 255-259.
11. Jarque, C.M.; Bera, A.K. Efficient tests for normality, homoscedasticity and serial independence
of regression residuals: Monte Carlo evidence. Economics Letters 1981, 7(4), 313-318.
12. Jarque, C.M.; Bera, A.K. A test for normality of observations and regression residuals.
International Statistical Review 1987, 55(2), 163-172.
13. D’Agostino, R.B.; Belanger, A.; D’Agostino, R.B.Jr. A suggestion for using powerful and
informative tests of normality. The American Statistician 1990, 44(4), 316-321.
14. Lilliefors, H.W. On the Kolmogorov-Smirnov for normality with mean and variance unknown.
Journal of the American Statistical Association 1967, 62, 399-402.
15. Shapiro, S.S.; Francia, R.S. An approximate analysis of variance test for normality. Journal of
the American Statistical Association 1972, 67, 215-216.
16. Razali, N.M., Wah, Y.B. Power comparison of Shapiro-Wilk, Kolmogorov-Smirnow, Lilliefors
and Anderson-darling tests. Journal of Statistical Modeling and Analytics 2011, 2(1), 21-33.
17. Tui, I. Normality Testing – A New Direction. International Journal of Business and Social
Sciences 2011, 2(3), 115-118.
18. Curran-Everett, D., Benos, D.J. Guidelines for reporting statistics in journals published by the
American Physiological Society. American Journal of Physiology. Endocrinology and
Metabolism 2004, 287(2), E189-91.
19. Lang, T.A.; Altman, D.G. Basic Statistical Reporting for Articles Published in Biomedical
Journals: The “Statistical Analyses and Methods in the Published Literature” or The SAMPL
Guidelines”. In: Smart, P.; Maisonneuve, H.; Polderman, A. (Eds). Science Editors' Handbook,
European Association of Science Editors, 2013. Available online: http://www.equator-
network.org/wp-content/uploads/2013/07/SAMPL-Guidelines-6-27-13.pdf (accessed on 23 July
2015)

10
20. Jäntschi, L.; Bolboacă, S.D. Distribution fitting 2. Pearson-Fisher, Kolmogorov-Smirnov,
Anderson-Darling, Wilks-Shapiro, Kramer-von-Misses and Jarque-Bera statistics. Bulletin of
University of Agricultural Sciences and Veterinary Medicine Cluj-Napoca. Horticulture 2009,
66(2), 691-697.
21. Fisher, R.A, Questions and answers #14. The American Statistician 1948, 2(5), 30-31.
22. Bolboacă, S.D.; Jäntschi, L.; Sestraş, A.F.; Sestraş, R.E.; Pamfil, D.C. Supplementary material of
'Pearson-Fisher chi-square statistic revisited'. Information 2011, 2(3), 528-545.
23. Shannon, C.E. A Mathematical Theory of Communication. Bell System Technical Journal 1948,
27(3), 379-423.
24. Kuiper, N.H. Tests concerning random points on a circle. Proceedings of the Koninklijke
Nederlandse Akademie van Wetenschappen, Series A 1960, 63, 38-47.
25. Zar, J. Biostatistical analysis, 2nd ed; Prentice-Hall, Inc., Englewood Cliffs: NJ, USA, 1984.
26. Matsumoto, M.; Nishimura, T. Mersenne twister: a 623-dimensionally equidistributed uniform
pseudo-random number generator. ACM Transactions on Modeling and Computer Simulation
1998, 8(1), 3-30.
27. Mitra, I.; Saha, A.; Roy, K. Chemometric QSAR Modeling and In Silico Design of Antioxidant
NO Donor Phenols. Scientia Pharmaceutica 2011, 79, 31-57.
28. Cena, C.; Boschi, D.; Tron, G.C.; Chegaev, K.; Lazzarato, L.; Di Stilo, A.; Aragno, M.; Fruttero,
R.; Gasco, A. Development of a new class of potential antiatherosclerosis agents: NO-donor
antioxidants. Bioorganic & Medicinal Chemistry Letters 2004, 14, 5971-5974.
29. Bolboacă, S.D.; Jäntschi, L. Predictivity Approach for Quantitative Structure-Property Models.
Application for Blood-Brain Barrier Permeation of Diverse Drug-Like Compounds.
International Journal of Molecular Science 2011, 12, 4348-4364.
30. Li, J.; Gramatica, P. The importance of molecular structures, endpoints' values, and predictivity
parameters in QSAR research: QSAR analysis of a series of estrogen receptor binders.
Molecular Diversity 2010, 14(4), 687-696.
31. Gharagheizi, F. A simple equation for prediction of net heat of combustion of pure chemicals.
Chemometrics and Intelligent Laboratory Systems 2008, 91(2), 177-180.
32. ChemIDPlus. ToxNet DATABSE. Available online: URL: http://chem.sis.nlm.nih.gov (accessed
on 5 August 2015).
33. Morales Helguera, A.; Cordeiro, M.N.D.S.; Perez, M.A.C.; Combes, R.D.; Perez Gonzalez. M.
QSAR modeling of the rodent carcinogenicity of nitrocompounds. Bioorganic & Medicinal
Chemistry 2008, 16, 3395-3407.
34. Aruoja, V.; Sihtmäe, M.; Dubourguier, H.C.; Kahru, A. Toxicity of 58 substituted anilines and
phenols to algae Pseudokirchneriella subcapitata and bacteria Vibrio fischeri: comparison with
published data and QSARs. Chemosphere 2011, 84, 1310-1320.
35. Zhao, Y.H.; Yuan, X.; Su, L.M.; Qin, W.C.; Abraham, M.H. Classification of toxicity of phenols
to Tetrahymena pyriformis and subsequent derivation of QSARs from hydrophobic, ionization
and electronic parameters. Chemosphere 2009, 75(7), 866-871.

11
36. Kadam, R.U.; Roy, N. Cluster analysis and two-dimensional quantitative structure-activity
relationship (2D-QSAR) of Pseudomonas aeruginosa deacetylase LpxC inhibitors. Bioorganic &
Medicinal Chemistry Letters 2006, 16(19), 5136-5143.
37. Ghasemi, J.B.; Safavi-Sohi, R.; Barbosa, E.G. 4D-LQTA-QSAR and docking study on potent
Gram-negative specific LpxC inhibitors: a comparison to CoMFA modeling. Molecular
Diversity 2012, 16(1), 203-213.
38. Duchowicz, P.R.; Talevi, A.; Bruno-Blanch, L.E.; Castro, E.A. New QSPR study for the
prediction of aqueous solubility of drug-like compounds. Bioorganic & Medicinal Chemistry
2008, 16(17), 7944-7955.
39. Supuran, C.T.; Clare, B.W. Carbonic anhydrase inhibitors – part 57: Quantum chemical QSAR
of a group of 1,3,4-thiadiazole- and 1,3,4-thiadiazoline disulfonamides with carbonic anhydrase
inhibitory properties. European Journal of Medicinal Chemistry 1999, 34, 41-50.
40. Balaban, A.T.; Khadikar, P.V.; Supuran, C.T.; Thakur, A.; Thakur, M. Study on supramolecular
complexing ability vis-à-vis estimation of pKa of substituted sulfonamides: dominating role of
Balaban index (J). Bioorganic & Medicinal Cemistry Letters 2005, 15(17), 3966-3973.
41. Melagraki, G.; Afantitis, A.; Sarimveis, H.; Igglessi-Markopoulou, O.; Supuran, C.T. QSAR
study on para-substituted aromatic sulfonamides as carbonic anhydrase II inhibitors using
topological information indices. Bioorganic & Medicinal Chemistry 2006, 14(4), 1108-1114.
42. Eroglu, E. Some QSAR studies for a group of sulfonamide Schiff base as carbonic anhydrase CA
II inhibitors. International Journal of Molecular Sciences 2008, 9(2), 181-197.
43. Puccetti, L.; Fasolis, G.; Vullo, D.; Chohan, Z.H.; Scozzafava, A.; Supuran, C.T. Carbonic
anhydrase inhibitors. Inhibition of cytosolic/tumor-associated carbonic anhydrase isozymes I, II,
IX, and XII with Schiff's bases incorporating chromone and aromatic sulfonamide moieties, and
their zinc complexes. Bioorganic & Medicinal Cemistry Letters 2005, 15, 3096-3101.
44. Supuran, C.T.; Scozzafava, A.; Popescu, A.; Bobes-Tureac, R.; Banciu, A.; Bobes-Tureac, G.;
Bamciu, M.D. Carbonic anhydrase inhibitors. Part 43. Schiff bases derived from aromatic
sulfonamides: towards more specific inhibitors for membrane-bound versus cytosolic isozymes.
European Journal of Medicinal Chemistry 1997, 32, 445-452.
45. Krungkrai, J.; Scozzafava, A.; Reungprapavut, R.; Krungkrai, S.R.; Rattanajak, R.;
Kamchonwongpaisand, S.; Supuran, C.T. Carbonic anhydrase inhibitors. Inhibition of
Plasmodium falciparum carbonic anhydrase with aromatic sulfonamides: towards antimalarials
with a novel mechanism of action. Bioorganic & Medicinal Chemistry 2005, 13, 483-489.
46. Mohanraj, S.; Doble, M. 3-D QSAR Studies of Microtubule Stabilizing Antimitotic Agents
Towards Six Cancer Cell Lines. QSAR & Combinatorial Science 2006, 25(10), 952-960.
47. Dong, P.P.; Zhang, Y.Y.; Ge, G.B.; Ai, C.Z.; Liu, Y.; Yang, L.; Liu, C.X. Modeling resistance
index of taxoids to MCF-7 cell lines using ANN together with electrotopological state
descriptors. Acta Pharmacologica Sinica 2008, 29(3), 385-396.
48. Morita, H.; Gonda, A.; Wei, L.; Takeya, K.; Itokawa, H. 3D QSAR Analysis of Taxoids from
Taxus Cuspidata Var. Nana by Comparative Molecular Field Approach. Bioorganic & Medicinal
Chemistry Letters 1997, 7(18), 2387-2392.
12
49. Comelli, N.C.; Ortiz, E.V.; Kolacz, M.; Toropova, A.P.; Toropov, A.A.; Duchowicz, P.R.;
Castro, E.A. Conformation-independent QSAR on c-Src tyrosine kinase inhibitors.
Chemometrics and Intelligent Laboratory Systems 2014, 134, 47-52.
50. Chase, M.W.Jr.; Davies, C.A.; Downey, J.R.Jr.; Frurip, D.J.; McDonald, R.A.; Syverud, A.N.
JANAF Thermochemical Tables, Third Edition. Journal of Physical and Chemical Reference
Data 1985, 14(S1), pp. 1856.
51. Bolboacă, S.D.; Jäntschi, L. Comparison of Quantitative Structure-Activity Relationship Model
Performances on Carboquinone Derivatives. TheScientificWorldJOURNAL 2009, 9(10), 1148-
1166
52. Roy, K. Chapter 7 – Validation of QSAR Models. In: Understanding the Basics of QSAR for
Applications in Pharmaceutical Sciences and Risk Assessment. AcademicPres, 2015, pp. 231-
289
53. Jia, L.; Shen, Z.; Guo, W.; Zhang, Y. Zhu, H.; Jia, W.; Fan, M. QSAR models for oxidative
degradation of organic pollutants in the Fenton process. Journal of the Taiwan Institute of
Chemical Engineers 2015, 46, 140-147.
54. Zhu, H.; Guo, W.; Shen, Z.; Tang, Q.; Ji, W.; Jia, L. QSAR models for degradation of organic
pollutants in ozonation process under acidic condition. Chemosphere 2015, 119, 65-71.
55. Cassani, S.; Kovarich, S.; Papa, E.; Roy, P.P.; van der Wal, L.; Gramatica, P. Daphnia and fish
toxicity of (benzo)triazoles: Validated QSAR models, and interspecies quantitative activity–
activity modeling. Journal of Hazardous Materials 2013, 258-259, 50-60.
56. Comelli, N.C.; Duchowicz, P.R.; Castro, E.A. QSAR models for thiophene and imidazopyridine
derivatives inhibitors of the Polo-Like Kinase 1. European Journal of Pharmaceutical Sciences
2014, 62, 171-179.
57. Verma, D.; Kumar, P.; Narasimhan, B.; Ramasamy, K.; Mani, V.; Mishra, R.K.; Majeed, A.B.A.
Synthesis, antimicrobial, anticancer and QSAR studies of 1-[4-(substituted phenyl)-2-
(substituted phenyl azomethyl)-benzo[b]-[1,4]diazepin-1-yl]-2-substituted
phenylaminoethanones. Arabian Journal of Chemistry 2015; doi:10.1016/j.arabjc.2015.06.010
58. Vitorović-Todorović, M.D.; Cvijetić, I.N.; Juranić, I.O.; Drakulić, B.J. The 3D-QSAR study of
110 diverse, dual binding, acetylcholinesterase inhibitors based on alignment independent
descriptors (GRIND-2). The effects of conformation on predictive power and interpretability of
the models. Journal of Molecular Graphics and Modelling 2012, 38, 194-210.
59. Tunç, T.; Koç, Y.; Açık, L.; Karacan, M.S.; Karacan, N. DNA cleavage, antimicrobial studies
and a DFT-based QSAR study of new antimony(III) complexes as glutathione reductase
inhibitor. Spectrochimica Acta Part A: Molecular and Biomolecular Spectroscopy 2015, 136,
1418-1427.
60. Hui-Ying, X.; Jian-Wei, Z.; Gui-Xiang, H.; Wei, W. QSPR/QSAR models for prediction of the
physico-chemical properties and biological activity of polychlorinated diphenyl ethers (PCDEs).
Chemosphere 2010, 80(6), 665-670.
61. Miri, R.; Javidnia, K.; Mirkhani, H.; Hemmateenejad, B.; Sepeher, Z.; Zalpour, M., Behzad, T.;
Khoshneviszadeh, M.; Edraki, N.; Mehdipour, A.R. Synthesis, QSAR and Calcium Channel

13
Modulator Activity of New Hexahydroquinoline Derivatives Containing Nitroimidazole.
Chemical Biology & Drug Design 2007, 70, 329-336.
62 . Abraham, M.H.; Kumarsingh, R.; Cometto-Muniz, J.E.; Cain, W.S. A Quantitative
Structure±Activity Relationship (QSAR) for a Draize Eye Irritation Database. Toxicology in
Vitro 1998, 12, 201-207.
63. Bolboacă, S.D.; Jäntschi, L. From molecular structure to molecular design through the
Molecular Descriptors Family Methodology, In: Castro, E.A. (Ed.), QSPR-QSAR Studies on
Desired Properties for Drug Design Research Signpost, Transworld Research Network, 2010, pp.
117-166.
64. Jäntschi, L.; Bolboacă, S.D., Diudea, M.V. Chromatographic Retention Times of Polychlorinated
Biphenyls: from Structural Information to Property Characterization. International Journal of
Molecular Sciences 2007, 8(11), 1125-1157.
65. Quesada-Romero, L.; Mena-Ulecia, K.; Tiznado, W.; Caballero, J. Insights into the Interactions
between Maleimide Derivates and GSK3β Combining Molecular Docking and QSAR. PLoS One
2014, 9(7), e102212.
66. Zhao, C.; Zhang, Y.; Zou, P.; Wang, J.; He, W.; Shi, D.; Li, H.; Liang, G.; Yang, S. Synthesis
and biological evaluation of a novel class of curcumin analogs as anti-inflammatory agents for
prevention and treatment of sepsis in mouse model. Drug Design, Development and Therapy
2015, 9, 1663-1678.
67. Hocart, S.J.; Liu, H.; Deng, H.; De, D.; Krogstad, F.M.; Krogstad, D.J. 4-Aminoquinolines
Active against Chloroquine-Resistant Plasmodium falciparum: Basis of Antiparasite Activity and
Quantitative Structure-Activity Relationship Analyses. Antimicrobial Agents and Chemotherapy
2011, 55(5), 2233-2244.
68. Hevener, K.E.; Ball, D.M.; Buolamwini, J.K.; Lee, R.E. Quantitative structure-activity
relationship studies on nitrofuranyl antitubercular agents. Bioorganic & Medicinal Chemistry
2008, 16(17), 8042-8053.
69. Sachs, L. Angewandte Statistik. Anwendung statistischer Methoden. Springer: Heidelberg,
Germany, 1997
70. Limpert, E.; Stahel, W.A. Problems with Using the Normal Distribution – and Ways to Improve
Quality and Efficiency of Data Analysis. PLoS ONE 2011, 6(7), e21403.
71. Lawrence, D.; D'Odorico, P.; Diekmann, L.; DeLonge, M.; Das, R.; Eaton, J. Ecological
feedbacks following deforestation create the potential for a catastrophic ecosystem shift in
tropical dry forest. Proceedings of the National Academy of Sciences of the United States of
America 2007, 104, 20696-20701.
72. Limpert, E.; Stahel, W.A.; Abbt, M. Log-normal distributions across the sciences – keys and
clues. BioScience 2001, 51, 341-352.
73. Sorrentino, R.P. Large standard deviations and logarithmic-normality – the truth about hemocyte
counts in Drosophila. Fly 2010, 4, 327-332.
74. Baur, P. Lognormal distribution of water permeability and organic solute mobility in plant
cuticles. Plant, Cell and Environment 2010, 20, 167-177.

14
75. Kelly, B.C.; Ikonomou, M.G.; Blair, J.D.; Morin, A.E.; Gobas, F.A.P.C. Food Web–Specific
Biomagnification of Persistent Organic Pollutants. Science 2007, 317, 236-239.
76. Schäper, M. Application of the logarithmic normal distribution in material testing – misleading
norm statements resulting in faulty analyses. Bautechnik 2010, 87, 541-549.
77. Merton, R.C. Lifetime Portfolio Selection under Uncertainty: The Continuous-Time Case.
Review of Economics and Statistics 1969, 51, 247-257.
78. Chang, J.J.; Chen, S.N.; Wu, T.P. A note to enhance the BPW model for the pricing of basket
and spread options. The Journal of Derivatives 2012, 19(3), 77-82.
79. Breuer, P.T.; Bowen, J.P. Empirical Patterns in Google Scholar Citation Counts. 2014 Available
online: URL: http://arxiv.org/pdf/1401.1861.pdf (cited October 10, 2015)
© 2015 by the authors; licensee MDPI, Basel, Switzerland. This article is an open access article
distributed under the terms and conditions of the Creative Commons Attribution license
(http://creativecommons.org/licenses/by/3.0/).


![Improving Covert Storage Channel Analysis with …...distributions based on Shannon’s entropy [4]. They proposed a methodology to detect anomalies that can identify DDoS attack traffic](https://static.cupdf.com/doc/110x72/5f2f2124950638572d4652a3/improving-covert-storage-channel-analysis-with-distributions-based-on-shannonas.jpg)