Chris Nicoletti
Activity #267: Analysing the socio-economic
impact of the Water Hibah on beneficiary
households and communities (Stage 1)
Impact Evaluation Training Curriculum
Session 3
April 18, 2013
MEASURING RESULTS
From Promises into Evidence IMPACT EVALUATION
AND
This material constitutes supporting material for the "Impact Evaluation in Practice" book. This additional material is made freely but please acknowledge its use as follows: Gertler, P. J.; Martinez, S., Premand, P., Rawlings, L. B. and Christel M. J. Vermeersch, 2010, Impact Evaluation in Practice: Ancillary Material, The World Bank, Washington DC (www.worldbank.org/ieinpractice). The content of this presentation reflects the views of the authors and not necessarily those of the World Bank.
Some of the data collection management material was developed by Adam Ross.

3
Tuesday - Session 1
INTRODUCTION AND OVERVIEW
1) Introduction
2) Why is evaluation valuable?
3) What makes a good evaluation?
4) How to implement an evaluation?
Wednesday - Session 2
EVALUATION DESIGN
5) Causal Inference
6) Choosing your IE method/design
7) Impact Evaluation Toolbox
Thursday - Session 3
SAMPLE DESIGN AND DATA COLLECTION
9) Sample Designs
10) Types of Error and Biases
11) Data Collection Plans
12) Data Collection Management
Friday - Session 4
INDICATORS & QUESTIONNAIRE DESIGN
1) Results chain/logic models
2) SMART indicators
3) Questionnaire Design
Outline: topics being covered

4
Impact Evaluation Project Timeline
Design the Intervention Rollout the Intervention
Ongoing Monitoring
and Process Evaluation
Design the Impact
Evaluation
Collect Baseline
Data
Collect Follow-up
data
Endline Analysis
Scope of this
session
5
• We are planning a prospective impact evaluation
• We need baseline and follow-up survey data on
treatment and control groups to measure
program impact.
• We are going to collect our own data for the
impact evaluation.
Assumptions of this presentation

6
• Can you use existing data?
• Regular surveys (Census, DHS survey, IRAP, etc.)
• Regular Monitoring (Annual achievement tests)
• Administrative Records (health records, school
enrollment, etc.)
• In many instances, administrative data is
insufficient, poor quality or not at the scale you
would like.
Before collecting your own data
7
• Who should collect the data?
• Bureau of statistics – may have good capacity and a
worthwhile place to invest in further capacity.
• University – often times a social science-based
program will have data collection experience.
• External Firm – depends on the questions, complexity
and magnitude.
• When do you need to start?
• Keep in mind, procurement, training and data
collection all take time.
Before collecting your data

8
Objectives of sampling and data collection…
•We need data that:
1. Accurately reflects the reality of the population
(remember the external validity discussion from
yesterday).
2. Is representative of the entire eligible population.
3. Allows policy makers and analysts to make real-
time, informed decisions.
4. Has minimal sampling and non-sampling error.

9
• Sampling error: the result of observing a sample
of n households (the sample size or the
“evaluation sample”) rater than all N households
in the target population.
• Remember our diagram from yesterday…
Types of errors: Sampling Error

10
Sampling Error
1. Population
Sampling Error
2. Evaluation
sample
3. Randomize
treatment
Internal Validity
Comparison
Treatment
X

11
• Non-Sampling Error: The result of errors in
survey development and execution. Some
examples are:
• Measurement error – when the answers recorded are
different than the actual values
• Selection bias – results from imperfections in sample
frame of deficiencies in the sample selection process/
• Non-response – when we don’t get answers from
people on certain questions and/or from entire
households.
• What are some other that you can think of???
Types of error: Non-Sampling Error

12
Source of Error Examples Strategies to
minimize error Planning and
interpretation
Inadequate definitions of concepts, terms or
populations.
Ensure all concepts, terms and
populations are defined precisely
through consultation between data users
and survey designers.
Sample selection Inadequate list from which sample is
selected; biased sample selection.
Check list for accuracy, duplicates and
missing units; use appropriate selection
procedures (see “Bias and Accuracy”
below).
Survey methods Inappropriate method (e.g., mail survey for a
very complicated topic).
Choose an appropriate method and test
thoroughly.
Questionnaire Loaded, misleading or ambiguous questions,
poor layout or sequencing.
Use plain English, clear questions and
logical layout; test thoroughly.
Interviewers Leading respondents, making assumptions,
misunderstanding or mis-recording answers.
Provide clear interviewer instructions
and appropriate training, including
exercises and field supervision.
Respondents Refusals, memory problems, rounding
answers, protecting personal interests or
integrity.
Promote survey through public media;
ensure confidentiality; if interviewer-
based, use well-trained, impartial
interviewers and probing techniques; if
mail-based, use a well-written
introductory letter.
Processing Errors in data entry, coding or editing. Adequately train and supervise
processing staff; check a sample of each
person’s work.
Estimation Incorrect weighting, errors in calculation of
estimates.
Ensure that skilled statisticians
undertake estimation.
This table was extracted from:http://www.oesr.qld.gov.au/about-statistics/survey-methods/#Sources
13
Random sampling
Systematic sampling
Stratified sampling
Convenience sampling
Snowball sampling
Multi-stage sampling
Probability Proportional to Size
Let’s discuss each one…
We will now discuss the types of sampling…

14
•Random sampling is the purest form of
probability sampling. Each member of the
population has an equal and known chance of
being selected.
• Can anyone explain what is meant by probability
sampling?
• Does IndII use this currently?
Random Sampling

15
•Systematic sampling is often used
instead of random sampling. After the required
sample size has been calculated, every Nth
record is selected from a list of population
members. Its only advantage over the random
sampling technique is simplicity.
• Rather than rolling a dice or lottery, you simply choose
every 10th person on the list.
• Is this still random???
Systematic sampling
16
•Stratified sampling is commonly used
probability method that reduces sampling error. A
stratum is a subset of the population that share at
least one common characteristic.
• The researcher first identifies the relevant stratums
and then random sampling is used to select a
sufficient number of subjects from each stratum.
• Stratified sampling is often used when one or more of
the stratums in the population have a low incidence
relative to the other stratums.
• What are some cases when this would be important?
Stratified Sampling
17
•Convenience sampling is used in
exploratory research where the researcher is
interested in getting an inexpensive
approximation of the truth.
• The sample is selected because they are convenient.
• This nonprobability method is often used during
preliminary research efforts to get a gross estimate of
the results, without incurring the cost or time required
to select a random sample.
• Examples: “That person looks like they will answer my
survey…,” “That house is closer…” or, “That village is
less expensive to get to…”
Convenience Sampling
18
•Probability proportional to size
(PPS) is a sampling technique for use with
surveys in which the probability of selecting a
sampling unit (e.g., village, zone, district, school)
is proportional to the size of its population.
Probability proportional to size

19
•Multistage sampling - is a complex form of
sampling in which two or more levels of units are
embedded one in the other.
• The first stage consists of constructing the clusters that will
be used to sample from. In the second stage, a sample of
primary units is randomly selected from each cluster. All
ultimate units (individuals, for instance) selected at the last
step of this procedure are then surveyed.
• This technique involves taking random samples from
proceeding random samples.
• You pick multistage sampling to maximize the efficiency
of your design!!!
Multi-stage sampling
20
• How do sampling techniques factor into Sample
Design?
• Sampling methods are just one part of the sample
design.
• Remember that sample design can be very complex,
because we are trying to capture enough information
in our sample, to be able to test outcomes.
• Remember from Tuesday….
But what about sample design?

21
• A good summary is provided by Duflo (2006): • The power of the design is the probability that, for a given effect size and a given
statistical significance level, we will be able to reject the hypothesis of zero effect.
Sample sizes, as well as other (evaluation & sample) design choices, will affect
the power of an experiment.
• There are lots of things to consider, such as: • The impact estimator to be used; The test parameters (power level, significance
level); The minimum detectable effect; Characteristics of the sampled (target)
population (population sizes for potential levels of sampling, means, standard
deviations, intra-unit correlation coefficients (if multistage sampling is used)); and
the sample design to be used for the sample survey
A good sample design requires expert knowledge…

22
The basic process is this…
Level of Power
Level of Hypothesis
Tests
Correlations in outcomes
within groups (ICCS)
Mean and Variance of
outcomes &
MDES

23
𝑀𝐷𝐸𝑆 = 𝑡(1 − 𝑘) +
𝑡𝛼 ∗ √[1
𝑃 1 − 𝑃] √[
𝜎2
𝑁]
And the mathematical formula is this…
The minimum detectable effect size for a given t-test statistics (t) with
power (k), significance level (α), sample size (N) and portion of subjects
allocated to treatment group (P).
This equation can show a lot of things:
(1) trade-off between power and size: when the size decreases, 𝑡𝛼
increases, so that the minimum effect size increases for a given
power.
(2) The MDES drives the whole equation, if you have a larger MDES the
sample size (N) may be lower to test at the same level of significance
(α).
(3) The equation is minimized when the portion of subject allocated to
treatment groups is equal to .5
24
• The equation becomes more complex when
introducing other factors, such as:
• Multi-stage designs, clusters, etc.
• Unknown variances on your outcome variables
• Costs of treatment do not allow for equal treatment
and control groups.
• Budget ceilings
• Multiple treatments with different MDES (Example:
expenditures on water vs. impacts on education
levels).
• Grouped errors.
Additional factors…

25
• In practice, the survey expert/statistician will test a
number of different design options to determine which one
will be the most efficient, given the information at hand.
• Try different sampling strategies.
• If you have baseline and endline data, you can improve efficiency
by using a Diff-in-Diff estimator.
• Incorporate the adjustment to standard errors from evaluation
design choice.
• Calculate ICCs to determine if clustering or multi-stage designs
are better.
• Check various stratifications to see if this improves efficiency.
• Adjust significance levels based on the rigor that is needed.
• Incorporate marginal costs – based on previous work and/or input
from the field teams.
TEST MULTIPLE DESIGNS…
26
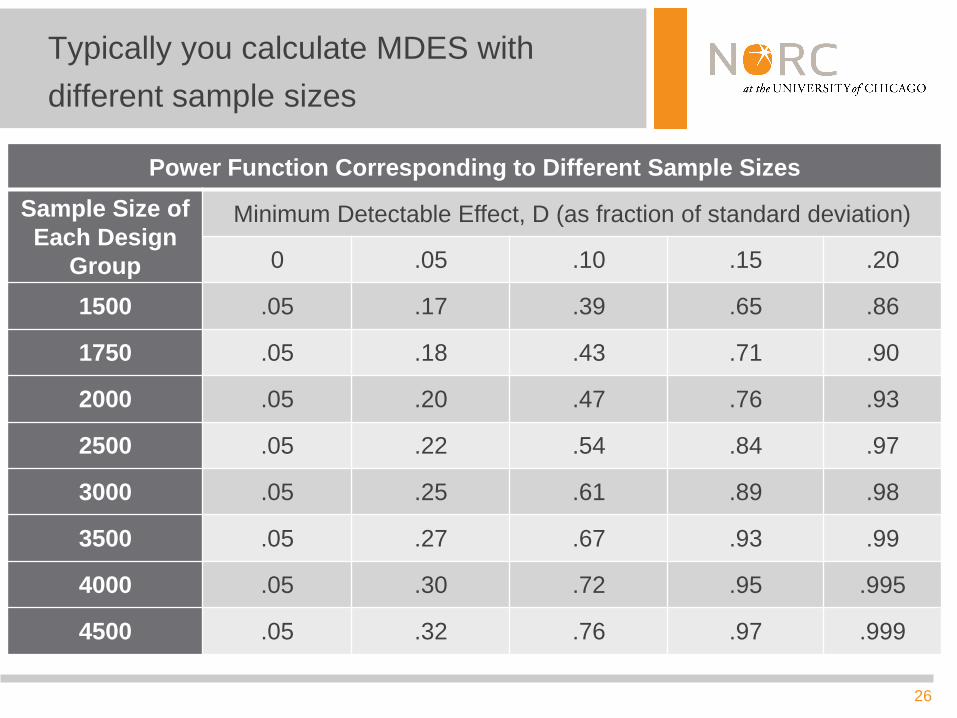
Typically you calculate MDES with
different sample sizes
Power Function Corresponding to Different Sample Sizes
Sample Size of
Each Design
Group
Minimum Detectable Effect, D (as fraction of standard deviation)
0 .05 .10 .15 .20
1500 .05 .17 .39 .65 .86
1750 .05 .18 .43 .71 .90
2000 .05 .20 .47 .76 .93
2500 .05 .22 .54 .84 .97
3000 .05 .25 .61 .89 .98
3500 .05 .27 .67 .93 .99
4000 .05 .30 .72 .95 .995
4500 .05 .32 .76 .97 .999

27
Evaluation Design
Sample Design
Evaluation Design and Sample Design...
Allow for
estimation and
hypothesis testing
of the impacts!!!

How does this all tie together?
In the case of the Phase 1 Water Hibah?
29
• Provision of services to villages and households under the Water
Hibah is not determined by randomization, but by assessment and
WTP.
• The dataset design exhibits some characteristics of a controlled
experiment with connected and unconnected, but connection decision
is not determined by randomization.
• Household matching is not an efficient method with the potential
discrepancies we identified in the pilot test, and does not work very
well with the sample design that was chosen.
• Village-level matching is not feasible because there are usually
connected and unconnected in a single village (locality).
• The design we have chosen is: pretest-posttest-nonequivalent-
control-group quasi-experimental design that will use
regression-adjusted Difference-in-Difference impact
estimators.
An example: Socio-econ impact of Endline Water Hibah

30
• Outcome indicators: we have simplified versions of them
in the baseline, but they have been modified for endline
Use baseline dataset to calculate ICCs.
• Highest variation in outcome indicators was identified across
villages (localities) primary sample unit is the village.
• The # of households in the village was found to improve the
efficiency of the design stratify villages based on the # of
households
• Marginal costs of village visit vs. household visit were
included.
• The final sample design that was identified is referred to
as: Stratified Multi-stage sampling with 250 villages and
7-14 households per experimental group = 7,000 hhs.
.
An example: Socio-econ impact of Endline Water Hibah

Data Collection Managment
Now that we have a design in place… what do you do?
32
• Initial Steps
• Publicity
• Coordination with local officials
• Recruitment of Staff
• Training
• Piloting
• Fielding
• Field Control
Training & Field Control…

33
• Conduct an awareness campaign
• Have a regular column in a newspaper
• Have regular segments in the broadcast media
• Prepare brochures for distribution.
• Sometimes this is not feasible, but it is nice to
make your eligible sample aware of the possibility
that they will be surveyed.
Publicity
34
• Ministry Officials
• Local Officials
• Local VIPs/Village Leaders
• Key Stakeholders
• IndII projects involve a number of parties (i.e.,
LGs, PDAMS, households, etc.) What are the
coordination efforts taken on IndII projects?
Coordination

35
Field Managers
• Tracking and reporting on field issues
• Applying the field sampling methodology
• Assigning units for enumeration
• Disposition of cases and field validation checks
• Completing the central office receipt control
sheets
• Giving out daily assignments to Field Interviewers
and ensuring that daily data collection activities
run smoothly
Team Composition

36
Editors
• Applying the field sampling methodology
• Field checking each completed survey for internal
consistency and completeness
• Disposition surveys as complete
• Assuring that surveys are receipted appropriately
and delivered to the central office for data entry
Team Composition
37
Enumerators
• Completing the interviews and ensuring that all
appropriate units are surveyed
• Assisting supervisors in applying the field
sampling methodology
• Data checks and editing
• Documenting the status of particular cases and
assigning disposition codes
Team Composition

38
Thorough training is essential to ensure that both
the interviewers and supervisors have the
necessary knowledge and skills to collect valid
and reliable data. The purpose of training is to:
• Ensure a standardized application of the survey
materials
• Clarify the rationale of the study and study protocol
• Motivate interviewers
• Provide practical suggestions
• Improve the overall quality of the data
• Allow 2-3 weeks for training and pilot testing
Training is essential!!!
39
• Opening and logistics of training
• Introduction to the Project
• Survey design and methodology
• Sampling and enumeration
• Introduction to field supervision
• Detailed review of each survey module
• Survey logistics
• Role playing and interview techniques
• Gaining cooperation
• Reducing Bias
• Ethics in survey research
• Gender issues in conducting an interview
• Controlling an interview - Probing
Training topics
40
• The main purpose of pilot testing is to catch potential
problems before they become costly mistakes.
• It is typically used if an instrument or method of data
collection is being used for the first time or for the first
time with a particular group.
• Pilot testing provides information on how long data
collection can be expected to take and a preview of how
difficult items will be to complete.
• The latter is important as, with proper advanced notice, you can
modify questions and possibly even the way you collect
information
Pilot testing is mandatory…

41
Valid and reliable data is based on rigorous
quality control standards
• Observation
• Editing
• Spot Checks
• Re-interviews
• Validation
Quality Control is crucial…

For tomorrow…
We will talk more about quality control and questionnaire
design practices.

43
Tuesday - Session 1
INTRODUCTION AND OVERVIEW
1) Introduction
2) Why is evaluation valuable?
3) What makes a good evaluation?
4) How to implement an evaluation?
Wednesday - Session 2
EVALUATION DESIGN
5) Causal Inference
6) Choosing your IE method/design
7) Impact Evaluation Toolbox
Thursday - Session 3
SAMPLE DESIGN AND DATA COLLECTION
9) Sample Designs
10) Types of Error and Biases
11) Data Collection Plans
12) Data Collection Management
Friday - Session 4
INDICATORS & QUESTIONNAIRE DESIGN
1) Results chain/logic models
2) SMART indicators
3) Questionnaire Design
Outline: topics being covered
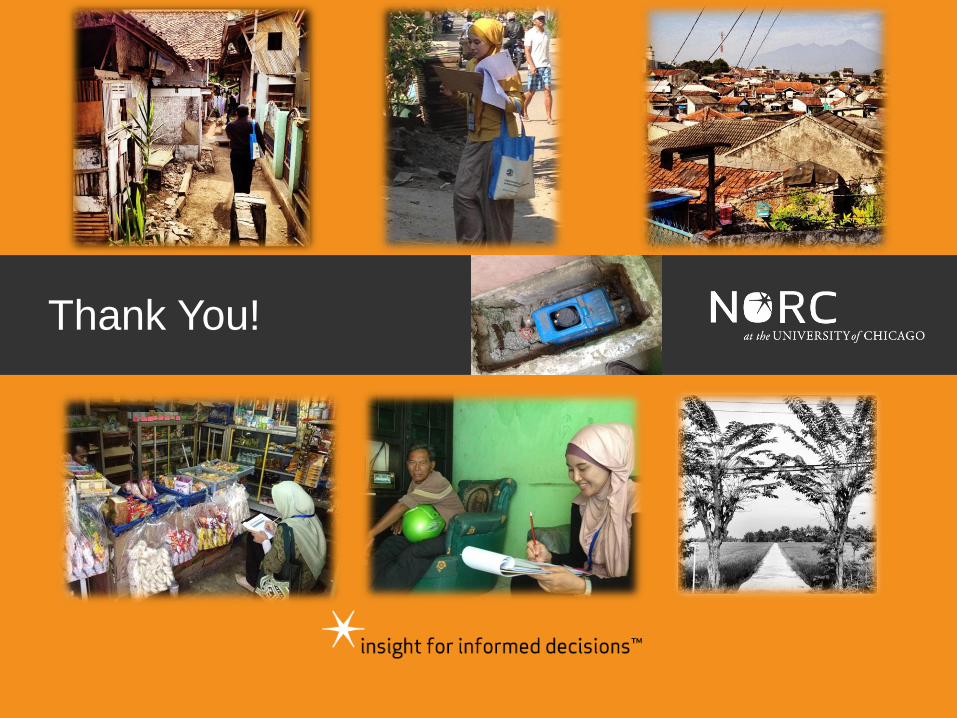
Thank You!

MEASURING RESULTS
From Promises into Evidence IMPACT EVALUATION
AND
This material constitutes supporting material for the "Impact Evaluation in Practice" book. This additional material is made freely but please acknowledge its use as follows: Gertler, P. J.; Martinez, S., Premand, P., Rawlings, L. B. and Christel M. J. Vermeersch, 2010, Impact Evaluation in Practice: Ancillary Material, The World Bank, Washington DC (www.worldbank.org/ieinpractice). The content of this presentation reflects the views of the authors and not necessarily those of the World Bank.
Some of the data collection management material was developed by Adam Ross
![[ftp tt] Engineering Design Sample Titlemhhe.com/designwebsite/SEM_Interiors/SEMint02.pdf · Engineering Design Sample Title [ftp_tt] Engineering Design Sample Title Second Edition](https://static.cupdf.com/doc/110x72/5e759b0bbbce06708c4cfe82/ftp-tt-engineering-design-sample-engineering-design-sample-title-ftptt-engineering.jpg)