Session 1
Database Marketing

Agenda
Administrative Course Work – Group/Individual Syllabus
Course Overview Regression Analysis Introduction to SAS

Group Work
Two Assignments Part I (3%) – run the SAS code
Email the SAS output to the TA: [email protected] More details on how to save output later!
Part II (12%) – analyze the output Answer questions in the assignment based on the results
Term Project Part I (10%) – group presentation Part II (20%) – group report
Individual Work
Midterm Exam (40%) – tested on material covered in weeks 1-4
Peer Evaluation
No Final Exam!

What the Course does NOT cover?
Hardware/Software issues related to database management systems
Building a Marketing Database Neural Networks/Genetic Algorithms

What does the course cover?
Relationship between variables (Chapters 18, 19) Simple/Multiple Regression analysis
Segmentation Analysis (Chapter 21) Cluster Analysis Data reduction technique – Factor Analysis
Response Analysis (Chapters 20, 28, 29, 30) Regression Analysis Discriminant Analysis Logistic Regression

Database Marketing? Managing a computerized relational database system, in real
time, of comprehensive up-to-date, relevant data on customers,
inquiries, prospects and suspects, to identify our most
responsive customers for the purpose of developing a high
quality, long-standing relationship of repeat business by
developing predictive models which enable us to send desired
messages at the right time in the right form to the right
people – all with the result of pleasing our customers, increasing
our response rate per marketing dollar, lowering our cost per
order, building our business and increasing our profits. -
National Center for Database Marketing

What is the Big Deal?
All customers are not created equal! 80% of all repeat business of goods and
services comes from 20% of the customer base
Lot of direct marketing efforts are misdirected resulting in lower payoffs Credit card mailings
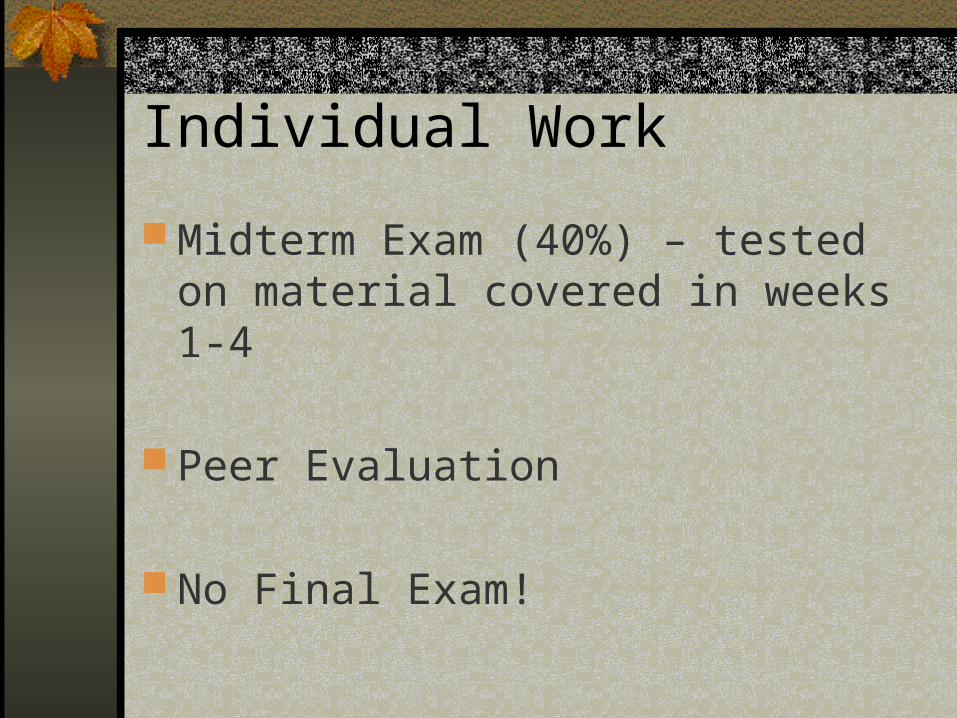
Direct Marketing vs Database Marketing
My view: Direct Marketing done well is Database
Marketing
Read Chapter 32

Market Research Techniques?
Will always continue to be helpful Earlier …
A mutual fund company could tell that 20% of 40-45 year old males making $50-$75K were interested in investing in mutual funds
But which 20%?
Now They can probably tell
Why?
Increased
Data
Availability!

Data Sources (chapter 4)
Transaction Data Easily available with increased use of
scanners Prospect Data
Either maintained or acquired Directly Supplied Data
Data that is provided directly by customers Data acquired from third-party

Data Sources …contd.
Directly Supplied Data Demographic Attitudinal – preferences, met/unmet needs,
lifestyle preferences, values, opinions etc. Behavioral – purchase/buying habits etc.
Traditionally acquired by conducting surveys Advances in the database technology,
precipitous drop in the price of computing/storage, rapid diffusion of the internet all aid the collection of this data

Where are We Now?
Firms have access to a reasonable amount of customer data
Certainly enough to enable them to do better job of marketing
More consumer data is certainly desirable
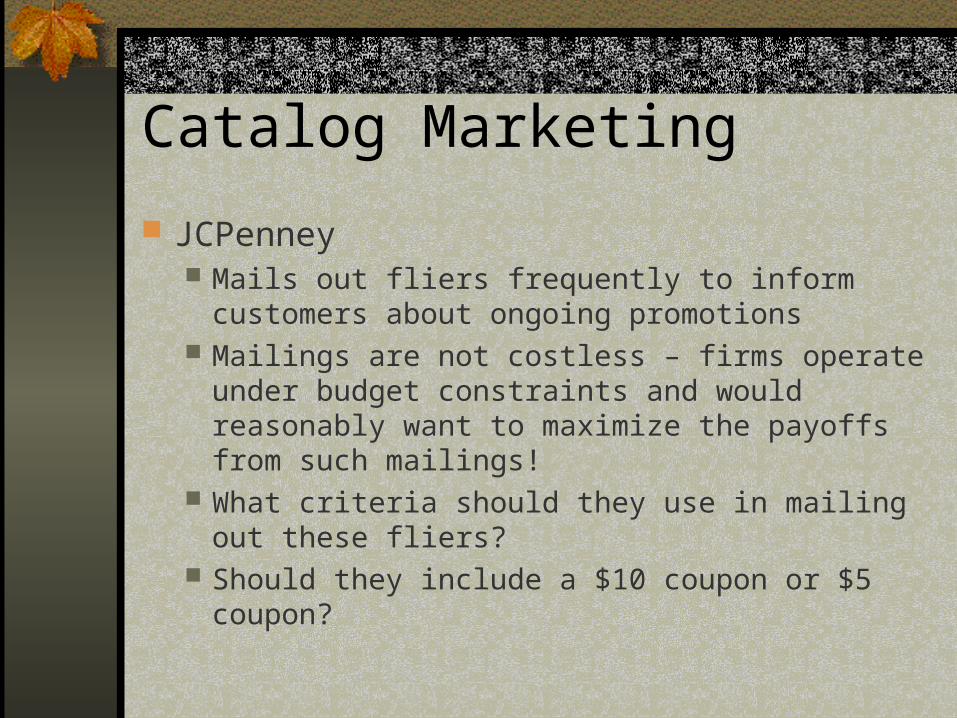
Catalog Marketing
JCPenney Mails out fliers frequently to inform customers
about ongoing promotions Mailings are not costless – firms operate under
budget constraints and would reasonably want to maximize the payoffs from such mailings!
What criteria should they use in mailing out these fliers?
Should they include a $10 coupon or $5 coupon?

Fund Raising
Non-Profit Organizations Solicit Donations – solicitation process
costly Who should they solicit? What amount should they solicit? Is the
amount solicited too high or too low?

Admission Process
Schools may wish to manage the matriculation process efficiently
Schools send out marketing materials to prospective students – some students may seek application material
Schools invest additional (costly) marketing efforts – are these even worthwhile if the student is not likely to matriculate?
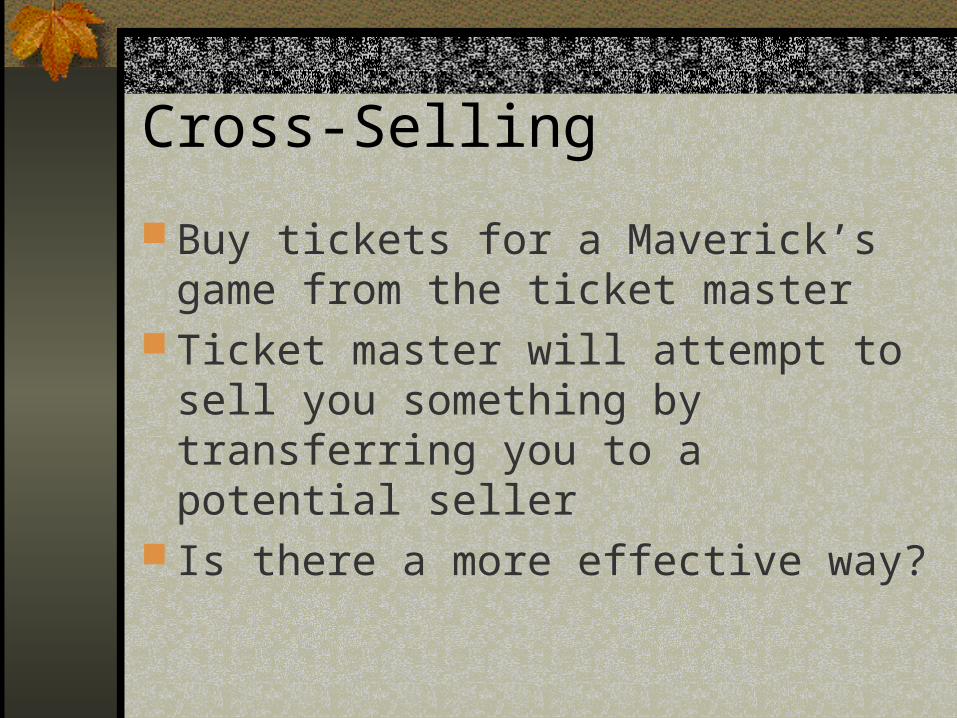
Cross-Selling
Buy tickets for a Maverick’s game from the ticket master
Ticket master will attempt to sell you something by transferring you to a potential seller
Is there a more effective way?

Communication Strategies
BMW recently introduced an SUV to compete with the Mercedes’ M-series In which magazines or cable programs
should they advertise? What should the advertising copy
emphasize? ….. countless other applications !!

Economics of Database Marketing
Trade-offs Short-term costs vs long-term pay-offs Inter-relationship between costs and pay-
offs
Benefits of Segmentation

Big Picture Understand customer behavior Segment customers based on behavior Establish link between (possible)
behavior and identifiable (or targetable) characteristics of customers
Target using above

Hot Picture
Behavior
Segment 1
Segment 2
Secondary
Data
Distinguishing
Characteristics Targeting

Hotter Picture
Behavior
Segment 1
Segment 2
Secondary
Data
Distinguishing
Characteristics Targeting
Factor Analysis Cluster
Analysis
Discriminant/Logit Analysis

Putting things in Perspective
Core Marketing Concepts Segmentation Targeting Positioning
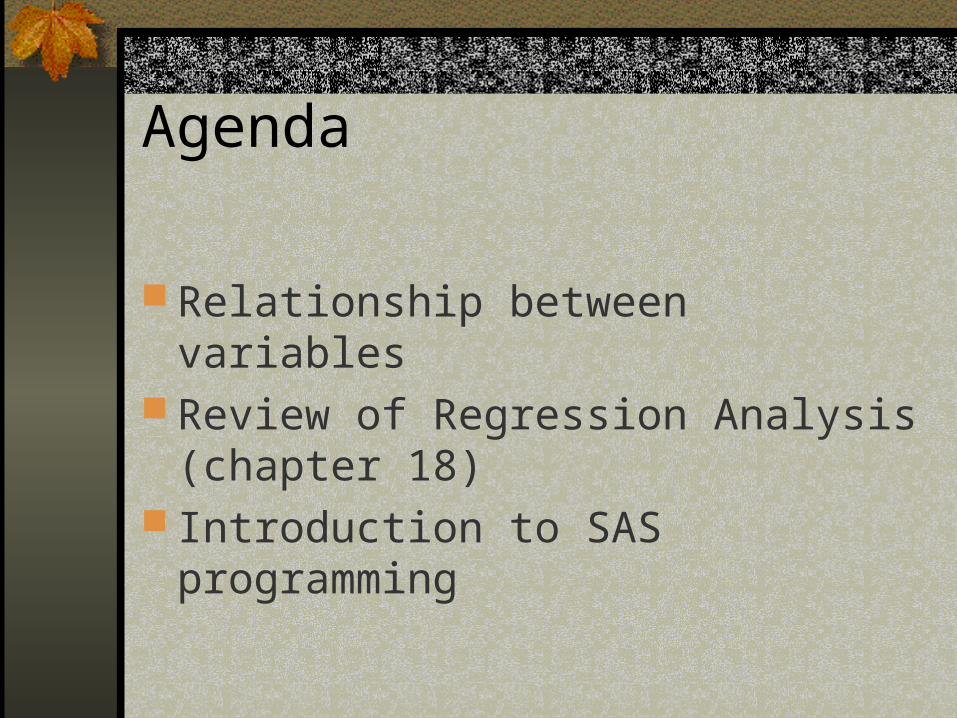
Agenda
Relationship between variables Review of Regression Analysis (chapter
18) Introduction to SAS programming

Data (chapter 18)
Catalog New Old
A 50 0
B 0 50

RelationshipP
erce
ntag
e bu
ying
A
New Old

Data
Catalog Old New
A 500 500
B 500 500

RelationshipP
erce
ntag
e bu
ying
A
New Old
Data
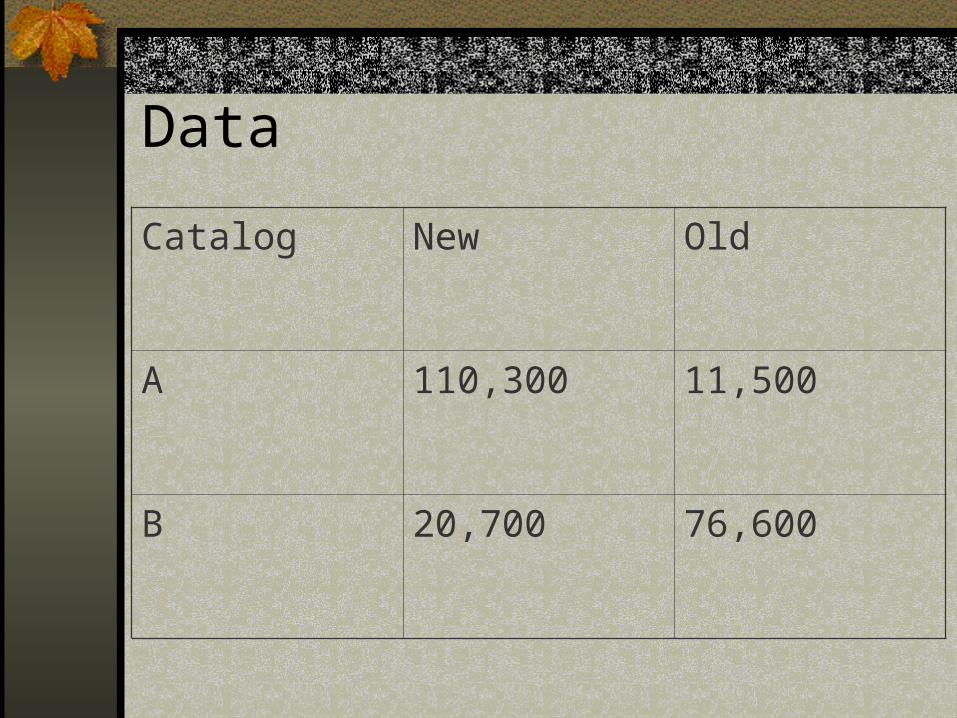
Catalog New Old
A 110,300 11,500
B 20,700 76,600

RelationshipP
erce
ntag
e bu
ying
A
New Old

Correlation Coefficient (r)
Statistical measure of the strength of relationship between two variables
r [-1,1] r [0,1] indicates a positive relationship r [-1,0] indicates a negative relationship

Know your Data
Sample should be representative of the population data
Reason why experts advocate the use of random samples

Regression Analysis
What does it do? Uncovers the relationship between a set of
variables
Simple Regression
y = f(x) Regression sets out to find the f(x) that
best fits the data

Assumptions:
f(x) is known up to some parameters So f(x) = a + bx Problem: Find a, b that best fit the data
An Example: Weight = a + b*Height

How does it Work?
Finds a, b that best fit the data Further assumptions:
Weight = a + b*Height + error Error is distributed normally: N(0, 2) Criteria – finds a, b that minimize the sum
of squared errors.

Picture

Return to Catalog Example
Hypothesis: Customers who purchase more
frequently also buy bigger ticket items
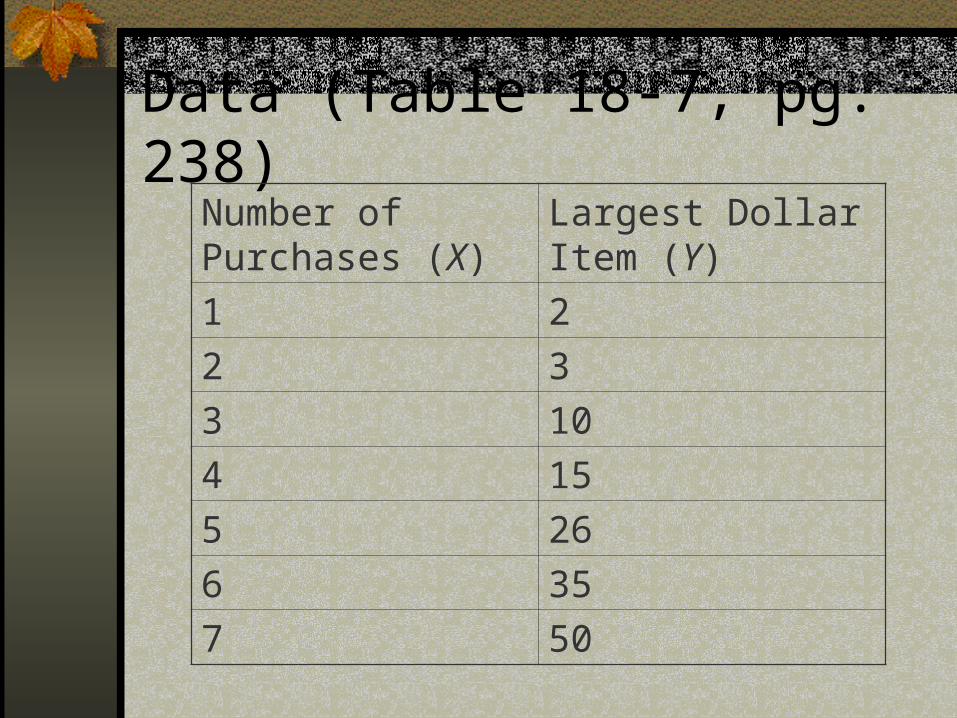
Data (Table 18-7, pg. 238)Number of Purchases (X)
Largest Dollar Item (Y)
1 2
2 3
3 10
4 15
5 26
6 35
7 50

Regression Model
Y = a + b X + error
Estimates: a = -18.22 b = 10 Goodness of Fit Measure: R2 = 0.946

Diagnostics
Linearity Assumption Y is linear in X – does this hold? If not transform the variables to ensure that
the linearity assumption holds Common Transforms: Log, Square-root,
Square etc.

Plot Y vs. X (r=0.97)
Y vs X
0102030405060
0 5 10
X
Y Series1

Plot Y1/2 vs. X (r=0.99)
Sqrt(Y) vs X
0
1
2
3
4
5
6
7
8
0 2 4 6 8
X
Sq
rt(Y
)
Series1

Regression Model
Y 1/2= a + b X + error
Estimates: a = 0.108845 b = 0.984 Goodness of Fit Measure: R2 = 0.9975

Obsession with R2
Can be a misleading statistic R2 can be increased by increasing the
number of explanatory variables R2 of a bad model can be higher than
that of a good model (one with better predictive validity)

Multiple Regression
Y = b0 + b1 X1 + b2 X2 + …+ bn Xn
Same as Simple Regression in principle
New Issues: Each Xi must represent something unique
Variable selection

Multiple Regression
Example 1: Spending = a + b income + c age
Example 2: weight = a + b height + c sex + d age

Introduction to SAS
SAS is an integrated system of software products that enables you to perform: Data entry, retrieval and management Statistical and Mathematical analysis Report writing Other stuff
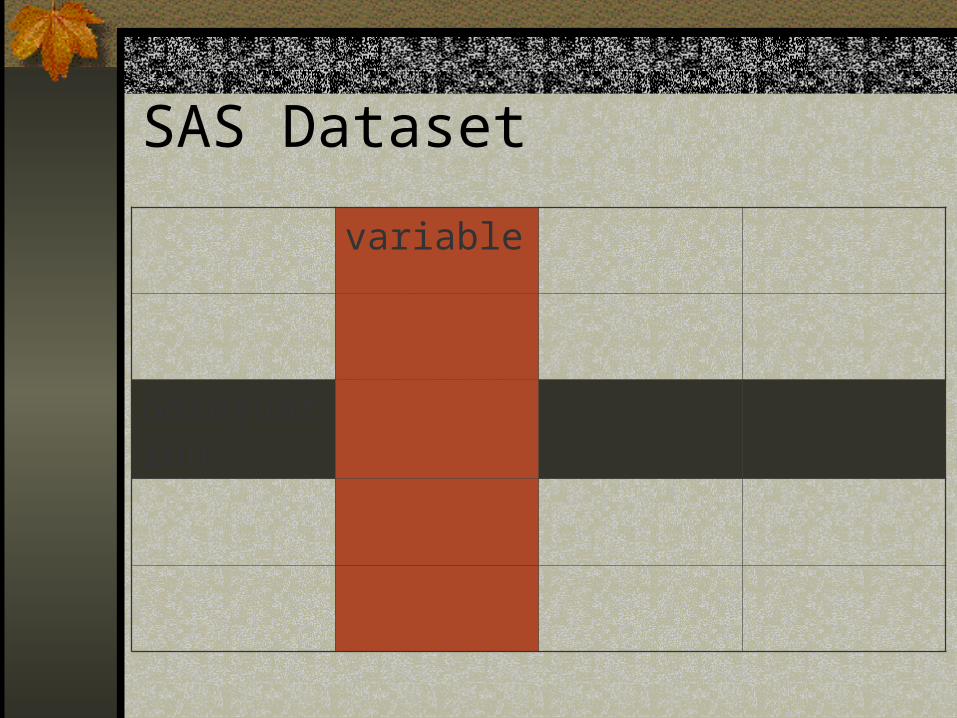
SAS Dataset
variable
observation

DATA Step and SAS Procedures DATA step
Consists of a group of statements that read/manipulate raw data or operates on existing SAS data sets to create a SAS data set
SAS Procedures Work with SAS data sets to help in data
management, statistical analysis etc.

How to Read a raw data (ASCII) file
libname mylib “some directory name”;data mylib.dat1;infile “name of the file” linesize=100 missover;length charvar1 $ 20;length charvar2 $ 5;input numvar1 numvar2 charvar1 $ numvar3 charvar2
$;
You have just read a raw data file with 3 numeric and 2 character/string variables into a SAS data set called dat1

Transforming Variables
newvar = log(oldvar); natural log
newvar = sqrt(oldvar); square root
newvar = oldvar**2; square
Standard Arithmetic Operators

Data Management
Sorting a data setProc sort data=mydata; by <descending> varname;
Merging data setsProc sort data=mydata1; by <descending> varname;
Proc sort data= mydata2; by <descending> varname;
Data targetdataset;
Merge mydata1(in=g) mydata2; by varname;
If g;

Statistical Procedures
Proc Reg data=indata <options>;
Model y = x1 x2 x3;
Proc Factor data= indata <options>;
Var x1 x2 x3;
Proc Cluster data= indata <options>;
Var x1 x2 x3;
SAS Exercises
Read in an Excel Sheet Create some data in excel (you may wish to
replicate the data we used in our regression example)
Use the import feature in SAS to read in the file
Write a regression program to: Estimate the relationship between Y and X Sqrt(Y) and X Y and X2