Section 2.1
Network Forensics
TRACKING HACKERS THROUGH CYBERSPACE
PACKET ANALYSIS

FUNDAMENTALS AND CHALLENGES• Fundamentals
• Protocol analysis
• Packet analysis
• Multipacket stream analysis
• Stream reconstruction
• Challenges
• Not always possible to recover all packets
• Packet data may be corrupted or truncated
• Contents may be encrypted
• Undocumented protocol
• Sheer volume of data
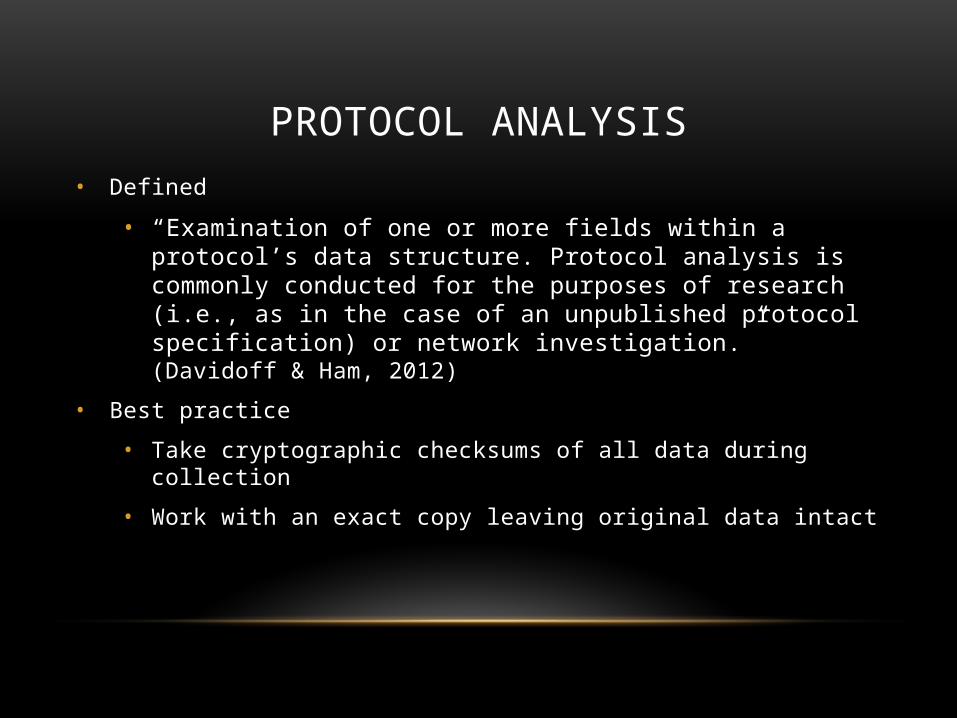
PROTOCOL ANALYSIS• Defined
• “Examination of one or more fields within a protocol’s data structure. Protocol analysis is commonly conducted for the purposes of research (i.e., as in the case of an unpublished protocol specification) or network investigation.” (Davidoff & Ham, 2012)
• Best practice
• Take cryptographic checksums of all data during collection
• Work with an exact copy leaving original data intact
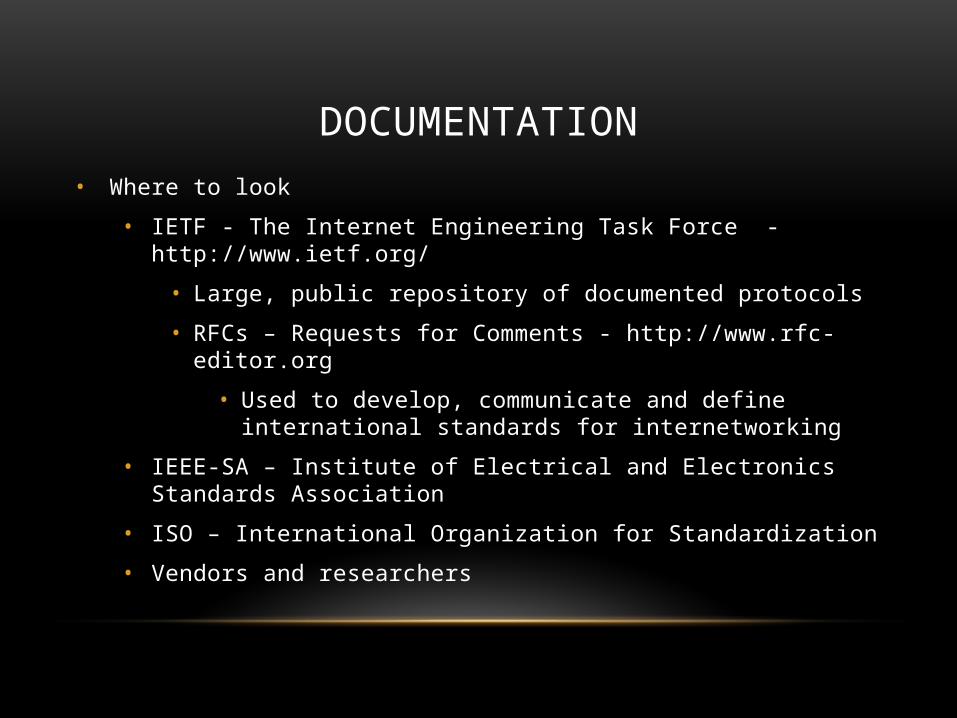
DOCUMENTATION• Where to look
• IETF - The Internet Engineering Task Force - http://www.ietf.org/
• Large, public repository of documented protocols
• RFCs – Requests for Comments - http://www.rfc-editor.org
• Used to develop, communicate and define international standards for internetworking
• IEEE-SA – Institute of Electrical and Electronics Standards Association
• ISO – International Organization for Standardization
• Vendors and researchers
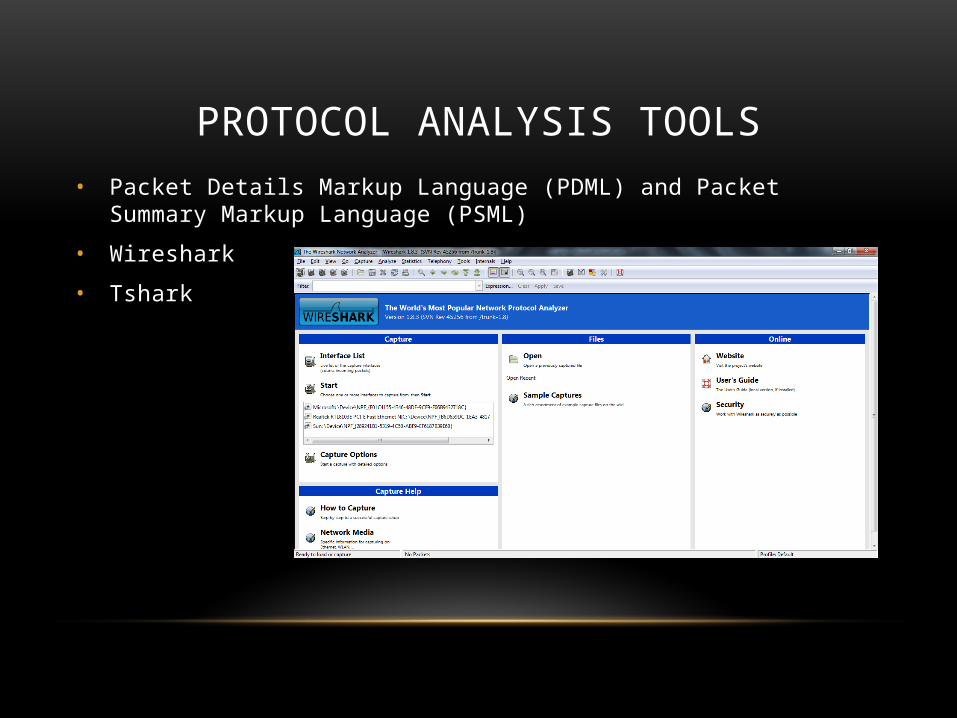
PROTOCOL ANALYSIS TOOLS• Packet Details Markup Language (PDML) and Packet Summary Markup Language
(PSML)
• Wireshark
• Tshark

Image/s clipped from work cited
PACKET DETAILS MARKUP LANGUAGE AND PACKET SUMMARY MARKUP LANGUAGE
• PDML
• Expresses packet details for Layers 2-7 in an XML format
• Example:
• $ tshark -r capturefile.pcap -T pdml
• PSML
• Used for most important details about a protocol also in XML
• Example:
• $ tshark -r capturefile.pcap -T psml
• Part of the NetBee library – support packet processing
• http://www.nbee.org/doku.php
WIRESHARK• Built-in protocol dissectors
• Automatically interprets and displays protocol details within packets
• Allows specific filters
• Default display
• Packet list
• Shows captured packets one per line
• Packet Details
• Shows highlighted packet in the Packet List View in all layers that Wireshark can interpret
• Packet Bytes
• Displays hex and ASCII representations of the packet, including Layer 2

WIRESHARK DISPLAY
TSHARK• Same functionality as Wireshark using command-line interface
• Basic commands
• $ tshark -r capturefile.pcap
• Capture file
• $ tshark -n -r capturefile.pcap
• Disable network naming resolution to show IP addresses and port numbers, -n
• $ tshark -r capturefile.pcap -T pdml
• Select output format using t flag
• $ tshark -r capturefile.pcap -T fields -e frame.number -e ip.addr -e udp
• Prints a specific field, -e flag
• $ tshark -r capturefile.pcap -d tcp.port ==29008 , http
• Decode as, -d
• $ tshark -r capturefile.pcap -R 'ip.addr == 192.168.1.1 '

TSHARK DISPLAY

PROTOCOL ANALYSIS TECHNIQUES• Protocol Identification
• Protocol Decoding
• Exporting Fields
1. HTTP://RACHELSHADOAN.FILES.WORDPRESS.COM/2012/02/SENSEMAKING.PNG?W=490
1.
PROTOCOL IDENTIFICATION• Look for common binary/hex/ASCII values that are associated with specific protocols
• Ex: 0x4500 marks the beginning of an IPv4 packet
• Use information in the encapsulating protocol
• Ex: Byte 9 of the IP header indicates protocol, 0x06 corresponds with TCP
• Use port numbers for TCP/UDP
• Ex: port 443 indicates TLS/SSL, check to see if packet is indeed encrypted
• Analyze the function of the src or dst server
• Use IP address and do a WHOIS lookup
• Look for recognizable protocol structures
• Refer to RFCs
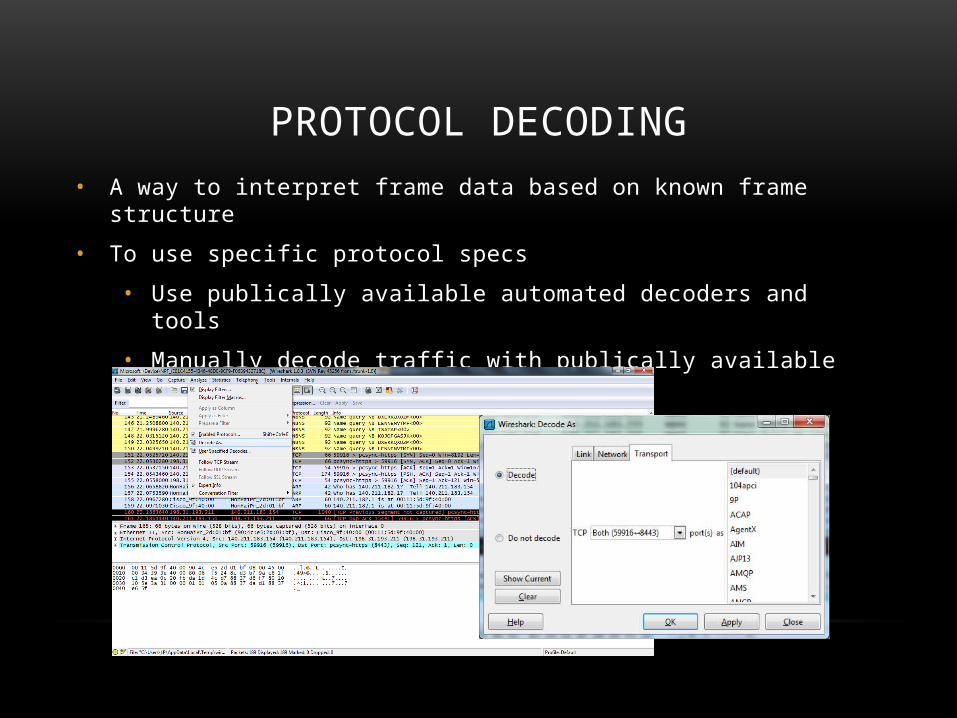
PROTOCOL DECODING• A way to interpret frame data based on known frame structure
• To use specific protocol specs
• Use publically available automated decoders and tools
• Manually decode traffic with publically available documentation
• Write you own decoder
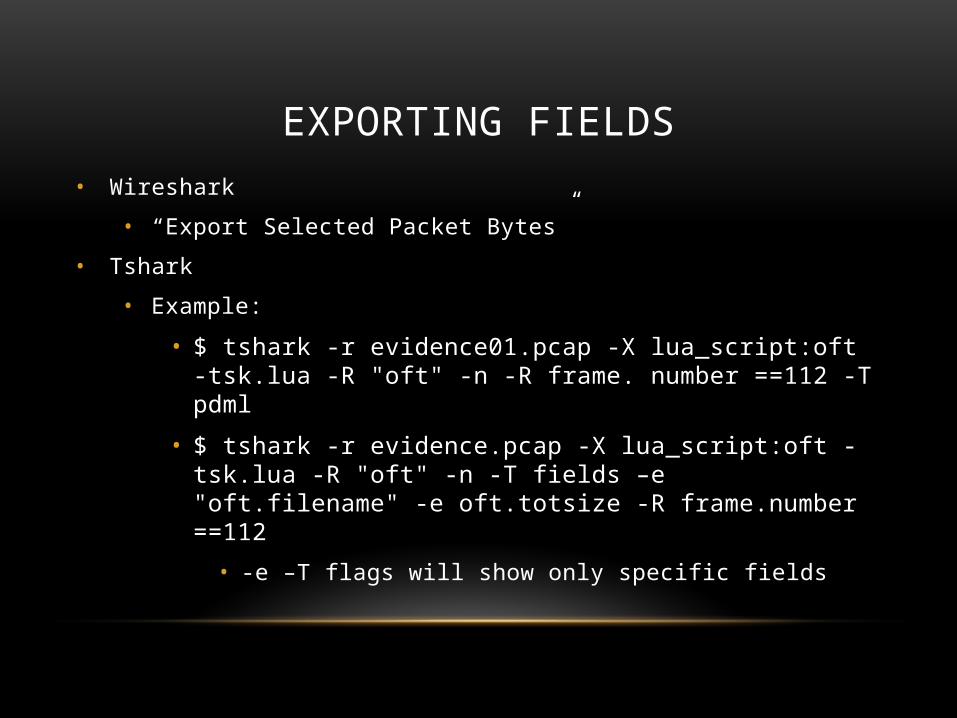
EXPORTING FIELDS• Wireshark
• “Export Selected Packet Bytes”
• Tshark
• Example:
• $ tshark -r evidence01.pcap -X lua_script:oft -tsk.lua -R "oft" -n -R frame. number ==112 -T pdml
• $ tshark -r evidence.pcap -X lua_script:oft -tsk.lua -R "oft" -n -T fields –e "oft.filename" -e oft.totsize -R frame.number ==112
• -e –T flags will show only specific fields

PACKET ANALYSIS• Defined
• “Packet Analysis—Examination of contents and/or metadata of one or more packets. Packet analysis is typically conducted in order to identify packets of interest and develop a strategy for flow analysis and content reconstruction.” (Davidoff & Ham, 2012)

PACKET ANALYSIS TOOLS• Wireshark And Tshark Display Filters
• Ngreg
• Hex Editors

WIRESHARK AND TSHARK DISPLAY FILTERS• Over 105,000 display filters
• Supports open plugin architecture
• Build your own protocol parser
• “Expressions” button to build a filter of your choice
• Tshark uses –R for filters
• Example:
• $ tshark -r capturefile.pcap -R "ip.src ==192.168.1.158 && ip.dst ==10.1.1.10“ 28. “
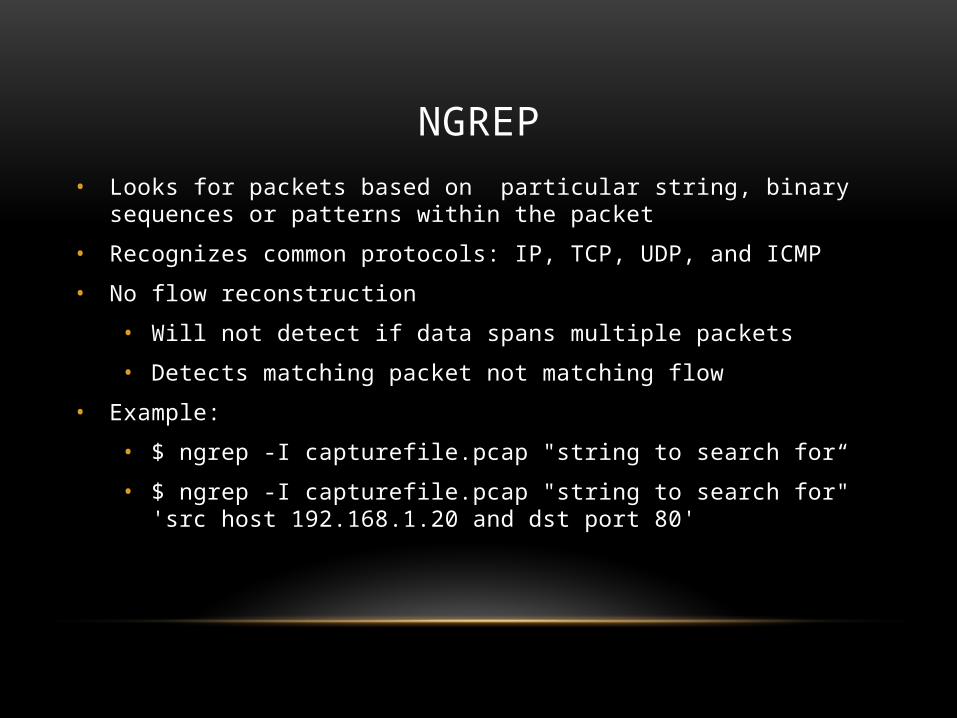
NGREP• Looks for packets based on particular string, binary sequences or patterns within the
packet
• Recognizes common protocols: IP, TCP, UDP, and ICMP
• No flow reconstruction
• Will not detect if data spans multiple packets
• Detects matching packet not matching flow
• Example:
• $ ngrep -I capturefile.pcap "string to search for“
• $ ngrep -I capturefile.pcap "string to search for" 'src host 192.168.1.20 and dst port 80'
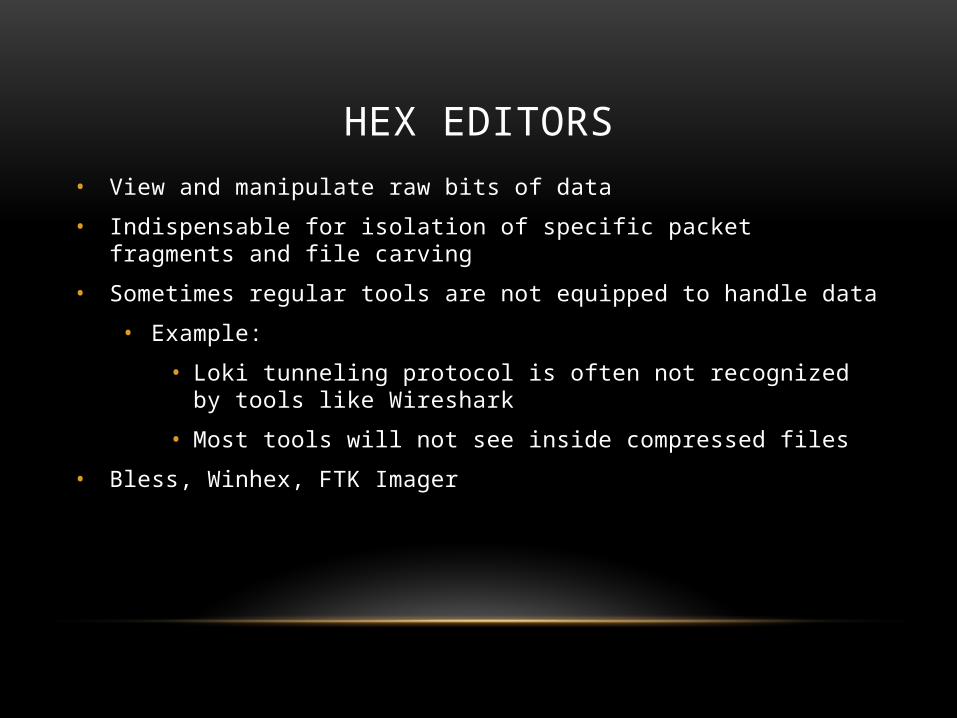
HEX EDITORS• View and manipulate raw bits of data
• Indispensable for isolation of specific packet fragments and file carving
• Sometimes regular tools are not equipped to handle data
• Example:
• Loki tunneling protocol is often not recognized by tools like Wireshark
• Most tools will not see inside compressed files
• Bless, Winhex, FTK Imager
PACKET ANALYSIS TECHNIQUES• Pattern Matching
• Parsing Protocol Fields
• Packet Filtering

PATTERN MATCHING• “dirty word search”
• List of strings, names, patterns that are related to suspect activity
• ngrep is the best tool for these searches
• Example:
• $ ngrep -I evidence01.pcap ‘words|search|for‘
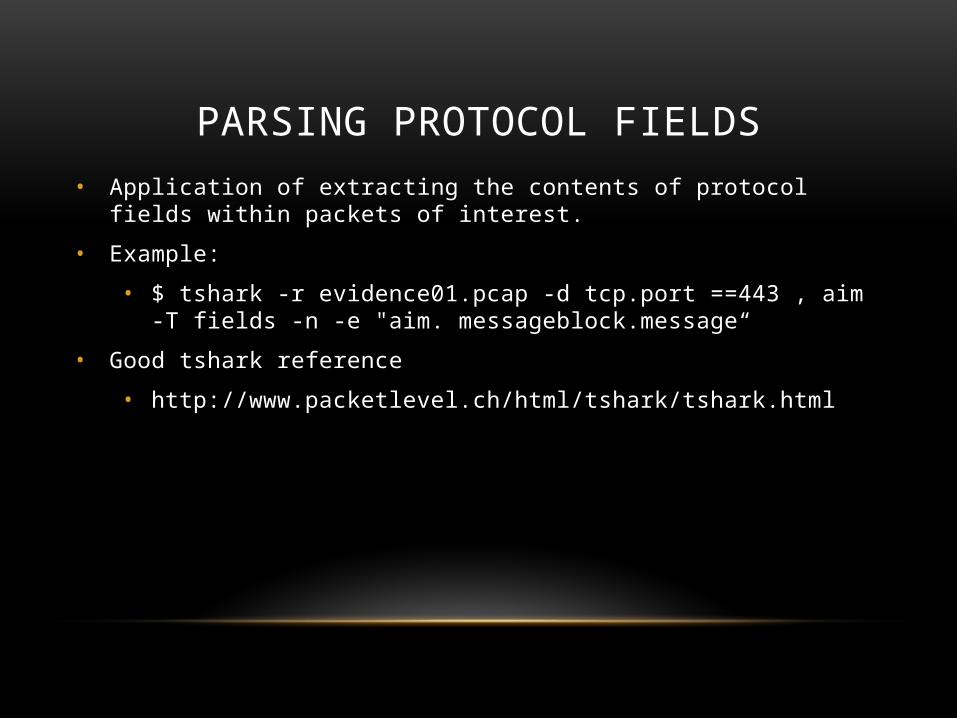
PARSING PROTOCOL FIELDS• Application of extracting the contents of protocol fields within packets of interest.
• Example:
• $ tshark -r evidence01.pcap -d tcp.port ==443 , aim -T fields -n -e "aim. messageblock.message“
• Good tshark reference
• http://www.packetlevel.ch/html/tshark/tshark.html

PACKET FILTERING• “…the art of separating packets based on the values of fields in protocol metadata or
payload.” (Davidoff & Ham, 2012)
• Use tcpdump with a BPF filter to dump out suspicious converstions
• Example using IP addresses
• $ tcpdump -s 0 -r evidence01.pcap -w evidence01 -talkers.pcap 'host 64.12.24.50 and host 192.168.1.158 ‘ Reading from file evidence01.pcap , link -type EN10MB (Ethernet)
• Use Wireshark

Works Cited
Davidoff, S., & Ham, J. (2012). Network Forensics Tracking Hackers Through Cyberspace. Boston: Prentice Hall.


![Hacks/Hackers Lima: Periodistas buscan hackers [de los buenos]](https://static.cupdf.com/doc/110x72/55cf94c2550346f57ba43575/hackshackers-lima-periodistas-buscan-hackers-de-los-buenos.jpg)