QUT Digital Repository: http://eprints.qut.edu.au/
Davey, Jeremy D. and Freeman, James E. and Lavelle, Anita L. (2009) Screening for drugs in oral fluid : illicit drug use and drug driving in a sample of urban and regional Queensland motorists. Transportation Research Part F Traffic Psychology and Behaviour, 12(4). pp. 311-316.
© Copyright 2009 Elsevier

1
Screening for Drugs in Oral Fluid: Illicit Drug Use and Drug Driving in a Sample of Urban and Regional Queensland
Motorists
Jeremy Davey, James Freeman & Anita Lavelle
Centre for Accident Research and Road Safety – Queensland (CARRS-Q)
School of Psychology and Counselling Queensland University of Technology (QUT), Brisbane, Australia
Address for Correspondence: Jeremy Davey, Deputy Director, Centre for Accident Research and Road Safety, CARRS-Q, School of Psychology and Counselling, Faculty of Health, Queensland University of Technology, Beams Rd, Carseldine, Queensland, Australia, 4503. P: +61 7 3138 4574 F: +61 7 3138 4640 [email protected]
Keywords: drug driving, oral fluid, roadside drug screening

2
Abstract
Police services in a number of Australian states and overseas jurisdictions have begun to
implement or consider random road-side drug testing of drivers. This paper outlines
research conducted to provide an estimate of the extent of drug driving in a sample of
Queensland drivers in regional, rural and metropolitan areas. Oral fluid samples were
collected from 2657 Queensland motorists and screened for illicit substances including
cannabis (delta 9 tetrahydrocannibinol [THC]), amphetamines, ecstasy, and cocaine.
Overall, 3.8% of the sample (n = 101) screened positive for at least one illicit substance,
although multiple drugs were identified in a sample of 23 respondents. The most common
drugs detected in oral fluid were ecstasy (n = 53), and cannabis (n = 46) followed by
amphetamines (n = 23). A key finding was that cannabis was confirmed as the most
common self-reported drug combined with driving and that individuals who tested positive
to any drug through oral fluid analysis were also more likely to report the highest frequency
of drug driving. Furthermore, a comparison between drug vs. drink driving detection rates
for one region of the study, revealed a higher detection rate for drug driving (3.8%) vs.
drink driving (0.8%). This research provides evidence that drug driving is relatively
prevalent on Queensland roads, and may in fact be more common than drink driving. This
paper will further outline the study findings’ and present possible directions for future drug
driving research.

3
1. Introduction
Presently, there is an increasingly amount of research effort focused on
determining the prevalence and impact of drug driving on public roads. Firstly,
research has found a strong association between drug driving and culpability, with
accident risk estimated as high as a driver with a blood alcohol content of 0.1 to 0.15
percent (Drummer, Gerostamoulos, Batziris, Chu, Capelhorn, Robertson & Swann,
2003). Secondly, a considerable body of literature is accumulating that has focused on
detecting the presence of drugs in body fluids of those who have been involved in a
crash (Del Rio, Gomez, Sancho & Alvarez, 2002; Drummer et al., 2003). For
example, it has been shown that drug use has been detected in anywhere between 8.8%
and 39.6% of fatally injured drivers (Del Rio et al., 2002; Drummer et al., 2003;
Gjerde, Beylich & Morland, 1993; Mura, Chatelain, Dumestre, Gaulier, Ghysel,
Lacroix et al., 2006; Seymour & Oliver, 1999; Swann, Boorman & Papafotiou, 2004).
In general, the predominant illicit drug found in the systems of the majority of such
drivers is cannabis, with this substance also prevalent among crash-involved, but non-
fatally injured drug drivers. Additionally, use of illicit substances, including the
predominant cannabis substance, among this group is also elevated and has been
reported to be between 2.7% and 41.3% for such drivers (Athanaselis, Dona,
Papadodima, Papoutsis, Maravelias & Koutselinis, 1999; Longo, Hunter, Lokan,
White & White, 2000; Soderstrom, Dischinger, Kerns & Trifillis, 1995; Stoduto,
Vingilis, Kapur, Sheu, McLellan & Liban, 1993; Waller, Blow, Maio, Singer, Hill &
Schaefer, 1997).
However, currently questions remain regarding the prevalence of individuals who
engage in drug driving practices that have yet to be apprehended or involved in a

4
crash. The main avenue for obtaining such information has been through self-report
data provided by motorists, which has indicated that the self-reported prevalence of
drug driving varies markedly between 2% and 90% of respondents, although the
largest body of research suggests between 3% and 10% (Kelly, Darke & Ross, 2004).
Historically, the prevailing view of drug driving in the community is that it is
relatively uncommon amongst the general driving population (Kelly et al, 2004).
However, research has shown that among some subcultures, the percentage of drug
driving may be much higher. For instance, amphetamine use among a sample of
nightclub attendees has been found to be 62% (Akram, 1997), while drug driving
among a sample of cannabis users has been reported to be approximately 82% (Terry
& Wright, 2005). Nevertheless, research has generally indicated that the most common
drugs combined with driving is cannabis (Davey, Leal & Freeman, 2007; Drummer et
al., 2003; Terry & Wright, 2005), which may in part be associated with perceptions
that cannabis does not have a negative impact on driving performance (Terry &
Wright, 2005).
In contrast, research studies that have included the collection of bodily fluids have
predominantly involved drivers who are already suspected of driving under the
influence of alcohol and/or drugs. Currently, a number of drug testing trials are
underway in different countries, however presently only preliminary published
research exists regarding the output of these studies or the strengths and limitations of
the research method. An early oral fluid study conducted in the United Kingdom
reported 4.7% of drivers from a random sample of non-crash drivers were confirmed
positive to the presence of drugs (Buttress, Tunbridge, Oliver, Torrance, & Wylie,

5
2004), while a German study identified illicit substances in 16.8% of a sample of
motorists (Wylie, Torrance, Seymour, Buttress & Oliver, 2005).
One of the first Australian studies, implemented by the Victorian police force,
reported a drug driving prevalence rate of one driver in 40 (2.4%) for cannabis and
amphetamines, which is more than double the positive alcohol-driving rate (Drummer,
Gerostamoulos, Chu, Swann, Boorman, & Cairns, 2007). An even larger detection rate
was reported in a three-year study of police traffic detainees in three Australian states,
as the researchers reported that 70% tested positive to one drug and approximately one
third (e.g., 38%) tested positive to more than one drug (Poyser, Makkai, Norman, &
Mills, 2002). Smaller Australian studies that have focused on young drivers (e.g.,
university students) have also revealed similar results, with between 8.2% and 15% of
motorists reported driving after consuming some form of illicit substance on a yearly
basis (Armstrong, Wills and Watson 2005; Davey, Davey and Obst 2005). These
preliminary findings indicate that drug driving presents as a serious threat to road
safety, and additionally prompts the need for further research to determining the
prevalence of non-crash drug driving rates in Australia.
As a result, the major objectives of this study were to:
• Measure the prevalence of drug driving among a sample of Queensland
drivers in three areas of Queensland; and
• Investigate the self-reported frequency of general motorists’ involvement in
drug driving behaviour.
2. Method
2.1. Participants, Materials and Procedure
6
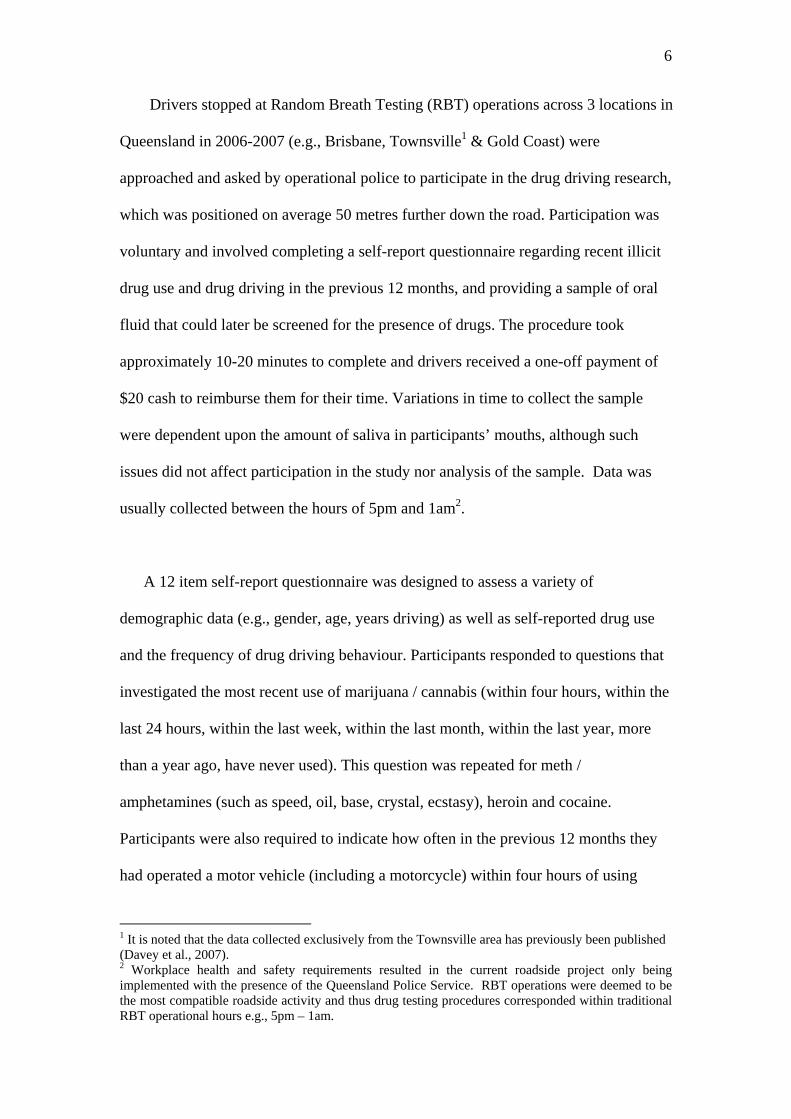
Drivers stopped at Random Breath Testing (RBT) operations across 3 locations in
Queensland in 2006-2007 (e.g., Brisbane, Townsville1 & Gold Coast) were
approached and asked by operational police to participate in the drug driving research,
which was positioned on average 50 metres further down the road. Participation was
voluntary and involved completing a self-report questionnaire regarding recent illicit
drug use and drug driving in the previous 12 months, and providing a sample of oral
fluid that could later be screened for the presence of drugs. The procedure took
approximately 10-20 minutes to complete and drivers received a one-off payment of
$20 cash to reimburse them for their time. Variations in time to collect the sample
were dependent upon the amount of saliva in participants’ mouths, although such
issues did not affect participation in the study nor analysis of the sample. Data was
usually collected between the hours of 5pm and 1am2.
A 12 item self-report questionnaire was designed to assess a variety of
demographic data (e.g., gender, age, years driving) as well as self-reported drug use
and the frequency of drug driving behaviour. Participants responded to questions that
investigated the most recent use of marijuana / cannabis (within four hours, within the
last 24 hours, within the last week, within the last month, within the last year, more
than a year ago, have never used). This question was repeated for meth /
amphetamines (such as speed, oil, base, crystal, ecstasy), heroin and cocaine.
Participants were also required to indicate how often in the previous 12 months they
had operated a motor vehicle (including a motorcycle) within four hours of using
1 It is noted that the data collected exclusively from the Townsville area has previously been published (Davey et al., 2007). 2 Workplace health and safety requirements resulted in the current roadside project only being implemented with the presence of the Queensland Police Service. RBT operations were deemed to be the most compatible roadside activity and thus drug testing procedures corresponded within traditional RBT operational hours e.g., 5pm – 1am.

7
marijuana / cannabis (every day, more than once a week, about once a week, 11 – 20
times, 3 – 10 times, once or twice, never). Once again, this question was repeated for
meth / amphetamines (such as speed, oil, base, crystal, ecstasy), heroin and cocaine.
The majority of data was descriptive and/or categorical, and recorded as percentage
frequencies, and thus, chi-square tests were performed where appropriate.
In addition, oral fluid samples were collected, stored and screened off-site at a later
date using the Cozart® RapiScan oral fluid drug test device. Participants provided a
sample of oral fluid that was collected from inside their mouth via a pad held either
under their tongue or beside the inside of their cheek. The five-panel cannabis and
single-panel methamphetamine / MDMA test cartridges were used (i.e. each sample
was screened twice). Each Cozart® RapiScan kit consisted of a collector, transport
tube containing buffer solution, separator filter tube, pipette and test cartridge. The
five-panel cannabis cartridge detected the presence of benzodiazepines, amphetamines,
cannabis (THC), and cocaine, while the single-panel methamphetamine / MDMA
cartridge detected the presence of methamphetamine and MDMA. There was no
subjectivity in the interpretation of results as the Cozart® RapiScan testing instrument
displayed and printed results.
3. Results
3.1 Sample and Response Rate
A total of 2657 motorists participated in the studies which were conducted over
three regions: (i) Brisbane n = 1587, (ii) Townsville n = 794 & (iii) Gold Coast n =
276. Due to resourcing constraints and the referral process from the Police RBT site,
it was not possible to obtain an accurate measurement of the response rate over the
8
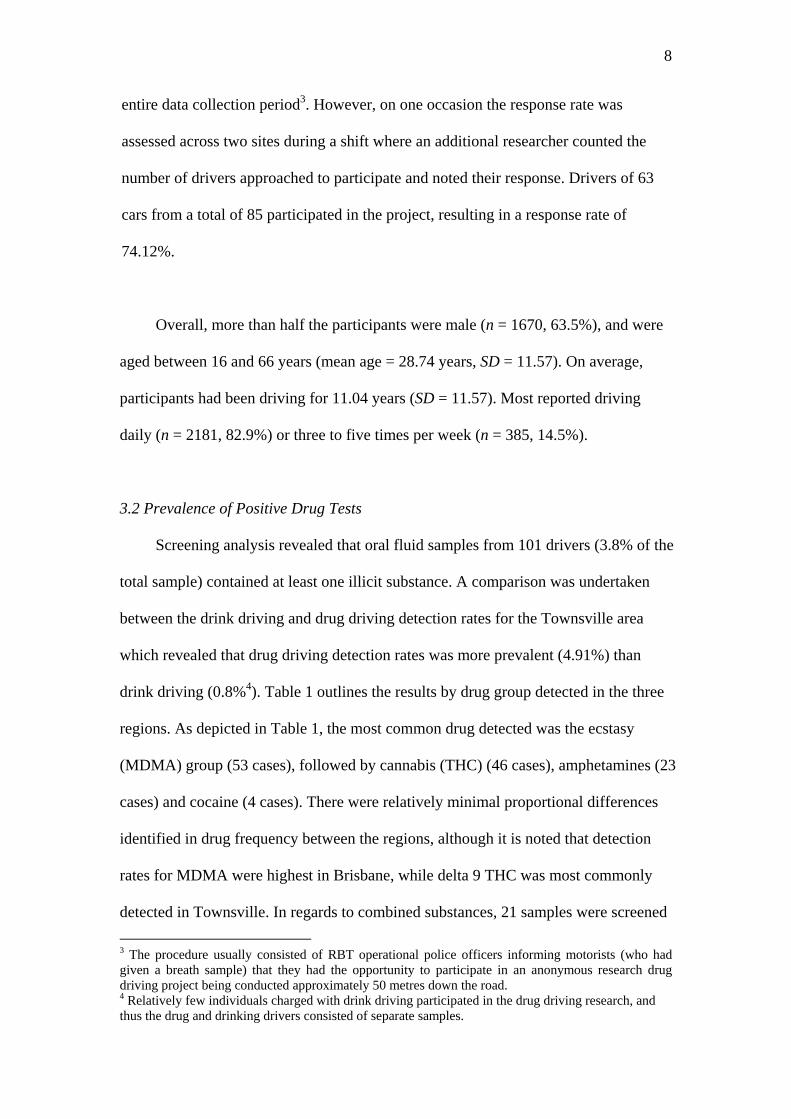
entire data collection period3. However, on one occasion the response rate was
assessed across two sites during a shift where an additional researcher counted the
number of drivers approached to participate and noted their response. Drivers of 63
cars from a total of 85 participated in the project, resulting in a response rate of
74.12%.
Overall, more than half the participants were male (n = 1670, 63.5%), and were
aged between 16 and 66 years (mean age = 28.74 years, SD = 11.57). On average,
participants had been driving for 11.04 years (SD = 11.57). Most reported driving
daily (n = 2181, 82.9%) or three to five times per week (n = 385, 14.5%).
3.2 Prevalence of Positive Drug Tests
Screening analysis revealed that oral fluid samples from 101 drivers (3.8% of the
total sample) contained at least one illicit substance. A comparison was undertaken
between the drink driving and drug driving detection rates for the Townsville area
which revealed that drug driving detection rates was more prevalent (4.91%) than
drink driving (0.8%4). Table 1 outlines the results by drug group detected in the three
regions. As depicted in Table 1, the most common drug detected was the ecstasy
(MDMA) group (53 cases), followed by cannabis (THC) (46 cases), amphetamines (23
cases) and cocaine (4 cases). There were relatively minimal proportional differences
identified in drug frequency between the regions, although it is noted that detection
rates for MDMA were highest in Brisbane, while delta 9 THC was most commonly
detected in Townsville. In regards to combined substances, 21 samples were screened 3 The procedure usually consisted of RBT operational police officers informing motorists (who had given a breath sample) that they had the opportunity to participate in an anonymous research drug driving project being conducted approximately 50 metres down the road. 4 Relatively few individuals charged with drink driving participated in the drug driving research, and thus the drug and drinking drivers consisted of separate samples.
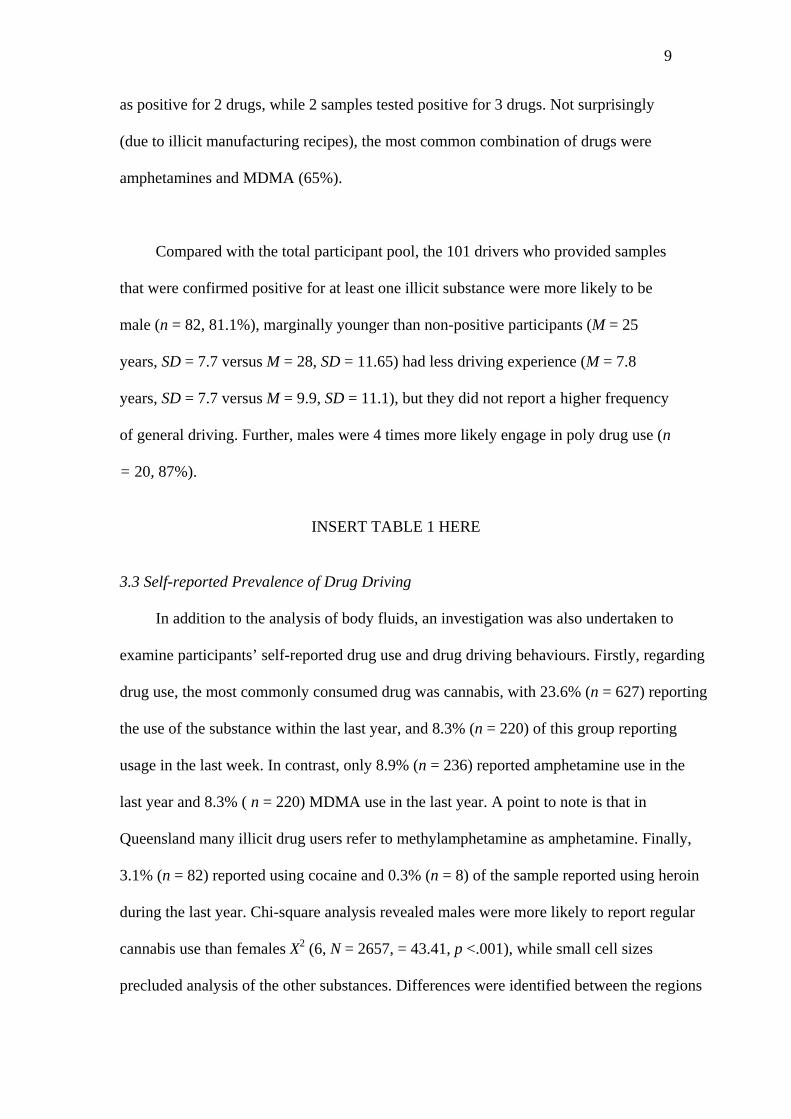
9
as positive for 2 drugs, while 2 samples tested positive for 3 drugs. Not surprisingly
(due to illicit manufacturing recipes), the most common combination of drugs were
amphetamines and MDMA (65%).
Compared with the total participant pool, the 101 drivers who provided samples
that were confirmed positive for at least one illicit substance were more likely to be
male (n = 82, 81.1%), marginally younger than non-positive participants (M = 25
years, SD = 7.7 versus M = 28, SD = 11.65) had less driving experience (M = 7.8
years, SD = 7.7 versus M = 9.9, SD = 11.1), but they did not report a higher frequency
of general driving. Further, males were 4 times more likely engage in poly drug use (n
= 20, 87%).
INSERT TABLE 1 HERE
3.3 Self-reported Prevalence of Drug Driving
In addition to the analysis of body fluids, an investigation was also undertaken to
examine participants’ self-reported drug use and drug driving behaviours. Firstly, regarding
drug use, the most commonly consumed drug was cannabis, with 23.6% (n = 627) reporting
the use of the substance within the last year, and 8.3% (n = 220) of this group reporting
usage in the last week. In contrast, only 8.9% (n = 236) reported amphetamine use in the
last year and 8.3% ( n = 220) MDMA use in the last year. A point to note is that in
Queensland many illicit drug users refer to methylamphetamine as amphetamine. Finally,
3.1% (n = 82) reported using cocaine and 0.3% (n = 8) of the sample reported using heroin
during the last year. Chi-square analysis revealed males were more likely to report regular
cannabis use than females X2 (6, N = 2657, = 43.41, p <.001), while small cell sizes
precluded analysis of the other substances. Differences were identified between the regions

10
on self-reported frequency of drug use, as participants in Townsville reported proportionally
higher frequencies of cannabis use, X2 (12, N = 2657, = 25.531, p =.012), while the Gold
Coast reported highest amphetamine consumption (n = 443, 16.7% within the last year) and
MDMA usage (n = 499, 18.8% within the last year). However, small cell sizes excluded
further chi-square analysis of the regions.
For drug driving, similar to the above findings, the most common substance combined
with driving was reported to be cannabis (see Table 2). Specifically, 4.4% of the sample
reported using cannabis before driving at least once a week, while approximately 1.0%
reported the use of amphetamines, and less than 1.0% reporting cocaine or heroin use while
driving in a week. There were no meaningful significant differences identified between the
regions on self-reported frequency of drug driving. Finally, examination of the self-reported
drug use for the 101 individuals who tested positive to the presence of drugs revealed that
drug driving was most common among these individuals. For example, 68 (67.3%) reported
driving within four hours of using at least one of the drugs outlined on the questionnaire.
This proportion is more than four times the proportion of the total sample of 2657 drivers
that reported drug driving (412 drivers, 15.5%). Furthermore, 32 (55.2%) of the drivers who
provided samples that were confirmed positive for at least one illicit substance reported
drug driving frequently (that is, once a week or more). This is more than 10 times the
proportion of the total sample that reported frequently drug driving (61 drivers, 3.8%).
INSERT TABLE 2 HERE
4. Discussion

11
This paper aimed to report on an investigation into the prevalence of drug driving
in three Queensland regions through both self-reported data and random roadside drug
testing technology. Specifically, the study focused on measuring the self-reported
prevalence of drug driving in three areas, as well as the major drug types that may be
used when driving.
4.1 Prevalence of Positive Drug Tests
The first major finding of the study was that the examination of oral fluid samples
revealed that 3.8% (n =101) of the sample provided a positive illicit drug reading. The
finding is consistent with the small amount of preliminary Australian research that has
focused on randomly drug testing motorists through oral fluid analysis (Drummer et
al., 2007). In addition, the detection rate for drug drivers (in the current case) appears
higher than the corresponding detection rates for drink drivers in Queensland (Davey
et al., 2007; Freeman & Watson, 2006). However, it is noted that these findings are
only preliminary and the data sample for the current study focused only on three
locations for a relatively brief period of time. Secondly, and as previously reported
(Davey et al., 2007) a comparison with the corresponding drink driving detection rates
for the Townsville RBT sites revealed a greater percentage of identified drug drivers
than drink drivers. Whilst only preliminary, the results suggest that a greater
proportion of drivers may be at risk of driving under the influence of drugs, rather than
alcohol, in the early hours of the morning.
Not surprisingly, individuals who tested positive to drugs were more likely to be
young drivers, with lower levels of driving experience. Importantly, while males were
more likely to test positive for illicit substances, a sizeable proportion of females also
12
tested positive, which indicates this group is also at risk of driving after consuming
drugs. The results are somewhat consistent with general drug research that has
consistently indicated that males are more likely to consume illicit substances than
females (Davey et al., 2007). However, it is noteworthy that males were more likely
to test positive to poly drug use (n = 20, 87%).
Interestingly, a proportion of the sample that were screened positive contained
more than one amphetamine type substance. One possible explanation for the
detection of multiple illicit drugs is the manufacturing process, as recreational “party”
drugs (e.g., ecstasy) are likely to contain more than one substance. Examination of the
self-reported data revealed that cannabis was the most frequently consumed illicit
substance, and not surprisingly, was also the most frequent self-reported drug to be
used when driving. This finding is again consistent with self-report research that
indicates cannabis is the most commonly combined drug with driving (Davey et al.,
2007; Drummer et al., 2003; Terry & Wright, 2005), although it is noted that drug
detection rates may prove to vary with specific locations. However, a greater number
of amphetamines were detected through the screening process in the current study.
Further research is required to determine whether this finding is a data anomaly,
screening issue or if amphetamines, are in fact, more likely to be combined with
driving in the late evening and early hours of the morning. A more consistent finding
was that individuals who tested positive to the drug testing process also reported the
highest rate of drug driving, which provides support for the drug screening process.
Finally, there were few differences identified between the regions on key measures
such as the number of positive samples or self-reported drug driving behaviours. The
13
results indicate that drug driving may prove to be a state-wide problem and that drug
testing may have the capacity to detect a considerable proportion of drug drivers.
4.2 Limitations
When interpreting the findings, a number of methodological limitations related to
the study should be kept in mind. The generalisability of the results in this study may
be limited, as the data was sampled from specific areas of Queensland, and it is
therefore expected that the prevalence of drug use (and therefore, drug driving) may
fluctuate by area due to issues relating to the supply, demand and cost of drugs. In
addition, the sample was skewed towards the younger age groups (M = 28 years) even
though a large age range was detected. Conversely, the sample may be representative
of a peak drug driving period, at night on weekends when this sample was taken.
However, it is possible that drug driving rates may increase or decrease further into the
early hours of the morning as well as during the day, given that data for this sample
was only collected between the hours of 5pm and 1 am. Further, the prospect of self-
report and volunteer bias persists, and even though the Queensland Police Service
were not specifically involved in the study, it is possible that operational officers’
presence at the research site deterred some individuals from participating (especially
those under the influence of drugs). Uncertainties also remain about the reliability of
saliva testing for illicit drugs, as environmental contaminations may negatively impact
on the accuracy of saliva testing, such as a person’s presence in an area where
cannabis is being smoked (e.g., Davey et al., 2007). Furthermore, this testing
approach requires samples to be stored at specific temperatures, and any variations
may negatively impact upon the accuracy of the results. Additionally, this study does
not include confirmatory analysis, which would have further improved the accuracy of

14
the results. Taking this into consideration, it would be ideal to replicate and/or expand
the present study with a wider sample from urban, regional and rural areas across
Queensland.
Overall, this study has provided evidence that driving under the influence of
drugs may be comparatively prevalent in some areas of Queensland and therefore drug
driving may present as a critical issue in road safety. In attempt to reduce drug driving,
the recent induction of random roadside drug testing legislation in Queensland appears
to be an important development. Previous research has suggested that perceptions of
apprehension uncertainty are an important factor in deterring both drug drivers
(Davey, Davies, French, Williams, & Lang, 2005) and drink drivers (Piquero &
Pogarsky, 2002) from engaging in criminal behaviours. As a result, the
implementation of the new detection method has the potential to influence the
prevalence of drug driving. In addition, further research may benefit from examining
motorists’ current perceptions concerning the probability of being detected for drug
driving, and their corresponding beliefs about the effectiveness and impact of saliva
testing on the prevalence of offending. Such information would offer further
information concerning the most effective system to implement and reinforce the
deterrent factor of random roadside drug testing. Conversely, further investigation into
the prevalence, effect and prevention of drug driving can only help with the
development and implementation of effective countermeasures targeted at decreasing
the burden of drug driving on road safety.

15
Acknowledgements:
This project was funded by an internal Centre for Accident Research and Road Safety
– Queensland / Motor Accident Insurance Commission grant, and was granted ethical
approval by the Queensland University of Technology Human Research Ethics
Committee. A major strength of the study, and the key to its successful
implementation and completion, was the collaborative relationship between the
researchers and representatives from the Queensland Police Service. Without their
support, this project would not have been possible.
16
References
Akram, G. (1997). Patterns of use and safety awareness amongst users of dance drugs
in Nottingham. MPH Thesis, Nottingham School of Public Health, University
of Nottingham.
Armstong, K, Wills, A, and Watson, B (2005). Psychosocial influences on drug
driving in young Australian drivers. Paper presented at the 2005 Australasian
Road Safety Research, Policing and Education Conference, Wellington, New
Zealand, [CD-ROM].
Athanaselis, S., Dona, A., Papadodima, S., Papoutsis, G., Maravelias, C., &
Koutselinis, A. (1999). The use of alcohol and other psychoactive substances
by victims of traffic accidents in Greece. Forensic Science International, 102,
103-109.
Buttress, S. C., Tunbridge, R. J., Oliver, J. S., Torrance, H., & Wylie, F. (2004). The
incidence of drink and drug driving in the UK – A roadside survey in
Glasgow. Proceedings of the 17th International Conference on Alcohol, Drugs
& Traffic Safety, Glasgow, UK.
Davey, J, Davey, T and Obst, P (2005). Drug and drink driving by university students: an
exploration of the influence of attitudes, Traffic Injury Prevention 6(1):44-52.
Davey, J., Davies, A., French, N., Williams, C., & Lang, C. (2005) Drug driving from a
users perspective. Drugs: Education, Prevention and Policy, 12(1): 61-70.
Davey, J., Leal, N., & Freeman, J. (2007). Screening for drugs in oral fluid: illicit drug
use and drug driving in a random sample of motorists. Drug and Alcohol
Review, 26(3), 301-307.

17
Del Rio, M. C., Gomez, J., Sancho, M., & Alvarez, F. J. (2002). Alcohol, illicit drugs
and medicinal drugs in fatally injured drivers in Spain between 1991 and
2000. Forensic Science International, 127, 63-70.
Drummer, O. H., Gerostamoulos, H., Batziris, H., Chu, M., Caplehorn, J., Robertson,
M. D. & Swann, P. (2003). The incidence of drugs in drivers killed in
Australian road traffic crashes. Forensic Science International, 134, 154-162.
Drummer O. H., Gerostamoulos, H., Chu, M., Swann, P., Boorman, M., & Cairns, I.
(2007). Drugs in oral fluid in randomly selected drivers. Forensic Science
International, 170, 105-110.
Freeman, J., & Watson, B. (2006). An application of Stafford and Warr's
reconceptualisation of deterrence to a group of recidivist drink drivers. Accident
Analysis and Prevention, 38(3), 462 - 471.
Gjerde, H., Beylich, K. M., & Morland, J. (1993). Incidence of alcohol and drugs in
fatally injured car drivers in Norway. Accident Analysis & Prevention, 23(4),
479-483.
Kelly, E., Darke, S., & Ross, J. (2004). A review of drug use and drug driving:
epidemiology, impairment, risk factors and risk perceptions. Drug and Alcohol
Review, 23, 319-344.
Longo, M. C., Hunter, C. E., Lokan, R. J., White, J. M., & White, M. A. (2000). The
prevalence of alcohol, cannabinoids, benzodiazepines and stimulants amongst
injured drivers and their role in culpability. Part I: The prevalence of drug use in
drivers, and characteristics of the drug-positive group. Accident Analysis &
Prevention, 32, 613-622.
Mura, P., Chatelain, C., Dumestre, V., Gaulier, J., Ghysel, M., Lacroix, C. et al. (2006).
Use of drugs of abuse in less than 30-year old drivers killed in a road crash in

18
France: a spectacular increase for cannabis, cocaine and amphetamines.
Forensic Science International, 160, 168-172.
Piquero, A. R., & Pogarsky, G. (2002). Beyond Stafford and Warr’s
reconceptualization of deterrence: personal and vicarious experiences,
impulsivity, and offending behavior. Journal of Research in Crime and
Delinquency, 39 (2), 153-186.
Poyser, C., Makkai, T., Norman, L., & Mills, L. (2002). Drug Driving Among Police
Detainees in Three States of Australia. National Drug Law Enforcement Fund:
Australia.
Seymour, A., & Oliver, J. S. (1999). Role of drugs and alcohol in impaired drivers
and fatally injured drivers in the Strathclyde police region of Scotland, 1995-
1998. Forensic Science International, 103, 89-100.
Soderstrom, C. A., Dischinger, P. C., Kerns, T. J., & Trifillis, A. L. (1995). Marijuana
and other drug use among automobile and motorcycle drivers treated at a
trauma centre. Accident Analysis & Prevention, 27(1), 131-135.
Stoduto, G., Vingilis E., Kapur, B. M., Sheu, W. J., McLellan, B. A., & Liban, C. B.
(1993). Alcohol and drug use among motor vehicle collision victims admitted
to a regional trauma unit: demographic, injury, and crash characteristics.
Accident Analysis and Prevention, 25(4), 411-420.
Swann, P. D., Boorman, M. C., & Papafotiou, K. (2004). Impairment and driving
assessments of drivers given amphetamines, cannabis and benzodiazepines
and oral fluid testing results. Proceedings of the 17th International Conference
on Alcohol, Drugs & Traffic Safety, Glasgow, UK.

19
Terry, P., & Wright, K. A. (2005). Self-reported driving behaviour and attitudes
towards driving under the influence of cannabis among three different user
groups in England. Addictive Behaviors, 30, 619-626.
Waller, F., Blow, F. C., Maio, R. F., Singer, K., Hill, E. M., & Schaefer, N. (1997).
Crash characteristics and injuries of victims impaired by alcohol versus illicit
drugs. Accident Analysis and Prevention, 29(6), 817–827.
Wylie, F. M., Torrance, H., Seymour, A., Buttress, S., & Oliver, J. S. (2005). Drugs in
oral fluid Part II. Investigation of drugs in drivers. Forensic Science
International, 150, 199-204.

20
Tables
Table 1. Number and Proportion of Positive Screening Tests by Drug Group
Total3 N = 2657
Brisbane N = 1587
Townsville N = 794
Gold Coast N = 276
Ecstasy (MDMA) 53 (1.99%) 35 (2.21%) 16 (2.02%) 2 (0.72%)
Cannabis (THC) 46 (1.73%) 20 (1.26%) 20 (2.52%) 6 (2.17%)
Amphetamines 23 (0.86%) 17 (1.07%) 3 (0.38%) 3 (1.08%)
Cocaine 6 (0.22%) 2 (0.13%) 2 (0.25%) 2 (0.72%)
Total Illicit Substances4 128 (4.82%) 74 (4.66%) 41 (5.16%) 13 (4.71%)
___________________________________________________________________ 3 29 respondents did not provide their gender. 4 23 respondents screened positive to more than one drug

21
Table 2. Self-reported Drug Driving Behaviour within Four Hours of Consumption Drug Type Cannabis Amphetamines Ecstasy Cocaine Heroin
n % n % n % n % n % Gold Coast Every day More than once week About once a week 11 - 20 times 3 - 10 times Once or twice Never
6 4 3 3 5 15
238
(2.2) (1.4) (1.1) (1.1) (1.8) (5.4)
(86.2)
0 4 0 5 3 10 253
(0.0) (1.4) (0.0) (1.8) (1.1) (3.6)
(91.7)
1 1 4 4 3 16 246
(0.4)(0.4)(1.4)(1.4)(1.1)(5.8)
(89.1)
0 0 2 2 2 12 257
(0.0) (0.0) (0.7) (0.7) (0.7) (4.3)
(93.1)
1 0 0 0 0 1 273 0 1 0 0 4 5 1568 1 0 0 0 0 2 755
(0.4) (0.0) (0.0) (0.0) (0.0) (0.4)
(98.9) (0.0) (0.1) (0.0) (0.0) (0.3) (0.3)
(98.8) (0.1) (0.0) (0.0) (0.0) (0.0) (0.3)
(99.6)
Brisbane Every day More than once week About once a week 11 - 20 times 3 - 10 times Once or twice
Never
26 20 19 14 18 76 1399
(1.6) (1.3) (1.2) (0.9) (1.1) (4.8)
(88.2)
3 3 12 12 12 28 1509
(0.2) (0.2) (0.8) (0.8) (0.8) (1.8)
(95.1)
1 6 4 7 20 58 1481
(0.1)(0.4)(0.3)(0.4)(1.3)(3.7)
(93.3)
0 0 0 6 5 22
1545
(0.0) (0.0) (0.0) (0.4) (0.3) (1.4)
(97.4)
Townsville Every day More than once week About once a week 11 - 20 times 3 - 10 times Once or twice Never
14 13 10 9 15 63 632
(1.8) (1.6) (1.3) (1.1) (1.9) (8.3)
(84.0)
1 2 3 8 5 17 722
(0.1) (0.3) (0.4) (1.0) (0.6) (2.1)
(95.5)
- - - - - - -
- - - - - - -
1 2 0 0 0 0 755
(0.1) (0.3) (0.0) (0.0) (0.0) (0.0)
(99.6)
• Note: The questionnaire for reporting drug driving behaviour was modified to include ecstasy after testing had been completed in Townsville.