SAFETY TRANSIENTS IN HELICAL COIL STEAM GENERATORS

EVALUATION OF SAFETY TRANSIENTS IN HELICAL-COIL STEAMGENERATORS WITH RELAP5-3D CODE
By CAHIT ALKAN, B.SC.A Thesis Submitted to the School of Graduate Studies in Partial Fulfillment of the
Requirements for the Degree of Master of Applied ScienceMcMaster University ©Copyright by Cahit Alkan, April 2022

McMaster University MASTER OF APPLIED SCIENCE (2022) Hamilton, Ontario(Engineering Physics)TITLE: Evaluation of Safety Transients in Helical Coil Steam Generators with RELAP5-3D CodeAUTHOR: Cahit Alkan, B.Sc. (McMaster University)SUPERVISOR: Professor Adriaan BuijsNUMBER OF PAGES: xi, 70
i
Acknowledgements
To begin, I would like to express my gratitude to my supervisor, Professor Adriaan
Buijs, for his enormous contribution and numerous hours of discussion we had through-
out the course of this effort. Without his support, I wouldn’t be able to complete this
study. Dr. Anuj Trivedi also assisted me with the initialization of steady state results,
which I am quite grateful for. I would also like to thank Professor David Novog and
Professor Nikola Popov for their valuable feedback. Last but not least, I would like to
thank my family and my dear friends for their continuous support in this journey.
ii
Abstract
Around the world, countries are increasingly considering carbon-free energy genera-
tion options as the threat of climate change grows. Small modular reactor designs,
promising such carbon-free energy generation, are thriving worldwide with novel and
innovative technologies that improve safety as well as economic performance. Canada
is also considering small modular reactors (SMRs) as a means of achieving net zero
carbon emissions by 2050.
Some of these reactor designs utilize pressurized water for cooling and moderator.
Reactors with pressurized water have been subjected to steam generator tube ruptures
in the past, and a detailed investigation into the possible consequences of such incidents
in SMRs should be conducted.
In this research, a model for one of the newer designs, the NuScale Integrated Small
Modular Reactor, was developed with the RELAP5-3D code for assessing safety-
related transients. The NuScale Small Modular Reactor incorporates helical coil steam
generators within its reactor pressure vessel, which are more efficient in terms of heat
transfer than the U-tube steam generators that are widely used in nuclear reactors.
In the first part of the research, a detailed model is created and used to obtain steady
state conditions with parameters collected from NuScale’s Final Safety Analysis Re-
port (FSAR). The Steam Generator Tube Rupture event is analyzed in the second part
of the work. Slight differences in the broken and intact steam generator pressures as
well as decay heat removal system flow rates are seen in the comparison of reference
values and calculated results. Among the reasons for those differences could be that
the correlations used by the RELAP5-3D code for heat transfer coefficient and pressure
drop in the helical coil steam generators are different than those of the NuScale pro-
prietary code NRELAP5, with which the analyses have been performed in the FSAR.
Also, post-dryout heat transfer at the exit of helical coil steam generators and evapora-
tor sections could cause differences in the outlet conditions of the steam, resulting in
iii

different mass flow rates as well.
The final section of the research simulates a comparable but more severe tube rup-
ture incident without the availability of decay heat removal systems in order to assess
the reactor’s emergency core cooling system reaction. Passive decay heat removal sys-
tems are crucial components for removing heat after reactor shutdown through heat
exchangers that are submerged in the reactor pool and connected to steam generators
by a closed loop. The containment pressures, the containment wall temperatures, and
the peak fuel clad temperatures are considered to be the key design constraints that
must be observed.
Future work on this subject could include modifying the source code, adding spe-
cific correlations for helical coil steam generators, and comparing the results, as well
as quantifying uncertainties in the SGTR event. Main parameters in the quantification
of uncertainties would be reactor power, single phase and two-phase discharge coeffi-
cients from the break, trip signals and delays as well as break size and location.
iv
Contributors and Funding Sources
The author is extremely appreciative of the opportunity to conduct this work. The Min-
istry of National Education of Turkey financially supported this particular research.
Also, this research made use of the resources of the High Performance Computing
Center at Idaho National Laboratory, which is supported by the Office of Nuclear En-
ergy of the U.S. Department of Energy and the Nuclear Science User Facilities under
Contract No. DE-AC07-05ID14517.
Nomenclature
AC Power - Alternating Current Power
CNSC - Canadian Nuclear Safety Commission
CFR - Code of Federal Regulations
CNV - Containment Vessel
DHRS - Decay Heat Removal System
ECCS - Emergency Core Cooling System
FIV - Flow Induced Vibrations
FSAR - Final Safety Analysis Report
FWIV - Feedwater Isolation Valve
HCSG - Helical Coil Steam Generator
IAEA - International Atomic Energy Agency
IAB - Inadvertent Actuation Block
ICSP - International Collaborative Standard Problem
INL - Idaho National Laboratory
LOCA - Loss of Coolant Accident
LTOP - Low Temperature Over Pressurization
MASLWR - Multi-Application Small Light-Water Reactor
v
MSIV - Main Steam Isolation Valve
NPM - NuScale Power Module
NSSS - Nuclear Steam Supply System
RCS - Reactor Coolant System
RELAP - Reactor Excursion Leak Analysis Program
RPV - Reactor Pressure Vessel
RRV - Reactor Recirculation Valve
RVV - Reactor Vent Valve
PWR - Pressurized Water Reactor
SG - Steam Generator
SGTR - Steam Generator Tube Rupture
SMR - Small Modular Reactor
U.S. NRC - United States Nuclear Regulatory Commission
vi

Contents
Contents vii
List of Figures ix
List of Tables x
1 Introduction 1
2 Small Modular Reactors 2
2.1 Safety Analysis and its Importance . . . . . . . . . . . . . . . . . . . 2
3 Multi-Application Small Light-Water Reactor 4
4 The NuScale Small Modular Reactor 5
4.1 Reactor Geometry and Parameters . . . . . . . . . . . . . . . . . . . 8
4.2 NuScale Safety Systems . . . . . . . . . . . . . . . . . . . . . . . . 9
4.2.1 Decay Heat Removal System (DHRS) . . . . . . . . . . . . . 9
4.2.2 Emergency Core Cooling System (ECCS) . . . . . . . . . . . 11
4.3 Helical Coil Steam Generators . . . . . . . . . . . . . . . . . . . . . 15
5 RELAP5 Code and Model Development 18
6 SGTR Events and SGTR Methodology 35
6.1 SGTR Events and Causes . . . . . . . . . . . . . . . . . . . . . . . . 35
6.2 SGTR Model . . . . . . . . . . . . . . . . . . . . . . . . . . . . . . 36
7 Results and Discussion 41
7.1 Steady State Results . . . . . . . . . . . . . . . . . . . . . . . . . . . 41
7.2 Power Decrease . . . . . . . . . . . . . . . . . . . . . . . . . . . . . 42
7.3 Transient SGTR Results . . . . . . . . . . . . . . . . . . . . . . . . 45
vii

7.4 Transient SGTR without DHRS Results . . . . . . . . . . . . . . . . 55
8 Conclusions 66
9 Recommendations 67
10 References 68
viii

List of Figures
1 MASLWR Test Facility Schematic at Oregon State University [6] . . 6
2 The NuScale Reactor Coolant System.[3] . . . . . . . . . . . . . . . 8
3 NuScale Decay Heat Removal System.[1] . . . . . . . . . . . . . . . 12
4 NuScale Emergency Core Cooling System.[1] . . . . . . . . . . . . . 14
5 Helical Coil Steam Generators in TF-2 NIST Test Reactor . . . . . . 16
6 Schematic of a pair of Dean vortices that form in curved pipes. . . . . 17
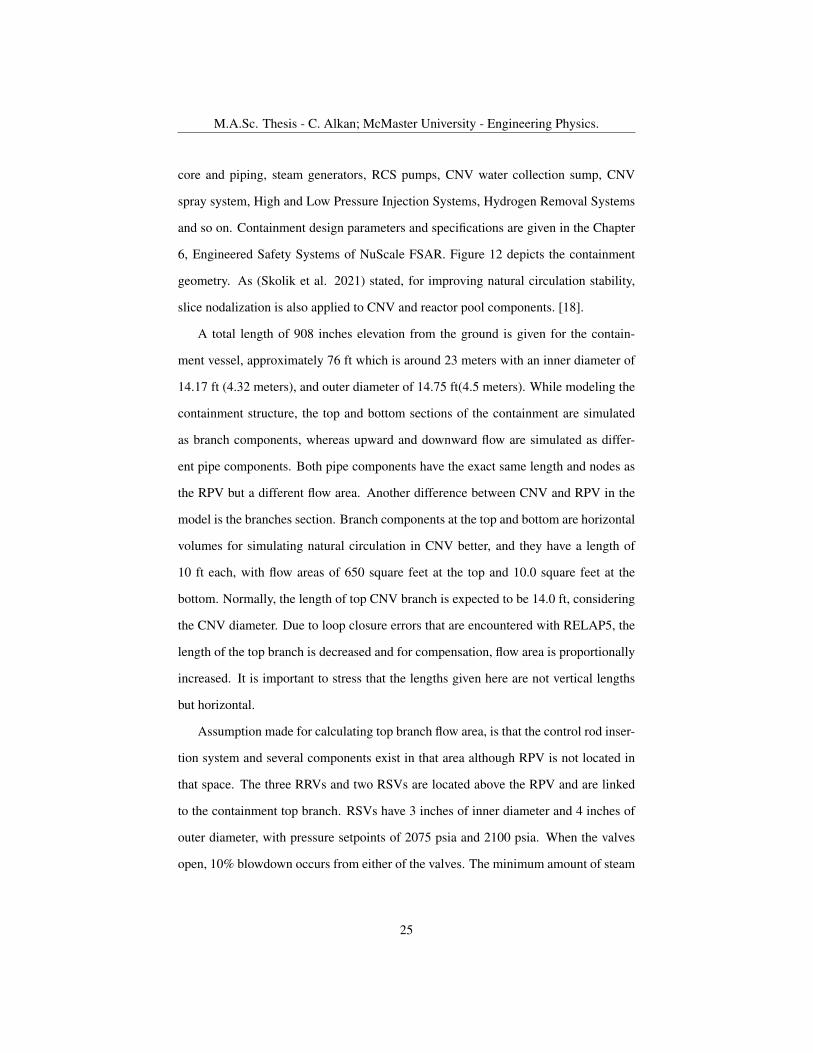
7 Early nodalization. . . . . . . . . . . . . . . . . . . . . . . . . . . . 28
8 Improved nodalization for natural circulation stability. . . . . . . . . . 29
9 Nodalization with Decay Heat Removal System Added . . . . . . . . 30
10 Axial power profile in the NuScale power module [2]. . . . . . . . . . 31
11 Radial power profile in beginning of cycle. . . . . . . . . . . . . . . . 31
12 Containment vessel and ECCS modeling. . . . . . . . . . . . . . . . 32
13 Reactor pool modeling. . . . . . . . . . . . . . . . . . . . . . . . . . 33
14 Containment and reactor pool multiple junction connections. . . . . . 34
15 Break Valve RELAP Model for SGTR Event . . . . . . . . . . . . . 37
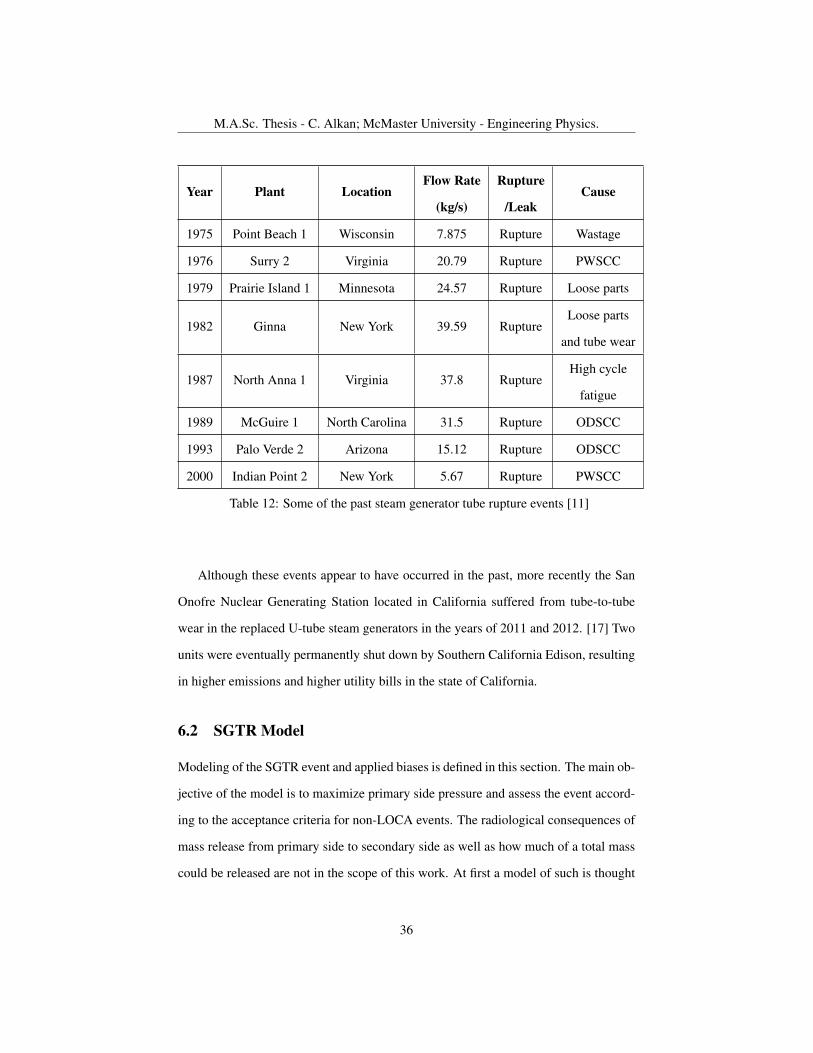
16 Changed break valve RELAP model for SGTR event . . . . . . . . . 38
17 Decay heat power after reactor shutdown . . . . . . . . . . . . . . . . 39
18 Primary pressure in a power decrease event. . . . . . . . . . . . . . . 43
19 Primary flow rate in a power decrease event. . . . . . . . . . . . . . . 44
20 Reactor and steam generator power in a transient SGTR event. . . . . 46
21 Pressurizer pressure in a transient SGTR event. . . . . . . . . . . . . 47
22 Faulted SG pressure in a transient SGTR event. . . . . . . . . . . . . 48
23 Intact SG pressure in a transient SGTR event. . . . . . . . . . . . . . 49
24 Faulted DHRS1 mass flow rate in a transient SGTR event. . . . . . . 50
25 Intact DHRS mass flow rate in transient SGTR event. . . . . . . . . . 51
26 Riser water level in a transient SGTR event. . . . . . . . . . . . . . . 52
ix
27 Peak clad temperature in hot channel in a transient SGTR event. . . . 53
28 Fuel average temperature in a transient SGTR event. . . . . . . . . . 54
29 Reactor safety valve flow rates in a transient SGTR without DHRS event. 57
30 Core water level in a transient SGTR without DHRS event. . . . . . . 58
31 Pressurizer pressure in transient SGTR without DHRS event. . . . . . 59
32 Containment pressure in a transient SGTR without DHRS event. . . . 60
33 CNV level in a transient SGTR without DHRS event. . . . . . . . . . 61
34 Riser level in a transient SGTR without DHRS event. . . . . . . . . . 62
35 Containment wall temperature in a transient SGTR without DHRS event. 63
36 Reactor recirculation valve flow rates in a transient SGTR without
DHRS event. . . . . . . . . . . . . . . . . . . . . . . . . . . . . . . 64
37 Reactor vent valve flow rates in a transient SGTR without DHRS event. 65
List of Tables
1 Small modular reactor designs in review by the Canadian Nuclear Safety
Commission (CNSC). [5] . . . . . . . . . . . . . . . . . . . . . . . . 3
2 NuScale Reactor Parameters [2] . . . . . . . . . . . . . . . . . . . . 9
3 Reactor Geometry Parameters [2]. . . . . . . . . . . . . . . . . . . . 10
4 NuScale Reactor Pressure Vessel Parameters [3]. . . . . . . . . . . . 11
5 Decay Heat Removal System Design Data [3] . . . . . . . . . . . . . 13
6 NuScale Steam Generator Design Data [3] . . . . . . . . . . . . . . . 15
7 RELAP hydrodynamic components . . . . . . . . . . . . . . . . . . 19
8 NuScale primary system RELAP5-3D model components and geometry. 20
9 Radial Power Profile for Core Channels in BOC . . . . . . . . . . . . 21
10 NuScale Primary System Flow Rates . . . . . . . . . . . . . . . . . . 23
11 Containment and Reactor Pool Parameters . . . . . . . . . . . . . . . 27
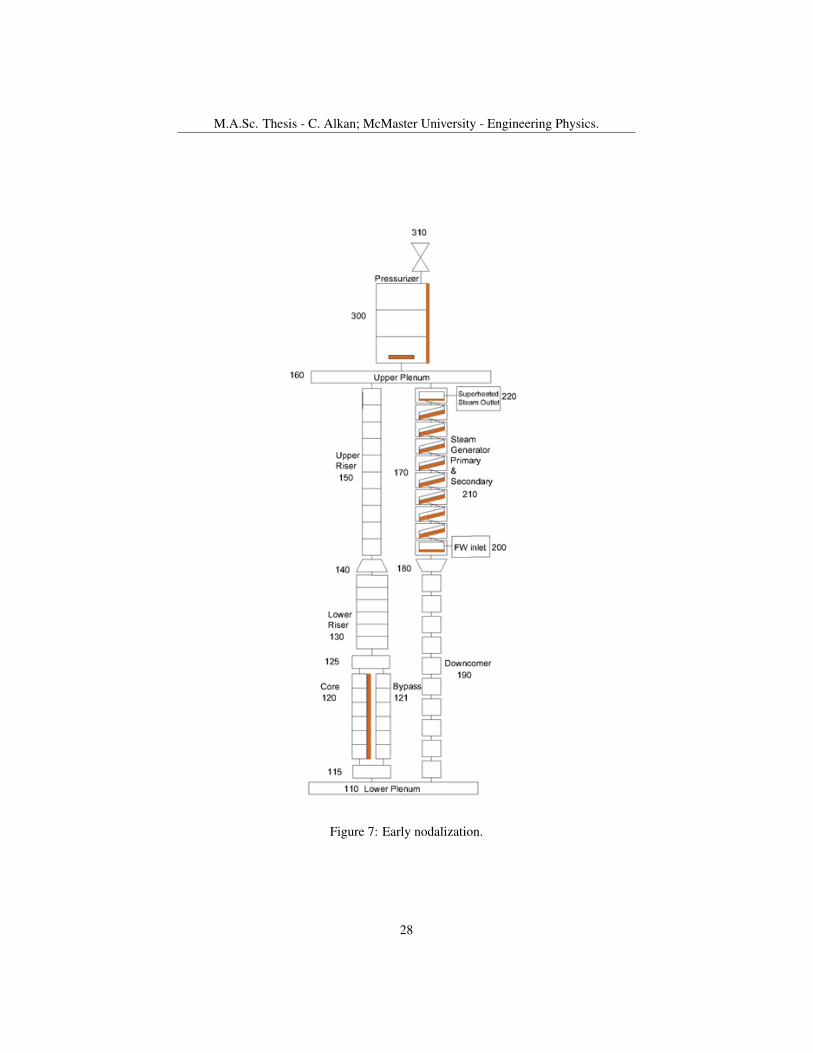
12 Some of the past steam generator tube rupture events [11] . . . . . . . 36
x

13 SGTR Biases . . . . . . . . . . . . . . . . . . . . . . . . . . . . . . 38
14 Steady state results and comparison to reference values. . . . . . . . . 41
15 Event Sequence Comparison for SGTR Event . . . . . . . . . . . . . 45
16 SGTR without DHRS event sequence. . . . . . . . . . . . . . . . . . 56
xi

M.A.Sc. Thesis - C. Alkan; McMaster University - Engineering Physics.
1 Introduction
Safety analysis is of great importance due to the nature and extent of events if an ac-
cident were to occur in a nuclear reactor. A considerable percentage of the radioactive
elements contained in a large power reactor could be discharged into the environment
in a populated region. Even if a succession of exceedingly unlikely catastrophes oc-
curs, containment and safety systems are essential to avoid radioactive material escape
into the atmosphere.[10]
In this context, the safety analysis of a chosen reactor, the NuScale SMR, is con-
ducted via regulatory procedures. Original objective of the work is to assess the tube
rupture event with the RELAP5-3D code and to do code-to-code comparison of the de-
sign with calculations done by the designer with NRELAP5. This modified version of
RELAP5-3D, as well as the model used by the NuScale Power LLC. company are pro-
prietary and not published by US NRC; The model developed may be different from
what the company originally published. Model changes may play important role in
the transients, considering user effects of the code. The written thesis is divided into
several sections, which are further explained as follows: Chapter 2 discusses the ratio-
nale for development of small modular reactors. Chapter 2 also discusses regulatory
viewpoints in the licensing of nuclear reactors in the United States and Canada. Chap-
ter 3 presents the Multi Application MASLWR, an early prototype of NuScale, and
earlier tests conducted with the prototype, as well as the obtained data and deduced
conclusions. Chapter 4 describes the NuScale SMR reactor and its various systems and
components. Helical coil steam generators are also explained in the Chapter 4. The
RELAP5 code and model developed for the NuScale SMR are described in Chapter
5. Chapter 6 describes steam generator tube rupture events, causes, earlier examples
and the tube rupture model for the NuScale Reactor. Chapter 7 consists of results for
the achieved steady state, power decrease, tube rupture and tube rupture without decay
heat removal system transients. Chapter 8 describes the deduced conclusions from the
1
M.A.Sc. Thesis - C. Alkan; McMaster University - Engineering Physics.
work and the last chapter, Chapter 9 shows the references.
2 Small Modular Reactors
The phrase "small modular reactor" (SMR) refers to plants that produce less energy
than large-scale commercial reactors. The power ranges from approximately 10–300
MW, and these reactors are classified as Generation 3+ or Generation 4. As the globe
continues to revolve around climate change, zero-carbon energy generation becomes
increasingly critical.
The US Nuclear Regulatory Commission (NRC) and the Canadian Nuclear Safety
Commission (CNSC) are now reviewing a variety of SMRs for numerous reasons.
While the primary objective of certain reactors is to generate energy, such as supply-
ing stable and affordable electricity to isolated settlements or urban areas, alternative
objectives might include hydrogen generation. SMR providers also consider mining
applications and operations that require a lot of heat, such as desalination. At this time,
there are several SMR advancements occurring globally.
A brief list of designs currently being assessed by CNSC can be seen in Table 1.
2.1 Safety Analysis and its Importance
The term "safety analysis" refers to the activities that take place from the first concep-
tual design of a nuclear reactor through to the decommissioning of the nuclear reactor.
The International Atomic Energy Agency (IAEA) and other regulatory organizations
such as the US Nuclear Regulatory Commission (US NRC) and the Canadian Nuclear
Safety Commission (CNSC, formerly AECB), have been working since the 1950’s to
create basic regulatory principles for generating nuclear energy in a safe way. To ensure
the safety of the public and the environment, it is critical to anticipate and eliminate the
occurrences that could cause the reactor to deviate from normal operation, as well as
2

M.A.Sc. Thesis - C. Alkan; McMaster University - Engineering Physics.
Vendor Name of design andcooling type
Electricalcapacity
(MW electrical)Applied for Review start date Status
TerrestrialEnergy Inc.
IMSRIntegral Molten
Salt Reactor
200 Phase 1 April 2016 Complete
Phase 2 December 2018Assessment in
progressUltra Safe
Nuclear CorporationMMR-5 and
MMR-10High-temperature gas
5-10 Phase 1 December 2016 Complete
Phase 2 June 2021Assessment in
progressLeadCold
Nuclear Inc.SEALER
Molten Lead 3 Phase 1 January 2017On hold at
vendor’s requestARC NuclearCanada Inc.
ARC-100Liquid Sodium 100 Phase 1 September 2017 Complete
Moltex EnergyMoltex Energy
Stable Salt ReactorMolten Salt
300Series
Phase 1 and 2 December 2017Phase 1
completed
SMR, LLC.SMR-160
Pressurized Light Water 160 Phase 1 July 2018 Complete
NuScalePower, LLC
NuScale Integralpressurized water
reactor60 Phase 2* January 2020
Assessment inprogress
U-BatteryCanada Ltd.
U-BatteryHigh-temperature
gas4 Phase 1 Pending
Project startpending
GE-HitachiNuclear Energy
BWRX-300boiling water
reactor300 Phase 2* January 2020
Assessment inprogress
X Energy, LLCXe-100
High-temperaturegas
80 Phase 2* July 2020Assessment in
progress
Table 1: Small modular reactor designs in review by the Canadian Nuclear SafetyCommission (CNSC). [5]
those that could result in the release of highly radioactive material at some point during
the plant’s operational life.
In this manner, voluminous safety analysis documents are created by the reactor
vendors for the regulatory bodies of the planned country of installation. Safety Analysis
documents consist of several chapters, usually describing general information about the
plant, site characteristics, design criteria, reactor, reactor coolant system (RCS), engi-
neered safety systems, instrumentation and controls, electricity requirements, auxiliary
systems, steam and conversion systems, radioactive waste management, radiation pro-
tection, conduct of operations, initial testing and operation, accident analysis, technical
specifications, quality assurance, probabilistic safety analysis, severe accident analysis,
and so on. This work is done for the licensing analysis for regulatory review purposes.
Design assist and experimental analysis are out of scope of this thesis as they are not
contributing to improving the design of the NuScale SMR nor were experiments for
3
M.A.Sc. Thesis - C. Alkan; McMaster University - Engineering Physics.
assessing the code.
The US NRC states a more rigid structure of needs defined by the law of 10 CFR
50. Appendices of 10 CFR 50 describe different requirements for manufacturing qual-
ity, installation of systems, and what is accepted as "nuclear grade". Safety analysis
studies must evaluate the design and performance of structures, systems, and compo-
nents, as well as their suitability for accident prevention and mitigation. For example,
the analysis and assessment of the cooling performance of the emergency core cool-
ing system (ECCS) after hypothetical loss-of-coolant accidents (LOCAs) must comply
with the criteria of 10 CFR 50.46; Or, the facility’s technical specifications must be
based on the safety analysis and developed in compliance with 10 CFR 50.36. [13]
The Canadian Nuclear Safety Commission (CNSC) addresses and details the stan-
dards and guidelines for preparing and presenting a safety analysis that proves a nu-
clear facility’s safety analysis needs and methods to use to the reactor vendors in the
REGDOC-2.4.1, Deterministic Safety Analysis document. [15]
3 Multi-Application Small Light-Water Reactor
The Multi-Application Small Light-Water Reactor (MASLWR) Test Reactor is an inte-
grated pressurized light water reactor that relies on natural circulation. The MASLWR
was built at Oregon State University as a prototype to a NuScale Power Module. The
MASLWR design layout is seen in Figure 1. The MASLWR nuclear steam supply sys-
tem (NSSS) is housed inside the reactor vessel, with natural circulation driving the core
flow. The steam generators, which are made up of banks of vertical helical tubes, are
positioned in the top section of the vessel, outside of the hot leg chimney. The feedwa-
ter is totally vaporized within the tubes after traversing roughly 60% of the tube length,
resulting in superheated steam at the steam generator outlet. The significance of this
facility is in the tests undertaken to determine natural circulation stability, to simulate
significant events, and to finally validate the present thermal-hydraulic computer codes
4
M.A.Sc. Thesis - C. Alkan; McMaster University - Engineering Physics.
in light of this evidence.
Conclusions related to Helical Coil Steam Generators (HCSG) derived from Inter-
national Collaborative Standart Problem (ICSP) experiments done in the MASLWR
facility could be summed up as the following: The majority of modern computer pro-
grams used for thermal-hydraulic analysis do not include suitable heat transfer and
pressure drop correlations for the helical coil’s interior and outer surfaces. [6] This
problem is further complicated by the fact that the helical coil steam generator’s in-
let condition corresponds to single-phase flow, while the outlet condition corresponds
to super-heated flow, necessitating not only the estimation of heat transfer and pres-
sure drop under single- and two-phase flow conditions, but also dryout and post-dryout
heat transfer. Additionally, numerous geometric and operating parameters such as the
diameter of the tube, the diameter of the helix, the helical pitch, the flow regime (lam-
inar, transition, and turbulent flow in single-phase fluid), the orientation of the helical
tube (vertical upward/downward, inclined or horizontal), and the flow patterns (bubbly,
slug, annular, and droplet flow) all affect the helical coil heat transfer and pressure drop.
Likewise, for heat transfer and pressure loss, the entrance effect must be considered.
It is also noted that while a lumped SG tube model demonstrated more stable be-
havior, parallel channel instabilities could not be investigated.
4 The NuScale Small Modular Reactor
One of the main reasons that analyses are chosen to be done with NuScale SMR is that
it is a competitor in the Canadian market for small modular reactors. This particular
reactor is an advanced design that depends on passive mechanisms to protect against
design basis accidents, and it incorporates HCSGs as a means of heat transfer.
The NuScale Reactor is composed of multiple components. Each of the facility’s
nuclear reactor units is called a NuScale Power Module (NPM), partially submerged in
water. It may have up to 12 such modules, each of which generates 50 MWe. [1] Each
5

M.A.Sc. Thesis - C. Alkan; McMaster University - Engineering Physics.
Figure 1: MASLWR Test Facility Schematic at Oregon State University [6]
6
M.A.Sc. Thesis - C. Alkan; McMaster University - Engineering Physics.
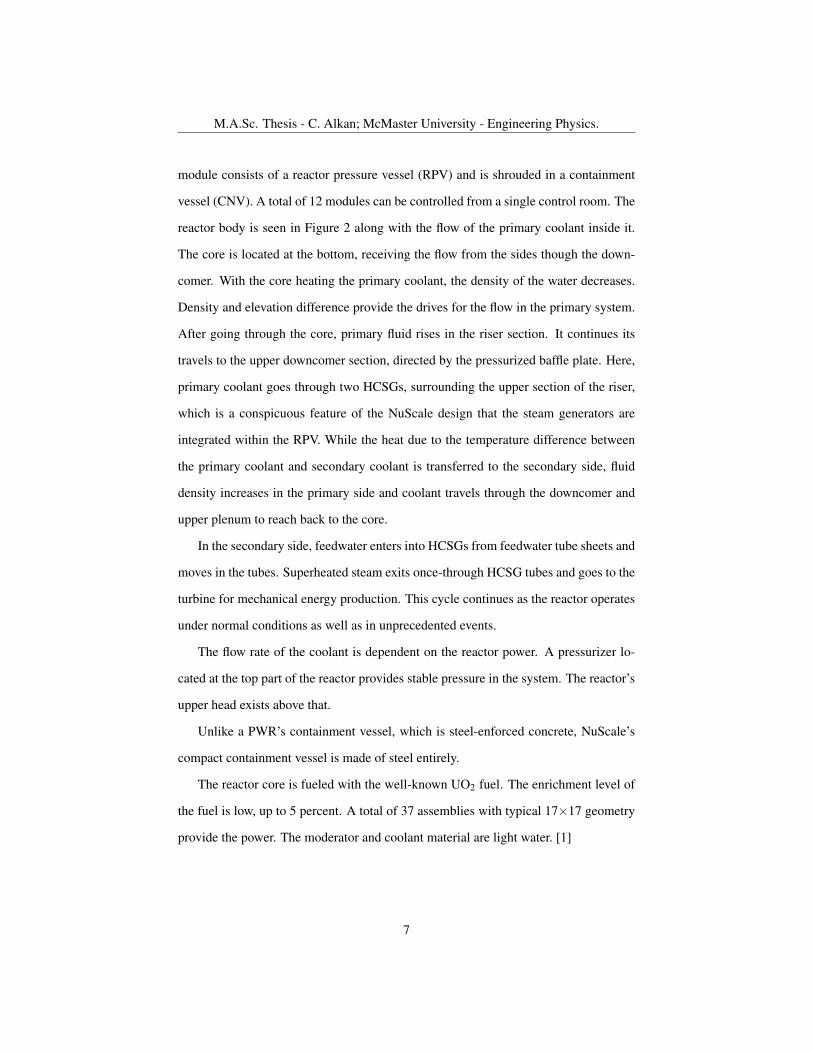
module consists of a reactor pressure vessel (RPV) and is shrouded in a containment
vessel (CNV). A total of 12 modules can be controlled from a single control room. The
reactor body is seen in Figure 2 along with the flow of the primary coolant inside it.
The core is located at the bottom, receiving the flow from the sides though the down-
comer. With the core heating the primary coolant, the density of the water decreases.
Density and elevation difference provide the drives for the flow in the primary system.
After going through the core, primary fluid rises in the riser section. It continues its
travels to the upper downcomer section, directed by the pressurized baffle plate. Here,
primary coolant goes through two HCSGs, surrounding the upper section of the riser,
which is a conspicuous feature of the NuScale design that the steam generators are
integrated within the RPV. While the heat due to the temperature difference between
the primary coolant and secondary coolant is transferred to the secondary side, fluid
density increases in the primary side and coolant travels through the downcomer and
upper plenum to reach back to the core.
In the secondary side, feedwater enters into HCSGs from feedwater tube sheets and
moves in the tubes. Superheated steam exits once-through HCSG tubes and goes to the
turbine for mechanical energy production. This cycle continues as the reactor operates
under normal conditions as well as in unprecedented events.
The flow rate of the coolant is dependent on the reactor power. A pressurizer lo-
cated at the top part of the reactor provides stable pressure in the system. The reactor’s
upper head exists above that.
Unlike a PWR’s containment vessel, which is steel-enforced concrete, NuScale’s
compact containment vessel is made of steel entirely.
The reactor core is fueled with the well-known UO2 fuel. The enrichment level of
the fuel is low, up to 5 percent. A total of 37 assemblies with typical 17×17 geometry
provide the power. The moderator and coolant material are light water. [1]
7
M.A.Sc. Thesis - C. Alkan; McMaster University - Engineering Physics.
4.1 Reactor Geometry and Parameters
The following information was obtained through the 5th Revision of the Final Safety
Analysis Report of NuScale SMR, which was submitted to the U.S. Nuclear Regulatory
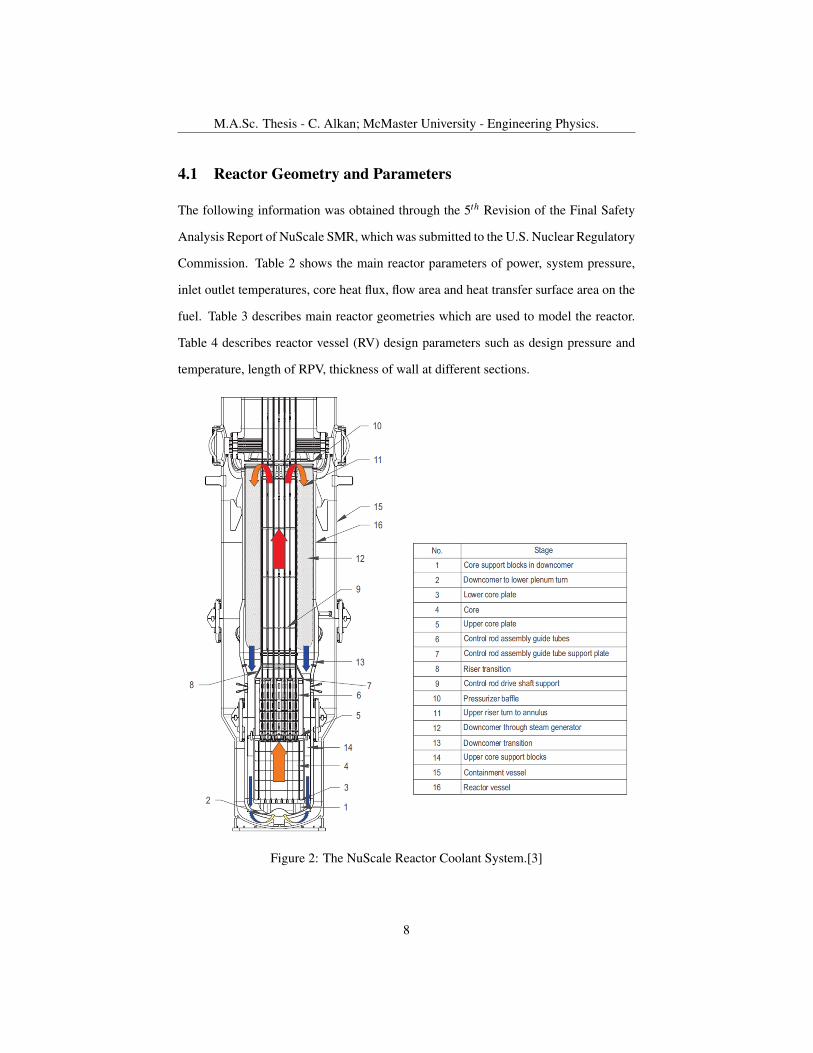
Commission. Table 2 shows the main reactor parameters of power, system pressure,
inlet outlet temperatures, core heat flux, flow area and heat transfer surface area on the
fuel. Table 3 describes main reactor geometries which are used to model the reactor.
Table 4 describes reactor vessel (RV) design parameters such as design pressure and
temperature, length of RPV, thickness of wall at different sections.
Figure 2: The NuScale Reactor Coolant System.[3]
8
M.A.Sc. Thesis - C. Alkan; McMaster University - Engineering Physics.
Reactor Parameter Imperial Unit SI UnitCore thermal output 160 MWth 160 MWthSystem pressure 1850 psia 12.76 MPaInlet temperature 497 °F 531.5 KCore average temperature 543 °F 557 KAverage temperature rise in the core 100 °F 56 KCore bypass flow (%)(best estimate) 7.3 7.3Average linear power density 2.5 kW/ft 8.2 kW/mPeak linear power for normal operating conditions 5 kW/ft 16.4 kW/mNormal operation peak heat flux 170,088 Btu/hr-ft2 536.558 kW/m2
Total heat flux hot channel factor, FQ 2 2Heat transfer area on fuel surface 6275.6 ft2 583.022 m2
Normal operation core average heat flux 85,044 Btu/hr-ft2 268.28 kW/m2
Core flow area 9.79 ft2 0.9095 m2
Core average coolant velocity 2.7 ft/s 0.823 m/s
Table 2: NuScale Reactor Parameters [2]
4.2 NuScale Safety Systems
This section will discuss the passive safety systems integrated into the NuScale reactor.
The reactor is equipped with two primary safety systems to protect against Design Ba-
sis Events. The Decay Heat Removal System is the first of these, while the Emergency
Core Cooling System is the second. Each safety system is described in detail in the
sections that follow.
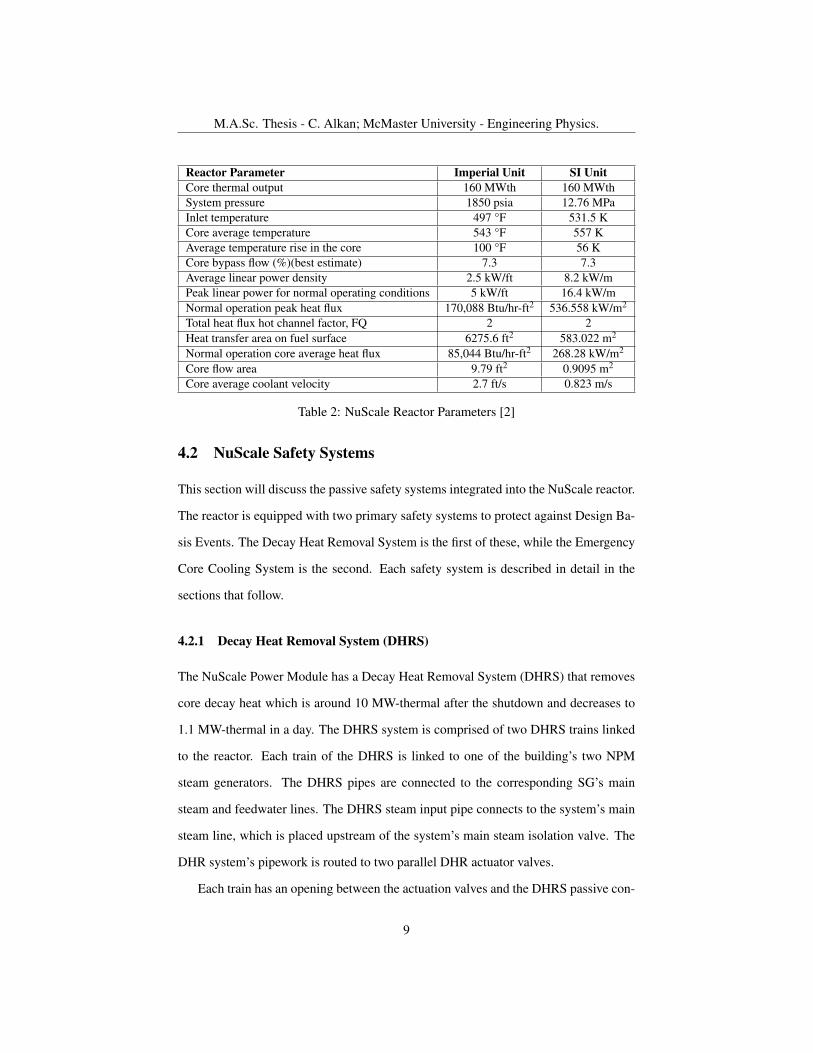
4.2.1 Decay Heat Removal System (DHRS)
The NuScale Power Module has a Decay Heat Removal System (DHRS) that removes
core decay heat which is around 10 MW-thermal after the shutdown and decreases to
1.1 MW-thermal in a day. The DHRS system is comprised of two DHRS trains linked
to the reactor. Each train of the DHRS is linked to one of the building’s two NPM
steam generators. The DHRS pipes are connected to the corresponding SG’s main
steam and feedwater lines. The DHRS steam input pipe connects to the system’s main
steam line, which is placed upstream of the system’s main steam isolation valve. The
DHR system’s pipework is routed to two parallel DHR actuator valves.
Each train has an opening between the actuation valves and the DHRS passive con-
9

M.A.Sc. Thesis - C. Alkan; McMaster University - Engineering Physics.
RCS Region Volumem3(ft3) RCS Sub-region
AverageFlow Area
m2(ft2)Length m(ft)
Riser 17.98(635) Lower riser and transition 2.31(24.9) 2.87(9.4)Upper riser and riser turn 1.43(15.4) 7.93(26)
Downcomer 33.95(1199)Downcomer (including
steam generators) 2.39(25.7) 14(46)
Core 2.52(89) Fuel assemblies 0.96(10.3) 2.4(7.9)Reflector cooling channel 0.084(0.9 ) 2.4(7.9)
Pressurizer 16.37(578)Pressurizer heaters /main steam plenums 3.353(36.1) 0.52(1.7)
Cylindrical pressurizer 5.70(61.4) 2.1(6.9)Reactor pressurevessel top head 3.83(41.2) 0.67(2.2)
Table 3: Reactor Geometry Parameters [2].
densers, which assists in maintaining a controlled water flow during operation. Follow-
ing that, a new length of pipe is created and routed along the exterior of the containment
vessel to a train-specific DHRS passive condenser. The DHRS passive condenser’s out-
put is routed to the feedwater line servicing the associated SG, where it is connected to
the feedwater line downstream of the main feed isolation valves to complete the loop.
The DHRS is always in standby mode during normal power operations, with each
train of DHRS being isolated from the associated main steam lines through the closing
of the DHRS actuation valves on the main steam lines. On each train, these four valves,
each with two valves, are connected in parallel and always maintained closed. [1]
When the MSIVs and FWIVs are actuated, they are closed and the DHRS actuation
valves are opened. The DHRS actuation valves are intended to open in the event of a
control power interruption, whether caused by control system actuation or a power loss.
Actuation allows the water column in the DHRS piping to drain into the feedwa-
ter system piping and plenum, and steam from the SG to flow into the DHRS piping
and passive condenser of the DHRS. The passive condenser condenses steam by trans-
ferring heat to the reactor pool. As a consequence of this procedure, condensate is
continuously pumped from the passive condenser to the related feedwater line and into
10

M.A.Sc. Thesis - C. Alkan; McMaster University - Engineering Physics.
Design Parameter Imperial UnitValue SI Unit Value
Design pressure 2100 psia 14.48 MPaDesign temperature 650 ◦F 616.48 KOverall height, bottom of alignment feature to
top of CRDM latch housing section 778 inches 1976.12 cm
Inside diameter of lower RPV section,cylindrical region, without clad 96.5 inches 245.11 cm
Outside diameter of lower RPV section,cylindrical region, without clad 105 inches 266.7 cm
Inside diameter of upper RPV section,cylindrical region, without clad 104.5 inches 265.43 cm
Outside diameter of upper RPV section,cylindrical region, without clad 112.5 inches 285.75 cm
Inside diameter of pressurizer,cylindrical region, without clad 106.5 inches 270.51 cm
Outside diameter of pressurizer,cylindrical region, without clad 115.5 inches 293.37 cm
Inside diameter of upper head without clad 104.5 inches 265.43 cmOutside diameter of upper head without clad 112.5 inches 285.75 cmInner clad thickness 0.25 inches 0.64 cmOuter clad thickness 0.125 inches 0.318 cm
Table 4: NuScale Reactor Pressure Vessel Parameters [3].
the associated SG. [3] DHRS is simulated for the tube rupture event.
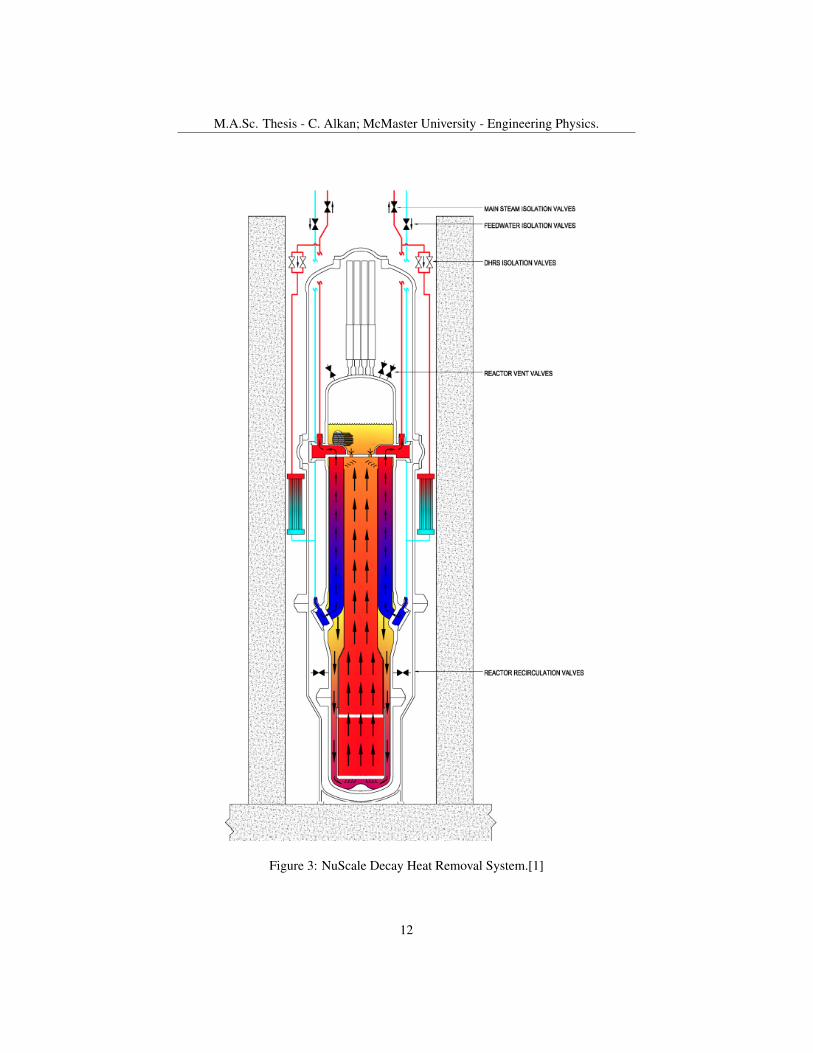
4.2.2 Emergency Core Cooling System (ECCS)
The ECCS is a critical component of the NuScale Power Plant’s safety system because
it responds to LOCAs in a safe manner and serves as a component of both the reactor
coolant and containment vessel pressure limits. The ECCS, in combination with the
containment heat removal function, offers core decay heat removal in the case of a
coolant loss that exceeds makeup capabilities.
Three reactor vent valves (RVVs) are positioned on the top head of the RPV, two
reactor recirculation valves (RRVs) are fixed on the RPV’s side, and accompanying
actuators are situated on the upper CNV. During normal plant operation, all five valves
are closed; they open to activate the system in the event of an accident. The RVVs
11
M.A.Sc. Thesis - C. Alkan; McMaster University - Engineering Physics.
Figure 3: NuScale Decay Heat Removal System.[1]
12

M.A.Sc. Thesis - C. Alkan; McMaster University - Engineering Physics.
Parameter Imperial Unit Value SI Unit ValueInternal Pressure 2100 psia 14.48 MPa
Actuation valve external pressure 60 psia 0.413 MPaPassive condenser external pressure 27 psia 0.186 MPa
Temperature 650 °F 616.5 KNumber of condensers 2
Total number of tubes per condenser 80Tube wall outer diameter 1.315 inches 3.34 cm
Tube wall thickness 0.109 inches 0.277 cmTube external surface area per condenser 258.2ft2 23.99 m2
Fouling factor 0.0005 hr-ft2-°F/BTU 0.00285 W/m2K
Table 5: Decay Heat Removal System Design Data [3]
release steam from the RPV into the CNV, where it condenses and settles as liquid
condensate at the containment’s bottom. The RRVs enable collected coolant to be
reintroduced into the RPV for recirculation and core cooling. The ECCS is totally
passive in nature, with heat being transferred through the CNV wall to the reactor
pool. The RRV penetrations are positioned on the side of the RPV in such a way that
when the system is operated, the coolant level in the RPV stays above the core and
the fuel remains covered. [1] ECCS is simulated in the model for tube rupture without
availability of the decay heat removal system but not for the tube rupture transient itself.
13

M.A.Sc. Thesis - C. Alkan; McMaster University - Engineering Physics.
Figure 4: NuScale Emergency Core Cooling System.[1]
14
M.A.Sc. Thesis - C. Alkan; McMaster University - Engineering Physics.
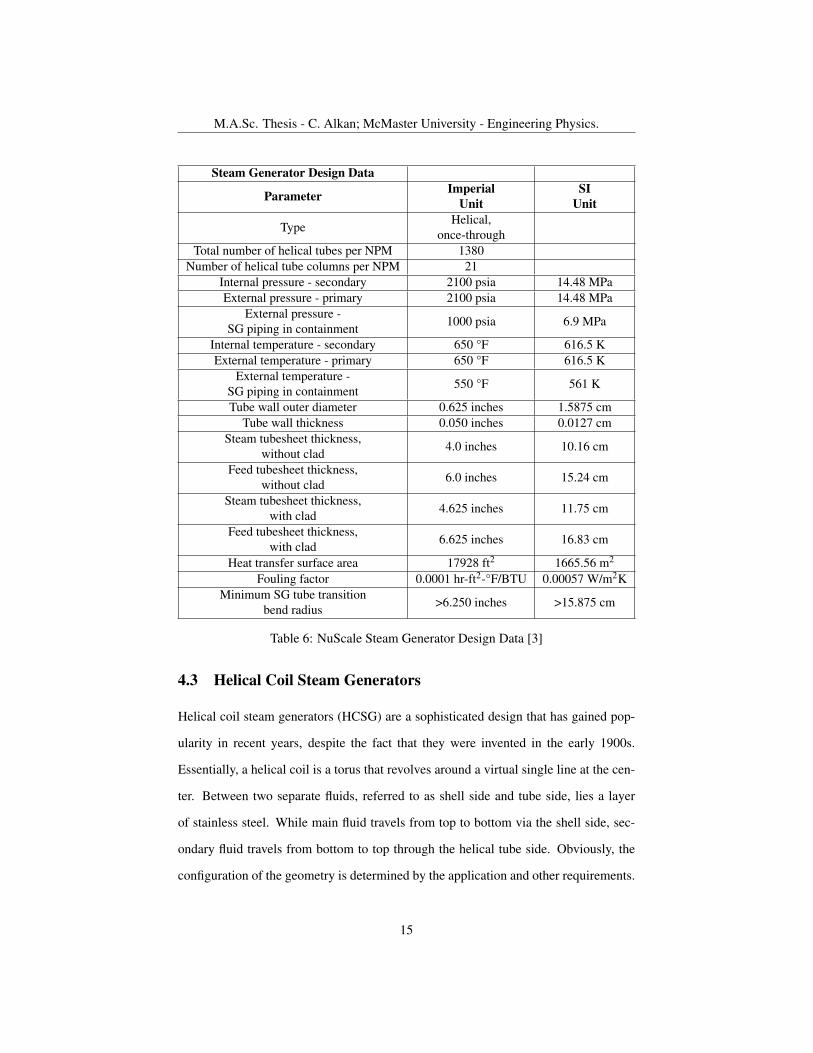
Steam Generator Design Data
Parameter ImperialUnit
SIUnit
TypeHelical,
once-throughTotal number of helical tubes per NPM 1380
Number of helical tube columns per NPM 21Internal pressure - secondary 2100 psia 14.48 MPaExternal pressure - primary 2100 psia 14.48 MPa
External pressure -SG piping in containment 1000 psia 6.9 MPa
Internal temperature - secondary 650 °F 616.5 KExternal temperature - primary 650 °F 616.5 K
External temperature -SG piping in containment 550 °F 561 K
Tube wall outer diameter 0.625 inches 1.5875 cmTube wall thickness 0.050 inches 0.0127 cm
Steam tubesheet thickness,without clad 4.0 inches 10.16 cm
Feed tubesheet thickness,without clad 6.0 inches 15.24 cm
Steam tubesheet thickness,with clad 4.625 inches 11.75 cm
Feed tubesheet thickness,with clad 6.625 inches 16.83 cm
Heat transfer surface area 17928 ft2 1665.56 m2
Fouling factor 0.0001 hr-ft2-°F/BTU 0.00057 W/m2KMinimum SG tube transition
bend radius >6.250 inches >15.875 cm
Table 6: NuScale Steam Generator Design Data [3]
4.3 Helical Coil Steam Generators
Helical coil steam generators (HCSG) are a sophisticated design that has gained pop-
ularity in recent years, despite the fact that they were invented in the early 1900s.
Essentially, a helical coil is a torus that revolves around a virtual single line at the cen-
ter. Between two separate fluids, referred to as shell side and tube side, lies a layer
of stainless steel. While main fluid travels from top to bottom via the shell side, sec-
ondary fluid travels from bottom to top through the helical tube side. Obviously, the
configuration of the geometry is determined by the application and other requirements.
15

M.A.Sc. Thesis - C. Alkan; McMaster University - Engineering Physics.
In such a system, heat transport occurs by conduction.
Main parameters for designing a helical coil heat exchanger are: tube diameter,
number of tubes, wall thickness of tubes, tube length, total coil rise, tube inlet and
outlet temperatures, primary side inlet and outlet temperatures, design pressure of the
system, pitch diameter, angle of curvature and so on. Figure 5 shows TF-2 test SGs
designed and tested by NuScale in the NIST(MASLWR) Test Reactor.
Figure 5: Helical Coil Steam Generators in TF-2 NIST Test Reactor
(Prabhanjan et al. 2002) describes, based on the experimental work on the compar-
ison of the heat transfer coefficient, that a helical coil heat exchanger has a larger heat
transfer coeeficient than a straight tube heat exchanger of the same dimensions. Heat
transfer coefficients increase as the surrounding fluid temperature rises, most likely
owing to buoyancy effects on the heat exchangers. [14] The coil shape and the fluid
flow rate have an impact on the fluid’s temperature increase. Prabhanjan notes that
approximately 16 to 42 percent increase is seen in the experiments.[14]
Helical coil heat exchangers perform substantially better in heat transfer than straight
tubes. The higher heat transfer coefficient occurs as a result of the coil’s curvature,
16

M.A.Sc. Thesis - C. Alkan; McMaster University - Engineering Physics.
Figure 6: Schematic of a pair of Dean vortices that form in curved pipes.
which exerts centrifugal forces on the circulating fluid, resulting in secondary flows.
Apart from increasing the heat transfer coefficient, generated secondary flow improves
mixing and frictional pressure drop, particularly in laminar flows. The number of sec-
ondary flows occurring inside the tubes, Dean vortices, can be seen in Figure 6. Nat-
urally, in a compact design where area is of concern, HCSGs are of choice compared
to U-tube SGs. Another factor to consider is the quantity of water that these SGs can
hold. U-tube SGs contain more water than HCSGs. This is important because U-tubes
can withstand a reduction in secondary side inventory for a longer period of time than
HCSGs. This is not a concern due to NuScale’s powerful passive ECCS. Another ben-
efit of HCSGs is their strong resistance to flow-induced vibrations (FIV), which are a
significant cause of tube ruptures.
Previous studies in the literature used the RELAP5-3D code with HCSGs. [7] [19]
Nonetheless, the code’s simulation capabilities for HCSGs may be enhanced further. In
the MASLWR IAEA collaboration work, for modeling HCSGs, contributors have used
several different techniques such as: Heat transfer surface area increase, and increase
in the heat transfer coefficient, using a fouling factor greater than 1.0. [6]
17

M.A.Sc. Thesis - C. Alkan; McMaster University - Engineering Physics.
5 RELAP5 Code and Model Development
RELAP5 code is developed by Idaho National Laboratory (INL) since 1970’s for ther-
mal hydraulic analysis of nuclear systems. Today, the code has been expanded to
function with a variety of fluids and a variety of simulated scenarios. [16] For this
analysis, latest RELAP5-3D version 4.4.2 (released in June 2018) is used. A license
for RELAP5-3D is obtained through an agreement between McMaster University and
Idaho National Laboratory, as a university participant. Code allows users to simulate
a wide variety of transients such as small and large break loss of coolant accidents,
especially in Light Water Reactors (LWR).
Based on INL’s RELAP5 and through the validation and testing prototype of NuS-
cale, MASLWR at Oregon State University, the NuScale Power LLC. company devel-
oped proprietary NRELAP5 code for simulating important phenomena related to the
NuScale Power Module in a more accurate way. NRELAP5 is validated through ex-
perimental tests conducted at the Oregon State University (MASLWR), at the SIET
TF-1&2 facility in Italy for HCSGs as well as with CHF tests conducted in Stern Labs.
Thermal hydraulic tests were conducted at these facilities. [6] [12] Since NRELAP5 is
unavailable for use, RELAP5-3D was chosen to achieve the closest results.
Many system thermal hydraulic codes work in a similar way in that the system is
divided into different nodes and connections. Pressure, temperature, quality parameters
are input for volumes, and either mass flow rate or velocity terms should be input for
junctions initially. Hydrodynamic structures are used for the flow in the system. An
area, length, or volume should be entered for all hydrodynamic structures existing in
the model. A list of hydrodynamic structures can be found in the table below.
Time-dependent volumes and junctions can be used for simulating inlet and outlet
conditions. This component behaves as a source or sink. For example, since a turbine
is not in the scope of work, turbine parameters (outlet temperature, pressure, quality)
values can be simulated as a time-dependent volume, and the steam generator outlet
18

M.A.Sc. Thesis - C. Alkan; McMaster University - Engineering Physics.
is connected to time-dependent volumes. Likewise, time-dependent junctions are con-
nections that can be used to provide a stable mass flow rate to volumes.
A branch component can be used to simulate when a lot of junctions should be
connected to a volume at the same time. Each of the junctions may have different flow
areas and velocities.
The valve component is used for simulating valves. Check valves, servo valves
controlled by a control system, motor valves that depend on different trip parameters as
well as opening and closing speeds, and trip valves activated when certain conditions
are met can be used. Heat structures simulate the heat transfer occurring between
Component Input NameSingle volume snglvol
Time-dependent volume tmdpvolSingle Junction sngljun
Time-dependent junction tmdpjunBranch branch
Separator separatrPipe pipe
Annulus annulusPressurizer prizer
Feedwater heater fwhtrJetmixer jetmixerTurbine turbine
ECC mixer eccmixValve Valve
Multiple Junction mtlpjun
Table 7: RELAP hydrodynamic components
different components. The code calculates the heat transfer according to input values
of wall thickness, mesh nodalization (both axially and radially), type of heat structure
(rectangular, cylindrical, or spherical), surface area of each node, and heated and wetted
diameters, thermal properties such as thermal conductivity and heat capacity of the
material. A good way to simulate heat exchangers is to use counter flow on the opposite
sides of the flow. Thermal properties of materials can be entered through temperature
dependent tables for materials that are used in reactors, such as stainless steel, clad
19
M.A.Sc. Thesis - C. Alkan; McMaster University - Engineering Physics.
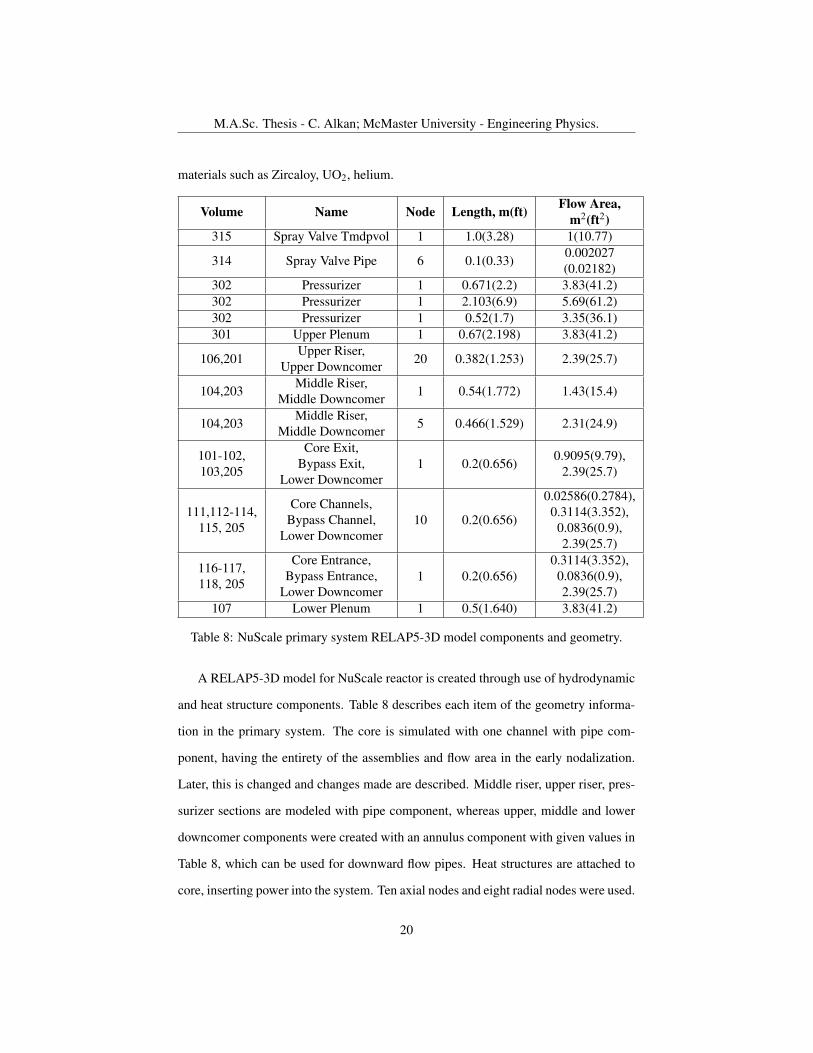
materials such as Zircaloy, UO2, helium.
Volume Name Node Length, m(ft) Flow Area,m2(ft2)
315 Spray Valve Tmdpvol 1 1.0(3.28) 1(10.77)
314 Spray Valve Pipe 6 0.1(0.33)0.002027(0.02182)
302 Pressurizer 1 0.671(2.2) 3.83(41.2)302 Pressurizer 1 2.103(6.9) 5.69(61.2)302 Pressurizer 1 0.52(1.7) 3.35(36.1)301 Upper Plenum 1 0.67(2.198) 3.83(41.2)
106,201Upper Riser,
Upper Downcomer 20 0.382(1.253) 2.39(25.7)
104,203Middle Riser,
Middle Downcomer 1 0.54(1.772) 1.43(15.4)
104,203Middle Riser,
Middle Downcomer 5 0.466(1.529) 2.31(24.9)
101-102,103,205
Core Exit,Bypass Exit,
Lower Downcomer1 0.2(0.656)
0.9095(9.79),2.39(25.7)
111,112-114,115, 205
Core Channels,Bypass Channel,
Lower Downcomer10 0.2(0.656)
0.02586(0.2784),0.3114(3.352),0.0836(0.9),2.39(25.7)
116-117,118, 205
Core Entrance,Bypass Entrance,
Lower Downcomer1 0.2(0.656)
0.3114(3.352),0.0836(0.9),2.39(25.7)
107 Lower Plenum 1 0.5(1.640) 3.83(41.2)
Table 8: NuScale primary system RELAP5-3D model components and geometry.
A RELAP5-3D model for NuScale reactor is created through use of hydrodynamic
and heat structure components. Table 8 describes each item of the geometry informa-
tion in the primary system. The core is simulated with one channel with pipe com-
ponent, having the entirety of the assemblies and flow area in the early nodalization.
Later, this is changed and changes made are described. Middle riser, upper riser, pres-
surizer sections are modeled with pipe component, whereas upper, middle and lower
downcomer components were created with an annulus component with given values in
Table 8, which can be used for downward flow pipes. Heat structures are attached to
core, inserting power into the system. Ten axial nodes and eight radial nodes were used.
20
M.A.Sc. Thesis - C. Alkan; McMaster University - Engineering Physics.
Five radial nodes were used for simulating the fuel pellet, one node for gap material
between fuel pellet and fuel sheath, and two radial nodes for sheath material. Thermal
properties for each material are given with a heat conductivity and heat capacity table
which is dependent on the temperature value. Default UO2 and Zr sheathing tables
are used since M5 zirconium alloy sheating produced by Framatome, used in NuScale
reactor are proprietary. [8]
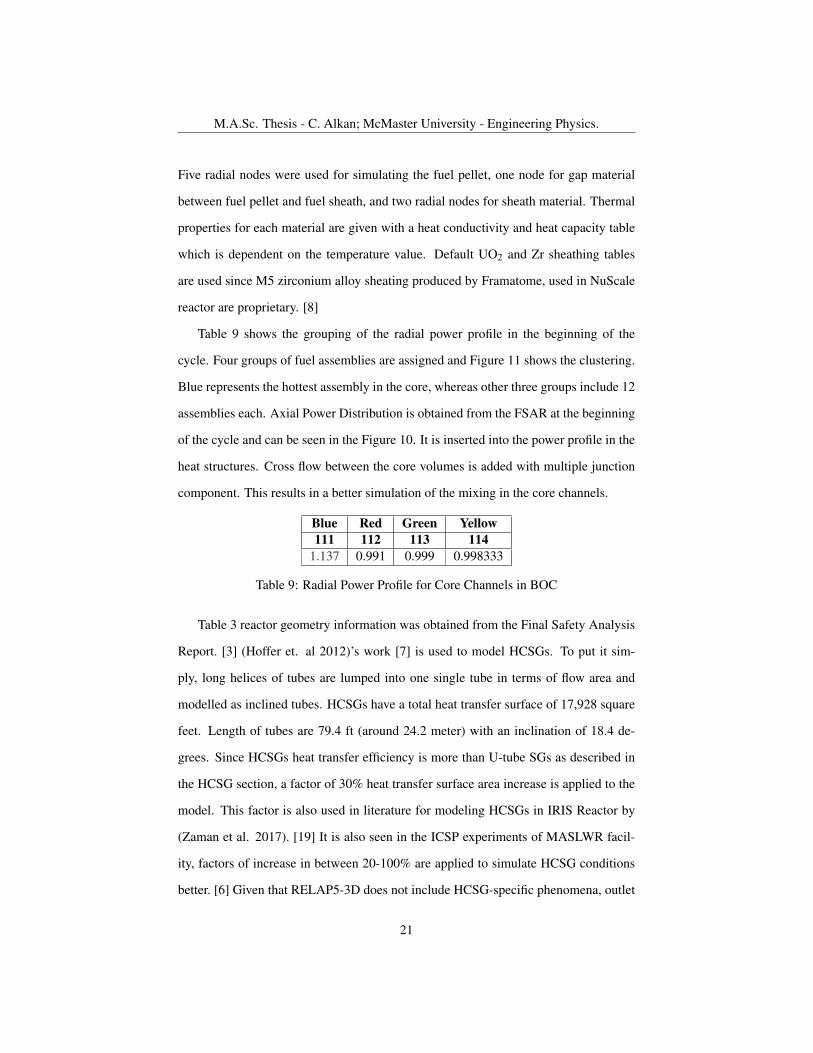
Table 9 shows the grouping of the radial power profile in the beginning of the
cycle. Four groups of fuel assemblies are assigned and Figure 11 shows the clustering.
Blue represents the hottest assembly in the core, whereas other three groups include 12
assemblies each. Axial Power Distribution is obtained from the FSAR at the beginning
of the cycle and can be seen in the Figure 10. It is inserted into the power profile in the
heat structures. Cross flow between the core volumes is added with multiple junction
component. This results in a better simulation of the mixing in the core channels.
Blue Red Green Yellow111 112 113 114
1.137 0.991 0.999 0.998333
Table 9: Radial Power Profile for Core Channels in BOC
Table 3 reactor geometry information was obtained from the Final Safety Analysis
Report. [3] (Hoffer et. al 2012)’s work [7] is used to model HCSGs. To put it sim-
ply, long helices of tubes are lumped into one single tube in terms of flow area and
modelled as inclined tubes. HCSGs have a total heat transfer surface of 17,928 square
feet. Length of tubes are 79.4 ft (around 24.2 meter) with an inclination of 18.4 de-
grees. Since HCSGs heat transfer efficiency is more than U-tube SGs as described in
the HCSG section, a factor of 30% heat transfer surface area increase is applied to the
model. This factor is also used in literature for modeling HCSGs in IRIS Reactor by
(Zaman et al. 2017). [19] It is also seen in the ICSP experiments of MASLWR facil-
ity, factors of increase in between 20-100% are applied to simulate HCSG conditions
better. [6] Given that RELAP5-3D does not include HCSG-specific phenomena, outlet
21
M.A.Sc. Thesis - C. Alkan; McMaster University - Engineering Physics.
conditions for HCSGs may also affect SGTR results.
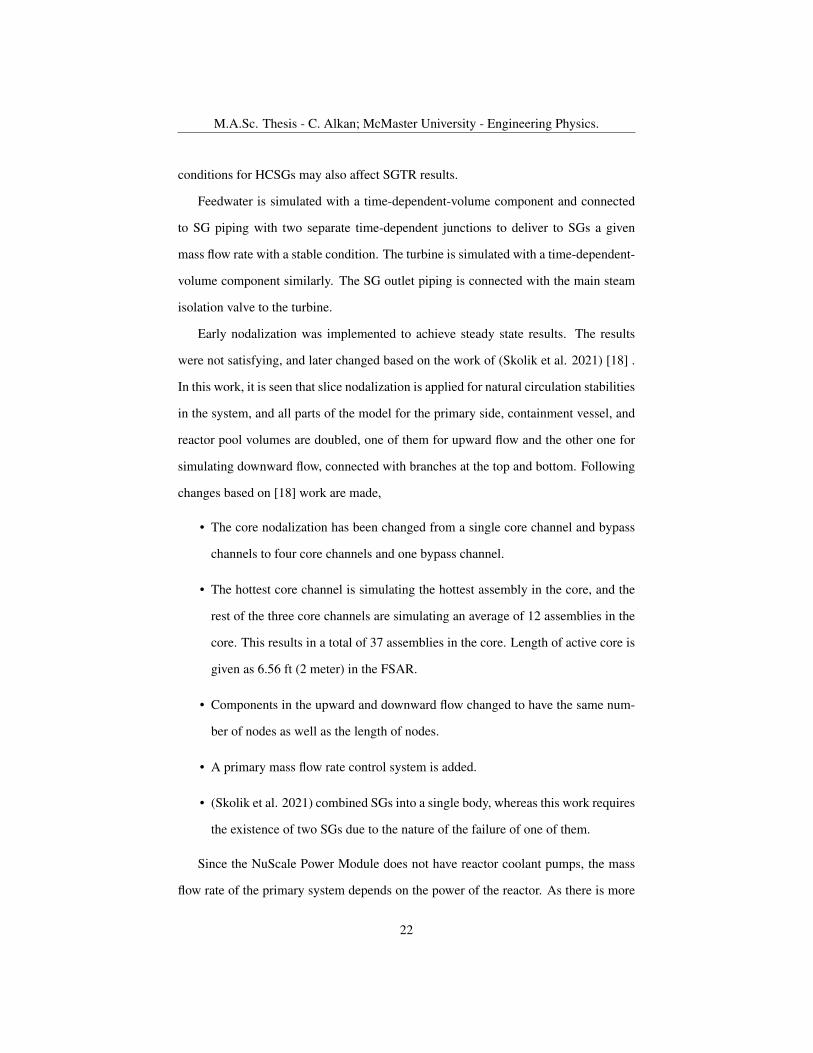
Feedwater is simulated with a time-dependent-volume component and connected
to SG piping with two separate time-dependent junctions to deliver to SGs a given
mass flow rate with a stable condition. The turbine is simulated with a time-dependent-
volume component similarly. The SG outlet piping is connected with the main steam
isolation valve to the turbine.
Early nodalization was implemented to achieve steady state results. The results
were not satisfying, and later changed based on the work of (Skolik et al. 2021) [18] .
In this work, it is seen that slice nodalization is applied for natural circulation stabilities
in the system, and all parts of the model for the primary side, containment vessel, and
reactor pool volumes are doubled, one of them for upward flow and the other one for
simulating downward flow, connected with branches at the top and bottom. Following
changes based on [18] work are made,
• The core nodalization has been changed from a single core channel and bypass
channels to four core channels and one bypass channel.
• The hottest core channel is simulating the hottest assembly in the core, and the
rest of the three core channels are simulating an average of 12 assemblies in the
core. This results in a total of 37 assemblies in the core. Length of active core is
given as 6.56 ft (2 meter) in the FSAR.
• Components in the upward and downward flow changed to have the same num-
ber of nodes as well as the length of nodes.
• A primary mass flow rate control system is added.
• (Skolik et al. 2021) combined SGs into a single body, whereas this work requires
the existence of two SGs due to the nature of the failure of one of them.
Since the NuScale Power Module does not have reactor coolant pumps, the mass
flow rate of the primary system depends on the power of the reactor. As there is more
22

M.A.Sc. Thesis - C. Alkan; McMaster University - Engineering Physics.
Primary System Temperatures and Flow RatesReactor Power Primary Flow Primary Coolant Temperature
% MWt % (kg/s) Core dT T_cold (F) T_avg (F) T_hot (F)Best Estimate Flow
0 0 0-12 0-68.5 0 42615 24 48 280 32 529 543 55850 80 76 444 67 512 543 57475 120 89 521.6 85 504 543 583100 160 100 587.0 100 497 543 590.1
Minimum Design Flow (kg/s)100 160 91.7 538.5 107.6 487.4 538.7 590.1
Maximum Design Flow (kg/s)100 160 112.5 660.5 89.65 507.8 548.9 590
Table 10: NuScale Primary System Flow Rates
power transferred to the coolant, the flow rate increases due to the larger temperature
difference in the riser region. Instabilities may occur during such a system, and these
instabilities are addressed in the Final Safety Analysis Report. To put it simply, if there
is a less than 5 degree Fahrenheit temperature difference in the riser region, the reactor
primary flow rate may be unstable and the reactor is not operable.
A control system in the upper riser with a servo valve component is added to
achieve the desired mass flow rate of 587 kg/s. (Flow rate best estimated with full
power) The control system works as a PID controller. Measured mass flow rate is sub-
tracted from target mass flow rate, and with a proportional integral value, the valve
opens and closes its stem position to achieve the targeted mass flow rate. A table is
added for primary flow rates and corresponding temperatures on the primary side. This
can be seen in the Table 10.
Pressurizer modeling during transient plays an important role. Pressurizer heaters
consist of two heaters, each of them having 400 kW electrical power. A heat structure
component is added to the bottom volume of the pressurizer to simulate heat addition
in the case of activation of heaters. When the pressure drops, the increased steam
produced by heaters provides additional pressure. When pressure increases, the spray
valve which is connected to top volume of pressurizer is activated and steam condenses
to liquid, providing pressure drop. Setpoints for these control are as the following,
23

M.A.Sc. Thesis - C. Alkan; McMaster University - Engineering Physics.
• Pressurizer heater is activated when pressure decreases to 1780 psia, and then it
is deactivated at 1850 psia.
• Pressurizer spray valve is activated at 1920 psia, and stops when pressure de-
creases to 1850 psia. (70 psia range)
Pressurizer spray valve is transferred through a pipe component which has down-
ward flow, with a flow area of 0.02181 square feet and length of 1 feet for each of the
nodes.
It is observed in the steady state run that the pressurizer level is lower than expected.
A spurious liquid adding volume is added to increase the pressurizer level to 6.48 ft of
expected value at the steady state values (60%). Later, it is increased to 7.34 ft (68%)
with the biases applied for the SGTR transient.
DHRS modeling is critical for heat removal during a reactor shutdown scenario.
While certain parameters, such as the heat transfer surface area, tube thickness, tube
diameter and the number of tubes in the DHRS, are specified, the detailed model for the
DHRS is not included in the FSAR. The length of tubes and piping system is assumed
in this case based on the work of (Skolik et al. 2021) [18]. The DHRS has a flow area
of 0.013 m2, or 0.14 square feet, and a total length of 42.65 feet for the heat-exchanger
section. Each DHRS train has a heat transfer surface area of 280.2 square feet, with a
heat structure connected to the reactor pool. Additionally, piping is included to connect
the DHRS system to the steam generators’ inlet and outlet. DHRS actuation valves are
added between piping of SG outlet and DHRS heat exchanger section.
Containment and reactor pool modeling is based on the parameters provided in
the FSAR. The containment vessel is a stainless steel vessel surrounding the RPV and
comprising ECCS valves, sitting inside a huge reactor pool which is the ultimate heat
sink. CNV also provides insulation of RPV, since it is vacuumed and removes the need
of simulating heat structures between RPV and outer sections. Usually in PWRs, CNV
is a large concrete structure with several different components inside such as reactor
24
M.A.Sc. Thesis - C. Alkan; McMaster University - Engineering Physics.
core and piping, steam generators, RCS pumps, CNV water collection sump, CNV
spray system, High and Low Pressure Injection Systems, Hydrogen Removal Systems
and so on. Containment design parameters and specifications are given in the Chapter
6, Engineered Safety Systems of NuScale FSAR. Figure 12 depicts the containment
geometry. As (Skolik et al. 2021) stated, for improving natural circulation stability,
slice nodalization is also applied to CNV and reactor pool components. [18].
A total length of 908 inches elevation from the ground is given for the contain-
ment vessel, approximately 76 ft which is around 23 meters with an inner diameter of
14.17 ft (4.32 meters), and outer diameter of 14.75 ft(4.5 meters). While modeling the
containment structure, the top and bottom sections of the containment are simulated
as branch components, whereas upward and downward flow are simulated as differ-
ent pipe components. Both pipe components have the exact same length and nodes as
the RPV but a different flow area. Another difference between CNV and RPV in the
model is the branches section. Branch components at the top and bottom are horizontal
volumes for simulating natural circulation in CNV better, and they have a length of
10 ft each, with flow areas of 650 square feet at the top and 10.0 square feet at the
bottom. Normally, the length of top CNV branch is expected to be 14.0 ft, considering
the CNV diameter. Due to loop closure errors that are encountered with RELAP5, the
length of the top branch is decreased and for compensation, flow area is proportionally
increased. It is important to stress that the lengths given here are not vertical lengths
but horizontal.
Assumption made for calculating top branch flow area, is that the control rod inser-
tion system and several components exist in that area although RPV is not located in
that space. The three RRVs and two RSVs are located above the RPV and are linked
to the containment top branch. RSVs have 3 inches of inner diameter and 4 inches of
outer diameter, with pressure setpoints of 2075 psia and 2100 psia. When the valves
open, 10% blowdown occurs from either of the valves. The minimum amount of steam
25

M.A.Sc. Thesis - C. Alkan; McMaster University - Engineering Physics.
that can be released from safety valves is 65,536 lbm/hr at 10% over pressure, which is
the equivalent of 18.2 lbm/s of steam. These two valves are only simulated for the sce-
nario of SGTR without DHRS. Two reactor recirculation valves (RRV) are also added
in the CNV model, connected from the CNV upward flow pipe component to the RPV
middle downcomer.
The initial condition for containment hydrodynamic structures is 0.09 psia (620
Pa), with a static quality of 1.0. The reactor building is also considered and filled with
air, instead of water. The flow area of the reactor pool is input as 2600 square feet for
each pipe component, with a length of 70 ft. The initial conditions for the reactor pool
are 14.7 psia (100 kPa) and 100 F (310 K).
The ECCS valve actuation signals are given as the following:
High CNV level actuation 252 inches (equivalent to 21 feet, 6.4 meter) above the
reactor pool floor, riser water low level actuation 30 ft (equivalent to 9.14 m), low
RCS pressure 800 psia (5.515 MPa), RPV low temperature and high pressure (LTOP)
actuation, which is a function of the RCS cold temperature, is not required here because
it is associated with reactor startup and has no effect on the SGTR findings.
Reactor Vent Valves are designed to interrupt opening of ECCS systems inadver-
tently. As described in the Chapter 6, Engineered Safety Systems, ECCS section, In-
advertent Actuation Block (IAB) features a spring-loaded pressure-differential system.
The spring system in the ECCS valves needs to have a pressure difference of less than
1300 psid between the two media to be actuated. For example, if the reactor pressure
is at 2000 psi, containment vessel pressure needs to be at 700 psi to be ECCS actuation
even if ECCS signals are actuated (which are described above). Also, if reactor pres-
sure can be reduced gradually, IAB releases at 950± 50 psi. It is also noted that IAB
does not interrupt valve opening for initial pressure of 900 psid or below. [4]
It is shown in Figure 12 how RSVs and RRVs are connected. In the model, they are
linked to the Containment Top Branch component. Sensitivity studies for containment
26

M.A.Sc. Thesis - C. Alkan; McMaster University - Engineering Physics.
volume, power and pressure were conducted for SGTR without DHRS event. HCSG
flow rate and heat transfer surface area sensitivity was conducted for achieving steady
state flow rate in the steam generators.When a multiplier used for simulating HCSGs,
oscillations occurred in the secondary side in the steady state runs. Due to that, instead,
surface area increase method is used.
Design Conditions Imperial Unit Value SI Unit ValueInternal Design Pressure 1050 psia 7.24 MPaExternal Design Pressure 60 psia 0.414 MPa
Design Temperature 550 °F 561 KDesign Maximum Containment Leakage 17.5 ft3/hr 137 cm3/s
UHS Pool Water Temperature 212 °F 373.15 KReactor Building Air Temperature 65 - 85 °F 292-303 K
Normal Operating Conditions (nominal)Internal CNV Pressure 0.09 psia 620 PaExternal CNV Pressure 60 psia 0.414 MPa
CNV Temperature (Atmosphere) 100 °F 311 KUHS Pool Water Level 68 - 69 ft 20.7-21.03 m
UHS Building Elevation 93 - 94 ft 28.3-28.6 mUHS Pool Water Volume 4 million gallons 15.14 million m3
UHS Pool Water (Avg) Temperature 100 °F 311 KReactor Building Air Temperature 75 ±10 °F 297±6 K
Lowest Service Temperature 40 °F 277.6 K
Table 11: Containment and Reactor Pool Parameters
27
M.A.Sc. Thesis - C. Alkan; McMaster University - Engineering Physics.
Figure 7: Early nodalization.
28

M.A.Sc. Thesis - C. Alkan; McMaster University - Engineering Physics.
Figure 8: Improved nodalization for natural circulation stability.
29

M.A.Sc. Thesis - C. Alkan; McMaster University - Engineering Physics.
Figure 9: Nodalization with Decay Heat Removal System Added
30

M.A.Sc. Thesis - C. Alkan; McMaster University - Engineering Physics.
Figure 10: Axial power profile in the NuScale power module [2].
Figure 11: Radial power profile in beginning of cycle.
31

M.A.Sc. Thesis - C. Alkan; McMaster University - Engineering Physics.
Figure 12: Containment vessel and ECCS modeling.
32

M.A.Sc. Thesis - C. Alkan; McMaster University - Engineering Physics.
Figure 13: Reactor pool modeling.
33

M.A.Sc. Thesis - C. Alkan; McMaster University - Engineering Physics.
Figure 14: Containment and reactor pool multiple junction connections.
34

M.A.Sc. Thesis - C. Alkan; McMaster University - Engineering Physics.
6 SGTR Events and SGTR Methodology
6.1 SGTR Events and Causes
This section describes SGTR events briefly, and also the model used for simulating
SGTR event in the NuScale reactor. (Macdonald et. al, 1996) notes that in PWRs,
SGTR accidents are the most common accidents.[11] A steam generator tube rupture
event can be described as a crack in one or several of the tubes of a steam generator,
causing the loss of the primary seal, which is one of the boundaries for the defense
in depth concept. The size of the break, the location of the break, and the number
of tubes involved are all important parameters to consider for the event. Causes of
accidents have been investigated in the past, and several reasons for SGTR events are
given below.
• Events of outer diameter stress corrosion cracking
• Flow induced vibration fatigue cracking
• Foreign objects in the tubes
• Wastage, fretting, denting, pitting of the tubes
To diminish the number of accidents or to mitigate the consequences, several precau-
tions are taken, such as maintenance and inspection of secondary sides, tube inspec-
tions, as well as controlling water chemistry. If the tubes are deemed not fit for service,
then a portion of the tubes may be plugged. This obviously decreases the total amount
of flow going through the system and decreases heat transfer occurring between the two
sides. On a side note, as stated earlier, HCSGs can withstand flow-induced vibrations
better than U-tube steam generators.
35
M.A.Sc. Thesis - C. Alkan; McMaster University - Engineering Physics.
Year Plant LocationFlow Rate
(kg/s)
Rupture
/LeakCause
1975 Point Beach 1 Wisconsin 7.875 Rupture Wastage
1976 Surry 2 Virginia 20.79 Rupture PWSCC
1979 Prairie Island 1 Minnesota 24.57 Rupture Loose parts
1982 Ginna New York 39.59 RuptureLoose parts
and tube wear
1987 North Anna 1 Virginia 37.8 RuptureHigh cycle
fatigue
1989 McGuire 1 North Carolina 31.5 Rupture ODSCC
1993 Palo Verde 2 Arizona 15.12 Rupture ODSCC
2000 Indian Point 2 New York 5.67 Rupture PWSCC
Table 12: Some of the past steam generator tube rupture events [11]
Although these events appear to have occurred in the past, more recently the San
Onofre Nuclear Generating Station located in California suffered from tube-to-tube
wear in the replaced U-tube steam generators in the years of 2011 and 2012. [17] Two
units were eventually permanently shut down by Southern California Edison, resulting
in higher emissions and higher utility bills in the state of California.
6.2 SGTR Model
Modeling of the SGTR event and applied biases is defined in this section. The main ob-
jective of the model is to maximize primary side pressure and assess the event accord-
ing to the acceptance criteria for non-LOCA events. The radiological consequences of
mass release from primary side to secondary side as well as how much of a total mass
could be released are not in the scope of this work. At first a model of such is thought
36

M.A.Sc. Thesis - C. Alkan; McMaster University - Engineering Physics.
Figure 15: Break Valve RELAP Model for SGTR Event
and implemented for SGTR event in the NuScale, considering general Loss of Coolant
Accident (LOCA) break modeling.
Break mass flow is diverted from Upper Downcomer’s the most bottom volume,
201-20 to a tmdpvol component. A control system measures the mass flow of this and
from another tmdpvol source term, same amount of mass with given temperature and
pressure is added into Steam generators lowest section, Component 400’s first volume.
Connection of such system diagram is given in Figure 15. The reason for choosing the
most bottom volume in this case would be that the pressure differential between both
sides would be greater than at other locations that are connected.
Later, it is seen that there are discrepancies in the results, and model is changed to
direct connection between the last volume of the upper downcomer and first volume
37
M.A.Sc. Thesis - C. Alkan; McMaster University - Engineering Physics.
Figure 16: Changed break valve RELAP model for SGTR event
of the SG-1 which are at the same level as can be seen in Figure 16. With the break
opening, it is also simulated that loss of AC power occurs at the same time, losing
feedwater and turbine.
Description Nominal BiasCore Power 160 MWt 163.2 MWt (+2%)
Pressurizer Pressure 1850 psia (12.76 MPa) 1920 psia (+70 psia)SG pressure 500 psia (3.45 MPa) 535 psia (+35 psia)
Feedwater Temperature 300 F (422.04 K) 290 F (-10 F) (416.48 K)Pressurizer Level 60% 68% (+8%)Location of Break - Bottom of SG
Table 13: SGTR Biases
Several biases are applied at the start of the event. High core power is related to
mass release in that it causes greater pressure differential between the main and sec-
ondary systems, resulting in a high break flow. Applying given biases are conservative
in terms of main and secondary side effects. Higher pressurizer pressure results in a
38

M.A.Sc. Thesis - C. Alkan; McMaster University - Engineering Physics.
higher secondary side pressure, as well as delayed low pressurizer pressure trip.
A scram signal is created with the given below levels for different components,
• Pressure of pressurizer lower than 1600 psia, (2.0 seconds delay)
• Pressure of pressurizer higher than 2000 psia, (2.0 seconds delay)
• Pressurizer level lower than 35.0 percent, (2.0 seconds delay)
If any of the above occurs, the reactor is tripped with a given delay and the decay
power curve is initiated for the reactor which can be seen in Figure 17. Decay heat
power input is given in the FSAR, with the assumption of the highest-value control rod
being stuck and not inserted in the core.
Figure 17: Decay heat power after reactor shutdown
In the SGTR event, turbine stop valves and feedwater isolation valves are activated
with loss of AC power. Main steam isolation valves are postulated to be successfully
39

M.A.Sc. Thesis - C. Alkan; McMaster University - Engineering Physics.
closed after reactor trip. Pressurizer pressure control and level control systems are
deactivated for the transient.
If this event is considered to challenge fuel integrity and DHRS does not success-
fully cool the system, there is a need to simulate ECCS systems as well. (Reactor
Vent Valves, Reactor Recirculation Valves). It is expected that the DHRS will be able
to cool down the reactor. Later, for a more severe scenario which is SGTR without
DHRS, ECCS components are simulated.
A steady state file is run for several thousand seconds to establish stability in the
system. Afterwards, using a restart file of the steady state file, a transient file is run.
A restart problem is simply an extension of a previous calculation, beginning from the
exact conditions present at a restart edit in that calculation. With given trip and initial
conditions which are input above, for maximizing the primary side pressure, break size
is chosen as 16% tube area split break, which is 0.00375 sq-ft.
A recent Masters thesis was published in the open literature for transient analysis
of HCSG tube rupture in NuScale with RELAP5-3D by Johnson, P. Kyle, 2021. [9]
Since the model used in the assessment is different in the sense of nodalization of the
primary system, modeling of the DHRS system for tube rupture event in this model,
modeling reactor core power in transient as well as modeling the pressurizer of the
primary system, the findings of the study cannot be compared directly to the ones
presented here.
40

M.A.Sc. Thesis - C. Alkan; McMaster University - Engineering Physics.
7 Results and Discussion
7.1 Steady State Results
Steady state results are given below. Comparison with the reference values of the Final
Safety Analysis Report is added with a table.
Parameter Reference CalculationCore Power (MWth) 160 160
Pressure (MPa) 12.76 12.76Primary flow rate (kg/s) 587.0 587.6
Core Inlet Temperature (K) 531.5 531.8Core Outlet Temperature (K) 587.04 583.7
Secondary Inlet Temperature (K) 422.04 422.04Secondary Outlet Temperature (K) 574.8 575.1
Secondary flow rate (kg/s) 67.06 74.5
Table 14: Steady state results and comparison to reference values.
In the steady state, core power and pressure are introduced to the system. The
primary mass flow rate of 587 kg/s is obtained with a control system, which is the
best-estimate primary flow rate in the FSAR. In a conventional PWR, a primary reactor
coolant pump controls the primary flow rate. Since NuScale lacks primary RCS pumps,
the flow resistance of the reactor’s components is critical for flow rate. The core inlet
and outlet temperatures are 531.8 K and 583.7 K. Temperature is 3 degrees cooler than
the original 587 K. This is mainly due to the secondary side flow rate being increased.
The secondary flow rate was increased because there was void fraction occurrence in
the hottest assembly with the lower flow rates than 76.6 kg/s. This could be because
HCSG specific phenomena such as heat transfer and pressure drop correlations are
not included in RELAP5-3D. The model of HCSGs in RELAP5-3D was previously
described in the model definition. For the primary mass flow rate, the calculation starts
with the initial condition of 587 kg/s. There is a slight oscillation occurring in the mass
flow rate at the start of event, though this is not important as the code tries to converge
to a result with level control system, heaters, spray valve and so on.
41

M.A.Sc. Thesis - C. Alkan; McMaster University - Engineering Physics.
The pressurizer pressure reaches to a stable value of 1850 psia(12.76 MPa) in the
calculations. The secondary side inlet temperature is inserted into the system through
a time-dependent volume with a time-dependent junction of 422 K. Coolant enters into
the single inclined tube in the liquid phase. Steam generation begins around 40-50%
of the way down the tube. Since steam is less dense than water, heat transfer decreases
as the fluid travels through the tube. Steam temperature rises to 575 K at the tube exit.
Both of the steam generators have the same mass flow rate of 37.25 kg/s in the steady
state run.
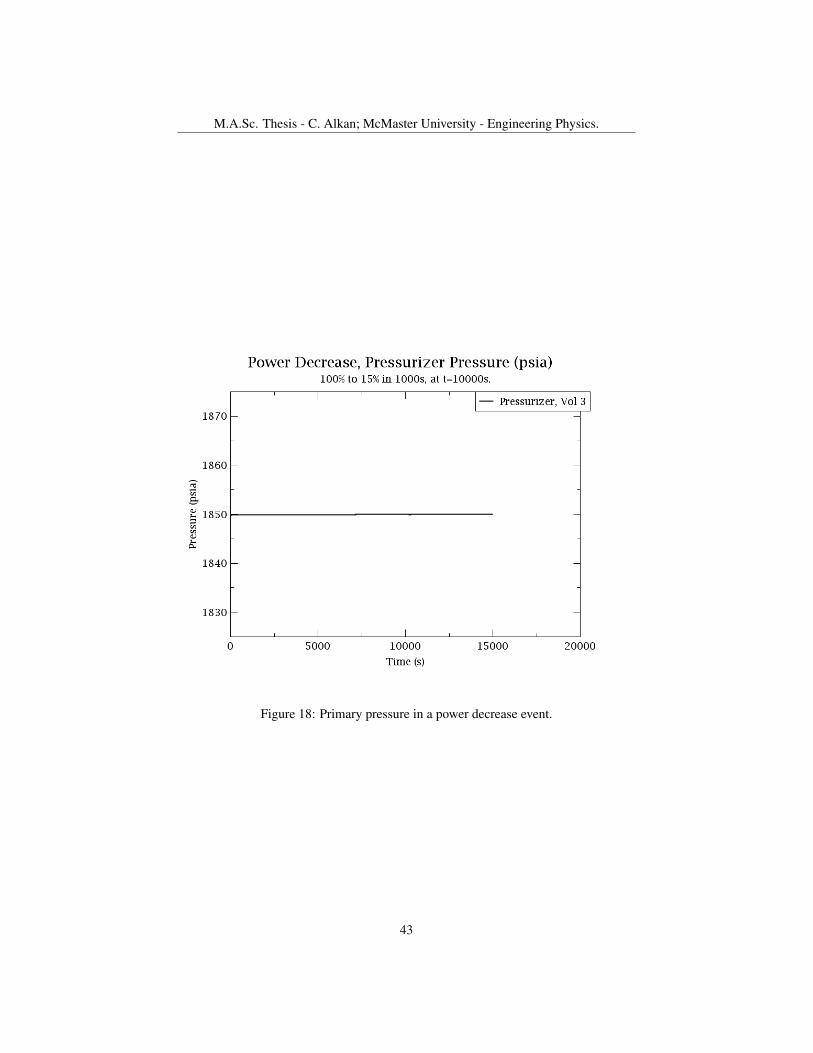
7.2 Power Decrease
A power decrease event in the reactor and corresponding reactor parameters of core
power, pressure, and primary mass flow rate are shown in Figures 18 and 19 to verify
that the primary flow with natural circulation is functioning properly. While the re-
actor is operating at full power (160 MWth) for 10,000 seconds, power is reduced to
15% (24 MWth) in 1,000 seconds. Table 10 shows the power and associated primary
flow rates. Figure 18 depicts the primary side pressure in the power decrease event.
Figure 19 shows reactor power in the event. Although power decreases, the pressure
control system is acting to stabilize the primary pressure at 1850 psia. There is a slight
decrease in the pressure at the start of power decrease, and this is compensated by acti-
vating heaters. The mass flow rate initially stabilizes around 587 kg/s. After the power
decrease, the flow rate decreases to 268 kg/s at the end of the event. In the power to
flow rate table, the best-estimate flow rate is given as 280 kg/s for 15% power. The
relative error of the flow rate is less than 5% in this case.
42
M.A.Sc. Thesis - C. Alkan; McMaster University - Engineering Physics.
Figure 18: Primary pressure in a power decrease event.
43

M.A.Sc. Thesis - C. Alkan; McMaster University - Engineering Physics.
Figure 19: Primary flow rate in a power decrease event.
44
M.A.Sc. Thesis - C. Alkan; McMaster University - Engineering Physics.
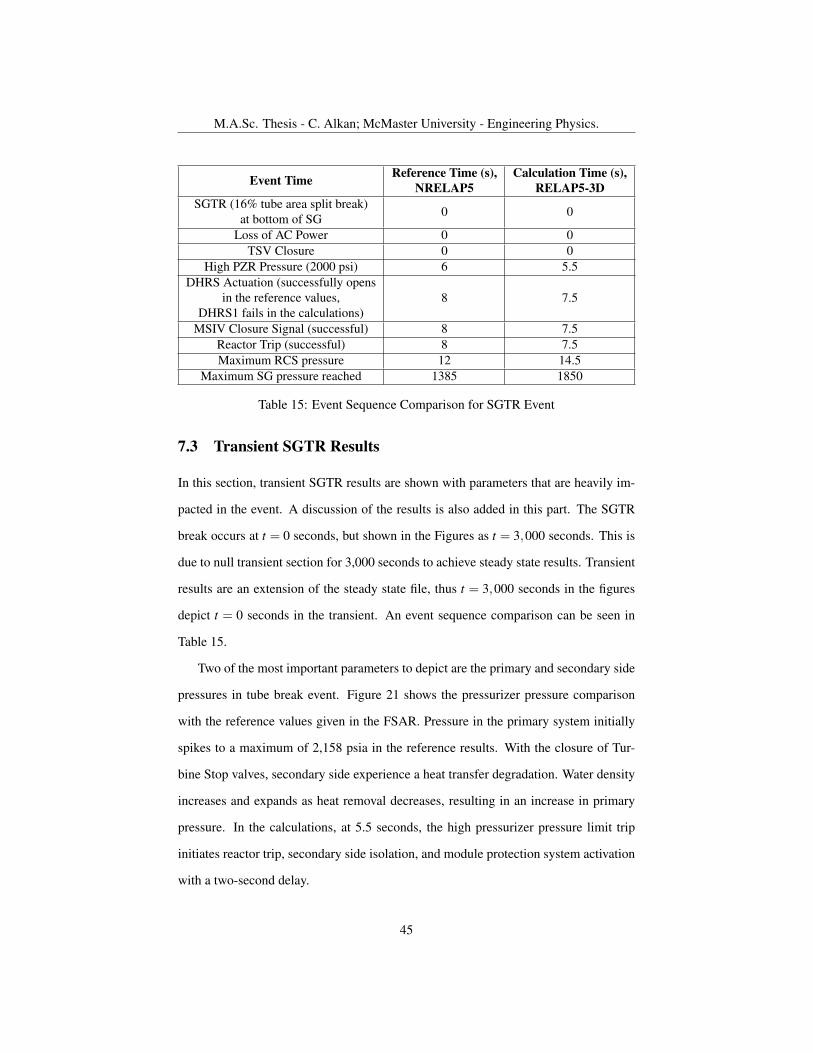
Event Time Reference Time (s),NRELAP5
Calculation Time (s),RELAP5-3D
SGTR (16% tube area split break)at bottom of SG 0 0
Loss of AC Power 0 0TSV Closure 0 0
High PZR Pressure (2000 psi) 6 5.5DHRS Actuation (successfully opens
in the reference values,DHRS1 fails in the calculations)
8 7.5
MSIV Closure Signal (successful) 8 7.5Reactor Trip (successful) 8 7.5Maximum RCS pressure 12 14.5
Maximum SG pressure reached 1385 1850
Table 15: Event Sequence Comparison for SGTR Event
7.3 Transient SGTR Results
In this section, transient SGTR results are shown with parameters that are heavily im-
pacted in the event. A discussion of the results is also added in this part. The SGTR
break occurs at t = 0 seconds, but shown in the Figures as t = 3,000 seconds. This is
due to null transient section for 3,000 seconds to achieve steady state results. Transient
results are an extension of the steady state file, thus t = 3,000 seconds in the figures
depict t = 0 seconds in the transient. An event sequence comparison can be seen in
Table 15.
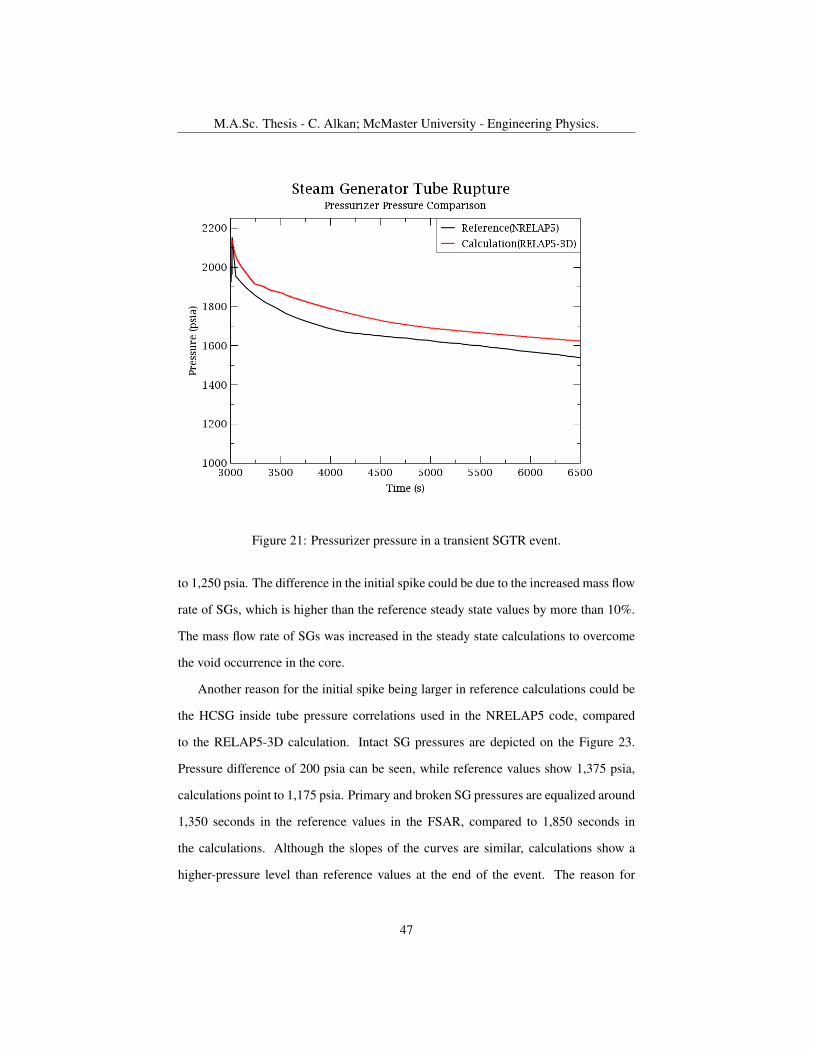
Two of the most important parameters to depict are the primary and secondary side
pressures in tube break event. Figure 21 shows the pressurizer pressure comparison
with the reference values given in the FSAR. Pressure in the primary system initially
spikes to a maximum of 2,158 psia in the reference results. With the closure of Tur-
bine Stop valves, secondary side experience a heat transfer degradation. Water density
increases and expands as heat removal decreases, resulting in an increase in primary
pressure. In the calculations, at 5.5 seconds, the high pressurizer pressure limit trip
initiates reactor trip, secondary side isolation, and module protection system activation
with a two-second delay.
45

M.A.Sc. Thesis - C. Alkan; McMaster University - Engineering Physics.
Figure 20: Reactor and steam generator power in a transient SGTR event.
Following a successful reactor trip, the power output rapidly decreases. The DHRS
actuation valve is used to activate the trains, although the broken SGTR’s DHRS actua-
tion valve is assumed to fail open, but intact SG’s DHRS successfully opens and steam
from the outlet SGs is diverted to DHRS. Calculations reveal an initial pressure spike,
reaching a maximum of 2,138 psia. When the intact DHRS is initiated, the pressure
drops to around 1,900 psia and continues to fall. Primary pressure is slightly higher
than reference values, this might be due to DHRS1 actuation valve being closed for
the entirety of the event as well as secondary side heat removal discrepancies. The
criterion for acceptance of the reactor pressure in the FSAR is specified as 120 % of
the design pressure, or 2,520 psia.
The Secondary side pressure comparison is shown in the figure. The reference
broken SG pressure shows a larger spike than calculations for broken SG at 1,575 psia
46
M.A.Sc. Thesis - C. Alkan; McMaster University - Engineering Physics.
Figure 21: Pressurizer pressure in a transient SGTR event.
to 1,250 psia. The difference in the initial spike could be due to the increased mass flow
rate of SGs, which is higher than the reference steady state values by more than 10%.
The mass flow rate of SGs was increased in the steady state calculations to overcome
the void occurrence in the core.
Another reason for the initial spike being larger in reference calculations could be
the HCSG inside tube pressure correlations used in the NRELAP5 code, compared
to the RELAP5-3D calculation. Intact SG pressures are depicted on the Figure 23.
Pressure difference of 200 psia can be seen, while reference values show 1,375 psia,
calculations point to 1,175 psia. Primary and broken SG pressures are equalized around
1,350 seconds in the reference values in the FSAR, compared to 1,850 seconds in
the calculations. Although the slopes of the curves are similar, calculations show a
higher-pressure level than reference values at the end of the event. The reason for
47

M.A.Sc. Thesis - C. Alkan; McMaster University - Engineering Physics.
Figure 22: Faulted SG pressure in a transient SGTR event.
this difference could be due to the scenario used in the calculations where the DHRS1
actuation valve is never opened, and less heat removal occurs through the only intact
DHRS2. In the reference values, faulted DHRS1 flow is able to transfer some heat to
the reactor pool for around 750 seconds and can be seen in Figure 24.
Figures 24 and 25 depict the comparison of DHRS flow rates during the transient.
While the reference intact DHRS shows a spike to 8 lb/s and stabilizes with a mass flow
rate of around 5 lb/s to 4.0 lb/s at the end of event, the intact DHRS flow rate initially
spikes at 15 lb/s and stabilizes at around 6.0 lb/s at the end. The broken SG’s DHRS
flow in the calculations is 0 lb/s as the DHRS1 actuation valve is closed throughout
the event, whereas the faulted DHRS flow rate is spiking to 8 lb/s, continues with 4
lb/s at the start of event and diminishes to zero in 1,350 seconds. It is also seen in the
reference values that DHRS flow starts 36 seconds after the event occurrence and 30
48
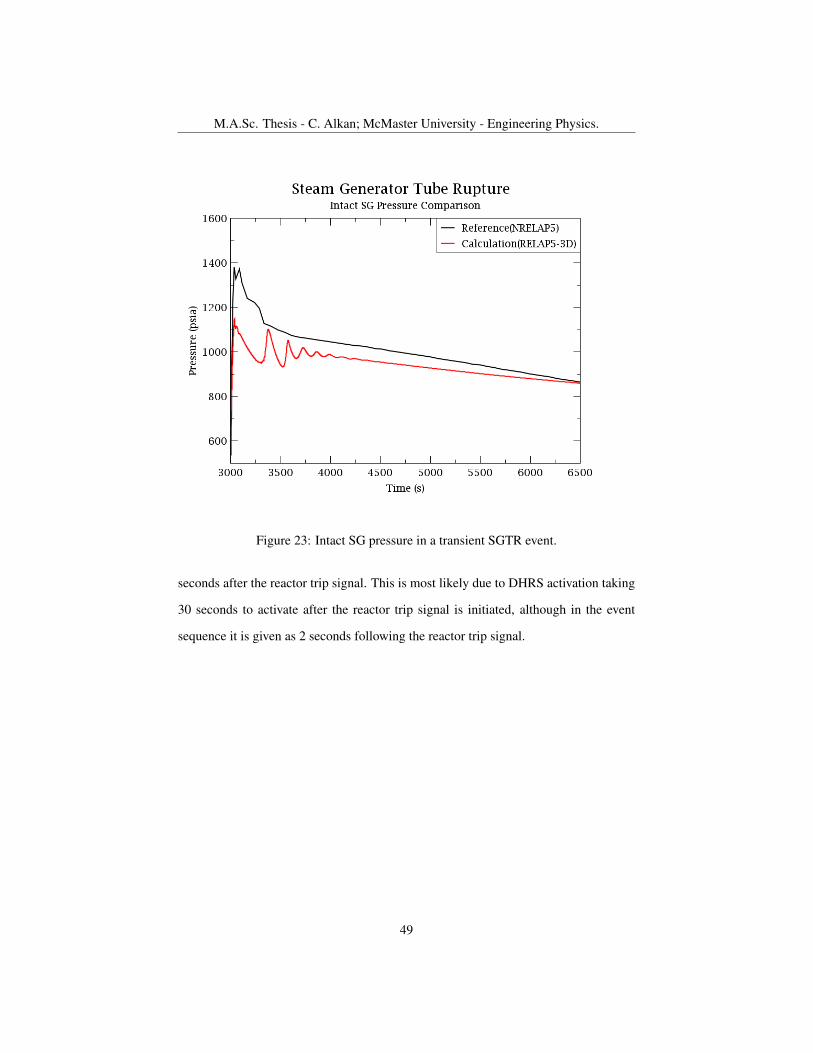
M.A.Sc. Thesis - C. Alkan; McMaster University - Engineering Physics.
Figure 23: Intact SG pressure in a transient SGTR event.
seconds after the reactor trip signal. This is most likely due to DHRS activation taking
30 seconds to activate after the reactor trip signal is initiated, although in the event
sequence it is given as 2 seconds following the reactor trip signal.
49
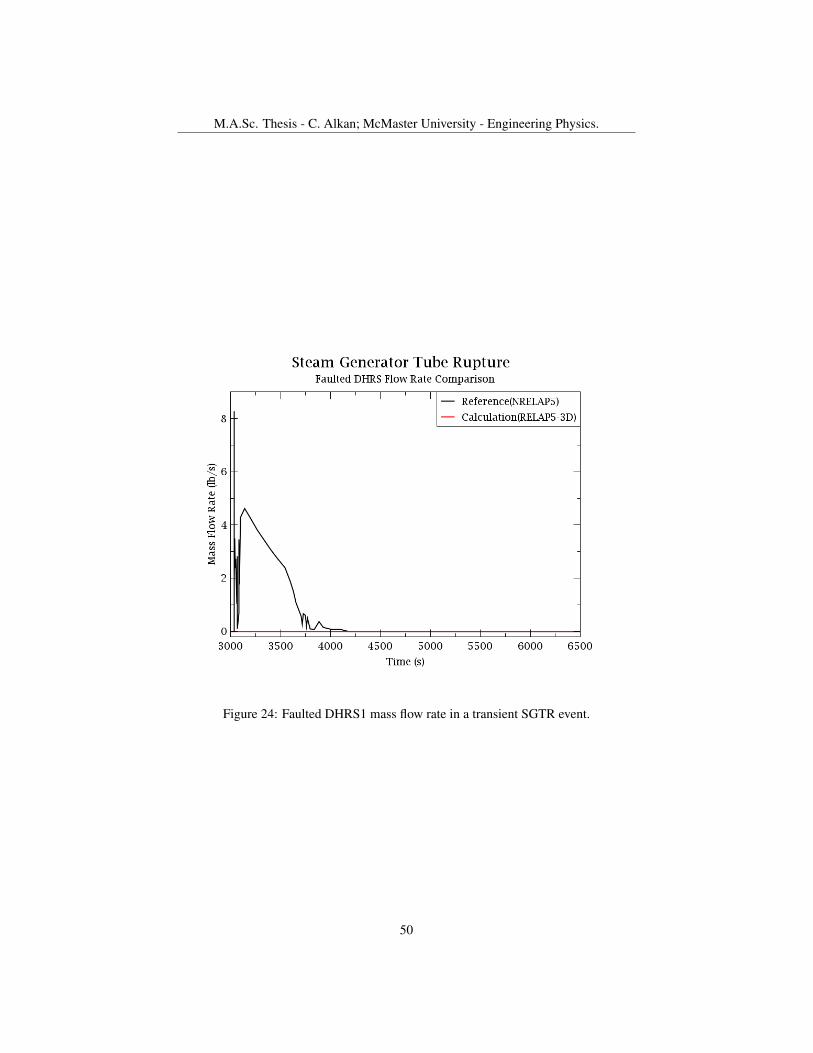
M.A.Sc. Thesis - C. Alkan; McMaster University - Engineering Physics.
Figure 24: Faulted DHRS1 mass flow rate in a transient SGTR event.
50

M.A.Sc. Thesis - C. Alkan; McMaster University - Engineering Physics.
Figure 25: Intact DHRS mass flow rate in transient SGTR event.
51
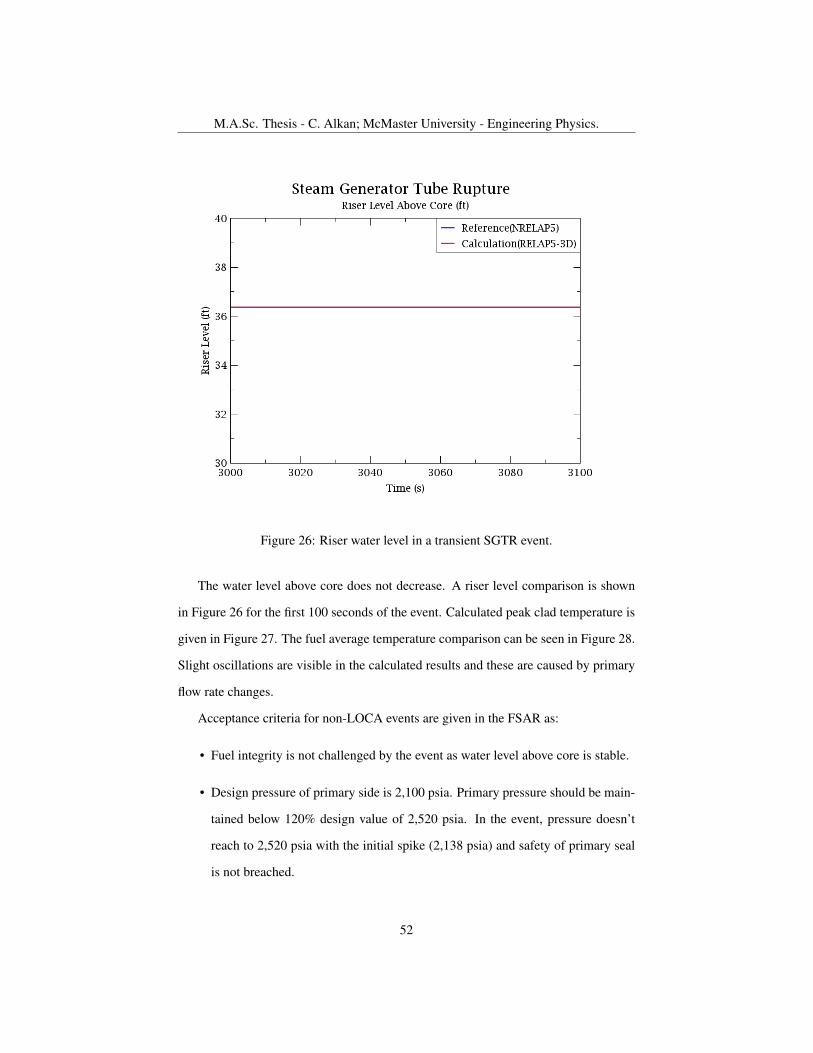
M.A.Sc. Thesis - C. Alkan; McMaster University - Engineering Physics.
Figure 26: Riser water level in a transient SGTR event.
The water level above core does not decrease. A riser level comparison is shown
in Figure 26 for the first 100 seconds of the event. Calculated peak clad temperature is
given in Figure 27. The fuel average temperature comparison can be seen in Figure 28.
Slight oscillations are visible in the calculated results and these are caused by primary
flow rate changes.
Acceptance criteria for non-LOCA events are given in the FSAR as:
• Fuel integrity is not challenged by the event as water level above core is stable.
• Design pressure of primary side is 2,100 psia. Primary pressure should be main-
tained below 120% design value of 2,520 psia. In the event, pressure doesn’t
reach to 2,520 psia with the initial spike (2,138 psia) and safety of primary seal
is not breached.
52
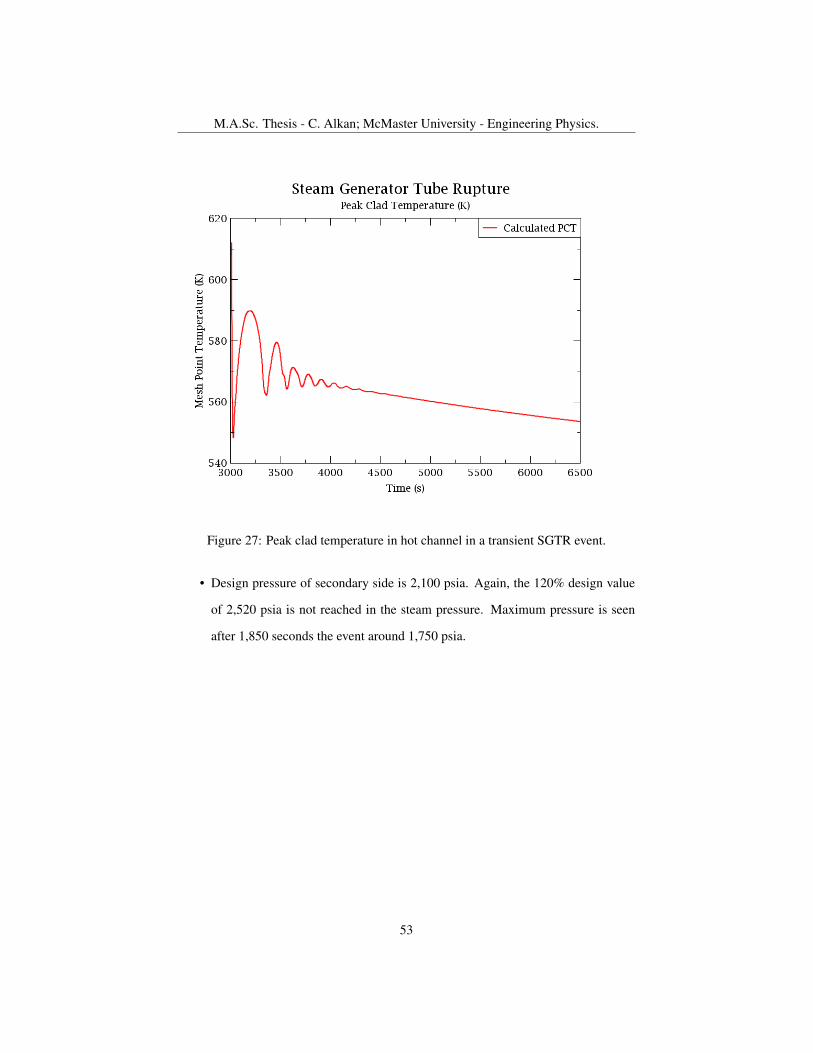
M.A.Sc. Thesis - C. Alkan; McMaster University - Engineering Physics.
Figure 27: Peak clad temperature in hot channel in a transient SGTR event.
• Design pressure of secondary side is 2,100 psia. Again, the 120% design value
of 2,520 psia is not reached in the steam pressure. Maximum pressure is seen
after 1,850 seconds the event around 1,750 psia.
53

M.A.Sc. Thesis - C. Alkan; McMaster University - Engineering Physics.
Figure 28: Fuel average temperature in a transient SGTR event.
54
M.A.Sc. Thesis - C. Alkan; McMaster University - Engineering Physics.
7.4 Transient SGTR without DHRS Results
In this scenario, a transient run with postulated failure of both DHRS valves is sim-
ulated to observe ECCS response to the reactor. The closest scenario to this event in
the FSAR is the Loss of Coolant Accident, although in the LOCA event, DHRS is
available for the removal of decay heat and decreasing pressure on the RPV. In this
chosen scenario, the pressure on the primary side steadily increases due to decay heat,
and pressure can only be released in small amounts through reactor safety valves. In
10 CFR 50.46, the acceptance criterion for emergency core cooling systems for light-
water nuclear power reactors is given as the following for the ECCS systems. Also in
10 CFR 50, Appendix K, ECCS Evaluation Models are specified.
• The calculated maximum fuel cladding temperature must not exceed 2,200 ◦F
(1477.6 K),
• The calculated maximum total oxidation of cladding must not exceed 17% of the
total cladding thickness before oxidation.
• The calculated total amount of hydrogen generated from the chemical reaction
of the cladding with water or steam must not exceed 0.01 times the hypothetical
maximum amount that could be generated.
• Calculated changes in core geometry shall be such that the core remains amenable
to cooling.
• After any calculated successful initial operation of the ECCS, the calculated core
temperature shall be maintained at an acceptably low value and decay heat shall
be removed for the extended period.
The event sequence is given in Table 16. The event starts with a single tube break in
the bottom of the SGs with the consequent loss of AC power, similar to earlier section
with break having 16% tube area. Only this time, both DHRS valves fail, leading to
55

M.A.Sc. Thesis - C. Alkan; McMaster University - Engineering Physics.
Event Time Calculation Time (s), RELAP5-3DSGTR (16% tube area split break) at bottom of SG 0
Loss of AC Power 0TSV Closure 0
High PZR Pressure (2000 psi) 6.6MSIV Closure Signal (successful) 8.6
Reactor Trip (successful) 8.6Maximum RCS pressure 11.0
DHRS Actuation ( both DHRS fails) 36.6CNV High Pressure Signal 3433
Low Riser Level Signal 6264CNV High Water Level Signal 11605
IAB threshold lifted ( ECCS Activation) 14647Maximum CNV pressure 14652
Minimum Riser Level 14652End Time 19000
Table 16: SGTR without DHRS event sequence.
an increase in pressure in the primary side, with no heat removal systems available.
The reactor trips successfully with high pressurizer pressure trip and power decreases
to decay heat levels. The Reactor Safety Valves with pressure set points of 2,075 and
2,100 psia are expected to release the excessive pressure to the Containment Vessel
until one of the ECCS signals is activated through trips. However, a threshold is put to
interrupt ECCS valves opening while reactor pressure is still at higher levels, which is
explained previously in the model definition section for ECCS valves. Steam which is
condensed through CNV walls that is in contact with reactor pool water, starts being
collected at the bottom of the CNV and leads to increase in the CNV water level.
In normal operation, the CNV is emptied and heat transfer between CNV and RPV
is negligible. In this case, heat structures are added between downcomer and lower
plenum section of the primary side, connected to upward flow CNV, considering the
heat transfer occurring between collected water at the bottom which is touching to outer
wall of RPV.
The Reactor Safety Valves mass flow rate is shown in Figure 29. Mass flow release
from a single RSV with 12 lb/s and around 15 lb/s in some occasions, can be seen in the
56

M.A.Sc. Thesis - C. Alkan; McMaster University - Engineering Physics.
Figure 29: Reactor safety valve flow rates in a transient SGTR without DHRS event.
same figure when the pressure reaches to the set point of 2,075 psi and the valve stays
open until pressure is reduced to 1,867 psi. A continuous release from the primary
side is visible, due to the pressure increasing steadily from the void occurrence in the
core due to decay heat. Void occurrence in the core is visible in Figure 30, as the void
fraction is greater than 0.0.
As the primary water level inside the RPV starts decreasing, a low riser signal
occurs around 6,250 seconds. As the water level decreases, the minimum level of
water above core is calculated as 1.2 ft at around 14,650 seconds. With the actuation
of ECCS signals and the Inadvertent Block Valve pressure-differential being less than
the threshold value of 1,300 psid, maximum containment pressure in the calculations is
1,030 psi, where the design limit of containment pressure is 1,050 psi. Before and after
release of RVV and RRVs, containment and RPV pressures can be seen in Figure 31
57

M.A.Sc. Thesis - C. Alkan; McMaster University - Engineering Physics.
Figure 30: Core water level in a transient SGTR without DHRS event.
and Figure 32. The Containment water level and riser water level are shown in Figures
33 and 34. The core water level is tracked, and is shown in Figure 30. The maximum
containment wall temperature is shown in Figure 35. The maximum containment wall
temperature obtained in the results was 543.8 K, whereas the design wall temperature
as given in the FSAR is 561 K. RVV and RRV mass flow rates are shown in Figures
36 and 37. The Reactor Vent Valves release more pressure to the Containment and
decrease primary coolant inventory at around 14,647 seconds. The presence of water
above the top of the core during the transient protects the core from CHF occurrence
and eliminates the need to calculate zircaloy oxidation in the core. Around 17,500
seconds in the figure, equivalent to 14,500 seconds in the transient time, a sharp line
occurs at the moment of ECCS activation. This is due to a massive amount of mass
released from the primary side to containment, almost equalizing the inside and outside
58
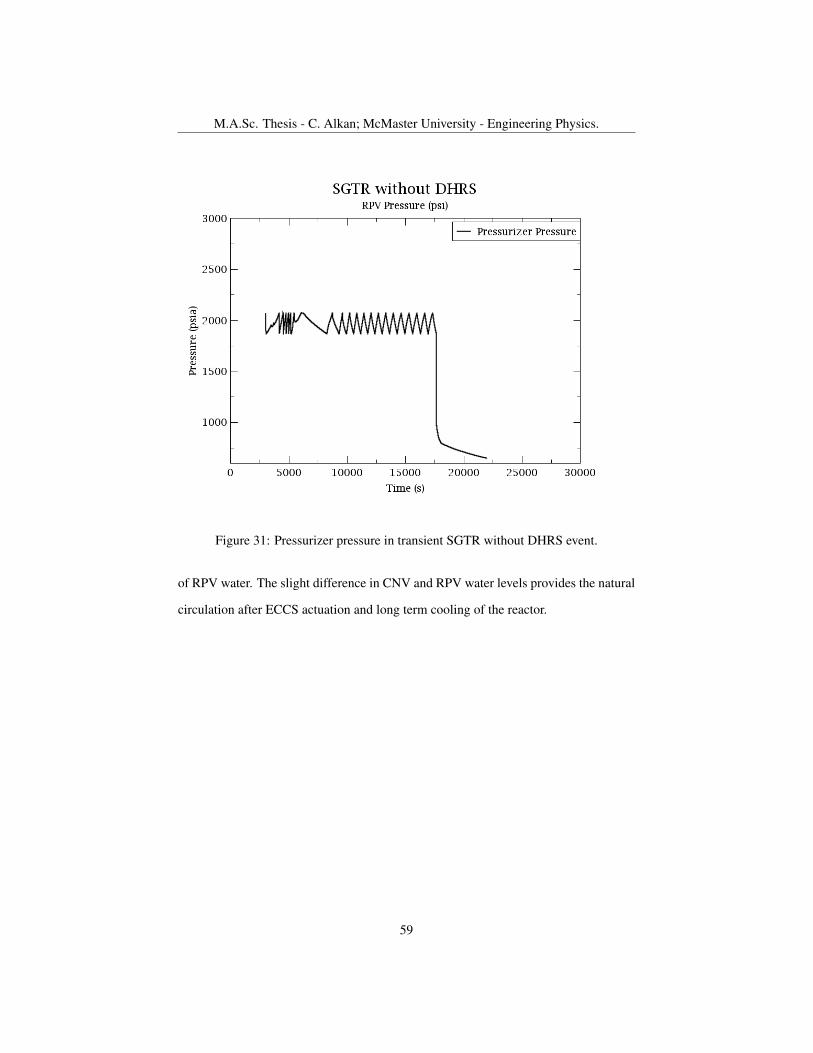
M.A.Sc. Thesis - C. Alkan; McMaster University - Engineering Physics.
Figure 31: Pressurizer pressure in transient SGTR without DHRS event.
of RPV water. The slight difference in CNV and RPV water levels provides the natural
circulation after ECCS actuation and long term cooling of the reactor.
59

M.A.Sc. Thesis - C. Alkan; McMaster University - Engineering Physics.
Figure 32: Containment pressure in a transient SGTR without DHRS event.
60
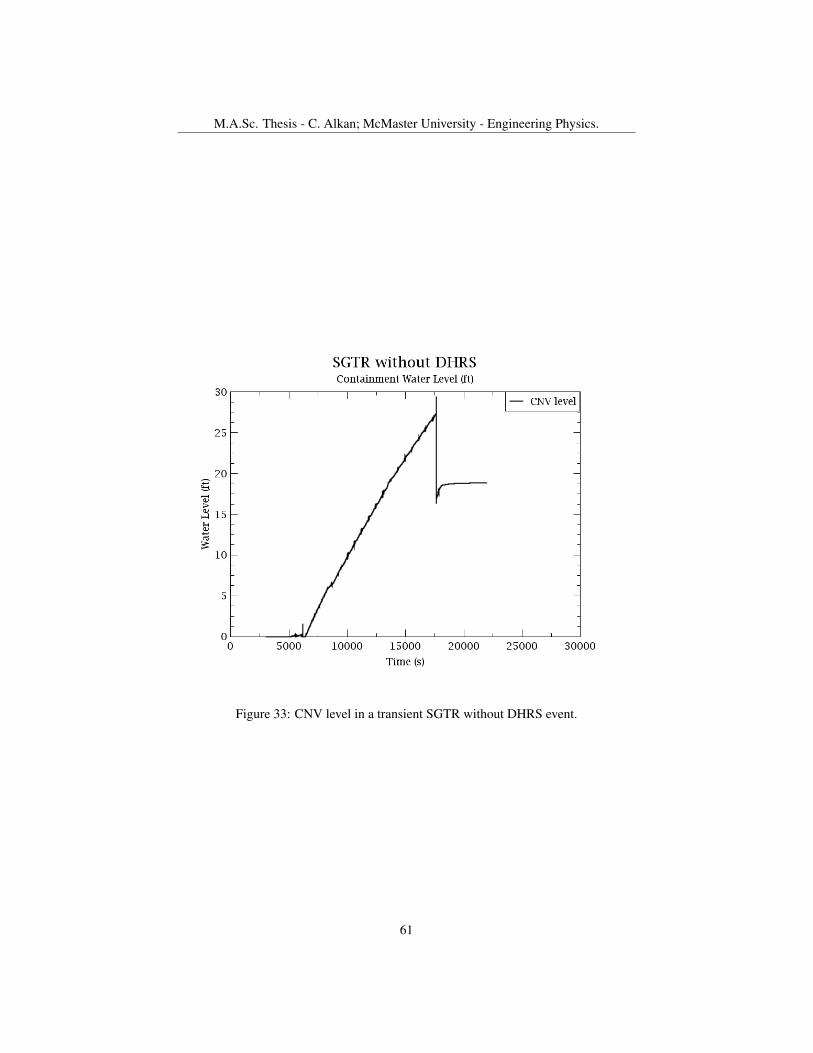
M.A.Sc. Thesis - C. Alkan; McMaster University - Engineering Physics.
Figure 33: CNV level in a transient SGTR without DHRS event.
61
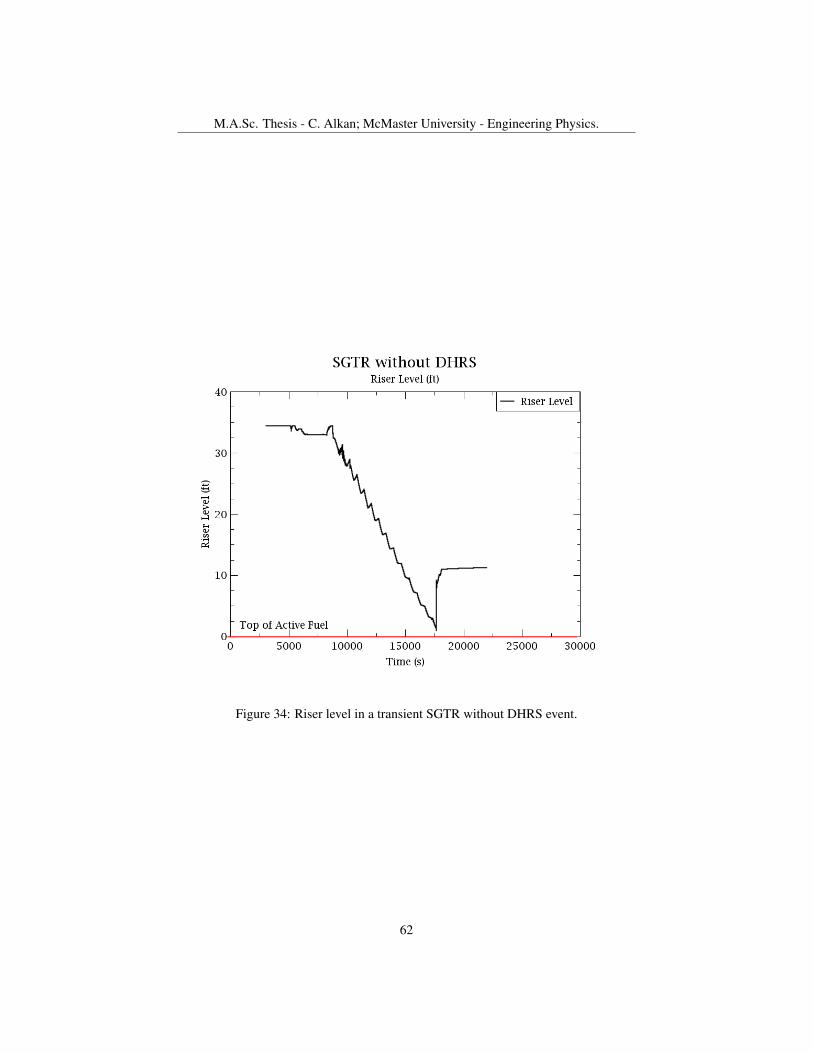
M.A.Sc. Thesis - C. Alkan; McMaster University - Engineering Physics.
Figure 34: Riser level in a transient SGTR without DHRS event.
62
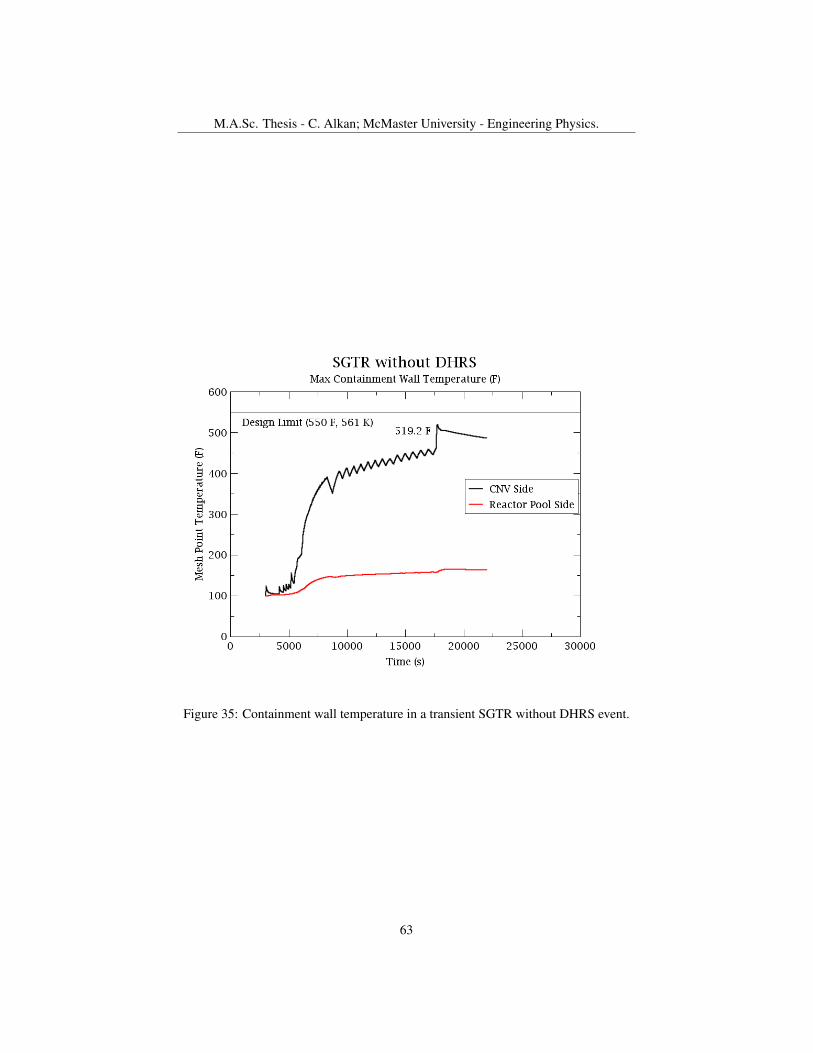
M.A.Sc. Thesis - C. Alkan; McMaster University - Engineering Physics.
Figure 35: Containment wall temperature in a transient SGTR without DHRS event.
63

M.A.Sc. Thesis - C. Alkan; McMaster University - Engineering Physics.
Figure 36: Reactor recirculation valve flow rates in a transient SGTR without DHRSevent.
64

M.A.Sc. Thesis - C. Alkan; McMaster University - Engineering Physics.
Figure 37: Reactor vent valve flow rates in a transient SGTR without DHRS event.
65

M.A.Sc. Thesis - C. Alkan; McMaster University - Engineering Physics.
8 Conclusions
The main objective of this work was to assess a postulated Steam Generator Tube
Rupture event in the NuScale SMR with evaluation of passive Decay Heat Removal
System, using the industrially renown RELAP5-3D code. A model was developed
based on the available data given in NuScale’s Final Safety Analysis Report. Its core is
modeled with three average channels, each having 12 assemblies and one hot channel
having a single assembly with radially highest power fraction. HCSGs were modeled
as double, lumped, inclined tubes with equivalent hydraulic diameter and flow area.
Steady state conditions were achieved and a power decrease event was simulated
with the model for observing natural circulation flow rate of the system. Although there
were no oscillations in the power decrease event, reactor shutdown and tube rupture
caused oscillations in the primary mass flow rate. The break location of the single
tube break with 16 percent flow area was chosen at the bottom of one of the steam
generators. Moreover, several biases were applied in the start of transient, such as an
increase in operating and secondary pressure, a decrease in feedwater temperature and
an increase in pressurizer level. This increases the pressure differential between RPV
and secondary side and causes the initial spike to be larger.
In the tube rupture event where single DHRS were available the simulation showed
that the broken steam generator’s initial pressure spike was slightly under-predicted
and long-term pressure decrease was over-predicted with respect to the FSAR. Fuel
average temperature and peak clad temperature were not challenged in the event. The
intact DHRS mass flow rate was calculated as 6.5 lb/s compared to the reference value
of 4.5 lb/s. Radiological consequences of an SGTR event and mass releases from the
secondary side were not in the scope of this work. Design pressures for the primary
and secondary sides were not challenged as the means of heat removal was sufficient
for such an event.
A severe accident was also simulated in the absence of a decay heat removal system
66

M.A.Sc. Thesis - C. Alkan; McMaster University - Engineering Physics.
in order to observe the reactor’s ECCS reaction to a severe accident. Although more
sensitivity tests may be necessary, the containment pressure and wall temperature were
predicted to be both below design levels. During the transient, the water in RPV was
still above the core level when the maximum containment pressure occurred.
9 Recommendations
Several challenges were encountered during this work. The secondary side mass flow
rate had to be increased from 67 to 74.5 kg/s to overcome void occurrence in the core
in the steady state results. The higher mass flow rate in SGs may impact transient
response of the system in the tube rupture event.
Modeling of the natural circulation proved challenging during transients. Modeling
natural circulation may be improved in RELAP5-3D in the future works to establish a
more stable flow rate after a transient.
HCSG specific correlations may also be incorporated and examined with existing
experimental data to see improvements on modeling HCSG with RELAP5-3D. Also,
oscillations were encountered in the secondary side flow while trying to implement
a multiplier for increasing heat transfer efficiency of HCSGs. Instead, a surface area
increase in the heat structures was implemented.
Valve flow areas of the RRV and RVVs might be different than what the original
design has, which may indicate that the mass flow rates also be different from the
design of the reactor. Containment modeling, especially flow obstructions between
reactor pressure vessel and containment vessel may need further sensitivity studies.
Volume of containment is significant for the reason it describes the level of containment
and water level of riser in the transient.
Trip delays may be put into sensitivity studies, such as MSIV, FWIV closure, DHRS
actuation.
67
M.A.Sc. Thesis - C. Alkan; McMaster University - Engineering Physics.
10 References
[1] Chapter 1, Introduction and General Description of the Plant, NuScale Standard
Plant Design Certification Application, Revision 5. Tech. rep. NuScale Power
LLC., July 2020.
[2] Chapter 4, Reactor, NuScale Standard Plant Design Certification Application,
Revision 5. Tech. rep. NuScale Power LLC., July 2020.
[3] Chapter 5, Reactor Coolant System and Connecting Systems, NuScale Standard
Plant Design Certification Application, Revision 5. Tech. rep. NuScale Power
LLC., July 2020.
[4] Chapter 6, Engineered Safety Systems, NuScale Standard Plant Design Certifi-
cation Application, Revision 5. Tech. rep. NuScale Power LLC., July 2020.
[5] Canadian Nuclear Safety Commission. List of Pre-Licensing Vendor Design Re-
views of SMRs. URL: https://nuclearsafety.gc.ca/eng/reactors/
power-plants/pre-licensing-vendor-design-review/index.cfm.
(accessed: 29.11.2021).
[6] Evaluation of Advanced Thermohydraulic System Codes for Design and Safety
Analysis of Integral Type Reactors. TECDOC Series 1733. Vienna: Interna-
tional Atomic Energy Agency, 2014. ISBN: 978-92-0-100314-0. URL: https:
//www.iaea.org/publications/10658/evaluation-of-advanced-
thermohydraulic-system-codes-for-design-and-safety-analysis-
of-integral-type-reactors.
[7] Nathan V. Hoffer, Nolan A. Anderson, and Piyush Sabharwall. “Development
and Transient Analysis of a Helical-coil Steam Generator for High Temperature
Reactors”. In: Journal of Young Investigators 22.2 (Aug. 2011). URL: https:
//www.osti.gov/biblio/1034126.
68

M.A.Sc. Thesis - C. Alkan; McMaster University - Engineering Physics.
[8] Incorporation of M5 Properties in Framatome ANP Approved Methods, BAW-
10240(NP), Revision 0. Tech. rep. Framatome ANP Inc., October 2002.
[9] Kyle P. Johnson. “Transient Analysis of the NuScale Power Helical-Coil Steam
Generator Tube Rupture Using RELAP5-3D”. MA thesis. University of Rhode
Island, 2021.
[10] E.E. Lewis. Nuclear Power Reactor Safety. Wiley-Interscience publication. Wi-
ley, 1977. ISBN: 9780471533351. URL: https://books.google.ca/books?
id=LuRBAAAAIAAJ.
[11] P. E. MacDonald et al. “Steam generator tube failures”. In: (Apr. 1996). DOI:
10.2172/236258. URL: https://www.osti.gov/biblio/236258.
[12] NRELAP5: Code Description and Assessment, PM-1015-18414-NP, Revision 0.
Tech. rep. NuScale Power LLC., 2016.
[13] Office of Nuclear Regulatory Research. Regulatory Guide 1.203, Transient and
Accident Analysis Methods. Tech. rep. U.S. Nuclear Regulatory Commission,
December 2005.
[14] D.G. Prabhanjan, Vijaya Raghavan, and Timothy Rennie. “Comparison of heat
transfer rates between a straight tube heat exchanger and a helically coiled heat
exchanger”. In: International Communications in Heat and Mass Transfer 29
(Feb. 2002), pp. 185–191. DOI: 10.1016/S0735-1933(02)00309-3.
[15] REGDOC 2.4.1, Deterministic Safety Analysis. Tech. rep. Canadian Nuclear
Safety Commission, May 2014.
[16] RELAP5-3D Code Manual Volume II: User’s Guide and Input Requirements,
Appendix A, INL/MIS-15-36723-V2, Revision 4.4. Tech. rep. Idaho National
Laboratory, 2018.
[17] San Onofre Nuclear Generating Station Unit 2 Return To Service Report. Tech.
rep. Southern California Edison, 2012.
69

M.A.Sc. Thesis - C. Alkan; McMaster University - Engineering Physics.
[18] Katarzyna Skolik et al. “Analysis of loss of coolant accident without ECCS
and DHRS in an integral pressurized water reactor using RELAP/SCDAPSIM”.
In: Progress in Nuclear Energy 134 (2021), p. 103648. ISSN: 0149-1970. DOI:
https://doi.org/10.1016/j.pnucene.2021.103648. URL: https://
www.sciencedirect.com/science/article/pii/S0149197021000202.
[19] Fakhar Uz Zaman et al. “Thermal hydraulics analysis of a helical coil steam
generator of a small modular reactor”. In: Annals of Nuclear Energy 109 (2017),
pp. 705–711. ISSN: 0306-4549. DOI: https : / / doi . org / 10 . 1016 / j .
anucene . 2017 . 06 . 002. URL: https : / / www . sciencedirect . com /
science/article/pii/S0306454916305527.
70