RR - 75 - 14
INTERNATIONAL INSTITUTE FOR I IASA APPLIED SYSTEMS ANALYSIS
RESEARCH RE PORT
SCHLOSS LAXENBURG 2361 Laxenburg
AUSTRIA
RR-75-14
AVOIDANCE RESPONSE TO THE RISK ENVIRONMENT:
A CROSS-CULTURAL COMPARISON
Harry J. Otway
R. Maderthaner
G. Guttmann
June 1975
Research Reports are publications repo rting on the work of the authors. Any views or conclusions are those of the authors, and do not necessarily reflect those of IIASA .
Avoidance Response to the Risk Enviroranent:
Surrrna.ry
A Cross-cultural CCJTiparison1
2 Harry J. otway
R. Maderthaner3
G. Guttmann3
A field survey was performed in Vienna, Austria, as a replication of one previously done in Ontario, Canada, with the objective of exploring attitudes tc:::Wclrd various types of enviroranental risk. Subjects WE:!re asked to rate fifteen hazard situations in order of their wish to ~yotd ~~ the ;reSJ?Ons:es. we;r.-e then used to construct a risk avoidance ranking orlier •• The rank size correlation coefficient for the tota.1. Austrian and Canadian groups was 0. 62. In the Canadian sample the respondent's personal experience with specific hazards was an important factor in detennining ranking (experienced respondents vs. inexperienced r = 0 .45) • This was not found in the Austrian sample, r = 0. 81. The largest ranking difference in the Austrian group was related to the resix>ndent's self-estimated ability to imagine specific hazard situations (good imaginability vs. poor r = 0.59) . Plans for further psychometric field surveys oriented specifically tc:Mard risks of technological origin are presented.
I . Introduction
Infonnation on societal attitudes and behavioural patterns fonn an irrportant input into decisions regarding the selection and deployment of large-scale techno-
~e views expressed in this paper are those of the authors, and do not necessarily reflect those of the project sponsors.
2International Atanic Energy 'kjency, Joint IAEA/IIASA Research Project, P.O. Box 590, A-1011 Vienna, Austria.
3Psychologisches Institut der Universit!t Wien, Liebiggasse 5, A-1010 Vienna, Austria .
- 2-
logical systems (see, for example, reference 3). Of special interest are the second and higher order consequences of those decisions which are probabilistic in terms of both occurrence and magnitude of consequence. These risks, in many cases, are the daninant factor in the acceptance of technological innovations by the public.
Obviously the perception of risks is a vital factor in fonning attitudes t.CMard them. In the case of risks of technological origin there has been relatively little research in this area and there is no body of behavioural theory to which hypothesis can be related. This paper will report on a field survey perfonred in Vienna, Austria, to determine attitudes tc:Mard a number of environmental risks. The survey used was the Avoidance Resp:>nse Test of Golant and Burton [ 2 ] who were investigating attitudes, in I..ondon, Ontario, canada, tCMards natural hazards. The Vienna survey was intended as a preparatory step to the design of psycharetric surveys specific to the investigation of technological risks.
II. Objectives
The primary objectives of this work were to gain experience in administering this type of field survey and to develop canputer prograrnnes for data analysis. The Avoidance Response Test of Golant and Burton was selected because it was available to us in detail and had been already run with a group in canada, thus allCMing, at the same tirre, a limited crosscultural carparison of the response to SCITE risk situations.
III. Test Description
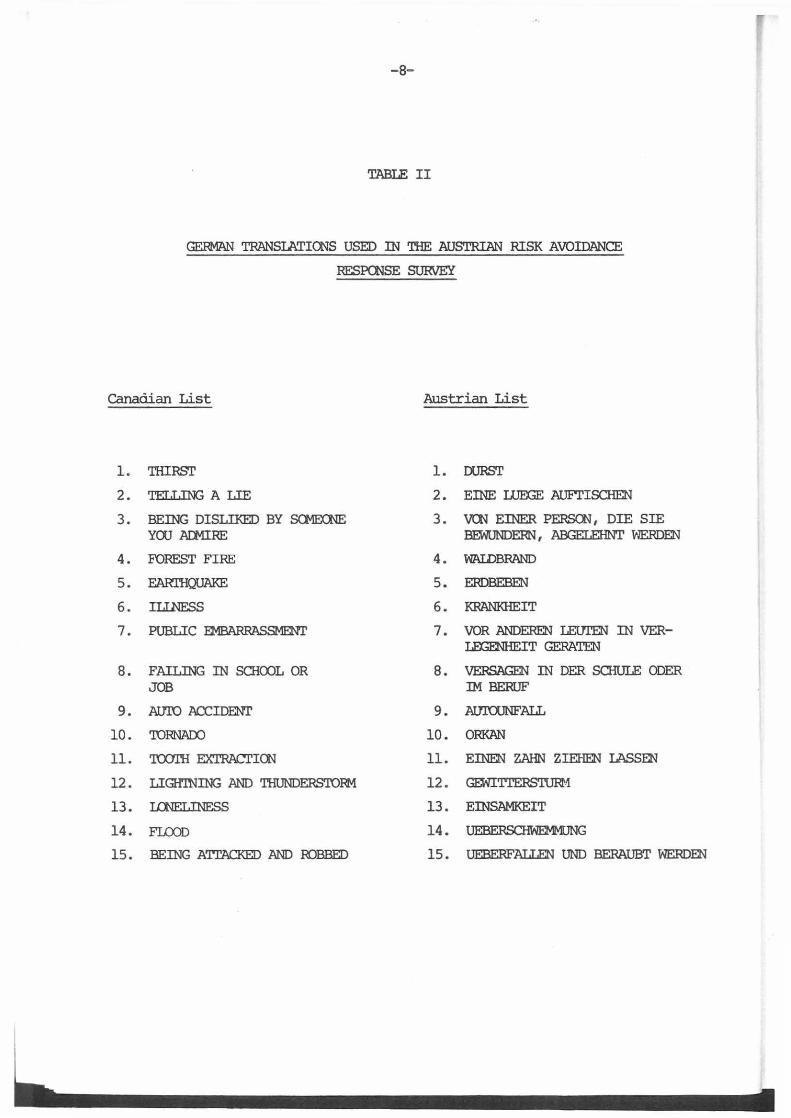
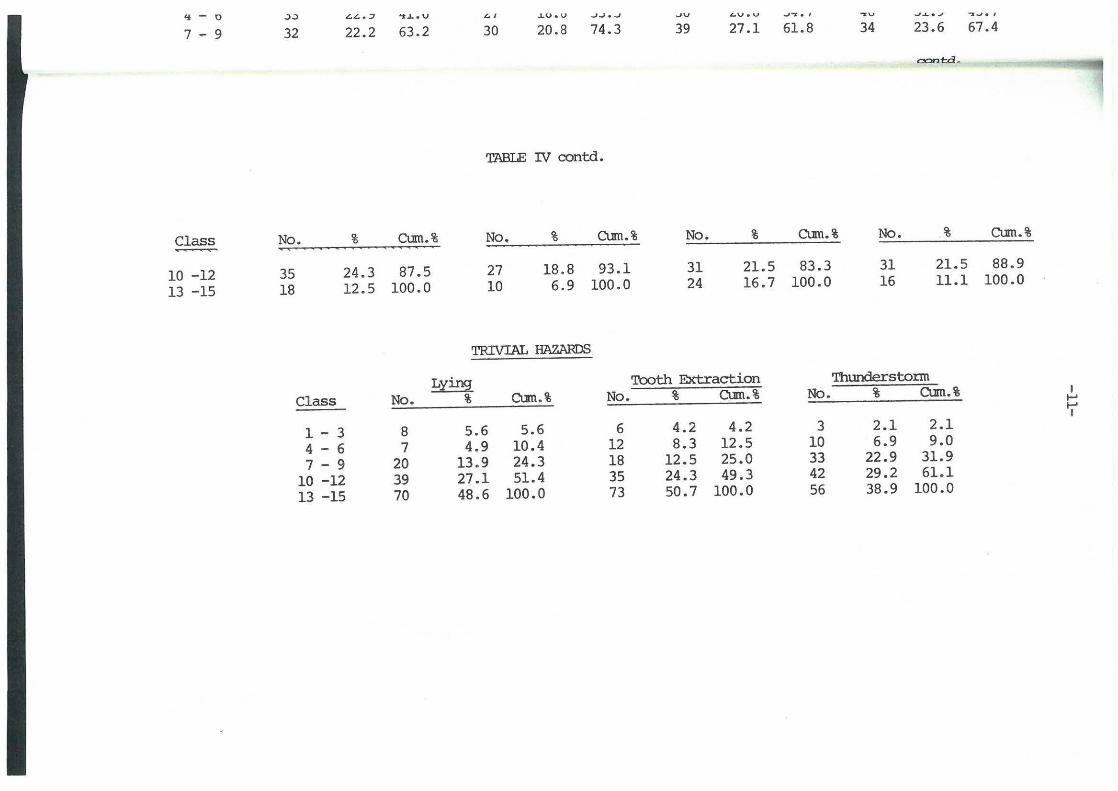
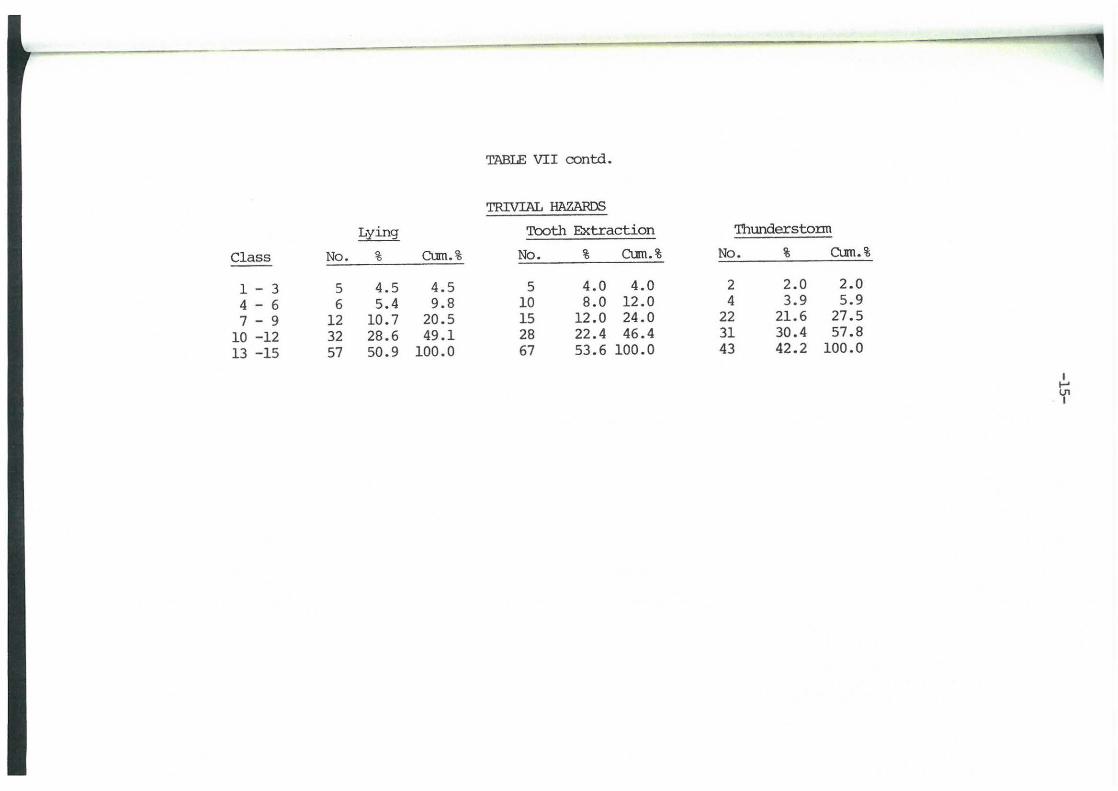
Respondents were given a test fonn listing the fifteen hazard situations of Table I (the German translations used are given in Table II) and were instructed to rank them in tenns of their desire to avoid them. As in the Canadian sample, rrost of the resp:>ndents found three of the situations (telling a lie , tooth extraction , lightning and thunderstonn) as being trivial, leaving essentially twelve hazard situations to be ranked. No attempt was made to tell respondents what to think about specific hazards, e.g. severe or minor auto accident. They were told to respond to the items as presented without seeking further information .
Four of the situations may be described as physical hazards (thirst, illness, auto accident, being attacked and robbed), :inplying discanfort or injury to the person; another group contains social hazards (being disliked by sareone you admire, public embarrassment, failing in school or job, loneliness} , :inplying psychic (non-physical) discanfort or injury; the others are natural hazards (forest fire , eart:h:p.iake, tornado, flood) • Golant and Burton emphasised that, in speaking of social, physical or natural hazards, it must be kept in mind that only the specific hazards of Table I are being considered and it is not possible, fran these studies, to speak of avoidance to these general categories of hazard.
t
ic
ClS
ial, nade 1or
~s
-3-
Although the main anphasis was on the group response to the hazard situations, a limited effort was made to examine the effect of individual attributes upon responses. The Canadian study selected for this purpose the respondents' experience, or lack of it, with particular hazards, several ·socio-econanic traits, and two personality dimensions . The Austrian study added the self-rated ability of subjects to imagine themselves in specific hazard situations.
4 Results
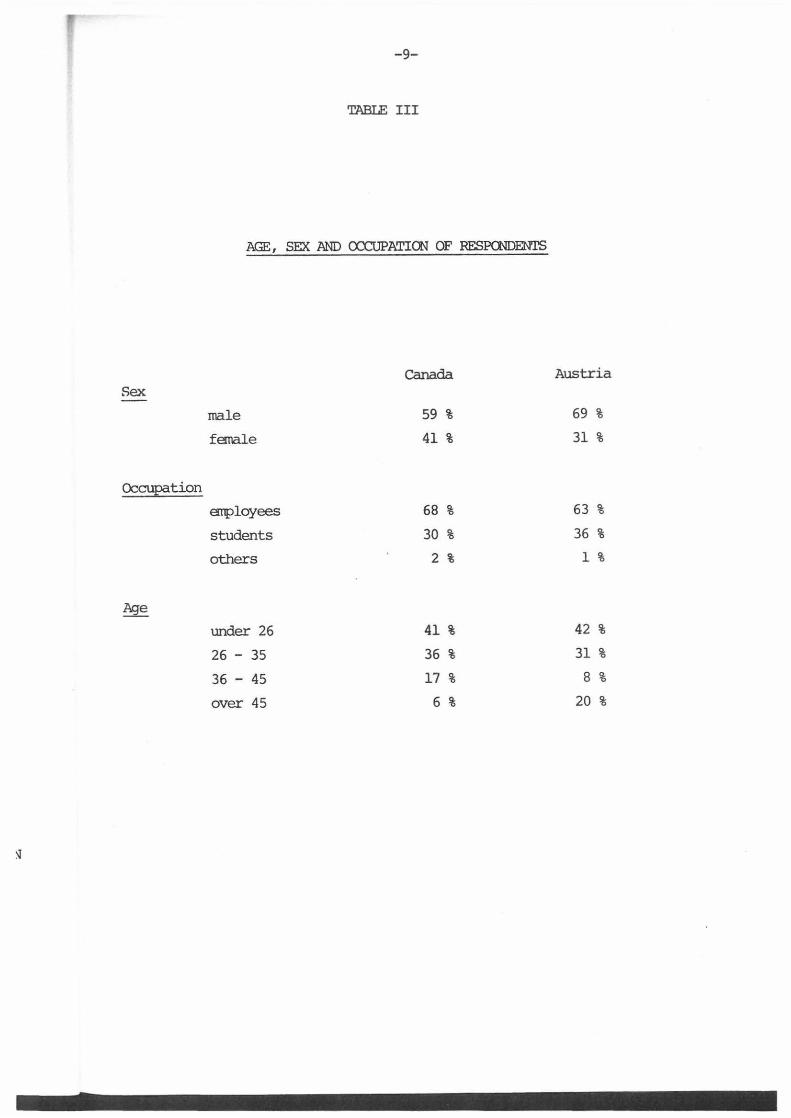
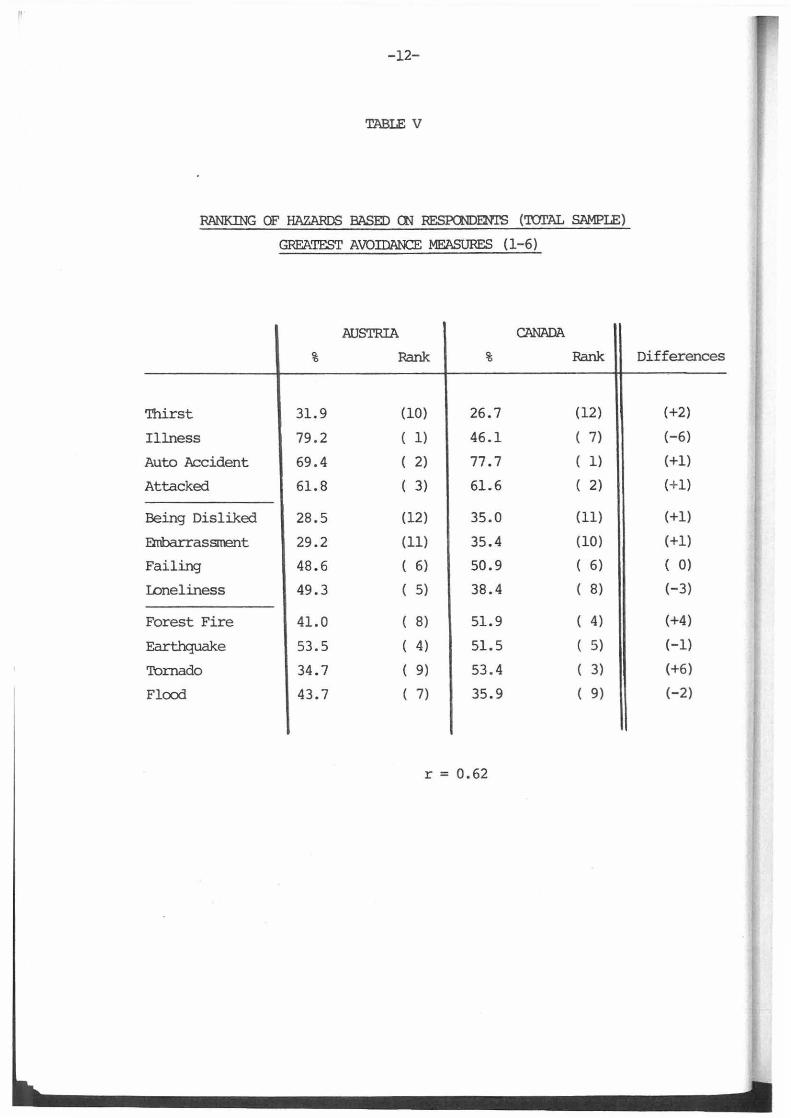
The sample of this study consisted of 144 respondents, rrost of whan were either administrative anployees or students in Vienna. Table III shows a breakdown by age, sex and occupation. The subjects expressed their rank preferences for avoiding the hazard situations of Table I. The initial rankings were distributed into five classes and frequency distributions we.re produced for each hazard (Table IV). Rankings of 1 to 6 were said to be representative of a respondent wanting to rrost avoid a specific hazard situation, making it possible to construct the overall hazard avoidance ranking of Table V. The rank size correlation coefficient for the total Canadian and Austrian samples was 0.62 .
A. Respondents' Hazard Experience
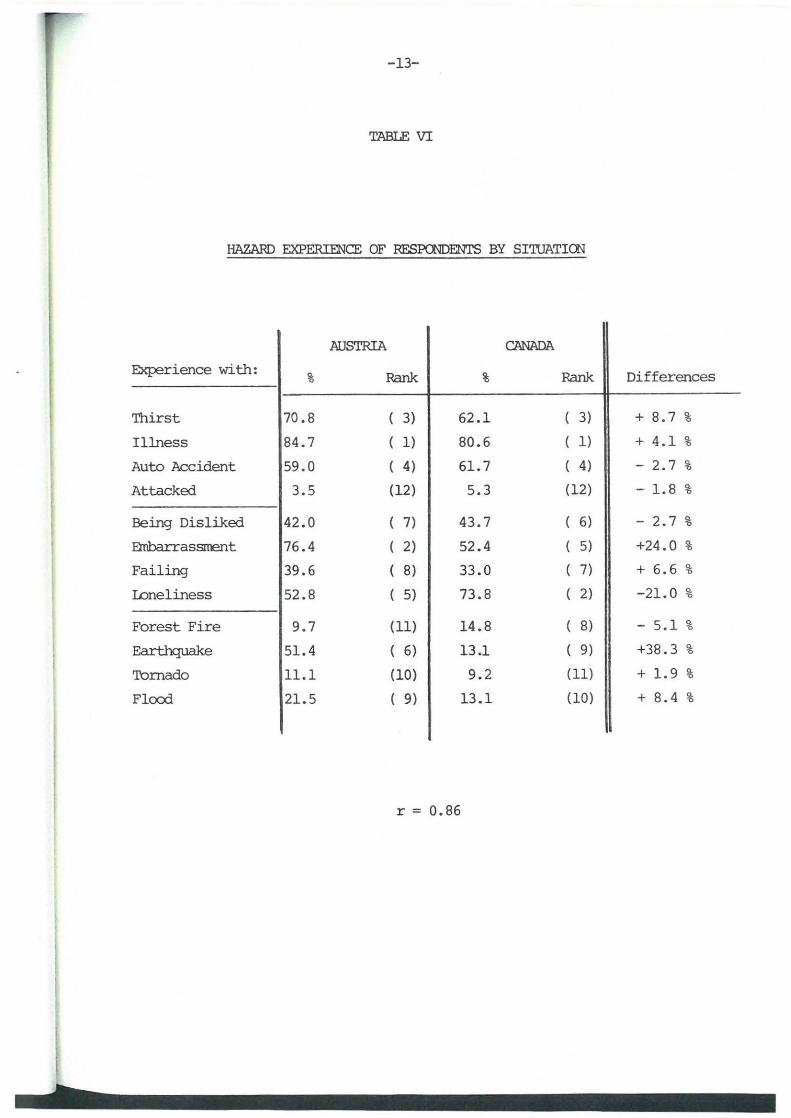
Table VI gives the percentage of respondents who had, or had not, personally experienced specific hazard situations (here ranked in order of experience percentage, not avoidance response). The rank correlation for experience between the Austrian and Canadian samples was 0. 86. In the Canadian study the relationship between hazard avoidance and experience (Tables V and VI) was examined and a correlation of -0 . 43 was found, suggesting the relationship between hazard avoidance and experience to be inverse . The Austrian results shav a different result, namely a correlation of +0 .08. The difference between the Austrian and Canadian samples is significant at the P!.= 0. 01 level .
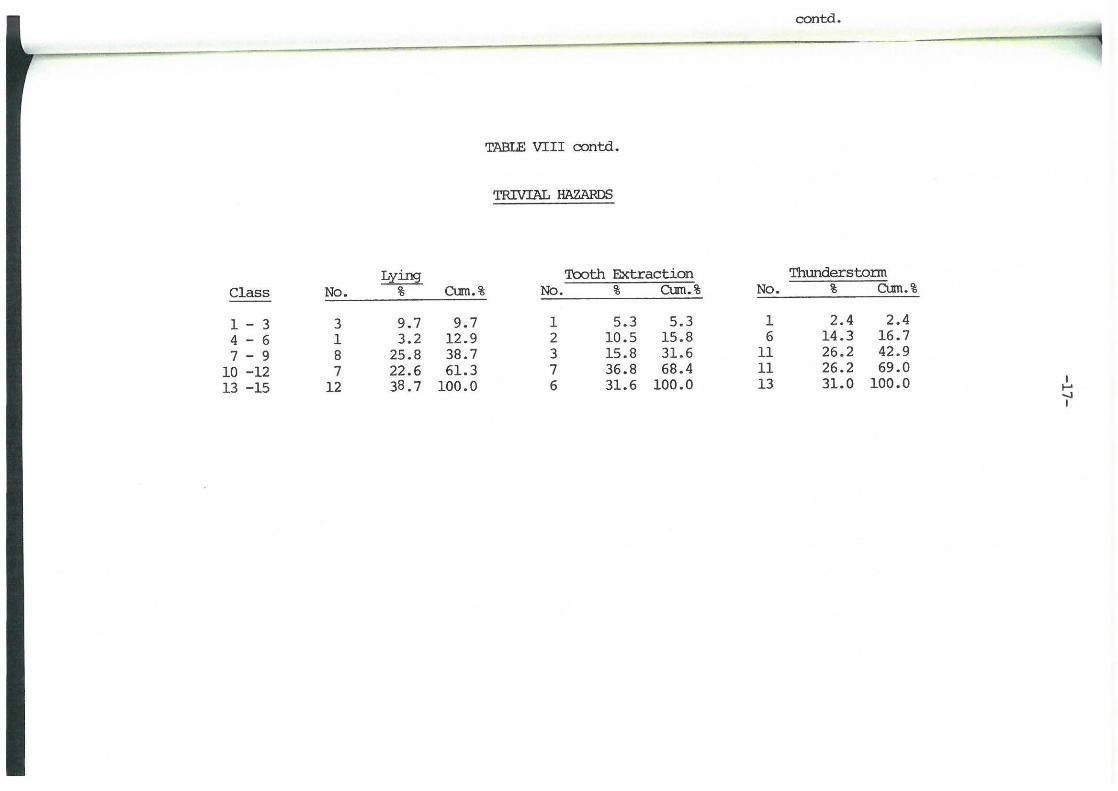
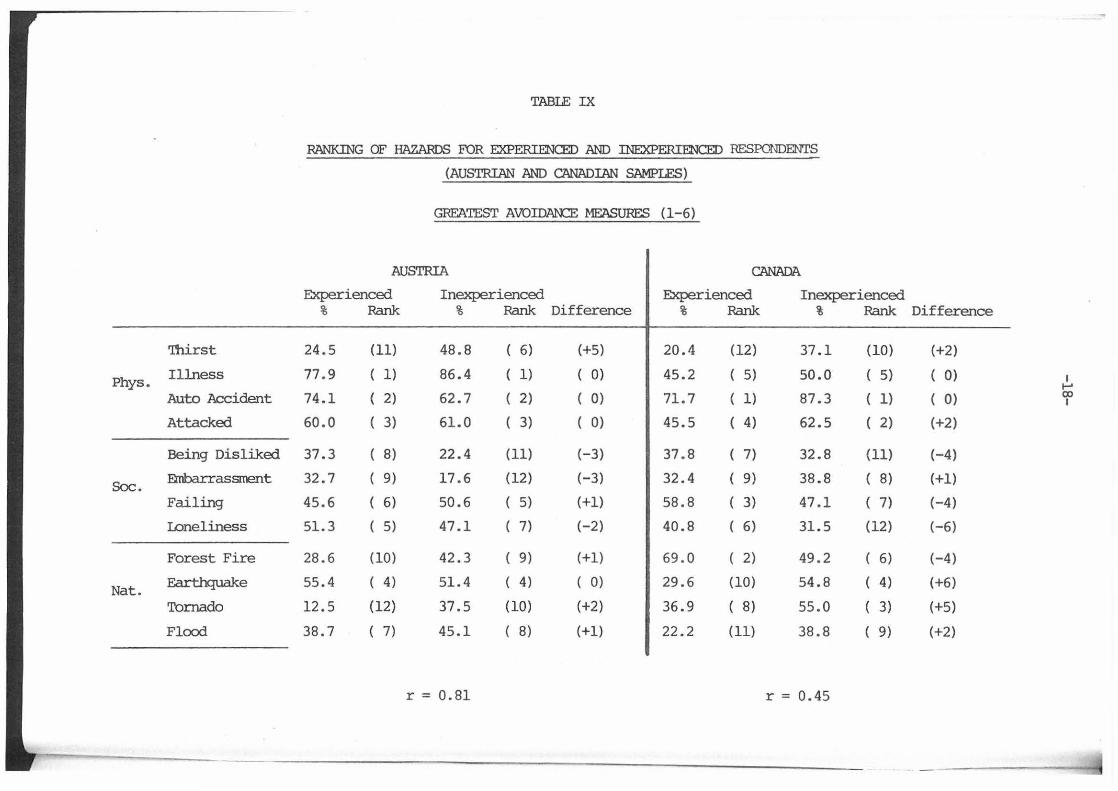
To examine the experience-avoidance correlations rrore closely , Table VI was divided into experienced and inexperienced hazard respondents to form Tables VII and VIII and each of the situations was analysed on the basis of "greatest avoidance" as had been done earlier with the canplete study sample. When the avoidance responses for experienced and inexperienced respondents are separated, Table IX is formed.
In the Canadian sample it may be noted that the rankings for avoidance of physical hazards are rather harogenous for the experienced and inexperienced group but there are larger differences for the social hazards and even rrore for the natural hazards. The Austrian sample showed a significant difference between experienced and inexperienced respondents only for the physical hazard "thirst" (...:: = 0.10). The rank size correlations bebleen the two sets of responses were 0.45 for the Canadian sample and 0. 81 for the Austrian. In other \\Qrds, in contrast to the Canadian results , experience was not an important variable in the responses of the Austrian sample.
4r-or ease in making canparisons the analysis of data exactly follavs that used in the Canadian study.
-4-
In Table X the Austrian and Canadian responses for experienced respondents are carpared, as are those fran inexperienced respondents. The agreement between the risk avoidance tendencies ranains small with rank size correlation of 0.43 and 0.52 respectively.
B. Irnaginability
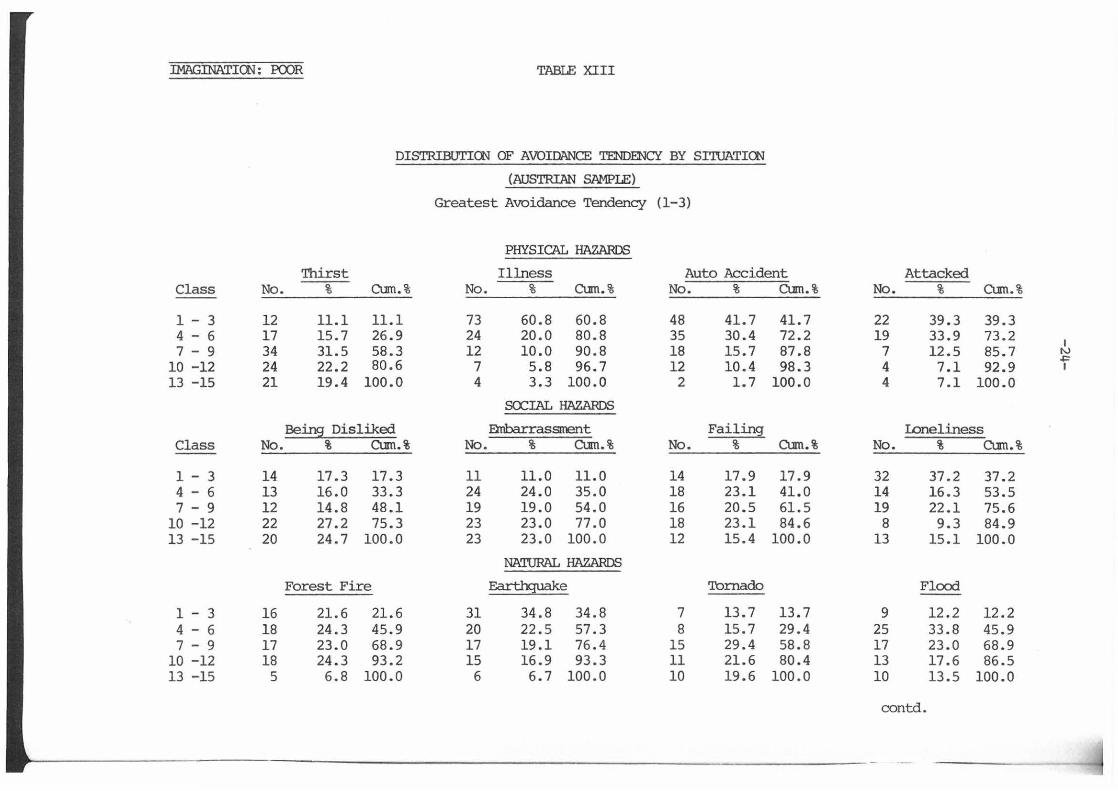
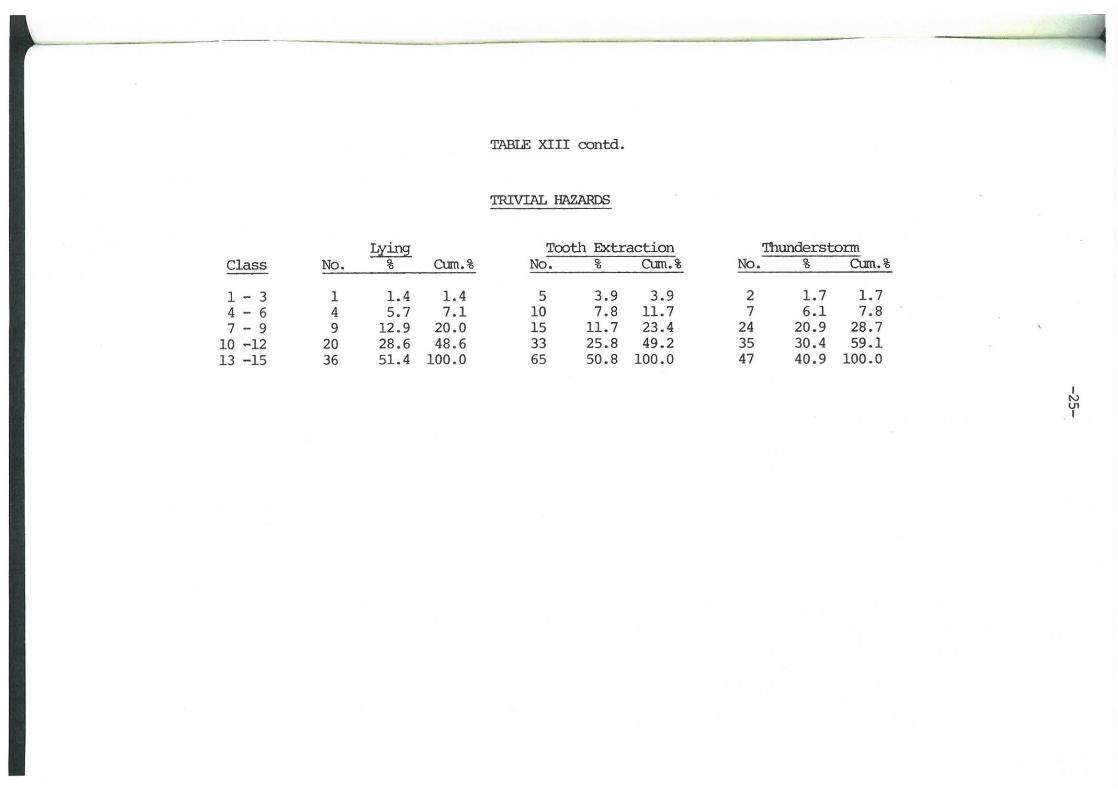
Previous research at the University of Vienna [l, 4] in the field of attitude determination has indicated the importance of being able to imagine oneself in a given risk situation. Therefore, as the only departure fran the canadian study, subjects were asked to rate their own ability, on a three-step scale, to irnagine themselves in each situation. These responses were then divided into the three groups indicated (see Tables XI, XII and XIII) and rankings based upon "greatest avoidance" were made as with the ccrnplete study sarrq;ile.
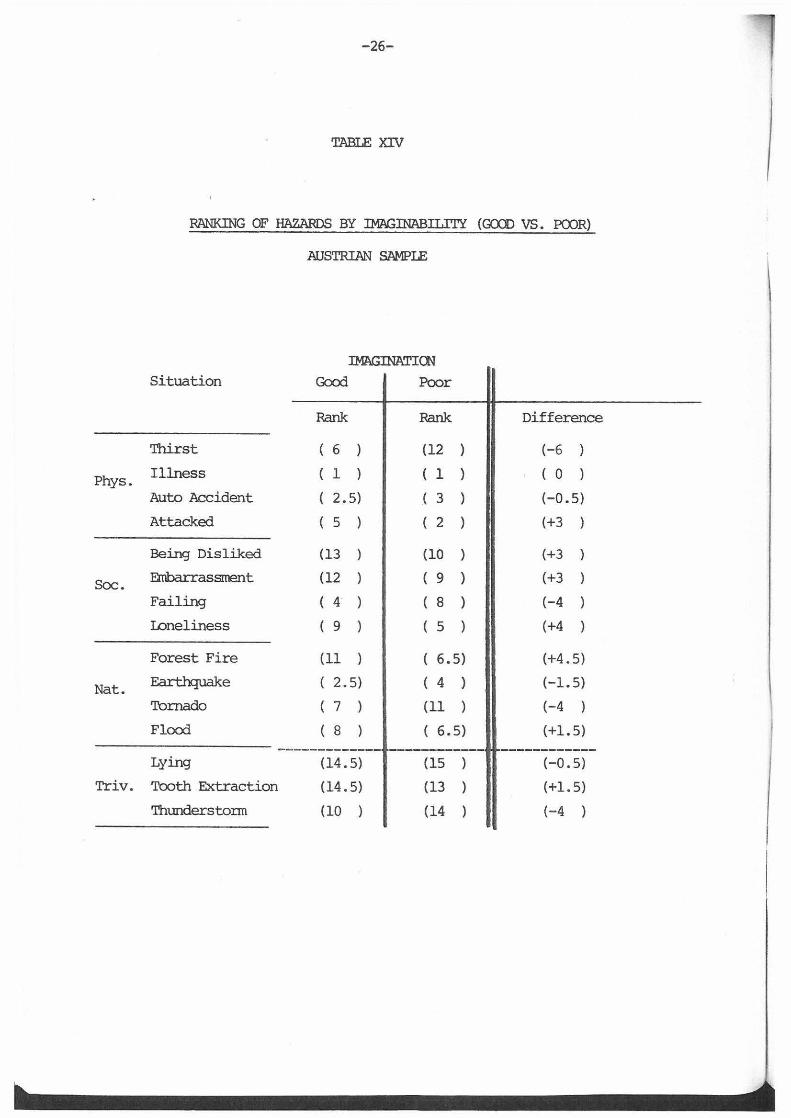
Table XIV shows a carparison of the risk avoidance tendencies for those who rated the imagination of specific situations as "gcxxl" or "poor". The rank size correlation for these groups was 0.59 which indicates that, for the Austrian sample, the ability to irnagine specific hazard situations seeted to be rrore important than actual experience.
c. Aggregated Hazard canparisons
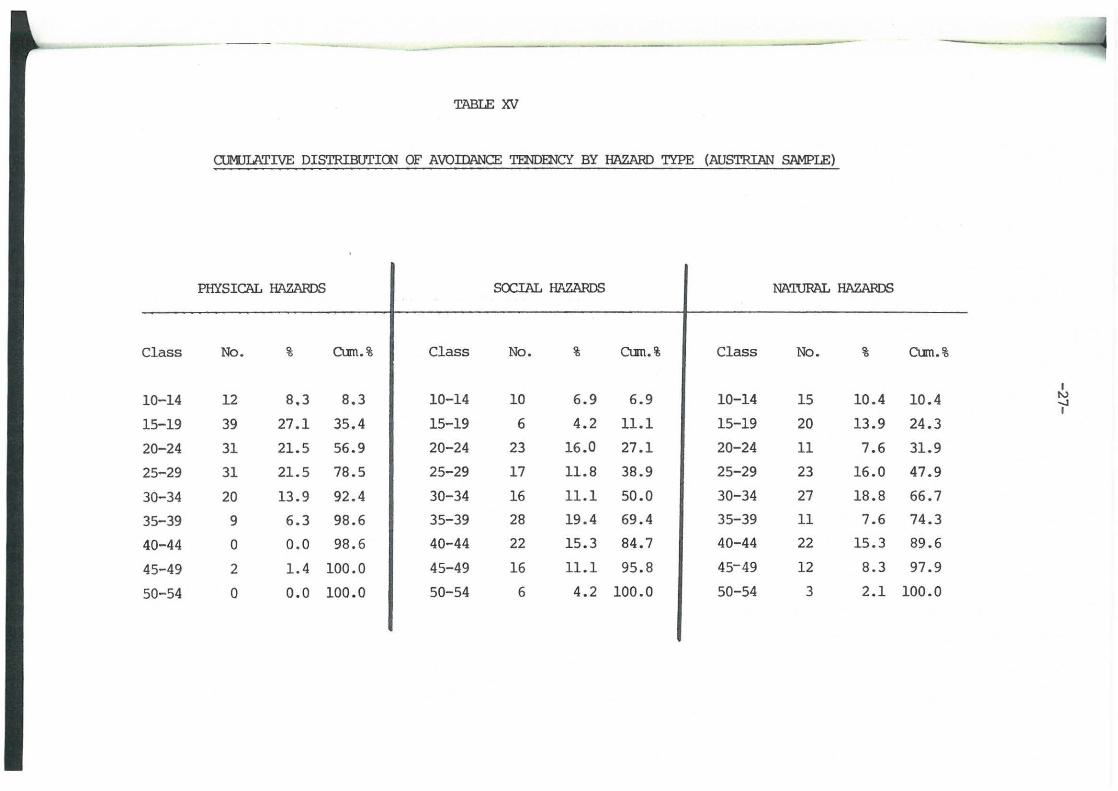
A further step in the evaluation was to consider the three types of hazard situations (physical, social and natural) as groups; that is, the responses for individual situations were treated cumulatively under the type of hazard:
1) physical hazards: thirst, illness, auto accident, being attacked and robbed;
2) social hazards: being disliked by saneone you admire, public embarrassment, failing in school or job, loneliness;
3) natural hazards: forest fire, earthquake, tornado flcxxl.
These data were then used to fo:rm hazard type rankings, based upon "greatest avoidance" as had been done with the individual hazard situations of the canplete study sample (surrmarized in Table XV). The criterion used here to define "greatest avoidance" was the rank sum of the four specific situations found under each type of hazard (cumulative rank 10-24) • In this case, for the Canadian sample, natural hazards were the rrost avoided type; in contrast, the physical hazards were rrost avoided in the Austrian group. (Curm.llative percentages corresponding to cumulative rank 10-24, taken fran Table XV, are shown below: )
Physical hazards Social hazards Natural hazards
Canada
36.9 % 31.6 % 44.2 %
Austria
56.9 % 27.1 % 31.9 %
-5-
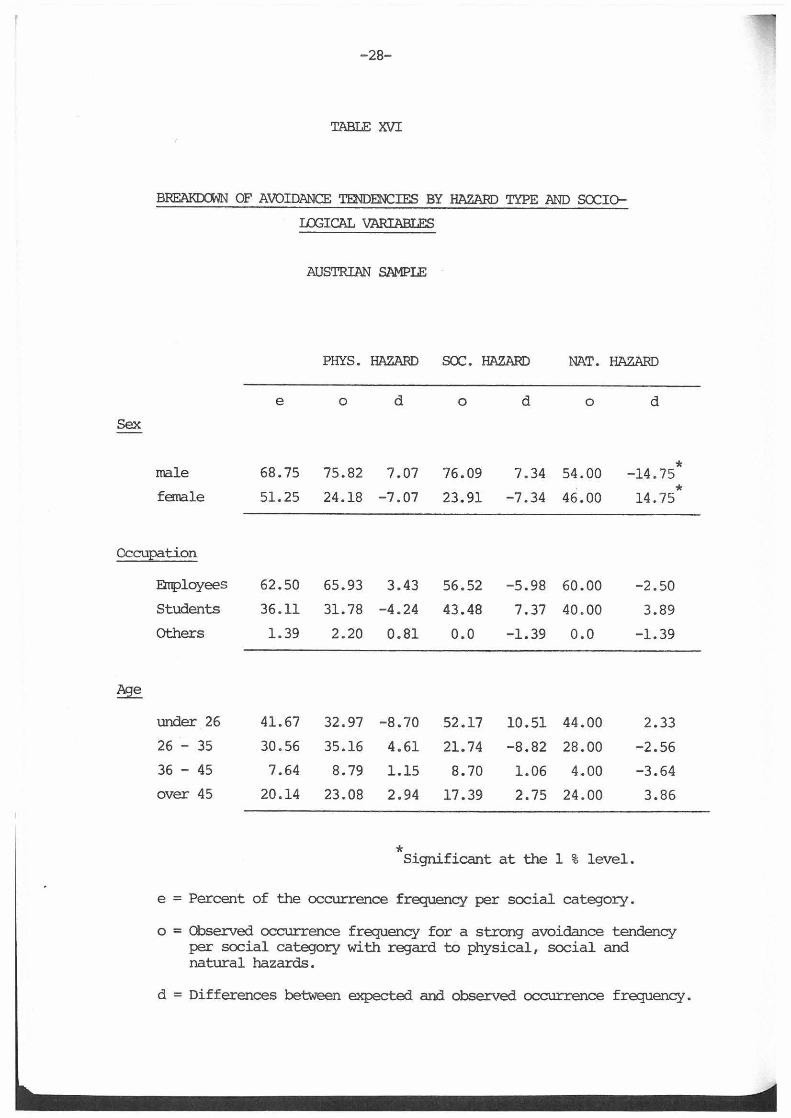
ients D. Effect of Sociological Variables '
:ion A breakdown of the Austrian data in tenn of sociological variables in-dicated, as might be expected, a relatively greater avoidance, anong people under 26 years, for social hazards as cx:mpared to physical. The opposite was found for persons between the ages of 26 and 53. H~ver, the only factor found significant at the 0.01 level was a greater risk avoidance tendency with respect to natural hazards for \YClreI'l than for :iren. These analyses are
le surrmarized in Table XVI. Socio-econanic variables and personality di:irensions the (Eysenck Personality Inventory Test) were not found to be significant. ;tep
idy
;e
lZard ; for
1cked
:t
:o LS
>r the he
V. Concluding Discussion
The results of this canparative investigation must be interpreted with caution. In order to allow direct canparisons the questionnaire and methods used in the original Canadian study were strictly replicated-even in cases where different, perhaps better, techniques were available. With these limitations in mind a few tentative conclusions may be drawn.
The extent to which man seeks to avoid specific risk situations was found to be culturally dependent in this study. The overall rank correlation coefficient Canada-Austria was found to be 0. 62. While in Austria a markedly increased avoidance response to physical-social hazards was observed, the Canadian avoidance response was strongest for natural hazards. This does not necessarily seem to be the result of geographical-geological differences since the rank size correlations between the two groups for persons having had personal experience with these hazard situations was found to be 0.86. Further, the effect of personal experience was seen to be much less important in the Austrian sample (r = 0.81) than in the Canadian (r = 0.45) •
An important variable in the Austrian study (not investigated in the Canadian work) seaned to be the ability to imagine specific risk situations. The canparison between sub-groups reporting good, as opposed to poor, imaginability gave a rank correlation of 0.59 . The relationship between actual experience and imaginability is conjecturally interesting--consider the case of nuclear power plant risk avoidance where imagination must substitute for experience.
In sumnary, no finn conclusions can be made with respect to the cultural dependence of risk avoidance based upon these limited studies. The trends indicated are interesting and might, perhaps, be oonfinned by further testing. Ha-.rever, the experience gained through this survey has suggested sare new directions and techniques for future work:
a) the developnent of culturally independent test items regarding specific risk situations that may be readily understood by naive test subjects;
b) an attempt at structure analysis of risk behaviour in order to detennine the basic dimensions;
c) the use of paired cx:mparisons and rating scales in onedimensional sllift.tests designed to gain a psychanetrical under~ standing of risk attitudes.
-6-
The relationship between this research and the overall research progranme of the Joint IAF.A/IIASA Research Project has been presented in an earlier publication [ 3 ].
-7-
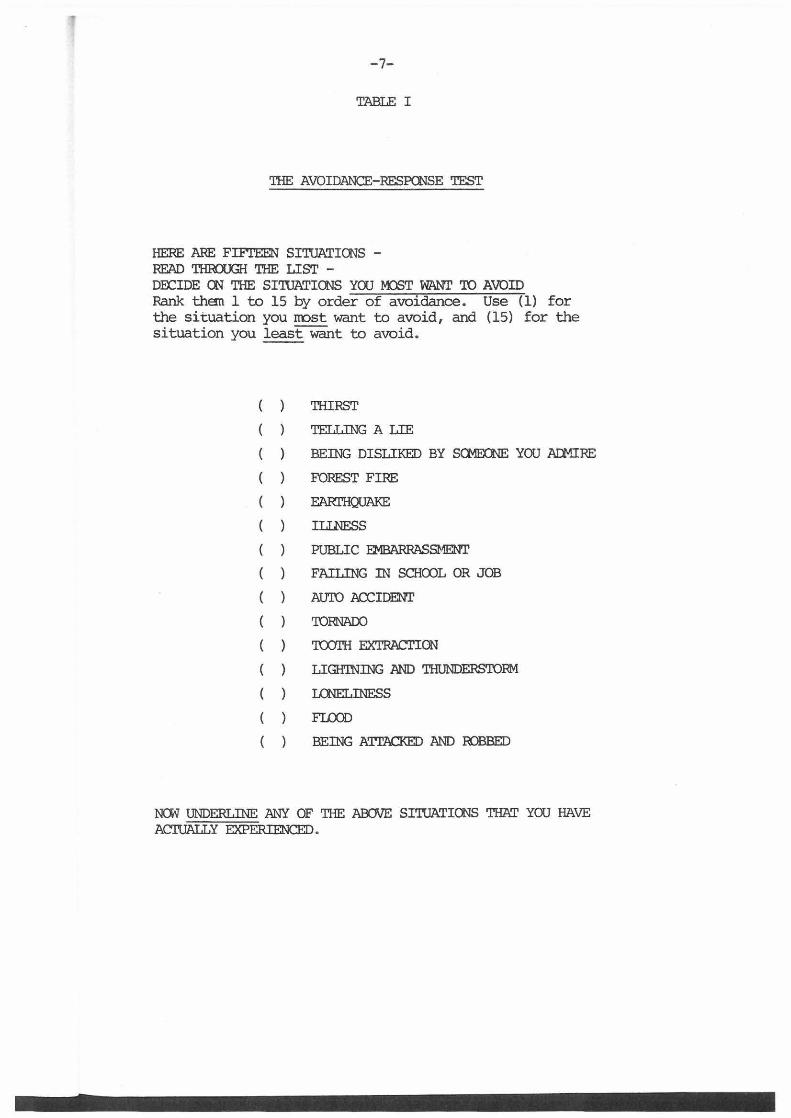
TABLE I
THE AVOIDANCE-RESPCNSE TEST
HERE ARE FIFTEEN SI'IUATIOOS -READ THiaJGH THE LIST -DOCIDE 00 THE SI'IUATIOOS YOU M)ST WANT 'ID AVOID Rank them 1 to 15 by order of avoidance. Use ( 1) for the situation you rrost want to avoid, and (15) for the situation you least want to avoid.
THIRST
TELLING A LIE
BEING DISLIKED BY SCMEXJNE YOU Aflo.1IRE
FOREST FIRE
EAR.l'HQUAKE
ILLNESS
PUBLIC EMBARRASSMENT
FAILING m SCHOOL OR JOB
AU'ID ACCIDENT
'IDRNAOO
'IWrH EXTRACTION
LIGH'INlliG AND THUNDERSTORM
r..rnELINESS
FLOOD
BElliG ATI'ACKED AND ROBBED
NCM UNDERLINE ANY OF THE ABOVE SI'IUATIOOS THAT YOU HAVE ACIUALLY EXPERIENCED.
-8-
TABLE II
~ TRANSLATIOOS USED IN THE AUSTRIAN RISK AVOIDANCE
RFSPCNSE SURVEY
canadian List Austrian List
1. THIRST 1. DURST
2. TELLING A LIE 2. EINE LUEX;E AUFI'ISOiEN
3. BEING DISLIKED BY SCMEX:NE 3. ~ ErnER PERSOO, DIE SIE YOO AI:MIRE BEWUNDERN, ABGELEHNT WERDEN
4. FOREST FIRE 4. WAID BRAND
5. EARI'HQUAKE 5. ERDBEBEN
6. ILINFSS 6. KRANKHEIT
7. PUBLIC EMBARRASSMEN1' 7. VOR ANDEREN LElJI'EN IN VER-r..:ffiENHEIT GERATEN
8. FAILING IN SOICOL OR 8 . VERSAGEN IN DER saruLE ODER JOB IM BERlJF
9 . AlJ'1D ACCIDENT 9. AUIUJNFALL
10 . 'IDRNAOO 10. ORKAN
11. 'lOOI'H EXTRACTIOO 11. EINEN ZAHN ZIEHEN IASSEN
12 . LIGH'INING AND THUNDERS'roR-1 12 . GEWITI'ERS'IUR-1
13 . I..CNELINESS 13. EINSAMKEIT
14. FUX>D 14. llEBERSCHWEMMUN
15. BEING ATrACKED AND ROBBED 15 . UEBERFALLEN UND BERAUBT WERDEN
-9-
TABLE III
AGE, SEX AND OCCUPATIOO OF RF..SPCNDENTS
Canada Austria Sex
male 59 % 69 %
f anale 41 % 31 %
Occupation
anployees 68 % 63 %
students 30 % 36 %
others 2 % 1 %
~ under 26 41 % 42 %
26 - 35 36 % 31 %
36 - 45 17 % 8 %
over 45 6 % 20 %
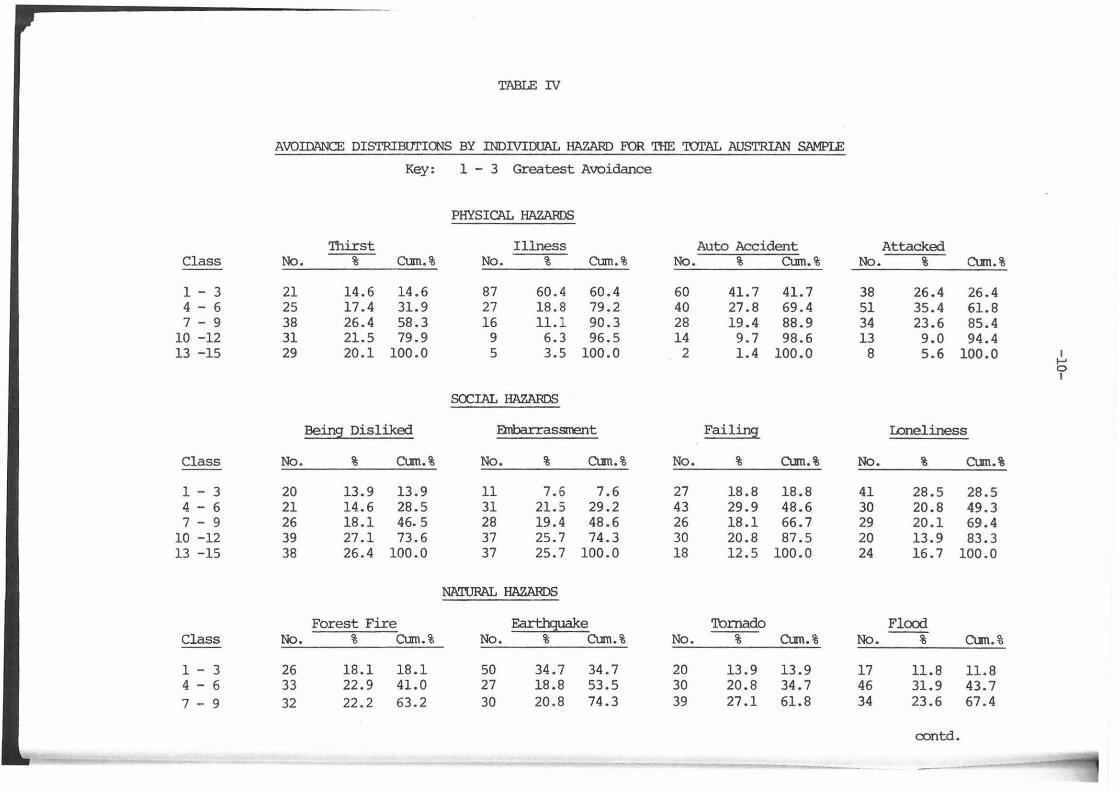
TABLE N
AVOIDANCE DISTRIBUTIOOS BY INDNIDUAL HAZARD FOR 'IHE 'IUI'AL AUSTRIAN SAMPLE
Key: 1 - 3 Greatest Avoidance
PHYSICAL HAZARDS
Thirst Illness Auto Accident Attacked Class No. % CUm.% No. % CUm.% No. % CUm.% No. % CUm.% --
1 - 3 21 14.6 14.6 87 60.4 60.4 60 41. 7 41. 7 38 26.4 26.4 4 - 6 25 17.4 31.9 27 18.8 79.2 40 27.8 69.4 51 35.4 61.8 7 - 9 38 26.4 58.3 16 11.1 90.3 28 19.4 88.9 34 23.6 85.4
10 -12 31 21.5 79.9 9 6.3 96.5 14 9.7 98.6 13 9.0 94.4 13 -15 29 20.1 100.0 5 3.5 100.0 2 1.4 100.0 8 5.6 100.0 I ......
0 I
SOCIAL HAZARDS
Being Disliked Enlbarrassment Failing wneliness
Class No. % CUm.% No. % CUm.% No. % CUm.% No. % a.m.%
1 - 3 20 13.9 13.9 11 7.6 7.6 27 18.8 18.8 41 28.5 28.5 4 - 6 21 14.6 28.5 31 21.5 29.2 43 29.9 48.6 30 20.8 49.3 7 - 9 26 18.1 46. 5 28 19.4 48.6 26 18.l 66.7 29 20.l 69.4
10 -12 39 27.1 73.6 37 25.7 74.3 30 20.8 87.5 20 13.9 83.3 13 -15 38 26.4 100.0 37 25.7 100.0 18 12.5 100.0 24 16.7 100.0
NA'IURAL HAZARDS
Forest Fire Earthquake Tornado Flood Class No. % CUm.% No. % CUm.% No. % CUm.% No. --% CUm.%
1 - 3 26 18.1 18.1 50 34.7 34.7 20 13.9 13.9 17 11.8 11.8 4 - 6 33 22.9 41.0 27 18.8 53.5 30 20.8 34.7 46 31.9 43.7 7 - 9 32 22.2 63.2 30 20.8 74.3 39 27.1 61.8 34 23.6 67.4
oontd.
'! - 0
7 .... 9
Class ~
10 -12 13 -15
.:>::>
32
No.
35 18
~~. :J ""t,.1... v
22.2 63 . 2
% Cum.%
24.3 87.5 12. 5 100.0
LI .1..U • U .J.J • .J
30 20.8 74.3
TABLE IV contd.
No.
27 10
% Cum.%
18 .8 93.l 6.9 100 . 0
TRIVIAL HAZARDS
.JV
39
No.
31 24
,v.v -'~·'
27 .1 61.8
% Cum.%
21.5 83.3 16 . 7 100 .0
34
No.
31 16
..J.L•J '"SJe I
23.6 67.4
oont:d.
% Cum.%
21.5 88 . 9 11.1 100.0
L:t:ing Tooth Extraction Thunderstonn
Class No. % Cum. % No. % Cum.% No. % Cum. %
1 - 3 8 5.6 5.6 6 4.2 4.2 3 2.1 2.1
4 - 6 7 4.9 10.4 12 8.3 12.5 10 6.9 9. 0
7 - 9 20 13.9 24.3 18 12.5 25.0 33 22.9 31.9
10 - 12 39 27.1 51.4 35 24.3 49.3 42 29.2 61.l
13 -15 70 48.6 100.0 73 50.7 100.0 56 38.9 100.0
I ..... ..
r
-12-
TABLE V
RANKING OF HAZARD.S BASED 00 RESPCNDENI'S ('rol'AL SAMPLE)
GREATEST AVOIDANCE MEASURES ( 1-6)
AUSTRIA CANADA
% Rank % Rank
Thirst 31.9 (10) 26.7 (12)
Illness 79.2 ( 1) 46.l ( 7)
Auto Accident 69.4 ( 2) 77.7 ( 1)
Attacked 61.8 ( 3) 61.6 ( 2)
Being Disliked 28.5 (12) 35.0 (11)
Erobarrassroont 29.2 (11) 35.4 (10)
Failing 48.6 ( 6) 50.9 ( 6)
Loneliness 49.3 ( 5) 38.4 ( 8)
Forest Fire 41.0 ( 8) 51.9 ( 4)
Earthquake 53.5 ( 4) 51.5 ( 5)
Tornado 34.7 ( 9) 53 . 4 ( 3)
Flood 43.7 ( 7) 35.9 ( 9)
r = 0.62
Differences
(+2)
(-6)
(+l)
(+l)
(+l)
(+l)
( 0)
(-3)
(+4)
(-1)
(+6)
(-2)
-13-
TABLE VI
HAZARD EXPERIENCE OF RE'SPCNDENTS BY SITUATIOO
AUSTRIA CANADA
Experience with: % Rank % Rank Differences
Thirst 70.8 ( 3) 62.1 ( 3) + 8.7 %
Illness 84.7 ( 1) 80.6 ( 1) + 4.1 %
Auto Accident 59.0 ( 4) 61. 7 ( 4) - 2.7 %
Attacked 3.5 (12) 5.3 (12) - 1.8 %
Being Disliked 42.0 ( 7) 43.7 ( 6) - 2.7 %
Enbarrassrrent 76.4 ( 2) 52.4 ( 5) +24.0 %
Failing 39.6 ( 8) 33.0 ( 7) + 6.6 %
Loneliness 52.8 ( 5) 73.8 2) -21. 0 %
Forest Fire 9.7 (11) 14.8 ( 8) - 5.1 %
Earthquake 51.4 ( 6) 13.1 ( 9) +38.3 %
Tornado 11.1 (10) 9.2 (11) + 1.9 %
Flood 21.5 ( 9) 13.1 (10) + 8.4 %
r = 0.86
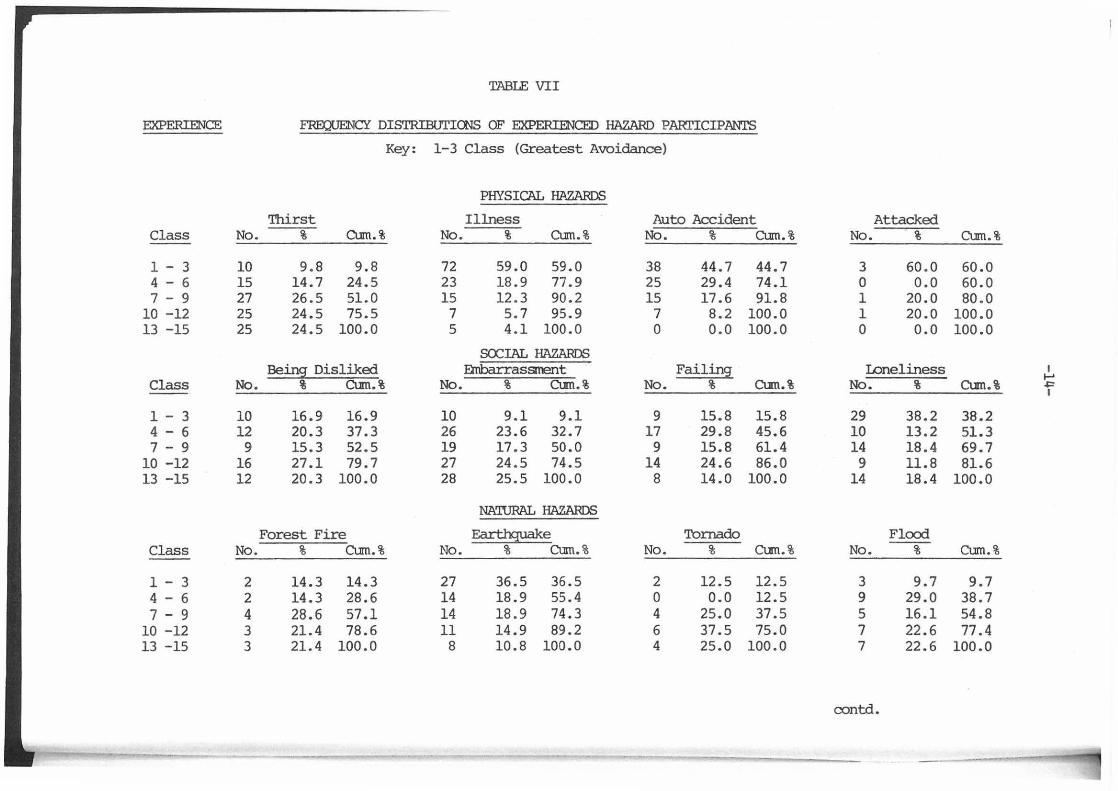
TABLE VII
EXPERIENCE FRmlENCY DISTRIBUTICNS OF EXPERIENCED HAZARD PARI'ICIPANI'S
Key: 1-3 Class (Greatest Avoidance)
PHYSICAL HAZARDS
Thirst Illness Auto Accident Attacked Class No. % Cum.% No. % Curn.% No. % Cum.% No. % Curn.%
1 - 3 10 9.8 9.8 72 59.0 59.0 38 44.7 44.7 3 60.0 60.0 4 - 6 15 14.7 24.5 23 18.9 77.9 25 29.4 74.1 0 0.0 60.0 7 - 9 27 26.5 51.0 15 12 . 3 90.2 15 17.6 91.8 1 20.0 80.0
10 -12 25 24.5 75.5 7 5.7 95.9 7 8.2 100.0 1 20.0 100.0 13 -15 25 24.5 100.0 5 4.1 100.0 0 o.o 100.0 0 0.0 100.0
SOCIAL HAZARDS Bein~ Disliked Dnbarrassrrent Failing loneliness I .....
Class No. % Cum.% No. % Curn.% No. % Curn.% No. % Curn.% ~ I
1 - 3 10 16.9 16.9 10 9.1 9.1 9 15.8 15.8 29 38.2 38.2 4 - 6 12 20.3 37.3 26 23.6 32.7 17 29.8 45.6 10 13.2 51.3 7 - 9 9 15.3 52.5 19 17.3 50.0 9 15.8 61.4 14 18.4 69.7
10 -12 16 27.1 79.7 27 24.5 74.5 14 24.6 86.0 9 11.8 81.6 13 -15 12 20.3 100.0 28 25.5 100.0 8 14.0 100.0 14 18.4 100.0
NATURAL HAZARDS
Forest Fire Earthquake Tornado Flood Class No. % Curn.% No. % Curn.% No. % Curn.% No. % Curn.%
1 - 3 2 14.3 14.3 27 36.5 36.5 2 12.5 12.5 3 9.7 9.7 4 - 6 2 14.3 28.6 14 18.9 55.4 0 0.0 12.5 9 29.0 38.7 7 - 9 4 28.6 57.1 14 18.9 74.3 4 25.0 37.5 5 16.l 54.8
10 -12 3 21.4 78.6 11 14.9 89.2 6 37.5 75.0 7 22.6 77.4 13 -15 3 21.4 100.0 8 10.8 100.0 4 25.0 100.0 7 22.6 100.0
contd.
-' _-..-"~-
Lying
Class No. % CUm. %
1 - 3 5 4.5 4.5 4 - 6 6 5.4 9.8 7 - 9 12 10.7 20.5
10 -12 32 28.6 49.1 13 -15 57 50 . 9 100.0
TABIE VII contd.
TRIVIAL HAZARDS
Tooth Extraction
No. % CUm.%
5 4.0 4.0 10 8.0 12.0 15 12 . 0 24.0 28 22.4 46.4 67 53.6 100.0
Thunderstonn
No. % CUm.%
2 2.0 2.0 4 3.9 5.9
22 21.6 27.5 31 30.4 57.8 43 42.2 100.0
I t-'
lf
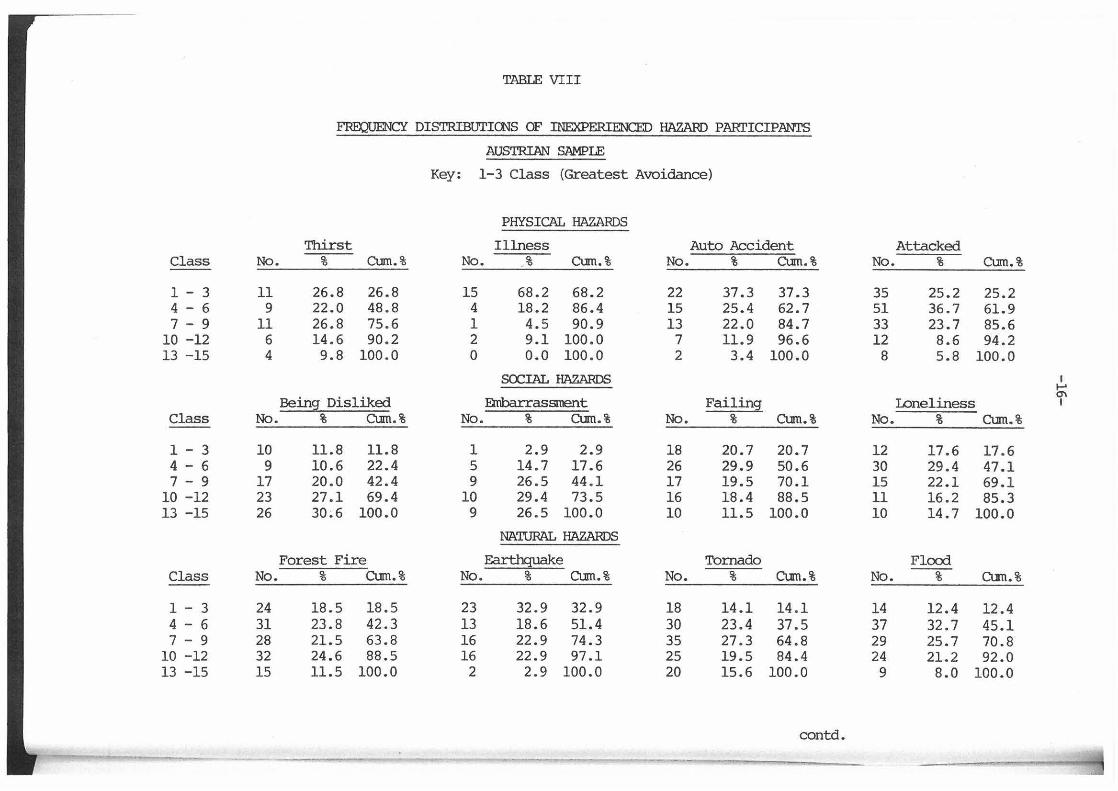
TABLE VIII
FIIDJUENCY DISTRIBUTICNS OF INEXPERIENCED HAZARD PARI'ICIPANI'S
AUSTRIAN SAMPLE
Key: 1-3 Class {Greatest Avoidance)
PHYSICAL HAZARDS
Thirst Illness Auto Accident Attacked Class No. % Curn.% No. _% Curn.% No. % Curn.% No. % Curn.%
1 - 3 11 26.8 26.8 15 68.2 68.2 22 37.3 37.3 35 25.2 25.2 4 - 6 9 22.0 48.8 4 18.2 86.4 15 25.4 62.7 51 36.7 61.9 7 - 9 11 26.8 75.6 1 4.5 90.9 13 22.0 84.7 33 23.7 85.6
10 -12 6 14.6 90.2 2 9.1 100.0 7 11.9 96.6 12 8.6 94.2 13 -15 4 9.8 100.0 0 o.o 100.0 2 3.4 100.0 8 5.8 100.0
SOCIAL HAZARDS I
~ Bein9: Disliked Enlba.rrassrrent Failing loneliness I
Class No. % Curn.% No. % Curn.% No. % Curn.% No. % Curn.% -1 - 3 10 11.8 11.8 1 2.9 2.9 18 20.7 20.7 12 17.6 17.6 4 - 6 9 10.6 22.4 5 14.7 17.6 26 29.9 50.6 30 29.4 47.1 7 - 9 17 20.0 42.4 9 26.5 44.1 17 19.5 70.1 15 22.1 69.1
10 -12 23 27.1 69.4 10 29.4 73.5 16 18.4 88.5 11 16.2 85.3 13 -15 26 30~6 100.0 9 26.5 100.0 10 11.5 100.0 10 14.7 100.0
NATURAL HAZARDS
Forest Fire Earthquake Tornado Flood Class No. % Cum.% No. % Cum.% No. % Curn.% No. % Curn.%
1 - 3 24 18.5 18.5 23 32.9 32.9 18 14.1 14.1 14 12.4 12.4 4 - 6 31 23.8 42.3 13 18.6 51.4 30 23.4 37.5 37 32.7 45.1 7 - 9 28 21.5 63.8 16 22.9 74.3 35 27.3 64.8 29 25.7 70.8"
10 -12 32 24.6 88.5 16 22.9 97.1 25 19.5 84.4 24 21.2 92.0 13 -15 15 11.5 100.0 2 2.9 100.0 20 15.6 100.0 9 8.0 100.0
contd.
contd.
~-=......,..._. ............. ------....,.-..-..----=-........---_...........----=--"'-=-"""-- ............... --- --~- .. 2"ii4 ·-TABLE VIII contd.
TRIVIAL HAZARDS
L:tin9: Tooth Extraction Thunderstorm Class No. % CUm.% No. % CUm.% No. % CUm.%
1 - 3 3 9.7 9.7 1 5.3 5.3 1 2.4 2.4 4 - 6 1 3.2 12.9 2 10.5 15.8 6 14 . 3 16.7 7 - 9 8 25.8 38.7 3 15.8 31.6 11 26.2 42.9
10 -12 7 22.6 61.3 7 36.8 68.4 11 26.2 69.0 13 -15 12 38.7 100.0 6 31.6 100.0 13 31.0 100 .0 I
...... -..J I
Thirst
Phys. Illness
Auto Accident
Attacked
Being Disliked
Soc. Embarrassment
Failing
wneliness
Forest Fire
Nat. Earthquake
Tornado
Flood
TABIE IX
RANKING OF HAZARDS FOR EXPERIENCED AND INEXPEIUENCED RESPONDENTS
(AUSTRIAN AND CANADIAN SAMPLF.S)
GREATEST AVOIDANCE MFASURES (1-6)
AUSTRIA CANADA
Experienced Inexperienced Experienced Inexperienced % Rank % Rank Difference % Rank % Rank
24.5 (11) 48.8 ( 6) (+5) 20.4 (12) 37.1 (10)
77.9 ( 1) 86.4 ( 1) ( 0) 45.2 ( 5) 50.0 ( 5)
74.1 ( 2) 62.7 ( 2) ( 0) 71.7 ( 1) 87.3 ( 1)
60.0 ( 3) 61.0 ( 3) ( 0) 45.5 ( 4) 62.5 ( 2)
37 . 3 ( 8) 22.4 (11) (-3) 37 . 8 ( 7) 32.8 (11)
32.7 ( 9) 17 .6 (12) (-3) 32.4 ( 9) 38.8 ( 8)
45.6 ( 6) 50.6 ( 5) (+l) 58.8 ( 3) 47.1 ( 7)
51.3 ( 5) 47.1 ( 7) (-2) 40.8 ( 6) 31.5 (12)
28.6 (10) 42.3 ( 9) (+ 1) 69.0 ( 2) 49.2 ( 6)
55.4 ( 4) 51.4 ( 4) ( 0) 29.6 (10) 54.8 ( 4)
12.5 (12) 37.5 (10) (+2) 36.9 ( 8) 55.0 ( 3)
38.7 ( 7) 45 . l ( 8) (+l) 22.2 (11) 38.8 ( 9)
r = 0.81 r = 0.45
Difference
(+2)
( 0) I ..... ( 0) (X)
I
(+2)
(-4)
(+l)
(-4)
(-6)
(-4)
(+6)
(+5)
(+2)
-· - _.....,...
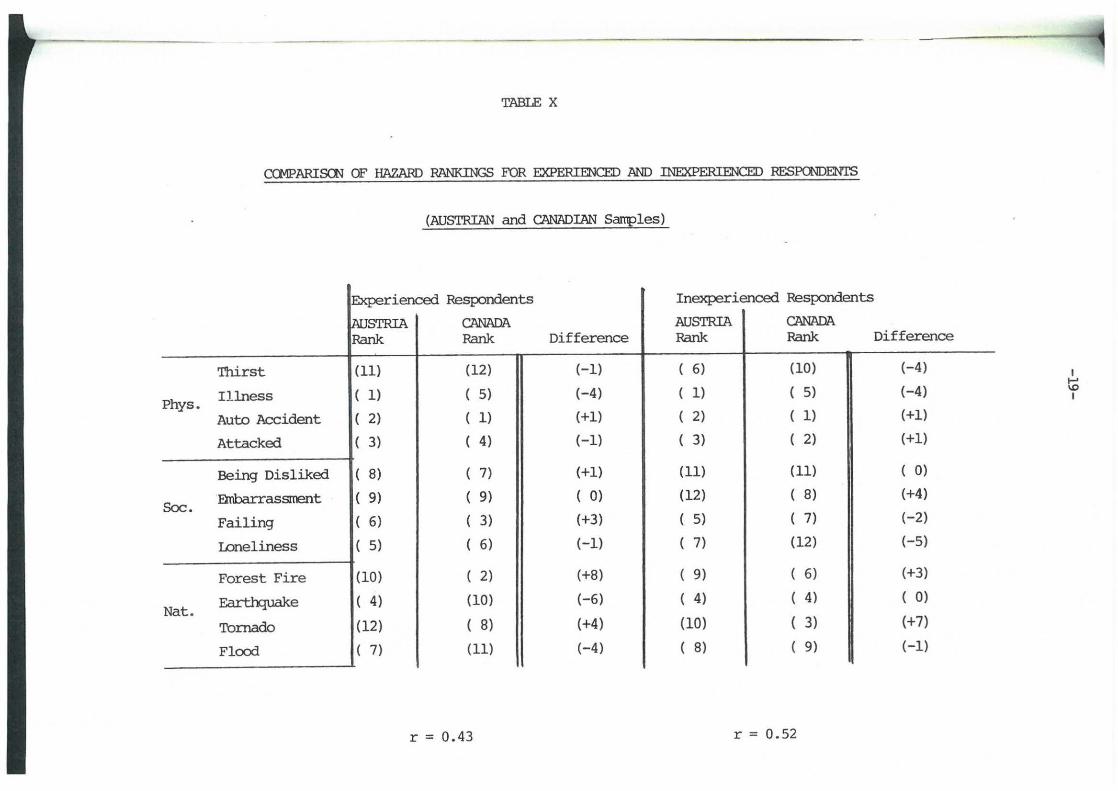
TABLE X
CG1PARISCN OF HAZARD RANKINGS FOR EXPERIENCED AND INEXPERIENCED RF.S:POODENTS
(AUSTRIAN and CANADIAN Samples)
Experienced Respondents Inexperienced Respondents
!AUSTRIA CANADA AUSTRIA CANADA Rank Rank Difference Rank Rank Difference
Thirst (11) (12) (-1) ( 6) (10) (-4)
Phys. Illness ( 1) ( 5) (-4) ( 1) ( 5) (-4)
Auto Accident ( 2) ( 1) (+1) ( 2) ( 1) (+1)
I
~ I
Attacked ( 3) ( 4) (-1) ( 3) ( 2) (+1)
Being Disliked ( 8) ( 7) (+1) (11) (11) ( O)
Soc. Einbarrassment ( 9) ( 9) ( 0) (12) ( 8) (+4)
Failing ( 6) ( 3) (+3) ( 5) ( 7) (-2)
I.Dneliness ( 5) ( 6) (-1) ( 7) (12) (-5)
Forest Fire (10) ( 2) (+8) ( 9) ( 6) (+3)
Nat. Earthquake ( 4) (10) (-6) ( 4) ( 4) ( O)
'Ibrnado (12) { 8) (+4) (10) ( 3) (+7)
Flcxx1 ( 7) (11) (-4) ( 8) ( 9) (-1)
r = 0.43 r = 0.52
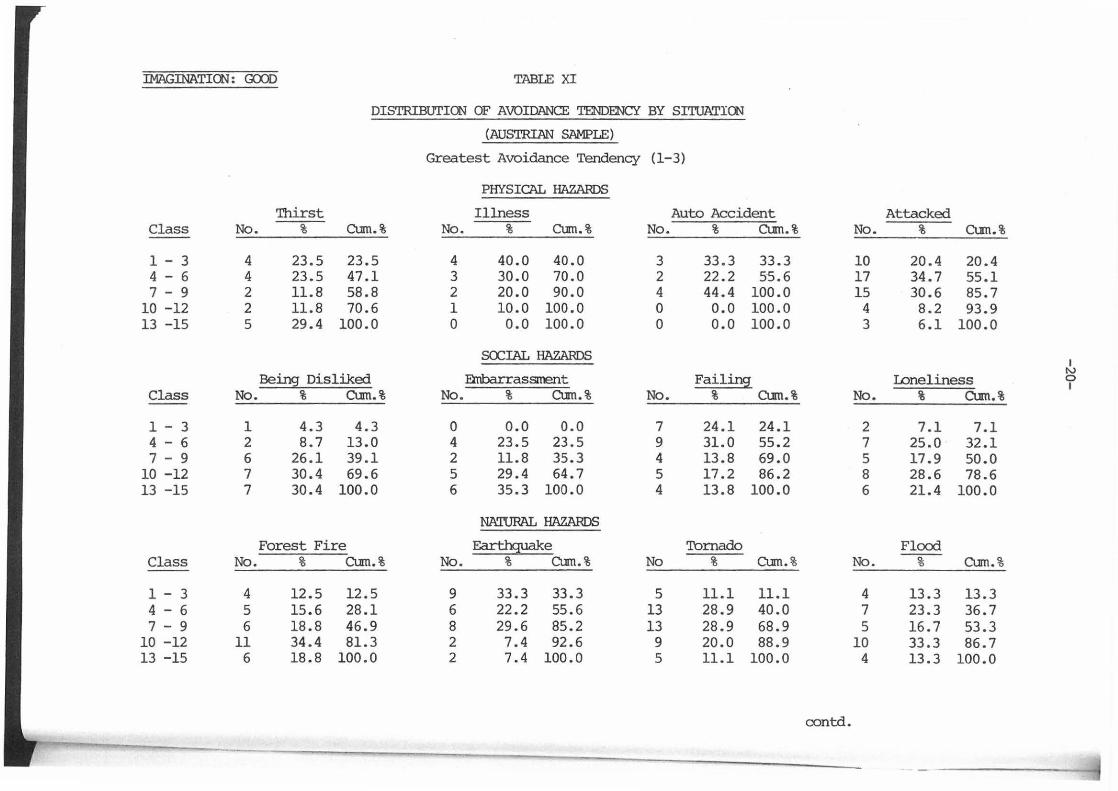
IMAGINATION: GCX)[) TABLE XI
DISTRIBUTION OF AVOIDANCE TENDENCY BY SITUATION
(AUSTRIAN SAMPLE)
Greatest Avoidance Tendency (1-3)
PHYSICAL HAZARDS
Thirst Illness Auto Accident Attacked Class No. % CUm.% No. % CUm.% No. % CUm.% No. % CUm.%
1 - 3 4 23.5 23.5 4 40.0 40.0 3 33.3 33.3 10 20.4 20.4 4 - 6 4 23.5 47.1 3 30.0 70.0 2 22.2 55.6 17 34.7 55.1 7 - 9 2 11.8 58.8 2 20.0 90.0 4 44.4 100.0 15 30.6 85.7
10 -12 2 11.8 70.6 1 10.0 100.0 0 0.0 100.0 4 8.2 93.9 13 -15 5 29.4 100.0 0 0.0 100.0 0 0.0 100.0 3 6.1 100.0
SOCIAL HAZARDS I
Bein9: Disliked Failing N
EXnbarrassrrent timeliness 0 I
Class No. % CUm.% No. % CUm.% No. % CUm.% No. % CUm.%
1 - 3 1 4.3 4.3 0 0.0 0.0 7 24.1 24.1 2 7.1 7.1 4 - 6 2 8.7 13.0 4 23.5 23.5 9 31.0 55.2 7 25.0 32.1 7 - 9 6 26.l 39.1 2 11.8 35.3 4 13.8 69.0 5 17.9 50.0
10 -12 7 30.4 69.6 5 29.4 64.7 5 17.2 86.2 8 28.6 78.6 13 -15 7 30.4 100.0 6 35.3 100.0 4 13.8 100.0 6 21.4 100.0
NATURAL HAZARDS
Forest Fire Earthquake Tornado Flood Class No. % CUm.% No. % Cum.% No % CUm.% No. % CUm.%
1 - 3 4 12.5 12.5 9 33.3 33.3 5 11.1 11.1 4 13.3 13.3 4 - 6 5 15.6 28.1 6 22.2 55.6 13 28.9 40.0 7 23.3 36.7 7 - 9 6 18.8 46.9 8 29.6 85.2 13 28.9 68.9 5 16.7 53.3
10 -12 11 34.4 81.3 2 7.4 92.6 9 20.0 88.9 10 33.3 86.7 13 -15 6 18.8 100.0 2 7.4 100.0 5 11.1 100.0 4 13.3 100.0
contd.
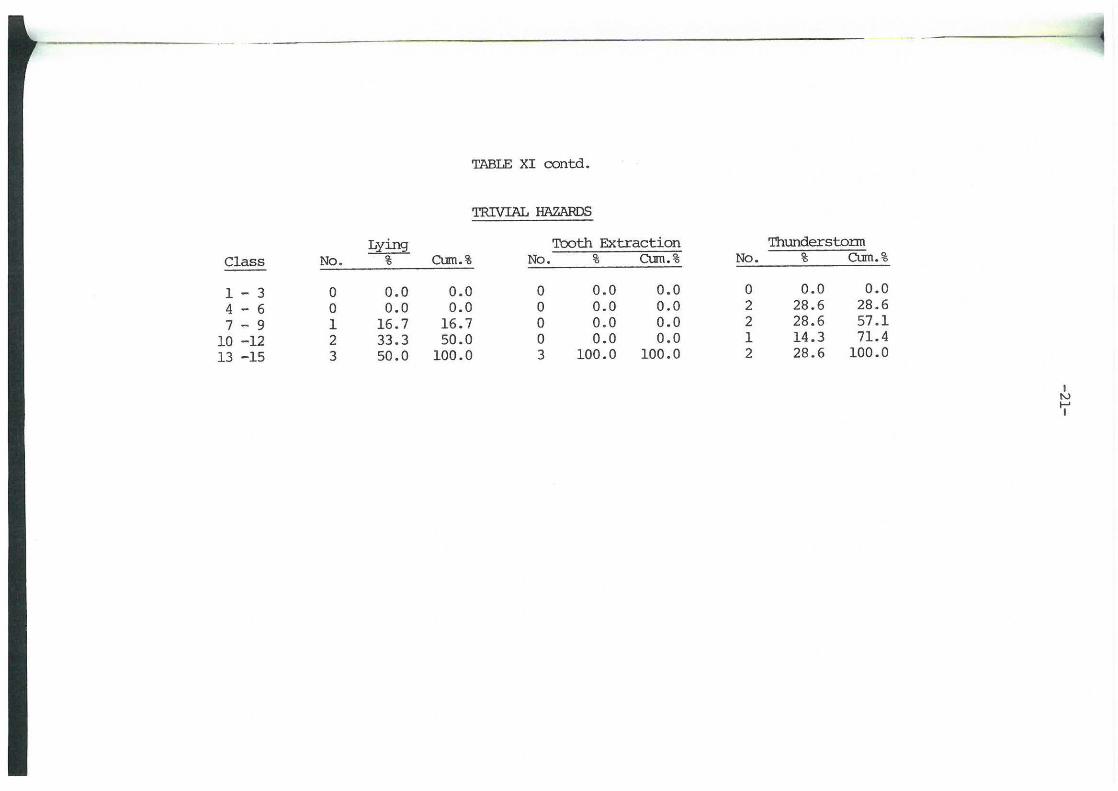
TABLE XI contd.
TRIVIAL HAZARDS
Lying Tooth Extraction Class No. % CUm.% No. % CUm. %
1 - 3 0 o.o 0.0 0 0.0 0.0 4 - 6 0 0.0 0.0 0 0.0 0.0 7 - 9 1 16.7 16.7 0 0 . 0 0.0
10 -12 2 33.3 50.0 0 0.0 0.0 13 -15 3 50.0 100.0 3 100.0 100.0
No.
0 2 2 1 2
Thunderstonn % CUm. %
0.0 0.0 28.6 28.6 28.6 57.1 14.3 71.4 28.6 100.0
I N
7
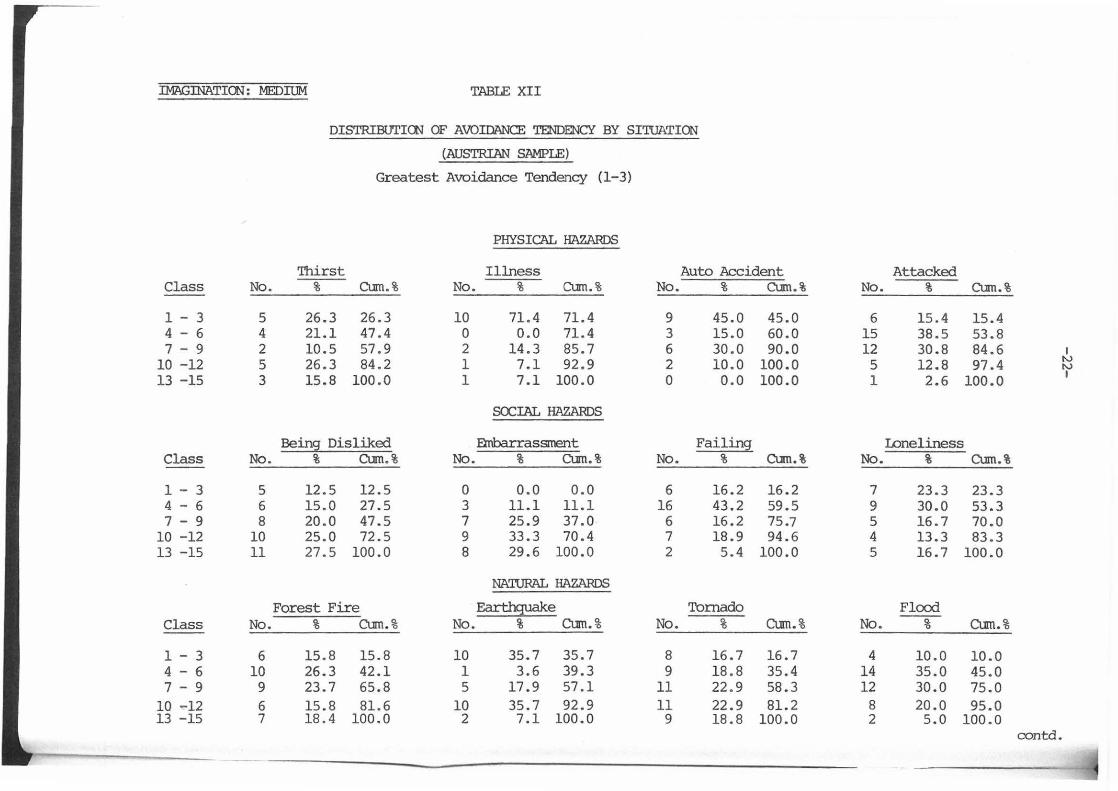
IMAGlNATICN: MEDIUM TABLE XII
Class No.
1 - 3 5 4 - 6 4 7 - 9 2
10 -12 5 13 -15 3
Class No. --
1 - 3 5 4 - 6 6 7 - 9 8
10 -12 10 13 -15 11
Class No. --1 - 3 6 4 - 6 10 7 - 9 9
10 -12 6 13 -15 7
DISTRIBUTICN OF AVOIDANCE TENDENCY BY SITUATION
(AUSTRIAN SAMPLE)
Greatest Avoidance Tendency (1-3)
PHYSICAL HAZARDS
Thirst Illness Auto Accident % Cum.% No. % Cum.% No. % Cum.% --
26.3 26.3 10 71.4 71.4 9 45.0 45.0 21.1 47.4 0 0.0 71.4 3 15.0 60.0 10.5 57.9 2 14.3 85.7 6 30.0 90.0 26.3 84.2 1 7.1 92 . 9 2 10.0 100.0 15.8 100.0 1 7.1 100.0 0 0.0 100.0
SOCIAL HAZARDS
Beins_ Disliked :&nbarrassrrent Failing % Cum.% No. % Cum.% No. % Cum.%
12.5 12.5 0 o.o 0.0 6 16.2 16.2 15.0 27.5 3 11.1 11.1 16 43.2 59.5 20.0 47.5 7 25.9 37.0 6 16.2 75.7 25.0 72.5 9 33.3 70.4 7 18.9 94.6 27 . 5 100.0 8 29.6 100.0 2 5.4 100.0
NA'.lURAL HAZARDS
Forest Fire Earthquake Tornado % CUm. % No. % CUm.% No. % Cum.%
15.8 15.8 10 35.7 35.7 8 16.7 16.7 26.3 42.1 1 3.6 39.3 9 18.8 35.4 23.7 65 . 8 5 17.9 57.l 11 22.9 58.3 15. 8 81.6 10 35.7 92.9 11 22.9 81.2 18.4 100.0 2 7.1 100.0 9 18.8 100.0
Attacked No. % Cum.%
6 15 .4 15.4 15 38.5 53.8 12 30.8 84.6 I
5 12.8 97.4 N N
1 2.6 100.0 I
Loneliness No. % Cum.%
7 23.3 23.3 9 30.0 53.3 5 16.7 70.0 4 13.3 83 . 3 5 16.7 100.0
Flcx:xi No. % Cum. %
4 10.0 10.0 14 35 . 0 45.0 12 30.0 75 .0
8 20.0 95.0 2 5.0 100.0
contd.
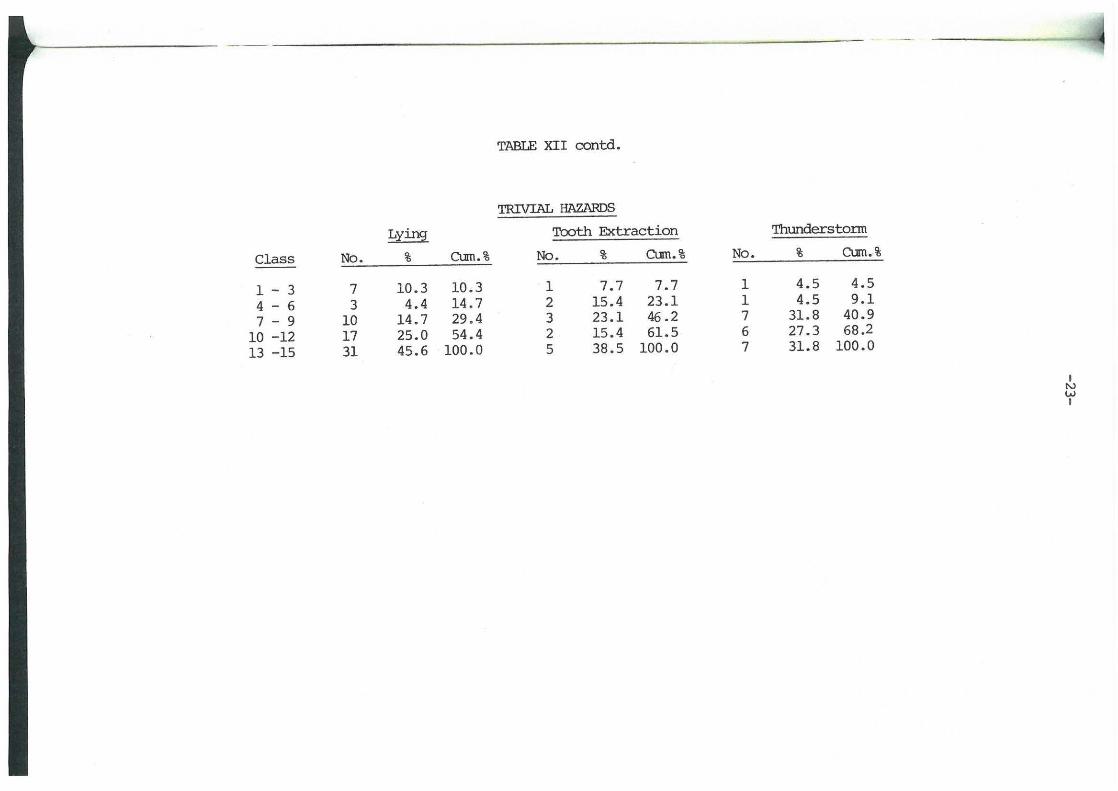
TABLE XII contd.
TRIVIAL HAZARDS
Lying Tooth Extraction Thunderstonn
Class No. % CUm.% No. % CUm.% No. % CUm.%
1 - 3 7 10.3 10 . 3 1 7.7 7.7 1 4.5 4.5
4 - 6 3 4.4 14.7 2 15.4 23.l 1 4.5 9.1
7 - 9 10 14.7 29 . 4 3 23.1 46 .2 7 31.8 40.9
10 -12 17 25.0 54.4 2 15.4 61.5 6 27.3 68.2
13 -15 31 45.6 100.0 5 38.5 100.0 7 31.8 100.0
I N w I
IMAGINATICN: P(X)R TABLE XIII
DISTRIBUTIOO OF AVOIDANCE TENDENCY BY SITUATIOO
(AUSTRIAN SAMPLE)
Greatest Avoidance Tendency (1-3)
PHYSICAL HAZARDS
Thirst Illness Auto Accident Attacked Class No. % CUm.% No. % CUm.% No. % CUm.% No. % CUm.% -1 - 3 12 11.1 11.1 73 60.8 60.8 48 41. 7 41. 7 22 39.3 39.3 4 - 6 17 15.7 26.9 24 20.0 80.8 35 30.4 72.2 19 33.9 73.2
I 7 - 9 34 31.5 58.3 12 10.0 90.8 18 15.7 87.8 7 12.5 85.7 N
10 -12 24 22.2 80.6 7 5.8 96.7 12 10.4 98.3 4 7.1 92.9 +: I
13 -15 21 19.4 100.0 4 3.3 100.0 2 1. 7 100.0 4 7.1 100.0
SOCIAL HAZARDS
Being Disliked EmbarrasSJrent Failing: loneliness Class No. % CUm.% No. % CUm.% No. % CUm.% No. % CUm.%
1 - 3 14 17.3 17.3 11 11.0 11.0 14 17.9 17.9 32 37.2 37.2 4 - 6 13 16.0 33.3 24 24.0 35.0 18 23.1 41.0 14 16.3 53.5 7 - 9 12 14.8 48.1 19 19.0 54.0 16 20.5 61.5 19 22.1 75.6
10 -12 22 27.2 75.3 23 23.0 77.0 18 23.1 84.6 8 9.3 84.9 13 -15 20 24.7 100.0 23 23.0 100.0 12 15.4 100.0 13 15.1 100.0
NATURAL HAZARDS
Forest Fire Earthquake Tornado Flood --1 - 3 16 21.6 21.6 31 34.8 34.8 7 13.7 13.7 9 12.2 12.2 4 - 6 18 24.3 45.9 20 22.5 57.3 8 15.7 29.4 25 33.8 45.9 7 - 9 17 23.0 68.9 17 19.1 76.4 15 29.4 58.8 17 23.0 68.9
10 -12 18 24.3 93.2 15 16.9 93.3 11 21.6 80.4 13 17.6 86.5 13 -15 5 6.8 100.0 6 6.7 100.0 10 19.6 100.0 10 13.5 100.0
contd.
~ - - --- - -" -·-
TABLE XIII contd.
TRIVIAL HAZARDS
L:tin~ Tooth Extraction Class No. % CUrn.% No. % CUrn.% No.
1 - 3 1 1.4 1.4 5 3.9 3.9 2 4 - 6 4 5.7 7.1 10 7.8 11. 7 7 7 - 9 9 12.9 20.0 15 11. 7 23.4 24
10 -12 20 28.6 48.6 33 25.8 49.2 35 13 -15 36 51.4 100.0 65 50.8 100.0 47
Thunderstorm % CUrn.%
1. 7 1. 7 6.1 7.8
20.9 28.7 30.4 59.1 40.9 100.0
I N IJ1 I
-26-
TABLE XIV
RANKING OF HAZARDS BY IMAGINABILITY (GCXD VS. P(X)R)
AUSTRIAN SAMPLE
IMAGINATICN Situation Good Poor
Rank Rank Difference
Thirst ( 6 ) (12 ) (-6 )
Phys. Illness ( 1 ) ( 1 ) ( 0 )
Auto Accident ( 2. 5) ( 3 (-0. 5)
Attacked ( 5 ) ( 2 (+3 )
Being Disliked (13 (10 ) (+3
Soc. Embarrassment (12 ( 9 ) (+3
Failing ( 4· ( 8 ) (-4
lDneliness ( 9 ( 5 (+4
Forest Fire (11 ( 6.5) (+4 . 5)
Nat. Earthquake ( 2. 5) ( 4 ) (-1.5)
Tornado ( 7 ) (11 ) (-4 )
Flood ( 8 ) ( 6.5) (+1.5)
------------- ------------ ------------Lying (14. 5) (15 ) (-0. 5)
Triv. Tooth Extraction (14. 5) (13 ) (+1.5)
Thunderstonn (10 ) (14 (-4 )
TABLE~
ct.MJIATIVE DISTRIBUTICN OF AVOIDANCE TENDENCY BY HAZARD TYPE (AUSTRIAN SAMPLE)
PHYSICAL HAZARDS SOCIAL HAZARDS NA'IURAL HAZARDS
Class No. % Ctnn.% Class No. % Ctnn.% Class No. % Ctnn.%
I
10-14 12 8,3 8.3 10-14 10 6.9 6.9 10-14 15 10.4 10.4 N .....J I
15-19 39 27.1 35.4 15-19 6 4.2 11.1 15-19 20 13.9 24.3
20-24 31 21.5 56.9 20-24 23 16.0 27.1 20-24 11 7.6 31.9
25-29 31 21.5 78.5 25-29 17 11.8 38.9 25-29 23 16.0 47.9
30-34 20 13.9 92.4 30-34 16 11.1 50.0 30-34 27 18.8 66.7
35-39 9 6.3 98.6 35-39 28 19.4 69.4 35-39 11 7.6 74.3
40-44 0 0.0 98.6 40-44 22 15.3 84.7 40-44 22 15.3 89.6
45-49 2 1.4 100.0 45-49 16 11.1 95.8 45-49 12 8.3 97.9
50-54 0 o.o 100.0 50-54 6 4.2 100.0 50-54 3 2.1 100.0
Sex
-28-
TABIE XVI
BREAKI:X:WN OF AVOIDANCE TENDENCIF.s BY HAZARD TYPE AND SOCIO
.ux;rCAL VARIABLES
AUSTRIAN SAMPLE
PHYS. HAZARD soc. HAZARD NAT. HAZARD
e 0 d 0 d 0 d
male 68 . 75 75.82 7.07 76.09 7.34 54.00 -14.75
f anale 51.25 24.18 -7.07 23.91 -7.34 46.00 14.75
* *
Occupation
~
Eirployees 62.50 65.93 3.43 56.52 -5.98 60.00 -2.50
Students 36.11 31.78 -4.24 43.48 7.37 40.00 3.89
others 1.39 2.20 0.81 0.0 -1.39 0.0 -1.39
under 26 41.67 32.97 -8.70 52.17 10.51 44.00 2.33
26 - 35 30.56 35.16 4.61 21. 74 -8.82 28.00 -2.56
36 - 45 7.64 8.79 1.15 8.70 1.06 4.00 -3.64
over 45 20.14 23.08 2. 94 17.39 2.75 24.00 3. 86
* Significant at the 1 % level.
e =Percent of the occurrence frequency per social category.
o = Observed occurrence frequency for a strong avoidance tendency per social category with regard to physical, social and natural hazards.
d = Differences between expected and observed occurrence frequency.
-29-
References
(1] Butschek, Christine. "Die Bedeutung der Vorstellung filr das Imitationslemen." Dissertation, Psychological Institute of the University of Vienna, 1972.
(2] Golant, s., and Bw:ton, I. "Avoidance-Response to the Risk Environrrent." Natural Hazard Research Working Paper No. 6, Depa.rt:nep.t of Geography, University of Toronto, 1969.
( 3] otway, Harry J. "Risk Assessrrent and Societal Choices. " IIASA RM-7 5-2 , Laxenburg, Austria, International Institute for Applied Systems Analysis, 1975.
(4] Schaden, Margit. "Die Bedeutung der Vorstellung in der Verhaltenstherapie." Dissertation, Psychological Institute of the University of Vienna, 1974.