Role of renewable fuels in
transport up to 2050 – a sce-
nario based analysis to contribute
to Paris Agreement goals D6.2 RESfuels in transport sector
Ayla Uslu, Joost van Stralen &
Larissa Pupo Nogueira
TNO Energy Transition
Amsterdam, the Netherlands
Report no. TNO 2020 P10738
www.tno.nl

1
Deliverable Information
Grant Agreement Number 764799
Project Acronym ADVANCEFUEL
Instrument CSA
Start Date 1 September 2017
Duration 36 months
Website www.ADVANCEFUEL.eu
Deliverable Number D6.2 RESfuels in transport sector
Deliverable Title Role of renewable fuels in transport up to
2050 –A scenario based analysis to contrib-
ute to Paris agreement goals
Expected Submission M26
Actual Submission M34
Authors Ayla Uslu, Joost van Stralen, Larissa Pupo
Nogueira
Reviewers Ric Hoefnagels, Ivan Vera Concha (both
Utrecht University); Yuri Kroyan (Aalto);
Karina Veum (TNO); Calliope Panoutsou
(ICL); Birger Kerckow (FNR), Kristin Sternberg
(FNR)
Dissemination Level
Public (PU), Restricted (PP), Confidential
(CO)
PU

2
ADVANCEFUEL at a glance
ADVANCEFUEL (www.ADVANCEFUEL.eu) aims to facilitate the commercialisation of renewable
transport fuels by providing market stakeholders with new knowledge, tools, standards and
recommendations to help remove barriers to their uptake. The project will look into liquid ad-
vanced biofuels – defined as liquid fuels produced from lignocellulosic feedstocks from agri-
culture, forestry and waste – and liquid renewable alternative fuels produced from renewable
hydrogen and CO2 streams.
In order to support commercial development of these fuels, the project will firstly develop a
framework to monitor the current status, and future perspectives, of renewable fuels in Eu-
rope in order to better understand how to overcome barriers to their market roll-out. Follow-
ing this, it will investigate individual barriers and advance new solutions for overcoming them.
The project will examine the challenges of biomass availability for second-generation biofuels,
looking at non-food crops and residues, and how to improve supply chains from providers to
converters. New and innovative conversion technologies will also be explored in order to see
how they can be integrated into energy infrastructure.
Sustainability is a major concern for renewable fuels and ADVANCEFUEL will look at socio-
economic and environmental sustainability across the entire value chain, providing sustaina-
bility criteria and policy-recommendations for ensuring that renewable fuels are truly sustain-
able fuels. A decision support tools will be created for policy-makers to enable a full value
chain assessment of renewable fuels, as well as useful scenarios and sensitivity analysis on the
future of these fuels.
Stakeholders will be addressed throughout the project to involve them in a dialogue on the
future of renewable fuels and receive feedback on ADVANCEFUEL developments to ensure
applicability to the end audience, validate results and ensure successful transfer and uptake of
the project results. In this way, ADVANCEFUEL will contribute to the development of new
transport fuel value chains that can contribute to the achievement of the EU’s renewable en-
ergy targets, and reduce carbon emissions in the transport sector to 2030 and beyond.
To stay up to date with ADVANCEFUEL’s stakeholder activities, sign up at:
www.ADVANCEFUEL.eu/en/stakeholders

3
Executive Summary Transport sector, including international aviation and shipping, represents more than a quarter
of EU greenhouse gas (GHG) emissions1. It is the only sector in the EU, where the emissions are
continuously increasing. This sector remains dependent on fossil fuels, with oil-derived fuels
accounting for 95% of final energy consumption. The demand for transport is expected to grow
at a faster rate, posing a major challenge to efforts to reduce GHG emissions in line with the
Paris Agreement goal. Even when the 2030 renewable energy and energy efficiency policies are
implemented the transport sector will continue to emit significant amounts of GHG emissions.
The main elements of the EUs carbon reduction strategy for the transport sector include in-
creasing the efficiency of the transport sector, moving towards zero emission vehicles (ZEVs2),
and speeding up the deployment of carbon neutral energy carriers. Advanced biofuels and
(liquid) renewable fuels from non-biological origin are among the key options for reducing GHG
emissions. Currently, biofuels comprise around 5% of the total fuels used in the transport sector
in the EU. Less than 0,2% of biofuels are from lignocellulosic feedstocks (Gain, 2019). Their fur-
ther development and market uptake raises significant challenges in terms of energy policy,
and the shaping of industry, technology, supply chains and markets.
Approach and aim of the report The overarching goal of the ADVANCEFUEL project is to facilitate the market roll-out of ad-
vanced liquid biofuels (produced from lignocellulosic feedstocks) and other liquid renewable
fuels from non-biologic origin (further jointly addressed as “RESfuels”), in the transportation
sector in 2030, with an outlook on 2050. Other liquid renewable fuels from non-biologic origin
(hereafter referred as e-fuel) consist of synthetic fuels produced by electrolysis of water with
renewable electricity and CO2 capture. To contribute to this goal and as part of ADVANCEFUEL
project, strategies for the further development of RESfuels will need to be defined. These strat-
egies should be based on solid insights in the full supply chain, taking into account feedstock
costs and potentials, logistics, technology performances and market demand. Furthermore, the
interaction with alternative fuels, such as direct use of electricity, e-fuels and hydrogen (H2),
should also be addressed. To do that, two scenarios and a number of what-if and sensitivity
cases are constructed using RESolve-Biomass model. RESolve-Biomass determines the least-
cost configuration of the entire biobased production chain (including biofuels in transport, bi-
oelectricity, bioheat and biobased products). In addition to biofuels, the model includes other
zero-emission fuels and vehicles. Based on the most recent PRIMES Baseline scenario (2018) a
reference scenario (REF) is constructed that can provide the main input parameters to the
RESfuel scenarios, such as the total energy demand in transport sector. Two main factors –
technology development and the availability of renewable electricity – have set the scenario
framework. Firstly, the Transport BIO scenario reflects a significant technology development in
the production of advanced biofuels; whereas the Road ZERO scenario assumes a technology
breakthrough in zero emission vehicles as well as low electricity prices. The biomass supply both
within the EU and from third countries is considered to respect to the sustainability criteria as
set by the Renewable Energy Directive. The main topics addressed in this report are as follows:
the optimal renewable fuel mixes to meet the GHG emission reduction targets;
1 In 2017, transport, including international aviation and shipping, was responsible for 27% of total GHG
emissions in the EU28(EEA,2019). 2 Zero emission refers to tank- to- wheel emissions.

4
the order of the magnitude ambition of advanced biofuels to comply with the Paris
agreement;
the role of power-to-fuel options (H2 and e-fuels);
the main issues around renewable fuel deployment in aviation and maritime; and
policies to deploy renewable fuels.
Main features of the two scenarios
Transport final en-
ergy demand
Same values implemented for both scenarios. The data derived from PRIMES
baseline (2018).
Biomass demand
from other sectors
Same values implemented to both scenarios. Biomass demand for electricity &
heat derived from PRIMES (2018). Biobased materials demand derived from
S2Biom.
Domestic biomass
potential
Derived from S2Biom and Biomass Policies projects. In Road ZERO, forestry bio-
mass supply potential is reduced by 25%.
Biomass/biofuel
import potential
Biofuel import derived from Biomass Policies and same data implemented for
both scenarios. Import of wood pellets and agricultural residues derived from
Biotrade2020 project. Baseline values implemented for Road ZERO and high
scenario results implemented for Transport BIO.
Technology devel-
opment
In Road ZERO, technology breakthroughs in zero tailpipe emission vehicles such
as electric vehicles. In transport BIO, rapid technological developments in ad-
vanced biofuels.
Renewable elec-
tricity price as-
sumptions
Lower electricity prices in Road ZERO (45 €/MWh in 2030, 40 €/MWh in 2050).
Higher electricity prices in Transport BIO (65 €/MWh in 2030, 60 €/MWh in
2050)
Introduced GHG
emission reduc-
tion targets
85% CO2 emission reduction target by 2050, compared to 1990 for road, rail, in-
land navigation and aviation. For the maritime sector 50% CO2 reduction by
20050 compared to 2008. CO2 emission calculations are based on the tank-to-
wheel emissions.
Scenario projections and conclusions All renewable options, including biofuels, H2, e-fuels and electrification and others need
to be deployed to meet Paris Agreement goals. The overall conclusion is that while the op-
timal renewable fuel mix depends on
the scenario construction all renewa-
ble transport fuel supply options need
to be deployed to meet tank-to-wheel
CO2 emission reduction targets. In this
study, the GHG emissions reduction
target for transport sector 3 is set to
85% by 2050 compared to 1990 levels,
which serves to contribute to meeting
the Paris Agreement goals. While the
main difference between the two sce-
narios, Road ZERO and Transport BIO,
relates to use of electric vehicles (EVs)
on road transport, both scenarios re-
quire significantly high shares of EVs by 2050. In 2030, electrification comprises only 9% and
3 The transport sector refers to road and rail transport, inland shipping and aviation with international
extra EU-flights. It excludes international maritime. Extra-EU flights refer to flights that take off in the
EU and land outside the EU, or vice versa.

5
5% of transport demand and biofuels 5% and 11% of total transport demand in 2030 for Road
ZERO and Transport BIO, respectively. In 2050, more than 85% of the road vehicle fleet in
Transport BIO and 95% in Road ZERO is projected to be EVs. The rest of the renewable fuel mix
aims to replace the fossil carbon with renewable carbon and reduce the CO2 emissions in heavy-
duty vehicles (HDVs), inland shipping and aviation with international extra-EU flights. In 2030,
both scenarios project more than 80% of the fuel mix to be supplied still from fossil fuels. By
2050, fossil carbon is almost entirely replaced with renewable fuels to reduce the CO2 emissions
in heavy-duty vehicles (HDVs), inland shipping
and aviation including international extra-EU
flights.
A 50% GHG emission reduction target is also
introduced to the maritime sector, compared
to 2008 levels, next to the 85% emission re-
duction target. This leads to large deployment
of advanced biofuels and e-fuels in this sector
due to the lack of alternative options. Even so,
the GHG emission reduction in both maritime
and aviation appears to be very challenging.
This indicates the significant importance of
demand management in addition to the re-
newable fuel options.
Results show the need for a significant deployment of advanced biofuels to help reduce
the CO2 emissions in the transport sector. The role of biofuels in the future will largely de-
pend on the timely deployment of ZEVs. Even if the vehicle fleet consist of a significant
amount of zero emission vehicles (ZEVs), still large amounts of biofuels will be needed. By
2050, even the low biofuel demand projections in Road ZERO indicate an increase of 165%
compared to the present biofuel deployment rates. For Transport BIO, the needed increase
will be around 700% in 2050 compared to 2017. More than 70% of the biofuels consist of ad-
vanced biofuels produced from lignocellulosic feedstocks. In absolute terms, the total amount
of biofuels (including biomethane) in the transport sector, including aviation and maritime,
are projected to be more than 700 PJ and 1700 PJ in 2030 according to the Road ZERO and
Transport BIO scenarios, respectively. This increases to more than 1600 PJ and close to 4800
PJ in 2050. The high biofuel projection in Transport BIO is almost equal to today’s gross final
consumption of bioenergy in all sectors in the EU28 , i.e.~5000 PJ. Achieving such amounts
over a period of 30 years will certainly be very challenging.

6
To avoid unsustainable practices mobilisation of European sustainable biomass potential
becomes increasingly important. The maximum biofuel demand projection in the Transport
BIO scenario appears to be mainly limited by the supply potential of sustainable biomass feed-
stocks and the demand from other sectors (heat, power, biobased industry). Mobilising the
sustainable biomass potentials, in this regard, appears to be extremely important, so will the
role of dedicated energy crops on marginal lands. Notably, in the Transport BIO scenario, more
than 80% of the total biomass feedstock categories are projected to be utilised. Even dedicated
energy crops that are relatively more expensive than other types of feedstocks appear to be
utilised in very high amounts in this scenario. Such large amounts are needed to meet the de-
mand from the energy sector (including transport, power and heat sectors) and the biobased
chemicals industry.
Even with the high biofuels deployment power-to-fuel (PtX) supply options will be in-
creasingly needed and any delays in advanced biofuel deployment will shift the pressure
to other sectors in the energy system. According to the modelling results, neither H2 nor e-
fuels appear before 2030. They are projected to contribute to the fuel mix beyond 2035. In
particular, they contribute to the fuel mix of HDVs, maritime and aviation sectors, meeting
around 23% and 24% of the fuel mix in transport sector (including aviation and maritime) in
2050, according to Transport BIO and Road ZERO, respectively. The slow growth in advanced
biofuels in Road ZERO and the biomass resource limitations in Transport BIO cause demand for
these fuels. The PtX4 deployment rates in this modelling exercise require significantly large
amounts of renewable electricity, corresponding to 52% to 56% of the net electricity generation
in the EU in 2017. When the renewable electricity demand for battery electric vehicles (BEVs) is
also included, the pressure in other sectors that also need renewable electricity will increase.
Maritime and aviation sector GHG emissions will continue to grow unless the demand in
these sectors is significantly reduced unless renewable jet fuel production in refineries is
prioritised and renewable fuel use in maritime sector is incentivised. Meeting the 50% CO2
reduction targets for aviation and maritime does not appear feasible according to the Road
ZERO and Transport BIO scenarios. One of the reasons relate to the biorefineries producing a
mixture of jet fuels, gasoline, diesel and light ends. Even if a large number of refineries are
installed, the amount of jet fuels is not likely to meet the demand. Next to that, they will produce
a large amount of other fuels not suitable for aviation. In the event of significant electrification,
these biofuels cannot find market outlets, making the business case even less attractive. An-
other reason relates to the market introduction of certain technologies that produce jet fuels
and the needed time frame for these technologies to grow. For the maritime sector, it relates
mainly to the very high financial gap, which is the difference between advanced renewable fuel
production costs and the low prices of fossil fuels used in this sector.
Recommendations
There is no silver bullet; a balanced set of options (and development of new conversion
routes) will be needed to meet GHG emission reduction targets in transport (next to effi-
ciency improvements and demand side management) to avoid pressure on feedstock mar-
kets, and also electricity and heat sectors.
4In this study PtX covers H2 and e-fuels (such as e-LNG, e-methanol, e-diesel-e-kerosene)

7
One of the options to reduce the pressure on the lignocellulosic feedstock markets, today
largely supplied from forest biomass sources and to a lesser extend from agricultural resi-
dues, is the development of energy crops grown on marginal land, which requires major
(policy) efforts, including the development of infrastructure, farmers experience, regulatory
compliance and support, as they are more expensive compared to other supply options.
Another option is that policies could prioritise biomass supply to the sectors with few al-
ternatives decarbonisation, including the transport sector at the expense of other sectors
that have good alternatives (e.g. electricity generation). Such a prioritisation could, to some
degree, reduce the increasing stress on additional power demand and electricity infrastruc-
ture in Europe.
The policy measures to be implemented need to be strong and stable enough over a longer
period to gain confidence of the relevant stakeholders and to ensure that significant
amounts of RESfuels and ZEVs are deployed. These need to go hand in hand with the en-
ergy efficiency improvements.
Enabling renewable fuels for aviation requires dedicated support to increase the jet fuel
production share in multi-output biorefineries that produce a mixture of fuels. Otherwise,
multi-product technologies may not be sufficient to meet the demand from this sector.
A combination of policies, such as the quota obligation combined with a feed-in premium,
is recommended to provide secure and reliable market conditions until the RESfuel tech-
nologies become more mature, particularly for aviation and also maritime sector.

8
Contents
Executive Summary ................................................................................................................................................ 3
1. Introduction ......................................................................................................................................................... 9
1.1. Background ....................................................................................................................................................... 9
1.2. Objectives ....................................................................................................................................................... 10
1.3. Report outline ............................................................................................................................................... 11
2. Methodology .................................................................................................................................................... 12
2.1. Description of scenarios ........................................................................................................................... 12
2.2. Defining the reference and the 2050 CO2 target setting ............................................................ 13
2.3. Main input data ............................................................................................................................................ 16
2.4. RESolve-Biomass Model & the main scenario assumptions ...................................................... 17
3. Modelling results ............................................................................................................................................ 21
3.1. Transport sector CO2 emissions ............................................................................................................ 21
3.2. Renewable Fuel Mix ................................................................................................................................... 24
3.3. Role of advanced biofuels ....................................................................................................................... 28
3.4. Primary biomass use .................................................................................................................................. 35
4. ‘What if’ cases and the sensitivities ......................................................................................................... 38
4.1. What if biomass demand from power sector is reduced ............................................................ 38
4.2. What if the supply potential is lower .................................................................................................. 39
4.3. What if a CO2 price is introduced to aviation and maritime sectors ...................................... 40
4.4. What if advanced technologies become commercial 5 years earlier ..................................... 43
4.5. Sensitivities .................................................................................................................................................... 44
5. Conclusions, discussions and recommendations ............................................................................... 49
5.1. Conclusions .................................................................................................................................................... 49
5.2. Discussions ..................................................................................................................................................... 51
5.3. Recommendations ...................................................................................................................................... 52
Annex I. Sustainability criteria implemented in S2Biom ........................................................................... 56
Annex II. Transport sector characterization ................................................................................................... 57

9
1. Introduction
1.1. Background Transport sector is the only major EU sector where Green House Gas (GHG) emissions are con-
tinuously increasing. In 2017, transport, including international aviation and shipping, was re-
sponsible from 27% of total GHG emissions in the EU28 (EEA,2019). There is an urgent need to
speed up the decarbonisation efforts in Europe in order to combat climate change and comply
with emission reduction targets. Decarbonisation refers to eliminating carbon-based fuels with
for instance use of renewable electricity. However, transport sectors such as heavy-duty vehicles
(HDVs), aviation and shipping will continue to rely on carbon-based fuels, and they will need to
be replaced by renewable carbon-based transport fuels. We refer to this “renewable-carboni-
sation” of transport sector (referred to as re-carbonisation). Advanced biofuels and liquid re-
newable fuels from non-biological origin are among the key options for transport re-carboni-
sation. However, their further development and market uptake raises significant challenges in
terms of energy policy, and the shaping of industry, technology, supply chains and markets.
Currently, biofuels comprise around 5% of the total fuels used in the transport sector in the EU,
dominated by the food crop-based biofuels (more than 80%). Around 1% of biofuels are from
used cooking oil (UCO) and animal fats, and less than 0,2% from lignocellulosic feedstocks
(Gain, 2019). There is a limited number of demonstration plants and only one first-of-a-kind
(FOAK) demonstration plant producing lignocellulosic ethanol in Europe.
The most recent policy instrument addressing renewable fuels in transport is the recast Renew-
able Energy Directive (EU) 2018/2001 (hereafter REDII). This directive sets the regulatory frame-
work for the use of renewable transport fuels in the EU for the period 2021-2030, and introduces
an EU obligation on fuel suppliers in Europe. The main elements of this framework are as fol-
lows:
Share of renewable fuels in road and rail transport to reach 14% by 2030 (energy
based).
A 7% cap on food and feed crop-based biofuels. If a Member State caps crop-based
biofuels at a level lower than 7%, then it can reduce the overall 14% target.
Sub-mandate to biofuels produced from Annex IX A type feedstock (0,2% in 2022; 1%
in 2025; 3,5% in 2030). Fuels may be double counted to achieve this target, which de
facto implies that the targets are only 0,1%, 0,5% and 1,75%.
Cap on biofuels produced from Annex IX B type feedstock (mainly used cooking oil and
animal fats) of 1,7%5 of transport fuels. These fuels may be double counted to arrive at
a contribution of 3,4%
High ILUC risk biofuels will be phased out towards 2030 unless they are certified as
being low ILUC risk
Biofuel use in aviation and maritime can be counted 1,2 times
No sub-targets specified to other forms of renewable energy in transport, but they
contribute to achieve the overall 14% (or lower) target.
o Renewable electricity, when used in road vehicles, counts 4 times. When used
in rail, counts 1,5 time.
5 For Malta and Cyprus this 1.7% cap is not applicable.

10
o Renewable liquid and gaseous transport fuels of non-biological origin (can be
produced from renewable electricity).
The Paris Agreement aims to keep the increase in global average temperature to well below 2
°C above pre-industrial levels; and to pursue efforts to limit the increase to 1.5 °C, recognizing
that this would substantially reduce the risks and impacts of climate change. Deployment of
renewable fuels in transport sector, including advanced biofuels, will contribute to Paris Agree-
ment goal. However, a quantitative analysis looking at the role of advanced biofuels and the
possible interactions with other renewable fuel options is missing.
1.2. Objectives The overarching goal of the ADVANCEFUEL project is to facilitate the market roll-out of ad-
vanced liquid biofuels (produced from lignocellulosic feedstocks) and other liquid renewable
fuels (further jointly addressed as “RESfuels”) in the transportation sector in 2030, with an out-
look on 2050. To contribute to this goal and as part of this project, strategies for the further
development of RESfuels will need to be defined. These strategies should be based on solid
insights in the full-chain fuel cost, taking into account feedstock costs and potentials, logistics,
technology performances and market demand. The interplay with alternative fuels, such as e-
fuels, is also relevant in this respect. Besides, it should be clear how robust these insights are,
and what the impacts could be of e.g. sustainable feedstock mobilisation and technological
progress, and also of changing fossil energy prices.
In this report, results of an integrated analysis through useful scenarios and sensitivity analyses
on the future role of RESfuels are presented. This includes analysing the role of advanced bio-
fuels in relation to the possible developments in other renewable fuel options. The analysis
takes into account the sustainable supply of biomass feedstocks, both within the EU and im-
ports from third countries. Particular attention is given to the role of dedicated energy crops as
the innovative technologies that can contribute to their production cost reduction has been
analysed in “D2.2 Innovative cropping schemes for lignocellulosic feedstock production” and
their sustainability aspects were analysed in “D4.3 Regional specific impacts of biomass feed-
stock sustainability”. This analysis includes the future cost reduction potential of advanced bio-
fuel conversion technologies. CAPEX cost reduction potentials were analysed in “D3.5 Data on
low-risk ramp-up of liquid biomass conversion technologies”. The main research questions ad-
dressed in this report are as follows.
What are the optimal renewable fuel mixes to meet the GHG emission reduction tar-
gets?
What is the order of the magnitude ambition of advanced biofuels to comply with the
Paris agreement?
What will be the role of power-to-fuel options?
How will certain policies (targets and CO2 prices) affect the deployment of renewable
fuels?
What are the main issues around renewable fuel deployment in aviation and maritime?
The scenario-based modelling analyses in this study are meant to project what could happen
under pre-determined conditions and highlight the key choices and consequences. Thus, they
are not predictions of what will happen in the future. This analysis provides valuable information
regarding the main sensitivities around renewable energy deployment in the transport sector.

11
1.3. Report outline Chapter 2 introduces the methodological framework. It presents the scenario approach and the
storylines. The main input parameters such as biomass feedstock potentials, the techno-eco-
nomic update of conversion technologies and the modelling tool itself are briefly introduced in
this chapter. Chapter 3 presents the modelling results related to the main scenarios. This is
followed by the “what if ” cases and the sensitivity analysis in Chapter 4. Finally, the overall
conclusions are drawn in Chapter 5.

12
2. Methodology
2.1. Description of scenarios The scenarios are based on the main driving forces that will shape the future of RESfuels in
Europe. These forces were identified and evaluated according to their importance and uncer-
tainty in a dedicated expert workshop. The most important and uncertain parameters were
identified as being (i) the future developments regarding zero tailpipe emission vehicles (ZEVs),
(ii) technology developments in the time frame 2020-2050, and (iv) the availability of renewable
electricity (RES-e) supply. These parameters constitute the basis for the scenario framework.
Figure 1 illustrates the scenario construction. Based on the four quadrants, two scenarios are
considered as the most relevant to analyse the role of RESfuels.
Figure 1. illustration of the scenario construction based on the uncertainties
SC1: SCENARIO ROAD ZERO
General scenario storyline
In this scenario, considerations of climate change and energy security at EU-level lead to
strong cooperation in meeting climate mitigation goals. This boosts the development of
renewable energy technologies and electrification of the energy system at a rapid pace. Rapid
transition to electrification is driven by ambitious GHG reduction targets at a national and
EU-level, combined with policy measures and incentives that eventually decrease investment
costs for electricity generation from solar and wind. Power generation is entirely renewable
SC2: Scenario
Transport BIO
SC1: Scenario Road
ZERO
Zero-emission vehicle (ZEV) technology development
ZEVs for 2050 includes battery electric vehicles and fuel cell electric vehicles.
RESfuels technology development
High RES-e availability Low RES-e availability

13
in 2050. Bioenergy continues to play an important role in heat and electricity generation, but
its role in transport sector is more limited due to slow progress in advanced biofuel
technologies. Biofuels produced from food and feed crops are capped due to sustainability
concerns.
Key characteristics of the energy economy of the transport sector
Technology breakthroughs in zero tailpipe emission vehicles such as electric vehicles with
batteries (BEVs), and fuel cell vehicles (FCVs) play a major role in meeting the climate
objectives in the transport sector through higher efficiency and reduced costs over time.
Limited technological developments in advanced biofuel conversion technologies in
terms of efficiency and cost-competitiveness for commercialization result in a relatively
slow implementation of advanced biofuels in the transport sector. Nevertheless, the
HDVs, maritime and aviation sectors are likely to rely mostly on a mix of biofuels,
hydrogen and e-fuels by 2050.
SC2: SCENARIO TRANSPORT BIO
General scenario storyline
EU Member States opt for a steady but secure energy transition hence maximizing the use
of existing infrastructures and conventional transport technologies. Therefore, due to limited
incentives to change existing infrastructures and the high intermittency and costs of
renewable electricity, the electrification of the energy system is more limited compared to
the previous scenario, and efforts are directed towards biomass-to-energy systems.
Rapid technological developments in the biorefinery sector result in cost reductions and
higher efficiency of biofuel conversion technologies and consequently, a fast-paced market
uptake for advanced biofuels. This is also encouraged by the EU Member States and society’s
support to keep existing infrastructures (internal combustion engines (ICEs)), hence in favour
of technologies that will have the least effect on citizens’ and businesses’ habits. This in
combination with the low availability of electricity from renewable energy sources results in
less focus on electrification and an increased focus on fuel efficiency and biofuels.
Key characteristics of the energy economy of the transport sector
In this scenario, there is a strong growth of advanced biofuels in the transport sector.
The HDVs, maritime and aviation sectors are likely to rely mostly on a mix of biofuels,
hydrogen and e-fuels by 2050.
2.2. Defining the reference and the 2050
CO2 target setting A reference scenario is needed that can provide the main input parameters to the RESFuel sce-
narios, such as the total km driven, total energy demand in transport sector and related GHG
emission reductions. The most recent Baseline scenario (2018) conducted for the European
Commission is chosen for this purpose.
The PRIMES Baseline scenario has been developed to help define the long-term strategy of the
European Union. It builds largely on the EU Reference Scenario 2016 (REF2016), but also pre-
sents an update on key elements. It keeps the macro-economic projections, fossil fuels price
developments and pre-2015 Member States policies as implemented in REF2016. The Baseline

14
scenario incorporates an update on technology assumptions as well as recently agreed legisla-
tions and Commission proposals. It also projects the achievements of energy and climate 2030
targets as agreed by June 2018, as well as the continuation of policies impacting non-CO2 emis-
sions.
The Baseline scenario reflects the current EU decarbonisation trajectory based largely on agreed
EU policies for the time frame up to 2030. These policies will continue pushing further GHG
emissions reduction, and increasing energy savings and renewable energies deployment after
2030, either because they do not have a "sunset clause" (notably ETS, and since recently, Article
7 in revised EED), or because of the technological learning and cost reductions that they are
expected to induce. Moreover, most actions in the energy system have long-term impacts. The
Baseline scenario captures these dynamics, however, no intensification of policies post-2030
was assumed and no target for GHG emissions reduction in 2050 was set (EC, 2018).
Table 1. Main input data according to PRIMES baseline scenario (EC, 2018)
Unit 2030 2050
Transport sector final energy demand (includes
aviation with international extra-EU flights and
inland shipping))
PJ 13640 11298
Aviation including international extra-EU flights PJ 2339 2646
EU international shipping final energy demand PJ 2495 2927
2.2.1. CO2 emission reduction targets for 2050
Both Transport BIO and Road ZERO scenarios aim to achieve one single objective, that is to
contribute to the Paris Agreement goal. This goal is to keep the increase in global average
temperature to well below 2 °C above pre-industrial levels; and to pursue efforts to limit the
increase to 1.5 °C, recognizing that this would substantially reduce the risks and impacts of
climate change. However, determining a robust CO2 emission reduction target (or target range)
for transport sector for 2050 is very challenging. The needed emission reductions in transport
sector relate, among others, to the decarbonisation efforts in all sectors of the European Union
and the economy as a whole. The European Commission’s 2011 transport white paper
“Roadmap to a single European transport area — Towards a competitive and RESOURCE-
EFFICIENT transport system” (EC, 2011) indicated a 60% CO2 emission reduction in 2050 (com-
pared to 1990), however, this target was set prior to the Paris agreement. “A Clean Planet for
all– A European long-term strategic vision for a prosperous, modern, competitive and climate
neutral economy (EC, 2018) includes a number of scenario analysis that focus on either 80%
GHG emission reduction by 2050 (compared to 1990) or more than 90% GHG emission reduc-
tion.
In this study the two developed scenarios target a 85% CO2 reduction in transport
sector (including aviation with international extra-EU flights6, excluding international
maritime) in Europe by 2050.
For the international maritime a 50% GHG emission reduction target in 2050 com-
pared to 2008 is applied. This target is in line with the sector ambitions.
For aviation sector no specific GHG emission reduction target is included. This sec-
tor is covered under the overall 85% CO2 reduction target.
6Extra-EU flights refer to flights that take off in the EU and land outside the EU, or vice versa.

15
Figure 1 illustrates the transport sector historical GHG emissions and plot the 2050 target
aimed in this study and Figure 2 presents these for the EU international marine sector.
Figure 2. EU28 historical GHG emissions (EEA, 2019) and the 2050 target according to this study
Figure 3. EU28 International maritime GHG emissions (EEA, 2019) and the 2050 target according to this study

16
2.3. Main input data The main data source for domestic biomass feedstock potential is derived from the two pro-
jects; IEE-funded Biomass Policies (2016) and the FP7-funded S2BIOM (2017) projects. While
Biomass Policies has looked into all types of biomass resources, the S2BIOM project has focused
on the lignocellulosic feedstock potentials. The supply data is originally expressed in tonnes of
dry mass on the Nomenclature of Territorial Units for Statistics 3 (NUTS3) level per category for
regions in Europe for the years 2012, 2020 and 2030. Costs data refer to the roadside cost for
biomass based on the activities needed to produce, yield and bring the biomass to the roadside.
When aggregating the cost-supply data into a national level, the weighted average cost per
biomass type was used. Biomass costs are kept constant between 2020 and 2050. This is be-
cause any future cost/price estimate for biomass will include large uncertainties. Both studies
include the 2009 EU Renewable Energy Directive’s (RED) sustainability criteria as the main
framework for calculating the biomass supply potential. Figure 4 illustrates the domestic bio-
mass supply potential used for the main scenario analysis
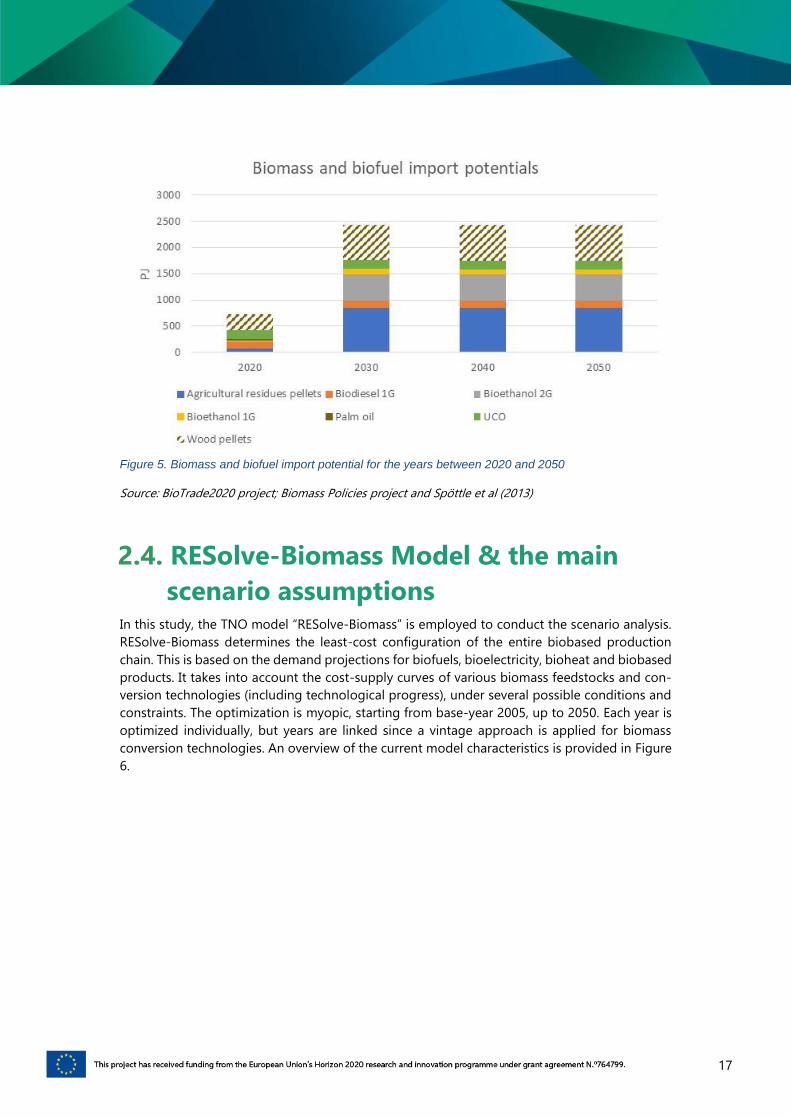
Figure 5 presents the biomass and biofuel import potentials used in the scenario analysis. The
biomass and biofuel import potentials are based on different literatures. Import of wood pel-
lets and agricultural residues are based on the BioTrade project (2016) (BASELINE for Road
ZERO scenario and HIGH for Transport BIO scenario). Import potential of biofuels (both con-
ventional and advanced) are derived from the Biomass Policies project. Finally, the UCO po-
tential is derived from Spöttle et al (2013).
An overview of the RED sustainability criteria used for the identification of land suitable for
production of woody and herbaceous crops per location according to S2Biom is presented in
in Annex I.
Figure 4. EU28 domestic biomass potential implemented in the main scenarios
17
Figure 5. Biomass and biofuel import potential for the years between 2020 and 2050
Source: BioTrade2020 project; Biomass Policies project and Spöttle et al (2013)
2.4. RESolve-Biomass Model & the main
scenario assumptions In this study, the TNO model “RESolve-Biomass” is employed to conduct the scenario analysis.
RESolve-Biomass determines the least-cost configuration of the entire biobased production
chain. This is based on the demand projections for biofuels, bioelectricity, bioheat and biobased
products. It takes into account the cost-supply curves of various biomass feedstocks and con-
version technologies (including technological progress), under several possible conditions and
constraints. The optimization is myopic, starting from base-year 2005, up to 2050. Each year is
optimized individually, but years are linked since a vintage approach is applied for biomass
conversion technologies. An overview of the current model characteristics is provided in Figure
6.

18
Figure 6. Exogenous and endogenous model components of RESolve-Biomass *updated from de Jong et al. 2017.
As Figure 6 shows, demand for bio-based electricity, heat, chemical sector is an exogenous
component of RESolve-Biomass. Demand for transport fuels for maritime and aviation sectors
is also exogenously provided in final energy.
For the purpose of this project, the RESolve-Biomass model is expanded for road transport so
that the competition of different types of vehicles meeting different service demands in the
transport sector can be mimicked. In this new version, final energy demand for advanced
RESfuels in the road transport sector becomes an endogenous parameter optimized by the
model. In contrast, end-use demand driving this final energy consumption is exogenous, pro-
vided either in passenger-kilometres (for public and private transport) or in ton-kilometres (for
freight transport). Figure 7 shows the expansion in RESolve-Biomass (lined in red) within the
complete scheme considered in the model.
Figure 7. Diagram with energy flows considered in RESolve-Biomass
Road Transport Demand
End-useConversion
Non-Road Transport & Other Demands
[energy]
Road Transport[service demand]
Passenger: pkmFreight: tkm
ExternalFuels
Fossil Fuels, electricity,e-fuels, hydrogen

19
16 types of vehicles constitute the energy conversion portfolio of the transport sector in the
model. Each vehicle is characterized by the ranges (efficiencies in PJ/km), mileages (in km), oc-
cupancies (in person per vehicle or tonne per vehicle), typical lifetime (years), and deprecia-
tion (based on scrapping curves) as well as investment and operation costs per vehicle. More
details on these assumptions can be found in the Annex II. The model input data and main assumptions regarding supply options are presented below:
Table 2 Main assumptions regarding model input data
Reference Scenario Road Zero Scenario Transport Bio
Renewable electricity
price
45 €/MWh in 2030
40 €/MWh in 2050
65 €/MWh in 2030
60 €/MWh in 2050
Bioelectricity demand 1161 PJ in 2030
964 PJ in 2050
Bioheat demand 2694 PJ 2030
2412 PJ in 2050
Assumptions
regarding 1st gen
biofuels
Palm oil import for energy purposes is set to zero in 2030 and 2050.
Biodiesel import potentials of 1st generation is kept the same as
2020 potential in 2030 and 2050 (total 132 PJ)
Cap on 1st generation and UCO also beyond 2030
Domestic biomass
supply
Lignocellulosic
biomass supply
from Biomass
Policies & S2Biom
study
Other non-ligno.
biomass supply
from Biomass
Policies
25% reduced
reference potential
for forestry
(roundwood);
Same as reference
Biomass import BioTrade2020
project BASELINE
Import for wood
pellets and
agricultural
residues
Biomass Policies
for import of
biofuels
Spöttle et al (2013)
for import of UCO
BioTrade2020
project BASELINE
Import for wood
pellets and
agricultural
residues
Biomass Policies
for import of
biofuels
Spöttle et al (2013)
for import of UCO
BioTrade2020 High
import scenario for
wood pellets and
agricultural residues
Biomass Policies for
import of biofuels
Spöttle et al (2013)
for import of UCO
Assumptions
regarding electric
vehicles (EVs)
Same as Transport
BIO
EV capital expenditures are lower in Road
ZERO compared to Transport BIO
Power to liquid
options
These value chains consider CO2 via direct air capture
Multipliers No multipliers beyond 2030
Biofuel blending
B7 in 2030 and 2050
E10 applied to all MSs by 2025
By 2030, E20 introduced in all MSs
Introduction of CO2
targets to the model
In the model one common CO2 target for road, rail, inland navigation and
aviation for the years 2030 and 2050 have been specified and

20
interpolation of these CO2 targets for the intermediate years has been
applied. For the maritime sector similarly CO2 targets have been applied
for the years 2030 and 2050 and interpolation for intermediate years. CO2
emission calculations are based on the tank-to-wheel emissions. This
means that emissions related to mining, transport of the fuel, land use
change emissions for biomass and emissions of the grey part of
electricity are excluded.

21
3. Modelling results
3.1. Transport sector CO2 emissions Figure 8 illustrates the historical CO2 emissions in the transport sector (derived from EEA, 2019).
In this study, the transport sector covers road and rail transport, inland navigation and aviation,
including international extra-EU flights. International maritime sector is treated separately and
the results are provided in the below section 3.1.1. Figure 8 also presents the transport sector’s
CO2 emissions according to the three scenarios: Reference, Road ZERO and Transport BIO. The
Reference scenario (coloured in orange) represents the baseline, where the EU’s 2030 policy
goals are achieved. In this scenario, the CO2 emission reduction continues also beyond 2030.
By 2050 around 20% of the CO2 emissions are reduced compared to 1990 levels. This relates to
the spill over effects of recent policy ambitions set for 2030 (mainly recast renewable energy
directive (REDII) and the CO2 standards for vehicles). Nevertheless, the reference scenario clearly
shows that with no additional policies, the transport sector will continue to emit significant
amounts of CO2. In fact, the emissions will be around 5 times higher than the target set in this
study7.
The aim of the two other scenarios, Road ZERO and Transport BIO, is to reduce EU transport
sector CO2 emissions by 85% compared to 1990 to comply with the Paris agreement goals. This
corresponds to allowing not more than 125 Mtonne CO2 emission by 2050. These emissions
relate to tank-to-wheel emissions in the transport sector.
7 The target is set to 85% CO2 reduction by 2050 compared to 1990.
Figure 8. Tank-to-wheel CO2 emissions according to different scenarios

22
The high CO2 emission reductions in the Road ZERO and Transport BIO scenarios, compared to
the Reference scenario, mainly relate to the passenger and freight transport activities. Accord-
ing to the modelling results, CO2 emissions from the passenger transport activity become zero
in 2050. This relates to the electrification of road transport and the higher prices of fossil gaso-
line and diesel compared to fossil fuels used in aviation and maritime, which makes deployment
of renewable fuels more favourable to road transport. The remaining emissions relate mainly
to the aviation sector, followed by the HDVs (see Figure 9). When the two scenarios are com-
pared it appears that the emissions related to freight transport are relatively lower in Transport
BIO scenario than Road ZERO. This difference is due to more extensive use of advanced biofuels
in HDVs in Transport BIO. Contrary to this, the emissions from the aviation sector are relatively
lower in Road ZERO. This is because of the higher deployment rates of e-fuels in this scenario
compared to Transport BIO. Lower renewable electricity prices favour e-fuels and their deploy-
ment in aviation sector.
Figure 9. Breakdown of EU28 transport sector (excl. international shipping) tank-to-wheel CO2 emis-sions in 2050 compared to 1990
3.1.1. Aviation and Maritime
According to the PRIMES Baseline scenario, international maritime transport activity at EU level
is projected to continue growing strongly, increasing by 51% for 2015-2050, due to rising de-
mand from primary resources and container shipping8. For the aviation sector the PRIMES base-
line scenario projects the air transport activity including international extra-EU flights to in-
crease significantly (101% for 2015-2050) (EC, 2018).
8 The reduced demand for fossil fuels due to electrification of road transport and its implications to the
shipping sector is not included in this study. (EC, 2018) indicates around 8% reduction in shipping
activity.

23
In this analysis, the 85% CO2 emission reduction target in 2050 (compared to 1990) covers, next
to road and rail transport, aviation and inland shipping. So, while no separate target or ambition
is set to the aviation sector and inland navigation they are an integrated part of the scenarios.
The EU international shipping has been treated separately. It is assumed that this sector will
need to reduce its CO2 emissions by 50% compared to 2008. Figure 10 illustrates the aviation
and shipping related emissions. According to the reference scenario, the emissions in these two
sectors will continue to increase (in line with the projected activity increases in these sectors).
Since a separate target is introduced for international shipping, the same emission reduction
appears in both Road ZERO and Transport BIO. What is interesting is the renewable fuel mix
that enables this emission reduction. This aspect is discussed in the next sections. In the aviation
sector, Road ZERO estimates a larger CO2 emission reduction as compared to the Transport BIO
scenario. The main reason behind this relates to the relatively larger deployment of e-fuels.
Figure 10. Tank-to-wheel CO2 emission related to aviation and international maritime sector in the EU
*Historical emissions are reported for different years. This is because the aviation and maritime sectors
define CO2 emission reductions for different base years.

24
3.2. Renewable Fuel Mix This section highlights modelling results regarding the fuel mix corresponding to the targeted
CO2 emission reductions of the Road ZERO and Transport BIO scenarios in a cost-optimal way.
In 2017, 95% of the EU transport fuel was fossil based. The reference scenario indicates that
fossil fuels will comprise around 83% of the total transport fuels in 2030, reducing to 66% in
2050, when the current policies up to 2030 are implemented. This reduction mainly relates to
their substitution by biofuels and also increased use of battery electric vehicles (also resulting
in energy savings). In 2050, the reference scenario indicates that more than 20% of the total
transport demand, including international aviation, is met by biofuels, and around 10% is elec-
trified. Total transport fuel in this section relates to fuels used in road and rail transport, inland
shipping and aviation (if not mentioned otherwise). It excludes international maritime.
The main difference between the two scenarios, Road ZERO and Transport BIO, relates to the
amount of biofuels deployed and the electricity used in electric vehicles (EVs). Road ZERO pro-
vides a favourable investment climate for EVs. This is because EV capital expenditures are lower
in Road ZERO compared to Transport BIO. Next to that, the electricity price is assumed to be as
low as 4,5 €ct/kWh in this scenario, whereas it is 6,5 €ct/kWh in Transport BIO. Figure 11 illus-
trates the transport sector fuel mix projections according to the scenario modelling. The total
transport fuel demand in Transport BIO is around 11% higher than in Road ZERO in 2050. This
difference relates to the higher deployment of EVs and related energy savings. The share of
electrification is around 9% of the total transport fuel mix in 2030 in Road ZERO. This increases
to around 50% of the total fuel mix (around 70% of the road transport fuel mix) in 2050. This
corresponds to 35% of the vehicle fleet to be electricity based in 2030, and an increase to 95%
in 2050. Low electricity prices in this scenario also favours e-fuels that can be used in transport
sector, including aviation, with no need for modifications to the vehicle fleet. Biofuels play a
relatively smaller role in this scenario. In 2030, only 5% of the total fuel mix is from biofuels. This
increases to around 12% in 2050.
In the Transport BIO scenario, the role of electrification is comparable with the reference sce-
nario in 2030. Less than 5% of the total fuel mix in transport is from electricity in 2030. In 2050,
electrification comprises around 25% of the total fuel mix. In this scenario only 6% of road
transport demand is electrified in 2030, increasing to 35% in 2050. This corresponds to 85% of
the total vehicle fleet based on EVs in 20509. In 2030, around 11% of the total fuel demand is
met by biofuels and this increases to around 40% in 2050.
In 2050, Power-to-X (PtX) technologies also play an important role in both scenarios. In Road
ZERO, e-fuels correspond to around 20% of the total mix, whereas in Transport BIO, hydrogen
becomes an important fuel, comprising around 15% of the total fuel mix. Low (renewable) elec-
tricity price assumed in Road ZERO favours e-fuel deployment above H2 use as fuel, which also
requires additional costs to the vehicle fleet.
9 The energy efficiency of the BEVs in Road ZERO is relatively better than Transport BIO. That is why such
a high share of BEVs appears in also Transport BIO.

25
Figure 11. Transport sector fuel mix according to different scenarios for 2030 and 2050
3.2.1. Renewable fuels in road transport, shipping and aviation
Figure 12 illustrates the amount of renewable fuels in 2030 and 2050 in different sub-sectors in
transport and Figure 13 presents the share of renewable fuels compared to total fuel demand
in these sub-sectors. These figures also include EU international maritime. In 2030, biofuels and
electrification of road transport are the two renewable options that help to reduce CO2 emis-
sions in the transport sector in both scenarios. In 2050, due to the ambitious CO2 emission
reduction targets (translated to renewable fuels in these scenarios), other renewable options
such as H2 and e-fuels also play an important role. Beyond 2030, biofuels shift more to the
marine and aviation sectors in Road ZERO as around 95% of the vehicle fleet in road transport
consist of EVs. Different from Road ZERO, biofuel consumption in road transport continues to
increase in the Transport BIO scenario. In this scenario, most of the renewable fuel options
appear equally important (comprising >20% of the demand), whereas in the other scenario
electrification appears as the major player followed by e-fuels.
In Transport BIO biofuels are projected to already play some role in the aviation sector, meeting
around 3% of the sector’s demand in 2030. In 2050, biofuels contribute to around 29% of EU
aviation demand, followed by e-fuels satisfying around 16% of the demand in 2050. In Road
ZERO, contribution of biofuels in the aviation sector appears beyond 2030. Nevertheless in 2050
around 19% of the demand is supplied by biofuels. This is 10% less than in the Transport BIO
scenario. The main renewable supply option appears as e-fuels in this scenario, meeting around
39% of the demand.
In the shipping sector, 4% of the demand is met by biofuels according to Transport BIO in 2030.
In Road ZERO, this is only 1%. In 2050, the share of biofuels appears to be around 23% and 28%

26
according to Road ZERO and Transport BIO, respectively. And the share of e-fuels is 27% and
22% according to Road ZERO and Transport BIO, respectively.
Figure 12. Amount of renewable fuels in road, shipping and aviation for 2030 and 2050 according to different scenarios
27
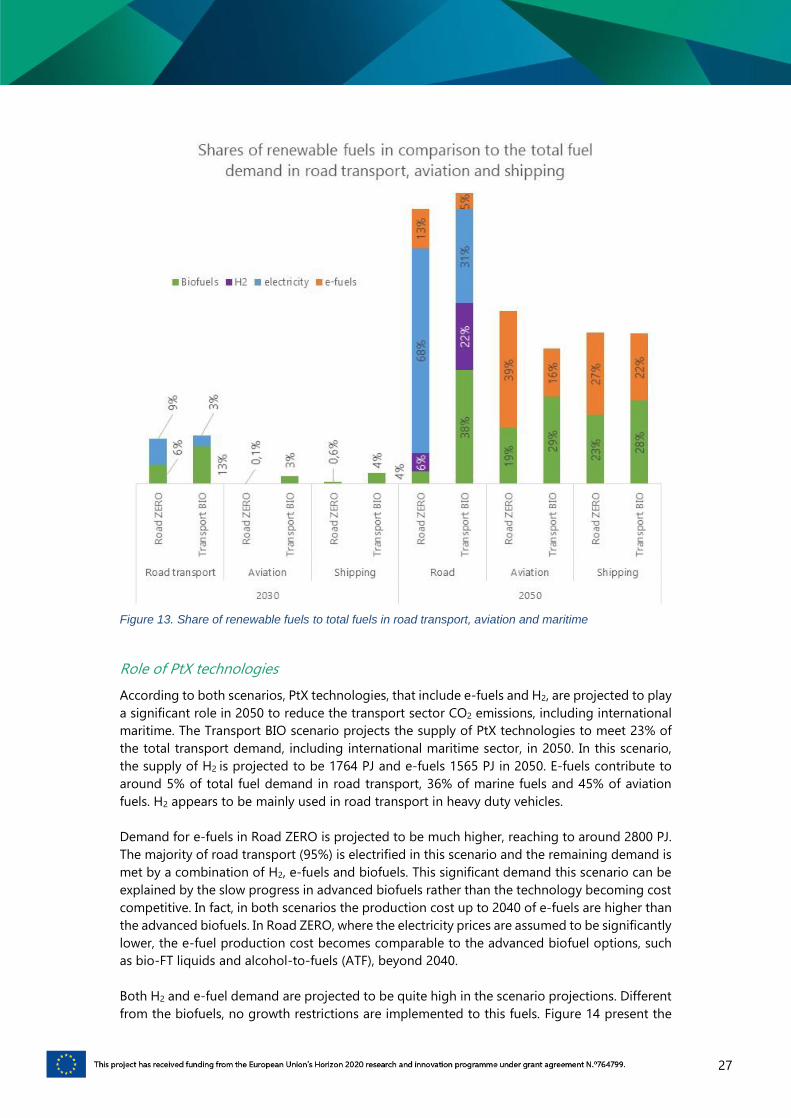
Figure 13. Share of renewable fuels to total fuels in road transport, aviation and maritime
Role of PtX technologies
According to both scenarios, PtX technologies, that include e-fuels and H2, are projected to play
a significant role in 2050 to reduce the transport sector CO2 emissions, including international
maritime. The Transport BIO scenario projects the supply of PtX technologies to meet 23% of
the total transport demand, including international maritime sector, in 2050. In this scenario,
the supply of H2 is projected to be 1764 PJ and e-fuels 1565 PJ in 2050. E-fuels contribute to
around 5% of total fuel demand in road transport, 36% of marine fuels and 45% of aviation
fuels. H2 appears to be mainly used in road transport in heavy duty vehicles.
Demand for e-fuels in Road ZERO is projected to be much higher, reaching to around 2800 PJ.
The majority of road transport (95%) is electrified in this scenario and the remaining demand is
met by a combination of H2, e-fuels and biofuels. This significant demand this scenario can be
explained by the slow progress in advanced biofuels rather than the technology becoming cost
competitive. In fact, in both scenarios the production cost up to 2040 of e-fuels are higher than
the advanced biofuels. In Road ZERO, where the electricity prices are assumed to be significantly
lower, the e-fuel production cost becomes comparable to the advanced biofuel options, such
as bio-FT liquids and alcohol-to-fuels (ATF), beyond 2040.
Both H2 and e-fuel demand are projected to be quite high in the scenario projections. Different
from the biofuels, no growth restrictions are implemented to this fuels. Figure 14 present the

28
e-fuel growth according to the two scenarios. E-fuel demand is in the 1565PJ and 2795 PJ in
2050 in Transport BIO and Road ZERO scenarios, respectively. H2 demand is 1764PJ and 411 PJ
in Transport BIO and Road ZERO scenarios, respectively. These PtX options will require around
1728-1624 TWh renewable electricity in 2050. These numbers correspond to 52% to 56% of the
net electricity generation in 201710. Next to that, according to REDII, renewability of e-fuels will
be based either on the European or national average share of electricity from renewable sources
as measured two years before the year in question, or the amount obtained directly from re-
newable electricity generation installation. Furthermore, there should be an element of addi-
tionality, meaning that the fuel producer is adding to the renewable deployment or to the fi-
nancing of renewable energy. The accounting details of this fuels are to be set in a delegated
act by 31 December 2021.
3.3. Role of advanced biofuels According to the modelling results, biofuels are expected to play an important role in reducing
GHG emissions in the transport sector. Their relative role will depend on the future deployment
of other renewable supply options and the deployment of zero emission vehicles. According to
Road ZERO scenario, biofuels comprise 716 PJ in 2030, which is 4% of overall transport demand
(including international aviation and maritime). This amount corresponds to 6% of the final
energy demand in road and rail transport. Conventional biofuels produced from food and feed
crops comprise 37% of the total fuels. The rest relates to the biofuels produced from animal fat,
UCO and other organic wastes and residues. In 2050, biofuel deployment increases by 130%
and reaches to 1644 PJ in Road ZERO. This amount can meet 13% of the total fuel demand in
overall transport sector (including international shipping and aviation) and 23% of the final en-
ergy demand in road and rail transport in 2050. More than 80% of the biofuels relate to liquid
biofuels, and more than 70% of the total biofuels is produced from lignocellulosic feedstocks,
according to this scenario in 2050.
In Transport BIO, biofuels comprise around 10% of total fuel mix in transport sector, including
aviation and maritime, and 14% of the final energy demand in road and rail transport in 2030.
The absolute amount of biofuels in this sector is already larger than the biofuels projects in
Road ZERO for 2050. In 2050, the amount of biofuels increases around 3 times of the 2030
amount and reaches to 4790 PJ. This is almost equal to today’s gross final consumption of
10 According to Eurostat, net electricity generation in 2017 was 3099TWh.
Figure 14. E-fuel deployment according to different scenarios

29
bioenergy in all sectors the EU28 ~5000 PJ. This amount corresponds to 34% of total fuel de-
mand and 57% of the road and rail transport final energy demand. More than 85% of the bio-
fuels are projected to be produced from lignocellulosic feedstocks in this scenario.
When compared to current production levels, even the low biofuel supply projections in Road
ZERO scenario will require an increase of around 165%. For Transport BIO the needed increase
will be around 700% in 2050 compared to 2017.
Figure 15 presents the total biofuel demand according to Road ZERO and Transport BIO.
Figure 15. Role of biofuels in 2030 and 2050 according to the scenario modelling
Figure 16 presents the modelling results regarding the contribution of different biofuel tech-
nologies according to the two scenarios. The biofuel mix in 2030 mainly relates to conventional
biofuels, biodiesel produced from used cooking oil (UCO) and animal fats and bio-LNG based
on anaerobic digestion of organic wastes and residues. In the Transport BIO scenario, biofuels
based on the pyrolysis pathway also appear to play an important role already in 2030. This
relates to the co-processing of pyrolysis oil in existing refineries. This co-processing results in a
mix of gasoline, diesel, and a small amount of marine gas oil. The scenario analysis indicates
that this pathway emerges in 2025 and steadily increases up to 2040. Beyond 2040, a reduction
is observed. This is mainly related to the significantly reduced demand for gasoline based fuels.
which is considered as the main product with the largest share in an existing conventional re-
fineries.
In 2050, biofuels produced from lignocellulosic feedstocks comprise more than 70% of the total
fuels in Road ZERO, and more than 85% in Transport BIO. The share of biofuels produced from
food and feed crops become very small, around 3% of the total biofuels in Transport BIO and
8% in Road ZERO. This relates to the cap introduced to such biofuels beyond 2020. Next to that,
biofuels produced from palm oil and soybean are set to zero in 2030 onwards due to their high
iLUC profiles. Biofuels produced from used cooking oil and animal fats are also capped to 1,7%
of road and rail transport demand from 2030 onwards.

30
One of the main differences between the two scenarios appears to be the advanced biofuel
technology mix. In Road ZERO, advanced biofuels produced from the Fischer–Tropsch process
appear as the largest biofuel supply option (comprising 28% of the total biofuels), followed by
Bio-LNG, produced via both anaerobic digestion and gasification routes and comprising 17%
of the total biofuels, HTL (19% of the total biofuels) and ATF (16%) processes in 2050. It is
necessary to highlight that these advanced biofuel routes are in different technology readiness
levels (TRLs). According to the literature bio-FT has the highest TRL (7-8), whereas HTL is around
TRL 5-6 with small demonstration activities. Dedicated upgrading of HTL oil to jet fuel is at lab-
scale. Thus, the future role of HTL based on this modelling study needs to be treated with cau-
tious.
In Transport BIO, the largest amount of advanced biofuels relate to Bio-Dimethyl Ether (Bio-
DME) (roughly 42% of the total biofuel supply), followed by ATF fuels (22%) and HTL (17%)
based fuels. The modelling results project Bio-DME use in HDVs as one of the least cost supply
options even when the estimated additional costs11 related to the adaptation of HDVs to use
DME are included in the assessment. It is, however, necessary to highlight that there are cur-
rently no standards12 on DME use in transport, and the development of codes, standards and
compliance testing methodologies can be very challenging and can even become show stop-
pers. Unless, the necessary standards are developed and the investments are done to adapt the
car fleet, Bio-DME will not be a viable option for road transport. This relates to the chicken and
the egg issue (Boehman, 2019) – it is hard to justify building up a fuel production and distribu-
tion infrastructure without vehicles in place that can use the fuel, and it is hard to justify engi-
neering and producing vehicles that would operate on a dedicated alternative fuel without hav-
ing the fuel production and supply infrastructure in place.
11 Due to its good ignition quality, with a high cetane number, DME can be used in diesel engines as a
substitute for conventional diesel fuel. However, compared to diesel fuel, DME has a lower viscosity (in-
sufficient) and poor lubricity. Like LPG for gasoline engines, DME is stored in a liquid state under rela-
tively low pressure of 0.5 MPa. This helps to limit the number of modifications required to the engine.
Still, some slight engine modifications are necessary, primarily relating to the injection pump and the in-
stallation of a pressure tank, similar to that for LPG. The fuel line must also be adapted with specific elas-
tomers. DME in diesel engine burns very cleanly with no soot (EAFO, 2020. See https://www.eafo.eu/al-
ternative-fuels/advanced-biofuels/BioDME) 12 The standardization of fuel supply systems (excluding the on-board fuel tank) and refuelling port for
DME vehicles is making progress. The International Organization for Standardization (ISO) established a
working group (ISO/TC22/SC41/WG8), and has been holding meetings regularly since its first interna-
tional meeting in 2016. See https://www.jsae.or.jp/en/publications/yearbook_e/2018/docu/14_En-
gine_for_Alternative_Fuels.pdf

31
Figure 16. Biofuel mix according to different scenarios
Supplying the amounts of biofuels presented in Transport BIO and also Road ZERO will require
significant efforts. For instance, the total number of lignocellulosic biofuel installations will need
to be around 1100 to achieve the advanced biofuel amounts in Transport BIO in 2050. These
will consist of around 300 Bio-DME, 250 pyrolysis, 140 HTL and roughly 380 lignocellulosic eth-
anol plants (to be converted to jet fuels) to be in operation when approaching 205013. While
the total demand for biofuels is lower in Road ZERO, the number of installations needed is still
high. According to this scenario around 360 lignocellulosic biofuel installations would be re-
quired to be operational up to 2050. This will compromise more than 150 Fischer-Tropsch
plants. Next to that, a large number of pyrolysis and HTL plants (around 110 plants) would need
to be operational. To produce the needed jet fuels from ethanol, 95 lignocellulosic ethanol
plants would need to be operational by 2050.
When we assume that these installations are distributed equally among the member states, this
implies on average 40 advanced liquid biofuel installations per member state in scenario
Transport BIO, and around 15 installations per member states in Road ZERO, to be built before
2050.
13 The average plant capacities applied are: 75 MW for ATJ; 200 MW for DME; 100 MW for lignocellulosic
ethanol; 200 MW for HTL and 30 MW for pyrolysis.

32
3.3.1. Biofuels in different transport segments
Figure 17 illustrates the role of biofuels in different transport segments according to the two
scenarios. The Biofuels share in road transport continues to grow in the Transport BIO scenario
projections, and the absolute amount is 11 times higher than in Road ZERO. This is because
biofuels are mostly used to meet the large demand in road transport, whereas, the vehicles with
the internal combustion engine (ICE) are replaced by electric vehicles in Road ZERO. According
to the Road ZERO projections, biofuel consumption steadily increases between 2025 and 2035
in road transport, and decline afterwards.
The contribution of biofuels in maritime sector appears to be limited to 23% and 28% of the
total demand in Road ZERO and Transport BIO, respectively. The limited role in Transport BIO
can be explained by the fact that majority of the biofuels are projected to be used in road
transport and the maximum limit of sustainable biomass supply potential is reached. In Road
ZERO, the limited role relates to:
i) The amount of fossil LNG projected up to 2050. 11% of the maritime sector
fuels is projected to be LNG and the scenario projections consider around 90%
of this fuel by bio-LNG.
ii) The slow progress in advanced biofuel technologies. For instance Fischer-
Tropsch process is introduced in 2035 and its growth rate between 2040-2050
will be limited. Besides, biorefineries produce multiple products and they also
meet the demand in aviation.
In the maritime sector, the distribution of fossil fuels (heavy fuel oil (HFO), marine gas oil (MGO),
low-sulphur heavy fuel oil (LSHFO) and liquified natural gas (LNG)) for 2030 and 2050 are de-
rived from the 2018 PRIMES scenario projections. In this study, the renewable fuel use in the
maritime sector has been modelled based on the optimal supply of renewable fuel options,
which is furthermore based on a distribution over HFO, LSHFO, MGO and LNG based ships in
the model. As opposed to the road transport, possible future shifts related to vessel adapta-
tions, i.e. shifts to methanol or larger shifts to liquefied natural gas (LNG) based ships, cannot
be captured in the RESolve-Biomass model. Thus, any possible shifts among the different ma-
rine fuels or introduction of new types of fuels could not be captured in this study. There is, for
instance, a large body of literature indicating the future opportunities for methanol use in the
marine sector to comply with the IMO regulations. In emission control area (ECA) jurisdictions,
strict SOx, NOx and PM emission targets have been set. These targets may enable the use of
methanol, which cannot be covered in this scenario analysis. The role of LNG-based ships and,
therefore, the role of bio-LNG might also be under estimated. Still, both in Road ZERO and
Transport Bio, bio-LNG is the most dominant biofuel for shipping in 2050. Next to bio-LNG,
FAME and biodiesel and HFO from pyrolysis pathways play an important role in the maritime
sector.
In the aviation sector, only a limited number of biofuel production routes are recognised by
American Society for Testing and Materials (ASTM) standards. These are :
Fischer-Tropsch (FT) fuels such as Biomass-to-Liquid (BtL). BtL can be blended up to
50% with fossil-based jet fuel.

33
Hydrotreated Esters and Fatty Acids (HEFA), also could be blended up to 50% with
fossil kerosene. Renewable Synthesized Iso-Paraffinic (SIP) fuel could be blended with
fossil kerosene up to 10%.
Synthetic paraffinic kerosene with aromatics via Fischer-Tropsch with 50% of blending
with fossil kerosene.
Alcohol-to-jet (ATJ) from isobutanol (certified in 2016) and ethanol (certified in 2018).
ATJ could be blended with the fossil kerosene up to 50%.
According to the scenario results, 30% and 16% of total biofuel consumption is used for aviation
for respectively Road ZERO and Transport BIO. In Transport BIO, 95% of the aviation biofuel mix
is from ATF value chain. The biofuel mix in Road ZERO in aviation sector is quite different. The
main value chain is Fischer-Tropsch route (comprising 54%), followed by ATF (37%). In 2050 the
total amount of ATJ is 181 PJ and 729 PJ in respectively Road ZERO and Transport BIO. This
large differences can be attributed to the fact that the supply chain of non-wood based ligno-
cellulosic ethanol production is much more developed in Transport BIO. In Transport BIO the
uptake of perennial grasses and imported agricultural residues already starts to develop in 2030.
In Road ZERO these chains start to develop between 2040-2045, which is too late to realize
large volumes in 2050.
Figure 17. Role of biofuels in road, shipping and aviation
3.3.2. Marginal system costs of biofuel technologies
In this section the marginal system costs of biofuels are presented. The marginal system cost
refers to the most expensive biofuel value chain that is needed to meet the demand. Biofuel
value chain, here, covers not only the biofuel production cost but also the costs related to the
end use, such as vehicle adaptation costs. These figures should not be confused with the aver-
age production cost of biofuels. They can better be interpreted as the possible market prices of
biofuels. The main factors that determine the marginal system costs are fuel substitution op-
tions, fuel availability14, vehicle adaptation cost and whether or not a fuel production process
has multiple outputs.
14 In case a fuel supply is at its limits, due to growth restrictions, an alternative, potentially expensive
fuel, needs to be used.

34
Figure 18 and Figure 19 present the marginal system costs of different biofuel technologies.
Marginal costs of all advanced biofuel technologies are lower in Road ZERO than in Transport
BIO scenario. This is because there is a much larger demand for advanced biofuels in Transport
BIO scenario than in Road ZERO. In 2030, Bio-DME, which is projected to be used in HDVs, has
the highest marginal cost. This relatively high marginal cost relates to the additional vehicle
adaptation cost assumed in this study. While the average production cost of other advanced
biofuel pathways like the Fischer-Tropsch routes , alcohol-to-fuel (ATF) value chain, or the HTL
routes will have higher production costs their marginal system cost appear lower.
In 2050, with the increased demand for advanced biofuels, the marginal costs of almost all
advanced biofuel technologies are increased in both scenarios (compared to 2030). The largest
increase occurs in Fischer-Tropsch and ATF routes in both scenarios.
The marginal cost of fuels from processes with multiple fuel outputs, might be different. For
example ATF process produces three types of biofuels: alcohol-to-gasoline (ATG), alcohol-to-
jet (ATJ) and alcohol-to-diesel (ATD). The demand for gasoline substitution is low, since the
model prefers EV’s. Therefore, the marginal cost of ATG is low (as low as the 1st generation
bioethanol cost). Another example is the price comparison between FT-Diesel, HTL-Diesel and
pyrolysis diesel in 2050. As they serve the same market their marginal cost/price appears the
same while the production cost of the technologies will be different.
Figure 18. Marginal costs of different biofuels in 2030 according to Transport BIO and Road ZERO (low end of the figures represent Road ZERO and high end transport BIO)
ATG: alcohol-to-gasoline; ATD: alcohol-to-diesel; ATJ: alcohol-to-jet; HVO(UCO); hydrotreated used
cooking oil; HEFA: hydroprocessed esters and fatty acids from used cooking oil
*fossil fuel prices are based on the crude oil price range of 30-50 €/MWh

35
Figure 19. Marginal costs of different biofuels in 2050 according to Transport BIO and Road ZERO (low end of the figures represent Road ZERO and high end transport BIO
* fossil fuel prices are based on the crude oil price range of 30-50 €/MWh
ATG: alcohol-to-gasoline; ATD: alcohol-to-diesel; ATJ: alcohol-to-jet; HVO(UCO): hydrotreated used
cooking oil; HEFA: hydroprocessed esters and fatty acids from used cooking oil; HTLD: hydrothermal
liquefaction diesel; HTLG: hydrothermal liquefaction gasoline; HTLG: hydrothermal liquefaction jet
fuel
3.4. Primary biomass use Figure 20 illustrates the amount of the primary biomass feedstocks deployed to meet the de-
mand from different sectors. This figure also presents the breakdown between domestic versus
imported feedstocks and biofuels for the two scenarios and Figure 21 shows the share of do-
mestic biomass utilised to meet the demand from different sectors in comparison to the po-
tential. Both scenarios project a low share of imports. In Transport BIO the imports relate to
wood and agricultural residue based pellets (69% of the total import) followed by lignocellulosic
ethanol import (24%). In 2050, the lignocellulosic ethanol import is projected to be around 303
PJ. In Road ZERO pellets comprise only 21% of the total import (on energy basis). The majority
of the import relates to import of biofuels, followed by import of UCO in this scenario.
What is remarkable in Transport BIO scenario is that more than 80% of most feedstock catego-
ries are exploited to reach the above mentioned figures (see Figure 21). Even dedicated energy
crops that are relatively expensive compared to other feedstocks appear to be utilised in very
large amounts in this scenario. It is necessary to highlight that the primary biomass utilisation
relates not only to biofuel production but also to other bioenergy sectors including electricity,
heat and biobased products for the chemical industry. In road ZERO, use of forestry biomass is
also high. Other feedstocks such as dedicated energy crops, agricultural residues and landscape
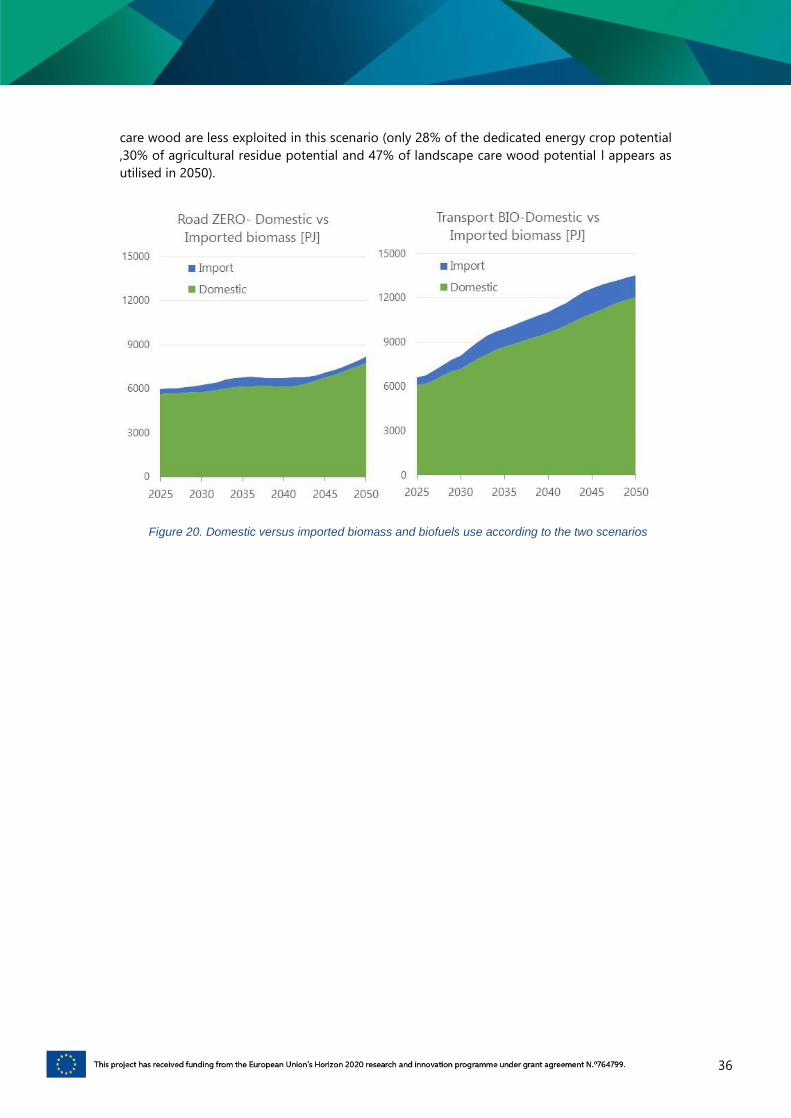
36
care wood are less exploited in this scenario (only 28% of the dedicated energy crop potential
,30% of agricultural residue potential and 47% of landscape care wood potential l appears as
utilised in 2050).
Figure 20. Domestic versus imported biomass and biofuels use according to the two scenarios

37
Figure 21. Share of domestic biomass use in comparison to the technical biomass supply potential in Europe

38
4. ‘What if’ cases and the
sensitivities
In addition to the main scenarios a number of what if cases and sensitivity runs are conducted
to further analyse the certain aspects of the scenario set up and the results presented in the
previous chapter.
4.1. What if biomass demand from power
sector is reduced In this study, in addition to transport sector, heat and power sectors and also the chemical industry are included to illustrate the possible competition among different sectors for the biomass resources. The bioenergy demand values for heat and power sectors are derived from the PRIMES(2018) scenarios. Lignocellulosic biomass demand for chemical industry to pro-duce biobased products is based on the S2Biom assessment, “D7.2 Market analysis for ligno-cellulosic biomass as feedstock for bioenergy, biobased chemicals & materials in Europe” 15. Among the three sectors, especially the power sector has many alternative renewable energy supply options. The supply of bio-electricity will depend on the technology developments and the cost reduction potential of other renewable energy resources. In this case we looked into “What if the demand for biomass derived electricity is less (10% of the reference) by 2050 due to further developments and cost reductions in other technologies?” and assessed the possible implications to advanced biofuel generation for transport sector.
This what if case is implemented for the Transport BIO scenario, as this scenario faces the bio-
mass resource limitations. In Transport BIO around 85% of the total biomass supply potential is
consumed and the remaining resources relate mainly to conventional feedstocks (i.e. what,
maize rapeseed) and also agricultural residues (65% of the total is used). Thus, advanced biofuel
generation, in this scenario, is mainly limited by the resource availability. The what if case shows
that a 10% reduction in bio-electricity demand directly effects the amount of advanced biofuels
for transport sector. Advanced biofuels increase by 7,6%. Figure 22 presents the contribution
of biofuels to different transport sectors. As can be seen, a possible increase in biomass poten-
tial, in this case, by reducing the demand in another sector, leads to increased use of advanced
biofuels manly in road and rail transport and a relatively smaller amount in maritime sector.
These additional biofuel production reduces the need for e-fuels and H2. No change is observed
in aviation sector.
15The 2030 figures are doubled for 2050.

39
4.2. What if the supply potential is lower The total domestic biomass potential implemented in the scenario modelling was around
14600 PJ in 2030 and 14300 PJ in 2050. This supply potential was defined in accordance with
the sustainability criteria introduced in the renewable energy directive. The FP7 S2Biom study
has looked into the different value chains and implemented stricter sustainability criteria, par-
ticularly for the forestry feedstocks, in some of their user cases (see Annex I for the list of cri-
teria). These criteria resulted in lower feedstock potentials. According to the S2Biom study
(with strict sustainability criteria) forestry feedstocks are assumed to be around 35% lower
than the feedstock supply potential used in the main scenarios. A comparison of the two dif-
ferent supply potentials are introduced in Figure 23. In this what if case, we look into the im-
plications of lower biomass supply.
Figure 23. Comparison of the feedstock input data
Figure 22. Contribution of biofuels to transport sub-sectors in 2050
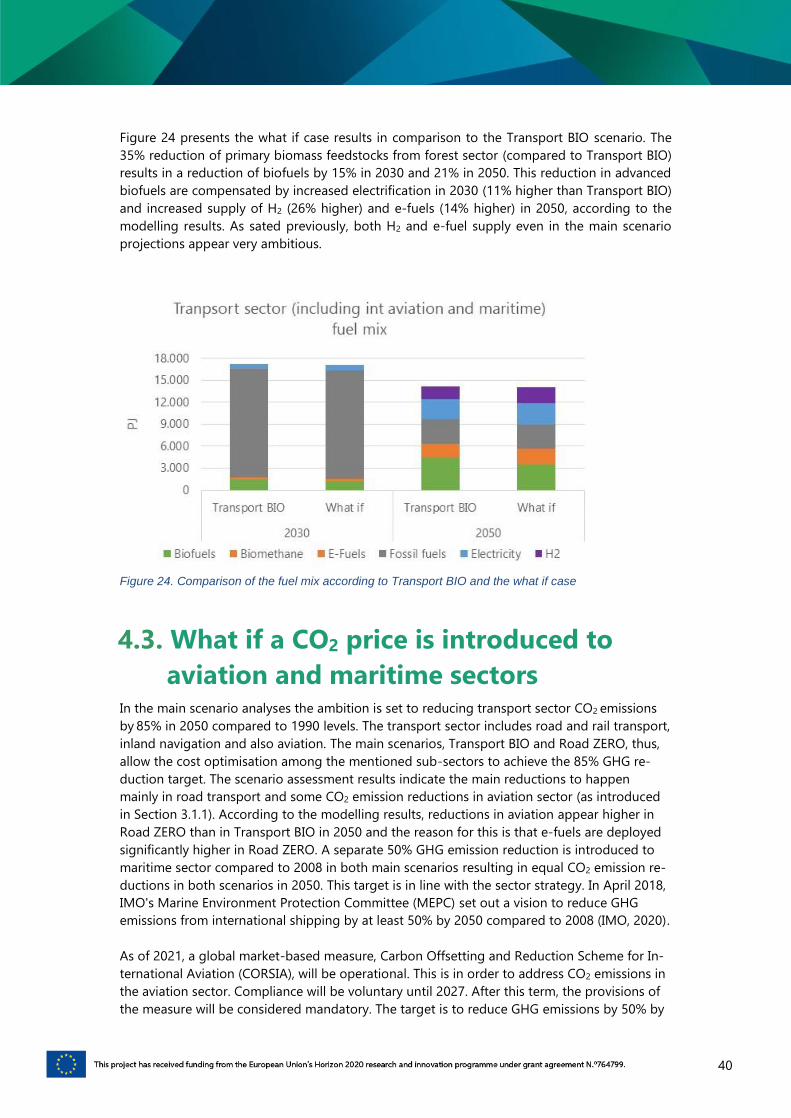
40
Figure 24 presents the what if case results in comparison to the Transport BIO scenario. The
35% reduction of primary biomass feedstocks from forest sector (compared to Transport BIO)
results in a reduction of biofuels by 15% in 2030 and 21% in 2050. This reduction in advanced
biofuels are compensated by increased electrification in 2030 (11% higher than Transport BIO)
and increased supply of H2 (26% higher) and e-fuels (14% higher) in 2050, according to the
modelling results. As sated previously, both H2 and e-fuel supply even in the main scenario
projections appear very ambitious.
Figure 24. Comparison of the fuel mix according to Transport BIO and the what if case
4.3. What if a CO2 price is introduced to
aviation and maritime sectors In the main scenario analyses the ambition is set to reducing transport sector CO2 emissions
by 85% in 2050 compared to 1990 levels. The transport sector includes road and rail transport,
inland navigation and also aviation. The main scenarios, Transport BIO and Road ZERO, thus,
allow the cost optimisation among the mentioned sub-sectors to achieve the 85% GHG re-
duction target. The scenario assessment results indicate the main reductions to happen
mainly in road transport and some CO2 emission reductions in aviation sector (as introduced
in Section 3.1.1). According to the modelling results, reductions in aviation appear higher in
Road ZERO than in Transport BIO in 2050 and the reason for this is that e-fuels are deployed
significantly higher in Road ZERO. A separate 50% GHG emission reduction is introduced to
maritime sector compared to 2008 in both main scenarios resulting in equal CO2 emission re-
ductions in both scenarios in 2050. This target is in line with the sector strategy. In April 2018,
IMO's Marine Environment Protection Committee (MEPC) set out a vision to reduce GHG
emissions from international shipping by at least 50% by 2050 compared to 2008 (IMO, 2020).
As of 2021, a global market-based measure, Carbon Offsetting and Reduction Scheme for In-
ternational Aviation (CORSIA), will be operational. This is in order to address CO2 emissions in
the aviation sector. Compliance will be voluntary until 2027. After this term, the provisions of
the measure will be considered mandatory. The target is to reduce GHG emissions by 50% by

41
2050, as compared to 2005. The future carbon price facing the CORSIA will depend on the de-
mand for and supply of GHG emission units. ICAO Council's Committee on Aviation Environ-
mental Protection (CAEP) has assumed the carbon price of 15$/t as low and 33 $/t as high by
2030 in their analysis regarding the possible costs of a global market-based measure (MBM16)
(CAEP, 2016). The GHG emissions from intra-EU aviation are already included in the EU ETS
with certain exceptions. International extra- EU flights are, however, exempted until December
2023, when their inclusion will be reviewed on the basis of the progress with implementation
of CORSIA (E4Tech, 2019).
Within this what if case both aviation and maritime sectors are treated separately. It is as-
sumed that the 85% CO2 reduction is applied to road and rail transport and a CO2 price is in-
troduced to aviation and shipping. The CO2 price is assumed to be 30 €/tonne in 2030 in-
creasing to 60 €/tonne in 2050. It is necessary to highlight that other measures than renewa-
ble fuels can also be implemented to reduce the CO2 emissions. In this modelling exercise,
however, the CO2 price is applied to renewable fuels only.
Figure 25 presents the comparison between the main scenarios and the what if cases. The figure
also includes sector ambitions. As can be seen none of the sectors would achieve their ambi-
tions with a price of 60 €/tonne by 2050. This amount appears insufficient to deploy sufficient
amounts of renewable fuels in these sectors. In fact, the CO2 emissions continue to grow.
Figure 25. Comparison of maritime and aviation CO2 emissions between Transport BIO and Transport BIO with CO2 prices to aviation and marine sectors
Figure 26 and Figure 27 present the renewable fuel mix in aviation and maritime sectors in 2050
according to the modelling results. Biofuel consumption is significantly lower in both what if
cases when compared with the main scenarios. Biofuel deployment in maritime sector is re-
duced by 80% in the Transport BIO what if case and more than 65% in the Road ZERO what if
16 A market-based measure (MBM) is a policy tool that is designed to achieve environmental goals at a lower cost and
in a more flexible manner than traditional regulatory measures. Examples of MBMs include levies, emissions trading
systems, and carbon offsetting.

42
case. In aviation, biofuel supply is reduced by around 79% and 30%, in Transport BIO and Road
ZERO what if cases, respectively.
The e-fuels appear only in the Road ZERO what if case for aviation, but also much lower when
compared with the main scenario (~90% reduction).
In conclusion, while a CO2 price of 60 €/ton enables some biofuel deployment in aviation and
maritime sectors the amounts are very low. This price does not enable any e-fuels to maritime
sector in both scenarios. A low electricity price combined with the price in Road ZERO scenario
indicates around 100 PJ e-fuels for the aviation sector.
Figure 26. Renewable fuel mix in EU international aviation sector in 2050
Figure 27. Renewable fuel mix in EU international maritime sector in 2050

43
4.4. What if advanced technologies become
commercial 5 years earlier Most of the advanced biofuel technologies are currently not commercial and the exact timing
of their market introduction in large quantities is uncertain. Commercial availability, here, refers
to the nth pant, which is assumed to be a mature technology. An early market introduction of
technologies will mean that the expected CAPEX and OPEX related cost reductions will also
occur much earlier. In the main scenario analysis Bio-DME and biomethanol, via gasification are
assumed to be mature technologies by 2025. Bio-FT synthesis process is considered to mature
after 3 years, thus in 2028. Standalone pyrolysis oil upgrading is assumed to take much longer
time and considered as a mature technology by 2040. These introduction years are based on
the expert judgments and prone to many uncertainties. In this case market introduction of these
thermochemical routes are considered to happen 5 years in advance compared to the main
scenario runs to assess the effect of introduction years.
The results show that early introduction of thermochemical conversion routes does not change
the overall biofuel deployment in Transport BIO. This is because the biofuel deployment is al-
ready very high in this scenarios. In Road ZERO, deployment of biofuels are slightly increased
due to early introduction of thermochemical pathways. The increase is around 5% compared to
the main scenario run in 2050.
The main impact of early introduction of these routes relates to the composition of the biofuels
and their role in different transport segments. In the Transport BIO what if case the bio-FT route
starts growing at the expense of bio-DME. By 2040 the absolute amount of the two value chains
appear equal in this scenario. After 2040, biomass potential becomes a limiting factor. Con-
fronted with an inefficient use of limited biomass, the model prefers a more efficient conver-
sions route after 2040, which appears to be the HTL route. HTL has a higher energetic efficiency
with larger fraction of biofuels when compared with the bio-FT route. In case of bio-FT 3,1 PJ
of biomass is used to produce 1 PJ of fuel. Bio-FT process has a large fraction of naphtha and
the model treats this as a by-product. In case of HTL 1,8 PJ of biomass is needed to produce 1
PJ of fuel. In Road ZERO, the largest increase occurs in pyrolysis oil related value chains, fol-
lowed by Bio-FT route. It is necessary to highlight that the bio-crude production of HTL oils is
currently at TRL 5-6 with small scale demonstration activities ongoing. Dedicated upgrading to
jet fuel is at lab-scale. Thus, the future role of HTL based on this modelling study needs to be
treated with cautious.

44
Figure 28. Presentation of relative changes in certain technologies (change >25% included in the graphs)
4.5. Sensitivities
4.5.1. S1. Fossil fuel prices
The model aims to provide the most optimal value chains to achieve the CO2 emission reduction
target. To do that, it looks at the financial gap between the renewable fuel supply option and
the fossil fuel reference, including the necessary adaptation and extra distribution costs. That is
why the fossil fuel prices play an important role. The higher the fossil reference fuel prices are
(diesel, gasoline, MDO, HFO and kerosene) the lower the financial gap between advanced bio-
fuels and the fossil references will be. In this sensitivity analysis the fossil fuel prices are +/- 50%
changed. The main scenario analysis has used the PRIMES(2016) fossil fuel price projections.
Figure 29 and Figure 30 illustrate the results of the sensitivity runs for Road ZERO and Transport
BIO. A 50% increase in fossil fuel prices result in 46% increase in biofuel consumption (including
biomethane) by 2050 in Road ZERO. In this sensitivity both e-fuels and H2 consumptions are
reduced. When the fossil fuel prices are reduced by 50% the impact on the total biofuel con-
sumption is feasible in 2030; biofuel consumption is reduced by 46%, resulting in slightly higher
use of fossil fuels and increased CO2 emissions in road transport. The effect of low prices in
2050 is ignorable as the increased price gap between fossil fuels and biofuels does not any
more change the already very low level of biofuel supply in this scenario.
In Transport BIO, the impact of price change appears to be very limited. Total biofuels increase
only 0,9% by 2050 when higher fossil fuel prices (50% higher) are implemented. This is mainly
due to the fact that the biomass resources are used to a large extent in this scenario and the
remaining feedstock technology combination is much more expensive than the other renewa-
ble options.

45
Figure 29. Fossil fuel price impacts to biofuel projections for Road ZERO
Figure 30. Impacts of fossil fuel prices to biofuel deployment for Transport BIO
4.5.2. S2. Cap on UCO
In REDII use of biofuels produced from animal fat and used cooking oil (UCO) are capped to
1,7% of the final energy use of road and rail transport to avoid possible unintended sustaina-
bility impacts. This pathway, however, is the only commercial advanced liquid biofuel produc-
tion pathway at present. In this sensitivity, we look at what if this cap is released after 2030.
Figure 31 illustrates the results of the animal fat and UCO based biofuel consumption accord-
ing to different scenarios. When the 1,7% cap is released consumption of these biofuels in-
crease by 87% in transport BIO and 116% in road ZERO. Thus, in absolute terms the increase
in biofuels produced from animal fats and UCO is high in both scenarios. These biofuels con-
stitute around 3% and 4% of the total fuels consumed in road and rail transport in 2050 for
Transport BIO and Road ZERO, respectively. These figures correspond to full utilisation of sus-
tainable supply potential (both domestic and import). However, the results show that the total
biofuel consumption increases only by 0.9% in 2050 when compared with the main scenario

46
run in Transport BIO. Releasing this cap results in an increase of total biofuels by around 8% in
2050 (from 1644 PJ to 1774 PJ) in Road ZERO.
Figure 31. Consumption of biofuels based on animal fat and UCO according to different scenarios
4.5.3. S3. Electricity price assumptions
In scenario analyses availability of renewable electricity is reflected using different electricity
prices. In Road ZERO, the assumption was that there would be abandoned amount of renewa-
ble electricity and the market price of electricity was assumed as 45€/MWh in 2030 reducing
to 40 €/MWh in 2050. In Transport BIO, the price of renewable electricity was assumed to be
65 €/MWh in 2030 and reduced to 60€/MWh in 2050. Both scenarios are re-run with an elec-
tricity price of 55€/MWh in 2030 reducing to 50€/MWh in 2050 to analyse the impacts of
electricity prices to the future deployment of renewable fuels and specifically to biofuels. The
results are compared with the respective main scenario results. So, a 30% electricity price re-
duction is implemented for Transport BIO scenario and a 30% price increase to Road ZERO.
Not surprisingly, the supply options that are mainly effected are electrification of road
transport and supply of PtX and H2. A 30% price reduction in Transport BIO resulted in around
60% higher e-fuel utilisation and around 35% reduction in H2 use. Apparently, power-to-liquid
options that can be used in the existing vehicle fleet is preferred over H2 that is accompanied
with the relatively high fuel cell vehicle costs
In Road ZERO, the electricity price increase results in significantly higher utilisation of H2. The
amount of H2 is more or less tripled in this scenario. Also the total amount of biofuels has in-
creased by 11% (replacing H2 in HDVs). E-fuels are significantly reduced in this scenario,
mainly in aviation and road transport.

47
Figure 32. Impact of electricity price to the fuel mix
4.5.4. S4. PtX introduction year
The market introduction year of advanced technologies play a critical role in their future diffu-
sion rates and unfortunately their introduction year is very uncertain. In the main scenario anal-
ysis PtX technology is assumed to be commercially available in the market by 2030. In this case
the effects of possible delays to this technology is analysed. Compared to the main scenarios
in this variant a 5 years delay, thus, introduction of PtX in 2035, is modelled.
According to the modelling results, a 5 year delay in PtX introduction year does not affect the
technology deployment rate. This is because even when the technology becomes commercial
and enters the market by 2030 it appears beyond 2035 in Road ZERO and the significant cost
reductions occur beyond 2040. In transport BIO PtX appears in the model after 2032 even
though the electricity prices are assumed to be higher than Road ZERO. This relates to biofuels
being deployed in large amounts. Delaying the introduction of PtX with 5 years requires PtX to
enter the market with a production capacity of above 200 PJ and grow linearly thereafter. The
impact of this 5 year delay to biofuel deployment is ignorable as it is very small. It is, however,
extremely important to mention that such an exponential growth in e-fuels is not very realistic.
Figure 33 illustrate the modelling results.

48
Figure 33. Deployment of e-fuels according to different scenarios

49
5. Conclusions, discussions
and recommendations
5.1. Conclusions This study looks into the possible future role of advanced biofuels and analyses the interactions
with other renewable energy supply options through scenario analysis. The analysis takes into
account the sustainable supply of biomass feedstocks, both within the EU and imports from
outside the EU. It includes the future cost reduction potential of advanced renewable fuel con-
version technologies. The conclusions of the scenario modelling are as follows.
the optimal renewable fuel mix to meet the GHG emission reduction targets
The optimal renewable fuel mix depends on the scenario construction. In this study, two main
factors – technology development and the availability of renewable power – have set the sce-
nario framework. The overall conclusion from the scenario assessment is that all of the renew-
able options need to be deployed to meet the CO2 emission reduction targets, which can serve
to contribute to meeting the Paris Agreement goals. The intended targets are 85% tank-to-
wheel CO2 emissions reduction in road and rail transport, and 50% CO2 emissions reduction in
maritime and aviation sectors. These targets appear to be very challenging and requires not
only all renewable options to be deployed but also increasing efficiency and reducing energy
demand. Thus, unless the total fuel demand from the transport sector is reduced and energy
efficiency measures are implemented, the CO2 reduction ambitions, particularly for maritime
and aviation sectors are not met.
While the main difference between the two scenarios, Road ZERO and Transport BIO, relates to
electrification of road transport both scenarios require significantly high shares of EVs. Close to
70% of the road transport fuel mix is projected to be electrified in 2050 according to the sce-
nario Road ZERO. Electrification comprises more than 30% of road transport fuel mix in
Transport BIO scenario in 2050.
According to the modelling results, H2 and e-fuels appear beyond 2035 and they contribute to
the fuel mix of HDVs, maritime and aviation sectors, meeting around 23% and 24% of the fuel
mix in transport sector (including int aviation and maritime) in 2050 according to Transport BIO
and Road ZERO, respectively. In this scenario assessment both H2 and e-fuel demand are pro-
jected to be quite high. Nevertheless, these fuels will be needed together with advanced biofu-
els if very ambitious GHG emission reductions are to be achieved.
The two scenarios indicate the main pressure points. In Road ZERO, the power sector will face
the renewable electricity demand for transport sector that is significantly high. Satisfying this
demand in addition to other sectors, such as electrification of heat demand, will be extremely
challenging if not impossible. In Transport BIO, the supply of sustainable biomass resources and
the possible competition with power and heat sectors and also biobased products will be very
difficult to meet.

50
the order of the magnitude ambition of advanced biofuels to comply with the Paris
agreement and the supply of sustainable biomass
According to the modelling results, biofuels are expected to play a significant role in reducing
GHG emissions in the transport sector. The role of biofuels in the future will largely depend on
the timely deployment of ZEVs. But even if the vehicle fleet consist of a significant amount of
ZEVs, still large quantities of biofuels are needed. This study projects the minimum and maxi-
mum range for biofuels as around 700 PJ and 1700 PJ in 2030. This increases to around 1650
PJ and 4680 PJ in 2050, for Road ZERO and Transport BIO, respectively. When compared to
current production levels these numbers indicate a significant increase. Thus, even the low bio-
fuel supply in Road ZERO will require an increase of 165% compared to 2017. For Transport
BIO, the needed increase will be around 700% in 2050. More than 70% of biofuels consist of
advanced biofuels produced from lignocellulosic feedstocks in both scenarios and it will be very
challenging to install all these plants.
The maximum biofuel range is constraint by the sustainable biomass potential and the bio-
mass demand from other sectors (heat, power, biobased industry). Thus, mobilising the sus-
tainable biomass potentials will become extremely important, so will the role of new sources
of lignocellulosic biomass, including dedicated energy crops, grown on marginal lands. What
is remarkable in Transport BIO scenario is that more than 80% of the feedstock categories are
projected to be utilised. Even dedicated energy crops that are relatively more expensive than
other feedstocks appear to be utilised in very large amounts in this scenario. Dedicated en-
ergy crops are, however, currently cultivated on very small scale. Major efforts and time will be
needed to develop these at the volumes needed to produce advanced biofuels cost-effec-
tively at commercial scale (farmers experience, infrastructure, etc). It is necessary to highlight
that the primary biomass utilisation relates not only to biofuel production but also to electric-
ity, heat and biobased products for the chemical industry.
effect of policies (targets and CO2 prices) to the deployment of renewable fuels and the
main issues in aviation and maritime
Renewable fuels have been mainly supported though quota obligations. In this study, a CO2
reduction target is introduced. Next to that, effects of a CO2 price to aviation and maritime
sectors have been looked into. According to these results, achieving emission reduction targets
in road and rail transport will require a mutual growth of advanced biofuels and electrification.
However, neither the obligation nor a CO2 price of 60 €/t appears to mobilise enough amounts
of renewable fuels for aviation and maritime. One of the reasons relate to the large amounts of
renewable fuel demand from road transport. In case of Transport BIO, advanced biofuels are
first supplied to road transport as the price gap between advanced biofuels and gasoline &
diesel are lower than the financial gap in other transport segments. The second reason is that
the biorefineries produce a mixture of jet fuels, gasoline, diesel and light ends. Even if a large
number of refineries are installed the amount of jet fuels is not likely to meet the demand unless
jet fuel production is significantly increased. Next to that, they produce a large amount of other
fuels, including gasoline. In the event of significant electrification these biofuels cannot find
market outlets. Additionally, the market introduction of bio jet fuel value chains and the needed
time frame for them to grow appears challanging.

51
5.2. Discussions In this study, a scenario analysis is conducted using the RESolve-Biomass model. These scenar-
ios do not aim to predict or forecast the most likely futures but to articulate different pathways
to achieve a desired or set goal. The scenario modelling aims to provide useful information
about the potential risks and benefits of different pathways. It provides useful insights about
the relationships between the key drivers. However, the functioning of the modelling exercise
and its main limitations, and the main assumptions behind the scenarios need to be well un-
derstood.
Modelling transport sector
This study uses a cost optimisation model, in which road transport modelling includes the com-
petition of different types of vehicles meeting different service demands in the transport sector.
For this segment the efficiency improvements in vehicle fleet and possible shifts among differ-
ent modes can be captured. However, the model does not capture the complete vehicle fleet
of the EU28. Instead, a limited number of representative vehicle technologies are introduced
into the model. The technology competition within the transport sector is modelled on the basis
of techno-economics, e.g. cost reductions derived from technology development. In reality,
user’s choice on vehicles and modes of transportation is also subject to social preferences, non-
technology related costs, such as taxes, and demand-side policies. Further research on those
aspects should be performed next to better reflect the road transport sector.
Different than the road transport, the cost optimisation in maritime and aviation sectors relates
mainly to the least cost supply of renewable fuels. This is particularly important for the maritime
sector. The ship fleet and related techno-economic data are not included in the model. Instead,
the different fuel segments, such as HFO, MFO, LNG and LSHFO are exogenously introduced
(using PRIMES projections) and the model determines the least cost distribution of different
renewable fuel options among these segments. Thus, it cannot capture possible future devel-
opments on ships and infrastructure. The developments are limited to what PRIMES scenario
has projected. One example relates to the use of methanol in shipping. Since methanol use in
ships has not been included in PRIMES this study did not project any biomethanol use, which
may substitute conventional methanol. Another example is the possibility to use H2 in shipping.
The modelling results favour bio-DME use in heavy duty vehicles according to Transport BIO
scenario. Bio-DME combustion in heavy duty diesel engines is assumed to require some adap-
tations to the existing vehicle fleet , which is not very CAPEX intensive. Next to that, other pos-
sible biofuel supply options like HVO or FAME are limited due to the introduced caps and the
sustainability concerns around feedstocks such a palm and soy oil. This makes the supply of
bio-DME produced from lignocellulosic feedstocks as the preferred, least cost supply option.
However, there are no standards on DME nor large implementation of DME trucks at present.
H2 use in HDVs is a comparable example. According to the scenario analysis H2 appears as one
of the renewable fuel options for HDVs. This has to do with either the slow progress in biodiesel
production (in Road ZERO) or reaching the limits of the sustainable biomass supply (in
Transport BIO). However, one of the main challenges with hydrogen is its transportation and
storage. Another challenge is the range. The range of fuel cell trucks may become an issue,
depending on the load and the terrain. There will be a need for significant infrastructure devel-
opment, to ensure the availability of fuels in various locations. Moreover, there are safety related
concerns as H2 is very combustible and it disperses very rapidly upwards into the air. While the
modelling assessment tried to capture some of the cost elements, such as high CAPEX and

52
OPEX of fuel cell electric vehicles and infrastructure costs it is not possible to capture such
challenges in full scope.
Technology development and technology diffusion
In this modelling framework, certain restrictions are introduced to future diffusion of advanced
biofuel technologies. Thus, they have a limited growth from one year to another. Next to that
competition for biomass among different sectors has been part of this study. There will also be
other sectors like chemical industry, power and heat sectors requiring PtX technologies (includ-
ing H2). In such a competition the availability and use of these fuels in transport may appear
differently.
Sustainable biomass supply and future demand
Sustainable supply potential of biomass resources has been a discussion point and a research
topic for a very long time. This study considers the total potential to be 14000 PJ and within
one of the what if cases 12000 PJ, According to the Transport BIO scenario the total amount of
supply potential particularly the forestry and perennial crops may become a limiting factor. One
of the deliverables “D2.1 Lignocellulosic feedstock availability, market status and sustainability”
highlights the wide range of biomass supply potential for the EU, between 8000 PJ to 25000PJ
in 2050, according to a number of studies. Within this wide range the contribution of dedicated
energy crops and the forestry biomass potential play the major role. Give that the supply po-
tential can become a limiting factor demand from other sectors and the competition can be-
come an important aspect in the future.
Translation of GHG emission reduction target to the model and projections of further energy
efficiency improvements
A GHG emission reduction target can be achieve, next to renewable fuels, with other
measures, such as efficiency improvements, improved traffic management, more use of bus-
ses, carpooling, etc. In this modelling such options are not covered. According to the model
GHG emissions are reduced by BEVs and replacing fossil fuels with renewable fuels.
5.3. Recommendations There is no silver bullet; a balanced set of options (and development of new conversion
routes) will be needed to meet GHG emission reduction targets in transport (next to effi-
ciency improvements and demand side management) to avoid pressure on feedstock
markets, and also electricity and power sectors.
One of the options to reduce the pressure on the lignocellulosic feedstock markets is the
development of energy crops grown on marginal land, which requires major (policy) ef-
forts, including the development of infrastructure, farmers experience, regulatory compli-
ance and support, as they are more expensive compared to other supply options.
Another option is that policies could prioritise biomass supply to the transport sector at
the expense of other sectors that have good alternatives (e.g. electricity generation). Such
a prioritisation could reduce the future electricity demand to produce transport fuels.
The policy measures to be implemented need to be strong enough to ensure that signifi-
cant amounts of RESfuels and ZEVs are deployed. These need to go hand in hand with the
energy efficiency improvements.
Enabling renewable fuels to aviation requires dedicated support to increase jet fuel pro-
duction in biorefineries that produce a mixture of fuels. Otherwise multi-product technol-
ogies may not be sufficient to meet the demand from this sector.

53
A combination of policies, such as quota obligation combined with feed-in premium, are
needed to provide secure and reliable market conditions, particularly for aviation and also
maritime sector.

54
References
Biomass Policies (2016). Outlook of spatial biomass value chains in EU28. Deliverable 2.3 of
the Biomass Policies project. Berien Elbersen, Igor Staritsky, Geerten Hengeveld, Leonne
Jeurissen, Jan-Peter Lesschen & Caliope Panoutsou
Biotrade2020(2016). See https://www.biotrade2020plus.eu/publications-reports.html
Boehman (2019). Prof. Boehman provides insight into the practical benefits of DME’s use as
an automotive fuel,See https://www.aboutdme.org/?bid=577
CAEP(2016) See https://www.icao.int/Meetings/HLM-
MBM/Documents/EAG15_CAEP%20Technical%20Analyses.pdf
D2.1 Lignocellulosic feedstock availability, market status and sustainability. Hoefnagels. R. &
Germer, S. ADVANCEFUEL, 2018. See v http://www.advancefuel.eu/contents/reports/d21-re-
port-on-lignocellulosic-feedstock-availability.pdf
D2.2 Innovative crop rotation schemes. Germer, S.; Sailer, K.; Grundmann, P.; Kern. J.
ADVANCEFUEL, 2019. See http://www.advancefuel.eu/contents/reports/d22-innovativecropro-
tationschemes.pdf
D3.5 First data on efficient, low-risk ramp-up of liquid biomass conversion technologies - from
short time to long term. ADVANCEFUEL, 2029. Karka, P.; Papadokonstantakis, S.; Johnsson. F.
See http://www.advancefuel.eu/contents/reports/d35-liquid-biofuel-conversion-technol-
ogy.pdf
de Jong, S., van Stralen, J., Londo, M., Hoefnagels, R., Faaij, A., and M. Junginger (2017) The
role of renewable jet fuel in the European Union in the context of a developing bio-economy
EAFO, 2020. See https://www.eafo.eu/alternative-fuels/advanced-biofuels/BioDME
EC (2011). European Commission’s 2011 transport white paper. Roadmap to a Single Euro-
pean Transport Area – Towards a competitive and resource efficient transport system. See
https://eur-lex.europa.eu/legal-content/EN/TXT/PDF/?uri=CELEX:52011DC0144&from=EN
EC (2018). In-depth analysis in support on the COM(2018) 773: A Clean Planet for all - A Euro-
pean strategic long-term vision for a prosperous, modern, competitive and climate neutral
economy. See https://ec.europa.eu/knowledge4policy/publication/depth-analysis-support-
com2018-773-clean-planet-all-european-strategic-long-term-vision_en
EC (2019). Eurostat Database. Available at: https://ec.europa.eu/eurostat/home? . Access: Sep-
tember 2019.
EEA, 2019. Greenhouse gas emissions from transport in Europe. See https://www.eea.eu-
ropa.eu/data-and-maps/indicators/transport-emissions-of-greenhouse-gases/transport-emis-
sions-of-greenhouse-gases-12

55
EU Reference Scenario 2016 (REF2016). See https://ec.europa.eu/energy/data-analysis/en-
ergy-modelling/eu-reference-scenario-2016_en
E4Tech (2019). Study on the potential effectiveness of a renewable energy obligation for avia-
tion in the Netherlands
Gain, 2019. EU Biofuels Annual. See https://apps.fas.usda.gov/newgainapi/api/report/down-
loadreportbyfilename?filename=Biofuels%20Annual_The%20Hague_EU-28_7-15-2019.pdf
ICAO (2016). Resolution A39-3: Consolidated statement of continuing ICAO policies and prac-
tices related to environmental protection – Global Market-based Measure (MBM) scheme.
IMO (2020). See https://unfccc.int/sites/default/files/re-
source/250_IMO%20submission_Talanoa%20Dialogue_April%202018.pdf. Last visited April
2020.
ODYSSEE-MURE (2019). ODYSSEE-MURE Database. Available at: https://www.odyssee-
mure.eu/. Access: September 2019.
S2BIOM (2017a). D1.6. A spatial database on sustainable biomass cost-supply of lignocellulo-
sic biomass in Europe – methods and data sources. Issue: 1.2. https://www.s2biom.eu /Publi-
cations/D1.6_S2Biom_Spatial_data_methods_data_sources_Final_Final.pdf
S2Biom (2017). D1.8.Atlas with regional cost supply biomass potentials for EU28, Western Bal-
kan Countries, Moldovia, Turkey and Ukraine. See http://s2biom.al-
terra.wur.nl/doc/S2Biom_D8_1_Oct_2015-revision.pdf
Spöttle, et al (2013). Low ILUC potentials of wastes and residues for biofuels – Straw, forestry
residues, UCO, corn cobs. Ecofys Netherlands B.V.
Also see https://www.jsae.or.jp/en/publications/yearbook_e/2018/docu/14_Engine_for_Alter-
native_Fuels.pdf

56
Annexes
Annex I. Sustainability criteria
implemented in S2Biom
Table 3. (RED) sustainability criteria for assessing land available for dedicated biomass crops (S2BIOM, 2017a)
Criteria Rules implemented to assess land availability, selection of
suitable crops
No loss of habitat of
high biodiversity value
Exclude Natura2000 areas & other protected areas
Exclude High Natura Value farmland
No use of areas of high
carbon stock lands
Exclude wetlands & peatland areas
Only use lands that have been registered as agricultural since
1990 which ensures exclusion of continues forest lands
Exclusion of permanent grasslands
Avoidance of direct land
cover change
Only use lands that have been registered as agriculture since
1990 and marginal and polluted lands. Exclude continues forest
lands, urban areas, recreation areas et.
Avoid conversion of permanent grasslands to arable
Avoidance of indirect
land use change
Use only surplus (agricultural) lands and marginal and polluted
lands
Avoid use of Natura2000 & HNV farmlands
Support agro-
biodiversity
Avoid Natura2000 & HNV farmlands
Avoid conversion of permeant grasslands to arable\no use of
fallow land if fallow land share (on total arable land) declines to
< 10%
Avoid monoculture choosing mix of at least 3 perennial crop per
region
Avoid negative impacts
on soil quality &
enhance soil quality
impacts
Maximum slope limits to perennial plantations
Use perennial plantations to protect soil susceptible to erosion
Use perennial plantations for bio-remediation of polluted soils
Avoid negative impacts
on water sources
Only use crops where minimal water requirement is delivered
through annual precipitation
No use of irrigation in perennial crops
Preference for water use efficient crops in drought prone regions
Avoid competition with
food
Only use surplus (agricultural) lands

57
Annex II. Transport sector characterization
In order to meet end-use demand of the road transport sector in passenger-kilometre and ton-
kilometres, different types of vehicles were considered for road private passenger transport,
road public passenger transport and freight transport. Table 4 below shows the main assump-
tions per vehicle, mostly based on data provided by PRIMES’ reference scenario (EC, 2018) and
cross-checked by transport experts within TNO. The cost data is provided in ranges as reported
by literature for novel technologies. In that context, different values were adopted in each of
the two scenarios Transport BIO and Road ZERO according to their storylines.
Table 4. Techno-Economic Characterization of Vehicles for Road Transport.
Vehicle - Fuel
Rang
e
(PJ/k
m) Investment Cost (Euro2018/vehicle)
Operational
Cost
(Euro2018/km
)
Private Passenger
Transport 2020 2030 2050
ICE Car - Gasoline 1.87 20,132 19,931 19,931 0.02
ICE Car - Diesel 1.44 23,575 22,992 22,992 0.02
ICE Car - CNG 2.06 22,019 22,019 22,019 0.02
PHEV Car - Gasoline 1.54 28,738 24,605 22,883 0.02
PHEV Car - Diesel 1.23 30,986 27,019 25,476 0.02
BEV Car - Electricity 0.54
24,478-
47,759
22,420-
30,084
21,490-
25,524 0.01
FC Car - Hydrogen 0.95 56,686 39,473 30,263 0.02
Public Passenger
Transport 2,020 2,030 2,050
ICE Bus - Diesel 12.59 287,812 287,812 287,812 0.05
ICE Bus - CNG 9.22 312,945 312,945 312,945 0.05
BEV Bus - Electricity
4.1-
4.9
436,424-
466,902
324,379-
349,453
299,187-
307,565 0.05
FC Bus - Hydrogen 8.3-9.8 624,517 405,589 329,744 0.05
Freight Transport 2,020 2,030 2,050
ICE LDV - Diesel 1-1.8 23,348 22,442 22,442 0.09
BEV LDV - Electricity 0.61
23,401-
48,786
20,542-
34,083
19,651-
26,950 0.06
FC LDV - Hydrogen 1.2 52,423 37,910 28,721 0.08
ICE HDV - Diesel 12.01 154,974 152,260 152,260 0.07
ICE HDV - Biodiesel 12.61 154,974 152,260 152,260 0.07
ICE HDV - CNG 16.81 198,373 192,023 192,023 0.07
BEV HDV - Electricity 5.94
301,224-
521,107
207,454-
400,481
173,434-
249,206 0.07
FC HDV - Hydrogen 8.03 493,217 308,329 207,074 0.07

58
Cost assumptions for all vehicles include neither taxes nor insurance costs and relate only to
costs of acquisition and operation. Because our analysis encompasses only technological
competitivity, those elements were kept out of the modelling framework.
Other relevant data used relates to capacity and activity data in the transport sector. Capacity
data relates to the stock (or fleet) of vehicles per type and activity data relates to mileage, e.g.,
average kilometres run per year per type of vehicle, and average occupancy in terms of pas-
sengers or tons. Statistics from 2010 and 2015 (when available) from EUROSTAT (EC, 2019)
and from the ODYSSEE-MURE database (ODYSSEE-MURE, 2019) per Member State were com-
bined so to fit in the vehicles’ categories defined in the model. As the fleet of vehicles is opti-
mized by the model for future years, average activity data per type of vehicle were kept con-
stant assuming no disruptive changes in behaviour as a simplification.

59
List of acronyms
ASTM American Society for Testing and Materials
ATF Alcohol to fuel
ATD Alcohol to diesel
ATG Alcohol to gasoline
ATJ Alcohol to jet fuel
BEV Battery electric vehicles
BioDME Bio dimethyl ether
Bio-FT Bio Fischer Tropsch
BtL Biomass-to-Liquid
ECA Emission control area
EED Energy efficiency directive
ETS European Trading Scheme
EV Electric vehicle
EU European Union
FP7 Framework programme 7
GHG Greenhouse gas
HDV Heavy duty vehicles
HEFA Hydrotreated Esters and Fatty Acids
H2 Hydrogen
HFO Heavy fuel oil
ICE Internal combustion engine
IEE Intelligent Energy Europe
IMO International maritime organisation
LSHFO Low-sulphur heavy fuel oil
MGO Marine gas oil
LNG Liquified natural gas
NUTS3 Nomenclature of Territorial Units for Statistics 3
RESfuels Renewable fuels from lignocellulosic feedstocks and other renewable fuels
from non-biological origin
REDII Recast renewable energy directive
SIP Renewable Synthesized Iso-Paraffinic
UCO Used cooking oil
ZEV Zero emission vehicle