1

2
Road Network Evaluation Tools (RONET)
Version 1.0
Rodrigo Archondo-Callao, The World BankOlav E. Ellevset, SSATP/The World Bank
2007 SSATP Annual MeetingOuagadougou, Burkina Faso
November 5-7, 2007

3
RONET• Developed by SSATP together with
expertise of the World Bank.• Helps decision makers:
– Monitor network condition– Plan allocation of resources– Assess consequences of macro policies
• Developed for the Africa region, but can be applied on any developing country worldwide

4
Structure and
Data Requirements
RONET Version 1.0

5
Current RONET Modules
• Current Condition Assessment: Calculates current road network statistics and monitoring indicators.
• Performance Assessment: Evaluates road network performance under different rehabilitation and maintenance standards (budget scenarios).

6
Road Network Length MatrixMatrix of Road Classes: Overall Network Evaluation
Network Surface TypeType Concrete Asphalt S.T. Gravel EarthPrimarySecondaryTertiaryUnclassifiedUrban
Traffic Condition CategoryCategory Very Good Good Fair Poor Very PoorTraffic ITraffic IITraffic IIITraffic IVTraffic V
Total 5 X 5 X 5 X 5 = 625 road classes

7
Road Network Evaluation Tools Version 1.0, 6/6/2007
Configuration Inputs Calculations Outputs
O-Length & UtilizationC-Basic Configuration I-Country Data Current Condition Assessment O-Asset Value
I-Road Network Length O-RoughnessO-Network Distribution ChartsO-Network Monitoring Indicators
Performance Assessment O-Network PerformanceC-Basic Configuration I-Country Data O-Road Works DistributionC-Standards Configuration I-Road Network Length O-Road Works Summary
I-Historical Data O-Historical Data Comparison
The World BankWashington, D.C.
PAM
RONET Inputs

8
Road Network Length
Country XYZ - 2007
Road Network Two-Lane Equivalent Length (km)
Primary PrimaryConcrete Asphalt
Condition (IRI) Very Good Good Fair Poor Very Poor Condition (IRI) Very Good Good Fair Poor Very PoorTraffic (AADT) 2 3 4 8 12 Total Traffic (AADT) 2 3 4.5 8 12 TotalTraffic I <300 0 Traffic I <300 0 0 0 0 0 0Traffic II 300-1000 0 Traffic II 300-1000 0 184 39 31 10 264Traffic III 1000-3000 0 Traffic III 1000-3000 370 341 61 22 0 794Traffic IV 3000-10000 0 Traffic IV 3000-10000 0 0 0 0 0 0Traffic V >10000 0 Traffic V >10000 2 97 16 2 0 117Total 0 0 0 0 0 0 Total 372 622 116 55 10 1,175
Secondary SecondaryConcrete Asphalt
Condition (IRI) Very Good Good Fair Poor Very Poor Condition (IRI) Very Good Good Fair Poor Very PoorTraffic (AADT) 2 3 4 8 12 Total Traffic (AADT) 2 3 4.5 8 12 TotalTraffic I <300 0 Traffic I <300 0 0 0 0 0 0Traffic II 300-1000 0 Traffic II 300-1000 0 41 32 17 0 90Traffic III 1000-3000 0 Traffic III 1000-3000 0 0 21 6 0 27Traffic IV 3000-10000 0 Traffic IV 3000-10000 0 0 0 0 0 0Traffic V >10000 0 Traffic V >10000 0 0 0 0 0 0Total 0 0 0 0 0 0 Total 0 41 53 23 0 117

9
Name and YearCountry Name Country XYZCurrent Year 2007
Basic CharacteristicsLand area (sq km) 121,000Total population (million persons) 5.000Rural population (million persons) 2.00GDP at current prices ($ Billion) 4.600Total vehicle fleet (vehicles) 150,000Discount Rate (%) 12%
Traffic Growth and Pavement WidthAnnual Traffic Growth Average Pavement
Network Rate (%/year) Width (m)Primary 3.0% 7.0Secondary 3.0% 6.0Tertiary 3.0% 5.0Unclassified 3.0% 5.0Urban 3.0% 7.0
Country Data

10
Country DataCapital Road Works Unit Costs
Two-Lane Unit Costs of Road Works ($/km)Surface Type Current Condition Road Work Primary Secondary Tertiary Unclassified UrbanConcrete Good Condition Preventive Treatment 5,000 4,000 3,000 3,000 5,000
Fair Condition Resurfacing (Overlay) 45,000 36,000 27,000 27,000 45,000Poor Condition Strengthening (Overlay) 130,000 104,000 78,000 78,000 130,000Very Poor Condition Reconstruction 230,000 184,000 138,000 138,000 230,000No Road New Construction 350,000 280,000 210,000 210,000 350,000
Asphalt Mix Good Condition Preventive Treatment 5,000 4,000 3,000 3,000 5,000Fair Condition Resurfacing (Overlay) 45,000 36,000 27,000 27,000 45,000Poor Condition Strengthening (Overlay) 130,000 104,000 78,000 78,000 130,000Very Poor Condition Reconstruction 230,000 184,000 138,000 138,000 230,000No Road New Construction 350,000 280,000 210,000 210,000 350,000
Surface Treatmeant Good Condition Preventive Treatment 2,000 1,600 1,200 1,200 2,000Fair Condition Resurfacing (Reseal) 18,000 14,400 10,800 10,800 18,000Poor Condition Strengthening (Overlay) 90,000 72,000 54,000 54,000 90,000Very Poor Condition Reconstruction 180,000 144,000 108,000 108,000 180,000No Road New Construction 300,000 240,000 180,000 180,000 300,000
Gravel Good Condition Spot Regravelling 3,000 2,400 1,800 1,800 3,000Fair Condition Regravelling 8,000 6,500 5,000 5,000 8,000Poor Condition Partial Reconstruction 17,500 14,000 10,500 10,500 17,500Very Poor Condition Full Reconstruction 35,000 28,000 21,000 21,000 35,000No Road New Construction 60,000 48,000 36,000 36,000 60,000
Earth Good Condition Spot Repairs 200 100 10 10 200Fair Condition Heavy Grading 800 400 50 50 800Poor Condition Partial Reconstruction 8,000 4,000 500 500 8,000Very Poor Condition Full Reconstruction 25,000 12,500 1,500 1,500 25,000No Road New Construction 40,000 20,000 2,500 2,500 40,000

11
RONET versus HDM 4
• RONET is a macro model only• Both requires country data input and calibration• RONET requires input on road length, condition,
traffic, pavement type, climate, terrain• HDM 4 requires additionally pavement history,
data on bases and sub-bases• RONET slightly simplified deterioration equations• RONET much less “data hungry”

12
RONET Version 1.0
Outputs

13
Road Network Evaluation Tools Version 1.0, 6/6/2007
Configuration Inputs Calculations Outputs
O-Length & UtilizationC-Basic Configuration I-Country Data Current Condition Assessment O-Asset Value
I-Road Network Length O-RoughnessO-Network Distribution ChartsO-Network Monitoring Indicators
Performance Assessment O-Network PerformanceC-Basic Configuration I-Country Data O-Road Works DistributionC-Standards Configuration I-Road Network Length O-Road Works Summary
I-Historical Data O-Historical Data Comparison
The World BankWashington, D.C.
PAM
Current Condition Assessment
Results computed using Excel formulas and are updated automatically when the inputs change.

14
Monitoring Indicators (1)Monitoring IndicatorNetwork LengthRoad network length kmRoad network length that is unpaved kmRoad network length that is paved kmRoad network length that is paved %Network DensityRoad network per thousand land area km/1000 sq kmRoad network per thousand total population km/1000 personsRoad network per thousand rural population km/1000 personsRoad network per thousand vehicles km/1000 vehiclesRoad network per $ million GDP km/million $Paved road network per thousand land area km/1000 sq kmPaved road network per thousand total population km/1000 personsPaved road network per thousand rural population km/1000 personsPaved road network per thousand vehicles km/1000 vehiclesPaved road network per $ million GDP km/million $

15
Monitoring Indicators (2)Network ConditionPercentage of road network in good and fair condition %Percentage of paved road network in good and fair condition %Percentage of paved road network with roughness 4 m/km IRI or less %Paved roads average roughness weighted by km IRI, m/kmPaved roads average roughness weighted by vehicle-km IRI, m/kmPercentage of unpaved roads that are all-weather roads %Network StandardsPercentage of unpaved roads with 30 AADT or less %Percentage of unpaved roads with 300 AADT or more %Percentage of paved roads with 300 AADT or less %Percentage of paved roads with 10,000 AADT or more %Network UtilizationAnnual motorized vehicle utilization million vehicle-kmAnnual freight carried over road network million ton-kmAnnual passengers carried over road network million pass-kmAverage network annual average daily traffic vehicles/dayNetwork AssetCurrent Road asset value million $Current Road asset value as a share of maximum road asset value %Current Road asset value as a share of GPD %

16
Result Examples
• Results presented here is the first attempt to apply the model to networks in specific countries (Ghana, Mozambique, Tanzania and Uganda)
• All data have been entered by the country representatives
• We do not know the quality of the data and in-country quality processes, and we cannot guarantee the correctness of the data
• Work in Progress, requires Country reviews

17
Mozambique All RoadsNetwork Length and Asset Value by Functional Classification
0%
20%
40%
60%
80%
100%
Per
cent
(%)
Urban
Vicinal
Tertiary
Secondary
Primary
Urban 0% 0%
Vicinal 23% 2%
Tertiary 43% 15%
Secondary 17% 16%
Primary 17% 67%
Length (km) Current Asset Value (M US$)

18
Road Network Evaluation Tools Version 1.0, 6/6/2007
Configuration Inputs Calculations Outputs
O-Length & UtilizationC-Basic Configuration I-Country Data Current Condition Assessment O-Asset Value
I-Road Network Length O-RoughnessO-Network Distribution ChartsO-Network Monitoring Indicators
Performance Assessment O-Network PerformanceC-Basic Configuration I-Country Data O-Road Works DistributionC-Standards Configuration I-Road Network Length O-Road Works Summary
I-Historical Data O-Historical Data Comparison
The World BankWashington, D.C.
PAM
Performance Assessment
Results computed using Excel macros and are updated only after the PAM button is pressed (evaluation takes around 3 minutes).

19
What are the Consequences of Applying Different Maintenance
Standards?
Standards ConsequencesVery High Standard Road WorksHigh Standard Performance FinancialMedium Standard Assessment EconomicLow Standard ConditionVery Low Standard Asset ValueDo Minimum Road UsersDo Nothing Etc.Custom Standard
RoadNetwork

20
Mozambique All Roads under ANE(29,238 km)
Road Agency and Road User Costs in Years 1 to 20
0 5,000 10,000 15,000 20,000 25,000 30,000 35,000
Very High Standard
High Standard
Medium Standard
Low Standard
Very Low Standard
Costs (Million US$)
Road Agency Road Users

21
Mozambique All Roads under ANE(29,238 km)
Road Agency and User CostsCompared to the Very High Standard Scenario
01,0002,0003,0004,0005,0006,000
Very HighStandard
High Standard Medium Standard Low Standard Very LowStandard
Roa
d Ag
ency
and
Use
r Cos
ts(M
US$
)
0.01.02.03.04.05.06.0
Roa
d U
ser p
er
Roa
d A
genc
y R
atio
Road User Costs Increase Road Agency Costs DeficitRoad User per Road Agency Ratio

22
Case StudiesSSATP Working Paper No. 85-B
Country Comparisons: Olav Ellevset, SSATP / The World Bank
Ghana: Godwin Brocke, Ministry of TransportationMozambique: Atanasio Mugunhe, National Roads
Administration (ANE)Tanzania: Joseph Lwiza, Tanzania National Roads Agency
(TANROADS)Uganda: David Lyiumbazi, Road Agency Formation Unit
(RAFU)

23
Year of Data-Sets
• Ghana 2005• Mozambique 2006• Tanzania 2007• Uganda 2007

24
Country, Basic Characteristics Ghana Mozambique Tanzania Uganda Land area (sq km) 238,500 781,129 881,000 197,097 Total population (million persons) 21.343 19.92 36 28 Rural population (million persons) 11.99 15.98 28.8 22.4 GDP at current prices ($ Billion) 10.57 7.368 10.68 8.502 Total vehicle fleet (vehicles) 653,309 187,660 608,000 278,595

25
The Case Studies
Main Roads Only

26
Main Roads Length & Utilization
0
10,000
20,000
30,000
40,000
50,000
60,000
70,000
80,000
90,000
Ghana Mozambique Tanzania Uganda
Net
wor
k Le
ngth
(km
)
Main Roads (km) Other Roads (km)
0
5,000
10,000
15,000
20,000
25,000
Ghana Mozambique Tanzania Uganda
Net
wor
k U
tiliz
atio
n (M
veh
icle
-km
)
Main Roads (km) Other Roads (km)
Main roads represent 27% of the total network length
Main roads represent 77% of the total network
utilization

27
Network Condition
Network Monitoring Indicators, Main Roads
Monitoring Indicator Ghana Mozambique Tanzania Uganda
Network Condition Percentage of road network in good and fair condition (%) 73.8 83.3 78.0 82.1 Percentage of paved road network in good and fair condition (%) 95.3 87.5 93.7 88.1 Percentage of paved road network with roughness 4 m/km IRI or less (%) 64.6 53.1 58.3 24.7 Paved roads average roughness weighted by km (IRI, m/km) (%) 4.47 4.91 4.30 5.73 Paved roads average roughness weighted by vehicle-km (IRI, m/km) (%) 3.94 4.63 3.67 5.67 Percentage of unpaved roads that are all-weather roads (%) 54.0 59.5 63.1 80.1

28
Network Standards
Network Monitoring Indicators, Main Roads
Monitoring Indicator Ghana Mozambique Tanzania Uganda
Network Standards Percentage of unpaved roads with 30 AADT or less (%) 1.2 19.2 20.7 2.6 Percentage of unpaved roads with 300 AADT or more (%) 31.2 2.2 10.2 29.5 Percentage of paved roads with 300 AADT or less (%) 0.0 40.2 12.3 13.9 Percentage of paved roads with 10,000 AADT or more (%) 13.9 0.2 2.5 8.2

29
Network Utilization
Network Monitoring Indicators, Main Roads
Monitoring Indicator Ghana Mozambique Tanzania Uganda
Network Utilization Annual motorized vehicle utilization (million vehicle-km) 10,738 2,229 5,876 4,344 Annual freight carried over road network (million ton-km) 32,164 6,844 19,857 18,777 Annual passengers carried over road network (million pass-km) 73,140 15,484 45,032 25,226 Average network annual average daily traffic (vehicles/day) 2,632 623 555 1,100

30
Network Assets
Network Monitoring Indicators, Main Roads
Monitoring Indicator Ghana Mozambique Tanzania Uganda
Network Asset Current Road asset value (million $) 1,390.4 2,423.0 2,463.9 1,360.2 Current Road asset value as a share of maximum road asset value (%) 90.3 90.2 90.4 86.2 Current Road asset value as a share of GDP (%) 13.2 32.9 23.1 16.0

31
Capital Road Works Unit Costs (US$/km)
Surface Type Road Work Ghana Mozambique Tanzania Uganda Asphalt Mix Preventive Treatment 2,500 9,500 5,000 12,500 Primary Roads Resurfacing (Overlay) 110,000 71,500 60,000 45,000 Strengthening (Overlay) 170,000 250,000 100,000 130,000 Reconstruction 250,000 400,000 300,000 350,000 New Construction 400,000 650,000 350,000 600,000 Surface Treatment Preventive Treatment 1,800 3,510 2,000 10,000 Primary Roads Resurfacing (Reseal) 25,000 32,500 27,000 25,000 Strengthening (Overlay) 60,000 107,310 80,000 75,000 Reconstruction 160,000 300,000 254,000 250,000 New Construction 220,000 450,000 304,000 400,000 Gravel Spot Regraveling 900 2,400 2,708 5,000 Secondary Roads Regraveling 12,000 45,000 8,462 10,000 Partial Reconstruction 18,000 55,000 11,846 25,000 Full Reconstruction 28,000 70,000 21,154 40,000 New Construction 32,000 90,000 47,385 60,000 Earth Spot Repairs 500 125 104 125 Tertiary Roads Heavy Grading 600 250 426 250 Partial Reconstruction 750 350 5,192 625 Full Reconstruction 950 350 10,385 1,125 New Construction 1,000 350 27,692 1,500

32
Recurrent Road Works Unit Costs (US$/km/year)
Surface Type Road Condition Ghana Mozambique Tanzania Uganda
Asphalt Mix Very Good 900 1,100 1,000 1,875 Primary Roads Good 1,200 1,200 1,250 1,875 Fair 1,500 1,300 1,500 2,500 Poor 1,750 975 1,750 6,250 Very Poor 750 650 2,000 12,500 Surface Treatment Very Good 600 1,000 1,000 1,500 Primary Roads Good 900 1,200 1,250 1,500 Fair 1,200 1,300 1,500 2,000 Poor 1,500 975 1,750 5,000 Very Poor 600 650 2,000 10,000 Gravel Very Good 375 1,200 413 1,125 Secondary Roads Good 470 1,200 506 1,125 Fair 580 1,200 600 2,625 Poor 660 900 694 3,375 Very Poor 290 600 788 5,625 Earth Very Good 40 100 125 50 Tertiary Roads Good 60 100 157 50 Fair 80 125 188 50 Poor 100 125 219 100 Very Poor 40 125 250 100

33
Average Results for the Four Countries Network Density Road network per thousand land area (km/1000 sq km) 36.81 Road network per thousand total population (km/1000 persons) 0.55 Road network per thousand rural population (km/1000 persons) 0.76 Road network per thousand vehicles (km/1000 vehicles) 38.98 Road network per $ million GDP (km/million $) 1.59 Paved road network per thousand land area (km/1000 sq km) 24.65 Paved road network per thousand total population (km/1000 persons) 0.36 Paved road network per thousand rural population (km/1000 persons) 0.49 Paved road network per thousand vehicles (km/1000 vehicles) 25.41 Paved road network per $ million GDP (km/million $) 1.09 Network Asset Current Road asset value per kilometer (million $/km) 0.15 Current Road asset value as a share of maximum road asset value (%) 89% Current Road asset value as a share of GPD (%) 21% Medium Standard Rehabilitation and Maintenance Requirements Annual rehabilitation and maintenance requirements as share of GDP (%) 0.66% Annual rehabilitation and maintenance requirements (US$ per Year per Km) 4,574 Annual rehabilitation and maintenance requirements (US$ per Year per Vehicle-Km) 0.016 Rehabilitation expenditures as a share of total expenditures (%) 36% Periodic Maintenance expenditures as a share of total expenditures (%) 46% Routine Maintenance expenditures as a share of total expenditures (%) 18%

34
Main Roads Performance
Medium Standard Maintains Current Condition
Ghana
0
2
4
6
8
10
12
14
16
18
20
1 10
Year
Net
wor
k A
vera
ge R
ough
ness
(IR
I)
Do MinimumVery Low StandardLow StandardMedium StandardHigh StandardVery High Standard
Mozambique
0
2
4
6
8
10
12
14
16
18
20
1 10
Year
Net
wor
k A
vera
ge R
ough
ness
(IR
I)
Do MinimumVery Low StandardLow StandardMedium StandardHigh StandardVery High Standard
Tanzania
0
2
4
6
8
10
12
14
16
18
20
1 10
Year
Net
wor
k A
vera
ge R
ough
ness
(IR
I)
Do MinimumVery Low StandardLow StandardMedium StandardHigh StandardVery High Standard
Uganda
0
2
4
6
8
10
12
14
16
18
20
1 10
Year
Net
wor
k Av
erag
e R
ough
ness
(IR
I)Do MinimumVery Low StandardLow StandardMedium StandardHigh StandardVery High Standard

35
Main Roads Requirements
0.0
10.0
20.0
30.0
40.0
50.0
60.0
70.0
80.0
Ghana Mozambique Tanzania Uganda
Req
uire
men
ts (M
US
$ pe
r Yea
r)
Rehabilitation (M US$ per Year) Periodic Maintenance (M US$ per Year)Recurrent Maintenance (M US$ per Year)
0%
20%
40%
60%
80%
100%
Ghana Mozambique Tanzania Uganda
Req
uire
men
ts (%
)
Rehabilitation (M US$ per Year) Periodic Maintenance (M US$ per Year)Recurrent Maintenance (M US$ per Year)
Annual Road Works Requirements for Medium
Standard
Share of Annual Requirements:Rehabilitation = 35%
Periodic Maintenance = 47%Routine Maintenance = 18%

36
Main Roads RequirementsAnnual Rehabilitation and Maintenance Requirements (M US$ per Year)
Ghana Mozambique Tanzania Uganda AverageVery High Standard 71.6 85.1 98.9 62.1 79.4High Standard 58.4 75.8 86.4 54.9 68.9Medium Standard 51.0 69.2 73.9 48.7 60.7Low Standard 40.4 56.7 57.5 32.7 46.8Very Low Standard 14.7 48.9 38.3 31.2 33.2Do Minimum 8.9 39.2 22.0 14.1 21.0
Annual Rehabilitation and Maintenance Requirements (M US$ per Year as Percent of GDP)Ghana Mozambique Tanzania Uganda Average
Very High Standard 0.68% 1.16% 0.93% 0.73% 0.87%High Standard 0.55% 1.03% 0.81% 0.65% 0.76%Medium Standard 0.48% 0.94% 0.69% 0.57% 0.67%Low Standard 0.38% 0.77% 0.54% 0.39% 0.52%Very Low Standard 0.14% 0.66% 0.36% 0.37% 0.38%Do Minimum 0.08% 0.53% 0.21% 0.17% 0.25%
Annual Rehabilitation and Maintenance Requirements (US$ per Year per Km)Ghana Mozambique Tanzania Uganda Average
Very High Standard 6,409 8,680 3,409 5,735 6,058High Standard 5,228 7,729 2,980 5,074 5,253Medium Standard 4,562 7,052 2,549 4,498 4,665Low Standard 3,616 5,776 1,983 3,025 3,600Very Low Standard 1,311 4,984 1,321 2,879 2,624Do Minimum 794 4,000 758 1,299 1,713
Annual Rehabilitation and Maintenance Requirements (US$ per Year per Vehicle-Km)Ghana Mozambique Tanzania Uganda Average
Very High Standard 0.007 0.038 0.017 0.014 0.019High Standard 0.005 0.034 0.015 0.013 0.017Medium Standard 0.005 0.031 0.013 0.011 0.015Low Standard 0.004 0.025 0.010 0.008 0.012Very Low Standard 0.001 0.022 0.007 0.007 0.009Do Minimum 0.001 0.018 0.004 0.003 0.006
Annual rehabilitation,
periodic maintenance and
routine maintenance requirements represent for
Medium Standard:
- 0.67% of GDP
- 4,665 US$ per km-year
- 0.015 US$ per vehicle-km-year
37
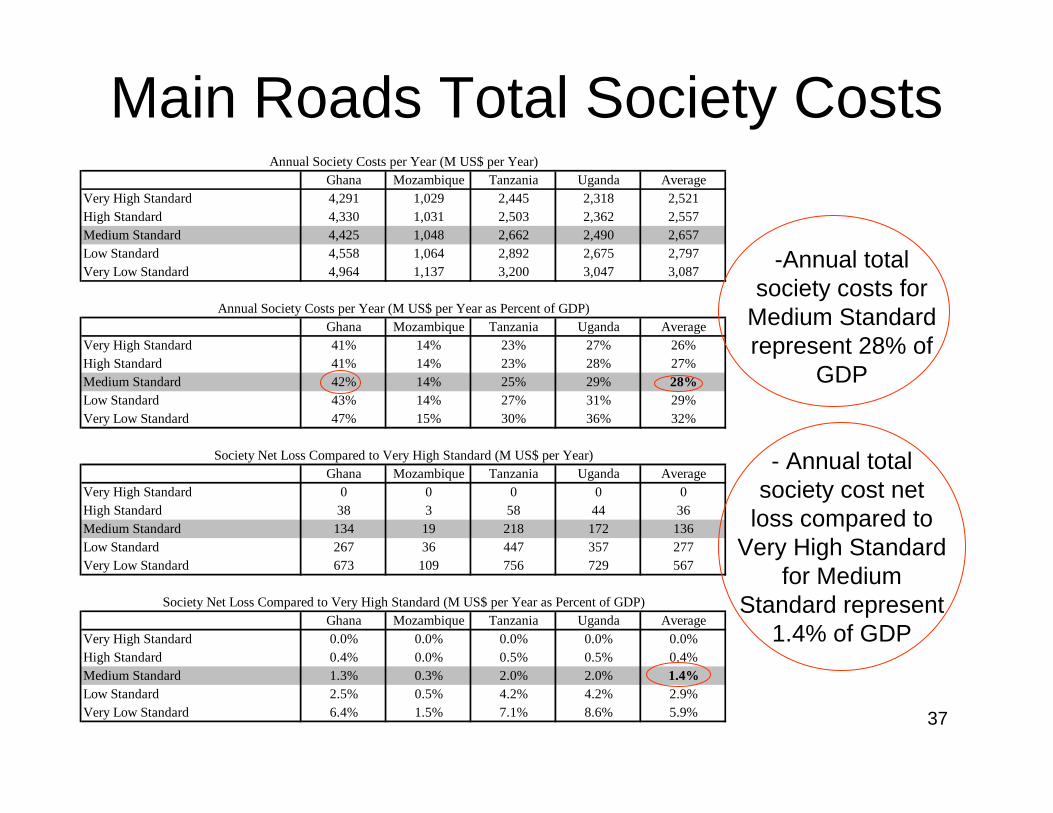
Main Roads Total Society Costs
-Annual total society costs for
Medium Standard represent 28% of
GDP
- Annual total society cost net
loss compared to Very High Standard
for Medium Standard represent
1.4% of GDP
Annual Society Costs per Year (M US$ per Year)Ghana Mozambique Tanzania Uganda Average
Very High Standard 4,291 1,029 2,445 2,318 2,521High Standard 4,330 1,031 2,503 2,362 2,557Medium Standard 4,425 1,048 2,662 2,490 2,657Low Standard 4,558 1,064 2,892 2,675 2,797Very Low Standard 4,964 1,137 3,200 3,047 3,087
Annual Society Costs per Year (M US$ per Year as Percent of GDP)Ghana Mozambique Tanzania Uganda Average
Very High Standard 41% 14% 23% 27% 26%High Standard 41% 14% 23% 28% 27%Medium Standard 42% 14% 25% 29% 28%Low Standard 43% 14% 27% 31% 29%Very Low Standard 47% 15% 30% 36% 32%
Society Net Loss Compared to Very High Standard (M US$ per Year)Ghana Mozambique Tanzania Uganda Average
Very High Standard 0 0 0 0 0High Standard 38 3 58 44 36Medium Standard 134 19 218 172 136Low Standard 267 36 447 357 277Very Low Standard 673 109 756 729 567
Society Net Loss Compared to Very High Standard (M US$ per Year as Percent of GDP)Ghana Mozambique Tanzania Uganda Average
Very High Standard 0.0% 0.0% 0.0% 0.0% 0.0%High Standard 0.4% 0.0% 0.5% 0.5% 0.4%Medium Standard 1.3% 0.3% 2.0% 2.0% 1.4%Low Standard 2.5% 0.5% 4.2% 4.2% 2.9%Very Low Standard 6.4% 1.5% 7.1% 8.6% 5.9%

38
Main Roads Road User CostsRoad User Costs Increase per Agency Deficit Compared to Very High Standard (US$ per US$)
Ghana Mozambique Tanzania Uganda AverageVery High Standard 0.0 0.0 0.0 0.0 0.0High Standard 3.9 1.3 5.7 7.2 4.5Medium Standard 7.5 2.2 9.7 13.9 8.3Low Standard 9.6 2.2 11.8 13.2 9.2Very Low Standard 12.8 4.0 13.5 24.6 13.7
0.0
2.0
4.0
6.0
8.0
10.0
12.0
14.0
16.0
Very HighStandard
High Standard Medium Standard Low Standard Very LowStandard
Roa
d U
ser C
osts
Incr
ease
per
Age
ncy
Def
icit
Com
pare
d to
Ver
y H
igh
Stan
dard
(US$
per
US
$)
For Medium Standard, for every Dollar of road agency deficit, road users costs increase by 8.3 Dollars

39
Experiences with Country Applications (1)• No particular problems with data for model
calibration• Traffic level statistics from feeder/local
government roads not available• Unit costs strongly influence evaluations,
and important to review individual unit costs and consistency of cost structure.
• Difficult to find sufficient data for all unit costs in many countries, and they will also vary substantially within the country itself.

40
Experiences with Country Applications (2)
• Separate analyses for all roads, and another one for main roads only, may avoid distortions from large, low-level networks with low traffic and uncertain unit costs.
• Separate calculations for roads under the same management institution would be an option.

41
Countries follow up
• For a next round of comparison and posting at SSATP’s website, the Pilot countries should review and satisfy themselves with the input data quality

42
RONET Version 1.0
Available Documentation

43
RONET v1.0 User’s Guide w/ CD

44
Case StudiesGhana, Mozambique, Tanzania and Uganda

45
RONET Distribution• RONET is available for free internet download at:
http://www.worldbank.org/afr/ssatp
• RONET CD can be obtained by contacting:– Monique S. Desthuis-Francis ([email protected])– Olav Ellevset (e-mail: [email protected])
• Technical issues: – Rodrigo Archondo-Callao
([email protected])– Olav Ellevset

46
What’s Next for RONET• Dissemination• RONET development
– Improved Version 1.1 under preparation– In French next year– New modules added to version 1.0, evaluating also a
matrix of road classes• Road user charges• Life-cycle economic evaluation• Axle loading impacts• Accident impacts• Social impacts from transport sector interventions, SAM (?)• Rural Access Indicator (RAI) (?)
– New tool that evaluates homogeneous road sections, suited to support programming of road works

47
Conclusions
RONET Version 1.0 may contribute well to:
– Getting network condition and asset value– Budget forecasts– Identifying challenging areas– Country comparisons that now can be based on the
same tool– Fast and low-cost network evaluations
We encourage countries to start using it

48
Thank You !