Revised First Quarter Employment and Wages
January - March 2020
Alaska
Industrial Classification# of
UnitsJan
EmpFeb
EmpMar
EmpAverage
Monthly EmpTotal
EarningsAverage
Monthly Wage
TOTAL INDUSTRIES 22,606 311,905 318,385 317,906 316,065 $4,602,179,196 $4,854
TOTAL GOVERNMENT 2,246 78,353 79,623 79,834 79,270 $1,120,888,994 $4,713
FEDERAL GOVERNMENT 550 14,719 14,712 15,207 14,879 $284,843,267 $6,381
STATE GOVERNMENT 1,021 22,515 23,008 23,080 22,868 $335,476,617 $4,890
LOCAL GOVERNMENT 675 41,119 41,903 41,547 41,523 $500,569,110 $4,018
PRIVATE OWNERSHIP 20,360 233,552 238,762 238,072 236,795 $3,481,290,203 $4,901
GOODS-PRODUCING 3,607 37,393 40,998 40,844 39,745 $982,030,081 $8,236
NATURAL RESOURCES AND MINING 543 14,103 14,332 14,403 14,279 $553,777,728 $12,928
Agriculture, Forestry, Fishing, Hunting 293 1,123 1,211 1,365 1,233 $13,050,601 $3,528
Crop Production 106 609 642 685 645 $4,497,034 $2,324111
Oilseed and Grain Farming 11111
Vegetable and Melon Farming 14 39 33 36 36 $117,803 $1,0911112
Fruit and Tree Nut Farming 21113
Greenhouse, Nursery, etc. 86 564 602 641 602 $4,288,392 $2,3751114
Other Crop Farming 31119
Animal Production 40 226 256 292 258 $2,771,985 $3,581112
Cattle Ranching, Farming 31121
Sheep, Goat Farming 11124
Animal Aquaculture 33 216 246 282 248 $2,695,742 $3,6231125
Other Animal Production 31129
Forestry and Logging 28 152 193 206 184 $2,660,097 $4,819113
Timber Tract Operations 21131
Logging 261133
Fishing, Hunting, Trapping 101 92 81 139 104 $2,850,892 $9,137114
Fishing 1001141
Hunting, Trapping 11142
Agriculture, Forestry Support 18 44 39 43 42 $270,593 $2,148115
Crop Production 31151
Animal Production 3 10 9 9 9 $53,253 $1,9721152
Forestry 121153
Mining 250 12,980 13,121 13,038 13,046 $540,727,127 $13,816
Oil and Gas Industry 1/ 137 9,962 10,107 9,954 10,008 $449,320,000 $14,965210
Oil and Gas Extraction 29 3,483 3,483 3,510 3,492 $270,515,627 $25,822211
Oil and Gas Extraction 29 3,483 3,483 3,510 3,492 $270,515,627 $25,8222111
Mining, except Oil and Gas 83 2,917 2,933 2,996 2,949 $88,800,017 $10,037212
Coal 12121
Metal Ore 49 2,613 2,606 2,663 2,627 $81,256,596 $10,3102122
Nonmetallic Mineral, Quarrying 332123
Mining Support Activities 138 6,580 6,705 6,532 6,606 $181,411,483 $9,154213
Support Activities for Mining 138 6,580 6,705 6,532 6,606 $181,411,483 $9,1542131
CONSTRUCTION 2,471 13,849 14,326 14,499 14,225 $274,529,542 $6,433
Construction of Buildings 805 4,528 4,536 4,555 4,540 $81,187,312 $5,961236
Residential 490 1,431 1,459 1,434 1,441 $14,756,475 $3,4132361
Nonresidential 315 3,097 3,077 3,121 3,098 $66,430,837 $7,1482362
Heavy Construction 306 3,195 3,597 3,797 3,530 $95,867,559 $9,053237
Utility System 139 1,894 2,172 2,277 2,114 $58,543,995 $9,2312371
Land Subdivision 11 34 36 38 36 $230,363 $2,1332372
Highway, Street, Bridge 113 1,039 1,134 1,218 1,130 $29,221,758 $8,6202373
Other Civil Engineering 43 228 255 264 249 $7,871,443 $10,5372379
Specialty Trade Contractors 1,360 6,126 6,193 6,147 6,155 $97,474,671 $5,279238
Foundation, Structure, Exterior 265 652 686 650 663 $9,640,985 $4,8472381
Building Equipment 484 3,532 3,500 3,458 3,497 $62,609,852 $5,9682382
Building Finishing 349 1,079 1,109 1,084 1,091 $12,676,993 $3,8732383
Page 1 of 701/ Oil Gas industry employment includes oil and gas exploration and oilfield services, or North American Industrial Classification System (NAICS) codes 211, 213111, 213112Quarterly Census of Employment Wages (QCEW): January - March 2020Data are preliminary and subject to revisionBlanks in the Employment, Total Earnings and Average Monthly Earnings columns due to confidentiality; data are suppressedSource: Alaska Department of Labor and Workforce Development, Research and Analysis Section

Alaska
Industrial Classification# of
UnitsJan
EmpFeb
EmpMar
EmpAverage
Monthly EmpTotal
EarningsAverage
Monthly Wage
GOODS-PRODUCING 3,607 37,393 40,998 40,844 39,745 $982,030,081 $8,236
CONSTRUCTION 2,471 13,849 14,326 14,499 14,225 $274,529,542 $6,433
Specialty Trade Contractors 1,360 6,126 6,193 6,147 6,155 $97,474,671 $5,279238
Other Trade 262 863 898 955 905 $12,546,841 $4,6212389
MANUFACTURING 593 9,441 12,340 11,942 11,241 $153,722,812 $4,558
Food 196 6,263 9,104 8,690 8,019 $105,329,667 $4,378311
Animal Food 23111
Grain, Oilseed Milling 13112
Sugar, Confectionery Products 8 51 50 47 49 $242,585 $1,6503113
Fruit, Vegetable, Specialty Foods 13114
Dairy Products 13115
Animal Slaughtering, Processing 6 93 85 83 87 $786,671 $3,0143116
Seafood Product Prep., Pkg. 140 5,717 8,540 8,138 7,465 $100,945,403 $4,5073117
Bakeries, Tortilla 25 283 308 300 297 $2,524,702 $2,8343118
Other Food 12 72 74 75 74 $545,497 $2,4573119
Beverage and Tobacco Products 56 505 522 516 514 $4,108,694 $2,665312
Beverage Manufacturing 56 505 522 516 514 $4,108,694 $2,6653121
Textiles 1313
Fiber, Yarn, Thread Mills 13131
Textile Products 10 51 50 43 48 $361,894 $2,513314
Other Textile Product Mills 10 51 50 43 48 $361,894 $2,5133149
Apparel 7 10 9 9 9 $20,151 $746315
Cut, Sew Apparel 43152
Apparel Accessories, etc. 33159
Leather and Allied Products 3316
Leather, Hide Tanning, Finishing 13161
Other Leather, Allied Products 23169
Wood Products 33 207 228 233 223 $2,734,812 $4,088321
Sawmills, Wood Preservation 103211
Veneer, Plywood, Engineered Wood 43212
Other Wood Products 19 124 134 139 132 $1,905,957 $4,8133219
Paper 1322
Converted Paper Product Manufacturing 13222
Printing and Support Activities 46 284 280 274 279 $2,587,775 $3,092323
Printing and Related Support Activities 46 284 280 274 279 $2,587,775 $3,0923231
Petroleum and Coal Products 7 339 343 345 342 $13,228,075 $12,893324
Petroleum and Coal Products Mfg. 7 339 343 345 342 $13,228,075 $12,8933241
Chemicals 15 64 65 64 64 $721,933 $3,760325
Resin, Synthetic, Rubber, etc. 13252
Pesticide, Fertilizer, etc. 23253
Pharmaceutical, Medicine 33254
Soap, Cleaning Compound, etc. 23256
Other Chemical Products, etc. 7 39 39 37 38 $405,778 $3,5593259
Plastics and Rubber Products 7 57 55 57 56 $870,446 $5,181326
Plastics Products 53261
Rubber Products 23262
Nonmetallic Mineral Products 27 164 172 175 170 $2,905,926 $5,698327
Glass, Glass Products 23272
Cement, Concrete Products 23 144 153 157 151 $2,706,937 $5,9763273
Other Nonmetallic Mineral Products 23279
Primary Metals 4 9 10 10 10 $177,565 $5,919331
Iron, Steel Mills, Ferroalloy 13311
Products from Purchased Steel 23312
Nonferrous Metal 13314
Fabricated Metal Products 54 417 408 407 411 $5,933,633 $4,812332
Forging, Stamping 13321
Cutlery, Hand Tool 23322
Architectural, Structural Metals 16 142 133 135 137 $1,680,960 $4,0903323
Boiler, Tank, Shipping Container 6 69 72 71 71 $1,204,661 $5,6563324
Spring, Wire Products 13326
Machine Shops, Turned Products 14 130 128 128 129 $2,219,852 $5,7363327
Coating, Engraving, etc. 4 10 9 9 9 $96,687 $3,5813328
Page 2 of 701/ Oil Gas industry employment includes oil and gas exploration and oilfield services, or North American Industrial Classification System (NAICS) codes 211, 213111, 213112Quarterly Census of Employment Wages (QCEW): January - March 2020Data are preliminary and subject to revisionBlanks in the Employment, Total Earnings and Average Monthly Earnings columns due to confidentiality; data are suppressedSource: Alaska Department of Labor and Workforce Development, Research and Analysis Section

Alaska
Industrial Classification# of
UnitsJan
EmpFeb
EmpMar
EmpAverage
Monthly EmpTotal
EarningsAverage
Monthly Wage
GOODS-PRODUCING 3,607 37,393 40,998 40,844 39,745 $982,030,081 $8,236
MANUFACTURING 593 9,441 12,340 11,942 11,241 $153,722,812 $4,558
Fabricated Metal Products 54 417 408 407 411 $5,933,633 $4,812332
Other Fabricated Metal 10 47 47 46 47 $555,193 $3,9383329
Machinery 10 84 84 84 84 $1,442,771 $5,725333
Ag., Const., Mining Mach. 13331
Commercial, Service Industry 33333
Ventilation, Heat/Air Equipment 33334
Engine, Turbine, Transmission 13336
Other Machinery 23339
Computer and Electronic Products 14 122 119 119 120 $2,498,691 $6,941334
Navigational/Electromedical Manuf. 13 121 118 118 119 $2,467,038 $6,9103345
Electrical Equip. and Appliances 3335
Electrical Equipment 13353
Other Electrical Equipment 23359
Transportation Equipment 43 584 615 640 613 $7,808,647 $4,246336
Motor Vehicle Body, Trailer 3 53 51 47 50 $564,080 $3,7613362
Motor Vehicle Parts 43363
Aerospace Products, Parts 12 123 128 131 127 $1,625,438 $4,2663364
Ship, Boat Building 23 401 429 454 428 $5,583,909 $4,3493366
Other Transp. Equipment 13369
Furniture and Related Products 15 89 89 94 91 $1,022,690 $3,746337
Furniture, Kitchen Cabinets, etc. 12 58 58 63 60 $627,527 $3,4863371
Office Furniture, Fixtures 13372
Other Furniture 23379
Miscellaneous 41 158 152 148 153 $1,617,113 $3,523339
Medical Equipment 19 63 60 58 60 $778,227 $4,3233391
Other Miscellaneous 22 95 92 90 92 $838,886 $3,0393399
SERVICE-PROVIDING 16,753 196,159 197,764 197,228 197,050 $2,499,260,121 $4,228
TRADE, TRANSPORTATION AND UTILITIES 4,306 60,537 60,566 60,541 60,548 $777,946,442 $4,283
Wholesale Trade 704 6,493 6,500 6,512 6,502 $99,772,085 $5,115
Wholesale, Durable Goods 387 2,718 2,711 2,695 2,708 $48,667,277 $5,991423
Motor Vehicle, Parts 20 205 204 172 194 $2,699,838 $4,6394231
Furniture, Home Furnishing 10 36 34 34 35 $479,437 $4,5664232
Lumber, Other Materials 20 87 86 89 87 $1,276,833 $4,8924233
Professional, Commercial Equip. 93 373 375 378 375 $8,536,354 $7,5884234
Metal, Mineral, except Petroleum 14 127 129 128 128 $2,225,807 $5,7964235
Electrical, Electronic Goods 36 179 180 182 180 $3,638,268 $6,7384236
Hardware, Plumbing, Heating 36 339 341 340 340 $5,002,475 $4,9044237
Machinery, Equipment 118 1,155 1,148 1,155 1,153 $22,249,630 $6,4324238
Miscellaneous Durable Goods 40 217 214 217 216 $2,558,635 $3,9494239
Wholesale, Nondurable Goods 232 3,526 3,529 3,557 3,537 $46,921,092 $4,422424
Paper, Paper Product 13 127 133 130 130 $1,924,854 $4,9364241
Drugs, Druggists Sundries 29 139 137 134 137 $2,330,092 $5,6694242
Apparel, Piece Goods, Notions 24243
Grocery, Related Products 95 2,017 2,021 2,034 2,024 $23,840,444 $3,9264244
Farm Product Raw Material 24245
Chemical, Allied Products 19 137 136 131 135 $2,928,518 $7,2314246
Petroleum, Petroleum Products 32 591 585 598 591 $9,775,642 $5,5144247
Beer, Wine, Distilled Beverage 14 282 283 288 284 $4,084,315 $4,7944248
Miscellaneous Wholesalers 26 227 228 236 230 $1,981,548 $2,8724249
Wholesale, Electronic Markets 85 249 260 260 256 $4,183,716 $5,448425
Wholesale, Electronic Markets 85 249 260 260 256 $4,183,716 $5,4484251
Retail Trade 2,321 34,185 33,868 33,869 33,974 $282,936,270 $2,776
Motor Vehicle and Parts Dealers 242 3,938 3,952 3,964 3,951 $49,013,058 $4,135441
Automobile Dealers 57 2,156 2,169 2,153 2,159 $31,240,364 $4,8234411
Other Motor Vehicle Dealers 66 464 472 489 475 $4,617,670 $3,2404412
Automotive Parts and Accessories 119 1,318 1,311 1,322 1,317 $13,155,024 $3,3304413
Furniture and Home Furnishings 93 774 756 733 754 $6,383,323 $2,822442
Furniture Stores 33 416 424 409 416 $3,773,952 $3,0244421
Home Furnishings Stores 60 358 332 324 338 $2,609,372 $2,5734422
Page 3 of 701/ Oil Gas industry employment includes oil and gas exploration and oilfield services, or North American Industrial Classification System (NAICS) codes 211, 213111, 213112Quarterly Census of Employment Wages (QCEW): January - March 2020Data are preliminary and subject to revisionBlanks in the Employment, Total Earnings and Average Monthly Earnings columns due to confidentiality; data are suppressedSource: Alaska Department of Labor and Workforce Development, Research and Analysis Section

Alaska
Industrial Classification# of
UnitsJan
EmpFeb
EmpMar
EmpAverage
Monthly EmpTotal
EarningsAverage
Monthly Wage
SERVICE-PROVIDING 16,753 196,159 197,764 197,228 197,050 $2,499,260,121 $4,228
TRADE, TRANSPORTATION AND UTILITIES 4,306 60,537 60,566 60,541 60,548 $777,946,442 $4,283
Retail Trade 2,321 34,185 33,868 33,869 33,974 $282,936,270 $2,776
Electronics and Appliances 66 592 578 576 582 $5,722,143 $3,277443
Electronics and Appliances 66 592 578 576 582 $5,722,143 $3,2774431
Building Material and Garden 153 3,457 3,443 3,520 3,473 $36,398,087 $3,493444
Building Material Dealers 131 3,386 3,367 3,421 3,391 $35,933,477 $3,5324441
Lawn, Garden Equip., Supply 22 71 76 99 82 $464,610 $1,8894442
Food and Beverages 281 5,327 5,329 5,314 5,323 $38,057,464 $2,383445
Grocery Stores 156 4,216 4,247 4,215 4,226 $31,274,151 $2,4674451
Specialty Food Stores 43 559 538 551 549 $3,297,053 $2,0024452
Beer, Wine, Liquor Stores 82 552 544 548 548 $3,486,260 $2,1214453
Health and Personal Care 123 1,026 988 987 1,000 $9,317,931 $3,106446
Health and Personal Care 123 1,026 988 987 1,000 $9,317,931 $3,1064461
Gasoline Stations 188 1,737 1,699 1,689 1,708 $11,644,815 $2,273447
Gasoline Stations 188 1,737 1,699 1,689 1,708 $11,644,815 $2,2734471
Clothing and Clothing Accessories 219 1,664 1,585 1,517 1,589 $8,260,866 $1,733448
Clothing Stores 131 1,291 1,218 1,154 1,221 $5,910,527 $1,6144481
Shoe Stores 16 175 172 176 174 $668,307 $1,2804482
Jewelry, Luggage, Leather Goods 72 198 195 187 193 $1,682,032 $2,9054483
Sporting Goods, Books, Music, etc. 190 1,935 1,896 1,886 1,906 $9,653,853 $1,688451
Sporting Goods, Musical Inst. 161 1,746 1,693 1,698 1,712 $8,738,653 $1,7014511
Books, Periodicals, Recorded Music 29 189 203 188 193 $915,200 $1,5814512
General Merchandise 187 9,874 9,770 9,798 9,814 $72,149,852 $2,451452
Miscellaneous 429 2,633 2,639 2,622 2,631 $17,153,239 $2,173453
Florists 21 73 101 77 84 $414,641 $1,6454531
Office Supplies, Gift Stores 163 704 725 739 723 $4,766,541 $2,1984532
Used Merchandise Stores 42 437 429 420 429 $2,565,495 $1,9934533
Other Miscellaneous Retailers 203 1,419 1,384 1,386 1,396 $9,406,562 $2,2464539
Nonstore Retailers 150 1,228 1,233 1,263 1,241 $19,181,639 $5,152454
Electronic Shopping, Mail-Order 24 69 63 62 65 $667,632 $3,4244541
Vending Machine Operators 4 65 62 62 63 $506,337 $2,6794542
Direct Selling Establishments 122 1,094 1,108 1,139 1,114 $18,007,670 $5,3884543
Transportation and Warehousing 1,175 17,641 17,972 17,948 17,854 $342,108,115 $6,387
Air Transportation 191 5,827 5,848 5,868 5,848 $105,055,220 $5,988481
Scheduled Air Transportation 82 4,749 4,840 4,857 4,815 $87,138,940 $6,0324811
Nonscheduled Air Transportation 109 1,078 1,008 1,011 1,032 $17,916,280 $5,7874812
Water Transportation 176 910 992 1,023 975 $24,352,650 $8,326483
Deep Sea, Coastal, Water Transp. 153 734 811 835 793 $17,399,208 $7,3144831
Inland Water Transp. 23 176 181 188 182 $6,953,442 $12,7354832
Truck Transportation 202 2,418 2,457 2,481 2,452 $36,940,087 $5,022484
General Freight Trucking 88 1,155 1,174 1,168 1,166 $18,646,347 $5,3314841
Specialized Freight Trucking 114 1,263 1,283 1,313 1,286 $18,293,740 $4,7424842
Transit and Ground Passenger 77 1,578 1,578 1,423 1,526 $11,585,291 $2,531485
Urban Transit System 3 34 33 35 34 $269,326 $2,6404851
Interurban, Rural Bus Transp. 34852
Taxi, Limousine Service 16 184 193 186 188 $1,072,111 $1,9014853
School, Employee Bus Transp. 31 1,156 1,151 1,015 1,107 $8,531,554 $2,5694854
Charter Bus Industry 14855
Other Transit, Ground Passenger 23 199 196 182 192 $1,655,868 $2,8754859
Pipeline 6486
Pipeline Transp. of Crude Oil 64861
Scenic and Sightseeing 191 762 806 909 826 $8,623,646 $3,480487
Scenic, Sightseeing Transp., Land 42 346 390 443 393 $3,554,895 $3,0154871
Scenic, Sightseeing Transp., Water 136 346 341 373 353 $3,966,974 $3,7464872
Scenic, Sightseeing Transp., Other 13 70 75 93 79 $1,101,777 $4,6494879
Support Activities 219 2,243 2,374 2,322 2,313 $30,817,111 $4,441488
Support Activities, Air Transp. 82 1,247 1,250 1,222 1,240 $13,066,423 $3,5124881
Support Activities, Rail Transp. 24882
Support Activities, Water Transp. 62 513 623 603 580 $12,175,951 $6,9984883
Support Activities, Road Transp. 37 184 197 200 194 $1,810,899 $3,1124884
Freight Transportation Arrangement 30 285 287 283 285 $3,617,125 $4,2314885
Other Support Activities, Transp. 64889
Page 4 of 701/ Oil Gas industry employment includes oil and gas exploration and oilfield services, or North American Industrial Classification System (NAICS) codes 211, 213111, 213112Quarterly Census of Employment Wages (QCEW): January - March 2020Data are preliminary and subject to revisionBlanks in the Employment, Total Earnings and Average Monthly Earnings columns due to confidentiality; data are suppressedSource: Alaska Department of Labor and Workforce Development, Research and Analysis Section

Alaska
Industrial Classification# of
UnitsJan
EmpFeb
EmpMar
EmpAverage
Monthly EmpTotal
EarningsAverage
Monthly Wage
SERVICE-PROVIDING 16,753 196,159 197,764 197,228 197,050 $2,499,260,121 $4,228
TRADE, TRANSPORTATION AND UTILITIES 4,306 60,537 60,566 60,541 60,548 $777,946,442 $4,283
Transportation and Warehousing 1,175 17,641 17,972 17,948 17,854 $342,108,115 $6,387
Postal Service 21491
Postal Service 214911
Couriers and Messengers 62 2,523 2,547 2,545 2,538 $80,382,627 $10,557492
Couriers, Messengers 46 2,433 2,456 2,447 2,445 $79,564,767 $10,8474921
Local Messengers, Local Delivery 16 90 91 98 93 $817,860 $2,9314922
Warehousing and Storage 30 508 507 513 509 $7,037,915 $4,609493
Warehousing and Storage 30 508 507 513 509 $7,037,915 $4,6094931
Utilities 106 2,218 2,226 2,212 2,219 $53,129,972 $7,981
Utilities 106 2,218 2,226 2,212 2,219 $53,129,972 $7,981221
Power Generation, etc. 71 1,636 1,636 1,640 1,637 $37,285,429 $7,5922211
Natural Gas Distribution 9 266 271 269 269 $9,248,634 $11,4612212
Water, Sewage and Other Systems 26 316 319 303 313 $6,595,909 $7,0242213
INFORMATION 385 5,155 5,116 5,048 5,106 $89,523,914 $5,844
Publishing, except Internet 65 359 356 359 358 $4,187,649 $3,899511
Newspapers, Periodicals, etc. 33 326 322 325 324 $3,226,422 $3,3195111
Software Publishers 32 33 34 34 34 $961,227 $9,4245112
Motion Picture and Sound Recording 37 490 475 419 461 $2,376,966 $1,719512
Motion Picture, Video 37 490 475 419 461 $2,376,966 $1,7195121
Broadcasting, except Internet 52 630 631 623 628 $8,167,477 $4,335515
Radio, Television Broadcasting 515151
Other Subscription Programming 15152
Telecommunications 148 3,495 3,461 3,464 3,473 $71,855,101 $6,897517
Telecommunications Resellers 122 3,181 3,152 3,145 3,159 $64,168,672 $6,7715173
Satellite Telecommunications 7 17 18 19 18 $496,800 $9,2005174
Other Telecommunications 19 297 291 300 296 $7,189,629 $8,0965179
ISPs, Data Processing 49 77 82 78 79 $1,208,155 $5,098518
Data Processing Hosting, etc. 49 77 82 78 79 $1,208,155 $5,0985182
Other Information Services 34 104 111 105 107 $1,728,566 $5,385519
FINANCIAL ACTIVITIES 1,457 11,925 11,951 11,902 11,926 $200,778,190 $5,612
Finance and Insurance 746 6,553 6,595 6,554 6,567 $133,362,946 $6,769
Credit Intermediation, etc. 330 4,439 4,467 4,438 4,448 $83,455,424 $6,254522
Depository Credit Intermediation 234 3,969 3,996 3,981 3,982 $74,101,366 $6,2035221
Credit Intermediation 71 390 392 383 388 $7,945,047 $6,8265222
Related Activities to Credit Int. 25 80 79 74 78 $1,409,011 $6,0215223
Securities, Investments 104 471 475 459 468 $19,430,868 $13,840523
Securities, Contracts Brokerage 25 240 244 229 238 $11,481,814 $16,0815231
Other Financial Investments 79 231 231 230 231 $7,949,054 $11,4705239
Insurance Carriers 298 1,620 1,632 1,634 1,629 $29,851,937 $6,108524
Insurance Carriers 65 580 586 588 585 $12,133,855 $6,9145241
Agencies, Brokerages, etc. 233 1,040 1,046 1,046 1,044 $17,718,082 $5,6575242
Funds, Trusts, etc. 14 23 21 23 22 $624,717 $9,465525
Insurance, Employee Benefit Funds 4 17 16 17 17 $491,380 $9,6355251
Other Investment Pools, Funds 10 6 5 6 6 $133,337 $7,4085259
Real Estate, Rental and Leasing 711 5,372 5,356 5,348 5,359 $67,415,244 $4,193
Real Estate 566 4,021 4,016 3,995 4,011 $49,833,337 $4,141531
Lessors of Real Estate 267 1,624 1,615 1,612 1,617 $18,798,675 $3,8755311
Offices of Agents, Brokers 166 1,595 1,598 1,592 1,595 $21,110,513 $4,4125312
Activities Related to Real Estate 133 802 803 791 799 $9,924,149 $4,1405313
Rental and Leasing Svcs. 143532
Automotive Equip. Rental, Leasing 63 749 743 750 747 $8,322,318 $3,7145321
Consumer Goods Rental 29 171 162 162 165 $1,628,331 $3,2905322
General Rental Centers 85323
Commercial, Industrial Machine 43 371 376 381 376 $7,002,172 $6,2085324
Lessors of Intangible Assets 2533
Lessors of Intangible Assets 25331
PROFESSIONAL AND BUSINESS SERVICES 3,535 26,829 27,286 27,334 27,150 $446,911,806 $5,487
Professional, Scientific, Tech. 2,201 13,033 13,167 13,188 13,129 $237,036,869 $6,018
Professional, Scientific, Tech. 2,201 13,033 13,167 13,188 13,129 $237,036,869 $6,018541
Legal Svcs. 284 1,148 1,147 1,147 1,147 $17,021,186 $4,9475411
Page 5 of 701/ Oil Gas industry employment includes oil and gas exploration and oilfield services, or North American Industrial Classification System (NAICS) codes 211, 213111, 213112Quarterly Census of Employment Wages (QCEW): January - March 2020Data are preliminary and subject to revisionBlanks in the Employment, Total Earnings and Average Monthly Earnings columns due to confidentiality; data are suppressedSource: Alaska Department of Labor and Workforce Development, Research and Analysis Section

Alaska
Industrial Classification# of
UnitsJan
EmpFeb
EmpMar
EmpAverage
Monthly EmpTotal
EarningsAverage
Monthly Wage
SERVICE-PROVIDING 16,753 196,159 197,764 197,228 197,050 $2,499,260,121 $4,228
PROFESSIONAL AND BUSINESS SERVICES 3,535 26,829 27,286 27,334 27,150 $446,911,806 $5,487
Professional, Scientific, Tech. 2,201 13,033 13,167 13,188 13,129 $237,036,869 $6,018
Professional, Scientific, Tech. 2,201 13,033 13,167 13,188 13,129 $237,036,869 $6,018541
Accounting, Tax Preparation, etc. 339 1,408 1,466 1,485 1,453 $17,707,685 $4,0625412
Architectural, Engineering 475 4,747 4,715 4,654 4,705 $96,498,205 $6,8375413
Specialized Design Svcs. 22 60 60 62 61 $591,478 $3,2325414
Computer Systems Design, etc. 381 1,407 1,436 1,491 1,445 $28,598,257 $6,5975415
Mgmt, Scientific, Tech Consulting 364 1,962 2,055 2,086 2,034 $47,164,157 $7,7295416
Scientific Research, Development 72 492 493 499 495 $7,329,467 $4,9365417
Advertising, etc. 75 471 446 450 456 $4,010,153 $2,9315418
Other Professional, Scientific 189 1,338 1,349 1,314 1,334 $18,116,281 $4,5275419
Mgmt. of Companies & Enterprises 161 2,662 2,729 2,707 2,699 $67,135,634 $8,291
Mgmt. of Companies and Enterprises 161 2,662 2,729 2,707 2,699 $67,135,634 $8,291551
Mgmt. of Companies and Enterprises 161 2,662 2,729 2,707 2,699 $67,135,634 $8,2915511
Administrative and Waste Services 1,173 11,134 11,390 11,439 11,321 $142,739,303 $4,203
Administrative and Support Services 1,007 9,639 9,832 9,908 9,793 $113,643,062 $3,868561
Office Administrative Svcs. 94 880 923 919 907 $19,889,438 $7,3105611
Facilities Support Svcs. 60 1,730 1,745 1,743 1,739 $25,728,491 $4,9325612
Employment Svcs. 107 887 883 878 883 $11,887,779 $4,4885613
Business Support Svcs. 88 650 652 637 646 $9,592,958 $4,9505614
Travel, Reservation Arrangements 80 474 486 501 487 $5,510,251 $3,7725615
Investigation, Security 94 1,822 1,837 1,899 1,853 $20,497,288 $3,6875616
Buildings, Dwellings 443 2,964 3,080 3,082 3,042 $18,257,735 $2,0015617
Other Support Svcs. 41 232 226 249 236 $2,279,121 $3,2195619
Waste Management/Remediation 166 1,495 1,558 1,531 1,528 $29,096,241 $6,347562
Waste Collection 39 490 488 490 489 $7,526,719 $5,1315621
Waste Treatment, Disposal 9 52 53 53 53 $716,687 $4,5075622
Remediation, Waste Mgmt. Svcs. 118 953 1,017 988 986 $20,852,835 $7,0505629
EDUCATIONAL AND HEALTH SERVICES 2,630 50,461 50,639 50,513 50,538 $694,766,885 $4,582
Educational Services 339 2,367 2,518 2,460 2,448 $22,157,325 $3,017
Educational Services 339 2,367 2,518 2,460 2,448 $22,157,325 $3,017611
Elementary, Secondary Schools 21 241 247 247 245 $1,908,351 $2,5966111
Junior Colleges 36112
Colleges, Universities 50 399 444 434 426 $3,698,699 $2,8946113
Business Schools, Mgmt. Training 206114
Technical, Trade Schools 60 446 453 473 457 $7,812,914 $5,6996115
Other Schools Instruction 143 851 921 860 877 $3,728,174 $1,4176116
Educational Support Svcs. 42 236 239 230 235 $2,602,455 $3,6916117
Health Care and Social Assistance 2,291 48,094 48,121 48,053 48,089 $672,609,560 $4,662
Out Patient Health Care 1,443 22,157 22,095 22,092 22,115 $340,020,724 $5,125621
Offices of Physicians 416 8,739 8,749 8,790 8,759 $165,834,803 $6,3116211
Office of Dentists 292 2,426 2,380 2,292 2,366 $28,887,671 $4,0706212
Other Health Practioners, Offices 436 3,178 3,187 3,129 3,165 $34,603,782 $3,6446213
Outpatient Care Centers 137 4,822 4,814 4,920 4,852 $81,861,043 $5,6246214
Medical, Diagnostic Laboratories 35 316 327 329 324 $4,681,924 $4,8176215
Home Health Care Svcs. 76 2,132 2,083 2,084 2,100 $13,007,246 $2,0656216
Other Ambulatory Health Care 51 544 555 548 549 $11,144,255 $6,7666219
Hospitals 23 12,928 12,962 13,017 12,969 $230,167,816 $5,916622
General Medical, Surgical Hosp. 17 12,341 12,370 12,434 12,382 $222,899,462 $6,0016221
Psychiatric, Substance Abuse Hosp. 46222
Specialty Hospitals 26223
Nursing and Residential Care 289 4,066 4,068 4,063 4,066 $31,903,250 $2,615623
Nursing Care Facilities 7 294 309 321 308 $3,301,207 $3,5736231
Res., Mental Retardation, etc. 69 1,596 1,602 1,588 1,595 $13,468,621 $2,8156232
Elderly Community Care 179 1,358 1,329 1,328 1,338 $9,362,049 $2,3326233
Other Residential Care 34 818 828 826 824 $5,771,373 $2,3356239
Social Assistance 536 8,943 8,996 8,881 8,940 $70,517,770 $2,629624
Individual, Family Svcs. 279 4,699 4,736 4,713 4,716 $40,140,913 $2,8376241
Food, Housing, Emergency Relief 73 1,011 1,025 1,013 1,016 $9,256,311 $3,0376242
Vocational Rehabilitation 34 1,350 1,341 1,337 1,343 $9,979,923 $2,4776243
Child Day Care 150 1,883 1,894 1,818 1,865 $11,140,623 $1,9916244
Page 6 of 701/ Oil Gas industry employment includes oil and gas exploration and oilfield services, or North American Industrial Classification System (NAICS) codes 211, 213111, 213112Quarterly Census of Employment Wages (QCEW): January - March 2020Data are preliminary and subject to revisionBlanks in the Employment, Total Earnings and Average Monthly Earnings columns due to confidentiality; data are suppressedSource: Alaska Department of Labor and Workforce Development, Research and Analysis Section

Alaska
Industrial Classification# of
UnitsJan
EmpFeb
EmpMar
EmpAverage
Monthly EmpTotal
EarningsAverage
Monthly Wage
SERVICE-PROVIDING 16,753 196,159 197,764 197,228 197,050 $2,499,260,121 $4,228
LEISURE AND HOSPITALITY 2,679 30,332 31,219 30,932 30,828 $182,720,925 $1,976
Arts, Entertainment and Recreation 599 4,072 4,318 4,292 4,227 $21,702,887 $1,711
Performing Arts 89 666 737 725 709 $3,404,488 $1,601711
Performing Arts Companies 29 121 148 139 136 $946,319 $2,3197111
Spectator Sports 30 387 401 409 399 $1,010,975 $8457112
Promoters, Sports Events 16 127 149 146 141 $1,016,408 $2,4037113
Agents, Managers 27114
Artists, Writers, Performers 127115
Museums, Zoos, Parks, etc. 43 293 310 297 300 $3,200,018 $3,556712
Museums, Zoos, Parks, etc. 43 293 310 297 300 $3,200,018 $3,5567121
Amusements, Gambling, Recreation 467 3,113 3,271 3,270 3,218 $15,098,381 $1,564713
Amusement Parks, Arcades 4 82 81 88 84 $847,655 $3,3647131
Gambling Industries 61 532 533 513 526 $2,820,416 $1,7877132
Other Amusement, Recreation 402 2,499 2,657 2,669 2,608 $11,430,310 $1,4617139
Accommodation and Food Services 2,080 26,260 26,901 26,640 26,600 $161,018,038 $2,018
Accommodation 601 6,645 6,843 6,900 6,796 $51,302,489 $2,516721
Traveler Accommodation 394 6,185 6,339 6,399 6,308 $45,884,950 $2,4257211
RV Parks and Recreational Camps 195 277 312 306 298 $2,468,322 $2,7617212
Rooming, Boarding Houses 12 183 192 195 190 $2,949,217 $5,1747213
Food Services and Drinking Places 1,479 19,615 20,058 19,740 19,804 $109,715,549 $1,847722
Special Food Svcs. 137 1,683 1,873 1,849 1,802 $15,372,933 $2,8447223
Drinking Places, Alcoholic 147 1,207 1,221 1,166 1,198 $5,608,664 $1,5617224
Restaurants and other eating places 1,195 16,725 16,964 16,725 16,805 $88,733,951 $1,7607225
OTHER SERVICES 1,723 10,880 10,959 10,929 10,923 $106,362,152 $3,246
Repair and Maintenance 496 2,746 2,792 2,807 2,782 $35,881,710 $4,299811
Automotive Repair, Maintaince 309 1,791 1,810 1,825 1,809 $19,313,889 $3,5598111
Electronic, Precision Repair, etc. 32 151 158 156 155 $2,022,185 $4,3498112
Commercial, Machine Repair, etc. 89 562 573 577 571 $12,146,738 $7,0918113
Personal, Household Repairs, etc. 66 242 251 249 247 $2,398,898 $3,2378114
Personal and Laundry 336 2,106 2,112 2,078 2,099 $13,411,232 $2,130812
Personal Care Svcs. 195 1,177 1,185 1,149 1,170 $7,155,427 $2,0398121
Death Care Svcs. 19 79 82 81 81 $765,712 $3,1518122
Drycleaning, Laundry 37 365 362 368 365 $2,764,410 $2,5258123
Other Personal Svcs. 85 485 483 480 483 $2,725,683 $1,8818129
Membership Organizations, etc. 738 5,863 5,886 5,872 5,874 $55,941,202 $3,175813
Religious Organizations 120 1,770 1,766 1,749 1,762 $5,935,383 $1,1238131
Grantmaking, Giving Svcs. 60 330 346 342 339 $5,230,374 $5,1438132
Social Advocacy Organizations 167 1,215 1,221 1,214 1,217 $14,799,899 $4,0548133
Civic, Social Organizations 166 1,619 1,636 1,637 1,631 $14,367,455 $2,9368134
Business, Professional, Labor 225 929 917 930 925 $15,608,091 $5,6258139
Private Households 153 165 169 172 169 $1,128,007 $2,225814
Private Households 153 165 169 172 169 $1,128,007 $2,2258141
UNCLASSIFIED ESTABLISHMENTS 38 40 28 29 32 $249,808 $2,602
Page 7 of 701/ Oil Gas industry employment includes oil and gas exploration and oilfield services, or North American Industrial Classification System (NAICS) codes 211, 213111, 213112Quarterly Census of Employment Wages (QCEW): January - March 2020Data are preliminary and subject to revisionBlanks in the Employment, Total Earnings and Average Monthly Earnings columns due to confidentiality; data are suppressedSource: Alaska Department of Labor and Workforce Development, Research and Analysis Section

Aleutians East Borough
Industrial Classification# of
UnitsJan
EmpFeb
EmpMar
EmpAverage
Monthly EmpTotal
EarningsAverage
Monthly Wage
TOTAL INDUSTRIES 102 2,088 3,028 2,702 2,606 $37,566,829 $4,805
TOTAL GOVERNMENT 40 293 305 316 304 $2,724,783 $2,988
FEDERAL GOVERNMENT 8 13 14 16 14 $213,899 $5,093
STATE GOVERNMENT 13 13 12 14 13 $160,341 $4,111
LOCAL GOVERNMENT 19 267 279 286 277 $2,350,543 $2,829
PRIVATE OWNERSHIP 62 1,795 2,723 2,386 2,301 $34,842,046 $5,047
GOODS-PRODUCING 11 1,608 2,537 2,203 2,116 $33,097,772 $5,214
NATURAL RESOURCES AND MINING 2
Agriculture, Forestry, Fishing, Hunting 2
Fishing, Hunting, Trapping 2114
CONSTRUCTION 1
Heavy Construction 1237
MANUFACTURING 8 1,608 2,537 2,203 2,116 $33,097,772 $5,214
Food 8 1,608 2,537 2,203 2,116 $33,097,772 $5,214311
SERVICE-PROVIDING 51 187 186 183 185 $1,744,274 $3,143
TRADE, TRANSPORTATION AND UTILITIES 22 71 69 72 71 $525,327 $2,466
Wholesale Trade 1
Wholesale, Nondurable Goods 1424
Retail Trade 7 53 51 54 53 $283,208 $1,781
Food and Beverages 1445
Sporting Goods, Books, Music, etc. 1451
General Merchandise 3452
Nonstore Retailers 2454
Transportation and Warehousing 11 6 8 8 7 $146,986 $6,999
Air Transportation 1481
Water Transportation 8483
Truck Transportation 2484
Utilities 3
Utilities 3221
INFORMATION 3 11 11 11 11 $41,261 $1,250
Broadcasting, except Internet 1515
Telecommunications 2517
FINANCIAL ACTIVITIES 1
Real Estate, Rental and Leasing 1
Real Estate 1531
PROFESSIONAL AND BUSINESS SERVICES 3
Professional, Scientific, Tech. 1
Professional, Scientific, Tech. 1541
Mgmt. of Companies & Enterprises 2
Mgmt. of Companies and Enterprises 2551
EDUCATIONAL AND HEALTH SERVICES 12
Health Care and Social Assistance 12
Out Patient Health Care 7621
Social Assistance 5624
LEISURE AND HOSPITALITY 9 22 24 23 23 $104,882 $1,520
Arts, Entertainment and Recreation 3
Amusements, Gambling, Recreation 3713
Accommodation and Food Services 6
Accommodation 2721
Food Services and Drinking Places 4722
OTHER SERVICES 1
Membership Organizations, etc. 1813
Page 8 of 701/ Oil Gas industry employment includes oil and gas exploration and oilfield services, or North American Industrial Classification System (NAICS) codes 211, 213111, 213112Quarterly Census of Employment Wages (QCEW): January - March 2020Data are preliminary and subject to revisionBlanks in the Employment, Total Earnings and Average Monthly Earnings columns due to confidentiality; data are suppressedSource: Alaska Department of Labor and Workforce Development, Research and Analysis Section

Aleutians West Census Area
Industrial Classification# of
UnitsJan
EmpFeb
EmpMar
EmpAverage
Monthly EmpTotal
EarningsAverage
Monthly Wage
TOTAL INDUSTRIES 173 3,689 4,754 4,604 4,349 $66,247,223 $5,078
TOTAL GOVERNMENT 38 565 588 592 582 $6,942,041 $3,976
FEDERAL GOVERNMENT 6 12 13 12 12 $209,119 $5,809
STATE GOVERNMENT 18 25 24 25 25 $450,662 $6,009
LOCAL GOVERNMENT 14 528 551 555 545 $6,282,260 $3,842
PRIVATE OWNERSHIP 135 3,124 4,166 4,012 3,767 $59,305,182 $5,248
GOODS-PRODUCING 29 2,069 2,927 2,755 2,584 $37,293,156 $4,811
NATURAL RESOURCES AND MINING 8 29 32 30 30 $655,988 $7,289
Agriculture, Forestry, Fishing, Hunting 6
Animal Production 1112
Fishing, Hunting, Trapping 5 16 16 16 16 $448,629 $9,346114
Mining 2
Mining, except Oil and Gas 2212
CONSTRUCTION 8 38 35 38 37 $874,270 $7,876
Construction of Buildings 1236
Heavy Construction 3237
Specialty Trade Contractors 4238
MANUFACTURING 13 2,002 2,860 2,687 2,516 $35,762,898 $4,738
Food 12311
Transportation Equipment 1336
SERVICE-PROVIDING 106 1,055 1,239 1,257 1,184 $22,012,026 $6,197
TRADE, TRANSPORTATION AND UTILITIES 47 654 833 863 783 $15,372,670 $6,544
Wholesale Trade 6 194 198 208 200 $2,940,206 $4,900
Wholesale, Durable Goods 2423
Wholesale, Nondurable Goods 4424
Retail Trade 16
Motor Vehicle and Parts Dealers 2441
Food and Beverages 3445
Gasoline Stations 2447
Sporting Goods, Books, Music, etc. 2451
General Merchandise 3452
Miscellaneous 1453
Nonstore Retailers 3454
Transportation and Warehousing 24 322 493 520 445 $10,629,947 $7,963
Air Transportation 3481
Water Transportation 6 171 240 263 225 $5,604,473 $8,303483
Truck Transportation 2484
Transit and Ground Passenger 1485
Support Activities 9 109 208 212 176 $4,084,095 $7,735488
Warehousing and Storage 3 12 13 13 13 $452,799 $11,610493
Utilities 1
Utilities 1221
INFORMATION 5 25 28 28 27 $382,987 $4,728
Broadcasting, except Internet 1515
Telecommunications 4517
FINANCIAL ACTIVITIES 6 41 40 39 40 $763,389 $6,362
Finance and Insurance 2
Credit Intermediation, etc. 1522
Securities, Investments 1523
Real Estate, Rental and Leasing 4
Real Estate 2531
Rental and Leasing Svcs. 2532
PROFESSIONAL AND BUSINESS SERVICES 17 158 162 150 157 $2,995,333 $6,360
Page 9 of 701/ Oil Gas industry employment includes oil and gas exploration and oilfield services, or North American Industrial Classification System (NAICS) codes 211, 213111, 213112Quarterly Census of Employment Wages (QCEW): January - March 2020Data are preliminary and subject to revisionBlanks in the Employment, Total Earnings and Average Monthly Earnings columns due to confidentiality; data are suppressedSource: Alaska Department of Labor and Workforce Development, Research and Analysis Section

Aleutians West Census Area
Industrial Classification# of
UnitsJan
EmpFeb
EmpMar
EmpAverage
Monthly EmpTotal
EarningsAverage
Monthly Wage
SERVICE-PROVIDING 106 1,055 1,239 1,257 1,184 $22,012,026 $6,197
PROFESSIONAL AND BUSINESS SERVICES 17 158 162 150 157 $2,995,333 $6,360
Professional, Scientific, Tech. 8 28 27 20 25 $332,036 $4,427
Professional, Scientific, Tech. 8 28 27 20 25 $332,036 $4,427541
Mgmt. of Companies & Enterprises 2
Mgmt. of Companies and Enterprises 2551
Administrative and Waste Services 7
Administrative and Support Services 5561
Waste Management/Remediation 2562
EDUCATIONAL AND HEALTH SERVICES 14 103 98 105 102 $1,588,713 $5,192
Health Care and Social Assistance 14 103 98 105 102 $1,588,713 $5,192
Out Patient Health Care 10 88 83 90 87 $1,383,217 $5,300621
Social Assistance 4 15 15 15 15 $205,496 $4,567624
LEISURE AND HOSPITALITY 6 31 34 35 33 $315,246 $3,184
Arts, Entertainment and Recreation 1
Museums, Zoos, Parks, etc. 1712
Accommodation and Food Services 5
Food Services and Drinking Places 5722
OTHER SERVICES 11 43 44 37 41 $593,689 $4,827
Repair and Maintenance 4 12 12 14 13 $263,152 $6,747811
Membership Organizations, etc. 7 31 32 23 29 $330,537 $3,799813
Page 10 of 701/ Oil Gas industry employment includes oil and gas exploration and oilfield services, or North American Industrial Classification System (NAICS) codes 211, 213111, 213112Quarterly Census of Employment Wages (QCEW): January - March 2020Data are preliminary and subject to revisionBlanks in the Employment, Total Earnings and Average Monthly Earnings columns due to confidentiality; data are suppressedSource: Alaska Department of Labor and Workforce Development, Research and Analysis Section

Anchorage Municipality
Industrial Classification# of
UnitsJan
EmpFeb
EmpMar
EmpAverage
Monthly EmpTotal
EarningsAverage
Monthly Wage
TOTAL INDUSTRIES 8,257 145,813 146,795 146,188 146,265 $2,229,009,936 $5,080
TOTAL GOVERNMENT 203 28,125 28,344 28,198 28,222 $461,664,434 $5,453
FEDERAL GOVERNMENT 104 8,404 8,365 8,404 8,391 $168,444,781 $6,691
STATE GOVERNMENT 86 9,497 9,684 9,677 9,619 $140,836,699 $4,881
LOCAL GOVERNMENT 13 10,224 10,295 10,117 10,212 $152,382,954 $4,974
PRIVATE OWNERSHIP 8,054 117,688 118,451 117,990 118,043 $1,767,345,501 $4,991
GOODS-PRODUCING 1,170 10,501 10,650 10,815 10,655 $311,067,104 $9,731
NATURAL RESOURCES AND MINING 99 2,538 2,616 2,721 2,625 $168,139,381 $21,351
Agriculture, Forestry, Fishing, Hunting 24 200 218 261 226 $1,774,774 $2,618
Crop Production 15 189 210 219 206 $1,293,157 $2,092111
Animal Production 1112
Fishing, Hunting, Trapping 7114
Agriculture, Forestry Support 1115
Mining 75 2,338 2,398 2,460 2,399 $166,364,607 $23,116
Oil and Gas Extraction 17 1,482 1,487 1,507 1,492 $135,837,882 $30,348211
Mining, except Oil and Gas 13 42 47 90 60 $1,345,800 $7,477212
Mining Support Activities 45 814 864 863 847 $29,180,925 $11,484213
CONSTRUCTION 887 6,182 6,226 6,287 6,232 $120,818,143 $6,462
Construction of Buildings 262 1,964 1,933 1,966 1,954 $39,746,265 $6,780236
Heavy Construction 89 1,207 1,245 1,271 1,241 $31,391,047 $8,432237
Specialty Trade Contractors 536 3,011 3,048 3,050 3,036 $49,680,831 $5,455238
MANUFACTURING 184 1,781 1,808 1,807 1,799 $22,109,580 $4,097
Food 37 543 572 561 559 $5,117,527 $3,052311
Beverage and Tobacco Products 16 127 123 124 125 $865,900 $2,309312
Textile Products 2314
Apparel 3315
Wood Products 7321
Printing and Support Activities 28 203 200 197 200 $1,985,467 $3,309323
Petroleum and Coal Products 2324
Chemicals 4 16 16 17 16 $161,577 $3,366325
Plastics and Rubber Products 2326
Nonmetallic Mineral Products 11 82 86 91 86 $1,793,700 $6,952327
Primary Metals 2331
Fabricated Metal Products 18 191 190 195 192 $2,836,921 $4,925332
Machinery 2333
Computer and Electronic Products 6334
Electrical Equip. and Appliances 1335
Transportation Equipment 14 154 157 157 156 $1,912,930 $4,087336
Furniture and Related Products 7 54 52 54 53 $648,714 $4,080337
Miscellaneous 22 133 127 125 128 $1,399,117 $3,644339
SERVICE-PROVIDING 6,884 107,187 107,801 107,175 107,388 $1,456,278,397 $4,520
TRADE, TRANSPORTATION AND UTILITIES 1,503 31,308 31,296 31,088 31,231 $448,730,496 $4,789
Wholesale Trade 418 4,792 4,805 4,808 4,802 $74,400,036 $5,165
Wholesale, Durable Goods 246 1,993 1,992 1,965 1,983 $36,184,520 $6,082423
Wholesale, Nondurable Goods 118 2,606 2,611 2,642 2,620 $34,706,190 $4,416424
Wholesale, Electronic Markets 54 193 202 201 199 $3,509,325 $5,878425
Retail Trade 776 15,955 15,845 15,745 15,848 $139,410,752 $2,932
Motor Vehicle and Parts Dealers 89 2,097 2,099 2,094 2,097 $27,840,918 $4,426441
Furniture and Home Furnishings 39 494 487 471 484 $4,158,387 $2,864442
Electronics and Appliances 35 462 450 449 454 $4,560,594 $3,348443
Building Material and Garden 47 1,759 1,737 1,770 1,755 $20,268,206 $3,850444
Food and Beverages 80 2,051 2,058 2,062 2,057 $15,650,356 $2,536445
Health and Personal Care 63 564 541 541 549 $5,441,210 $3,304446
Gasoline Stations 57 525 537 524 529 $3,847,051 $2,424447
Page 11 of 701/ Oil Gas industry employment includes oil and gas exploration and oilfield services, or North American Industrial Classification System (NAICS) codes 211, 213111, 213112Quarterly Census of Employment Wages (QCEW): January - March 2020Data are preliminary and subject to revisionBlanks in the Employment, Total Earnings and Average Monthly Earnings columns due to confidentiality; data are suppressedSource: Alaska Department of Labor and Workforce Development, Research and Analysis Section

Anchorage Municipality
Industrial Classification# of
UnitsJan
EmpFeb
EmpMar
EmpAverage
Monthly EmpTotal
EarningsAverage
Monthly Wage
SERVICE-PROVIDING 6,884 107,187 107,801 107,175 107,388 $1,456,278,397 $4,520
TRADE, TRANSPORTATION AND UTILITIES 1,503 31,308 31,296 31,088 31,231 $448,730,496 $4,789
Retail Trade 776 15,955 15,845 15,745 15,848 $139,410,752 $2,932
Clothing and Clothing Accessories 94 1,185 1,139 1,084 1,136 $5,564,061 $1,633448
Sporting Goods, Books, Music, etc. 72 1,078 1,057 1,044 1,060 $5,554,673 $1,747451
General Merchandise 29 4,098 4,101 4,087 4,095 $31,736,887 $2,583452
Miscellaneous 143 1,352 1,354 1,330 1,345 $9,267,864 $2,297453
Nonstore Retailers 28 290 285 289 288 $5,520,545 $6,390454
Transportation and Warehousing 291 9,918 9,994 9,887 9,933 $216,051,844 $7,250
Air Transportation 42 3,077 3,074 3,105 3,085 $65,997,871 $7,131481
Water Transportation 13 299 306 298 301 $7,919,943 $8,771483
Truck Transportation 72 1,261 1,269 1,279 1,270 $18,191,494 $4,775484
Transit and Ground Passenger 22 575 585 419 526 $4,163,953 $2,639485
Pipeline 1486
Scenic and Sightseeing 17 114 128 155 132 $1,725,056 $4,356487
Support Activities 90 1,536 1,546 1,524 1,535 $18,000,789 $3,909488
Postal Service 1491
Couriers and Messengers 18 2,249 2,280 2,291 2,273 $77,191,645 $11,320492
Warehousing and Storage 15 449 448 455 451 $5,778,023 $4,271493
Utilities 18 643 652 648 648 $18,867,865 $9,706
Utilities 18 643 652 648 648 $18,867,865 $9,706221
INFORMATION 131 3,081 3,055 2,992 3,043 $59,765,330 $6,547
Publishing, except Internet 21 121 123 124 123 $1,702,275 $4,613511
Motion Picture and Sound Recording 14 184 186 130 167 $929,886 $1,856512
Broadcasting, except Internet 15 358 347 342 349 $5,500,943 $5,254515
Telecommunications 46 2,330 2,305 2,306 2,314 $50,407,485 $7,261517
ISPs, Data Processing 23 57 63 60 60 $709,216 $3,940518
Other Information Services 12 31 31 30 31 $515,525 $5,543519
FINANCIAL ACTIVITIES 676 7,459 7,497 7,460 7,472 $135,924,726 $6,064
Finance and Insurance 364 4,387 4,428 4,394 4,403 $98,606,273 $7,465
Credit Intermediation, etc. 139 2,902 2,925 2,910 2,912 $58,497,172 $6,696522
Securities, Investments 58 342 346 331 340 $15,751,482 $15,443523
Insurance Carriers 162 1,130 1,146 1,142 1,139 $24,016,671 $7,029524
Funds, Trusts, etc. 5 13 11 11 12 $340,948 $9,471525
Real Estate, Rental and Leasing 312 3,072 3,069 3,066 3,069 $37,318,453 $4,053
Real Estate 248 2,286 2,291 2,280 2,286 $29,051,939 $4,236531
Rental and Leasing Svcs. 62532
Lessors of Intangible Assets 2533
PROFESSIONAL AND BUSINESS SERVICES 1,747 16,631 16,868 16,969 16,823 $287,417,808 $5,695
Professional, Scientific, Tech. 1,124 8,596 8,697 8,666 8,653 $168,409,936 $6,488
Professional, Scientific, Tech. 1,124 8,596 8,697 8,666 8,653 $168,409,936 $6,488541
Mgmt. of Companies & Enterprises 72 1,545 1,572 1,563 1,560 $41,983,436 $8,971
Mgmt. of Companies and Enterprises 72 1,545 1,572 1,563 1,560 $41,983,436 $8,971551
Administrative and Waste Services 551 6,490 6,599 6,740 6,610 $77,024,436 $3,884
Administrative and Support Services 490 5,818 5,919 6,043 5,927 $66,292,285 $3,728561
Waste Management/Remediation 61 672 680 697 683 $10,732,151 $5,238562
EDUCATIONAL AND HEALTH SERVICES 1,194 26,516 26,548 26,298 26,454 $369,955,337 $4,662
Educational Services 144 1,281 1,352 1,313 1,315 $11,851,512 $3,004
Educational Services 144 1,281 1,352 1,313 1,315 $11,851,512 $3,004611
Health Care and Social Assistance 1,050 25,235 25,196 24,985 25,139 $358,103,826 $4,748
Out Patient Health Care 670 11,418 11,375 11,245 11,346 $183,454,218 $5,390621
Hospitals 9 7,168 7,157 7,183 7,169 $123,368,806 $5,736622
Nursing and Residential Care 204 2,435 2,446 2,423 2,435 $18,862,231 $2,582623
Social Assistance 167 4,214 4,218 4,134 4,189 $32,418,571 $2,580624
LEISURE AND HOSPITALITY 877 16,838 17,186 17,027 17,017 $102,545,010 $2,009
Arts, Entertainment and Recreation 171 2,329 2,498 2,465 2,431 $12,915,465 $1,771
Performing Arts 32 387 467 439 431 $2,011,960 $1,556711
Museums, Zoos, Parks, etc. 11 186 187 180 184 $2,077,236 $3,763712
Amusements, Gambling, Recreation 128 1,756 1,844 1,846 1,815 $8,826,269 $1,621713
Accommodation and Food Services 706 14,509 14,688 14,562 14,586 $89,629,545 $2,048
Accommodation 104 3,413 3,447 3,458 3,439 $25,012,446 $2,424721
Page 12 of 701/ Oil Gas industry employment includes oil and gas exploration and oilfield services, or North American Industrial Classification System (NAICS) codes 211, 213111, 213112Quarterly Census of Employment Wages (QCEW): January - March 2020Data are preliminary and subject to revisionBlanks in the Employment, Total Earnings and Average Monthly Earnings columns due to confidentiality; data are suppressedSource: Alaska Department of Labor and Workforce Development, Research and Analysis Section

Anchorage Municipality
Industrial Classification# of
UnitsJan
EmpFeb
EmpMar
EmpAverage
Monthly EmpTotal
EarningsAverage
Monthly Wage
SERVICE-PROVIDING 6,884 107,187 107,801 107,175 107,388 $1,456,278,397 $4,520
LEISURE AND HOSPITALITY 877 16,838 17,186 17,027 17,017 $102,545,010 $2,009
Accommodation and Food Services 706 14,509 14,688 14,562 14,586 $89,629,545 $2,048
Food Services and Drinking Places 602 11,096 11,241 11,104 11,147 $64,617,099 $1,932722
OTHER SERVICES 740 5,326 5,337 5,325 5,329 $51,768,164 $3,238
Repair and Maintenance 201 1,390 1,409 1,413 1,404 $16,365,790 $3,886811
Personal and Laundry 168 1,297 1,313 1,294 1,301 $9,041,795 $2,317812
Membership Organizations, etc. 288 2,557 2,532 2,532 2,540 $25,743,309 $3,378813
Private Households 83 82 83 86 84 $617,270 $2,449814
UNCLASSIFIED ESTABLISHMENTS 16 28 14 16 19 $171,526 $3,009
Page 13 of 701/ Oil Gas industry employment includes oil and gas exploration and oilfield services, or North American Industrial Classification System (NAICS) codes 211, 213111, 213112Quarterly Census of Employment Wages (QCEW): January - March 2020Data are preliminary and subject to revisionBlanks in the Employment, Total Earnings and Average Monthly Earnings columns due to confidentiality; data are suppressedSource: Alaska Department of Labor and Workforce Development, Research and Analysis Section

Bethel Census Area
Industrial Classification# of
UnitsJan
EmpFeb
EmpMar
EmpAverage
Monthly EmpTotal
EarningsAverage
Monthly Wage
TOTAL INDUSTRIES 358 7,200 7,180 7,235 7,205 $84,814,022 $3,924
TOTAL GOVERNMENT 157 3,045 3,116 3,108 3,089 $30,042,069 $3,242
FEDERAL GOVERNMENT 27 87 92 97 92 $1,149,343 $4,164
STATE GOVERNMENT 56 302 306 305 304 $6,245,592 $6,848
LOCAL GOVERNMENT 74 2,656 2,718 2,706 2,693 $22,647,134 $2,803
PRIVATE OWNERSHIP 201 4,155 4,064 4,127 4,115 $54,771,953 $4,437
GOODS-PRODUCING 20 245 249 244 246 $5,782,083 $7,835
NATURAL RESOURCES AND MINING 1
Mining 1
Mining, except Oil and Gas 1212
CONSTRUCTION 15 68 71 67 69 $1,002,015 $4,841
Construction of Buildings 10 65 67 63 65 $977,528 $5,013236
Heavy Construction 4237
Specialty Trade Contractors 1238
MANUFACTURING 4
Food 2311
Fabricated Metal Products 1332
Transportation Equipment 1336
SERVICE-PROVIDING 181 3,910 3,815 3,883 3,869 $48,989,870 $4,221
TRADE, TRANSPORTATION AND UTILITIES 87 1,600 1,552 1,564 1,572 $13,318,338 $2,824
Wholesale Trade 5 57 50 42 50 $360,964 $2,406
Wholesale, Durable Goods 2423
Wholesale, Nondurable Goods 3424
Retail Trade 56 838 779 810 809 $4,116,808 $1,696
Motor Vehicle and Parts Dealers 4441
Furniture and Home Furnishings 1442
Building Material and Garden 1444
Food and Beverages 8 114 98 93 102 $421,984 $1,379445
Gasoline Stations 11 207 157 172 179 $663,611 $1,236447
General Merchandise 23 469 472 487 476 $2,201,280 $1,542452
Miscellaneous 2453
Nonstore Retailers 6454
Transportation and Warehousing 13 589 613 601 601 $8,080,336 $4,482
Air Transportation 9 580 603 594 592 $7,895,566 $4,446481
Truck Transportation 2484
Support Activities 1488
Couriers and Messengers 1492
Utilities 13 116 110 111 112 $760,230 $2,263
Utilities 13 116 110 111 112 $760,230 $2,263221
INFORMATION 4 54 55 56 55 $664,325 $4,026
Broadcasting, except Internet 1515
Telecommunications 3517
FINANCIAL ACTIVITIES 13 150 142 138 143 $1,673,250 $3,900
Finance and Insurance 5 26 26 25 26 $456,162 $5,848
Credit Intermediation, etc. 3522
Insurance Carriers 2524
Real Estate, Rental and Leasing 8 124 116 113 118 $1,217,088 $3,438
Real Estate 7531
Rental and Leasing Svcs. 1532
PROFESSIONAL AND BUSINESS SERVICES 18 112 104 100 105 $1,139,563 $3,618
Professional, Scientific, Tech. 8
Professional, Scientific, Tech. 8541
Mgmt. of Companies & Enterprises 2
Page 14 of 701/ Oil Gas industry employment includes oil and gas exploration and oilfield services, or North American Industrial Classification System (NAICS) codes 211, 213111, 213112Quarterly Census of Employment Wages (QCEW): January - March 2020Data are preliminary and subject to revisionBlanks in the Employment, Total Earnings and Average Monthly Earnings columns due to confidentiality; data are suppressedSource: Alaska Department of Labor and Workforce Development, Research and Analysis Section

Bethel Census Area
Industrial Classification# of
UnitsJan
EmpFeb
EmpMar
EmpAverage
Monthly EmpTotal
EarningsAverage
Monthly Wage
SERVICE-PROVIDING 181 3,910 3,815 3,883 3,869 $48,989,870 $4,221
PROFESSIONAL AND BUSINESS SERVICES 18 112 104 100 105 $1,139,563 $3,618
Mgmt. of Companies & Enterprises 2
Mgmt. of Companies and Enterprises 2551
Administrative and Waste Services 8 75 66 64 68 $421,450 $2,066
Administrative and Support Services 8 75 66 64 68 $421,450 $2,066561
EDUCATIONAL AND HEALTH SERVICES 12
Educational Services 3
Educational Services 3611
Health Care and Social Assistance 9
Out Patient Health Care 7621
Social Assistance 2624
LEISURE AND HOSPITALITY 26
Arts, Entertainment and Recreation 8 58 57 60 58 $255,980 $1,471
Performing Arts 1711
Amusements, Gambling, Recreation 7713
Accommodation and Food Services 18
Accommodation 9721
Food Services and Drinking Places 9 17 17 23 19 $95,593 $1,677722
OTHER SERVICES 21 539 561 558 553 $7,557,300 $4,555
Repair and Maintenance 5811
Membership Organizations, etc. 15 530 553 552 545 $7,496,646 $4,585813
Private Households 1814
Page 15 of 701/ Oil Gas industry employment includes oil and gas exploration and oilfield services, or North American Industrial Classification System (NAICS) codes 211, 213111, 213112Quarterly Census of Employment Wages (QCEW): January - March 2020Data are preliminary and subject to revisionBlanks in the Employment, Total Earnings and Average Monthly Earnings columns due to confidentiality; data are suppressedSource: Alaska Department of Labor and Workforce Development, Research and Analysis Section

Bristol Bay Borough
Industrial Classification# of
UnitsJan
EmpFeb
EmpMar
EmpAverage
Monthly EmpTotal
EarningsAverage
Monthly Wage
TOTAL INDUSTRIES 132 510 544 505 520 $6,825,242 $4,375
TOTAL GOVERNMENT 25 198 204 194 198 $2,522,657 $4,247
FEDERAL GOVERNMENT 7 30 32 32 31 $612,164 $6,582
STATE GOVERNMENT 10 17 18 19 18 $340,019 $6,297
LOCAL GOVERNMENT 8 151 154 143 149 $1,570,474 $3,513
PRIVATE OWNERSHIP 107 312 340 311 321 $4,302,585 $4,468
GOODS-PRODUCING 27 88 110 82 93 $1,599,674 $5,734
NATURAL RESOURCES AND MINING 4
Agriculture, Forestry, Fishing, Hunting 3
Fishing, Hunting, Trapping 3114
Mining 1
Mining, except Oil and Gas 1212
CONSTRUCTION 11
Construction of Buildings 5236
Heavy Construction 4237
Specialty Trade Contractors 2238
MANUFACTURING 12 54 55 46 52 $879,199 $5,636
Food 11311
Textile Products 1314
SERVICE-PROVIDING 80 224 230 229 228 $2,702,911 $3,952
TRADE, TRANSPORTATION AND UTILITIES 32 95 89 95 93 $987,720 $3,540
Retail Trade 12 44 42 46 44 $329,391 $2,495
Motor Vehicle and Parts Dealers 2441
Food and Beverages 3445
Gasoline Stations 1447
Sporting Goods, Books, Music, etc. 3451
General Merchandise 2452
Miscellaneous 1453
Transportation and Warehousing 19
Air Transportation 6 13 12 12 12 $113,461 $3,152481
Water Transportation 8483
Truck Transportation 3 10 9 11 10 $132,868 $4,429484
Transit and Ground Passenger 1485
Support Activities 1488
Utilities 1
Utilities 1221
INFORMATION 2
Telecommunications 2517
FINANCIAL ACTIVITIES 3 14 15 16 15 $245,116 $5,447
Finance and Insurance 1
Credit Intermediation, etc. 1522
Real Estate, Rental and Leasing 2
Real Estate 1531
Rental and Leasing Svcs. 1532
PROFESSIONAL AND BUSINESS SERVICES 9 21 23 21 22 $413,950 $6,272
Professional, Scientific, Tech. 6
Professional, Scientific, Tech. 6541
Administrative and Waste Services 3
Administrative and Support Services 2561
Waste Management/Remediation 1562
EDUCATIONAL AND HEALTH SERVICES 4 25 26 27 26 $358,609 $4,598
Educational Services 1
Educational Services 1611
Page 16 of 701/ Oil Gas industry employment includes oil and gas exploration and oilfield services, or North American Industrial Classification System (NAICS) codes 211, 213111, 213112Quarterly Census of Employment Wages (QCEW): January - March 2020Data are preliminary and subject to revisionBlanks in the Employment, Total Earnings and Average Monthly Earnings columns due to confidentiality; data are suppressedSource: Alaska Department of Labor and Workforce Development, Research and Analysis Section

Bristol Bay Borough
Industrial Classification# of
UnitsJan
EmpFeb
EmpMar
EmpAverage
Monthly EmpTotal
EarningsAverage
Monthly Wage
SERVICE-PROVIDING 80 224 230 229 228 $2,702,911 $3,952
EDUCATIONAL AND HEALTH SERVICES 4 25 26 27 26 $358,609 $4,598
Health Care and Social Assistance 3
Out Patient Health Care 2621
Social Assistance 1624
LEISURE AND HOSPITALITY 26 49 56 50 52 $350,066 $2,244
Arts, Entertainment and Recreation 8
Museums, Zoos, Parks, etc. 1712
Amusements, Gambling, Recreation 7713
Accommodation and Food Services 18
Accommodation 13 28 34 25 29 $242,964 $2,793721
Food Services and Drinking Places 5722
OTHER SERVICES 4
Repair and Maintenance 2811
Membership Organizations, etc. 2813
Page 17 of 701/ Oil Gas industry employment includes oil and gas exploration and oilfield services, or North American Industrial Classification System (NAICS) codes 211, 213111, 213112Quarterly Census of Employment Wages (QCEW): January - March 2020Data are preliminary and subject to revisionBlanks in the Employment, Total Earnings and Average Monthly Earnings columns due to confidentiality; data are suppressedSource: Alaska Department of Labor and Workforce Development, Research and Analysis Section

Chugach Census Area (formerly part of Valdez-Cordova CA)
Industrial Classification# of
UnitsJan
EmpFeb
EmpMar
EmpAverage
Monthly EmpTotal
EarningsAverage
Monthly Wage
TOTAL INDUSTRIES 423 2,827 2,945 3,020 2,931 $49,686,275 $5,651
TOTAL GOVERNMENT 59 893 917 920 910 $12,929,390 $4,736
FEDERAL GOVERNMENT 10 61 61 62 61 $1,056,673 $5,774
STATE GOVERNMENT 35 165 165 161 164 $2,191,433 $4,454
LOCAL GOVERNMENT 14 667 691 697 685 $9,681,284 $4,711
PRIVATE OWNERSHIP 364 1,934 2,028 2,100 2,021 $36,756,885 $6,062
GOODS-PRODUCING 71 259 291 323 291 $6,136,944 $7,030
NATURAL RESOURCES AND MINING 30 79 89 104 91 $1,628,924 $5,967
Agriculture, Forestry, Fishing, Hunting 27 50 58 75 61 $763,993 $4,175
Crop Production 3111
Animal Production 7112
Fishing, Hunting, Trapping 17114
Mining 3 29 31 29 30 $864,931 $9,610
Oil and Gas Extraction 1211
Mining Support Activities 2213
CONSTRUCTION 23 61 68 72 67 $950,556 $4,729
Construction of Buildings 7236
Heavy Construction 4237
Specialty Trade Contractors 12 21 22 26 23 $297,901 $4,317238
MANUFACTURING 18 119 134 147 133 $3,557,464 $8,916
Food 11 54 70 82 69 $1,268,845 $6,130311
Beverage and Tobacco Products 1312
Petroleum and Coal Products 1324
Fabricated Metal Products 2332
Transportation Equipment 3336
SERVICE-PROVIDING 293 1,675 1,737 1,777 1,730 $30,619,941 $5,900
TRADE, TRANSPORTATION AND UTILITIES 80 709 713 704 709 $19,097,249 $8,978
Wholesale Trade 2
Wholesale, Nondurable Goods 2424
Retail Trade 30 301 299 287 296 $2,210,247 $2,489
Motor Vehicle and Parts Dealers 2441
Electronics and Appliances 1443
Building Material and Garden 5 36 30 34 33 $166,150 $1,678444
Food and Beverages 5 95 95 87 92 $648,801 $2,351445
Gasoline Stations 2447
Clothing and Clothing Accessories 4 18 19 19 19 $123,858 $2,173448
Sporting Goods, Books, Music, etc. 2451
General Merchandise 2452
Miscellaneous 4 9 11 9 10 $71,045 $2,368453
Nonstore Retailers 3 30 31 32 31 $472,805 $5,084454
Transportation and Warehousing 47 392 398 401 397 $16,492,927 $13,848
Air Transportation 4 25 25 26 25 $340,298 $4,537481
Water Transportation 23483
Truck Transportation 3484
Transit and Ground Passenger 3485
Pipeline 1486
Scenic and Sightseeing 8487
Support Activities 2488
Couriers and Messengers 1492
Warehousing and Storage 2493
Utilities 1
Utilities 1221
INFORMATION 10 89 93 91 91 $1,434,575 $5,255
Motion Picture and Sound Recording 1512
Page 18 of 701/ Oil Gas industry employment includes oil and gas exploration and oilfield services, or North American Industrial Classification System (NAICS) codes 211, 213111, 213112Quarterly Census of Employment Wages (QCEW): January - March 2020Data are preliminary and subject to revisionBlanks in the Employment, Total Earnings and Average Monthly Earnings columns due to confidentiality; data are suppressedSource: Alaska Department of Labor and Workforce Development, Research and Analysis Section

Chugach Census Area (formerly part of Valdez-Cordova CA)
Industrial Classification# of
UnitsJan
EmpFeb
EmpMar
EmpAverage
Monthly EmpTotal
EarningsAverage
Monthly Wage
SERVICE-PROVIDING 293 1,675 1,737 1,777 1,730 $30,619,941 $5,900
INFORMATION 10 89 93 91 91 $1,434,575 $5,255
Broadcasting, except Internet 2515
Telecommunications 7 72 73 72 72 $1,365,172 $6,320517
FINANCIAL ACTIVITIES 21 59 63 64 62 $672,214 $3,614
Finance and Insurance 6 26 28 26 27 $330,963 $4,086
Credit Intermediation, etc. 4522
Securities, Investments 1523
Insurance Carriers 1524
Real Estate, Rental and Leasing 15 33 35 38 35 $341,251 $3,250
Real Estate 10 21 22 26 23 $238,639 $3,459531
Rental and Leasing Svcs. 5 12 13 12 12 $102,612 $2,850532
PROFESSIONAL AND BUSINESS SERVICES 59 222 241 241 235 $4,227,231 $5,996
Professional, Scientific, Tech. 11 67 66 68 67 $987,295 $4,912
Professional, Scientific, Tech. 11 67 66 68 67 $987,295 $4,912541
Mgmt. of Companies & Enterprises 3 58 61 70 63 $1,217,662 $6,443
Mgmt. of Companies and Enterprises 3 58 61 70 63 $1,217,662 $6,443551
Administrative and Waste Services 45 97 114 103 105 $2,022,274 $6,420
Administrative and Support Services 7561
Waste Management/Remediation 38562
EDUCATIONAL AND HEALTH SERVICES 23 295 298 289 294 $3,027,134 $3,432
Educational Services 3
Educational Services 3611
Health Care and Social Assistance 20
Out Patient Health Care 9 38 42 45 42 $472,104 $3,747621
Hospitals 1622
Social Assistance 10 133 132 119 128 $1,021,530 $2,660624
LEISURE AND HOSPITALITY 69 213 247 300 253 $1,550,561 $2,043
Arts, Entertainment and Recreation 18 29 44 72 48 $341,439 $2,371
Museums, Zoos, Parks, etc. 1712
Amusements, Gambling, Recreation 17713
Accommodation and Food Services 51 184 203 228 205 $1,209,122 $1,966
Accommodation 17 97 106 133 112 $719,814 $2,142721
Food Services and Drinking Places 34 87 97 95 93 $489,308 $1,754722
OTHER SERVICES 31 88 82 88 86 $610,976 $2,368
Repair and Maintenance 10 17 17 16 17 $177,760 $3,485811
Personal and Laundry 2812
Membership Organizations, etc. 18 70 65 71 69 $432,411 $2,089813
Private Households 1814
Page 19 of 701/ Oil Gas industry employment includes oil and gas exploration and oilfield services, or North American Industrial Classification System (NAICS) codes 211, 213111, 213112Quarterly Census of Employment Wages (QCEW): January - March 2020Data are preliminary and subject to revisionBlanks in the Employment, Total Earnings and Average Monthly Earnings columns due to confidentiality; data are suppressedSource: Alaska Department of Labor and Workforce Development, Research and Analysis Section

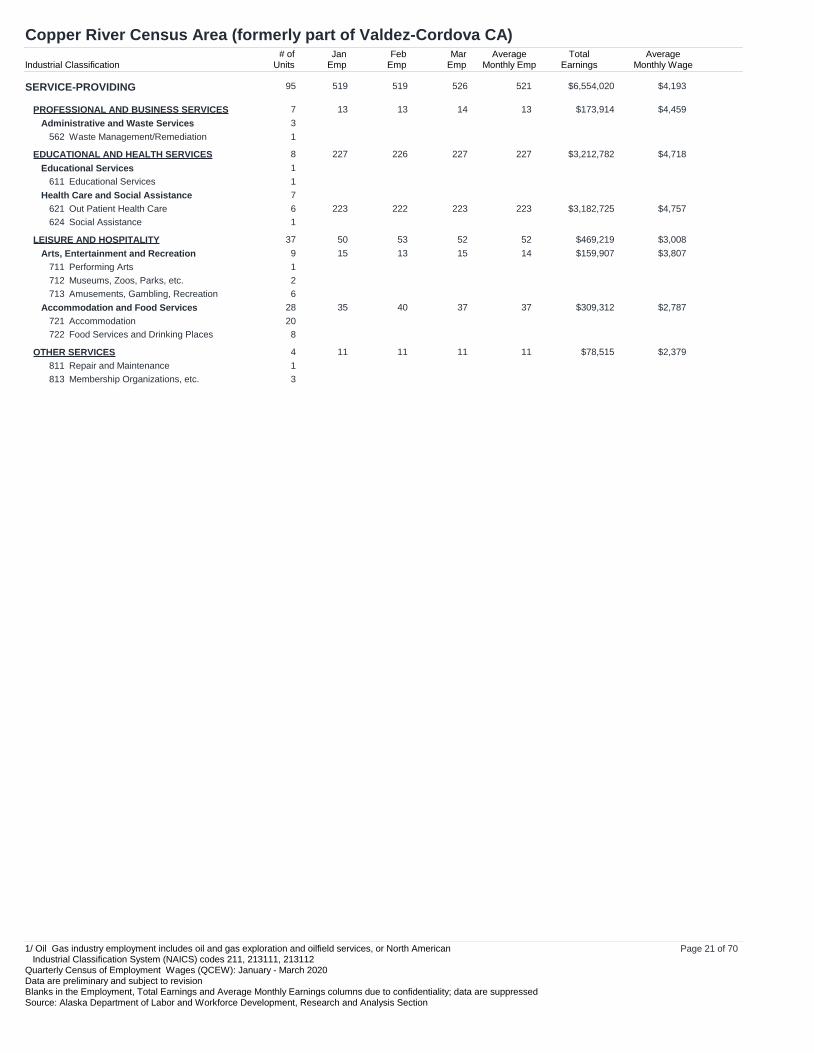
Copper River Census Area (formerly part of Valdez-Cordova CA)
Industrial Classification# of
UnitsJan
EmpFeb
EmpMar
EmpAverage
Monthly EmpTotal
EarningsAverage
Monthly Wage
TOTAL INDUSTRIES 150 863 882 905 883 $11,069,817 $4,179
TOTAL GOVERNMENT 43 310 322 319 317 $3,259,236 $3,427
FEDERAL GOVERNMENT 7 53 55 58 55 $1,021,661 $6,192
STATE GOVERNMENT 23 65 65 65 65 $919,077 $4,713
LOCAL GOVERNMENT 13 192 202 196 197 $1,318,498 $2,231
PRIVATE OWNERSHIP 107 553 560 586 566 $7,810,581 $4,600
GOODS-PRODUCING 12 34 41 60 45 $1,256,560 $9,308
NATURAL RESOURCES AND MINING 1
Agriculture, Forestry, Fishing, Hunting 1
Animal Production 1112
CONSTRUCTION 11
Construction of Buildings 3236
Heavy Construction 4237
Specialty Trade Contractors 4238
SERVICE-PROVIDING 95 519 519 526 521 $6,554,020 $4,193
TRADE, TRANSPORTATION AND UTILITIES 31 180 178 184 181 $2,032,752 $3,744
Wholesale Trade 2
Wholesale, Nondurable Goods 2424
Retail Trade 18 82 78 86 82 $523,878 $2,130
Motor Vehicle and Parts Dealers 1441
Building Material and Garden 1444
Food and Beverages 4 29 26 31 29 $160,821 $1,849445
Gasoline Stations 5 21 22 23 22 $136,515 $2,068447
Sporting Goods, Books, Music, etc. 2451
General Merchandise 2452
Miscellaneous 2453
Nonstore Retailers 1454
Transportation and Warehousing 8 40 42 40 41 $298,074 $2,423
Air Transportation 3 9 8 8 8 $40,868 $1,703481
Water Transportation 1483
Transit and Ground Passenger 2485
Support Activities 1488
Couriers and Messengers 1492
Utilities 3
Utilities 3221
INFORMATION 5 19 19 19 19 $334,342 $5,866
Publishing, except Internet 1511
Motion Picture and Sound Recording 1512
Broadcasting, except Internet 1515
Telecommunications 1517
Other Information Services 1519
FINANCIAL ACTIVITIES 3 19 19 19 19 $252,496 $4,430
Finance and Insurance 2
Credit Intermediation, etc. 2522
Real Estate, Rental and Leasing 1
Real Estate 1531
PROFESSIONAL AND BUSINESS SERVICES 7 13 13 14 13 $173,914 $4,459
Professional, Scientific, Tech. 3
Professional, Scientific, Tech. 3541
Mgmt. of Companies & Enterprises 1
Mgmt. of Companies and Enterprises 1551
Administrative and Waste Services 3
Administrative and Support Services 2561
Page 20 of 701/ Oil Gas industry employment includes oil and gas exploration and oilfield services, or North American Industrial Classification System (NAICS) codes 211, 213111, 213112Quarterly Census of Employment Wages (QCEW): January - March 2020Data are preliminary and subject to revisionBlanks in the Employment, Total Earnings and Average Monthly Earnings columns due to confidentiality; data are suppressedSource: Alaska Department of Labor and Workforce Development, Research and Analysis Section
Copper River Census Area (formerly part of Valdez-Cordova CA)
Industrial Classification# of
UnitsJan
EmpFeb
EmpMar
EmpAverage
Monthly EmpTotal
EarningsAverage
Monthly Wage
SERVICE-PROVIDING 95 519 519 526 521 $6,554,020 $4,193
PROFESSIONAL AND BUSINESS SERVICES 7 13 13 14 13 $173,914 $4,459
Administrative and Waste Services 3
Waste Management/Remediation 1562
EDUCATIONAL AND HEALTH SERVICES 8 227 226 227 227 $3,212,782 $4,718
Educational Services 1
Educational Services 1611
Health Care and Social Assistance 7
Out Patient Health Care 6 223 222 223 223 $3,182,725 $4,757621
Social Assistance 1624
LEISURE AND HOSPITALITY 37 50 53 52 52 $469,219 $3,008
Arts, Entertainment and Recreation 9 15 13 15 14 $159,907 $3,807
Performing Arts 1711
Museums, Zoos, Parks, etc. 2712
Amusements, Gambling, Recreation 6713
Accommodation and Food Services 28 35 40 37 37 $309,312 $2,787
Accommodation 20721
Food Services and Drinking Places 8722
OTHER SERVICES 4 11 11 11 11 $78,515 $2,379
Repair and Maintenance 1811
Membership Organizations, etc. 3813
Page 21 of 701/ Oil Gas industry employment includes oil and gas exploration and oilfield services, or North American Industrial Classification System (NAICS) codes 211, 213111, 213112Quarterly Census of Employment Wages (QCEW): January - March 2020Data are preliminary and subject to revisionBlanks in the Employment, Total Earnings and Average Monthly Earnings columns due to confidentiality; data are suppressedSource: Alaska Department of Labor and Workforce Development, Research and Analysis Section

Denali Borough
Industrial Classification# of
UnitsJan
EmpFeb
EmpMar
EmpAverage
Monthly EmpTotal
EarningsAverage
Monthly Wage
TOTAL INDUSTRIES 152 831 869 883 861 $14,978,686 $5,799
TOTAL GOVERNMENT 26 303 316 316 312 $4,422,081 $4,724
FEDERAL GOVERNMENT 9 148 157 157 154 $2,750,176 $5,953
STATE GOVERNMENT 10 19 18 19 19 $383,693 $6,731
LOCAL GOVERNMENT 7 136 141 140 139 $1,288,212 $3,089
PRIVATE OWNERSHIP 126 528 553 567 549 $10,556,605 $6,410
GOODS-PRODUCING 16 128 126 129 128 $3,836,121 $9,990
NATURAL RESOURCES AND MINING 4
Mining 4
Mining, except Oil and Gas 3212
Mining Support Activities 1213
CONSTRUCTION 12
Construction of Buildings 5 4 4 5 4 $60,379 $5,032236
Heavy Construction 1237
Specialty Trade Contractors 6 22 23 23 23 $362,077 $5,247238
SERVICE-PROVIDING 110 400 427 438 422 $6,720,484 $5,308
TRADE, TRANSPORTATION AND UTILITIES 30 133 129 142 135 $2,462,441 $6,080
Retail Trade 18
Food and Beverages 3445
Gasoline Stations 1447
Sporting Goods, Books, Music, etc. 2451
Miscellaneous 11453
Nonstore Retailers 1454
Transportation and Warehousing 11 23 25 31 26 $328,956 $4,217
Air Transportation 1481
Transit and Ground Passenger 3 5 5 7 6 $40,141 $2,230485
Scenic and Sightseeing 4 13 16 19 16 $246,381 $5,133487
Support Activities 2488
Postal Service 1491
Utilities 1
Utilities 1221
INFORMATION 3
Telecommunications 1517
Other Information Services 2519
FINANCIAL ACTIVITIES 2
Finance and Insurance 1
Credit Intermediation, etc. 1522
Real Estate, Rental and Leasing 1
Rental and Leasing Svcs. 1532
PROFESSIONAL AND BUSINESS SERVICES 18 65 72 71 69 $1,946,616 $9,404
Professional, Scientific, Tech. 10
Professional, Scientific, Tech. 10541
Administrative and Waste Services 8
Administrative and Support Services 6561
Waste Management/Remediation 2562
EDUCATIONAL AND HEALTH SERVICES 5 22 21 20 21 $130,006 $2,064
Health Care and Social Assistance 5 22 21 20 21 $130,006 $2,064
Out Patient Health Care 4621
Social Assistance 1624
LEISURE AND HOSPITALITY 51 169 194 195 186 $2,105,115 $3,773
Arts, Entertainment and Recreation 13 15 19 19 18 $167,677 $3,105
Performing Arts 1711
Amusements, Gambling, Recreation 12713
Page 22 of 701/ Oil Gas industry employment includes oil and gas exploration and oilfield services, or North American Industrial Classification System (NAICS) codes 211, 213111, 213112Quarterly Census of Employment Wages (QCEW): January - March 2020Data are preliminary and subject to revisionBlanks in the Employment, Total Earnings and Average Monthly Earnings columns due to confidentiality; data are suppressedSource: Alaska Department of Labor and Workforce Development, Research and Analysis Section

Denali Borough
Industrial Classification# of
UnitsJan
EmpFeb
EmpMar
EmpAverage
Monthly EmpTotal
EarningsAverage
Monthly Wage
SERVICE-PROVIDING 110 400 427 438 422 $6,720,484 $5,308
LEISURE AND HOSPITALITY 51 169 194 195 186 $2,105,115 $3,773
Accommodation and Food Services 38 154 175 176 168 $1,937,438 $3,844
Accommodation 26 125 143 155 141 $1,738,267 $4,109721
Food Services and Drinking Places 12 29 32 21 27 $199,171 $2,459722
OTHER SERVICES 1
Membership Organizations, etc. 1813
Page 23 of 701/ Oil Gas industry employment includes oil and gas exploration and oilfield services, or North American Industrial Classification System (NAICS) codes 211, 213111, 213112Quarterly Census of Employment Wages (QCEW): January - March 2020Data are preliminary and subject to revisionBlanks in the Employment, Total Earnings and Average Monthly Earnings columns due to confidentiality; data are suppressedSource: Alaska Department of Labor and Workforce Development, Research and Analysis Section

Dillingham Census Area
Industrial Classification# of
UnitsJan
EmpFeb
EmpMar
EmpAverage
Monthly EmpTotal
EarningsAverage
Monthly Wage
TOTAL INDUSTRIES 162 2,017 2,098 2,091 2,069 $24,297,767 $3,915
TOTAL GOVERNMENT 62 762 794 776 778 $7,464,977 $3,198
FEDERAL GOVERNMENT 11 41 46 45 44 $729,095 $5,523
STATE GOVERNMENT 23 77 85 86 83 $1,384,936 $5,562
LOCAL GOVERNMENT 28 644 663 645 651 $5,350,946 $2,740
PRIVATE OWNERSHIP 100 1,255 1,304 1,315 1,291 $16,832,790 $4,346
GOODS-PRODUCING 16
NATURAL RESOURCES AND MINING 1
Mining 1
Mining, except Oil and Gas 1212
CONSTRUCTION 9 4 10 22 12 $530,504 $14,736
Construction of Buildings 1236
Heavy Construction 5237
Specialty Trade Contractors 3238
MANUFACTURING 6
Food 6311
SERVICE-PROVIDING 84
TRADE, TRANSPORTATION AND UTILITIES 32 258 248 261 256 $1,625,827 $2,117
Wholesale Trade 1
Wholesale, Nondurable Goods 1424
Retail Trade 18 199 189 200 196 $1,090,773 $1,855
Building Material and Garden 2444
Food and Beverages 3445
Gasoline Stations 2447
Sporting Goods, Books, Music, etc. 1451
General Merchandise 6 123 113 117 118 $567,690 $1,604452
Miscellaneous 2453
Nonstore Retailers 2454
Transportation and Warehousing 12 33 33 37 34 $317,630 $3,114
Air Transportation 7 11 11 14 12 $156,533 $4,348481
Water Transportation 1483
Truck Transportation 1484
Transit and Ground Passenger 1485
Support Activities 2488
Utilities 1
Utilities 1221
INFORMATION 2
Telecommunications 2517
FINANCIAL ACTIVITIES 5 45 47 48 47 $599,970 $4,255
Finance and Insurance 1
Credit Intermediation, etc. 1522
Real Estate, Rental and Leasing 4
Real Estate 4531
PROFESSIONAL AND BUSINESS SERVICES 8 31 33 33 32 $366,185 $3,814
Professional, Scientific, Tech. 3
Professional, Scientific, Tech. 3541
Mgmt. of Companies & Enterprises 3 25 26 24 25 $276,612 $3,688
Mgmt. of Companies and Enterprises 3 25 26 24 25 $276,612 $3,688551
Administrative and Waste Services 2
Administrative and Support Services 1561
Waste Management/Remediation 1562
EDUCATIONAL AND HEALTH SERVICES 8 595 592 589 592 $9,387,588 $5,286
Educational Services 1
Page 24 of 701/ Oil Gas industry employment includes oil and gas exploration and oilfield services, or North American Industrial Classification System (NAICS) codes 211, 213111, 213112Quarterly Census of Employment Wages (QCEW): January - March 2020Data are preliminary and subject to revisionBlanks in the Employment, Total Earnings and Average Monthly Earnings columns due to confidentiality; data are suppressedSource: Alaska Department of Labor and Workforce Development, Research and Analysis Section

Dillingham Census Area
Industrial Classification# of
UnitsJan
EmpFeb
EmpMar
EmpAverage
Monthly EmpTotal
EarningsAverage
Monthly Wage
SERVICE-PROVIDING 84
EDUCATIONAL AND HEALTH SERVICES 8 595 592 589 592 $9,387,588 $5,286
Educational Services 1
Educational Services 1611
Health Care and Social Assistance 7
Out Patient Health Care 3621
Hospitals 1622
Nursing and Residential Care 1623
Social Assistance 2624
LEISURE AND HOSPITALITY 24
Arts, Entertainment and Recreation 5
Amusements, Gambling, Recreation 5713
Accommodation and Food Services 19 40 44 45 43 $181,349 $1,406
Accommodation 12 26 33 30 30 $139,196 $1,547721
Food Services and Drinking Places 7722
OTHER SERVICES 5 28 31 33 31 $442,753 $4,761
Repair and Maintenance 1811
Membership Organizations, etc. 4813
Page 25 of 701/ Oil Gas industry employment includes oil and gas exploration and oilfield services, or North American Industrial Classification System (NAICS) codes 211, 213111, 213112Quarterly Census of Employment Wages (QCEW): January - March 2020Data are preliminary and subject to revisionBlanks in the Employment, Total Earnings and Average Monthly Earnings columns due to confidentiality; data are suppressedSource: Alaska Department of Labor and Workforce Development, Research and Analysis Section

Fairbanks North Star Borough
Industrial Classification# of
UnitsJan
EmpFeb
EmpMar
EmpAverage
Monthly EmpTotal
EarningsAverage
Monthly Wage
TOTAL INDUSTRIES 2,283 36,510 36,961 37,064 36,845 $482,001,457 $4,361
TOTAL GOVERNMENT 125 10,627 10,764 10,896 10,762 $152,575,832 $4,726
FEDERAL GOVERNMENT 68 3,051 3,080 3,211 3,114 $52,996,704 $5,673
STATE GOVERNMENT 46 4,461 4,547 4,577 4,528 $62,954,875 $4,634
LOCAL GOVERNMENT 11 3,115 3,137 3,108 3,120 $36,624,253 $3,913
PRIVATE OWNERSHIP 2,158 25,883 26,197 26,168 26,083 $329,425,625 $4,210
GOODS-PRODUCING 444 3,662 3,810 3,947 3,806 $76,022,229 $6,658
NATURAL RESOURCES AND MINING 52 983 977 1,007 989 $24,323,821 $8,198
Agriculture, Forestry, Fishing, Hunting 26
Crop Production 22 193 202 223 206 $1,777,979 $2,877111
Agriculture, Forestry Support 4115
Mining 26
Mining, except Oil and Gas 14212
Mining Support Activities 12 29 27 27 28 $630,104 $7,501213
CONSTRUCTION 324 2,178 2,333 2,444 2,318 $45,512,229 $6,545
Construction of Buildings 123 502 527 525 518 $8,451,639 $5,439236
Heavy Construction 26 699 829 942 823 $20,020,483 $8,109237
Specialty Trade Contractors 175 977 977 977 977 $17,040,107 $5,814238
MANUFACTURING 68 501 500 496 499 $6,186,178 $4,132
Food 8 45 42 44 44 $290,637 $2,202311
Beverage and Tobacco Products 9 102 111 106 106 $691,165 $2,173312
Textiles 1313
Textile Products 2314
Leather and Allied Products 1316
Wood Products 6 48 48 45 47 $446,377 $3,166321
Printing and Support Activities 5 28 29 30 29 $228,030 $2,621323
Petroleum and Coal Products 3324
Chemicals 1325
Plastics and Rubber Products 3326
Nonmetallic Mineral Products 6 17 16 16 16 $370,880 $7,727327
Primary Metals 2331
Fabricated Metal Products 10 88 83 78 83 $1,182,913 $4,751332
Machinery 1333
Computer and Electronic Products 1334
Electrical Equip. and Appliances 1335
Transportation Equipment 1336
Furniture and Related Products 2337
Miscellaneous 5 3 3 3 3 $31,804 $3,534339
SERVICE-PROVIDING 1,714 22,221 22,387 22,221 22,276 $253,403,396 $3,792
TRADE, TRANSPORTATION AND UTILITIES 416 7,393 7,366 7,413 7,391 $87,148,167 $3,930
Wholesale Trade 44 615 609 611 612 $9,441,277 $5,142
Wholesale, Durable Goods 22 324 319 323 322 $5,147,206 $5,328423
Wholesale, Nondurable Goods 18 282 281 279 281 $4,184,475 $4,964424
Wholesale, Electronic Markets 4 9 9 9 9 $109,596 $4,059425
Retail Trade 260 4,612 4,598 4,610 4,607 $40,813,231 $2,953
Motor Vehicle and Parts Dealers 42 762 767 772 767 $9,596,218 $4,170441
Furniture and Home Furnishings 6 93 81 80 85 $710,822 $2,788442
Electronics and Appliances 10 54 54 52 53 $524,412 $3,298443
Building Material and Garden 21 417 428 428 424 $4,068,499 $3,199444
Food and Beverages 19 412 421 412 415 $3,131,617 $2,515445
Health and Personal Care 17 183 175 176 178 $1,218,522 $2,282446
Gasoline Stations 30 271 275 272 273 $2,040,167 $2,491447
Clothing and Clothing Accessories 26 235 224 221 227 $1,328,496 $1,951448
Sporting Goods, Books, Music, etc. 28 352 336 344 344 $1,457,432 $1,412451
Page 26 of 701/ Oil Gas industry employment includes oil and gas exploration and oilfield services, or North American Industrial Classification System (NAICS) codes 211, 213111, 213112Quarterly Census of Employment Wages (QCEW): January - March 2020Data are preliminary and subject to revisionBlanks in the Employment, Total Earnings and Average Monthly Earnings columns due to confidentiality; data are suppressedSource: Alaska Department of Labor and Workforce Development, Research and Analysis Section

Fairbanks North Star Borough
Industrial Classification# of
UnitsJan
EmpFeb
EmpMar
EmpAverage
Monthly EmpTotal
EarningsAverage
Monthly Wage
SERVICE-PROVIDING 1,714 22,221 22,387 22,221 22,276 $253,403,396 $3,792
TRADE, TRANSPORTATION AND UTILITIES 416 7,393 7,366 7,413 7,391 $87,148,167 $3,930
Retail Trade 260 4,612 4,598 4,610 4,607 $40,813,231 $2,953
General Merchandise 7 1,304 1,300 1,318 1,307 $11,049,979 $2,818452
Miscellaneous 38 345 351 344 347 $2,341,111 $2,249453
Nonstore Retailers 16 184 186 191 187 $3,345,957 $5,964454
Transportation and Warehousing 100 1,786 1,781 1,804 1,790 $26,726,306 $4,977
Air Transportation 12 520 512 502 511 $7,127,143 $4,649481
Water Transportation 1483
Truck Transportation 43 582 583 581 582 $9,271,896 $5,310484
Transit and Ground Passenger 7485
Pipeline 1486
Scenic and Sightseeing 6 68 82 107 86 $757,694 $2,937487
Support Activities 18 138 136 148 141 $2,445,989 $5,782488
Postal Service 4 41 34 35 37 $336,063 $3,028491
Couriers and Messengers 6 85 81 81 82 $915,602 $3,722492
Warehousing and Storage 2493
Utilities 12 380 378 388 382 $10,167,353 $8,872
Utilities 12 380 378 388 382 $10,167,353 $8,872221
INFORMATION 27 356 351 351 353 $5,601,701 $5,290
Publishing, except Internet 4511
Motion Picture and Sound Recording 3512
Broadcasting, except Internet 2515
Telecommunications 13 198 197 197 197 $4,181,867 $7,076517
ISPs, Data Processing 5 5 5 5 5 $162,623 $10,842518
FINANCIAL ACTIVITIES 165 1,241 1,242 1,243 1,242 $17,357,616 $4,659
Finance and Insurance 76 602 602 597 600 $9,318,989 $5,177
Credit Intermediation, etc. 40 432 436 429 432 $7,485,831 $5,776522
Securities, Investments 8 21 20 19 20 $374,552 $6,243523
Insurance Carriers 28 149 146 149 148 $1,458,606 $3,285524
Real Estate, Rental and Leasing 89 639 640 646 642 $8,038,628 $4,174
Real Estate 74 451 452 455 453 $5,054,130 $3,719531
Rental and Leasing Svcs. 15 188 188 191 189 $2,984,498 $5,264532
PROFESSIONAL AND BUSINESS SERVICES 355 2,688 2,655 2,608 2,650 $38,373,082 $4,827
Professional, Scientific, Tech. 218 1,449 1,406 1,374 1,410 $20,788,495 $4,915
Professional, Scientific, Tech. 218 1,449 1,406 1,374 1,410 $20,788,495 $4,915541
Mgmt. of Companies & Enterprises 8 145 152 158 152 $3,157,611 $6,925
Mgmt. of Companies and Enterprises 8 145 152 158 152 $3,157,611 $6,925551
Administrative and Waste Services 129 1,094 1,097 1,076 1,089 $14,426,976 $4,416
Administrative and Support Services 115 942 943 918 934 $10,857,854 $3,875561
Waste Management/Remediation 14 152 154 158 155 $3,569,122 $7,676562
EDUCATIONAL AND HEALTH SERVICES 264 5,490 5,493 5,469 5,484 $72,847,926 $4,428
Educational Services 28 189 204 210 201 $1,589,421 $2,636
Educational Services 28 189 204 210 201 $1,589,421 $2,636611
Health Care and Social Assistance 236 5,301 5,289 5,259 5,283 $71,258,505 $4,496
Out Patient Health Care 163 1,900 1,904 1,874 1,893 $27,335,983 $4,814621
Hospitals 2622
Nursing and Residential Care 13623
Social Assistance 58 1,075 1,080 1,076 1,077 $9,137,169 $2,828624
LEISURE AND HOSPITALITY 299 4,028 4,261 4,102 4,130 $23,060,769 $1,861
Arts, Entertainment and Recreation 81 531 572 546 550 $2,125,846 $1,288
Performing Arts 17 84 83 76 81 $359,449 $1,479711
Museums, Zoos, Parks, etc. 8 16 29 21 22 $135,452 $2,052712
Amusements, Gambling, Recreation 56 431 460 449 447 $1,630,945 $1,216713
Accommodation and Food Services 218 3,497 3,689 3,556 3,581 $20,934,923 $1,949
Accommodation 32 858 886 845 863 $7,273,839 $2,810721
Food Services and Drinking Places 186 2,639 2,803 2,711 2,718 $13,661,084 $1,675722
OTHER SERVICES 186 1,023 1,017 1,033 1,024 $9,002,009 $2,930
Repair and Maintenance 77 397 394 410 400 $4,824,163 $4,020811
Personal and Laundry 38 243 236 232 237 $1,532,140 $2,155812
Membership Organizations, etc. 56 370 376 377 374 $2,581,270 $2,301813
Page 27 of 701/ Oil Gas industry employment includes oil and gas exploration and oilfield services, or North American Industrial Classification System (NAICS) codes 211, 213111, 213112Quarterly Census of Employment Wages (QCEW): January - March 2020Data are preliminary and subject to revisionBlanks in the Employment, Total Earnings and Average Monthly Earnings columns due to confidentiality; data are suppressedSource: Alaska Department of Labor and Workforce Development, Research and Analysis Section

Fairbanks North Star Borough
Industrial Classification# of
UnitsJan
EmpFeb
EmpMar
EmpAverage
Monthly EmpTotal
EarningsAverage
Monthly Wage
SERVICE-PROVIDING 1,714 22,221 22,387 22,221 22,276 $253,403,396 $3,792
OTHER SERVICES 186 1,023 1,017 1,033 1,024 $9,002,009 $2,930
Private Households 15 13 11 14 13 $64,436 $1,652814
UNCLASSIFIED ESTABLISHMENTS 2 2 2 2 2 $12,125 $2,021
Page 28 of 701/ Oil Gas industry employment includes oil and gas exploration and oilfield services, or North American Industrial Classification System (NAICS) codes 211, 213111, 213112Quarterly Census of Employment Wages (QCEW): January - March 2020Data are preliminary and subject to revisionBlanks in the Employment, Total Earnings and Average Monthly Earnings columns due to confidentiality; data are suppressedSource: Alaska Department of Labor and Workforce Development, Research and Analysis Section

Haines Borough
Industrial Classification# of
UnitsJan
EmpFeb
EmpMar
EmpAverage
Monthly EmpTotal
EarningsAverage
Monthly Wage
TOTAL INDUSTRIES 162 680 691 734 702 $6,249,760 $2,968
TOTAL GOVERNMENT 22 200 187 197 195 $2,035,256 $3,479
FEDERAL GOVERNMENT 3 11 11 17 13 $291,745 $7,481
STATE GOVERNMENT 15 23 23 23 23 $315,779 $4,577
LOCAL GOVERNMENT 4 166 153 157 159 $1,427,732 $2,993
PRIVATE OWNERSHIP 140 480 504 537 507 $4,214,504 $2,771
GOODS-PRODUCING 27 81 90 99 90 $1,005,248 $3,723
NATURAL RESOURCES AND MINING 3
Agriculture, Forestry, Fishing, Hunting 1
Fishing, Hunting, Trapping 1114
Mining 2
Mining Support Activities 2213
CONSTRUCTION 17 55 65 73 64 $837,655 $4,363
Construction of Buildings 6 13 9 13 12 $68,995 $1,917236
Heavy Construction 4237
Specialty Trade Contractors 7238
MANUFACTURING 7
Food 3311
Beverage and Tobacco Products 2312
Wood Products 1321
Furniture and Related Products 1337
SERVICE-PROVIDING 113 399 414 438 417 $3,209,256 $2,565
TRADE, TRANSPORTATION AND UTILITIES 27 113 117 122 117 $925,348 $2,636
Retail Trade 19 104 106 111 107 $828,720 $2,582
Motor Vehicle and Parts Dealers 1441
Building Material and Garden 3 17 18 18 18 $153,437 $2,841444
Food and Beverages 4 42 43 44 43 $327,893 $2,542445
Gasoline Stations 1447
Clothing and Clothing Accessories 1448
General Merchandise 1452
Miscellaneous 6453
Nonstore Retailers 2454
Transportation and Warehousing 7
Truck Transportation 1484
Scenic and Sightseeing 5487
Support Activities 1488
Utilities 1
Utilities 1221
INFORMATION 5
Publishing, except Internet 2511
Broadcasting, except Internet 1515
Telecommunications 2517
FINANCIAL ACTIVITIES 5
Finance and Insurance 2
Credit Intermediation, etc. 1522
Securities, Investments 1523
Real Estate, Rental and Leasing 3
Real Estate 3531
PROFESSIONAL AND BUSINESS SERVICES 9 21 19 19 20 $240,025 $4,000
Professional, Scientific, Tech. 4 5 5 6 5 $136,306 $9,087
Professional, Scientific, Tech. 4 5 5 6 5 $136,306 $9,087541
Administrative and Waste Services 5 16 14 13 14 $103,719 $2,470
Administrative and Support Services 3561
Page 29 of 701/ Oil Gas industry employment includes oil and gas exploration and oilfield services, or North American Industrial Classification System (NAICS) codes 211, 213111, 213112Quarterly Census of Employment Wages (QCEW): January - March 2020Data are preliminary and subject to revisionBlanks in the Employment, Total Earnings and Average Monthly Earnings columns due to confidentiality; data are suppressedSource: Alaska Department of Labor and Workforce Development, Research and Analysis Section

Haines Borough
Industrial Classification# of
UnitsJan
EmpFeb
EmpMar
EmpAverage
Monthly EmpTotal
EarningsAverage
Monthly Wage
SERVICE-PROVIDING 113 399 414 438 417 $3,209,256 $2,565
PROFESSIONAL AND BUSINESS SERVICES 9 21 19 19 20 $240,025 $4,000
Administrative and Waste Services 5 16 14 13 14 $103,719 $2,470
Waste Management/Remediation 2562
EDUCATIONAL AND HEALTH SERVICES 19 130 137 143 137 $1,244,349 $3,028
Educational Services 3 5 10 10 8 $55,195 $2,300
Educational Services 3 5 10 10 8 $55,195 $2,300611
Health Care and Social Assistance 16 125 127 133 128 $1,189,154 $3,097
Out Patient Health Care 6621
Nursing and Residential Care 1623
Social Assistance 9 41 44 45 43 $195,577 $1,516624
LEISURE AND HOSPITALITY 36 79 81 96 85 $400,701 $1,571
Arts, Entertainment and Recreation 15 23 23 37 28 $218,098 $2,596
Performing Arts 1711
Museums, Zoos, Parks, etc. 3712
Amusements, Gambling, Recreation 11 16 15 28 20 $146,620 $2,444713
Accommodation and Food Services 21 56 58 59 58 $182,603 $1,049
Accommodation 9 25 26 23 25 $73,576 $981721
Food Services and Drinking Places 12 31 32 36 33 $109,027 $1,101722
OTHER SERVICES 12 30 31 32 31 $191,739 $2,062
Repair and Maintenance 2811
Personal and Laundry 1812
Membership Organizations, etc. 9 26 27 28 27 $164,355 $2,029813
Page 30 of 701/ Oil Gas industry employment includes oil and gas exploration and oilfield services, or North American Industrial Classification System (NAICS) codes 211, 213111, 213112Quarterly Census of Employment Wages (QCEW): January - March 2020Data are preliminary and subject to revisionBlanks in the Employment, Total Earnings and Average Monthly Earnings columns due to confidentiality; data are suppressedSource: Alaska Department of Labor and Workforce Development, Research and Analysis Section

Hoonah-Angoon Census Area
Industrial Classification# of
UnitsJan
EmpFeb
EmpMar
EmpAverage
Monthly EmpTotal
EarningsAverage
Monthly Wage
TOTAL INDUSTRIES 140 614 607 632 618 $5,513,365 $2,974
TOTAL GOVERNMENT 42 368 368 372 369 $3,497,344 $3,159
FEDERAL GOVERNMENT 9 77 78 79 78 $1,318,868 $5,636
STATE GOVERNMENT 17 9 9 9 9 $112,418 $4,164
LOCAL GOVERNMENT 16 282 281 284 282 $2,066,058 $2,442
PRIVATE OWNERSHIP 98 246 239 260 248 $2,016,021 $2,710
GOODS-PRODUCING 18 32 36 39 36 $222,106 $2,057
NATURAL RESOURCES AND MINING 1
Agriculture, Forestry, Fishing, Hunting 1
Animal Production 1112
CONSTRUCTION 13 13 10 15 13 $112,674 $2,889
Construction of Buildings 4236
Heavy Construction 4237
Specialty Trade Contractors 5238
MANUFACTURING 4
Food 2311
Beverage and Tobacco Products 1312
Wood Products 1321
SERVICE-PROVIDING 80 214 203 221 213 $1,793,915 $2,807
TRADE, TRANSPORTATION AND UTILITIES 33 93 82 87 87 $459,344 $1,760
Wholesale Trade 2
Wholesale, Durable Goods 1423
Wholesale, Nondurable Goods 1424
Retail Trade 17 60 58 63 60 $299,288 $1,663
Food and Beverages 5 15 16 14 15 $47,265 $1,050445
Gasoline Stations 2447
Sporting Goods, Books, Music, etc. 2451
General Merchandise 3 25 25 20 23 $159,810 $2,316452
Miscellaneous 3453
Nonstore Retailers 2454
Transportation and Warehousing 12 22 11 9 14 $96,893 $2,307
Air Transportation 1481
Water Transportation 2483
Truck Transportation 3 5 3 5 4 $33,166 $2,764484
Scenic and Sightseeing 6487
Utilities 2
Utilities 2221
FINANCIAL ACTIVITIES 2
Finance and Insurance 1
Credit Intermediation, etc. 1522
Real Estate, Rental and Leasing 1
Rental and Leasing Svcs. 1532
EDUCATIONAL AND HEALTH SERVICES 17 61 62 61 61 $511,634 $2,796
Educational Services 4 7 7 7 7 $63,034 $3,002
Educational Services 4 7 7 7 7 $63,034 $3,002611
Health Care and Social Assistance 13 54 55 54 54 $448,600 $2,769
Out Patient Health Care 6621
Social Assistance 7624
LEISURE AND HOSPITALITY 24 51 51 64 55 $789,975 $4,788
Arts, Entertainment and Recreation 4
Amusements, Gambling, Recreation 4713
Accommodation and Food Services 20
Accommodation 17 20 20 23 21 $103,054 $1,636721
Page 31 of 701/ Oil Gas industry employment includes oil and gas exploration and oilfield services, or North American Industrial Classification System (NAICS) codes 211, 213111, 213112Quarterly Census of Employment Wages (QCEW): January - March 2020Data are preliminary and subject to revisionBlanks in the Employment, Total Earnings and Average Monthly Earnings columns due to confidentiality; data are suppressedSource: Alaska Department of Labor and Workforce Development, Research and Analysis Section

Hoonah-Angoon Census Area
Industrial Classification# of
UnitsJan
EmpFeb
EmpMar
EmpAverage
Monthly EmpTotal
EarningsAverage
Monthly Wage
SERVICE-PROVIDING 80 214 203 221 213 $1,793,915 $2,807
LEISURE AND HOSPITALITY 24 51 51 64 55 $789,975 $4,788
Accommodation and Food Services 20
Food Services and Drinking Places 3722
OTHER SERVICES 4
Repair and Maintenance 1811
Membership Organizations, etc. 3 8 7 6 7 $27,869 $1,327813
Page 32 of 701/ Oil Gas industry employment includes oil and gas exploration and oilfield services, or North American Industrial Classification System (NAICS) codes 211, 213111, 213112Quarterly Census of Employment Wages (QCEW): January - March 2020Data are preliminary and subject to revisionBlanks in the Employment, Total Earnings and Average Monthly Earnings columns due to confidentiality; data are suppressedSource: Alaska Department of Labor and Workforce Development, Research and Analysis Section

Juneau City and Borough
Industrial Classification# of
UnitsJan
EmpFeb
EmpMar
EmpAverage
Monthly EmpTotal
EarningsAverage
Monthly Wage
TOTAL INDUSTRIES 1,146 16,480 16,807 16,847 16,711 $225,949,732 $4,507
TOTAL GOVERNMENT 84 6,764 6,945 6,971 6,893 $108,026,334 $5,224
FEDERAL GOVERNMENT 24 657 658 698 671 $15,304,564 $7,603
STATE GOVERNMENT 53 3,534 3,694 3,686 3,638 $55,540,475 $5,089
LOCAL GOVERNMENT 7 2,573 2,593 2,587 2,584 $37,181,295 $4,796
PRIVATE OWNERSHIP 1,062 9,716 9,862 9,876 9,818 $117,923,398 $4,004
GOODS-PRODUCING 169 1,716 1,779 1,792 1,762 $36,437,439 $6,893
NATURAL RESOURCES AND MINING 17 932 919 912 921 $24,224,547 $8,767
Agriculture, Forestry, Fishing, Hunting 9 80 85 81 82 $755,661 $3,072
Crop Production 5 43 44 38 42 $289,848 $2,300111
Animal Production 1112
Fishing, Hunting, Trapping 1114
Agriculture, Forestry Support 2115
Mining 8 852 834 831 839 $23,468,886 $9,324
Mining, except Oil and Gas 3212
Mining Support Activities 5213
CONSTRUCTION 125 519 551 563 544 $9,340,244 $5,723
Construction of Buildings 56 213 220 232 222 $2,719,342 $4,083236
Heavy Construction 9 97 117 126 113 $3,838,670 $11,324237
Specialty Trade Contractors 60 209 214 205 209 $2,782,232 $4,437238
MANUFACTURING 27 265 309 317 297 $2,872,648 $3,224
Food 7 81 131 142 118 $954,515 $2,696311
Beverage and Tobacco Products 6 134 128 130 131 $1,554,531 $3,956312
Textile Products 1314
Wood Products 1321
Printing and Support Activities 4 28 28 24 27 $252,845 $3,122323
Machinery 1333
Transportation Equipment 2336
Furniture and Related Products 1337
Miscellaneous 4 8 8 7 8 $36,085 $1,504339
SERVICE-PROVIDING 893 8,000 8,083 8,084 8,056 $81,485,958 $3,372
TRADE, TRANSPORTATION AND UTILITIES 233 2,710 2,761 2,807 2,759 $26,073,114 $3,150
Wholesale Trade 22
Wholesale, Durable Goods 9 63 62 61 62 $1,254,980 $6,747423
Wholesale, Nondurable Goods 10 73 73 70 72 $733,030 $3,394424
Wholesale, Electronic Markets 3425
Retail Trade 145 1,650 1,658 1,660 1,656 $12,251,701 $2,466
Motor Vehicle and Parts Dealers 9 121 122 118 120 $1,381,506 $3,838441
Furniture and Home Furnishings 8 35 34 30 33 $217,025 $2,192442
Electronics and Appliances 4 11 11 11 11 $79,434 $2,407443
Building Material and Garden 8 196 202 206 201 $1,485,386 $2,463444
Food and Beverages 13 416 415 424 418 $2,731,664 $2,178445
Health and Personal Care 6 26 31 27 28 $243,845 $2,903446
Gasoline Stations 5 32 32 32 32 $266,462 $2,776447
Clothing and Clothing Accessories 28 48 39 36 41 $199,282 $1,620448
Sporting Goods, Books, Music, etc. 14 102 102 107 104 $402,078 $1,289451
General Merchandise 7 441 431 433 435 $3,592,122 $2,753452
Miscellaneous 36 166 181 175 174 $877,103 $1,680453
Nonstore Retailers 7 56 58 61 58 $775,795 $4,459454
Transportation and Warehousing 65 853 898 946 899 $10,600,526 $3,930
Air Transportation 8 349 354 359 354 $4,976,765 $4,686481
Water Transportation 11 50 53 55 53 $762,073 $4,793483
Truck Transportation 5 84 90 88 87 $873,164 $3,345484
Transit and Ground Passenger 6485
Page 33 of 701/ Oil Gas industry employment includes oil and gas exploration and oilfield services, or North American Industrial Classification System (NAICS) codes 211, 213111, 213112Quarterly Census of Employment Wages (QCEW): January - March 2020Data are preliminary and subject to revisionBlanks in the Employment, Total Earnings and Average Monthly Earnings columns due to confidentiality; data are suppressedSource: Alaska Department of Labor and Workforce Development, Research and Analysis Section

Juneau City and Borough
Industrial Classification# of
UnitsJan
EmpFeb
EmpMar
EmpAverage
Monthly EmpTotal
EarningsAverage
Monthly Wage
SERVICE-PROVIDING 893 8,000 8,083 8,084 8,056 $81,485,958 $3,372
TRADE, TRANSPORTATION AND UTILITIES 233 2,710 2,761 2,807 2,759 $26,073,114 $3,150
Transportation and Warehousing 65 853 898 946 899 $10,600,526 $3,930
Scenic and Sightseeing 26 246 278 319 281 $2,978,168 $3,533487
Support Activities 4488
Couriers and Messengers 5 38 35 38 37 $330,804 $2,980492
Utilities 1
Utilities 1221
INFORMATION 26 250 257 259 255 $3,429,216 $4,483
Publishing, except Internet 3511
Motion Picture and Sound Recording 6512
Broadcasting, except Internet 5 49 52 55 52 $553,005 $3,545515
Telecommunications 7 92 92 93 92 $1,703,161 $6,171517
ISPs, Data Processing 2518
Other Information Services 3519
FINANCIAL ACTIVITIES 82 458 448 459 455 $6,764,800 $4,956
Finance and Insurance 36 185 182 182 183 $3,753,088 $6,836
Credit Intermediation, etc. 18 117 115 114 115 $2,022,074 $5,861522
Securities, Investments 5 20 20 20 20 $982,545 $16,376523
Insurance Carriers 12524
Funds, Trusts, etc. 1525
Real Estate, Rental and Leasing 46 273 266 277 272 $3,011,712 $3,691
Real Estate 40 254 250 258 254 $2,821,777 $3,703531
Rental and Leasing Svcs. 6 19 16 19 18 $189,935 $3,517532
PROFESSIONAL AND BUSINESS SERVICES 162 877 873 891 880 $11,104,232 $4,206
Professional, Scientific, Tech. 101 461 457 470 463 $5,847,324 $4,210
Professional, Scientific, Tech. 101 461 457 470 463 $5,847,324 $4,210541
Mgmt. of Companies & Enterprises 5 90 92 92 91 $1,789,045 $6,553
Mgmt. of Companies and Enterprises 5 90 92 92 91 $1,789,045 $6,553551
Administrative and Waste Services 56 326 324 329 326 $3,467,863 $3,546
Administrative and Support Services 51 291 289 292 291 $2,877,727 $3,296561
Waste Management/Remediation 5 35 35 37 36 $590,136 $5,464562
EDUCATIONAL AND HEALTH SERVICES 126 1,629 1,683 1,680 1,664 $19,821,683 $3,971
Educational Services 17 65 93 78 79 $446,382 $1,883
Educational Services 17 65 93 78 79 $446,382 $1,883611
Health Care and Social Assistance 109 1,564 1,590 1,602 1,585 $19,375,301 $4,075
Out Patient Health Care 69 684 693 710 696 $11,310,165 $5,417621
Nursing and Residential Care 6623
Social Assistance 34624
LEISURE AND HOSPITALITY 139 1,412 1,400 1,332 1,381 $7,132,696 $1,722
Arts, Entertainment and Recreation 34 260 255 268 261 $964,516 $1,232
Performing Arts 8 53 43 67 54 $285,239 $1,761711
Amusements, Gambling, Recreation 26 207 212 201 207 $679,277 $1,094713
Accommodation and Food Services 105 1,152 1,145 1,064 1,120 $6,168,180 $1,836
Accommodation 21 333 343 331 336 $2,214,012 $2,196721
Food Services and Drinking Places 84 819 802 733 785 $3,954,169 $1,679722
OTHER SERVICES 124 664 661 656 660 $7,159,154 $3,616
Repair and Maintenance 28 81 82 84 82 $893,841 $3,634811
Personal and Laundry 21 106 104 96 102 $598,841 $1,957812
Membership Organizations, etc. 65 464 458 462 461 $5,547,152 $4,011813
Private Households 10 13 17 14 15 $119,320 $2,652814
UNCLASSIFIED ESTABLISHMENTS 1 0 0 0 0 $1,063
Page 34 of 701/ Oil Gas industry employment includes oil and gas exploration and oilfield services, or North American Industrial Classification System (NAICS) codes 211, 213111, 213112Quarterly Census of Employment Wages (QCEW): January - March 2020Data are preliminary and subject to revisionBlanks in the Employment, Total Earnings and Average Monthly Earnings columns due to confidentiality; data are suppressedSource: Alaska Department of Labor and Workforce Development, Research and Analysis Section

Kenai Peninsula Borough
Industrial Classification# of
UnitsJan
EmpFeb
EmpMar
EmpAverage
Monthly EmpTotal
EarningsAverage
Monthly Wage
TOTAL INDUSTRIES 2,127 18,401 18,614 18,808 18,608 $238,205,073 $4,267
TOTAL GOVERNMENT 163 4,875 4,949 5,009 4,944 $68,809,213 $4,639
FEDERAL GOVERNMENT 30 339 334 383 352 $6,629,724 $6,278
STATE GOVERNMENT 95 1,182 1,189 1,203 1,191 $17,499,358 $4,898
LOCAL GOVERNMENT 38 3,354 3,426 3,423 3,401 $44,680,131 $4,379
PRIVATE OWNERSHIP 1,964 13,526 13,665 13,799 13,663 $169,395,860 $4,133
GOODS-PRODUCING 390 2,554 2,609 2,695 2,619 $57,132,345 $7,272
NATURAL RESOURCES AND MINING 76 916 971 938 942 $30,147,354 $10,668
Agriculture, Forestry, Fishing, Hunting 40 76 82 79 79 $743,156 $3,136
Crop Production 15 37 39 41 39 $294,864 $2,520111
Animal Production 2112
Forestry and Logging 3113
Fishing, Hunting, Trapping 17 13 15 10 13 $113,571 $2,912114
Agriculture, Forestry Support 3115
Mining 36 840 889 859 863 $29,404,198 $11,357
Oil and Gas Extraction 3211
Mining, except Oil and Gas 6212
Mining Support Activities 27 566 600 561 576 $14,708,411 $8,512213
CONSTRUCTION 245 749 758 795 767 $10,429,499 $4,533
Construction of Buildings 80 232 239 241 237 $2,570,328 $3,615236
Heavy Construction 29 121 117 129 122 $1,745,285 $4,769237
Specialty Trade Contractors 136 396 402 425 408 $6,113,886 $4,995238
MANUFACTURING 69 889 880 962 910 $16,555,492 $6,064
Food 22 273 227 308 269 $2,320,899 $2,876311
Beverage and Tobacco Products 5 45 44 40 43 $253,792 $1,967312
Textile Products 2314
Wood Products 3321
Printing and Support Activities 4 9 9 9 9 $51,528 $1,908323
Petroleum and Coal Products 1324
Chemicals 5 14 14 14 14 $198,651 $4,730325
Nonmetallic Mineral Products 2327
Fabricated Metal Products 8 84 82 81 82 $1,313,802 $5,341332
Machinery 1333
Computer and Electronic Products 1334
Transportation Equipment 8 148 183 199 177 $2,158,897 $4,066336
Furniture and Related Products 2337
Miscellaneous 5 6 6 5 6 $88,808 $4,934339
SERVICE-PROVIDING 1,574 10,972 11,056 11,104 11,044 $112,263,515 $3,388
TRADE, TRANSPORTATION AND UTILITIES 438 3,581 3,575 3,621 3,592 $37,814,143 $3,509
Wholesale Trade 42 206 205 206 206 $3,696,700 $5,982
Wholesale, Durable Goods 22423
Wholesale, Nondurable Goods 18 102 103 104 103 $2,190,333 $7,088424
Wholesale, Electronic Markets 2425
Retail Trade 231 2,447 2,462 2,483 2,464 $19,275,429 $2,608
Motor Vehicle and Parts Dealers 29 228 229 227 228 $2,234,045 $3,266441
Furniture and Home Furnishings 13 39 40 44 41 $301,638 $2,452442
Electronics and Appliances 3 34 33 34 34 $319,660 $3,134443
Building Material and Garden 17 286 293 299 293 $2,652,196 $3,017444
Food and Beverages 29 516 520 513 516 $3,927,910 $2,537445
Health and Personal Care 8 62 62 62 62 $683,143 $3,673446
Gasoline Stations 19 167 170 166 168 $1,010,733 $2,005447
Clothing and Clothing Accessories 11 43 42 42 42 $192,216 $1,526448
Sporting Goods, Books, Music, etc. 20 117 116 118 117 $634,069 $1,806451
General Merchandise 12 692 699 706 699 $5,268,152 $2,512452
Page 35 of 701/ Oil Gas industry employment includes oil and gas exploration and oilfield services, or North American Industrial Classification System (NAICS) codes 211, 213111, 213112Quarterly Census of Employment Wages (QCEW): January - March 2020Data are preliminary and subject to revisionBlanks in the Employment, Total Earnings and Average Monthly Earnings columns due to confidentiality; data are suppressedSource: Alaska Department of Labor and Workforce Development, Research and Analysis Section

Kenai Peninsula Borough
Industrial Classification# of
UnitsJan
EmpFeb
EmpMar
EmpAverage
Monthly EmpTotal
EarningsAverage
Monthly Wage
SERVICE-PROVIDING 1,574 10,972 11,056 11,104 11,044 $112,263,515 $3,388
TRADE, TRANSPORTATION AND UTILITIES 438 3,581 3,575 3,621 3,592 $37,814,143 $3,509
Retail Trade 231 2,447 2,462 2,483 2,464 $19,275,429 $2,608
Miscellaneous 51 143 144 154 147 $823,531 $1,867453
Nonstore Retailers 19 120 114 118 117 $1,228,136 $3,499454
Transportation and Warehousing 158 717 697 721 712 $9,066,096 $4,244
Air Transportation 18 143 144 139 142 $1,989,412 $4,670481
Water Transportation 33 72 61 64 66 $1,074,926 $5,429483
Truck Transportation 17 83 80 83 82 $1,190,472 $4,839484
Transit and Ground Passenger 6485
Scenic and Sightseeing 49 55 64 77 65 $644,577 $3,306487
Support Activities 25 159 145 147 150 $2,489,812 $5,533488
Postal Service 2491
Couriers and Messengers 6 46 45 40 44 $621,322 $4,707492
Warehousing and Storage 2493
Utilities 7 211 211 211 211 $5,775,918 $9,125
Utilities 7 211 211 211 211 $5,775,918 $9,125221
INFORMATION 27 221 214 214 216 $2,858,923 $4,412
Publishing, except Internet 2511
Motion Picture and Sound Recording 3512
Broadcasting, except Internet 4 43 43 43 43 $371,473 $2,880515
Telecommunications 9 112 112 111 112 $1,801,641 $5,362517
ISPs, Data Processing 2518
Other Information Services 7 9 10 9 9 $218,277 $8,084519
FINANCIAL ACTIVITIES 112 535 547 541 541 $8,211,884 $5,060
Finance and Insurance 50 277 277 272 275 $4,727,647 $5,730
Credit Intermediation, etc. 24 188 189 183 187 $3,073,308 $5,478522
Securities, Investments 8 34 35 35 35 $960,914 $9,152523
Insurance Carriers 18 55 53 54 54 $693,425 $4,280524
Real Estate, Rental and Leasing 62 258 270 269 266 $3,484,236 $4,366
Real Estate 45 136 144 138 139 $1,415,269 $3,394531
Rental and Leasing Svcs. 17 122 126 131 126 $2,068,967 $5,473532
PROFESSIONAL AND BUSINESS SERVICES 205 735 743 727 735 $8,987,449 $4,076
Professional, Scientific, Tech. 129 431 429 438 433 $5,507,988 $4,240
Professional, Scientific, Tech. 129 431 429 438 433 $5,507,988 $4,240541
Mgmt. of Companies & Enterprises 6 29 32 25 29 $1,051,726 $12,089
Mgmt. of Companies and Enterprises 6 29 32 25 29 $1,051,726 $12,089551
Administrative and Waste Services 70 275 282 264 274 $2,427,735 $2,953
Administrative and Support Services 60 183 194 176 184 $1,158,762 $2,099561
Waste Management/Remediation 10 92 88 88 89 $1,268,973 $4,753562
EDUCATIONAL AND HEALTH SERVICES 253 3,291 3,303 3,333 3,309 $39,751,098 $4,004
Educational Services 26 138 152 130 140 $821,040 $1,955
Educational Services 26 138 152 130 140 $821,040 $1,955611
Health Care and Social Assistance 227 3,153 3,151 3,203 3,169 $38,930,058 $4,095
Out Patient Health Care 131 1,122 1,124 1,146 1,131 $11,124,094 $3,279621
Hospitals 2622
Nursing and Residential Care 19623
Social Assistance 75 584 596 608 596 $4,608,792 $2,578624
LEISURE AND HOSPITALITY 357 1,823 1,869 1,881 1,858 $9,245,240 $1,659
Arts, Entertainment and Recreation 61 173 178 171 174 $771,220 $1,477
Performing Arts 6 19 19 23 20 $58,383 $973711
Museums, Zoos, Parks, etc. 5 20 19 19 19 $193,538 $3,395712
Amusements, Gambling, Recreation 50 134 140 129 134 $519,299 $1,292713
Accommodation and Food Services 296 1,650 1,691 1,710 1,684 $8,474,020 $1,677
Accommodation 114 495 516 536 516 $3,257,711 $2,104721
Food Services and Drinking Places 182 1,155 1,175 1,174 1,168 $5,216,309 $1,489722
OTHER SERVICES 181 782 802 784 789 $5,376,063 $2,271
Repair and Maintenance 56 207 218 208 211 $1,945,198 $3,073811
Personal and Laundry 33 138 140 139 139 $673,619 $1,615812
Membership Organizations, etc. 69 412 418 412 414 $2,634,456 $2,121813
Private Households 23 25 26 25 25 $122,789 $1,637814
Page 36 of 701/ Oil Gas industry employment includes oil and gas exploration and oilfield services, or North American Industrial Classification System (NAICS) codes 211, 213111, 213112Quarterly Census of Employment Wages (QCEW): January - March 2020Data are preliminary and subject to revisionBlanks in the Employment, Total Earnings and Average Monthly Earnings columns due to confidentiality; data are suppressedSource: Alaska Department of Labor and Workforce Development, Research and Analysis Section

Kenai Peninsula Borough
Industrial Classification# of
UnitsJan
EmpFeb
EmpMar
EmpAverage
Monthly EmpTotal
EarningsAverage
Monthly Wage
SERVICE-PROVIDING 1,574 10,972 11,056 11,104 11,044 $112,263,515 $3,388
OTHER SERVICES 181 782 802 784 789 $5,376,063 $2,271
UNCLASSIFIED ESTABLISHMENTS 1 4 3 3 3 $18,714 $2,079
Page 37 of 701/ Oil Gas industry employment includes oil and gas exploration and oilfield services, or North American Industrial Classification System (NAICS) codes 211, 213111, 213112Quarterly Census of Employment Wages (QCEW): January - March 2020Data are preliminary and subject to revisionBlanks in the Employment, Total Earnings and Average Monthly Earnings columns due to confidentiality; data are suppressedSource: Alaska Department of Labor and Workforce Development, Research and Analysis Section

Ketchikan Gateway Borough
Industrial Classification# of
UnitsJan
EmpFeb
EmpMar
EmpAverage
Monthly EmpTotal
EarningsAverage
Monthly Wage
TOTAL INDUSTRIES 610 6,251 6,372 6,452 6,358 $77,480,481 $4,062
TOTAL GOVERNMENT 47 1,899 1,925 1,928 1,917 $27,046,552 $4,703
FEDERAL GOVERNMENT 13 216 214 243 224 $4,383,710 $6,523
STATE GOVERNMENT 25 486 478 458 474 $6,941,919 $4,882
LOCAL GOVERNMENT 9 1,197 1,233 1,227 1,219 $15,720,923 $4,299
PRIVATE OWNERSHIP 563 4,352 4,447 4,524 4,441 $50,433,929 $3,785
GOODS-PRODUCING 106 539 546 549 545 $7,379,889 $4,514
NATURAL RESOURCES AND MINING 18 59 52 57 56 $472,011 $2,810
Agriculture, Forestry, Fishing, Hunting 18 59 52 57 56 $472,011 $2,810
Crop Production 2111
Animal Production 8112
Forestry and Logging 4113
Fishing, Hunting, Trapping 2114
Agriculture, Forestry Support 2115
CONSTRUCTION 70 259 259 252 257 $4,439,134 $5,758
Construction of Buildings 30 123 120 119 121 $2,378,475 $6,552236
Heavy Construction 11 28 23 22 24 $514,374 $7,144237
Specialty Trade Contractors 29 108 116 111 112 $1,546,285 $4,602238
MANUFACTURING 18 221 235 240 232 $2,468,744 $3,547
Food 9 121 130 133 128 $957,513 $2,494311
Beverage and Tobacco Products 1312
Wood Products 1321
Printing and Support Activities 1323
Chemicals 1325
Nonmetallic Mineral Products 1327
Fabricated Metal Products 1332
Transportation Equipment 2336
Miscellaneous 1339
SERVICE-PROVIDING 457 3,813 3,901 3,975 3,896 $43,054,039 $3,684
TRADE, TRANSPORTATION AND UTILITIES 175 1,313 1,322 1,322 1,319 $14,285,016 $3,610
Wholesale Trade 14
Wholesale, Durable Goods 6423
Wholesale, Nondurable Goods 8 79 78 79 79 $801,883 $3,383424
Retail Trade 96 746 751 754 750 $6,473,282 $2,877
Motor Vehicle and Parts Dealers 5 54 55 54 54 $493,128 $3,044441
Furniture and Home Furnishings 4 15 15 15 15 $94,495 $2,100442
Electronics and Appliances 3443
Building Material and Garden 5444
Food and Beverages 13 258 263 256 259 $1,959,835 $2,522445
Health and Personal Care 2446
Gasoline Stations 4 40 40 40 40 $207,570 $1,730447
Clothing and Clothing Accessories 21 12 12 16 13 $125,400 $3,215448
Sporting Goods, Books, Music, etc. 4 15 14 13 14 $51,295 $1,221451
General Merchandise 7 198 194 194 195 $1,703,169 $2,911452
Miscellaneous 26 64 70 75 70 $463,514 $2,207453
Nonstore Retailers 2454
Transportation and Warehousing 64 449 454 452 452 $6,135,681 $4,525
Air Transportation 13 145 148 149 147 $1,898,856 $4,306481
Water Transportation 6 106 111 115 111 $2,040,074 $6,126483
Truck Transportation 6 29 30 33 31 $312,175 $3,357484
Transit and Ground Passenger 2485
Scenic and Sightseeing 26 37 42 47 42 $457,411 $3,630487
Support Activities 7 86 77 62 75 $1,041,759 $4,630488
Couriers and Messengers 2492
Page 38 of 701/ Oil Gas industry employment includes oil and gas exploration and oilfield services, or North American Industrial Classification System (NAICS) codes 211, 213111, 213112Quarterly Census of Employment Wages (QCEW): January - March 2020Data are preliminary and subject to revisionBlanks in the Employment, Total Earnings and Average Monthly Earnings columns due to confidentiality; data are suppressedSource: Alaska Department of Labor and Workforce Development, Research and Analysis Section

Ketchikan Gateway Borough
Industrial Classification# of
UnitsJan
EmpFeb
EmpMar
EmpAverage
Monthly EmpTotal
EarningsAverage
Monthly Wage
SERVICE-PROVIDING 457 3,813 3,901 3,975 3,896 $43,054,039 $3,684
TRADE, TRANSPORTATION AND UTILITIES 175 1,313 1,322 1,322 1,319 $14,285,016 $3,610
Transportation and Warehousing 64 449 454 452 452 $6,135,681 $4,525
Warehousing and Storage 2493
Utilities 1
Utilities 1221
INFORMATION 8 78 75 77 77 $654,525 $2,833
Publishing, except Internet 2511
Motion Picture and Sound Recording 1512
Broadcasting, except Internet 2515
Telecommunications 3 21 20 20 20 $339,796 $5,663517
FINANCIAL ACTIVITIES 49 346 350 344 347 $5,147,742 $4,945
Finance and Insurance 21 221 222 221 221 $3,400,291 $5,129
Credit Intermediation, etc. 11 161 162 161 161 $2,673,069 $5,534522
Securities, Investments 3 4 4 4 4 $40,494 $3,374523
Insurance Carriers 7 56 56 56 56 $686,728 $4,088524
Real Estate, Rental and Leasing 28 125 128 123 125 $1,747,451 $4,660
Real Estate 25531
Rental and Leasing Svcs. 3532
PROFESSIONAL AND BUSINESS SERVICES 56 290 300 356 315 $3,990,920 $4,223
Professional, Scientific, Tech. 29 134 137 173 148 $1,648,547 $3,713
Professional, Scientific, Tech. 29 134 137 173 148 $1,648,547 $3,713541
Mgmt. of Companies & Enterprises 6 43 43 45 44 $1,230,806 $9,324
Mgmt. of Companies and Enterprises 6 43 43 45 44 $1,230,806 $9,324551
Administrative and Waste Services 21 113 120 138 124 $1,111,567 $2,988
Administrative and Support Services 18 95 101 117 104 $879,247 $2,818561
Waste Management/Remediation 3 18 19 21 19 $232,320 $4,076562
EDUCATIONAL AND HEALTH SERVICES 53 982 1,021 1,011 1,005 $13,981,538 $4,637
Educational Services 8 10 14 18 14 $134,609 $3,205
Educational Services 8 10 14 18 14 $134,609 $3,205611
Health Care and Social Assistance 45 972 1,007 993 991 $13,846,929 $4,658
Out Patient Health Care 25 249 247 253 250 $1,572,186 $2,096621
Hospitals 1622
Nursing and Residential Care 4623
Social Assistance 15 208 221 228 219 $1,769,321 $2,693624
LEISURE AND HOSPITALITY 77 656 678 708 681 $3,966,452 $1,941
Arts, Entertainment and Recreation 24 63 71 78 71 $583,210 $2,738
Performing Arts 3711
Museums, Zoos, Parks, etc. 1712
Amusements, Gambling, Recreation 20 28 36 39 34 $222,052 $2,177713
Accommodation and Food Services 53 593 607 630 610 $3,383,242 $1,849
Accommodation 16 250 254 266 257 $1,754,354 $2,275721
Food Services and Drinking Places 37 343 353 364 353 $1,628,888 $1,538722
OTHER SERVICES 39 148 155 157 153 $1,027,845 $2,239
Repair and Maintenance 9 22 25 26 24 $263,473 $3,659811
Personal and Laundry 8812
Membership Organizations, etc. 21 91 95 94 93 $598,759 $2,146813
Private Households 1814
Page 39 of 701/ Oil Gas industry employment includes oil and gas exploration and oilfield services, or North American Industrial Classification System (NAICS) codes 211, 213111, 213112Quarterly Census of Employment Wages (QCEW): January - March 2020Data are preliminary and subject to revisionBlanks in the Employment, Total Earnings and Average Monthly Earnings columns due to confidentiality; data are suppressedSource: Alaska Department of Labor and Workforce Development, Research and Analysis Section

Kodiak Island Borough
Industrial Classification# of
UnitsJan
EmpFeb
EmpMar
EmpAverage
Monthly EmpTotal
EarningsAverage
Monthly Wage
TOTAL INDUSTRIES 490 5,126 5,987 5,924 5,679 $66,446,777 $3,900
TOTAL GOVERNMENT 69 1,599 1,582 1,584 1,588 $20,112,197 $4,222
FEDERAL GOVERNMENT 15 271 263 280 271 $3,972,489 $4,886
STATE GOVERNMENT 34 249 256 256 254 $3,743,915 $4,913
LOCAL GOVERNMENT 20 1,079 1,063 1,048 1,063 $12,395,793 $3,887
PRIVATE OWNERSHIP 421 3,527 4,405 4,340 4,091 $46,334,580 $3,775
GOODS-PRODUCING 105 963 1,818 1,789 1,523 $16,754,793 $3,667
NATURAL RESOURCES AND MINING 39 81 88 117 95 $2,396,200 $8,408
Agriculture, Forestry, Fishing, Hunting 38
Crop Production 1111
Animal Production 1112
Forestry and Logging 3 29 44 43 39 $665,558 $5,689113
Fishing, Hunting, Trapping 33 34 22 49 35 $1,453,205 $13,840114
Mining 1
Mining Support Activities 1213
CONSTRUCTION 41 130 139 129 133 $1,876,509 $4,703
Construction of Buildings 13 48 50 37 45 $525,112 $3,890236
Heavy Construction 7 33 40 43 39 $770,761 $6,588237
Specialty Trade Contractors 21 49 49 49 49 $580,636 $3,950238
MANUFACTURING 25 752 1,591 1,543 1,295 $12,482,084 $3,213
Food 19 714 1,558 1,509 1,260 $12,123,047 $3,207311
Beverage and Tobacco Products 1312
Wood Products 1321
Nonmetallic Mineral Products 1327
Fabricated Metal Products 1332
Transportation Equipment 2336
SERVICE-PROVIDING 316 2,564 2,587 2,551 2,567 $29,579,787 $3,841
TRADE, TRANSPORTATION AND UTILITIES 102 770 800 781 784 $7,910,130 $3,363
Wholesale Trade 13
Wholesale, Durable Goods 4 22 23 22 22 $311,104 $4,714423
Wholesale, Nondurable Goods 7 19 19 19 19 $236,993 $4,158424
Wholesale, Electronic Markets 2425
Retail Trade 32 471 471 471 471 $3,775,337 $2,672
Motor Vehicle and Parts Dealers 6 26 24 24 25 $201,279 $2,684441
Furniture and Home Furnishings 3 17 15 15 16 $77,223 $1,609442
Building Material and Garden 2444
Food and Beverages 4445
Health and Personal Care 1446
Gasoline Stations 3447
Sporting Goods, Books, Music, etc. 4 22 23 23 23 $164,738 $2,388451
General Merchandise 3452
Miscellaneous 3 11 11 10 11 $43,502 $1,318453
Nonstore Retailers 3454
Transportation and Warehousing 56 221 250 233 235 $2,568,138 $3,643
Air Transportation 10 78 73 75 75 $618,819 $2,750481
Water Transportation 27 54 52 60 55 $1,102,464 $6,682483
Truck Transportation 6 27 31 33 30 $326,339 $3,626484
Transit and Ground Passenger 2485
Scenic and Sightseeing 2487
Support Activities 6 18 50 23 30 $213,665 $2,374488
Postal Service 1491
Couriers and Messengers 2492
Utilities 1
Utilities 1221
Page 40 of 701/ Oil Gas industry employment includes oil and gas exploration and oilfield services, or North American Industrial Classification System (NAICS) codes 211, 213111, 213112Quarterly Census of Employment Wages (QCEW): January - March 2020Data are preliminary and subject to revisionBlanks in the Employment, Total Earnings and Average Monthly Earnings columns due to confidentiality; data are suppressedSource: Alaska Department of Labor and Workforce Development, Research and Analysis Section

Kodiak Island Borough
Industrial Classification# of
UnitsJan
EmpFeb
EmpMar
EmpAverage
Monthly EmpTotal
EarningsAverage
Monthly Wage
SERVICE-PROVIDING 316 2,564 2,587 2,551 2,567 $29,579,787 $3,841
INFORMATION 7 45 46 47 46 $441,159 $3,197
Publishing, except Internet 1511
Motion Picture and Sound Recording 1512
Broadcasting, except Internet 2515
Telecommunications 3 15 15 15 15 $220,308 $4,896517
FINANCIAL ACTIVITIES 22 119 119 121 120 $2,502,525 $6,951
Finance and Insurance 11 60 61 65 62 $1,023,780 $5,504
Credit Intermediation, etc. 6 41 41 43 42 $624,108 $4,953522
Securities, Investments 1523
Insurance Carriers 4524
Real Estate, Rental and Leasing 11 59 58 56 58 $1,478,745 $8,499
Real Estate 8531
Rental and Leasing Svcs. 3532
PROFESSIONAL AND BUSINESS SERVICES 52 257 263 259 260 $4,726,536 $6,060
Professional, Scientific, Tech. 30 49 54 55 53 $709,068 $4,460
Professional, Scientific, Tech. 30 49 54 55 53 $709,068 $4,460541
Mgmt. of Companies & Enterprises 4 118 120 117 118 $3,152,801 $8,906
Mgmt. of Companies and Enterprises 4 118 120 117 118 $3,152,801 $8,906551
Administrative and Waste Services 18 90 89 87 89 $864,667 $3,238
Administrative and Support Services 16561
Waste Management/Remediation 2562
EDUCATIONAL AND HEALTH SERVICES 47 802 803 800 802 $10,728,996 $4,459
Educational Services 2
Educational Services 2611
Health Care and Social Assistance 45
Out Patient Health Care 20 349 351 352 351 $5,263,793 $4,999621
Hospitals 1622
Nursing and Residential Care 3 53 49 48 50 $357,934 $2,386623
Social Assistance 21 131 130 125 129 $889,793 $2,299624
LEISURE AND HOSPITALITY 57 390 384 364 379 $1,985,986 $1,747
Arts, Entertainment and Recreation 15 30 31 31 31 $153,763 $1,653
Performing Arts 1711
Museums, Zoos, Parks, etc. 2712
Amusements, Gambling, Recreation 12 21 22 22 22 $79,929 $1,211713
Accommodation and Food Services 42 360 353 333 349 $1,832,223 $1,750
Accommodation 16 91 97 90 93 $547,784 $1,963721
Food Services and Drinking Places 26 269 256 243 256 $1,284,439 $1,672722
OTHER SERVICES 29 181 172 179 177 $1,284,455 $2,419
Repair and Maintenance 10 62 49 55 55 $641,900 $3,890811
Personal and Laundry 4 9 10 10 10 $28,960 $965812
Membership Organizations, etc. 15 110 113 114 112 $613,595 $1,826813
Page 41 of 701/ Oil Gas industry employment includes oil and gas exploration and oilfield services, or North American Industrial Classification System (NAICS) codes 211, 213111, 213112Quarterly Census of Employment Wages (QCEW): January - March 2020Data are preliminary and subject to revisionBlanks in the Employment, Total Earnings and Average Monthly Earnings columns due to confidentiality; data are suppressedSource: Alaska Department of Labor and Workforce Development, Research and Analysis Section

Kusilvak Census Area (formerly Wade Hampton CA)
Industrial Classification# of
UnitsJan
EmpFeb
EmpMar
EmpAverage
Monthly EmpTotal
EarningsAverage
Monthly Wage
TOTAL INDUSTRIES 149 2,109 2,166 2,119 2,131 $16,504,279 $2,582
TOTAL GOVERNMENT 90 1,397 1,485 1,447 1,443 $10,444,615 $2,413
FEDERAL GOVERNMENT 12 21 23 22 22 $159,695 $2,420
STATE GOVERNMENT 35 31 32 29 31 $537,188 $5,776
LOCAL GOVERNMENT 43 1,345 1,430 1,396 1,390 $9,747,732 $2,338
PRIVATE OWNERSHIP 59 712 681 672 688 $6,059,664 $2,936
GOODS-PRODUCING 3
CONSTRUCTION 1
Heavy Construction 1237
MANUFACTURING 2
Food 1311
Transportation Equipment 1336
SERVICE-PROVIDING 56
TRADE, TRANSPORTATION AND UTILITIES 33 434 410 400 415 $2,140,046 $1,719
Wholesale Trade 1
Wholesale, Nondurable Goods 1424
Retail Trade 28 380 356 346 361 $1,593,539 $1,471
Food and Beverages 7 56 51 50 52 $249,077 $1,597445
Gasoline Stations 3 33 31 35 33 $228,675 $2,310447
General Merchandise 13 274 256 243 258 $976,723 $1,262452
Nonstore Retailers 5 17 18 18 18 $139,064 $2,575454
Transportation and Warehousing 3
Air Transportation 2481
Truck Transportation 1484
Utilities 1
Utilities 1221
FINANCIAL ACTIVITIES 1
Real Estate, Rental and Leasing 1
Real Estate 1531
PROFESSIONAL AND BUSINESS SERVICES 3 20 24 27 24 $226,032 $3,139
Mgmt. of Companies & Enterprises 3 20 24 27 24 $226,032 $3,139
Mgmt. of Companies and Enterprises 3 20 24 27 24 $226,032 $3,139551
EDUCATIONAL AND HEALTH SERVICES 3
Health Care and Social Assistance 3
Out Patient Health Care 1621
Social Assistance 2624
LEISURE AND HOSPITALITY 4 24 23 18 22 $34,587 $524
Arts, Entertainment and Recreation 3
Amusements, Gambling, Recreation 3713
Accommodation and Food Services 1
Accommodation 1721
OTHER SERVICES 12 113 107 111 110 $597,955 $1,812
Membership Organizations, etc. 12 113 107 111 110 $597,955 $1,812813
Page 42 of 701/ Oil Gas industry employment includes oil and gas exploration and oilfield services, or North American Industrial Classification System (NAICS) codes 211, 213111, 213112Quarterly Census of Employment Wages (QCEW): January - March 2020Data are preliminary and subject to revisionBlanks in the Employment, Total Earnings and Average Monthly Earnings columns due to confidentiality; data are suppressedSource: Alaska Department of Labor and Workforce Development, Research and Analysis Section

Lake and Peninsula Borough
Industrial Classification# of
UnitsJan
EmpFeb
EmpMar
EmpAverage
Monthly EmpTotal
EarningsAverage
Monthly Wage
TOTAL INDUSTRIES 124 729 756 789 758 $6,110,735 $2,687
TOTAL GOVERNMENT 58 452 476 462 463 $3,146,942 $2,266
FEDERAL GOVERNMENT 11 23 26 27 25 $299,068 $3,988
STATE GOVERNMENT 10 4 4 3 4 $50,870 $4,239
LOCAL GOVERNMENT 37 425 446 432 434 $2,797,004 $2,148
PRIVATE OWNERSHIP 66 277 280 327 295 $2,963,793 $3,349
GOODS-PRODUCING 11
NATURAL RESOURCES AND MINING 1
Agriculture, Forestry, Fishing, Hunting 1
Fishing, Hunting, Trapping 1114
CONSTRUCTION 7 8 8 7 8 $70,700 $2,946
Construction of Buildings 2236
Heavy Construction 3237
Specialty Trade Contractors 2238
MANUFACTURING 3
Food 3311
SERVICE-PROVIDING 55
TRADE, TRANSPORTATION AND UTILITIES 19 138 135 133 135 $1,188,644 $2,935
Retail Trade 8 27 29 30 29 $204,619 $2,352
Food and Beverages 3445
General Merchandise 3 8 8 8 8 $37,421 $1,559452
Nonstore Retailers 2454
Transportation and Warehousing 7 88 84 79 84 $852,761 $3,384
Air Transportation 5 86 83 77 82 $848,741 $3,450481
Truck Transportation 1484
Transit and Ground Passenger 1485
Utilities 4 23 22 24 23 $131,264 $1,902
Utilities 4 23 22 24 23 $131,264 $1,902221
INFORMATION 1
Telecommunications 1517
FINANCIAL ACTIVITIES 2
Finance and Insurance 1
Securities, Investments 1523
Real Estate, Rental and Leasing 1
Real Estate 1531
PROFESSIONAL AND BUSINESS SERVICES 5 9 8 5 7 $208,310 $9,920
Professional, Scientific, Tech. 2
Professional, Scientific, Tech. 2541
Mgmt. of Companies & Enterprises 2
Mgmt. of Companies and Enterprises 2551
Administrative and Waste Services 1
Administrative and Support Services 1561
EDUCATIONAL AND HEALTH SERVICES 2
Educational Services 1
Educational Services 1611
Health Care and Social Assistance 1
Out Patient Health Care 1621
LEISURE AND HOSPITALITY 22 43 39 41 41 $402,601 $3,273
Arts, Entertainment and Recreation 7
Amusements, Gambling, Recreation 7713
Accommodation and Food Services 15
Accommodation 15721
Page 43 of 701/ Oil Gas industry employment includes oil and gas exploration and oilfield services, or North American Industrial Classification System (NAICS) codes 211, 213111, 213112Quarterly Census of Employment Wages (QCEW): January - March 2020Data are preliminary and subject to revisionBlanks in the Employment, Total Earnings and Average Monthly Earnings columns due to confidentiality; data are suppressedSource: Alaska Department of Labor and Workforce Development, Research and Analysis Section

Lake and Peninsula Borough
Industrial Classification# of
UnitsJan
EmpFeb
EmpMar
EmpAverage
Monthly EmpTotal
EarningsAverage
Monthly Wage
SERVICE-PROVIDING 55
OTHER SERVICES 4
Membership Organizations, etc. 4813
Page 44 of 701/ Oil Gas industry employment includes oil and gas exploration and oilfield services, or North American Industrial Classification System (NAICS) codes 211, 213111, 213112Quarterly Census of Employment Wages (QCEW): January - March 2020Data are preliminary and subject to revisionBlanks in the Employment, Total Earnings and Average Monthly Earnings columns due to confidentiality; data are suppressedSource: Alaska Department of Labor and Workforce Development, Research and Analysis Section

Matanuska-Susitna Borough
Industrial Classification# of
UnitsJan
EmpFeb
EmpMar
EmpAverage
Monthly EmpTotal
EarningsAverage
Monthly Wage
TOTAL INDUSTRIES 2,320 24,636 24,951 25,020 24,869 $278,524,531 $3,733
TOTAL GOVERNMENT 102 5,360 5,557 5,659 5,525 $66,951,974 $4,039
FEDERAL GOVERNMENT 19 262 257 363 294 $5,542,958 $6,285
STATE GOVERNMENT 74 1,374 1,361 1,388 1,374 $19,375,991 $4,701
LOCAL GOVERNMENT 9 3,724 3,939 3,908 3,857 $42,033,025 $3,633
PRIVATE OWNERSHIP 2,218 19,276 19,394 19,361 19,344 $211,572,557 $3,646
GOODS-PRODUCING 569 2,939 2,991 2,932 2,954 $50,313,039 $5,677
NATURAL RESOURCES AND MINING 57 150 155 167 157 $1,042,857 $2,214
Agriculture, Forestry, Fishing, Hunting 42 125 124 136 128 $636,073 $1,656
Crop Production 32 95 93 108 99 $472,947 $1,592111
Animal Production 5 10 10 10 10 $76,243 $2,541112
Forestry and Logging 2113
Fishing, Hunting, Trapping 1114
Agriculture, Forestry Support 2115
Mining 15 25 31 31 29 $406,784 $4,676
Mining, except Oil and Gas 12212
Mining Support Activities 3213
CONSTRUCTION 455 2,518 2,570 2,497 2,528 $46,752,975 $6,165
Construction of Buildings 128 1,010 1,009 1,012 1,010 $17,482,131 $5,770236
Heavy Construction 38 413 461 449 441 $13,740,527 $10,386237
Specialty Trade Contractors 289 1,095 1,100 1,036 1,077 $15,530,317 $4,807238
MANUFACTURING 57 271 266 268 268 $2,517,207 $3,131
Food 5 41 40 43 41 $282,858 $2,300311
Beverage and Tobacco Products 8 52 50 51 51 $397,080 $2,595312
Apparel 3315
Leather and Allied Products 1316
Wood Products 5 14 14 14 14 $143,562 $3,418321
Paper 1322
Printing and Support Activities 3 14 12 12 13 $51,892 $1,331323
Chemicals 3325
Plastics and Rubber Products 2326
Nonmetallic Mineral Products 2327
Fabricated Metal Products 10 33 31 31 32 $372,201 $3,877332
Machinery 3333
Computer and Electronic Products 2334
Transportation Equipment 4336
Other Transp. Equipment 13369
Furniture and Related Products 2337
Miscellaneous 3339
SERVICE-PROVIDING 1,649 16,337 16,403 16,429 16,390 $161,259,518 $3,280
TRADE, TRANSPORTATION AND UTILITIES 377 5,131 5,049 5,078 5,086 $49,074,662 $3,216
Wholesale Trade 49 162 164 169 165 $2,411,619 $4,872
Wholesale, Durable Goods 31 93 94 99 95 $1,528,842 $5,364423
Wholesale, Nondurable Goods 13 59 60 60 60 $726,379 $4,035424
Wholesale, Electronic Markets 5 10 10 10 10 $156,398 $5,213425
Retail Trade 232 3,859 3,775 3,795 3,810 $30,749,423 $2,690
Motor Vehicle and Parts Dealers 32 522 527 540 530 $5,935,107 $3,733441
Furniture and Home Furnishings 14 69 72 66 69 $740,175 $3,576442
Electronics and Appliances 4 12 12 10 11 $86,031 $2,607443
Building Material and Garden 24 492 486 508 495 $4,901,098 $3,300444
Food and Beverages 20 374 378 380 377 $2,586,679 $2,287445
Health and Personal Care 15 103 95 100 99 $1,016,130 $3,421446
Gasoline Stations 19 229 231 223 228 $1,534,748 $2,244447
Clothing and Clothing Accessories 11 65 60 58 61 $369,471 $2,019448
Page 45 of 701/ Oil Gas industry employment includes oil and gas exploration and oilfield services, or North American Industrial Classification System (NAICS) codes 211, 213111, 213112Quarterly Census of Employment Wages (QCEW): January - March 2020Data are preliminary and subject to revisionBlanks in the Employment, Total Earnings and Average Monthly Earnings columns due to confidentiality; data are suppressedSource: Alaska Department of Labor and Workforce Development, Research and Analysis Section

Matanuska-Susitna Borough
Industrial Classification# of
UnitsJan
EmpFeb
EmpMar
EmpAverage
Monthly EmpTotal
EarningsAverage
Monthly Wage
SERVICE-PROVIDING 1,649 16,337 16,403 16,429 16,390 $161,259,518 $3,280
TRADE, TRANSPORTATION AND UTILITIES 377 5,131 5,049 5,078 5,086 $49,074,662 $3,216
Retail Trade 232 3,859 3,775 3,795 3,810 $30,749,423 $2,690
Sporting Goods, Books, Music, etc. 18 154 157 146 152 $595,738 $1,306451
General Merchandise 9 1,263 1,200 1,213 1,225 $8,491,634 $2,311452
Miscellaneous 53 438 416 408 421 $2,765,129 $2,189453
Nonstore Retailers 13 138 141 143 141 $1,727,483 $4,084454
Transportation and Warehousing 87 780 783 788 784 $8,897,170 $3,783
Air Transportation 11 130 122 131 128 $1,934,702 $5,038481
Water Transportation 2483
Truck Transportation 13 109 117 114 113 $2,177,669 $6,424484
Transit and Ground Passenger 9 334 327 330 330 $2,826,728 $2,855485
Scenic and Sightseeing 7 20 20 24 21 $205,343 $3,259487
Support Activities 26 98 109 111 106 $1,014,421 $3,190488
Postal Service 9 36 35 33 35 $211,543 $2,015491
Couriers and Messengers 8 45 46 38 43 $482,113 $3,737492
Warehousing and Storage 2493
Utilities 9 330 327 326 328 $7,016,450 $7,131
Utilities 9 330 327 326 328 $7,016,450 $7,131221
INFORMATION 29 501 492 494 496 $7,886,715 $5,300
Publishing, except Internet 6511
Motion Picture and Sound Recording 1512
Broadcasting, except Internet 2515
Telecommunications 14 333 329 329 330 $6,754,447 $6,823517
ISPs, Data Processing 2518
Other Information Services 4 6 6 6 6 $94,668 $5,259519
FINANCIAL ACTIVITIES 141 849 839 844 844 $10,806,080 $4,268
Finance and Insurance 79 506 504 505 505 $7,329,876 $4,838
Credit Intermediation, etc. 39 349 348 350 349 $5,265,967 $5,030522
Securities, Investments 6 29 27 26 27 $730,970 $9,024523
Insurance Carriers 34 128 129 129 129 $1,332,939 $3,444524
Real Estate, Rental and Leasing 62 343 335 339 339 $3,476,205 $3,418
Real Estate 51 294 289 293 292 $3,052,886 $3,485531
Rental and Leasing Svcs. 11 49 46 46 47 $423,319 $3,002532
PROFESSIONAL AND BUSINESS SERVICES 301 1,329 1,383 1,367 1,360 $17,413,741 $4,268
Professional, Scientific, Tech. 185 683 712 708 701 $10,850,828 $5,160
Professional, Scientific, Tech. 185 683 712 708 701 $10,850,828 $5,160541
Mgmt. of Companies & Enterprises 4 63 63 63 63 $1,123,684 $5,945
Mgmt. of Companies and Enterprises 4 63 63 63 63 $1,123,684 $5,945551
Administrative and Waste Services 112 583 608 596 596 $5,439,229 $3,042
Administrative and Support Services 97 482 507 494 494 $4,143,482 $2,796561
Waste Management/Remediation 15 101 101 102 101 $1,295,747 $4,276562
EDUCATIONAL AND HEALTH SERVICES 343 5,054 5,077 5,099 5,077 $56,695,965 $3,722
Educational Services 37 355 347 339 347 $3,052,628 $2,932
Educational Services 37 355 347 339 347 $3,052,628 $2,932611
Health Care and Social Assistance 306 4,699 4,730 4,760 4,730 $53,643,337 $3,780
Out Patient Health Care 195 2,406 2,413 2,428 2,416 $29,956,560 $4,133621
Hospitals 4622
Nursing and Residential Care 34623
Social Assistance 73 1,069 1,055 1,050 1,058 $6,998,962 $2,205624
LEISURE AND HOSPITALITY 285 2,564 2,625 2,625 2,605 $12,980,351 $1,661
Arts, Entertainment and Recreation 63 330 339 340 336 $1,459,283 $1,448
Performing Arts 14 79 82 82 81 $370,777 $1,526711
Museums, Zoos, Parks, etc. 3 7 7 6 7 $35,046 $1,669712
Amusements, Gambling, Recreation 46 244 250 252 249 $1,053,460 $1,410713
Accommodation and Food Services 222 2,234 2,286 2,285 2,268 $11,521,068 $1,693
Accommodation 69 334 366 391 364 $2,685,424 $2,459721
Food Services and Drinking Places 153 1,900 1,920 1,894 1,905 $8,835,643 $1,546722
OTHER SERVICES 170 906 932 918 919 $6,393,015 $2,319
Repair and Maintenance 57 286 296 294 292 $3,375,592 $3,853811
Personal and Laundry 48 250 250 249 250 $1,282,850 $1,710812
Page 46 of 701/ Oil Gas industry employment includes oil and gas exploration and oilfield services, or North American Industrial Classification System (NAICS) codes 211, 213111, 213112Quarterly Census of Employment Wages (QCEW): January - March 2020Data are preliminary and subject to revisionBlanks in the Employment, Total Earnings and Average Monthly Earnings columns due to confidentiality; data are suppressedSource: Alaska Department of Labor and Workforce Development, Research and Analysis Section

Matanuska-Susitna Borough
Industrial Classification# of
UnitsJan
EmpFeb
EmpMar
EmpAverage
Monthly EmpTotal
EarningsAverage
Monthly Wage
SERVICE-PROVIDING 1,649 16,337 16,403 16,429 16,390 $161,259,518 $3,280
OTHER SERVICES 170 906 932 918 919 $6,393,015 $2,319
Membership Organizations, etc. 50 350 364 353 356 $1,619,699 $1,517813
Private Households 15 20 22 22 21 $114,874 $1,823814
UNCLASSIFIED ESTABLISHMENTS 3 3 6 4 4 $8,989 $749
Page 47 of 701/ Oil Gas industry employment includes oil and gas exploration and oilfield services, or North American Industrial Classification System (NAICS) codes 211, 213111, 213112Quarterly Census of Employment Wages (QCEW): January - March 2020Data are preliminary and subject to revisionBlanks in the Employment, Total Earnings and Average Monthly Earnings columns due to confidentiality; data are suppressedSource: Alaska Department of Labor and Workforce Development, Research and Analysis Section

Nome Census Area
Industrial Classification# of
UnitsJan
EmpFeb
EmpMar
EmpAverage
Monthly EmpTotal
EarningsAverage
Monthly Wage
TOTAL INDUSTRIES 313 3,864 3,900 3,849 3,871 $50,761,179 $4,371
TOTAL GOVERNMENT 128 1,694 1,738 1,727 1,719 $19,421,210 $3,766
FEDERAL GOVERNMENT 23 49 51 54 51 $812,278 $5,309
STATE GOVERNMENT 41 191 195 194 193 $3,817,480 $6,593
LOCAL GOVERNMENT 64 1,454 1,492 1,479 1,475 $14,791,452 $3,343
PRIVATE OWNERSHIP 185 2,170 2,162 2,122 2,151 $31,339,968 $4,857
GOODS-PRODUCING 25 54 52 50 52 $845,154 $5,418
NATURAL RESOURCES AND MINING 8
Agriculture, Forestry, Fishing, Hunting 1
Crop Production 1111
Mining 7
Mining, except Oil and Gas 7212
CONSTRUCTION 14 41 38 36 38 $543,505 $4,768
Construction of Buildings 5 19 18 17 18 $112,446 $2,082236
Heavy Construction 7237
Specialty Trade Contractors 2238
MANUFACTURING 3
Food 2311
Leather and Allied Products 1316
SERVICE-PROVIDING 160 2,116 2,110 2,072 2,099 $30,494,814 $4,843
TRADE, TRANSPORTATION AND UTILITIES 50 635 621 605 620 $7,000,211 $3,764
Wholesale Trade 1
Wholesale, Electronic Markets 1425
Retail Trade 35 385 358 354 366 $2,647,336 $2,411
Motor Vehicle and Parts Dealers 3 11 10 10 10 $127,885 $4,263441
Building Material and Garden 2444
Food and Beverages 7 93 99 94 95 $684,281 $2,401445
Gasoline Stations 1447
Clothing and Clothing Accessories 1448
General Merchandise 14 206 182 180 189 $1,005,691 $1,774452
Miscellaneous 1453
Nonstore Retailers 6 60 53 57 57 $721,497 $4,219454
Transportation and Warehousing 8 206 214 215 212 $4,088,541 $6,429
Air Transportation 5 193 202 204 200 $4,004,914 $6,675481
Truck Transportation 1484
Transit and Ground Passenger 1485
Support Activities 1488
Utilities 6
Utilities 6221
INFORMATION 5
Publishing, except Internet 1511
Broadcasting, except Internet 2515
Telecommunications 2517
FINANCIAL ACTIVITIES 14 82 75 66 74 $1,225,172 $5,519
Finance and Insurance 4 18 16 15 16 $315,894 $6,581
Credit Intermediation, etc. 4 18 16 15 16 $315,894 $6,581522
Real Estate, Rental and Leasing 10 64 59 51 58 $909,278 $5,226
Real Estate 7 57 52 43 51 $776,582 $5,076531
Rental and Leasing Svcs. 3 7 7 8 7 $132,696 $6,319532
PROFESSIONAL AND BUSINESS SERVICES 23 151 153 145 150 $1,653,791 $3,675
Professional, Scientific, Tech. 8 17 19 19 18 $265,133 $4,910
Professional, Scientific, Tech. 8 17 19 19 18 $265,133 $4,910541
Mgmt. of Companies & Enterprises 11 127 129 121 126 $1,283,720 $3,396
Page 48 of 701/ Oil Gas industry employment includes oil and gas exploration and oilfield services, or North American Industrial Classification System (NAICS) codes 211, 213111, 213112Quarterly Census of Employment Wages (QCEW): January - March 2020Data are preliminary and subject to revisionBlanks in the Employment, Total Earnings and Average Monthly Earnings columns due to confidentiality; data are suppressedSource: Alaska Department of Labor and Workforce Development, Research and Analysis Section

Nome Census Area
Industrial Classification# of
UnitsJan
EmpFeb
EmpMar
EmpAverage
Monthly EmpTotal
EarningsAverage
Monthly Wage
SERVICE-PROVIDING 160 2,116 2,110 2,072 2,099 $30,494,814 $4,843
PROFESSIONAL AND BUSINESS SERVICES 23 151 153 145 150 $1,653,791 $3,675
Mgmt. of Companies & Enterprises 11 127 129 121 126 $1,283,720 $3,396
Mgmt. of Companies and Enterprises 11 127 129 121 126 $1,283,720 $3,396551
Administrative and Waste Services 4 7 5 5 6 $104,938 $5,830
Administrative and Support Services 3561
Waste Management/Remediation 1562
EDUCATIONAL AND HEALTH SERVICES 27
Health Care and Social Assistance 27
Out Patient Health Care 24621
Social Assistance 3 46 50 47 48 $416,147 $2,890624
LEISURE AND HOSPITALITY 21 156 161 142 153 $745,809 $1,625
Arts, Entertainment and Recreation 6 44 51 28 41 $84,315 $685
Performing Arts 1711
Amusements, Gambling, Recreation 5713
Accommodation and Food Services 15 112 110 114 112 $661,494 $1,969
Accommodation 4 39 38 42 40 $249,484 $2,079721
Food Services and Drinking Places 11 73 72 72 72 $412,010 $1,907722
OTHER SERVICES 20 304 301 305 303 $4,259,204 $4,686
Repair and Maintenance 5811
Personal and Laundry 2812
Membership Organizations, etc. 13 270 271 275 272 $3,964,954 $4,859813
Page 49 of 701/ Oil Gas industry employment includes oil and gas exploration and oilfield services, or North American Industrial Classification System (NAICS) codes 211, 213111, 213112Quarterly Census of Employment Wages (QCEW): January - March 2020Data are preliminary and subject to revisionBlanks in the Employment, Total Earnings and Average Monthly Earnings columns due to confidentiality; data are suppressedSource: Alaska Department of Labor and Workforce Development, Research and Analysis Section

North Slope Borough
Industrial Classification# of
UnitsJan
EmpFeb
EmpMar
EmpAverage
Monthly EmpTotal
EarningsAverage
Monthly Wage
TOTAL INDUSTRIES 248 13,579 13,964 13,811 13,785 $391,168,912 $9,459
TOTAL GOVERNMENT 64 2,133 2,138 2,180 2,150 $30,171,466 $4,678
FEDERAL GOVERNMENT 10 17 17 16 17 $264,212 $5,181
STATE GOVERNMENT 20 56 56 57 56 $1,004,707 $5,980
LOCAL GOVERNMENT 34 2,060 2,065 2,107 2,077 $28,902,547 $4,639
PRIVATE OWNERSHIP 184 11,446 11,826 11,631 11,634 $360,997,447 $10,343
GOODS-PRODUCING 53 7,315 7,501 7,351 7,389 $275,160,320 $12,413
NATURAL RESOURCES AND MINING 28 6,798 6,850 6,716 6,788 $253,117,619 $12,430
Mining 28 6,798 6,850 6,716 6,788 $253,117,619 $12,430
Oil and Gas Extraction 6 1,736 1,730 1,729 1,732 $118,487,252 $22,804211
Mining Support Activities 22 5,062 5,120 4,987 5,056 $134,630,367 $8,876213
CONSTRUCTION 23
Construction of Buildings 5 116 115 107 113 $3,068,857 $9,053236
Heavy Construction 7237
Specialty Trade Contractors 11 38 43 25 35 $691,466 $6,585238
MANUFACTURING 2
Food 1311
Fabricated Metal Products 1332
SERVICE-PROVIDING 131 4,131 4,325 4,280 4,245 $85,837,127 $6,740
TRADE, TRANSPORTATION AND UTILITIES 41 609 639 646 631 $12,612,062 $6,662
Wholesale Trade 3
Wholesale, Durable Goods 3423
Retail Trade 19 250 266 267 261 $2,886,190 $3,686
Motor Vehicle and Parts Dealers 1441
Building Material and Garden 1444
Food and Beverages 4445
Gasoline Stations 1447
Sporting Goods, Books, Music, etc. 1451
General Merchandise 8 87 95 92 91 $553,094 $2,026452
Nonstore Retailers 3 54 62 63 60 $1,510,623 $8,392454
Transportation and Warehousing 16 250 263 271 261 $7,055,489 $9,011
Air Transportation 4 105 103 104 104 $1,901,350 $6,094481
Water Transportation 2483
Truck Transportation 4 53 67 75 65 $1,471,292 $7,545484
Pipeline 1486
Scenic and Sightseeing 1487
Support Activities 2488
Postal Service 1491
Couriers and Messengers 1492
Utilities 3
Utilities 3221
INFORMATION 4 56 55 55 55 $1,084,542 $6,573
Broadcasting, except Internet 1515
Telecommunications 3517
FINANCIAL ACTIVITIES 9 93 86 79 86 $2,731,697 $10,588
Finance and Insurance 1
Credit Intermediation, etc. 1522
Real Estate, Rental and Leasing 8
Real Estate 4 33 34 31 33 $800,208 $8,083531
Rental and Leasing Svcs. 4532
PROFESSIONAL AND BUSINESS SERVICES 39 2,062 2,177 2,117 2,119 $44,246,223 $6,960
Professional, Scientific, Tech. 18
Professional, Scientific, Tech. 18541
Page 50 of 701/ Oil Gas industry employment includes oil and gas exploration and oilfield services, or North American Industrial Classification System (NAICS) codes 211, 213111, 213112Quarterly Census of Employment Wages (QCEW): January - March 2020Data are preliminary and subject to revisionBlanks in the Employment, Total Earnings and Average Monthly Earnings columns due to confidentiality; data are suppressedSource: Alaska Department of Labor and Workforce Development, Research and Analysis Section

North Slope Borough
Industrial Classification# of
UnitsJan
EmpFeb
EmpMar
EmpAverage
Monthly EmpTotal
EarningsAverage
Monthly Wage
SERVICE-PROVIDING 131 4,131 4,325 4,280 4,245 $85,837,127 $6,740
PROFESSIONAL AND BUSINESS SERVICES 39 2,062 2,177 2,117 2,119 $44,246,223 $6,960
Mgmt. of Companies & Enterprises 4
Mgmt. of Companies and Enterprises 4551
Administrative and Waste Services 17 1,375 1,454 1,397 1,409 $26,278,807 $6,217
Administrative and Support Services 14 1,102 1,128 1,122 1,117 $17,646,334 $5,266561
Waste Management/Remediation 3 273 326 275 291 $8,632,473 $9,888562
EDUCATIONAL AND HEALTH SERVICES 7 471 489 495 485 $11,557,222 $7,943
Educational Services 2
Educational Services 2611
Health Care and Social Assistance 5
Out Patient Health Care 2621
Hospitals 1622
Nursing and Residential Care 1623
Social Assistance 1624
LEISURE AND HOSPITALITY 23 633 653 658 648 $7,084,644 $3,644
Arts, Entertainment and Recreation 5 32 24 20 25 $120,657 $1,609
Museums, Zoos, Parks, etc. 1712
Amusements, Gambling, Recreation 4713
Accommodation and Food Services 18 601 629 638 623 $6,963,987 $3,726
Accommodation 7721
Food Services and Drinking Places 11722
OTHER SERVICES 8 207 226 230 221 $6,520,737 $9,835
Repair and Maintenance 3811
Membership Organizations, etc. 5813
Page 51 of 701/ Oil Gas industry employment includes oil and gas exploration and oilfield services, or North American Industrial Classification System (NAICS) codes 211, 213111, 213112Quarterly Census of Employment Wages (QCEW): January - March 2020Data are preliminary and subject to revisionBlanks in the Employment, Total Earnings and Average Monthly Earnings columns due to confidentiality; data are suppressedSource: Alaska Department of Labor and Workforce Development, Research and Analysis Section

Northwest Arctic Borough
Industrial Classification# of
UnitsJan
EmpFeb
EmpMar
EmpAverage
Monthly EmpTotal
EarningsAverage
Monthly Wage
TOTAL INDUSTRIES 165 2,908 2,923 2,883 2,905 $54,338,656 $6,235
TOTAL GOVERNMENT 88 1,004 1,034 975 1,005 $12,140,142 $4,027
FEDERAL GOVERNMENT 14 45 46 50 47 $637,748 $4,523
STATE GOVERNMENT 24 59 59 61 60 $1,283,027 $7,128
LOCAL GOVERNMENT 50 900 929 864 898 $10,219,367 $3,793
PRIVATE OWNERSHIP 77 1,904 1,889 1,908 1,900 $42,198,514 $7,403
GOODS-PRODUCING 12
NATURAL RESOURCES AND MINING 4
Agriculture, Forestry, Fishing, Hunting 1
Crop Production 1111
Mining 3
Mining, except Oil and Gas 2212
Mining Support Activities 1213
CONSTRUCTION 8
Construction of Buildings 1236
Heavy Construction 4 12 10 8 10 $124,423 $4,147237
Specialty Trade Contractors 3 20 18 18 19 $323,937 $5,683238
SERVICE-PROVIDING 65
TRADE, TRANSPORTATION AND UTILITIES 25 351 359 366 359 $5,069,908 $4,707
Retail Trade 16
Building Material and Garden 1444
Food and Beverages 6 23 22 27 24 $117,859 $1,637445
Gasoline Stations 1447
General Merchandise 6 97 104 111 104 $680,972 $2,183452
Nonstore Retailers 2454
Transportation and Warehousing 8 189 191 187 189 $3,441,721 $6,070
Air Transportation 4 128 125 124 126 $2,061,131 $5,453481
Truck Transportation 1484
Transit and Ground Passenger 2485
Support Activities 1488
Utilities 1
Utilities 1221
INFORMATION 4 42 40 40 41 $596,988 $4,854
Broadcasting, except Internet 1515
Telecommunications 3517
FINANCIAL ACTIVITIES 4 53 49 46 49 $770,775 $5,243
Finance and Insurance 1
Credit Intermediation, etc. 1522
Real Estate, Rental and Leasing 3
Real Estate 3531
PROFESSIONAL AND BUSINESS SERVICES 5 43 43 40 42 $632,291 $5,018
Professional, Scientific, Tech. 2
Professional, Scientific, Tech. 2541
Mgmt. of Companies & Enterprises 1
Mgmt. of Companies and Enterprises 1551
Administrative and Waste Services 2
Administrative and Support Services 1561
Waste Management/Remediation 1562
EDUCATIONAL AND HEALTH SERVICES 14
Health Care and Social Assistance 14
Out Patient Health Care 14621
LEISURE AND HOSPITALITY 8 127 127 126 127 $1,788,256 $4,694
Arts, Entertainment and Recreation 2
Page 52 of 701/ Oil Gas industry employment includes oil and gas exploration and oilfield services, or North American Industrial Classification System (NAICS) codes 211, 213111, 213112Quarterly Census of Employment Wages (QCEW): January - March 2020Data are preliminary and subject to revisionBlanks in the Employment, Total Earnings and Average Monthly Earnings columns due to confidentiality; data are suppressedSource: Alaska Department of Labor and Workforce Development, Research and Analysis Section

Northwest Arctic Borough
Industrial Classification# of
UnitsJan
EmpFeb
EmpMar
EmpAverage
Monthly EmpTotal
EarningsAverage
Monthly Wage
SERVICE-PROVIDING 65
LEISURE AND HOSPITALITY 8 127 127 126 127 $1,788,256 $4,694
Arts, Entertainment and Recreation 2
Amusements, Gambling, Recreation 2713
Accommodation and Food Services 6
Accommodation 3721
Food Services and Drinking Places 3 73 74 72 73 $1,006,395 $4,595722
OTHER SERVICES 5
Repair and Maintenance 1811
Membership Organizations, etc. 3 19 18 18 18 $107,621 $1,993813
Private Households 1814
Page 53 of 701/ Oil Gas industry employment includes oil and gas exploration and oilfield services, or North American Industrial Classification System (NAICS) codes 211, 213111, 213112Quarterly Census of Employment Wages (QCEW): January - March 2020Data are preliminary and subject to revisionBlanks in the Employment, Total Earnings and Average Monthly Earnings columns due to confidentiality; data are suppressedSource: Alaska Department of Labor and Workforce Development, Research and Analysis Section

Petersburg Borough
Industrial Classification# of
UnitsJan
EmpFeb
EmpMar
EmpAverage
Monthly EmpTotal
EarningsAverage
Monthly Wage
TOTAL INDUSTRIES 168 1,172 1,227 1,222 1,207 $11,853,378 $3,274
TOTAL GOVERNMENT 23 509 522 531 520 $6,531,711 $4,187
FEDERAL GOVERNMENT 5 69 68 82 73 $1,346,145 $6,147
STATE GOVERNMENT 12 35 39 41 38 $489,404 $4,293
LOCAL GOVERNMENT 6 405 415 408 409 $4,696,162 $3,827
PRIVATE OWNERSHIP 145 663 705 691 686 $5,321,667 $2,586
GOODS-PRODUCING 27 188 227 218 211 $2,032,063 $3,210
NATURAL RESOURCES AND MINING 8
Agriculture, Forestry, Fishing, Hunting 7 8 10 12 10 $92,367 $3,079
Crop Production 1111
Animal Production 1112
Fishing, Hunting, Trapping 5114
Mining 1
Mining, except Oil and Gas 1212
CONSTRUCTION 12 26 30 35 30 $308,773 $3,431
Construction of Buildings 6236
Heavy Construction 2237
Specialty Trade Contractors 4238
MANUFACTURING 7
Food 6311
Transportation Equipment 1336
SERVICE-PROVIDING 118 475 478 473 475 $3,289,604 $2,308
TRADE, TRANSPORTATION AND UTILITIES 49 215 213 214 214 $1,755,412 $2,734
Wholesale Trade 3
Wholesale, Nondurable Goods 2424
Wholesale, Electronic Markets 1425
Retail Trade 26 166 163 165 165 $1,061,651 $2,145
Motor Vehicle and Parts Dealers 3 12 12 12 12 $105,338 $2,926441
Furniture and Home Furnishings 1442
Electronics and Appliances 1443
Building Material and Garden 2444
Food and Beverages 4445
Health and Personal Care 2446
Gasoline Stations 1447
Clothing and Clothing Accessories 1448
Sporting Goods, Books, Music, etc. 2451
General Merchandise 2452
Miscellaneous 5 6 9 10 8 $27,028 $1,126453
Nonstore Retailers 2454
Transportation and Warehousing 20
Air Transportation 3 18 19 17 18 $306,003 $5,667481
Water Transportation 10 12 13 11 12 $166,455 $4,624483
Truck Transportation 2484
Scenic and Sightseeing 1487
Support Activities 2488
Couriers and Messengers 1492
Warehousing and Storage 1493
INFORMATION 5 30 32 30 31 $156,661 $1,685
Publishing, except Internet 2511
Motion Picture and Sound Recording 1512
Broadcasting, except Internet 1515
Telecommunications 1517
FINANCIAL ACTIVITIES 8 23 22 20 22 $247,659 $3,752
Page 54 of 701/ Oil Gas industry employment includes oil and gas exploration and oilfield services, or North American Industrial Classification System (NAICS) codes 211, 213111, 213112Quarterly Census of Employment Wages (QCEW): January - March 2020Data are preliminary and subject to revisionBlanks in the Employment, Total Earnings and Average Monthly Earnings columns due to confidentiality; data are suppressedSource: Alaska Department of Labor and Workforce Development, Research and Analysis Section
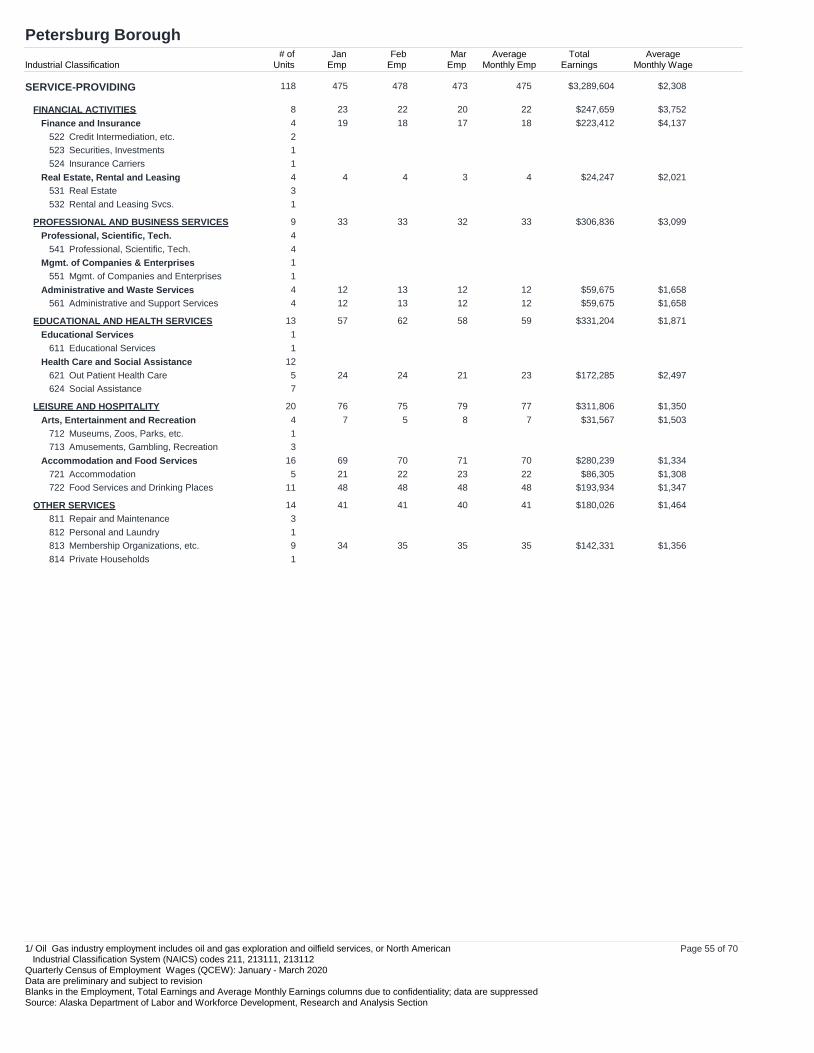
Petersburg Borough
Industrial Classification# of
UnitsJan
EmpFeb
EmpMar
EmpAverage
Monthly EmpTotal
EarningsAverage
Monthly Wage
SERVICE-PROVIDING 118 475 478 473 475 $3,289,604 $2,308
FINANCIAL ACTIVITIES 8 23 22 20 22 $247,659 $3,752
Finance and Insurance 4 19 18 17 18 $223,412 $4,137
Credit Intermediation, etc. 2522
Securities, Investments 1523
Insurance Carriers 1524
Real Estate, Rental and Leasing 4 4 4 3 4 $24,247 $2,021
Real Estate 3531
Rental and Leasing Svcs. 1532
PROFESSIONAL AND BUSINESS SERVICES 9 33 33 32 33 $306,836 $3,099
Professional, Scientific, Tech. 4
Professional, Scientific, Tech. 4541
Mgmt. of Companies & Enterprises 1
Mgmt. of Companies and Enterprises 1551
Administrative and Waste Services 4 12 13 12 12 $59,675 $1,658
Administrative and Support Services 4 12 13 12 12 $59,675 $1,658561
EDUCATIONAL AND HEALTH SERVICES 13 57 62 58 59 $331,204 $1,871
Educational Services 1
Educational Services 1611
Health Care and Social Assistance 12
Out Patient Health Care 5 24 24 21 23 $172,285 $2,497621
Social Assistance 7624
LEISURE AND HOSPITALITY 20 76 75 79 77 $311,806 $1,350
Arts, Entertainment and Recreation 4 7 5 8 7 $31,567 $1,503
Museums, Zoos, Parks, etc. 1712
Amusements, Gambling, Recreation 3713
Accommodation and Food Services 16 69 70 71 70 $280,239 $1,334
Accommodation 5 21 22 23 22 $86,305 $1,308721
Food Services and Drinking Places 11 48 48 48 48 $193,934 $1,347722
OTHER SERVICES 14 41 41 40 41 $180,026 $1,464
Repair and Maintenance 3811
Personal and Laundry 1812
Membership Organizations, etc. 9 34 35 35 35 $142,331 $1,356813
Private Households 1814
Page 55 of 701/ Oil Gas industry employment includes oil and gas exploration and oilfield services, or North American Industrial Classification System (NAICS) codes 211, 213111, 213112Quarterly Census of Employment Wages (QCEW): January - March 2020Data are preliminary and subject to revisionBlanks in the Employment, Total Earnings and Average Monthly Earnings columns due to confidentiality; data are suppressedSource: Alaska Department of Labor and Workforce Development, Research and Analysis Section

Prince of Wales - Hyder Census Area
Industrial Classification# of
UnitsJan
EmpFeb
EmpMar
EmpAverage
Monthly EmpTotal
EarningsAverage
Monthly Wage
TOTAL INDUSTRIES 248 2,081 2,087 2,160 2,109 $20,128,569 $3,181
TOTAL GOVERNMENT 70 1,140 1,099 1,135 1,124 $10,924,997 $3,240
FEDERAL GOVERNMENT 11 75 76 71 74 $1,228,149 $5,532
STATE GOVERNMENT 23 26 26 27 26 $390,676 $5,009
LOCAL GOVERNMENT 36 1,039 997 1,037 1,024 $9,306,172 $3,029
PRIVATE OWNERSHIP 178 941 988 1,025 985 $9,203,572 $3,115
GOODS-PRODUCING 49 238 263 301 267 $3,087,579 $3,855
NATURAL RESOURCES AND MINING 17 116 133 149 133 $1,924,529 $4,823
Agriculture, Forestry, Fishing, Hunting 15
Animal Production 5 24 26 32 27 $204,881 $2,529112
Forestry and Logging 7 63 78 93 78 $1,157,748 $4,948113
Agriculture, Forestry Support 3115
Mining 2
Mining, except Oil and Gas 2212
CONSTRUCTION 21 65 62 84 70 $630,442 $3,002
Construction of Buildings 3 17 15 15 16 $166,538 $3,470236
Heavy Construction 8 32 29 53 38 $327,301 $2,871237
Specialty Trade Contractors 10 16 18 16 17 $136,603 $2,678238
MANUFACTURING 11 57 68 68 64 $532,608 $2,774
Food 3311
Beverage and Tobacco Products 1312
Textile Products 1314
Wood Products 6321
SERVICE-PROVIDING 129 703 725 724 717 $6,115,994 $2,843
TRADE, TRANSPORTATION AND UTILITIES 46 325 316 319 320 $2,558,393 $2,665
Wholesale Trade 3
Wholesale, Durable Goods 2423
Wholesale, Nondurable Goods 1424
Retail Trade 22 238 229 232 233 $1,423,485 $2,036
Motor Vehicle and Parts Dealers 1441
Building Material and Garden 1444
Food and Beverages 8 86 81 86 84 $425,131 $1,687445
Health and Personal Care 1446
Gasoline Stations 3 30 29 29 29 $141,668 $1,628447
Sporting Goods, Books, Music, etc. 2451
General Merchandise 2452
Miscellaneous 2453
Nonstore Retailers 2454
Transportation and Warehousing 19 64 64 65 64 $828,402 $4,315
Air Transportation 1481
Water Transportation 2483
Truck Transportation 5 17 20 21 19 $203,720 $3,574484
Scenic and Sightseeing 6487
Support Activities 5488
Utilities 2
Utilities 2221
INFORMATION 2
Telecommunications 2517
FINANCIAL ACTIVITIES 16 68 71 70 70 $940,702 $4,480
Finance and Insurance 10 26 29 28 28 $495,056 $5,894
Credit Intermediation, etc. 8 23 26 25 25 $265,587 $3,541522
Securities, Investments 1523
Insurance Carriers 1524
Page 56 of 701/ Oil Gas industry employment includes oil and gas exploration and oilfield services, or North American Industrial Classification System (NAICS) codes 211, 213111, 213112Quarterly Census of Employment Wages (QCEW): January - March 2020Data are preliminary and subject to revisionBlanks in the Employment, Total Earnings and Average Monthly Earnings columns due to confidentiality; data are suppressedSource: Alaska Department of Labor and Workforce Development, Research and Analysis Section

Prince of Wales - Hyder Census Area
Industrial Classification# of
UnitsJan
EmpFeb
EmpMar
EmpAverage
Monthly EmpTotal
EarningsAverage
Monthly Wage
SERVICE-PROVIDING 129 703 725 724 717 $6,115,994 $2,843
FINANCIAL ACTIVITIES 16 68 71 70 70 $940,702 $4,480
Real Estate, Rental and Leasing 6 42 42 42 42 $445,646 $3,537
Real Estate 5531
Rental and Leasing Svcs. 1532
PROFESSIONAL AND BUSINESS SERVICES 11 26 40 40 35 $294,861 $2,808
Professional, Scientific, Tech. 3
Professional, Scientific, Tech. 3541
Mgmt. of Companies & Enterprises 3 15 30 31 25 $242,777 $3,237
Mgmt. of Companies and Enterprises 3 15 30 31 25 $242,777 $3,237551
Administrative and Waste Services 5
Administrative and Support Services 5561
EDUCATIONAL AND HEALTH SERVICES 17 159 165 164 163 $1,704,014 $3,485
Health Care and Social Assistance 17 159 165 164 163 $1,704,014 $3,485
Out Patient Health Care 7621
Social Assistance 10624
LEISURE AND HOSPITALITY 27 81 88 89 86 $417,342 $1,618
Arts, Entertainment and Recreation 1
Amusements, Gambling, Recreation 1713
Accommodation and Food Services 26
Accommodation 17 24 28 29 27 $207,964 $2,567721
Food Services and Drinking Places 9722
OTHER SERVICES 10
Repair and Maintenance 1811
Personal and Laundry 1812
Membership Organizations, etc. 8 40 41 38 40 $135,846 $1,132813
Page 57 of 701/ Oil Gas industry employment includes oil and gas exploration and oilfield services, or North American Industrial Classification System (NAICS) codes 211, 213111, 213112Quarterly Census of Employment Wages (QCEW): January - March 2020Data are preliminary and subject to revisionBlanks in the Employment, Total Earnings and Average Monthly Earnings columns due to confidentiality; data are suppressedSource: Alaska Department of Labor and Workforce Development, Research and Analysis Section

Sitka City and Borough
Industrial Classification# of
UnitsJan
EmpFeb
EmpMar
EmpAverage
Monthly EmpTotal
EarningsAverage
Monthly Wage
TOTAL INDUSTRIES 372 3,544 3,719 3,812 3,692 $42,079,896 $3,799
TOTAL GOVERNMENT 40 855 911 952 906 $12,506,197 $4,601
FEDERAL GOVERNMENT 11 100 100 130 110 $2,059,167 $6,240
STATE GOVERNMENT 25 263 313 318 298 $3,574,818 $3,999
LOCAL GOVERNMENT 4 492 498 504 498 $6,872,212 $4,600
PRIVATE OWNERSHIP 332 2,689 2,808 2,860 2,786 $29,573,698 $3,538
GOODS-PRODUCING 58 398 442 483 441 $5,477,445 $4,140
NATURAL RESOURCES AND MINING 9 46 50 54 50 $506,369 $3,376
Agriculture, Forestry, Fishing, Hunting 9 46 50 54 50 $506,369 $3,376
Crop Production 3 23 24 20 22 $118,958 $1,802111
Animal Production 3112
Fishing, Hunting, Trapping 3114
CONSTRUCTION 36 121 114 118 118 $1,733,606 $4,897
Construction of Buildings 19236
Heavy Construction 4237
Specialty Trade Contractors 13 61 53 62 59 $884,150 $4,995238
MANUFACTURING 13 231 278 311 273 $3,237,470 $3,953
Food 8 152 203 234 196 $2,158,187 $3,670311
Textile Products 1314
Apparel 1315
Chemicals 1325
Nonmetallic Mineral Products 1327
Transportation Equipment 1336
SERVICE-PROVIDING 274 2,291 2,366 2,377 2,345 $24,096,253 $3,425
TRADE, TRANSPORTATION AND UTILITIES 86 634 616 594 615 $5,615,295 $3,044
Wholesale Trade 6 27 26 27 27 $267,305 $3,300
Wholesale, Nondurable Goods 6 27 26 27 27 $267,305 $3,300424
Retail Trade 50 433 422 411 422 $3,178,547 $2,511
Motor Vehicle and Parts Dealers 4 12 12 12 12 $122,693 $3,408441
Furniture and Home Furnishings 2442
Electronics and Appliances 2443
Building Material and Garden 3444
Food and Beverages 5445
Health and Personal Care 3446
Gasoline Stations 1447
Clothing and Clothing Accessories 8 35 31 23 30 $226,006 $2,511448
Sporting Goods, Books, Music, etc. 4 23 22 22 22 $183,880 $2,786451
General Merchandise 3452
Miscellaneous 12 36 31 26 31 $132,829 $1,428453
Nonstore Retailers 3 30 32 31 31 $315,002 $3,387454
Transportation and Warehousing 30 174 168 156 166 $2,169,443 $4,356
Air Transportation 1481
Water Transportation 5 23 27 25 25 $422,474 $5,633483
Truck Transportation 2484
Transit and Ground Passenger 1485
Scenic and Sightseeing 14 44 42 37 41 $604,318 $4,913487
Support Activities 4 8 8 7 8 $64,504 $2,688488
Couriers and Messengers 3 11 9 9 10 $182,868 $6,096492
INFORMATION 8 43 44 42 43 $375,159 $2,908
Publishing, except Internet 2511
Motion Picture and Sound Recording 1512
Broadcasting, except Internet 3 15 16 15 15 $82,756 $1,839515
Telecommunications 2517
FINANCIAL ACTIVITIES 22 108 113 117 113 $1,303,711 $3,846
Page 58 of 701/ Oil Gas industry employment includes oil and gas exploration and oilfield services, or North American Industrial Classification System (NAICS) codes 211, 213111, 213112Quarterly Census of Employment Wages (QCEW): January - March 2020Data are preliminary and subject to revisionBlanks in the Employment, Total Earnings and Average Monthly Earnings columns due to confidentiality; data are suppressedSource: Alaska Department of Labor and Workforce Development, Research and Analysis Section

Sitka City and Borough
Industrial Classification# of
UnitsJan
EmpFeb
EmpMar
EmpAverage
Monthly EmpTotal
EarningsAverage
Monthly Wage
SERVICE-PROVIDING 274 2,291 2,366 2,377 2,345 $24,096,253 $3,425
Finance and Insurance 11 53 54 56 54 $701,297 $4,329
Credit Intermediation, etc. 5 44 44 44 44 $563,778 $4,271522
Securities, Investments 2523
Insurance Carriers 4524
Real Estate, Rental and Leasing 11 55 59 61 58 $602,414 $3,462
Real Estate 9531
Rental and Leasing Svcs. 2532
PROFESSIONAL AND BUSINESS SERVICES 35 208 212 210 210 $1,900,926 $3,017
Professional, Scientific, Tech. 23 74 72 72 73 $598,744 $2,734
Professional, Scientific, Tech. 23 74 72 72 73 $598,744 $2,734541
Mgmt. of Companies & Enterprises 3 28 28 27 28 $612,510 $7,292
Mgmt. of Companies and Enterprises 3 28 28 27 28 $612,510 $7,292551
Administrative and Waste Services 9 106 112 111 110 $689,672 $2,090
Administrative and Support Services 8561
Waste Management/Remediation 1562
EDUCATIONAL AND HEALTH SERVICES 35 802 802 850 818 $11,676,851 $4,758
Educational Services 8 59 59 63 60 $449,194 $2,496
Educational Services 8 59 59 63 60 $449,194 $2,496611
Health Care and Social Assistance 27 743 743 787 758 $11,227,657 $4,937
Out Patient Health Care 12 51 42 49 47 $296,682 $2,104621
Hospitals 1622
Nursing and Residential Care 2623
Social Assistance 12 94 97 102 98 $655,421 $2,229624
LEISURE AND HOSPITALITY 56 369 453 444 422 $2,304,286 $1,820
Arts, Entertainment and Recreation 14 14 16 14 15 $69,722 $1,549
Museums, Zoos, Parks, etc. 1712
Amusements, Gambling, Recreation 13713
Accommodation and Food Services 42 355 437 430 407 $2,234,564 $1,830
Accommodation 16 86 95 93 91 $566,750 $2,076721
Food Services and Drinking Places 26 269 342 337 316 $1,667,814 $1,759722
OTHER SERVICES 31 127 126 120 124 $920,025 $2,473
Repair and Maintenance 7 29 30 29 29 $272,745 $3,135811
Personal and Laundry 4812
Membership Organizations, etc. 18 81 79 77 79 $559,231 $2,360813
Private Households 2814
UNCLASSIFIED ESTABLISHMENTS 1 0 0 0 0 $0
Page 59 of 701/ Oil Gas industry employment includes oil and gas exploration and oilfield services, or North American Industrial Classification System (NAICS) codes 211, 213111, 213112Quarterly Census of Employment Wages (QCEW): January - March 2020Data are preliminary and subject to revisionBlanks in the Employment, Total Earnings and Average Monthly Earnings columns due to confidentiality; data are suppressedSource: Alaska Department of Labor and Workforce Development, Research and Analysis Section

Skagway Municipality
Industrial Classification# of
UnitsJan
EmpFeb
EmpMar
EmpAverage
Monthly EmpTotal
EarningsAverage
Monthly Wage
TOTAL INDUSTRIES 131 519 512 527 519 $5,035,118 $3,234
TOTAL GOVERNMENT 16 173 173 177 174 $2,334,015 $4,471
FEDERAL GOVERNMENT 5 38 41 46 42 $776,839 $6,165
STATE GOVERNMENT 7 10 9 9 9 $115,039 $4,261
LOCAL GOVERNMENT 4 125 123 122 123 $1,442,137 $3,908
PRIVATE OWNERSHIP 115 346 339 350 345 $2,701,103 $2,610
GOODS-PRODUCING 12 27 48 52 42 $323,624 $2,568
CONSTRUCTION 8
Construction of Buildings 7 14 13 13 13 $134,394 $3,446236
Heavy Construction 1237
MANUFACTURING 4
Food 1311
Beverage and Tobacco Products 3312
SERVICE-PROVIDING 103 319 291 298 303 $2,377,479 $2,615
TRADE, TRANSPORTATION AND UTILITIES 52 207 184 189 193 $1,545,583 $2,669
Wholesale Trade 1
Wholesale, Durable Goods 1423
Retail Trade 38
Building Material and Garden 1444
Food and Beverages 5 20 21 20 20 $135,392 $2,257445
Gasoline Stations 1447
Clothing and Clothing Accessories 9448
Sporting Goods, Books, Music, etc. 3451
Miscellaneous 18 21 20 27 23 $131,172 $1,901453
Nonstore Retailers 1454
Transportation and Warehousing 13 140 119 114 124 $1,053,429 $2,832
Air Transportation 1481
Truck Transportation 1484
Transit and Ground Passenger 1485
Scenic and Sightseeing 7487
Support Activities 2488
Warehousing and Storage 1493
INFORMATION 2
Publishing, except Internet 2511
FINANCIAL ACTIVITIES 5 11 15 16 14 $129,071 $3,073
Finance and Insurance 2
Credit Intermediation, etc. 1522
Insurance Carriers 1524
Real Estate, Rental and Leasing 3
Real Estate 1531
Rental and Leasing Svcs. 2532
PROFESSIONAL AND BUSINESS SERVICES 4
Administrative and Waste Services 4
Administrative and Support Services 4561
EDUCATIONAL AND HEALTH SERVICES 9 9 9 9 9 $40,995 $1,518
Educational Services 1
Educational Services 1611
Health Care and Social Assistance 8
Out Patient Health Care 2621
Social Assistance 6 6 6 6 6 $26,758 $1,487624
LEISURE AND HOSPITALITY 27 64 59 59 61 $532,687 $2,911
Arts, Entertainment and Recreation 10 31 33 27 30 $311,150 $3,457
Performing Arts 1711
Page 60 of 701/ Oil Gas industry employment includes oil and gas exploration and oilfield services, or North American Industrial Classification System (NAICS) codes 211, 213111, 213112Quarterly Census of Employment Wages (QCEW): January - March 2020Data are preliminary and subject to revisionBlanks in the Employment, Total Earnings and Average Monthly Earnings columns due to confidentiality; data are suppressedSource: Alaska Department of Labor and Workforce Development, Research and Analysis Section

Skagway Municipality
Industrial Classification# of
UnitsJan
EmpFeb
EmpMar
EmpAverage
Monthly EmpTotal
EarningsAverage
Monthly Wage
SERVICE-PROVIDING 103 319 291 298 303 $2,377,479 $2,615
LEISURE AND HOSPITALITY 27 64 59 59 61 $532,687 $2,911
Arts, Entertainment and Recreation 10 31 33 27 30 $311,150 $3,457
Museums, Zoos, Parks, etc. 2712
Amusements, Gambling, Recreation 7 27 29 23 26 $248,202 $3,182713
Accommodation and Food Services 17 33 26 32 30 $221,537 $2,462
Accommodation 6 9 9 12 10 $126,839 $4,228721
Food Services and Drinking Places 11 24 17 20 20 $94,698 $1,578722
OTHER SERVICES 4 26 22 21 23 $113,298 $1,642
Membership Organizations, etc. 4 26 22 21 23 $113,298 $1,642813
Page 61 of 701/ Oil Gas industry employment includes oil and gas exploration and oilfield services, or North American Industrial Classification System (NAICS) codes 211, 213111, 213112Quarterly Census of Employment Wages (QCEW): January - March 2020Data are preliminary and subject to revisionBlanks in the Employment, Total Earnings and Average Monthly Earnings columns due to confidentiality; data are suppressedSource: Alaska Department of Labor and Workforce Development, Research and Analysis Section

Southeast Fairbanks Census Area
Industrial Classification# of
UnitsJan
EmpFeb
EmpMar
EmpAverage
Monthly EmpTotal
EarningsAverage
Monthly Wage
TOTAL INDUSTRIES 250 2,379 2,428 2,465 2,424 $42,511,617 $5,846
TOTAL GOVERNMENT 65 786 777 796 786 $12,281,093 $5,208
FEDERAL GOVERNMENT 13 343 333 338 338 $7,088,697 $6,991
STATE GOVERNMENT 36 96 90 108 98 $1,345,307 $4,576
LOCAL GOVERNMENT 16 347 354 350 350 $3,847,089 $3,664
PRIVATE OWNERSHIP 185 1,593 1,651 1,669 1,638 $30,230,524 $6,152
GOODS-PRODUCING 37 633 658 665 652 $18,028,027 $9,217
NATURAL RESOURCES AND MINING 16
Agriculture, Forestry, Fishing, Hunting 5 10 11 13 11 $105,949 $3,211
Crop Production 3111
Forestry and Logging 2113
Mining 11
Mining, except Oil and Gas 8212
Mining Support Activities 3213
CONSTRUCTION 14 69 77 80 75 $1,058,832 $4,706
Construction of Buildings 6 41 47 49 46 $752,058 $5,450236
Heavy Construction 4237
Specialty Trade Contractors 4238
MANUFACTURING 7
Food 2311
Grain, Oilseed Milling 13112
Wood Products 1321
Nonmetallic Mineral Products 2327
Fabricated Metal Products 1332
Computer and Electronic Products 1334
SERVICE-PROVIDING 148 960 993 1,004 986 $12,202,496 $4,125
TRADE, TRANSPORTATION AND UTILITIES 48 321 331 333 328 $3,994,268 $4,059
Wholesale Trade 3
Wholesale, Durable Goods 1423
Wholesale, Nondurable Goods 1424
Wholesale, Electronic Markets 1425
Retail Trade 28 180 190 190 187 $1,452,558 $2,589
Motor Vehicle and Parts Dealers 2441
Building Material and Garden 3 16 17 17 17 $132,181 $2,592444
Food and Beverages 4 53 54 52 53 $362,826 $2,282445
Gasoline Stations 3 28 28 29 28 $206,125 $2,454447
Clothing and Clothing Accessories 2448
Sporting Goods, Books, Music, etc. 2451
General Merchandise 3452
Miscellaneous 7 10 12 15 12 $42,414 $1,178453
Nonstore Retailers 2454
Transportation and Warehousing 14 107 107 109 108 $1,911,966 $5,901
Air Transportation 5481
Truck Transportation 1484
Transit and Ground Passenger 4 42 41 42 42 $210,209 $1,668485
Pipeline 1486
Support Activities 2488
Postal Service 1491
Utilities 3
Utilities 3221
INFORMATION 8 16 16 15 16 $166,318 $3,465
Publishing, except Internet 2511
Telecommunications 5 13 13 13 13 $102,900 $2,638517
Other Information Services 1519
Page 62 of 701/ Oil Gas industry employment includes oil and gas exploration and oilfield services, or North American Industrial Classification System (NAICS) codes 211, 213111, 213112Quarterly Census of Employment Wages (QCEW): January - March 2020Data are preliminary and subject to revisionBlanks in the Employment, Total Earnings and Average Monthly Earnings columns due to confidentiality; data are suppressedSource: Alaska Department of Labor and Workforce Development, Research and Analysis Section

Southeast Fairbanks Census Area
Industrial Classification# of
UnitsJan
EmpFeb
EmpMar
EmpAverage
Monthly EmpTotal
EarningsAverage
Monthly Wage
SERVICE-PROVIDING 148 960 993 1,004 986 $12,202,496 $4,125
FINANCIAL ACTIVITIES 8 35 36 38 36 $458,975 $4,250
Finance and Insurance 3 14 15 17 15 $215,862 $4,797
Credit Intermediation, etc. 3 14 15 17 15 $215,862 $4,797522
Real Estate, Rental and Leasing 5 21 21 21 21 $243,113 $3,859
Real Estate 5 21 21 21 21 $243,113 $3,859531
PROFESSIONAL AND BUSINESS SERVICES 35 159 157 164 160 $2,294,380 $4,780
Professional, Scientific, Tech. 28 129 129 135 131 $2,014,772 $5,127
Professional, Scientific, Tech. 28 129 129 135 131 $2,014,772 $5,127541
Mgmt. of Companies & Enterprises 1
Mgmt. of Companies and Enterprises 1551
Administrative and Waste Services 6
Administrative and Support Services 4 11 9 10 10 $110,122 $3,671561
Waste Management/Remediation 2562
EDUCATIONAL AND HEALTH SERVICES 14 267 274 269 270 $4,413,677 $5,449
Educational Services 4
Educational Services 4611
Health Care and Social Assistance 10
Out Patient Health Care 8 191 195 197 194 $2,856,923 $4,909621
Social Assistance 2624
LEISURE AND HOSPITALITY 26 138 155 161 151 $783,834 $1,730
Arts, Entertainment and Recreation 2
Amusements, Gambling, Recreation 2713
Accommodation and Food Services 24
Accommodation 13721
Food Services and Drinking Places 11 97 112 112 107 $578,458 $1,802722
OTHER SERVICES 9 24 24 24 24 $91,043 $1,264
Repair and Maintenance 1811
Personal and Laundry 1812
Membership Organizations, etc. 7 23 23 23 23 $81,260 $1,178813
Page 63 of 701/ Oil Gas industry employment includes oil and gas exploration and oilfield services, or North American Industrial Classification System (NAICS) codes 211, 213111, 213112Quarterly Census of Employment Wages (QCEW): January - March 2020Data are preliminary and subject to revisionBlanks in the Employment, Total Earnings and Average Monthly Earnings columns due to confidentiality; data are suppressedSource: Alaska Department of Labor and Workforce Development, Research and Analysis Section

Wrangell City and Borough
Industrial Classification# of
UnitsJan
EmpFeb
EmpMar
EmpAverage
Monthly EmpTotal
EarningsAverage
Monthly Wage
TOTAL INDUSTRIES 96 745 762 762 756 $6,968,654 $3,073
TOTAL GOVERNMENT 20 218 223 220 220 $2,258,668 $3,422
FEDERAL GOVERNMENT 5 37 37 38 37 $620,702 $5,592
STATE GOVERNMENT 11 15 16 16 16 $225,579 $4,700
LOCAL GOVERNMENT 4 166 170 166 167 $1,412,387 $2,819
PRIVATE OWNERSHIP 76 527 539 542 536 $4,709,986 $2,929
GOODS-PRODUCING 22 38 51 58 49 $599,179 $4,076
NATURAL RESOURCES AND MINING 4 7 8 8 8 $73,779 $3,074
Agriculture, Forestry, Fishing, Hunting 4 7 8 8 8 $73,779 $3,074
Animal Production 2112
Forestry and Logging 2113
CONSTRUCTION 14 16 17 19 17 $175,998 $3,451
Construction of Buildings 4236
Heavy Construction 4237
Specialty Trade Contractors 6 7 8 9 8 $91,932 $3,830238
MANUFACTURING 4 15 26 31 24 $349,402 $4,853
Food 3311
Transportation Equipment 1336
SERVICE-PROVIDING 54 489 488 484 487 $4,110,808 $2,814
TRADE, TRANSPORTATION AND UTILITIES 23 163 159 157 160 $988,165 $2,059
Retail Trade 13 130 125 122 126 $808,059 $2,138
Motor Vehicle and Parts Dealers 2441
Building Material and Garden 1444
Food and Beverages 2445
Health and Personal Care 1446
Gasoline Stations 2447
Clothing and Clothing Accessories 1448
General Merchandise 2452
Miscellaneous 1453
Nonstore Retailers 1454
Transportation and Warehousing 10 33 34 35 34 $180,106 $1,766
Air Transportation 2481
Water Transportation 1483
Truck Transportation 1484
Transit and Ground Passenger 1485
Scenic and Sightseeing 4 10 12 10 11 $40,627 $1,231487
Support Activities 1488
INFORMATION 2
Broadcasting, except Internet 1515
Telecommunications 1517
FINANCIAL ACTIVITIES 8 19 19 18 19 $162,760 $2,855
Finance and Insurance 4 15 15 14 15 $152,010 $3,378
Credit Intermediation, etc. 3522
Securities, Investments 1523
Real Estate, Rental and Leasing 4 4 4 4 4 $10,750 $896
Real Estate 3531
Rental and Leasing Svcs. 1532
PROFESSIONAL AND BUSINESS SERVICES 4 8 10 10 9 $42,054 $1,558
Professional, Scientific, Tech. 2
Professional, Scientific, Tech. 2541
Administrative and Waste Services 2
Administrative and Support Services 2561
EDUCATIONAL AND HEALTH SERVICES 4
Page 64 of 701/ Oil Gas industry employment includes oil and gas exploration and oilfield services, or North American Industrial Classification System (NAICS) codes 211, 213111, 213112Quarterly Census of Employment Wages (QCEW): January - March 2020Data are preliminary and subject to revisionBlanks in the Employment, Total Earnings and Average Monthly Earnings columns due to confidentiality; data are suppressedSource: Alaska Department of Labor and Workforce Development, Research and Analysis Section

Wrangell City and Borough
Industrial Classification# of
UnitsJan
EmpFeb
EmpMar
EmpAverage
Monthly EmpTotal
EarningsAverage
Monthly Wage
SERVICE-PROVIDING 54 489 488 484 487 $4,110,808 $2,814
EDUCATIONAL AND HEALTH SERVICES 4
Health Care and Social Assistance 4
Out Patient Health Care 3621
Social Assistance 1624
LEISURE AND HOSPITALITY 8 41 39 43 41 $211,085 $1,716
Arts, Entertainment and Recreation 3
Amusements, Gambling, Recreation 3713
Accommodation and Food Services 5
Accommodation 1721
Food Services and Drinking Places 4 18 15 17 17 $72,652 $1,425722
OTHER SERVICES 5 26 29 26 27 $215,108 $2,656
Repair and Maintenance 3811
Membership Organizations, etc. 2813
Page 65 of 701/ Oil Gas industry employment includes oil and gas exploration and oilfield services, or North American Industrial Classification System (NAICS) codes 211, 213111, 213112Quarterly Census of Employment Wages (QCEW): January - March 2020Data are preliminary and subject to revisionBlanks in the Employment, Total Earnings and Average Monthly Earnings columns due to confidentiality; data are suppressedSource: Alaska Department of Labor and Workforce Development, Research and Analysis Section

Yakutat City and Borough
Industrial Classification# of
UnitsJan
EmpFeb
EmpMar
EmpAverage
Monthly EmpTotal
EarningsAverage
Monthly Wage
TOTAL INDUSTRIES 47 247 272 263 261 $3,121,868 $3,987
TOTAL GOVERNMENT 17 96 109 105 104 $1,267,092 $4,061
FEDERAL GOVERNMENT 6 23 23 23 23 $441,156 $6,394
STATE GOVERNMENT 7 9 9 8 9 $112,937 $4,183
LOCAL GOVERNMENT 4 64 77 74 72 $712,999 $3,301
PRIVATE OWNERSHIP 30 151 163 158 157 $1,854,776 $3,938
GOODS-PRODUCING 4 24 25 23 24 $359,752 $4,997
NATURAL RESOURCES AND MINING 1
Agriculture, Forestry, Fishing, Hunting 1
Forestry and Logging 1113
CONSTRUCTION 3
Heavy Construction 2237
Specialty Trade Contractors 1238
SERVICE-PROVIDING 26 127 138 135 133 $1,495,024 $3,747
TRADE, TRANSPORTATION AND UTILITIES 10 50 50 47 49 $621,309 $4,227
Retail Trade 3 32 32 29 31 $189,293 $2,035
General Merchandise 2452
Nonstore Retailers 1454
Transportation and Warehousing 6
Air Transportation 2481
Truck Transportation 1484
Scenic and Sightseeing 1487
Support Activities 2488
Utilities 1
Utilities 1221
INFORMATION 1
Telecommunications 1517
FINANCIAL ACTIVITIES 1
Real Estate, Rental and Leasing 1
Rental and Leasing Svcs. 1532
PROFESSIONAL AND BUSINESS SERVICES 1
Mgmt. of Companies & Enterprises 1
Mgmt. of Companies and Enterprises 1551
EDUCATIONAL AND HEALTH SERVICES 4 43 56 53 51 $666,547 $4,357
Health Care and Social Assistance 4 43 56 53 51 $666,547 $4,357
Out Patient Health Care 3621
Social Assistance 1624
LEISURE AND HOSPITALITY 8 26 25 29 27 $161,005 $1,988
Arts, Entertainment and Recreation 1
Amusements, Gambling, Recreation 1713
Accommodation and Food Services 7
Accommodation 6 14 12 15 14 $107,389 $2,557721
Food Services and Drinking Places 1722
OTHER SERVICES 1
Membership Organizations, etc. 1813
Page 66 of 701/ Oil Gas industry employment includes oil and gas exploration and oilfield services, or North American Industrial Classification System (NAICS) codes 211, 213111, 213112Quarterly Census of Employment Wages (QCEW): January - March 2020Data are preliminary and subject to revisionBlanks in the Employment, Total Earnings and Average Monthly Earnings columns due to confidentiality; data are suppressedSource: Alaska Department of Labor and Workforce Development, Research and Analysis Section

Yukon-Koyukuk Census Area
Industrial Classification# of
UnitsJan
EmpFeb
EmpMar
EmpAverage
Monthly EmpTotal
EarningsAverage
Monthly Wage
TOTAL INDUSTRIES 278 2,097 2,158 2,145 2,133 $20,265,336 $3,167
TOTAL GOVERNMENT 157 1,473 1,515 1,523 1,503 $12,712,870 $2,819
FEDERAL GOVERNMENT 29 56 53 63 57 $693,828 $4,057
STATE GOVERNMENT 59 75 74 79 76 $1,198,707 $5,257
LOCAL GOVERNMENT 69 1,342 1,388 1,381 1,370 $10,820,335 $2,633
PRIVATE OWNERSHIP 121 624 643 622 630 $7,552,466 $3,996
GOODS-PRODUCING 21 46 52 49 49 $1,156,699 $7,869
NATURAL RESOURCES AND MINING 10
Agriculture, Forestry, Fishing, Hunting 3
Crop Production 2111
Forestry and Logging 1113
Mining 7
Mining, except Oil and Gas 5212
Mining Support Activities 2213
CONSTRUCTION 10 37 42 39 39 $974,363 $8,328
Construction of Buildings 3 9 6 6 7 $47,023 $2,239236
Heavy Construction 5237
Specialty Trade Contractors 2238
MANUFACTURING 1
Food 1311
SERVICE-PROVIDING 100 578 591 573 581 $6,395,767 $3,669
TRADE, TRANSPORTATION AND UTILITIES 52 211 219 197 209 $2,393,445 $3,817
Wholesale Trade 3
Wholesale, Durable Goods 1423
Wholesale, Nondurable Goods 2424
Retail Trade 31 111 108 102 107 $728,715 $2,270
Building Material and Garden 1444
Food and Beverages 8445
Gasoline Stations 7 42 38 36 39 $314,765 $2,690447
General Merchandise 8 33 29 31 31 $182,645 $1,964452
Nonstore Retailers 7 11 16 14 14 $143,026 $3,405454
Transportation and Warehousing 11 64 73 60 66 $1,332,386 $6,729
Air Transportation 5 32 33 27 31 $230,746 $2,481481
Water Transportation 2483
Transit and Ground Passenger 1485
Pipeline 1486
Support Activities 1488
Postal Service 1491
Utilities 7
Utilities 7221
INFORMATION 5 11 12 8 10 $68,184 $2,273
Broadcasting, except Internet 3515
Telecommunications 2517
PROFESSIONAL AND BUSINESS SERVICES 6 18 20 26 21 $283,383 $4,498
Professional, Scientific, Tech. 1
Professional, Scientific, Tech. 1541
Mgmt. of Companies & Enterprises 3 11 13 9 11 $113,759 $3,447
Mgmt. of Companies and Enterprises 3 11 13 9 11 $113,759 $3,447551
Administrative and Waste Services 2
Administrative and Support Services 2561
EDUCATIONAL AND HEALTH SERVICES 8 194 194 196 195 $2,293,039 $3,920
Educational Services 1
Educational Services 1611
Page 67 of 701/ Oil Gas industry employment includes oil and gas exploration and oilfield services, or North American Industrial Classification System (NAICS) codes 211, 213111, 213112Quarterly Census of Employment Wages (QCEW): January - March 2020Data are preliminary and subject to revisionBlanks in the Employment, Total Earnings and Average Monthly Earnings columns due to confidentiality; data are suppressedSource: Alaska Department of Labor and Workforce Development, Research and Analysis Section

Yukon-Koyukuk Census Area
Industrial Classification# of
UnitsJan
EmpFeb
EmpMar
EmpAverage
Monthly EmpTotal
EarningsAverage
Monthly Wage
SERVICE-PROVIDING 100 578 591 573 581 $6,395,767 $3,669
EDUCATIONAL AND HEALTH SERVICES 8 194 194 196 195 $2,293,039 $3,920
Health Care and Social Assistance 7
Out Patient Health Care 4 36 35 36 36 $715,802 $6,628621
Nursing and Residential Care 1623
Social Assistance 2624
LEISURE AND HOSPITALITY 17 32 32 34 33 $152,010 $1,535
Arts, Entertainment and Recreation 2
Amusements, Gambling, Recreation 2713
Accommodation and Food Services 15
Accommodation 8 17 18 19 18 $78,269 $1,449721
Food Services and Drinking Places 7722
OTHER SERVICES 11 112 114 112 113 $1,205,706 $3,557
Membership Organizations, etc. 11 112 114 112 113 $1,205,706 $3,557813
UNCLASSIFIED ESTABLISHMENTS 1 0 0 0 0 $0
Page 68 of 701/ Oil Gas industry employment includes oil and gas exploration and oilfield services, or North American Industrial Classification System (NAICS) codes 211, 213111, 213112Quarterly Census of Employment Wages (QCEW): January - March 2020Data are preliminary and subject to revisionBlanks in the Employment, Total Earnings and Average Monthly Earnings columns due to confidentiality; data are suppressedSource: Alaska Department of Labor and Workforce Development, Research and Analysis Section

Unknown Location
Industrial Classification# of
UnitsJan
EmpFeb
EmpMar
EmpAverage
Monthly EmpTotal
EarningsAverage
Monthly Wage
TOTAL INDUSTRIES 830 1,396 1,426 1,485 1,436 $26,464,027 $6,143
TOTAL GOVERNMENT 103 237 240 249 242 $3,721,604 $5,126
FEDERAL GOVERNMENT 25 90 88 90 89 $1,787,910 $6,696
STATE GOVERNMENT 78 147 152 159 153 $1,933,694 $4,213
PRIVATE OWNERSHIP 727 1,159 1,186 1,236 1,194 $22,742,423 $6,349
GOODS-PRODUCING 73 109 116 122 115 $3,686,252 $10,685
NATURAL RESOURCES AND MINING 24 45 62 69 59 $2,677,255 $15,126
Agriculture, Forestry, Fishing, Hunting 8 14 31 37 28 $335,997 $4,000
Animal Production 1112
Forestry and Logging 3113
Fishing, Hunting, Trapping 3114
Agriculture, Forestry Support 1115
Mining 16 31 31 32 31 $2,341,258 $25,175
Oil and Gas Extraction 2211
Mining, except Oil and Gas 2212
Mining Support Activities 12 17 16 17 17 $445,045 $8,726213
CONSTRUCTION 33 43 35 36 38 $684,597 $6,005
Construction of Buildings 10 23 17 20 20 $364,477 $6,075236
Heavy Construction 11 11 12 11 11 $149,702 $4,536237
Specialty Trade Contractors 12 9 6 5 7 $170,418 $8,115238
MANUFACTURING 16 21 19 17 19 $324,400 $5,691
Food 3311
Beverage and Tobacco Products 2312
Printing and Support Activities 1323
Nonmetallic Mineral Products 1327
Fabricated Metal Products 1332
Machinery 2333
Computer and Electronic Products 3334
Electrical Equip. and Appliances 1335
Transportation Equipment 1336
Miscellaneous 1339
SERVICE-PROVIDING 654 1,050 1,070 1,114 1,078 $19,056,171 $5,892
TRADE, TRANSPORTATION AND UTILITIES 107 132 135 137 135 $2,620,955 $6,471
Wholesale Trade 59 67 71 73 70 $1,350,593 $6,431
Wholesale, Durable Goods 34 36 37 39 37 $956,144 $8,614423
Wholesale, Nondurable Goods 13 15 12 12 13 $194,175 $4,979424
Wholesale, Electronic Markets 12 16 22 22 20 $200,274 $3,338425
Retail Trade 21
Motor Vehicle and Parts Dealers 2441
Furniture and Home Furnishings 2442
Electronics and Appliances 3443
Building Material and Garden 1444
Food and Beverages 1445
Health and Personal Care 4 11 9 10 10 $54,100 $1,803446
Clothing and Clothing Accessories 1448
Sporting Goods, Books, Music, etc. 1451
General Merchandise 2452
Miscellaneous 1453
Nonstore Retailers 3454
Transportation and Warehousing 25 31 33 33 32 $812,406 $8,463
Air Transportation 2481
Water Transportation 12 9 8 8 8 $225,258 $9,386483
Truck Transportation 2484
Scenic and Sightseeing 1487
Support Activities 1488
Page 69 of 701/ Oil Gas industry employment includes oil and gas exploration and oilfield services, or North American Industrial Classification System (NAICS) codes 211, 213111, 213112Quarterly Census of Employment Wages (QCEW): January - March 2020Data are preliminary and subject to revisionBlanks in the Employment, Total Earnings and Average Monthly Earnings columns due to confidentiality; data are suppressedSource: Alaska Department of Labor and Workforce Development, Research and Analysis Section

Unknown Location
Industrial Classification# of
UnitsJan
EmpFeb
EmpMar
EmpAverage
Monthly EmpTotal
EarningsAverage
Monthly Wage
SERVICE-PROVIDING 654 1,050 1,070 1,114 1,078 $19,056,171 $5,892
TRADE, TRANSPORTATION AND UTILITIES 107 132 135 137 135 $2,620,955 $6,471
Transportation and Warehousing 25 31 33 33 32 $812,406 $8,463
Couriers and Messengers 7 9 11 11 10 $257,590 $8,586492
Utilities 2
Utilities 2221
INFORMATION 44 81 72 70 75 $1,858,806 $8,261
Publishing, except Internet 14 13 13 13 13 $471,964 $12,102511
Motion Picture and Sound Recording 4 34 27 25 29 $399,284 $4,589512
Broadcasting, except Internet 1515
Telecommunications 6 19 17 18 18 $683,213 $12,652517
ISPs, Data Processing 15 9 9 8 9 $202,751 $7,509518
Other Information Services 4519
FINANCIAL ACTIVITIES 51 62 62 62 62 $1,554,262 $8,356
Finance and Insurance 47 58 58 58 58 $1,493,081 $8,581
Credit Intermediation, etc. 10 22 21 20 21 $667,042 $10,588522
Securities, Investments 6 6 7 6 6 $193,028 $10,724523
Insurance Carriers 23 28 28 29 28 $544,056 $6,477524
Funds, Trusts, etc. 8 2 2 3 2 $88,955 $14,826525
Real Estate, Rental and Leasing 4 4 4 4 4 $61,181 $5,098
Real Estate 4 4 4 4 4 $61,181 $5,098531
PROFESSIONAL AND BUSINESS SERVICES 329 621 637 676 644 $11,122,863 $5,757
Professional, Scientific, Tech. 240 377 387 424 396 $7,101,124 $5,977
Professional, Scientific, Tech. 240 377 387 424 396 $7,101,124 $5,977541
Mgmt. of Companies & Enterprises 10 30 29 29 29 $1,115,368 $12,820
Mgmt. of Companies and Enterprises 10 30 29 29 29 $1,115,368 $12,820551
Administrative and Waste Services 79 214 221 223 220 $2,906,371 $4,404
Administrative and Support Services 78561
Waste Management/Remediation 1562
EDUCATIONAL AND HEALTH SERVICES 71 102 111 114 109 $1,366,490 $4,179
Educational Services 43 54 59 61 58 $603,710 $3,470
Educational Services 43 54 59 61 58 $603,710 $3,470611
Health Care and Social Assistance 28 48 52 53 51 $762,780 $4,985
Out Patient Health Care 24 44 48 49 47 $704,026 $4,993621
Social Assistance 4 4 4 4 4 $58,754 $4,896624
LEISURE AND HOSPITALITY 13 16 14 14 15 $157,105 $3,491
Arts, Entertainment and Recreation 6 2 2 2 2 $25,973 $4,329
Performing Arts 2711
Amusements, Gambling, Recreation 4713
Accommodation and Food Services 7 14 12 12 12 $131,132 $3,643
Accommodation 2721
Food Services and Drinking Places 5722
OTHER SERVICES 26 33 36 37 35 $338,299 $3,222
Repair and Maintenance 8 20 23 22 21 $203,355 $3,228811
Personal and Laundry 4 6 4 4 5 $32,973 $2,198812
Membership Organizations, etc. 14 7 9 11 9 $101,971 $3,777813
UNCLASSIFIED ESTABLISHMENTS 13 3 3 4 3 $37,391 $4,155
Page 70 of 701/ Oil Gas industry employment includes oil and gas exploration and oilfield services, or North American Industrial Classification System (NAICS) codes 211, 213111, 213112Quarterly Census of Employment Wages (QCEW): January - March 2020Data are preliminary and subject to revisionBlanks in the Employment, Total Earnings and Average Monthly Earnings columns due to confidentiality; data are suppressedSource: Alaska Department of Labor and Workforce Development, Research and Analysis Section