Lal Bahadur Shastri Institute of Management, Delhi
LBSIM Working Paper Series
LBSIM/WP/2020/18
Revealed Comparative
Advantage: A Study
of India
and ASEAN economies
Rashmi Ahuja
August,2020

LBSIM Working Papers indicate research in progress by the author(s) and are brought out to elicit
ideas, comments, insights and to encourage debate. The views expressed in LBSIM Working Papers
are those of the author(s) and do not necessarily represent the views of the LBSIM nor its Board of
Governors.

WP/August2020/18
LBSIM Working Paper
Research Cell
Revealed Comparative Advantage: A Study of India and ASEAN economies
Rashmi Ahuja
Lal Bahadur Shastri Institute of Management
Dwarka , Delhi
Abstract
The trade relations between India and ASEAN economies have gained more attention among
academicians and researchers especially after India initiated ‘Look East Policy’ in 1991. It
gained even more importance after its upgraded version of ‘Act East policy’ and also the
recent withdrawal of India from Regional Comprehensive Economic Partnership (RCEP).
This paper aims to explore India’s comparative advantage with that of nine ASEAN
economies in different product groups at SITC one-digit level classification for the period
2009-2018. This empirical analysis uses Balassa (1965) measure of Revealed Comparative
Advantage (RCA). Our findings suggest that India has maintained stable comparative
advantage in two primary product group and two labour-intensive product groups while
Indonesia has maintained comparative advantage in highest number of product groups among
all ASEAN economies over the considered period of study. Further, we identified that India
could leverage its trade potential in two product groups i.e. Chemical and related products &
manufactured Goods to further strengthen its trade relation with ASEAN.
Keywords: Revealed Comparative advantage, ASEAN , India
JEL classification: F14, F10, F13, B27,F4
Revealed Comparative Advantage: A Study of India and ASEAN
economies
1. Introduction
International trade has been one of the important elements of globalization during the past
few decades. A number of International Trade theories (For instance, Absolute advantage,
Comparative advantage by Ricardo, H-O theory, New trade theories etc) came up and tried to
explain the reasons for occurrence of trade and the various patterns of international trade that
exists among the countries. However, Ricardo’s Comparative advantage is still widely used
as one of the important reasons for international trade and predicting the bilateral trade
relations between the countries. The comparative advantage relates about how much
productive or cost efficient is one country to another. After the pioneer work by Balassa
(1965), Revealed comparative advantage (RCA) index became the standard method of
calculating the comparative advantage in different economies.
Established in 1967, ASEAN has now become one of the growth centres in the world
economy. ASEAN is a diverse group consisting of economies at different levels of
development such as Brunei, Cambodia, Indonesia, Laos, Malaysia, Myanmar, the
Philippines, Singapore, Thailand, and Vietnam. If ASEAN were a single market then it
represents the third largest market after China and India. Bilateral Relations between India
and ASEAN get more strengthened with the formulation of ‘Look East Policy’ initiated in
1991. Further, India has also signed a bilateral free trade agreement (FTA) with ASEAN.
India’s bilateral trade with ASEAN stood at $142bn in 2018 which is expected to reach $300
billion by 20251. Of total $142 bn total trade, $97 billion is in the merchandise and around
$45 billion is in services. There has also been huge amount of Foreign Direct Investment
(FDI) equity inflows into India from ASEAN economies i.e. $91 billion for the period April
2000-June 2009. Further, there has been economic cooperation between ASEAN and India in
the form of various Joint ventures, aids and other incentives.
After the withdrawal of India from Regional Comprehensive Economic Partnership (RCEP),
India’s existing bilateral relationship with ASEAN has gained further attention. ASEAN is
one of the important trading partners for India over the past few years. There exists an
immense potential to transform India-ASEAN bilateral relationship into a sound economic
partnership in the form of a robust trade bloc. Inspite of existence of such potential trade and
investment oppourtunies between India and ASEAN, the fact that India has a trade deficit
with the ASEAN over the past few years2 needs immediate attention. Against this
background, it becomes even more important as well as interesting to examine the trade
complementarities between ASEAN and India so that efforts could be made to realize the full
trade potential between these two. This paper has twofold objective: Firstly, it examines the
1 As per study by PHD Research Bureau, PHD Chamber of Commerce and Industry. https://www.phdcci.in/wp-content/uploads/2019/11/Indias-Trade-and-Investment-Opportunities-with-ASEAN-economies.pdf , Accessed on 3th April,2020. 2 India’s trade deficit with ASEAN has increased from 9.86 percent in 2012-2013 to 21.85 percent in 2018-2019. https://commerce.gov.in/InnerContent.aspx?Id=74 ,Accessed on 4th April,2020.

structure of comparative advantage in India and nine3 ASEAN economies over the period
2009-2018. Secondly, it does a comparative evaluation of the similarities in the pattern of
revealed comparative advantage for these ten economies.
The rest of the paper is organized as follows. Section 2 presents a selective review of
literature and section 3 talks about the methodology used in the paper. Section 4 discusses the
RCA analysis for India and ASEAN economies. Finally, the last section concludes.
2. Selective Review of Literature
There have been number of studies in the literature that have employed index of revealed
comparative advantage to examine the comparative advantage for various economies. This
section presents a select review of such studies in the literature.
Balassa (1977) analysed the pattern of comparative advantage for industrial countries for the
period 1953-1971. They found the evidence for existence of an association between the size
and diversification of exports. Further, their findings suggest that first the export
diversification increases with increase in technological development and then decrease with
further increase in technological development.
Richardson and Zhang (1999) used the Balassa RCA index to examine and interpret
comparative advantage in US across time, trading partners and regions at different level of
commodity classifications. They found these patterns of comparative advantage for US to be
different across different parts of the world. Some of the reasons which they found for these
differences are geographical proximity of the trading partners and influence of per-capita
income (specially in case of manufacturers).
Ferto & Hubbard (2002) examines the competitiveness of Hungarian agriculture in relation to
the EU for the period 1992 to 1998 using indices of Revealed comparative advantage. Their
findings suggest that Hungary has revealed comparative advantages for eleven of the 22
aggregated product groups: live animals; meat; cereals; vegetables and fruit; sugar;
beverages; oilseeds; cork and wood; and animal and vegetable materials, oils and fats.
Further, it also suggests that Hungary’s markets are unlikely to become less distorted with
membership of the EU, at least in the medium term.
Batra & Khan (2005) performed a systematic comparative evaluation of the similarities of the
pattern of revealed comparative advantage for India and China for the years 2000 and 2003.
They calculated RCA for all the ninety-seven chapters of the Harmonized System (HS -
1996) classification as well as at the more disaggregated six-digit level for both the countries
using their exports data. Their analysis suggests that sectors that rank among the top ten
according to the value of the index of RCA are not necessarily able to retain their position
when ranked according to comparative advantage at the more disaggregated 6-digit level.
Further, their findings also suggest that both the countries enjoy comparative advantage in
Manufactured goods chiefly classified by material.
Akhtar et al (2008) analysed the performance of footwear industry of Pakistan at two-digit as
well as four-digit level and compared it with that of China and India. The study period is
from 1996 to 2006.Their findings suggest that there has been shift in the comparative
3 Our study has considered nine economies and not considered Philippines due to unavailability of data for the period considered in the study.

advantage in Pakistan from disadvantage to comparative advantage over the study period.
Their findings also suggest that India and China have comparative advantage in the foot-wear
industry since 1990 but it is decreasing since 2001.
Startiene & Remeikiene(2014) examined the competitiveness of the Lithuanian industrial
products in global markets using Revealed Comparative Advantage index and Revealed
symmetric comparative advantage index during the period of 2007–2011. Their findings from
the RCA and RSCA values indicates that the Lithuanian food, chemicals, wood and textile
manufactures captures the strongest competitive positions in global markets.
Laosutsan et al (2017) explored the economic impacts of trade liberalization and improved
connectivity on Thailand exports of 23 vegetable product groups to the ASEAN member
states (AMSs) using the Revealed Comparative Advantage and Revealed Symmetric
Comparative Advantage indexes for the period 2009-2013. Their results suggest that most
ASEAN countries are in either the dog or question mark quadrant of the BCG matrix
implying that the exports of vegetables experience a dual-low dilemma in which both the
market share and the market growth are low.
Veeramani & Anum (2018) analyse Indo-ASEAN Trade patterns for the period from 2012 to
2017.They examined the reasons for the increase in trade deficit between India and ASEAN
for the past few years. Their findings suggest that India requires more liberal and appropriate
trade policy with ASEAN nations in order to take advantage of India’s comparative
advantage in products like Pharmaceuticals, Textiles, Agricultural Products, etc. Further,
their study also indicates that RCEP can act as an important contributor to India’s Act East
Policy and hence needs to be analysed carefully.
From the review of the above studies in the literature, it can be observed that there have not
been many extensive studies on the comparative evaluation of comparative advantage of
India with respect to ASEAN economies for the period specially after the global financial
crisis. Our preliminary study aims to fill this gap by making an attempt to examine the
comparative advantage of India with respect to ASEAN economies and examine the potential
trade linkages that could be leveraged for mutual benefit of both India and ASEAN.
3. Methodology
We have used the RCA index to do a comparative analysis of India with respect to the other
Nine ASEAN countries. Balassa(1965) RCA index is defined as a country’s share of world
exports of a commodity divided by its share of total world exports. It uses relative exports
share of the individual countries to examine the comparative advantage and hence the export
potential of any economy.
RCA index for a country i and commodity j is calculated as follows:
𝑅𝐶𝐴𝑖𝑗 =
𝑋𝑖𝑗𝑋𝑤𝑗⁄
𝑋𝑖𝑋𝑤⁄
or ……………………………………………….. (1)
Further, Equation (1) could be rearranged as follows : -
𝑅𝐶𝐴𝑖𝑗 =
𝑋𝑖𝑗𝑋𝑖⁄
𝑋𝑤𝑗𝑋𝑤⁄
……………………………………...(2)

Where,
𝑋𝑖𝑗 is Country i’s exports in category j ,
Xwj is world exports in category j ,
𝑋𝑖 is the country’s i total exports and
𝑋𝑤 is the world total exports.
The interpretation of the Revealed Comparative advantage index is straightforward. If the
value of RCA index is greater than 1, then the country i has comparative advantage in
category j.
The RCA index has become the most widely used method to calculate competitive advantage
after the pioneer work by Balassa(1965). Apart from that, studies in the literature also states
some other advantages of RCA indexes and its modifications: - easy to use method; helps in
examining the weakest and strongest sectors of an economy, helps in making better policy
decisions.
4. Revealed Comparative Advantage: The analysis of India and ASEAN
In this section, we have calculated the Revealed Comparative advantage (RCA) for India and
nine ASEAN countries. The ASEAN economies considered for the study are Indonesia,
Thailand, Malaysia, Singapore, Myanmar, Brunei, Lao’s Peoples Republic, Vietnam and
Cambodia. Philippines was not included in the analysis due to unavailability of its data for
the period considered in this study4. The period chosen for the study is 2009-2018.
We have performed the individual calculations of RCA index for all the above ten countries
at the SITC Revision 4 one-digit level using the export data from UMCOMTRADE. The nine
product groups across which we conduct our analysis are:
Table 1 : Nine Product groups at SITC one-digit classification
SITC
Code
Industry
0 Food and live animals
1 Beverages and tobacco
2 Crude materials, inedible, except fuels
3 Mineral fuels, lubricants and related materials
4 Animal and vegetable oils, fats and waxes
5 Chemicals and related products, n.e.s.
6 Manufactured goods classified chiefly by material
4 The data for Philippines at SITC One-digit level is only available for year 2017 and 2018 from UMCOMTRADE.
7 Machinery and transport equipment
8 Miscellaneous manufactured articles
9 Commodities and transactions not classified elsewhere in the SITC
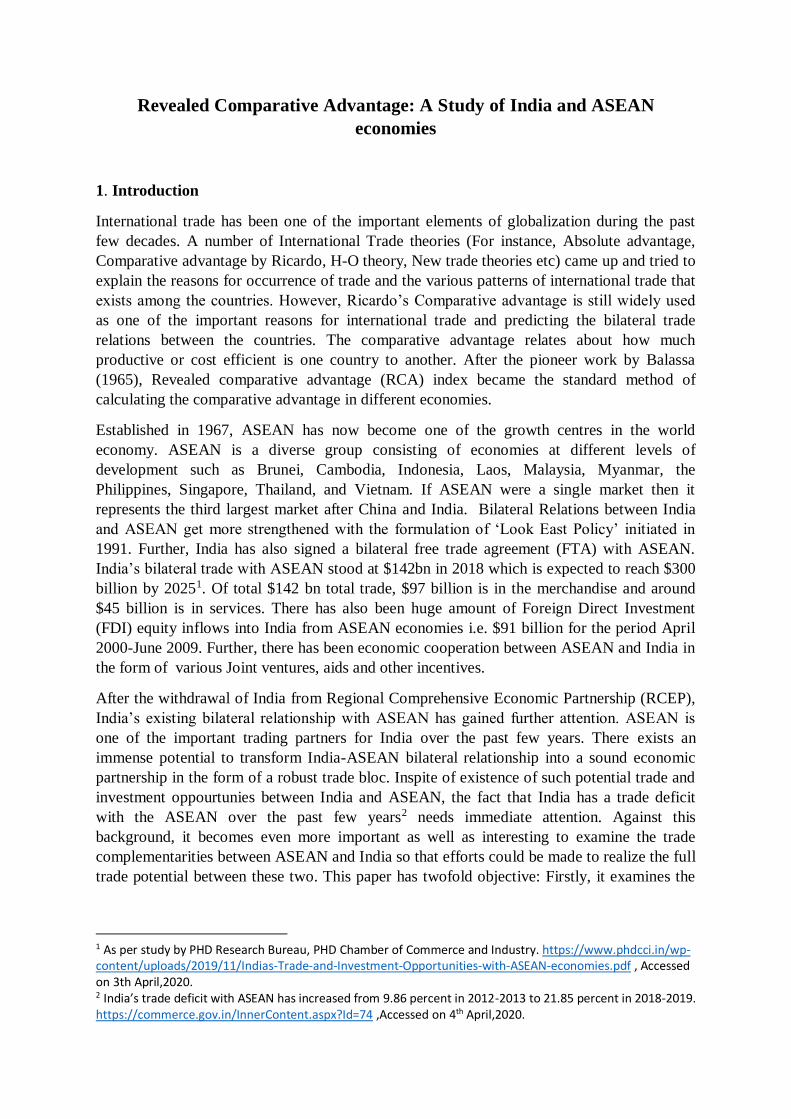
Next, we discussed the broad implications and inferences that emerges from our analysis.
The mean of RCA’s for the period 2009-2018 is reported in the Table 2 for India and the nine
ASEAN economies. From Table 2, it can be observed that India has comparative advantage
in six out of nine industries with mean RCA greater than 1. In case of ASEAN economies,
Indonesia, Singapore and Lao Peoples Republic exhibit comparative advantage in five out of
nine industries with mean RCA greater than one. The average RCA in Myanmar is greater
than one for the four industries reflecting their comparative advantage in those industries.
Thailand shows comparative advantage in two primary products (Food and live animals &
Crude materials, inedible, except fuels) and one capital-intensive product (SITC-7 i.e.
Machinery and transport equipment).Cambodia maintained its favourable position only in
Miscellaneous manufactured products with an overall mean RCA of 7.11 whereas Brunei
maintained its favourable position in Mineral fuels, lubricants and related materials (SITC-3)
with an RCA of 7.7 which is much higher than 1 over the study period. Malaysia maintained
strong comparative advantage with RCA of 14.14 in Animal and vegetable oils, fats and
waxes besides its comparative advantage in Machinery and transport equipment too.
However, Vietnam shows comparative advantage in only two industries out of 9 industries.
Table 2 : Mean RCA for India and Nine ASEAN Economies for the period 2009-20185
Industry
Classification IND VIET MALAY THAI INDO SING MYN CAMB BRUN LAO
Food and live
animals 1.467 2.427 0.519 2.062 1.070 0.239 4.307 0.533 0.018 2.202
Beverages
and tobacco 0.509 0.431 0.610 0.702 0.748 1.093 0.217 0.422 0.032 5.764
Crude
materials,
inedible,
except fuels 1.241 0.841 0.739 1.357 2.572 0.185 2.501 0.762 0.048 6.856
Mineral fuels,
lubricants and
related
materials 1.253 0.523 1.406 0.381 2.151 1.211 2.593 0.0002 7.704 0.601
Animal and
vegetable oils,
fats and
waxes 0.666 0.310 14.14 0.437 22.08 0.165 0.044 0.407 0.001 0.007
5 Mean RCA is for the period 2010-2018 for Indonesia, Myanmar and Laos as the data for 2009 is not available.
Chemicals
and related
products,
n.e.s. 1.111 0.235 0.671 0.872 0.622 1.133 0.016 0.056 0.217 0.331
Manufactured
goods
classified
chiefly by
material 2.022 0.840 0.724 0.999 1.051 0.301 0.958 0.207 0.047 2.051
Machinery
and transport
equipment 0.438 0.856 1.188 1.213 0.357 1.368 0.051 0.169 0.063 0.193
Miscellaneous
manufactured
articles 1.211 2.602 0.862 0.798 0.927 0.667 1.123 7.111 0.081 0.649
Commodities
and
transactions
not classified
elsewhere in
the SITC 0.414 0.128 0.127 0.460 0.181 1.756 0.836 0.136 0.029 1.154
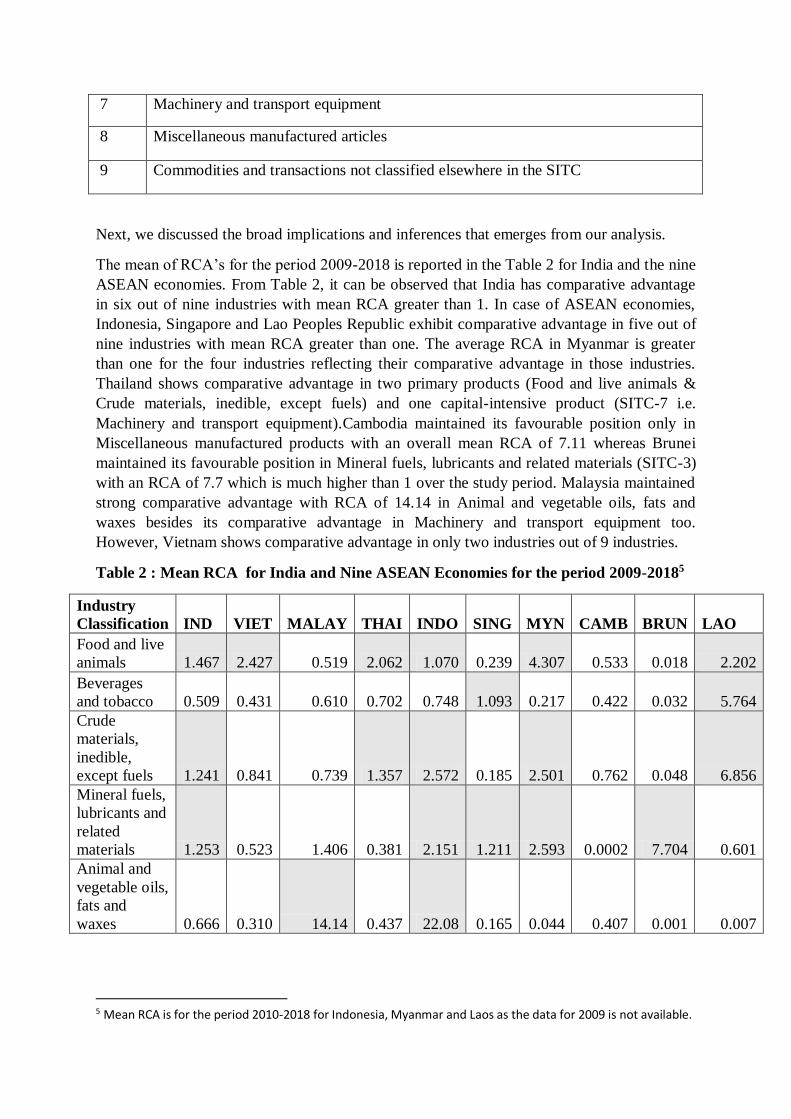
Source: Author’s compilation based on UMCOMTRADE database.
Further, the average RCA for Beverage and Tobacco is less than one for India and greater
than one for Singapore and Lao People’s Republic. This implies that there lies some scope to
trade beverage and tobacco between India and ASEAN economies with high RCA. Similarly,
there is a scope for trade in machinery and transport equipment between India and Malaysia,
Thailand & Singapore based on their revealed comparative advantage indices.
It is also evident from Table 2 that Malaysia and Indonesia have very high RCA indices of
14.4 and 22.08 respectively in Animal and vegetable oils, fats and waxes whereas India has
low RCA of about 0.666 only. This again implies a possible trade linkage between India and
ASEAN nations like Malaysia and Indonesia in SITC-4 category. It is in line with the fact
that Indonesia and Malaysia exports to India are substantial in this category for the period
2010-2018(refer Figure 1).
Figure 1: Indonesian and Malaysian Exports in Animal and vegetable oils, fats and
waxes to India for 2010-2018
0
1E+09
2E+09
3E+09
4E+09
5E+09
6E+09
2010 2011 2012 2013 2014 2015 2016 2017 2018
Indonesia
Malaysia

Source : Author’s compilation based on UMCOMTRADE database.
From the individual calculation of RCA for all countries for each of the year from 2009-2018,
our findings suggest that India is able to maintain its comparative advantage in 4 out of 9
industries as per SITC one-digit classification and it remained stable over the whole period
2009-2018. Out of these four industries, two are from the group of primary commodities
(Food & live animals and Mineral fuels, lubricants &related materials) and other two are
labour-intensive products (Manufactured goods classified chiefly by material and
miscellaneous manufacturing articles). In Crude materials, inedible except fuels, India
maintained its comparative advantage till 2016 after which its RCA index started decreasing
implying either its comparative disadvantage or diversification into other product groups.
Another interesting and important inference that emerges from our analysis is that India
shifted from comparative disadvantage to comparative advantage in Chemicals and related
products since 2012 only (See Figure 2) .All ASEAN economies except Singapore has
comparative disadvantage in this category. This implies that there exists some scope of
possible trade between India and Eight ASEAN economies (other than Singapore) in
chemical & related products. It is in line with the fact that total exports from India to these
nine ASEAN economies in Chemical and related products has increased from $1.7 bn in
2009 to $4.67 in 2018.
Figure 2 : RCA index calculation for India in Chemical & related products for the
period 2009-2018.
Source: Author’s compilation based on UMCOMTRADE database.
Our findings from the individual RCA analysis of ASEAN nations reveals that Indonesia
maintained its stable comparative advantage in highest number of industries i.e. four
throughout the period 2009-2018. Out of these four industries, three are from the group of
primary commodities (Crude materials, inedible except fuel; Mineral fuels, lubricants &
related materials; Animal & vegetable oils, fats & waxes) and one is from labour intensive
products (Manufactured goods classified chiefly by material). Malaysia, Myanmar,
Singapore, Laos and Thailand maintained stable comparative advantages in three industries
each for the period 2009-2018. Vietnam shows favourable position in Food & Live animals
and Miscellaneous manufactured articles by maintaining an RCA greater than 1 throughout
our study period. Cambodia exhibits a stable comparative advantage in Miscellaneous
manufactured products while Brunei shows the stable comparative advantage in Mineral
fuels, lubricants and related materials throughout the period 2009-2018.
0
0.2
0.4
0.6
0.8
1
1.2
1.4
1.6
2009 2010 2011 2012 2013 2014 2015 2016 2017 2018
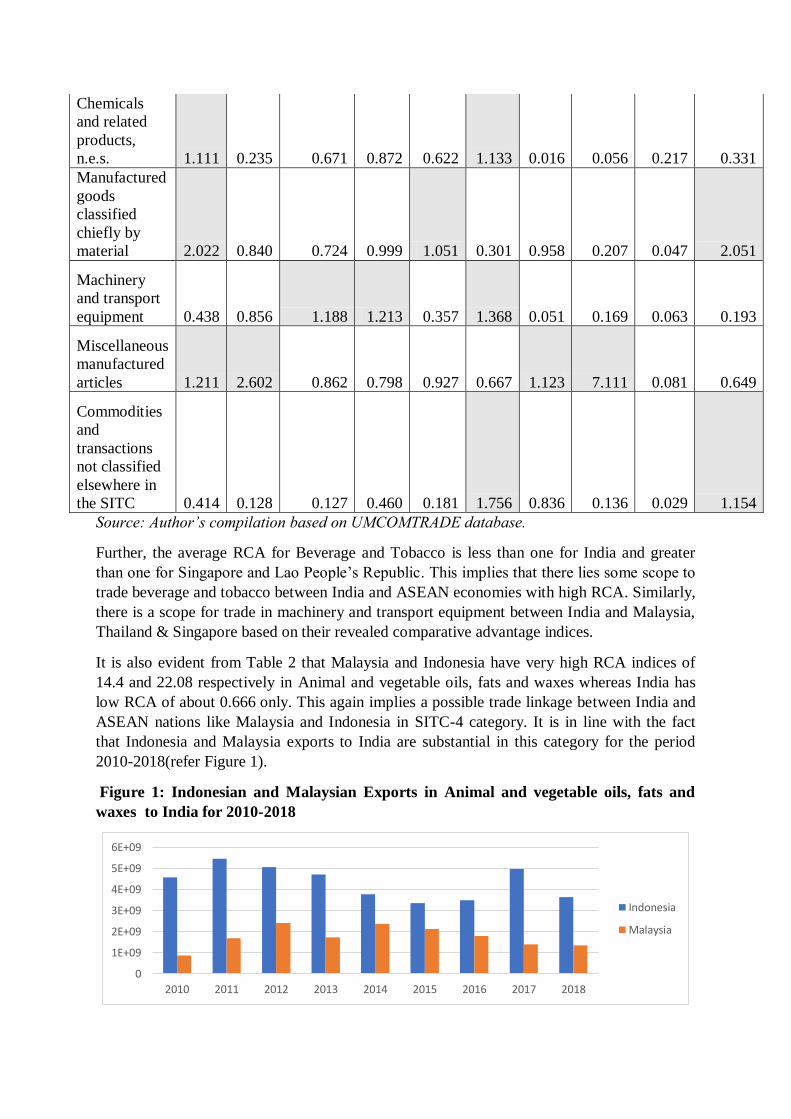
From the Figure 3, it can be observed that India has comparative advantage in SITC-0 : Food
and Live animals. From the ASEAN nations, four nations i.e. Vietnam, Thailand, Laos
peoples Republic and Myanmar also have comparative advantage with RCA greater than 1 in
SITC-0 category. Hence, India could face competition in this category from these four
nations especially Myanmar with a high average RCA of 4.3.
Figure 3 : RCA index in SITC ‘0’ category : Food and Live animals
Source : Author’s compilation based on UMCOMTRADE database.
Similarly, another industry where India has comparative advantage is SITC-3 i.e. Minerals,
fuels, lubricants and related materials with an average RCA of 1.25. Five out of the nine
ASEAN economies considered for our study has comparative advantage in SITC-3 like India
(see Figure 4). India could face tough competition in SITC-3 from these ASEAN economies
especially Brunei with high comparative advantage in SITC-3 with an average RCA of 7.7
which is much higher than 1 .
Figure 4 : RCA index in SITC ‘3’ category : Mineral fuels, lubricants and related
materials.
Source : Author’s compilation based on UMCOMTRADE database.
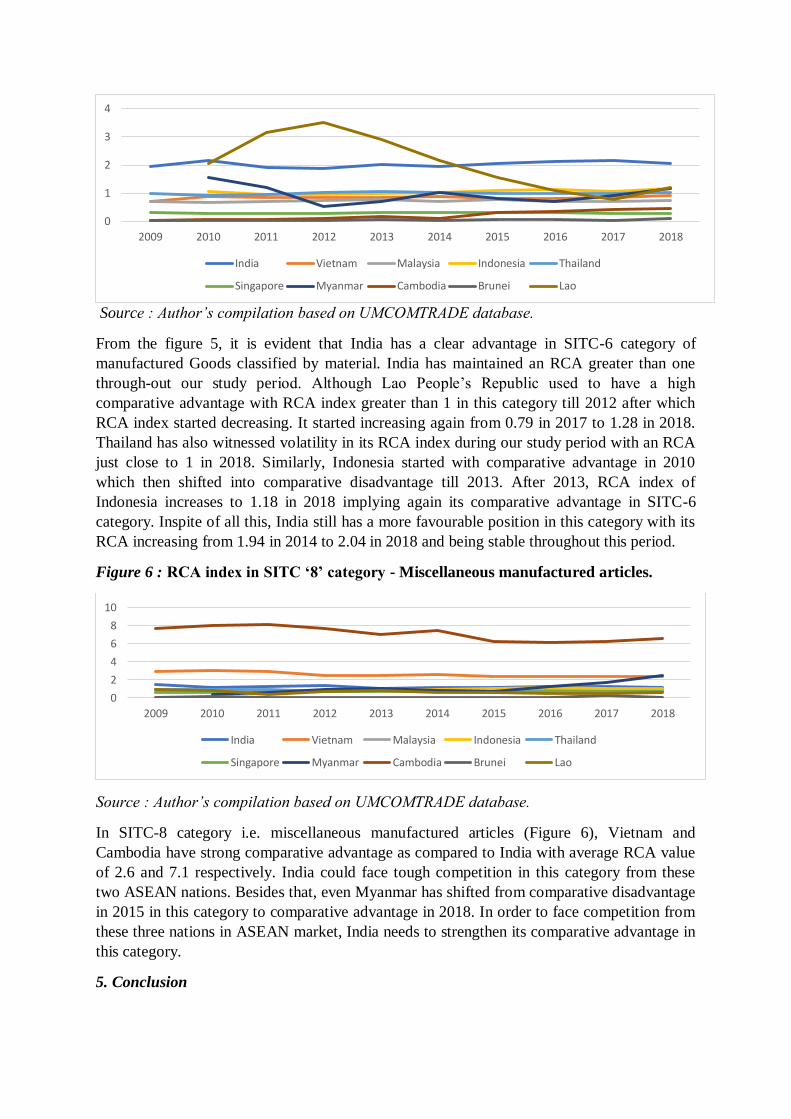
Figure 5: RCA index in SITC ‘6’ category - Manufactured Goods classified chiefly by
material
0
1
2
3
4
5
6
2009 2010 2011 2012 2013 2014 2015 2016 2017 2018
India Vietnam Malaysia Indonesia Thailand
Singapore Myanmar Cambodia Brunei Lao
0
5
10
15
2009 2010 2011 2012 2013 2014 2015 2016 2017 2018
India Vietnam Malaysia Indonesia Thailand
Singapore Myanmar Cambodia Brunei Lao
Source : Author’s compilation based on UMCOMTRADE database.
From the figure 5, it is evident that India has a clear advantage in SITC-6 category of
manufactured Goods classified by material. India has maintained an RCA greater than one
through-out our study period. Although Lao People’s Republic used to have a high
comparative advantage with RCA index greater than 1 in this category till 2012 after which
RCA index started decreasing. It started increasing again from 0.79 in 2017 to 1.28 in 2018.
Thailand has also witnessed volatility in its RCA index during our study period with an RCA
just close to 1 in 2018. Similarly, Indonesia started with comparative advantage in 2010
which then shifted into comparative disadvantage till 2013. After 2013, RCA index of
Indonesia increases to 1.18 in 2018 implying again its comparative advantage in SITC-6
category. Inspite of all this, India still has a more favourable position in this category with its
RCA increasing from 1.94 in 2014 to 2.04 in 2018 and being stable throughout this period.
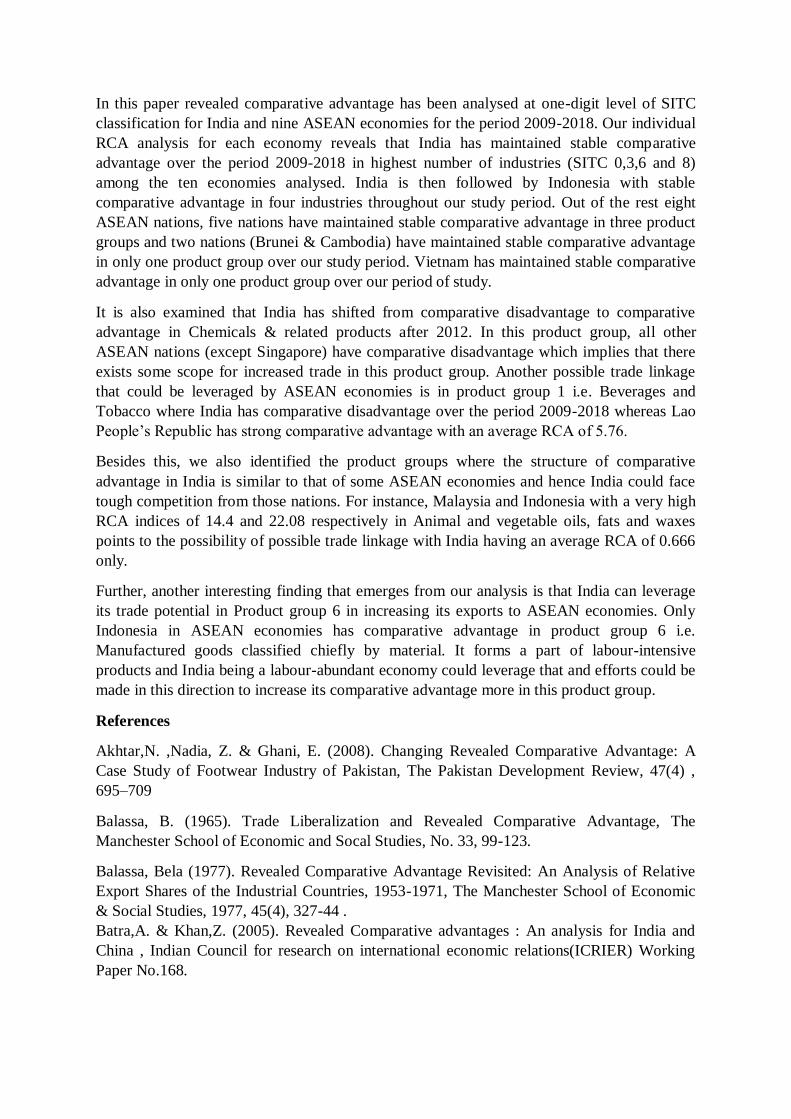
Figure 6 : RCA index in SITC ‘8’ category - Miscellaneous manufactured articles.
Source : Author’s compilation based on UMCOMTRADE database.
In SITC-8 category i.e. miscellaneous manufactured articles (Figure 6), Vietnam and
Cambodia have strong comparative advantage as compared to India with average RCA value
of 2.6 and 7.1 respectively. India could face tough competition in this category from these
two ASEAN nations. Besides that, even Myanmar has shifted from comparative disadvantage
in 2015 in this category to comparative advantage in 2018. In order to face competition from
these three nations in ASEAN market, India needs to strengthen its comparative advantage in
this category.
5. Conclusion
0
1
2
3
4
2009 2010 2011 2012 2013 2014 2015 2016 2017 2018
India Vietnam Malaysia Indonesia Thailand
Singapore Myanmar Cambodia Brunei Lao
0
2
4
6
8
10
2009 2010 2011 2012 2013 2014 2015 2016 2017 2018
India Vietnam Malaysia Indonesia Thailand
Singapore Myanmar Cambodia Brunei Lao
In this paper revealed comparative advantage has been analysed at one-digit level of SITC
classification for India and nine ASEAN economies for the period 2009-2018. Our individual
RCA analysis for each economy reveals that India has maintained stable comparative
advantage over the period 2009-2018 in highest number of industries (SITC 0,3,6 and 8)
among the ten economies analysed. India is then followed by Indonesia with stable
comparative advantage in four industries throughout our study period. Out of the rest eight
ASEAN nations, five nations have maintained stable comparative advantage in three product
groups and two nations (Brunei & Cambodia) have maintained stable comparative advantage
in only one product group over our study period. Vietnam has maintained stable comparative
advantage in only one product group over our period of study.
It is also examined that India has shifted from comparative disadvantage to comparative
advantage in Chemicals & related products after 2012. In this product group, all other
ASEAN nations (except Singapore) have comparative disadvantage which implies that there
exists some scope for increased trade in this product group. Another possible trade linkage
that could be leveraged by ASEAN economies is in product group 1 i.e. Beverages and
Tobacco where India has comparative disadvantage over the period 2009-2018 whereas Lao
People’s Republic has strong comparative advantage with an average RCA of 5.76.
Besides this, we also identified the product groups where the structure of comparative
advantage in India is similar to that of some ASEAN economies and hence India could face
tough competition from those nations. For instance, Malaysia and Indonesia with a very high
RCA indices of 14.4 and 22.08 respectively in Animal and vegetable oils, fats and waxes
points to the possibility of possible trade linkage with India having an average RCA of 0.666
only.
Further, another interesting finding that emerges from our analysis is that India can leverage
its trade potential in Product group 6 in increasing its exports to ASEAN economies. Only
Indonesia in ASEAN economies has comparative advantage in product group 6 i.e.
Manufactured goods classified chiefly by material. It forms a part of labour-intensive
products and India being a labour-abundant economy could leverage that and efforts could be
made in this direction to increase its comparative advantage more in this product group.
References
Akhtar,N. ,Nadia, Z. & Ghani, E. (2008). Changing Revealed Comparative Advantage: A
Case Study of Footwear Industry of Pakistan, The Pakistan Development Review, 47(4) ,
695–709
Balassa, B. (1965). Trade Liberalization and Revealed Comparative Advantage, The
Manchester School of Economic and Socal Studies, No. 33, 99-123.
Balassa, Bela (1977). Revealed Comparative Advantage Revisited: An Analysis of Relative
Export Shares of the Industrial Countries, 1953-1971, The Manchester School of Economic
& Social Studies, 1977, 45(4), 327-44 .
Batra,A. & Khan,Z. (2005). Revealed Comparative advantages : An analysis for India and
China , Indian Council for research on international economic relations(ICRIER) Working
Paper No.168.
Ferto, I. & Hubbard, L. J. (2002). Revealed comparative advantage and competitiveness in
Hungarian agri-food sectors, Institute of Economics Hungarian Academy of Sciences,
KTK/IE Discussion Paper No. MT–DP. 2002/8
Laosutsan, P. , Shivakoti, P. G. & Soni., P. (2017). Comparative advantage and export
potential of Thai vegetable products following the integration into the ASEAN Economic
Community, International Food and Agribusiness Management Association,20(4), 575-590.
PhD Chamber Report on Analysis of India’s Trade Pattern between India and ASEAN
(2018), http://phdcci.in/file/thematic_pdf/Analysis%20of%20Trade%20Pattern.pdf
Richardson, D. J. and Zhang, C. (1999). Revealing Comparative Advantage: Chaotic or
Coherent Patterns Across Time and Sector and U.S Trading Partner?, National Bureau of
Economic Research, Working Paper 7212.
Startiene, G. & Remeikiene,R. (2014). Evaluation of revealed comparative advantage of
Lithuanian industry in global markets, Procedia - Social and Behavioral Sciences, 110, 428 –
438.
Veermani, S. & Anam (2018). An analysis on India-ASEAN trade : Towards Regional
Economic Cooperation Partnership (RCEP) , Journal of Management , 5(4), 81-96.

LAL BAHADUR SHASTRI INSTITUTE OF MANAGEMENT, DELHI
PLOT NO. 11/7, SECTOR-11, DWARKA, NEW DELHI-110075
Ph.: 011-25307700, www.lbsim.ac.in