Responses of Ecosystem CarbonCycling to Climate Change
Treatments Along an ElevationGradient
Zhuoting Wu,1* George W. Koch,1 Paul Dijkstra,1 Matthew A. Bowker,2
and Bruce A. Hungate1
1Department of Biological Sciences and Merriam-Powell Center for Environmental Research, Northern Arizona University, Flagstaff,Arizona 86011, USA; 2US Geological Survey, Southwest Biological Science Center, Northern Arizona University, P.O. Box 5614,
Flagstaff, Arizona 86011, USA
ABSTRACT
Global temperature increases and precipitation
changes are both expected to alter ecosystem carbon
(C) cycling. We tested responses of ecosystem
C cycling to simulated climate change using field
manipulations of temperature and precipitation
across a range of grass-dominated ecosystems along
an elevation gradient in northern Arizona. In 2002,
we transplanted intact plant–soil mesocosms to
simulate warming and used passive interceptors and
collectors to manipulate precipitation. We measured
daytime ecosystem respiration (ER) and net eco-
system C exchange throughout the growing season
in 2008 and 2009. Warming generally stimulated ER
and photosynthesis, but had variable effects on
daytime net C exchange. Increased precipitation
stimulated ecosystem C cycling only in the driest
ecosystem at the lowest elevation, whereas de-
creased precipitation showed no effects on ecosystem
C cycling across all ecosystems. No significant
interaction between temperature and precipitation
treatments was observed. Structural equation mod-
eling revealed that in the wetter-than-average year
of 2008, changes in ecosystem C cycling were more
strongly affected by warming-induced reduction in
soil moisture than by altered precipitation. In con-
trast, during the drier year of 2009, warming induced
increase in soil temperature rather than changes in
soil moisture determined ecosystem C cycling. Our
findings suggest that warming exerted the strongest
influence on ecosystem C cycling in both years, by
modulating soil moisture in the wet year and soil
temperature in the dry year.
Key words: warming; precipitation; gross eco-
system photosynthesis; ecosystem respiration; net
ecosystem exchange; structural equation model.
INTRODUCTION
Global mean temperature is predicted to increase
1.8–4.0�C by the end of this century, whereas
estimates of projected precipitation are much more
uncertain and region-specific (IPCC 2007). In the
southwestern North America, multiple climate
models predicted a drier climate throughout the
current century as a result of rising greenhouse
Received 15 February 2011; accepted 16 June 2011
Electronic supplementary material: The online version of this article
(doi:10.1007/s10021-011-9464-4) contains supplementary material,
which is available to authorized users.
Author Contributions: BAH, GWK, and PD conceived of the study. ZW
performed the research and analyzed the data. MAB contributed new
models. ZW wrote the paper. BAH, GWK, PD, and MAB contributed to
the writing.
*Corresponding author; e-mail: [email protected]
EcosystemsDOI: 10.1007/s10021-011-9464-4
� 2011 Springer Science+Business Media, LLC
gases (Seager and others 2007; Seager and Vecchi
2010). It is nearly certain that changes in temper-
ature and precipitation will alter key ecosystem
processes and ecosystem-level C exchange, and
therefore will likely feed back to ongoing climate
change (Cox and others 2000). To improve our
predictive capability and allow human society to
anticipate the magnitude of these impacts, we
must: (1) assess the relative influence of these
global changes, (2) determine whether global
changes will produce antagonistic or synergistic
interactions, and (3) determine the degree to which
the answers to these questions is contingent upon
the particular ecosystem being studied.
Temperature is a key driver of ecosystem pro-
cesses, as demonstrated by a number of warming
experiments. Warming has been shown to signifi-
cantly increase soil respiration (Kirschbaum 1995;
Lilley and others 2001; Mertens and others 2001;
Emmett and others 2004; Niinisto and others 2004;
Schindlbacher and others 2009), ecosystem respi-
ration (ER) (Grogan and Chapin 2000), gross eco-
system production (Sullivan and others 2008), and
net C uptake (Oberbauer and others 2007). Tem-
perature can also negatively affect soil moisture
content due to enhanced evapotranspiration, thus
modulating the stimulating effects of increased
temperature on ecosystem C cycling (McHale and
others 1998; De Boeck and others 2007; Sherry and
others 2008; Liu and others 2009). Meanwhile,
precipitation is directly linked to ecosystem pro-
cesses via soil moisture (Weltzin and others 2003).
Enhanced precipitation has been shown to increase
soil moisture (Risch and Frank 2007), photosyn-
thesis (Liu and others 2009), and decomposition
(Liu and others 2009), and can alleviate some
negative effects of warming-induced soil drying.
Soil moisture deficiency imposes stress on ecologi-
cal processes such as photosynthesis (Deng and
others 1990, Gorissen and others 2004) and respi-
ration (Emmett and others 2004; Lellei-Kovacs and
others 2008). Field studies and models have dem-
onstrated the importance of interannual precipita-
tion variability in determining ecosystem-level
productivity (Lieth 1973; Churkina and others
1999; Knapp and Smith 2001; Scurlock and others
2002; Huxman and others 2004; Garbulsky and
others 2010). The majority of the above experi-
ments have manipulated temperature or precipi-
tation as single factors, yet few field studies have
tested their interactive effects. Based on seven field
manipulation experiments in forests, heathlands,
and grassland, models suggest that two-way inter-
active effects of elevated temperature and dou-
bled precipitation enhance ER and net primary
production (NPP), whereas NPP is depressed when
elevated temperature is combined with reduced
precipitation (Luo and others 2008). Although
examples are few, most multi-factor field experi-
ments have suggested that non-additive interac-
tions between precipitation and temperature are
negligible (Liu and others 2009; Dukes and
others 2005; Zhou and others 2006; Grime and
others 2008; Niu and others 2008a; Wu and others
2010).
To account for both rising temperature and
altered precipitation effects on ecosystem C cycling,
we conducted a plant–soil mesocosm (hereafter
referred to as ‘‘mesocosm’’) transplant experiment
along the C. Hart Merriam elevation gradient in
northern Arizona covering four ecosystems and a
broad range of climatic regimes. This gradient
has been used in numerous studies (Dijkstra and
others 2006; Schwartz and others 2007; Adair
and Schwartz 2008; Dijkstra and others 2008;
Blankinship and others 2010) because its 7�C mean
annual temperature range and 51-cm mean annual
precipitation range lead to a wide variety of eco-
system types within a distance of only 50 km. We
focused our studies on the grass-dominated vege-
tation across a 1064-m elevation range (1556–
2620 m), including meadows in mixed conifer
forests and ponderosa pine forests, grass-dominated
interspaces in pinyon-juniper woodlands, and high
desert grassland. A down-slope mesocosm trans-
plant manipulation was initiated in 2002 to
simulate projected warmer future temperatures.
Because of the uncertainty of future precipitation
change, two precipitation treatments (+50% and
-30%) were applied to the mesocosms represent-
ing ranges of precipitation projections over North
America (Christensen and others 2007). We mea-
sured components of ecosystem C cycling over two
consecutive growing seasons of 2008 and 2009.
With this approach, we aimed to determine the
relative importance of temperature and precipi-
tation change on ecosystem C cycling and their
interaction across multiple ecosystems. We
hypothesized that: (1) elevated temperature stim-
ulates gross ecosystem photosynthesis (GEP) and
respiration in cooler ecosystems at high elevation,
while suppressing these processes in warmer eco-
systems at low elevation; (2) increased precipita-
tion stimulates ecosystem C cycling more in drier
ecosystems at low elevation than in wetter eco-
systems at high elevation; and (3) warming
combined with increased precipitation enhances
net ecosystem C uptake, whereas warming with
decreased precipitation reduces ecosystem C
uptake.
Z. Wu and others
METHODS
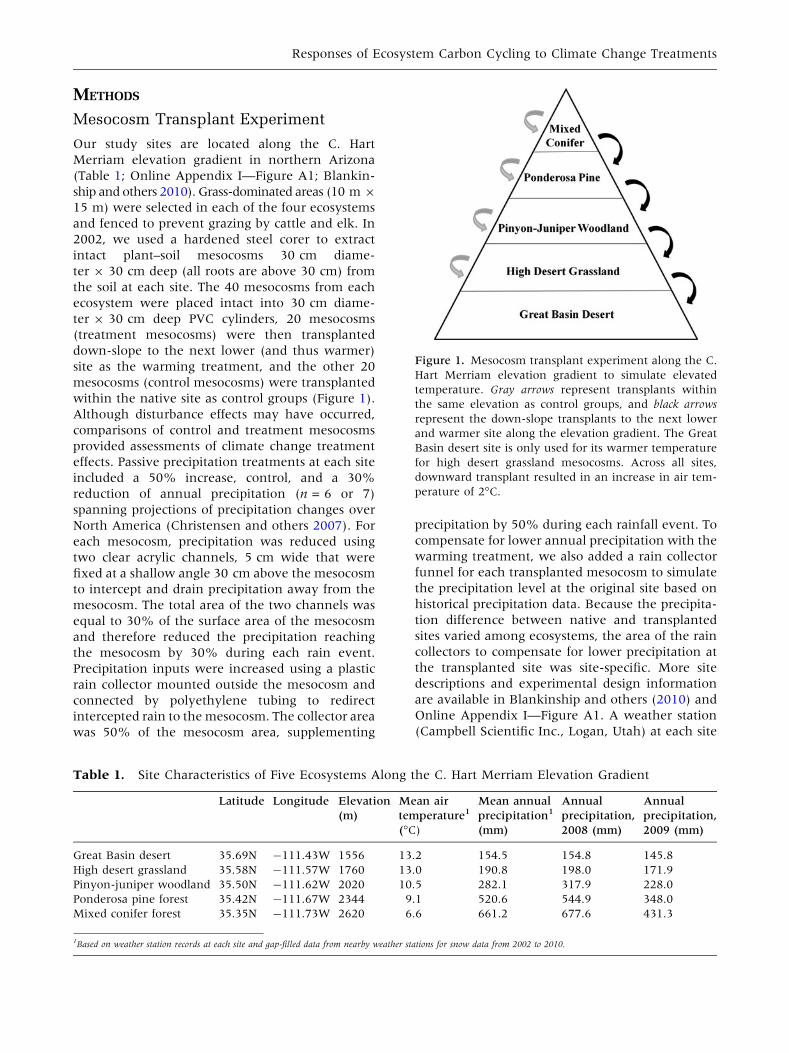
Mesocosm Transplant Experiment
Our study sites are located along the C. Hart
Merriam elevation gradient in northern Arizona
(Table 1; Online Appendix I—Figure A1; Blankin-
ship and others 2010). Grass-dominated areas (10 m 9
15 m) were selected in each of the four ecosystems
and fenced to prevent grazing by cattle and elk. In
2002, we used a hardened steel corer to extract
intact plant–soil mesocosms 30 cm diame-
ter 9 30 cm deep (all roots are above 30 cm) from
the soil at each site. The 40 mesocosms from each
ecosystem were placed intact into 30 cm diame-
ter 9 30 cm deep PVC cylinders, 20 mesocosms
(treatment mesocosms) were then transplanted
down-slope to the next lower (and thus warmer)
site as the warming treatment, and the other 20
mesocosms (control mesocosms) were transplanted
within the native site as control groups (Figure 1).
Although disturbance effects may have occurred,
comparisons of control and treatment mesocosms
provided assessments of climate change treatment
effects. Passive precipitation treatments at each site
included a 50% increase, control, and a 30%
reduction of annual precipitation (n = 6 or 7)
spanning projections of precipitation changes over
North America (Christensen and others 2007). For
each mesocosm, precipitation was reduced using
two clear acrylic channels, 5 cm wide that were
fixed at a shallow angle 30 cm above the mesocosm
to intercept and drain precipitation away from the
mesocosm. The total area of the two channels was
equal to 30% of the surface area of the mesocosm
and therefore reduced the precipitation reaching
the mesocosm by 30% during each rain event.
Precipitation inputs were increased using a plastic
rain collector mounted outside the mesocosm and
connected by polyethylene tubing to redirect
intercepted rain to the mesocosm. The collector area
was 50% of the mesocosm area, supplementing
precipitation by 50% during each rainfall event. To
compensate for lower annual precipitation with the
warming treatment, we also added a rain collector
funnel for each transplanted mesocosm to simulate
the precipitation level at the original site based on
historical precipitation data. Because the precipita-
tion difference between native and transplanted
sites varied among ecosystems, the area of the rain
collectors to compensate for lower precipitation at
the transplanted site was site-specific. More site
descriptions and experimental design information
are available in Blankinship and others (2010) and
Online Appendix I—Figure A1. A weather station
(Campbell Scientific Inc., Logan, Utah) at each site
Table 1. Site Characteristics of Five Ecosystems Along the C. Hart Merriam Elevation Gradient
Latitude Longitude Elevation
(m)
Mean air
temperature1
(�C)
Mean annual
precipitation1
(mm)
Annual
precipitation,
2008 (mm)
Annual
precipitation,
2009 (mm)
Great Basin desert 35.69N -111.43W 1556 13.2 154.5 154.8 145.8
High desert grassland 35.58N -111.57W 1760 13.0 190.8 198.0 171.9
Pinyon-juniper woodland 35.50N -111.62W 2020 10.5 282.1 317.9 228.0
Ponderosa pine forest 35.42N -111.67W 2344 9.1 520.6 544.9 348.0
Mixed conifer forest 35.35N -111.73W 2620 6.6 661.2 677.6 431.3
1Based on weather station records at each site and gap-filled data from nearby weather stations for snow data from 2002 to 2010.
Figure 1. Mesocosm transplant experiment along the C.
Hart Merriam elevation gradient to simulate elevated
temperature. Gray arrows represent transplants within
the same elevation as control groups, and black arrows
represent the down-slope transplants to the next lower
and warmer site along the elevation gradient. The Great
Basin desert site is only used for its warmer temperature
for high desert grassland mesocosms. Across all sites,
downward transplant resulted in an increase in air tem-
perature of 2�C.
Responses of Ecosystem Carbon Cycling to Climate Change Treatments
collected microclimatic variables including air
temperature, precipitation, relative humidity, total
shortwave radiation, and wind speed and direction.
Ecosystem C Flux Measurements
Ecosystem CO2 fluxes were measured once per
month from June to October in 2008 and in May
2009, and twice per month from June to August in
2009, using a static chamber method with a trans-
parent 30 cm diameter 9 30 cm height acrylic
chamber that was sealed on top of the mesocosm
cylinders and were interfaced to a LiCor 6400
(LI-COR, Lincoln, Nebraska) gas exchange system
operating as a closed system. All sites exhibited a
shorter growing season in the drier year of 2009,
with peak biomass being reached in mid-August
versus late-September in 2008. The CO2 flux mea-
surements were made between 9 am and 2 pm on
cloud-free days at least 3 days after rain events in an
attempt to capture intermediate and more common
soil moisture conditions. At each measurement
period, we first measured daytime net ecosystem
exchange (NEE) of each mesocosm under ambient
light, followed by ER (the sum of plant and soil res-
piration) in darkness. We calculated GEP as the sum
of NEE and ER. The measurement of daytime NEE
occurred over a period of 60 s during which CO2
concentration was reduced by about 6 ppm. The
chamber was then vented for 30 s, covered with a
light-proof cloth, and ER was also measured over a
period of 60 s, during which CO2 concentration was
increased by about 11 ppm. During each 60-s mea-
surement period, fluxes were determined over six
consecutive 10-s intervals with the average used for
data analyses. A brief increase in leaf respiration,
which is not representative of rates measured over
longer periods of darkness, is sometimes observed
immediately following a light-to-dark transition
(Atkin and others 2000). We consider this potential
artifact to be minor because our measurements also
included stem, root, and soil microbial respiration,
which are not known to exhibit a post-illumination
burst. Moreover, CO2 fluxes from ER were stable
during the 60-s measurement period, indicating that
any transient increase in leaf respiration following
the light-to-dark transition had an undetectable
contribution to the dynamics of total respiration. We
were also aware of the possible errors associated with
low CO2 fluxes, yet we chose the 60-s measurement
period to prevent chamber overheating. We used
replication (n = 6 or 7) to separate signal from noise
and installed a circulation fan inside the chamber to
ensure thorough air mixing during the 60-s mea-
surement period.
We conducted a time-weighted calculation to
integrate monthly and bi-weekly fluxes into mean
growing season fluxes. We calculated the products
of average CO2 flux rates and time span (in days)
between the two adjacent sampling periods and
then summed them over the entire growing season
and divided by total number of days between the
first and last sampling periods to get the time-
weighted, growing season average CO2 flux for
each year. Because ecosystem gas exchange was
measured in ambient light on cloud-free days, the
integrated CO2 fluxes likely represent maximum
values for growing season NEE, ER, and GEP.
Climate and Environmental Conditions
There was less than 0.4�C difference in mean an-
nual air temperature between 2008 and 2009 across
all sites. However, precipitation differed strongly
between the two years (Table 1). Annual precipi-
tation in 2008 was higher than the 9-year (2002–
2010) average across all sites, but much lower for
2009 (Table 1). In 2009, the actual precipitation
deviated from the long-term average more at higher
than lower elevation sites (Table 1). We also mea-
sured soil temperature, soil moisture, and photo-
synthetically active radiation (PAR) inside the
mesocosms at the same time as (or immediately
after) ecosystem C fluxes. Soil temperature at the
center of each mesocosm at 15 cm depth was
measured with a thermocouple, and light was
measured by a PAR sensor on top of the chamber,
both connected to the LiCor 6400 (LI-COR, Lincoln,
Nebraska). We measured soil moisture by inserting
a small theta probe soil moisture sensor at the
center of the mesocosms at 6 cm depth (ML2x,
Delta-T Devices Ltd., Burwell, Cambridge, England)
immediately following the CO2 flux measurements.
The effect of disturbance from this insertion was
minimal. The average environmental conditions
during the gas exchange measurements are shown
in Table 2. We found less than 1�C change in tem-
perature in the static chamber during the course of
measurements for each mesocosm across all sites.
Statistical Analysis
To analyze interrelationships among our variables
as a system, we used structural equation modeling
(Grace 2006). Structural equation modeling is
useful for partitioning relative strengths of direct
and indirect effects of one variable on another and
is widely used in ecological studies (Weiher and
others 2004; Grace and others 2007; Antoninka
and others 2009; Chaudhary and others 2009;
Laughlin and others 2010). Our modeling approach
Z. Wu and others

is summarized only briefly here, but is more fully
detailed in Online Appendix II. We developed an
a priori conceptual model as a starting point for our
modeling (Online Appendix II—Figure A2) and
evaluated it using our data set, resulting in esti-
mates of path coefficients and a test of validity of
the model as an overall hypothesis. Path coeffi-
cients describe the strength of a hypothesized
causal influence of one variable on another, and in
their standardized form are directly analogous to
partial correlation coefficients, or standardized
regression weights. Because 2008 and 2009 were so
different, we used a multi-group model with the
two years as groups (Pugesek and others 2003;
Grace 2006). This method allowed us to test dif-
ferences between years in the relative strength and
sign of pathways. A multi-group model starts with
the hypothesis that the same model structure fits
both groups and that the pathways are of equal sign
and magnitude among groups (Grace 2006). The
constraints are then relaxed one by one, allowing
path coefficients or residual variances to take on
different values in the different groups until the
model fit is adequate. A v2 goodness-of-fit test is
employed to test whether the model is a reasonable
explanation of the patterns in the data; this test
estimates the probability that the data fit the
hypothesized model structure, thus a low proba-
bility value (commonly P < 0.05) indicates a poor
fit. We confirmed adequate model fit with an
additional test, the RMSEA (root mean squared
error of approximation) index which adjusts for
sample size and, thus, is broadly more informative.
A value of the RMSEA of 0.05 or less would indi-
cate a close fit of the model (Browne and Cudeck
1993), and the P value of the close fit is for testing
the null hypothesis that the population RMSEA is
no greater than 0.05, and therefore high P values
indicate a close-fit model for the experimental data.
All structural equation modeling was conducted in
AMOS 18.0 (SPSS Inc., Chicago, Illinois). We also
used repeated measures ANOVA to statistically
evaluate the effects of temperature, precipitation,
time, and their interactions in Statistica 9.0 (Stat-
Soft Inc., Tulsa, Oklahoma).
RESULTS
Environmental Variables
Soil temperature decreased and soil moisture in-
creased with increasing elevation (Table 2). Soil
moisture content was significantly affected by
precipitation treatments (P < 0.001): mean soil
moisture content was 9.4% in the control meso-
coms, 11.4% in the increased precipitation treat-
ment, and 7.4% in the decreased precipitation
treatment. Combining the two years and all sites,
down-slope mesocosm transplants (warming) sig-
nificantly increased soil temperature relative to the
source sites by 3.4�C (P < 0.001). Downward
transplant increased soil temperature by different
amounts in different ecosystems (Table 2), yet the
magnitude of response to warming was not corre-
lated with the soil temperature increase. Thus, we
present responses to warming as simple treatment
comparisons, warmed versus control.
Climate Change Treatment Effectson Ecosystem C Cycling
GEP, ER, and daytime NEE responded significantly
to altered precipitation when all ecosystems and
both years were combined (Table 3). We did not
find a systematic variation of precipitation treat-
ments effects along the elevation gradient
(Table 3), contrary to our hypothesis that drier
ecosystems at low elevation would show larger
responses to precipitation. Combining both years
and all ecosystems (interannual variability is dis-
cussed later), increased precipitation stimulated
Table 2. Environmental Conditions During the Gas Exchange Measurements
Photosynthetically
active radiation1
(lmol m-2 s-1)
Air temperature1
(�C)
Relative
humidity1
(%)
Soil temperature1,*
(�C)
Soil
moisture2,*
(%)
Great Basin desert 1729 (86) 31.5 (1) 15.9 (4) 25.7 (0.2) 5.1 (0.2)
High desert grassland 1604 (86) 29.3 (2) 30.3 (8) 24.5 (0.1) 6.1 (0.3)
Pinyon-juniper woodland 1710 (27) 28.9 (2) 34.7 (9) 22.5 (0.3) 7.8 (0.3)
Ponderosa pine forest 1456 (123) 28.2 (2) 40.8 (8) 19.1 (0.1) 10.4 (0.8)
Mixed conifer forest 1485 (138) 24.1 (2) 41.2 (6) 15.5 (0.1) 12.0 (0.7)
Standard errors are in parentheses followed the means.1Recorded through LiCor 6400 during the gas exchange measurements and averaged over the growing seasons of 2008 and 2009.2Based on soil moisture probe data from growing seasons of 2008 and 2009.*P < 0.001 for one-way ANOVA of elevation effects on soil temperature and soil moisture.
Responses of Ecosystem Carbon Cycling to Climate Change Treatments
GEP on average by 18% (0.26 lmol CO2 m-2 s-1),
ER by 17% (0.15 lmol CO2 m-2 s-1), and daytime
NEE by 19% (0.11 lmol CO2 m-2 s-1), whereas
decreased precipitation had no significant effects on
ecosystem C cycling. In contrast to precipitation, the
effect of temperature on ecosystem C cycling varied
among ecosystems (Table 3). Warming significantly
stimulated GEP and ER to the same degree in the
high desert grassland and grassy interspaces in pin-
yon-juniper woodlands, with no significant change
in daytime NEE when both years were combined
(interannual variability is discussed later). In pon-
derosa pine forest meadows, warming signifi-
cantly stimulated GEP more than ER, such that
daytime NEE increased by 0.20 lmol CO2 m-2 s-1.
In contrast, meadows of mixed conifer forests
responded to warming with significantly reduced
GEP and increased ER, with daytime NEE decreasing
by 0.15 lmol CO2 m-2 s-1. No significant interac-
tions between temperature and precipitation treat-
ments were observed (Table 3).
Interannual Variability of Responses ofEcosystems C Cycling to Climate ChangeTreatments
Responses of ecosystems to climate change treat-
ments differed in 2008 and 2009 (Table 3). The four
ecosystems differed in responses to warming, and
these responses differed between the two years
(Table 3). For example, warming had contrasting
effects on GEP and ER of grassy interspaces of pin-
yon-juniper woodlands between 2008 and 2009
(Figure 2). The effects of warming on GEP and ER
differed both in direction and in magnitude
among ecosystems. In 2008, warming significantly
increased both GEP and ER in high desert grassland
and ponderosa pine forest meadows, reduced GEP
and ER in grassy interspaces of pinyon-juniper
woodland, and had no effect on meadows in mixed
conifer forests. In 2009, warming increased GEP and
ER in grassy interspaces of pinyon-juniper woodland
and had no effects in the other three ecosystems
(Figure 2). As a result, warming had no significant
effect on daytime NEE in 2008, except for ponderosa
pine forest meadows, and had no effects on daytime
NEE in 2009, except in the high desert grassland
(Figure 2). Overall, effects of warming on respira-
tion and photosynthesis were similar in magnitude,
with little effect on net C exchange.
Contrary to warming, effects of precipitation
treatments were small and consistent between years
(Figure 3). In 2008, only increased precipitation
influenced ecosystem C cycling resulting in greater
GEP and NEE in the high desert grassland and greater
NEE in meadows in ponderosa pine forests (Fig-
ure 3A). Similarly in 2009, increased precipitation
stimulated ER and GEP in the high desert grassland
(Figure 3B), but precipitation treatments had no
other significant effects on ecosystem C cycling.
Probing Mechanisms Using StructuralEquation Modeling
General Mechanism of Responses of Ecosystem C Cycling
to Climate Change Treatments
We developed a multi-group model for both years
including all the mesocosms from four ecosystems
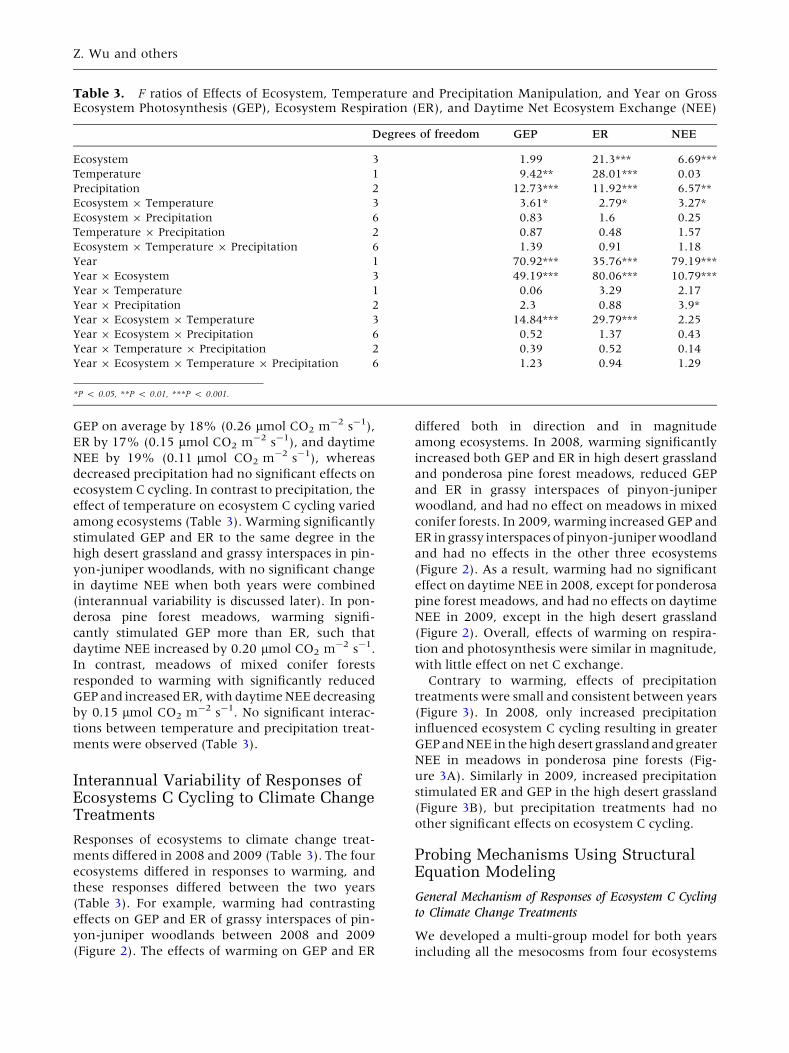
Table 3. F ratios of Effects of Ecosystem, Temperature and Precipitation Manipulation, and Year on GrossEcosystem Photosynthesis (GEP), Ecosystem Respiration (ER), and Daytime Net Ecosystem Exchange (NEE)
Degrees of freedom GEP ER NEE
Ecosystem 3 1.99 21.3*** 6.69***
Temperature 1 9.42** 28.01*** 0.03
Precipitation 2 12.73*** 11.92*** 6.57**
Ecosystem 9 Temperature 3 3.61* 2.79* 3.27*
Ecosystem 9 Precipitation 6 0.83 1.6 0.25
Temperature 9 Precipitation 2 0.87 0.48 1.57
Ecosystem 9 Temperature 9 Precipitation 6 1.39 0.91 1.18
Year 1 70.92*** 35.76*** 79.19***
Year 9 Ecosystem 3 49.19*** 80.06*** 10.79***
Year 9 Temperature 1 0.06 3.29 2.17
Year 9 Precipitation 2 2.3 0.88 3.9*
Year 9 Ecosystem 9 Temperature 3 14.84*** 29.79*** 2.25
Year 9 Ecosystem 9 Precipitation 6 0.52 1.37 0.43
Year 9 Temperature 9 Precipitation 2 0.39 0.52 0.14
Year 9 Ecosystem 9 Temperature 9 Precipitation 6 1.23 0.94 1.29
*P < 0.05, **P < 0.01, ***P < 0.001.
Z. Wu and others
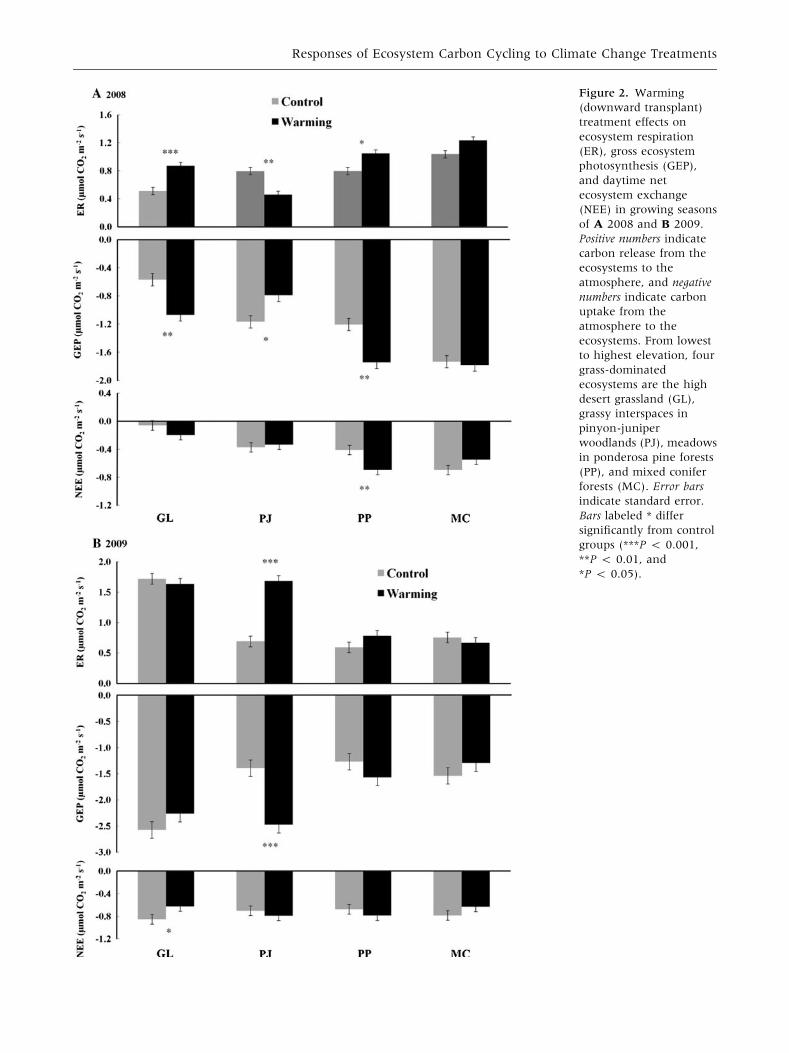
Figure 2. Warming
(downward transplant)
treatment effects on
ecosystem respiration
(ER), gross ecosystem
photosynthesis (GEP),
and daytime net
ecosystem exchange
(NEE) in growing seasons
of A 2008 and B 2009.
Positive numbers indicate
carbon release from the
ecosystems to the
atmosphere, and negative
numbers indicate carbon
uptake from the
atmosphere to the
ecosystems. From lowest
to highest elevation, four
grass-dominated
ecosystems are the high
desert grassland (GL),
grassy interspaces in
pinyon-juniper
woodlands (PJ), meadows
in ponderosa pine forests
(PP), and mixed conifer
forests (MC). Error bars
indicate standard error.
Bars labeled * differ
significantly from control
groups (***P < 0.001,
**P < 0.01, and
*P < 0.05).
Responses of Ecosystem Carbon Cycling to Climate Change Treatments
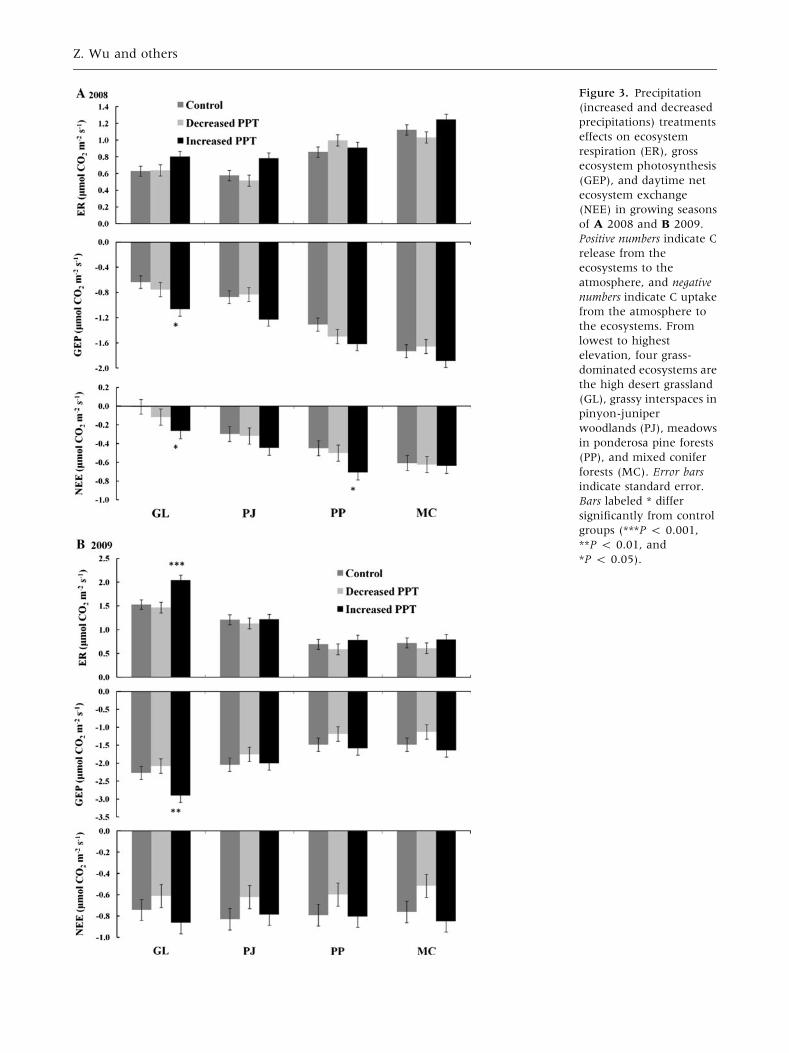
Figure 3. Precipitation
(increased and decreased
precipitations) treatments
effects on ecosystem
respiration (ER), gross
ecosystem photosynthesis
(GEP), and daytime net
ecosystem exchange
(NEE) in growing seasons
of A 2008 and B 2009.
Positive numbers indicate C
release from the
ecosystems to the
atmosphere, and negative
numbers indicate C uptake
from the atmosphere to
the ecosystems. From
lowest to highest
elevation, four grass-
dominated ecosystems are
the high desert grassland
(GL), grassy interspaces in
pinyon-juniper
woodlands (PJ), meadows
in ponderosa pine forests
(PP), and mixed conifer
forests (MC). Error bars
indicate standard error.
Bars labeled * differ
significantly from control
groups (***P < 0.001,
**P < 0.01, and
*P < 0.05).
Z. Wu and others
to probe the general mechanisms of ecosystem-level
responses to climate change treatments (Figure 4).
The model adequately fit the data (v2 = 37.9,
P = 0.08; RMSEA = 0.04, P = 0.81; n = 160).
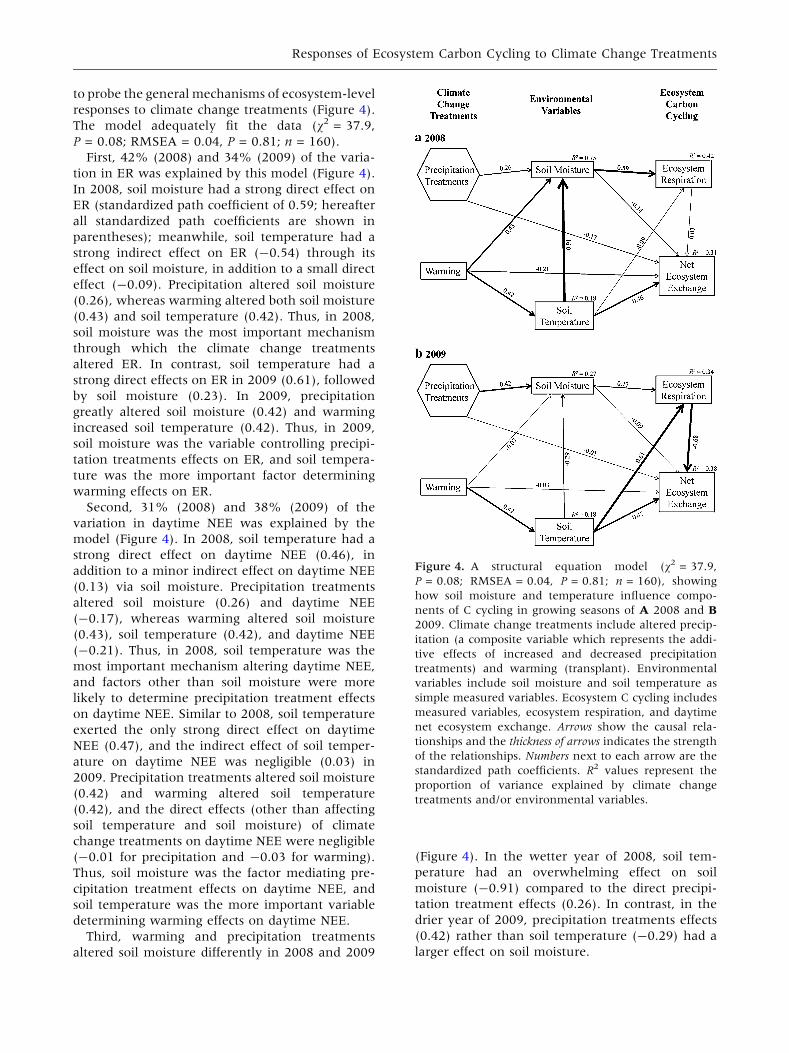
First, 42% (2008) and 34% (2009) of the varia-
tion in ER was explained by this model (Figure 4).
In 2008, soil moisture had a strong direct effect on
ER (standardized path coefficient of 0.59; hereafter
all standardized path coefficients are shown in
parentheses); meanwhile, soil temperature had a
strong indirect effect on ER (-0.54) through its
effect on soil moisture, in addition to a small direct
effect (-0.09). Precipitation altered soil moisture
(0.26), whereas warming altered both soil moisture
(0.43) and soil temperature (0.42). Thus, in 2008,
soil moisture was the most important mechanism
through which the climate change treatments
altered ER. In contrast, soil temperature had a
strong direct effects on ER in 2009 (0.61), followed
by soil moisture (0.23). In 2009, precipitation
greatly altered soil moisture (0.42) and warming
increased soil temperature (0.42). Thus, in 2009,
soil moisture was the variable controlling precipi-
tation treatments effects on ER, and soil tempera-
ture was the more important factor determining
warming effects on ER.
Second, 31% (2008) and 38% (2009) of the
variation in daytime NEE was explained by the
model (Figure 4). In 2008, soil temperature had a
strong direct effect on daytime NEE (0.46), in
addition to a minor indirect effect on daytime NEE
(0.13) via soil moisture. Precipitation treatments
altered soil moisture (0.26) and daytime NEE
(-0.17), whereas warming altered soil moisture
(0.43), soil temperature (0.42), and daytime NEE
(-0.21). Thus, in 2008, soil temperature was the
most important mechanism altering daytime NEE,
and factors other than soil moisture were more
likely to determine precipitation treatment effects
on daytime NEE. Similar to 2008, soil temperature
exerted the only strong direct effect on daytime
NEE (0.47), and the indirect effect of soil temper-
ature on daytime NEE was negligible (0.03) in
2009. Precipitation treatments altered soil moisture
(0.42) and warming altered soil temperature
(0.42), and the direct effects (other than affecting
soil temperature and soil moisture) of climate
change treatments on daytime NEE were negligible
(-0.01 for precipitation and -0.03 for warming).
Thus, soil moisture was the factor mediating pre-
cipitation treatment effects on daytime NEE, and
soil temperature was the more important variable
determining warming effects on daytime NEE.
Third, warming and precipitation treatments
altered soil moisture differently in 2008 and 2009
(Figure 4). In the wetter year of 2008, soil tem-
perature had an overwhelming effect on soil
moisture (-0.91) compared to the direct precipi-
tation treatment effects (0.26). In contrast, in the
drier year of 2009, precipitation treatments effects
(0.42) rather than soil temperature (-0.29) had a
larger effect on soil moisture.
Figure 4. A structural equation model (v2 = 37.9,
P = 0.08; RMSEA = 0.04, P = 0.81; n = 160), showing
how soil moisture and temperature influence compo-
nents of C cycling in growing seasons of A 2008 and B
2009. Climate change treatments include altered precip-
itation (a composite variable which represents the addi-
tive effects of increased and decreased precipitation
treatments) and warming (transplant). Environmental
variables include soil moisture and soil temperature as
simple measured variables. Ecosystem C cycling includes
measured variables, ecosystem respiration, and daytime
net ecosystem exchange. Arrows show the causal rela-
tionships and the thickness of arrows indicates the strength
of the relationships. Numbers next to each arrow are the
standardized path coefficients. R2 values represent the
proportion of variance explained by climate change
treatments and/or environmental variables.
Responses of Ecosystem Carbon Cycling to Climate Change Treatments
Fourth, the contribution of GEP and ER to day-
time NEE varied between the two years (Figure 4).
In the wetter year of 2008, daytime NEE was pri-
marily controlled by photosynthesis, indicated by
the weak correlation between ER and NEE (-0.03).
In contrast, in the drier year of 2009, ER largely
determined daytime NEE (-0.68).
Fifth, warming affected ecosystem C cycling
more than altered precipitation. In the wet year of
2008, warming had stronger direct and indirect
effects on soil moisture than altered precipitation;
warming had a strong direct effect on soil temper-
ature, and both soil temperature and soil moisture
affected ecosystem C cycling. In the dry year of
2009, warming had a strong effect on soil temper-
ature, and soil temperature rather than soil mois-
ture determined the ecosystem C cycling processes.
Responses of Individual Ecosystem to Climate Change
Treatments
The structural equation modeling results showed
that warming had the strongest effect on responses
of ecosystem C cycling to simulated climate change
through direct and indirect effects on soil moisture
and temperature (Figure 4). Warming significantly
increased soil temperature in all ecosystems during
both growing seasons (Figure A3). However,
warming had variable effects on soil moisture (Fig-
ure A4), due to the opposite direct and indirect
effects of warming on soil moisture based on our
structural equation model (Figure 4). In the wetter
year of 2008, warming increased soil moisture in the
high desert grassland (Figure A4a), leading to a po-
sitive effect on ER and GEP (Figure 2A). Warming
reduced soil moisture in grassy interspaces in pin-
yon-juniper woodlands and decreased ER and GEP
(Figure 2A). Warming had no effect on soil moisture
in meadows in ponderosa pine forests (Figure A4a)
and warming-induced increase in soil temperature
led to the positive effects on ER and GEP (Fig-
ure 2A). Warming increased soil moisture in
meadows in mixed conifer forests and tended to
increase ER and GEP (Figure 2A). In the drier year of
2009, warming did not have a significant effect on
soil moisture in the high desert grassland and
meadows in ponderosa pine forests (Figure A4b)
and warming had no significant effect on ER or GEP
(Figure 2B). Warming had no significant effect on
soil moisture in grassy interspaces in pinyon-juniper
woodlands, but warming-induced increase in
soil temperature led to an increase in ER and GEP
(Figure 2B). Warming reduced soil moisture in
meadows in mixed conifer forests (Figure A4b),
compensated by positive effects of warming-induced
increase in soil temperature, resulting in no signifi-
cant effect on ecosystem C cycling (Figure 2B).
In summary, in the wetter year of 2008, indirect
effects of warming on soil moisture determined the
responses of CO2 fluxes in the high desert grassland
and grassy interspaces in pinyon-juniper wood-
lands, especially the substantial reduction in soil
moisture in pinyon-juniper woodlands; the direct
effect of warming on soil temperature dominated
the responses of CO2 fluxes in meadows in pon-
derosa pine forests to warming. In the drier year of
2009, indirect effect of warming on soil moisture
determined the responses of CO2 fluxes in high
desert grassland and meadows in ponderosa pine
forests, whereas direct warming-induced increase
in soil temperature dominated the responses of CO2
fluxes in grassy interspaces in pinyon-juniper
woodlands and meadows in mixed conifer forests
to warming.
DISCUSSION
Warming Treatment Effects
Warming had variable effects on ER. Warming-in-
duced increases in ER could stem from increases in
C input from plant production (Luo and others
2009) and decomposition of soil organic matter
(Hobbie 1996; Grogan and Chapin 2000; Melillo
and others 2002; Neff and Hooper 2002), eventu-
ally leading to a net ecosystem C loss. However,
such effects could be tempered by reduced leaf
nutrient concentration and therefore lower litter
quality (Jonsdottir and others 2005), depletion of
the soil labile C pool or reduced root and microbial
activities due to warming-induced soil drying
(Saleska and others 2003; Allison and Treseder
2008). Warming could also increase net nitrogen
(N) mineralization and enhance vegetation growth,
compensating for C losses from soils (Rustad and
others 2001; Melillo and others 2002; Hartley and
others 1999). We also observed that warming had
variable impacts on GEP. In contrast to our results,
warming reduced photosynthesis due to water
stress in a grassland ecosystem in northern Bel-
gium, whereas respiration remained unchanged,
leading to a decline in net C uptake (De Boeck and
others 2007).
Contrary to our hypothesis that cooler ecosys-
tems at high elevation would show larger responses
to warming than warmer ecosystems at low ele-
vation, we did not find a systematic variation of
response to warming treatments along the eleva-
tion gradient, indicating that the magnitude of
ecosystem response to warming is not a simple
Z. Wu and others
function of annual temperature. With the excep-
tion of the grassy interspaces in pinyon-juniper
woodlands, warming had positive or no effects on
GEP and ER. In the grassy interspaces in pinyon-
juniper woodlands, warming had a negative effect
on GEP and ER in 2008. The large warming-in-
duced increase in soil temperature here (5.5�C) was
likely responsible for the reduction in soil moisture
from 11.1% in the control to 4.7% in the warmed
mesocosms. According to our structural equation
model, this moisture reduction underlies the neg-
ative effects of warming on GEP and ER in 2008.
A recent meta-analysis showed that across a
broad range of terrestrial ecosystems, warming
generally increased both GEP and ER, and had no
effects on NEE (Wu and others 2010). There have
been a number of studies using grassland model
ecosystems to study these responses. Some showed
grasslands as C sinks (Dugas and others 1999;
Lawton and others 2006; Risch and Frank 2006;
Soussana and others 2007; Mirzaei and others
2008; Chen and others 2009), C sources (Novick
and others 2004; Bellamy and others 2005; Silver
and others 2005; Schipper and others 2007), or
near neutral (Frank and Dugas 2001; Suyker and
others 2003), and such sink-source dynamics could
be altered due to climate change (Scott and others
2010). Oberbauer and others (2007) showed that
warming increased net C uptake in wet ecosystems,
but increased C losses in dry ecosystems associated
with higher ER. However, we only observed an
increase in ER with warming in the dry ecosystem
(high desert grassland) in the wet year (2008). Our
results are similar to Bontti and others (2009), who
found that increasing temperature only enhanced
decomposition if precipitation is not limiting.
We did not observe a clear trend of responses of
ecosystems to warming along the elevation gradi-
ent. However, we detected a critical role of soil
temperature on daytime NEE. Given these dispa-
rate results, we may still be far from a generalized
understanding of the responses of C exchange to
increasing temperature for different ecosystems.
We also observed interannual variability of
responses of ecosystems to warming. Based on our
structural equation model results, soil temperature
was found to be the most important factor con-
trolling such differences between years. In the
wetter year of 2008, soil temperature affected
daytime NEE and indirectly affected ER via its
influence on soil moisture. In the drier year of
2009, soil temperature directly affected ER and
daytime NEE without altering soil moisture.
Because the warming-induced increase in soil
temperature has contrasting indirect (negative
through soil moisture) and direct effects (positive)
on ecosystem C cycling, the relative strengths of
the two effects determined responses of different
ecosystems to warming between years. Based on
the structural equation model, warming had an
overall strong influence on ecosystem C cycling
when all four ecosystems were pooled together, yet
responses of ecosystem C cycling to warming varied
among ecosystems and between years. In addition,
the CO2 fluxes were integrated over a longer period
in 2008 because that year was wetter and had a
longer growing season than 2009. Growing season
duration is sensitive to climate change variables
(Menzel and Fabian 1999), and our use of a time-
weighted calculation for CO2 fluxes was designed
to account for this.
Furthermore, individual species are also very
sensitive to interannual variability (Zavaleta and
others 2003) and warming (Hobbie 1996), and
species-specific responses were observed to changes
in limiting resources (that is, moisture) as a direct
effect of warming (De Valpine and Harte 2001),
interacting with interannual temperature and pre-
cipitation variability to determine the direction and
magnitudes of ecosystem-level responses. Microbial
community and plant species composition shifts,
and changes in soil labile C could also contribute to
the responses of ecosystem C cycling to simulated
climate change (Shaver and others 2000). Thus, it
is important to conduct long-term ecosystem-level
experiments to take into account composition shifts
of species and possible feedbacks to ecosystem C
cycling.
Precipitation Treatments Effects
The effects of increased precipitation on ecosystem
C cycling are mostly non-significant except for the
high desert grassland, indicating grassland ecosys-
tems in the dry environment are most responsive to
increased precipitation. We did not find any sig-
nificant effects of decreased precipitation on eco-
system C cycling in both years, similar to the
general responses across various ecosystems from a
meta-analysis (Wu and others 2010). Contrary to
our results, Mirzaei and others (2008) showed a
reduction in CO2 efflux due to drought in a grass-
land ecosystem, possibly because of lower enzyme
activities from drought-induced soil moisture stress
(Sardans and others 2008). We also observed
stimulating effects of increased precipitation on
ecosystem C uptake in the high desert grassland
and meadows in ponderosa pine forests in 2008. In
a semiarid steppe, increased precipitation stimu-
lated photosynthesis more than respiration, leading
Responses of Ecosystem Carbon Cycling to Climate Change Treatments
to net C gains (Liu and others 2009). A higher sen-
sitivity of photosynthesis to soil moisture compared
to that of respiration has been observed in other
studies as well (Potts and others 2006; Chen and
others 2009). In our systems, daytime NEE was
predominantly determined by GEP in the wet year of
2008, whereas ER had a larger influence on daytime
NEE in the dry year of 2009, indicating photosyn-
thesis is more moisture-sensitive than respiration.
Based on the structural equation modeling of
precipitation effects, soil moisture influenced
responses of ecosystem C cycling to precipitation
manipulation, similar to findings in a semiarid
steppe (Chen and others 2008). Unlike the effects of
warming-induced increase in soil temperature on
ecosystem C cycling, precipitation directly altered
soil moisture, and soil moisture directly affected
ecosystem C cycling. Consistent with our hypothe-
sis, the driest ecosystem at the lowest elevation was
the most responsive to a simulated increase of pre-
cipitation, with ER and GEP increasing in both
years, indicating that high desert grassland ecosys-
tems in this region could be the most sensitive to
future precipitation change. We observed little
interannual variability of responses of ecosystems to
precipitation treatments, mostly due to the overall
non-significant effects of precipitation. In contrast,
interannual variability of precipitation strongly
affected C cycling in other grassland ecosystems
(Chou and others 2008; Niu and others 2008b), and
responses of ecosystems to precipitation treatments
may therefore show large interannual variability.
The frequency and magnitude of extreme
weather events, especially extreme precipitation
events, is likely to increase with climate change
(Easterling and others 2000; IPCC 2007). In addi-
tion to the total precipitation quantity manipulated
in our experiment, precipitation timing, seasonality
(winter snow vs. summer rainfall), length, and
frequency have been shown to alter responses of
ecosystem C cycling (Knapp and others 2008; Chen
and others 2009; Chimner and others 2010). For
example, a longer and later wet season led to sig-
nificant C losses from annual grasslands (Chou and
others 2008). Additionally, soil respiration de-
creased more because of altered rainfall timing than
reduced rainfall quantity (Harper and others 2005).
Photosynthesis and respiration may also have dif-
ferent sensitivities to precipitation changes. For
instance, heterotrophic respiration is more sensi-
tive to variability in wet season length than pho-
tosynthesis in a Mediterranean annual grassland in
California (Xu and Baldocchi 2004). Thus, precip-
itation timing, seasonality, length, and frequency
could disproportionally affect photosynthesis and
respiration, and the fate of net C exchange under
future extreme precipitation events is uncertain.
CONCLUSIONS
After 8 years of temperature and precipitation
manipulation in grassland model ecosystems along
an elevation gradient, warming stimulated or had
no effects on GEP and ER except for grassy inter-
spaces in pinyon-juniper woodlands, with small
and inconsistent effects on net C exchange.
Increased precipitation had no effects on GEP and
ER except for the high desert grassland, indicating
that grassland ecosystems in the dry environment
could be the most sensitive to future precipitation
change. Decreased precipitation had no effects on
ecosystem C cycling in all ecosystems during both
growing seasons. We found no interactive effects
between warming and altered precipitation, sug-
gesting single-factor manipulation experiments are
important in understanding responses of ecosys-
tems to climate change. Our structural equation
model results suggest that precipitation treatments
affected ecosystem C cycling mostly via soil mois-
ture, whereas warming affected the same processes
via both soil temperature and soil moisture. In the
wetter year of 2008, warming had a stronger effect
on soil moisture than altered precipitation; whereas
in the drier year of 2009, warming directly affected
soil temperature, which determined the ecosystem
C cycling processes. Our findings suggest that,
overall, warming rather than altered precipitation
had the strongest effect on ecosystem C cycling, by
directly affecting soil temperature and indirectly
influencing soil moisture.
ACKNOWLEDGEMENTS
Thanks to Dylan Ross, Nicolas Umstattd, and Neil
Cobb for their assistance in the field. Thanks to
Tom Kolb for providing the soil moisture probe. We
thank Seth Munson and Jim Grace for comments
on earlier versions of the manuscript. This work
was supported by the National Science Foundation
(DEB-0092642 and DEB-0949460), and Science
Foundation Arizona (GRF 0001-07). The use of
trade, product, or firm names is for descriptive
purposes only and does not constitute endorsement
by the U.S. Government.
REFERENCES
Adair K, Schwartz E. 2008. Evidence that ammonia-oxidizing
archaea are more abundant than ammonia-oxidizing bacteria
in semiarid soils of Northern Arizona, USA. Microb Ecol
56:420–6.
Z. Wu and others
Allison SD, Treseder KK. 2008. Warming and drying suppress
microbial activity and carbon cycling in boreal forest soils.
Glob Change Biol 14:2898–909.
Antoninka A, Wolf JE, Bowker M, Classen AT, Johnson NC.
2009. Linking above- and belowground responses to global
change at community and ecosystem scales. Glob Change Biol
15:914–29.
Atkin OK, Millar AH, Gardestrom P, Day DA. 2000. Photosyn-
thesis, carbohydrate metabolism, and respiration in leaves of
higher plants. In: Legood RC, Sharkey TD, von Cammerer S,
Eds. Photosynthesis: physiology and metabolism. Dordrecht:
Kluwer Academic Publishers. p 153–75.
Bellamy PH, Loveland PJ, Bradley RI, Lark RM, Kirk GJD. 2005.
Carbon losses from all soils across England and Wales 1978–
2003. Nature 437:245–8.
Blankinship JC, Brown JR, Dijkstra P, Allwright MC, Hungate
BA. 2010. Responses of terrestrial CH4 uptake to interactive
changes in precipitation and temperature along a climatic
gradient. Ecosystem 13:1157–70.
Bontti EE, Decant JP, Munson SM, Gathany MA, Prezeszlowska
A, Haddix ML, Owens S, Burke IC, Parton WJ, Harmon ME.
2009. Litter decomposition in grasslands of Central North
America (US Great Plains). Glob Change Biol 15:1356–63.
Browne MW, Cudeck R. 1993. Alternative ways of assessing
model fit. In: Bollen KA, Long JS, Eds. Testing structural
equation models. Newbury Park, CA: Sage Publications. p
136–62.
Chaudhary VB, Bowker MA, O’Dell TE, Grace JB, Redman AE,
Rillig MC, Johnson NC. 2009. Untangling the biological con-
tributions to soil stability in semiarid shrublands. Ecol Appl
19:110–22.
Chen S, Lin G, Huang J, He M. 2008. Responses of soil respi-
ration to simulated precipitation pulses in semiarid steppe
under different grazing regimes. J Plant Ecol 1:237–46.
Chen S, Lin G, Huang J, Jenerette GD. 2009. Dependence of
carbon sequestration on the differential responses of ecosys-
tem photosynthesis and respiration to rain pulses in a semiarid
steppe. Glob Change Biol 15:2450–61.
Chimner RA, Welker JM, Morgan J, LeCain D, Reeder J. 2010.
Experimental manipulations of winter snow and summer rain
influence ecosystem carbon cycling in a mixed-grass prairie,
Wyoming, USA. Ecohydrology 3:284–93.
Chou WW, Silver WL, Jackson RD, Thompson AW, Allen-Diaz
B. 2008. The sensitivity of annual grassland carbon cycling to
the quantity and timing of rainfall. Glob Change Biol
14:1382–94.
Christensen JH, Hewitson B, Busuioc A, Chen A, Gao X, Held I,
Jones R, Kolli RK, Kwon WT, Laprise R, Magana Rueda V,
Mearns L, Menendez CG, Raisanen J, Rinke A, Sarr A,
Whetton P. 2007. Regional climate projections. In: Solomon S,
Qin D, Manning M, Chen Z, Marquis M, Averyt KB, Tignor M,
Miller HL, Eds. Climate change 2007: the physical science
basis. Contribution of Working Group I to the Fourth
Assessment Report of the Intergovernmental Panel on Climate
Change. Cambridge, UK/New York, NY: Cambridge University
Press.
Churkina G, Running SW, Schloss AL, Intercomparison
TPOFTPNM. 1999. Comparing global models of terrestrial net
primary productivity (NPP): the importance of water avail-
ability. Glob Change Biol 5:46–55.
Cox PM, Betts RA, Jones CD, Spall SA, Totterdell IJ. 2000.
Acceleration of global warming due to carbon-cycle feedbacks
in a coupled climate model. Nature 408:184–7.
De Boeck HJ, Lemmens CM, Catherine MHM, Vicca S, Van den
Berge J, Van Dongen S, Janssens IA, Ceulemans R, Nijs I. 2007.
How do climate warming and species richness affect CO2 fluxes
in experimental grasslands? New Phytol 175:512–22.
De Valpine P, Harte J. 2001. Plant responses to experimental
warming in a montane meadow. Ecology 82:637–48.
Deng X, Joly RJ, Hahn T. 1990. The influence of water deficit on
photosynthesis and translocation of 14C-labeled assimilates in
cacao seedlings. Physiol Plant 78:623–7.
Dijkstra P, Ishizu A, Doucett R, Hart SC, Schwartz E, Menyailo
OV, Hungate BA. 2006. 13C and 15N natural abundance of the
soil microbial biomass. Soil Biol Biochem 38:3257–66.
Dijkstra P, LaViolette CM, Coyle JS, Doucett RR, Schwartz E,
Hart SC, Hungate BA. 2008. 15N enrichment as an integrator
of the effects of C and N on microbial metabolism and eco-
system function. Ecol Lett 11:389–97.
Dugas WA, Heuer ML, Mayeux HS. 1999. Carbon dioxide fluxes
over bermudagrass, native prairie, and sorghum. Agric For
Meteorol 93:121–39.
Dukes JS, Chiariello NR, Cleland EE, Moore LA, Shaw MR,
Thayer S, Tobeck T, Mooney HA, Field CB. 2005. Responses of
grassland production to single and multiple global environ-
mental changes. PLoS Biol 3:1829–37.
Easterling DR, Meehl GA, Parmesan C, Changnon SA, Karl TR,
Mearns LO. 2000. Climate extremes: observations, modeling,
and impacts. Science 289:2068–74.
Emmett BA, Beier C, Estiarte M, Tietema A, Kristensen HL,
Williams D, Penuelas J, Schmidt I, Sowerby A. 2004. The
response of soil processes to climate change: results from
manipulation studies of shrublands across an environmental
gradient. Ecosystems 7:625–37.
Frank AB, Dugas WA. 2001. Carbon dioxide fluxes over a
northern, semiarid, mixed-grass prairie. Agric For Meteorol
108:317–26.
Garbulsky MF, Penuelas J, Papale D, Ardo J, Goulden ML, Kiely
G, Richardson AD, Rotenberg E, Veenendaal EM, Filella I.
2010. Patterns and controls of the variability of radiation use
efficiency and primary productivity across terrestrial ecosys-
tems. Glob Ecol Biogeogr 19:253–67.
GorissenA,TietemaA, JoostenNN, EstiarteM,Penuelas J,Sowerby
A, Emmett BA, Beier C. 2004. Climate change affects carbon
allocation to the soil in shrublands. Ecosystems 7:650–61.
Grace JB. 2006. Structural equation modeling and natural sys-
tems. Cambridge: Cambridge University Press.
Grace JB, Anderson TM, Smith MD, Seabloom E, Andelman SJ,
Meche G, Weiher E, Allain LK, Julita H, Sankaran M, Knops J,
Ritchie M, Willig MR. 2007. Does species diversity limit pro-
ductivity in natural grassland communities? Ecol Lett 10:680–
9.
Grime JP, Fridley JD, Askew AP, Thompson K, Hodgson JG,
Bennett CR. 2008. Long-term resistance to simulated climate
change in an infertile grassland. Proc Natl Acad Sci USA
105:10028–32.
Grogan P, Chapin FSIII. 2000. Initial effects of experimental
warming on above- and belowground components of net eco-
system CO2 exchange in arctic tundra. Oecologia 125:512–20.
Harper CW, Blair JM, Fay PA, Knapp AK, Carlisle JD. 2005.
Increased rainfall variability and reduced rainfall amount
decreases soil CO2 flux in a grassland ecosystem. Glob Change
Biol 11:322–34.
Hartley AE, Neill C, Melillo JM, Crabtree R, Bowles FP. 1999.
Plant performance and soil nitrogen mineralization in
Responses of Ecosystem Carbon Cycling to Climate Change Treatments
response to simulated climate change in subarctic dwarf shrub
heath. Oikos 86:331–43.
Hobbie SE. 1996. Temperature plant species control over litter
decomposition in Alaskan tundra. Ecol Monogr 66:503–22.
Huxman T, Snyder K, Tissue D, Leffler AJ, Ogle K, Pockman WT,
Sandquist DR, Potts DL, Schwinning S. 2004. Precipitation
pulses and carbon fluxes in semiarid and arid ecosystems.
Oecologia 141:254–68.
Intergovernmental Panel on Climate Change (IPCC). 2007. Cli-
mate change 2007: the physical science basis-summary for
policy makers. Contribution of Working Group I to the Fourth
Assessment Report of the Intergovernmental Panel on Climate
Change. IPCC WGI 4th Assessment Report.
Jonsdottir IS, Khitun O, Stenstrom A. 2005. Biomass and
nutrient responses of a clonal tundra sedge to climate warm-
ing. Can J Bot 83:1608–21.
Kirschbaum MUF. 1995. The temperature dependence of soil
organic matter decomposition, and the effect of global
warming on soil organic C storage. Soil Biol Biochem 27:753–
60.
Knapp AK, Smith MD. 2001. Variation among biomes in tem-
poral dynamics of aboveground primary production. Science
291:481–4.
Knapp AK, Beier C, Briske DD, Classen AT, Luo Y, Reichstein M,
Smith MD, Smith SD, Bell JE, Fay PA, Heisler JL, Leavitt SW,
Sherry R, Smith B, Weng E. 2008. Consequences of more
extreme precipitation regimes for terrestrial ecosystems. Bio-
science 58:811–21.
Laughlin DC, Hart SC, Kaye JP, Moore MM. 2010. Evidence for
indirect effects of plant diversity and composition on net
nitrification. Plant Soil 330:435–45.
Lawton D, Leahy P, Kiely G, Byrne KA, Calanca P. 2006.
Modeling of net ecosystem exchange and its components for a
humid grassland ecosystem. J Geophys Res 111:G04013.
doi:10.1029/2006JG000160.
Lellei-Kovacs E, Kovacs-Lang E, Kalapos T, Botta-Dukat Z,
Barabas S, Beier C. 2008. Experimental warming does not
enhance soil respiration in a semiarid temperate forest-steppe
ecosystem. Community Ecol 9:29–37.
Lieth H. 1973. Primary production: terrestrial ecosystems. Hum
Ecol 1:303–32.
Lilley J, Bolger T, Gifford R. 2001. Productivity of Trifolium
subterraneum and Phalaris aquatica under warmer, high CO2
conditions. New Phytol 150:371–83.
Liu W, Zhang Z, Wan S. 2009. Predominant role of water in
regulating soil and microbial respiration and their responses to
climate change in a semiarid grassland. Glob Change Biol
15:184–95.
Luo YQ, Gerten D, Le Maire G, Parton WJ, Weng ES, Zhou XH,
Keogh C, Beier C, Ciais P, Cramer W, Dukes JS, Emmett B,
Hanson PJ, Knapp A, Linder S, Nepstad D, Rustad L. 2008.
Modeled interactive effects of precipitation, temperature, and
[CO2] on ecosystem carbon and water dynamics in different
climatic zones. Glob Change Biol 14:1986–99.
Luo Y, Sherry R, Zhou X, Wan S. 2009. Terrestrial carbon-cycle
feedback to climate warming: experimental evidence on plant
regulation and impacts of biofuel feedstock harvest. GCB
Bioenergy 1:62–74.
McHale PJ, Mitchell MJ, Bowles FP. 1998. Soil warming in a
northern hardwood forest: trace gas fluxes and leaf litter
decomposition. Can J For Res 28:1365–72.
Melillo JM, Steudler PA, Aber JD, Newkirk K, Lux H, Bowles FP,
Catricala C, Magill A, Ahrens T, Morrisseau S. 2002. Soil
warming and carbon-cycle feedbacks to the climate system.
Science 298:2173–6.
Menzel A, Fabian P. 1999. Growing season extended in Europe.
Nature 397:659.
Mertens S, Nijs I, Heuer M, Kockelbergh F, Beyens L, Ker-
ckvoorde Av, Impens I. 2001. Influence of high temperature
on end-of-season tundra CO2 exchange. Ecosystems 4:226–
36.
Mirzaei H, Kreyling J, Hussain MZ, Li Y, Tenhunen J, Bei-
erkuhnlein C, Jentsch A. 2008. A single drought event of 100-
year recurrence enhances subsequent carbon uptake and
changes carbon allocation in experimental grassland com-
munities. J Plant Nutr Soil Sci 171:681–9.
Neff JC, Hooper DU. 2002. Vegetation and climate controls on
potential CO2, DOC and DON production in northern latitude
soils. Glob Change Biol 8:872–84.
Niinisto SM, Silvola J, Kellomaki S. 2004. Soil CO2 efflux in a
boreal pine forest under atmospheric CO2 enrichment and air
warming. Glob Change Biol 10:1363–76.
Niu S, Wu M, Han Y, Xia J, Li L, Wan S. 2008a. Water-mediated
responses of ecosystem carbon fluxes to climatic change in a
temperate steppe. New Phytol 177:209–19.
Niu S, Li Z, Xia J, Han Y, Wu M, Wan S. 2008b. Climatic
warming changes plant photosynthesis and its temperature
dependence in a temperate steppe of northern China. Environ
Exp Bot 63:91–101.
Novick KA, Stoy PC, Katul GG, Ellsworth DS, Siqueira MBS,
Juang J, Oren R. 2004. Carbon dioxide and water vapor
exchange in a warm temperate grassland. Oecologia 138:259–
74.
Oberbauer SF, Tweedie CE, Welker JM, Fahnestock JT, Henry
GHR, Webber PJ, Hollister RD, Walker MD, Kuchy A, Elmore
E, Starr G. 2007. Tundra CO2 fluxes in response to experi-
mental warming across latitudinal and moisture gradients.
Ecol Monogr 77:221–38.
Potts DL, Huxman TE, Scott RL, Williams DG, Goodrich DC.
2006. The sensitivity of ecosystem carbon exchange to sea-
sonal precipitation and woody plant encroachment. Oecologia
150:453–63.
Pugesek B, Tomer A, Von Eye A. 2003. Structural equation
modeling: applications in ecological and evolutionary biology.
Cambridge: Cambridge University Press.
Risch AC, Frank DA. 2006. Carbon dioxide fluxes in a spatially
and temporally heterogeneous temperate grassland. Oecologia
147:291–302.
Risch AC, Frank DA. 2007. Effects of increased soil water
availability on grassland ecosystem carbon dioxide fluxes.
Biogeochemistry 86:91–103.
Rustad LE, Campbell JL, Marion GM, Norby RJ, Mitchell MJ,
Hartley AE, Cornelissen JH, Gurevitch J. 2001. A meta-anal-
ysis of the response of soil respiration, net nitrogen mineral-
ization, and aboveground plant growth to experimental
ecosystem warming. Oecologia 126:543–62.
Saleska SR, Miller SD, Matross DM, Goulden ML, Wofsy SC, da
Rocha HR, de Camargo PB, Crill P, Daube BC, de Freitas HC,
Hutyra L, Keller M, Kirchhoff V, Menton M, Munger JW, Pyle
EH, Rice AH, Silva H. 2003. Carbon in Amazon forests:
unexpected seasonal fluxes and disturbance-induced losses.
Science 302:1554–7.
Z. Wu and others
Sardans J, Penuuelas J, Estiarte M, Prieto P. 2008. Warming and
drought alter C and N concentration, allocation and accu-
mulation in a Mediterranean shrubland. Glob Change Biol
14:2304–16.
Schindlbacher A, Zechmeister-Boltenstern S, Jandl R. 2009.
Carbon losses due to soil warming: do autotrophic and het-
erotrophic soil respiration respond equally? Glob Change Biol
15:901–13.
Schipper LA, Baisden WT, Parfitt RL, Ross C, Claydon JJ, Arnold
G. 2007. Large losses of soil C and N from soil profiles under
pasture in New Zealand during the past 20 years. Glob Change
Biol 13:1138–44.
Schwartz E, Blazewicz S, Doucett R, Hungate BA, Hart SC,
Dijkstra P. 2007. Natural abundance d15N and d13C of DNA
extracted from soil. Soil Biol Biochem 39:3101–7.
Scott RL, Hamerlynck EP, Jenerette GD, Moran MS, Barron-
Gafford GA. 2010. Carbon dioxide exchange in a semidesert
grassland through drought-induced vegetation change. J Geo-
phys Res Biogeosci 115:G03026. doi:10.1029/2010JG001348.
Scurlock JMO, Johnson K, Olson RJ. 2002. Estimating net pri-
mary productivity from grassland biomass dynamics mea-
surements. Glob Change Biol 8:736–53.
Seager R, Vecchi GA. 2010. Greenhouse warming and the 21st
century hydroclimate of southwestern North America. Proc
Natl Acad Sci USA 107:21277–82.
Seager R, Ting MF, Held I, Kushnir Y, Lu J, Vecchi G, Huang HP,
Harnik N, Leetmaa A, Lau NC, Li CH, Velez J, Naik N. 2007.
Model projections of an imminent transition to a more arid
climate in southwestern North America. Science 316:1181–4.
Shaver G, Canadell J, Chapin FSIII, Gurevitch J, Harte J, Henry
G, Ineson P, Jonasson S, Melillo J, Pitelka L, Rustad L. 2000.
Global warming and terrestrial ecosystems: a conceptual
framework for analysis. Bioscience 50:871–82.
Sherry RA, Weng E, Arnone JAIII, Johnson DW, Schimel DS,
Verburg PS, Wallace LL, Luo Y. 2008. Lagged effects of
experimental warming and doubled precipitation on annual
and seasonal aboveground biomass production in a tallgrass
prairie. Glob Change Biol 14:2923–36.
Silver WL, Jackson RD, Allen-Diaz B. 2005. Soil carbon
dynamics of California grasslands under altered soil moisture
regimes. Kearney Foundation of Soil Science Final Report:
1–14.
Soussana JF, Allard V, Pilegaard K, Ambus P, Ammann C,
Campbell C, Ceschia E, Clifton-Brown J, Czobel S, Domingues
R, Flechard C, Fuhrer J, Hensen A, Horvath L, Jones M,
Kasper G, Martin C, Nagy Z, Neftel A, Raschi A, Baronti S,
Rees RM, Skiba U, Stefani P, Manca G, Sutton M, Tuba Z,
Valentini R. 2007. Full accounting of the greenhouse gas
(CO2, N2O, CH4) budget of nine European grassland sites.
Agric Ecosyst Environ 121:121–34.
Sullivan PF, Arens SJT, Chimner RA, Welker JM. 2008.
Temperature and microtopography interact to control carbon
cycling in a high arctic fen. Ecosystems 11:61–76.
Suyker AE, Verma SB, Burba GG. 2003. Interannual variability
in net CO2 exchange of a native tallgrass prairie. Glob Change
Biol 9:255–65.
Weiher E, Forbes S, Schauwecker T, Grace JB. 2004. Multivar-
iate control of plant species richness and biomass in blackland
prairie. Oikos 106:151–7.
Weltzin JF, Loik ME, Schwinning S, Williams D, Fay P, Haddad
B, Harte J, Huxman T, Knapp A, Lin G, Pockman W, Shaw R,
Small E, Smith M, Smith SD, Tissue D, Zak J. 2003. Assessing
the response of terrestrial ecosystems to potential changes in
precipitation. Bioscience 53:941–52.
Wu Z, Dijkstra P, Koch GW, Penuelas J, Hungate BA. 2010.
Responses of terrestrial ecosystems to temperature and precip-
itation change: a meta-analysis of experimental manipulation.
Glob Change Biol. doi:10.1111/j.1365-2486.2010.02302.x.
Xu L, Baldocchi DD. 2004. Seasonal variation in carbon dioxide
exchange over a Mediterranean annual grassland in Califor-
nia. Agric For Meteorol 123:79–96.
Zavaleta ES, Shaw MR, Chiariello NR, Thomas BD, Cleland EE,
Field CB, Mooney HA. 2003. Grassland responses to three
years of elevated temperature, CO2, precipitation, and N
deposition. Ecol Monogr 73:585–604.
Zhou X, Sherry RA, An Y, Wallace LL, Luo Y. 2006. Main and
interactive effects of warming, clipping, and doubled pre-
cipitation on soil CO2 efflux in a grassland ecosystem.
Glob Biogeochem Cycles 20:GB1003. doi:10.1029/2005GB
002526.
Responses of Ecosystem Carbon Cycling to Climate Change Treatments