Residential Air Conditioner with VFD Test Report
Prepared for:
Joe Eto
Lawrence Berkeley National Laboratory
Prepared by:
Steven Robles
Advanced Technology, Engineering & Technical Services, SCE
June 19, 2015

Residential Air Conditioner with VFD Test Report
© Southern California Edison 2015
Advanced Technology 14799 Chestnut Street, Westminster, California 92683 USA DER Laboratory Research
Page 2 of 147
Southern California Edison (SCE), an Edison International company, is one of the nation’s
largest investor-owned utilities, serving more than 14 million people in a 50,000-square-mile
service area of Central, Coastal and Southern California. The utility has been providing electric
service in the region for more than 125 years.
SCE’s service territory includes about 430 cities and communities with a total customer base of
4.9 million residential and business accounts. SCE is regulated by the California Public Utilities
Commission and the Federal Energy Regulatory Commission.
In 2012, SCE generated about 25 percent of the electricity it provided to customers, with the
remaining 75 percent purchased from independent power producers. One of the nation’s
leading purchasers of renewable energy, SCE delivered nearly 15 billion kilowatt-hours of
renewable energy to its customers in 2012, enough to power 2.3 million homes.
Advanced Technology is the organization in SCE’s Transmission and Distribution business unit
and Engineering & Technical Services (E&TS) division that investigates advanced
technologies and methodologies to support the utility’s goals to provide safe, reliable and
affordable energy while overcoming the challenges associated with the generation,
transmission and distribution of electricity such as: the integration of variable energy
resources, cascading outages and the effects of customer loads.

Residential Air Conditioner with VFD Test Report
© Southern California Edison 2015
Advanced Technology 14799 Chestnut Street, Westminster, California 92683 USA DER Laboratory Research
Page 3 of 147
SCE DISCLAIMER OF WARRANTIES AND LIMITATION OF LIABILITIES
This report was created as a result of work sponsored by the U.S. Department of Energy
through the Lawrence Berkeley National Laboratory and SCE's Research Development and
Demonstration Balancing Account, which was initially established in 1988 as part of customer
rates and performed by its Advanced Technology organization. This report has not been
approved or disapproved by SCE nor has SCE verified the accuracy, adequacy, and safety of
the information in this report.
Neither Advanced Technology, SCE, Edison International, nor any person working for or on
behalf of any of these entities, makes any warranty or representation, express or implied,
related to this report. Without limiting the foregoing, SCE expressly disclaims any liability
associated with the following: (i) information, products, processes or procedures discussed in
this report, including the merchantability and fitness for a particular purpose of these, (ii) use of
the test procedure or that this use does not infringe upon or interfere with rights of others,
including another’s intellectual property, and (iii) that this report is suitable to any particular
user’s circumstance.
SCE follows OSHA and internal safety procedures to protect its personnel and encourages its
partners and contractors to these safety practices as well.
The author acknowledges the efforts of SCE Engineer Manuel Garcia who provided valuable
contribution during the setup and testing of these units and Senior Engineer Richard Bravo for
developing the initial device test procedures.

Residential Air Conditioner with VFD Test Report
© Southern California Edison 2015
Advanced Technology 14799 Chestnut Street, Westminster, California 92683 USA DER Laboratory Research
Page 4 of 147
LBNL DISCLAIMER OF WARRANTIES AND LIMITATION OF LIABILITIES
This document was prepared as an account of work sponsored by the United States
Government. While this document is believed to contain correct information, neither the United
States Government nor any agency thereof, nor The Regents of the University of California,
nor any of their employees, makes any warranty, express or implied, or assumes any legal
responsibility for the accuracy, completeness, or usefulness of any information, apparatus,
product, or process disclosed, or represents that its use would not infringe privately owned
rights. Reference herein to any specific commercial product, process, or service by its trade
name, trademark, manufacturer, or otherwise, does not necessarily constitute or imply its
endorsement, recommendation, or favoring by the United States Government or any agency
thereof, or The Regents of the University of California. The views and opinions of authors
expressed herein do not necessarily state or reflect those of the United States Government or
any agency thereof, or The Regents of the University of California.
Ernest Orlando Lawrence Berkeley National Laboratory is an equal opportunity employer.

Residential Air Conditioner with VFD Test Report
© Southern California Edison 2015
Advanced Technology 14799 Chestnut Street, Westminster, California 92683 USA DER Laboratory Research
Page 5 of 147
TABLE OF CONTENTS
1.0 EXECUTIVE SUMMARY ................................................................................................ 8
2.0 EQUIPMENT SETUP & MEASUREMENTS ................................................................. 13
3.0 VFD AIR CONDITIONER #1 TEST RESULTS ............................................................. 15
3.1 Compressor Shutdown ................................................................................................. 16
3.2 Inrush Current ............................................................................................................... 17
3.3 Balanced & Unbalanced Under-voltages ...................................................................... 18
3.4 Balanced & Unbalanced Over-voltages ........................................................................ 22
3.5 Voltage Oscillations ...................................................................................................... 23
3.6 Under-frequency Events ............................................................................................... 24
3.7 Over-frequency Events ................................................................................................. 25
3.8 Frequency Oscillations ................................................................................................. 26
3.9 Voltage Ramps ............................................................................................................. 27
3.10 Frequency Ramps ........................................................................................................ 29
3.11 Harmonics Contribution ................................................................................................ 31
3.12 Conservation Voltage Reduction ................................................................................... 32
4.0 VFD AIR CONDITIONER #2 TEST RESULTS ............................................................. 34
4.1 Compressor Shutdown ................................................................................................. 35
4.2 Inrush Current ............................................................................................................... 36
4.3 Balanced & Unbalanced Under-voltages ...................................................................... 37
4.4 Balanced & Unbalanced Over-voltages ........................................................................ 41
4.5 Voltage Oscillations ...................................................................................................... 42
4.6 Under-frequency Events ............................................................................................... 43
4.7 Over-frequency Events ................................................................................................. 44
4.8 Frequency Oscillations ................................................................................................. 45
4.9 Voltage Ramps ............................................................................................................. 46
4.10 Frequency Ramps ........................................................................................................ 48
4.11 Harmonics Contribution ................................................................................................ 50
4.12 Conservation Voltage Reduction ................................................................................... 51
5.0 VFD AIR CONDITIONER #3 TEST RESULTS ............................................................. 53
5.1 Compressor Shutdown ................................................................................................. 54
5.2 Inrush Current ............................................................................................................... 55
5.3 Balanced & Unbalanced Under-voltages ...................................................................... 56
5.4 Balanced & Unbalanced Over-voltages ........................................................................ 60
5.5 Voltage Oscillations ...................................................................................................... 61
5.6 Under-frequency Events ............................................................................................... 62
5.7 Over-frequency Events ................................................................................................. 63
5.8 Frequency Oscillations ................................................................................................. 64
5.9 Voltage Ramps ............................................................................................................. 65

Residential Air Conditioner with VFD Test Report
© Southern California Edison 2015
Advanced Technology 14799 Chestnut Street, Westminster, California 92683 USA DER Laboratory Research
Page 6 of 147
5.10 Frequency Ramps ........................................................................................................ 67
5.11 Harmonics Contribution ................................................................................................ 69
5.12 Conservation Voltage Reduction ................................................................................... 70
6.0 VFD AIR CONDITIONER #4 TEST RESULTS ............................................................. 72
6.1 Compressor Shutdown ................................................................................................. 73
6.2 Inrush Current ............................................................................................................... 74
6.3 Balanced & Unbalanced Under-voltages ...................................................................... 75
6.4 Balanced & Unbalanced Over-voltages ........................................................................ 79
6.5 Voltage Oscillations ...................................................................................................... 80
6.6 Under-frequency Events ............................................................................................... 81
6.7 Over-frequency Events ................................................................................................. 82
6.8 Frequency Oscillations ................................................................................................. 83
6.9 Voltage Ramps ............................................................................................................. 84
6.10 Frequency Ramps ........................................................................................................ 86
6.11 Harmonics Contribution ................................................................................................ 88
6.12 Conservation Voltage Reduction ................................................................................... 89
7.0 VFD AIR CONDITIONER #5 TEST RESULTS ............................................................. 91
7.1 Compressor Shutdown ................................................................................................. 92
7.2 Inrush Current ............................................................................................................... 93
7.3 Balanced & Unbalanced Under-voltages ...................................................................... 94
7.4 Balanced & Unbalanced Over-voltages ........................................................................ 98
7.5 Voltage Oscillations ...................................................................................................... 99
7.6 Under-frequency Events ............................................................................................. 100
7.7 Over-frequency Events ............................................................................................... 101
7.8 Frequency Oscillations ............................................................................................... 102
7.9 Voltage Ramps ........................................................................................................... 103
7.10 Frequency Ramps ...................................................................................................... 105
7.11 Harmonics Contribution .............................................................................................. 107
7.12 Conservation Voltage Reduction ................................................................................. 108
8.0 VFD AIR CONDITIONER #6 TEST RESULTS ........................................................... 110
8.1 Compressor Shutdown ............................................................................................... 111
8.2 Inrush Current ............................................................................................................. 112
8.3 Balanced & Unbalanced Under-voltages .................................................................... 113
8.4 Balanced & Unbalanced Over-voltages ...................................................................... 117
8.5 Voltage Oscillations .................................................................................................... 118
8.6 Under-frequency Events ............................................................................................. 119
8.7 Over-frequency Events ............................................................................................... 120
8.8 Frequency Oscillations ............................................................................................... 121
8.9 Voltage Ramps ........................................................................................................... 122
8.10 Frequency Ramps ...................................................................................................... 124
8.11 Harmonics Contribution .............................................................................................. 126

Residential Air Conditioner with VFD Test Report
© Southern California Edison 2015
Advanced Technology 14799 Chestnut Street, Westminster, California 92683 USA DER Laboratory Research
Page 7 of 147
8.12 Conservation Voltage Reduction ................................................................................. 127
9.0 VFD AIR CONDITIONER #7 TEST RESULTS ........................................................... 129
9.1 Compressor Shutdown ............................................................................................... 130
9.2 Inrush Current ............................................................................................................. 131
9.3 Balanced & Unbalanced Under-voltages .................................................................... 132
9.4 Balanced & Unbalanced Over-voltages ...................................................................... 136
9.5 Voltage Oscillations .................................................................................................... 137
9.6 Under-frequency Events ............................................................................................. 138
9.7 Over-frequency Events ............................................................................................... 139
9.8 Frequency Oscillations ............................................................................................... 140
9.9 Voltage Ramps ........................................................................................................... 141
9.10 Frequency Ramps ...................................................................................................... 143
9.11 Harmonics Contribution .............................................................................................. 145
9.12 Conservation Voltage Reduction ................................................................................. 146

Residential Air Conditioner with VFD Test Report
© Southern California Edison 2015
Advanced Technology 14799 Chestnut Street, Westminster, California 92683 USA DER Laboratory Research
Page 8 of 147
1.0 EXECUTIVE SUMMARY
1.1 Introduction
System faults can sometimes occur on the electric grid due to a variety of
environmental conditions and result in protective relays isolating problem areas such
that voltage returns to normal conditions. Traditionally, the voltage recovers to
nominal within a second after the fault is cleared, but there have been instances of
delayed voltage recovery following faults on the electric system, especially during
the summer season. These fault induced delayed voltage recovery (FIDVR) events
have been attributed to air conditioner (A/C) units when their compressor motors
stall as a result of the momentary low voltage. During this stalled condition, the
compressors’ consumption of reactive power radically increases which prevents
system voltage from recovering immediately until the load trips itself off via internal
thermal protection. Voltage recovery has been delayed for up to 50 seconds in some
cases.
The Western Electricity Coordinating Council (WECC) has been continuously
investigating FIDVR events and in 2006 its members from Bonneville Power
Administration (BPA), Southern California Edison (SCE), and Electric Power
Research Institute (EPRI) tested 27 residential split-phase A/C units to evaluate their
dynamic performance. Among other performance characteristics, it was determined
that these units typically stall between 60% and 70% nominal voltage well before
they are disconnected by their power contactors at 53% voltage. It was also
discovered that these single-phase compressor motors began stalling rather quickly,
normally within 3 cycles. Ultimately, this A/C unit research was utilized by the Model
Validation Working Group (MVWG) to develop and validate the A/C motor model.

Residential Air Conditioner with VFD Test Report
© Southern California Edison 2015
Advanced Technology 14799 Chestnut Street, Westminster, California 92683 USA DER Laboratory Research
Page 9 of 147
1.2 Objective
The objective of this report is to assess the performance of several residential A/C
units with variable frequency drive (VFD) technology during typical voltage and
frequency deviations observed on the grid. These systems consist of an outdoor
condensing unit along with one or more indoor air handler units for cooling individual
areas in a residence, each with a controller printed circuit board (PCB). The
advantage of these ductless split systems over conventional A/C units is that they
are designed with inverter technology used to more accurately maintain temperature
and reduce energy consumption. This is achieved by adjusting the rotation speed of
the compressor to provide only enough cooling capacity to meet demand.
There has been little or no research executed on these types of units during dynamic
conditions to determine whether or not they share the same stalling characteristics
as conventional A/C devices during normal operation. Therefore the resulting test
data may be used to support the validation of load models as well as the
investigation of stalling solutions. The VFD A/C unit characteristics to be evaluated
during testing include:
- Compressor stalling criteria (or lack thereof)
- Inrush currents during startup
- Controls protection/dropout capabilities
- Harmonics contribution
- Under/over-voltage performance
- Under/over-frequency performance
- Behavior during voltage/frequency oscillations
- Behavior during conservation voltage reduction
The following work is part of an integrated program of FIDVR research sponsored by
the U.S. Department of Energy through the Lawrence Berkeley National Laboratory.
The program is intended to promote national awareness, improve understanding of
potential grid impacts, and identify appropriate steps to ensure the reliability of the
power system.

Residential Air Conditioner with VFD Test Report
© Southern California Edison 2015
Advanced Technology 14799 Chestnut Street, Westminster, California 92683 USA DER Laboratory Research
Page 10 of 147
1.3 Test Results Summary
Each of the VFD A/C units tested displayed similar shutdown and startup
characteristics. Most of the load consumed by the compressor shuts down with
rather short delay times, typically less than 5 cycles. Some of the units required an
additional delay of 30 to 60 seconds or so for the outdoor fan to stop operating
before going into standby mode. Once in standby mode, none of the VFD A/C units
consumed more than 0.65 Amps.
Each unit also displayed relatively low inrush currents compared to conventional
residential A/C units when starting up after nominal voltage has been established.
The largest inrush current magnitude observed from these VFD A/C units was 11.3
Amps within 1.8 cycles (VFD A/C unit #1). Typically, VFD compressors would slowly
ramp up over the course of roughly 20 to 50 seconds until the unit began consuming
a constant steady state current value of no more than 5 Amps. However the VFD
compressors were not limited this amount of load, but they would increase
consumption periodically over the course of several minutes to meet temperature
demand. Therefore, it was required that the unit continue running for several minutes
before performing further testing to ensure the motor was more heavily loaded at
approximately 80 degrees Fahrenheit room temperature. Based on this room
temperature, each unit would operate at approximately 50% to 80% of its rated load.
No motor stalling occurred during any of the balanced and unbalanced under-
voltage tests for all seven VFD A/C units. The compressor controls for the VFD A/C
systems would always trip or drop out before compressor stalling could potentially
take place. Also, data captured several seconds after the compressor was
disconnected did not reveal restarting behavior and therefore reclose times were not
captured. This indicates that there must be a protective relay and associated delay
times programmed into the local controller of the VFD A/C unit to prevent immediate
restarting. The compressor would only restart approximately several minutes after
tripping/dropout occurred, outside the range of the data captured.
Residential Air Conditioner with VFD Test Report
© Southern California Edison 2015
Advanced Technology 14799 Chestnut Street, Westminster, California 92683 USA DER Laboratory Research
Page 11 of 147
Even during cases where dropout did not happen and the compressor rode through
all of the under-voltage sags down to 0% voltage, motor stalling still did not occur.
These ride through scenarios typically occurred for those voltage transients with
shorter duration times. The longest voltage sag duration time where compressor ride
through occurred for all under-voltages was 6 cycles (for VFD A/C units #4 and #5).
The conditions required to cause dropout varied slightly for each VFD A/C unit and
were greatly dependent on the voltage magnitude and sometimes the duration time
of the voltage sag. The most common voltage magnitudes where dropout behavior
takes place is between 50% and 60% nominal voltages among all seven VFD A/C
units. Although there are a few exceptions, most tests revealed that compressor
tripping occurs either at the end of the voltage sag or even up to 3 cycles after the
voltage has recovered to steady state. One theory to explain these trip times is that
the compressor is disconnected in response to the inrush current observed at the
end of the voltage sag as it steps up to nominal. Another, less likely, explanation is
that there may be logic in the controller PCB of the outdoor condensing unit that
prevents disconnection of compressor load until voltage returns to nominal.
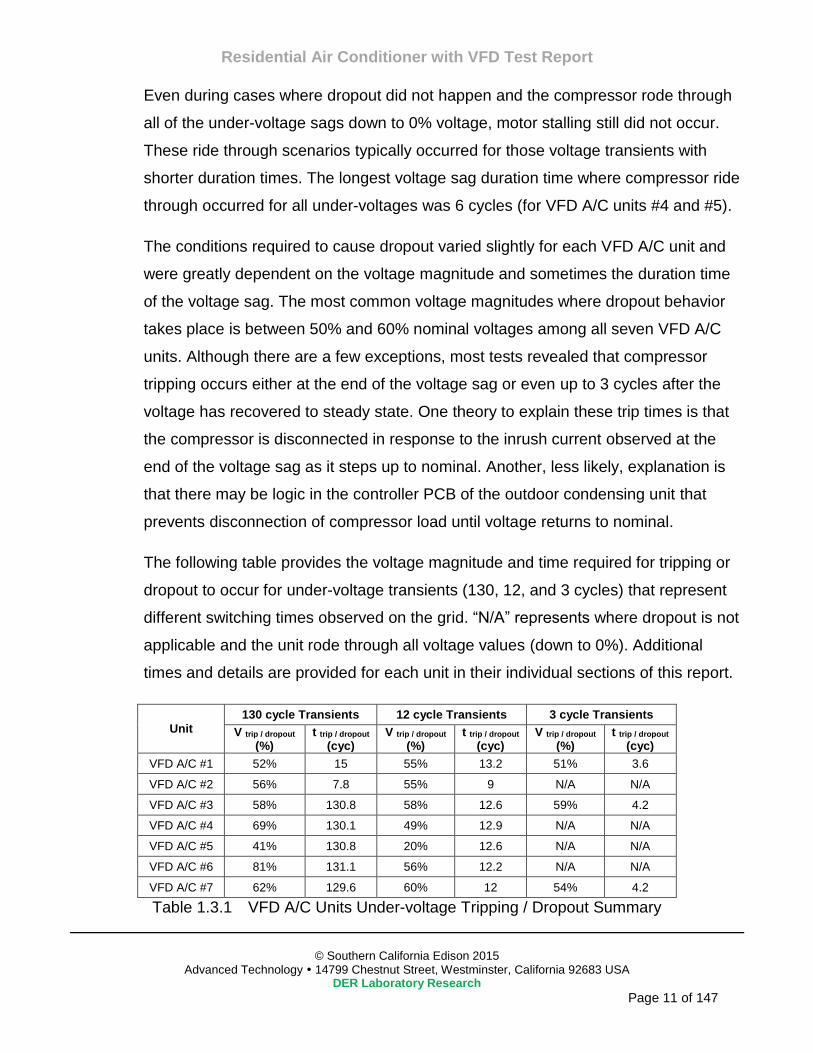
The following table provides the voltage magnitude and time required for tripping or
dropout to occur for under-voltage transients (130, 12, and 3 cycles) that represent
different switching times observed on the grid. “N/A” represents where dropout is not
applicable and the unit rode through all voltage values (down to 0%). Additional
times and details are provided for each unit in their individual sections of this report.
Unit
130 cycle Transients 12 cycle Transients 3 cycle Transients
V trip / dropout (%)
t trip / dropout (cyc)
V trip / dropout (%)
t trip / dropout (cyc)
V trip / dropout (%)
t trip / dropout (cyc)
VFD A/C #1 52% 15 55% 13.2 51% 3.6
VFD A/C #2 56% 7.8 55% 9 N/A N/A
VFD A/C #3 58% 130.8 58% 12.6 59% 4.2
VFD A/C #4 69% 130.1 49% 12.9 N/A N/A
VFD A/C #5 41% 130.8 20% 12.6 N/A N/A
VFD A/C #6 81% 131.1 56% 12.2 N/A N/A
VFD A/C #7 62% 129.6 60% 12 54% 4.2
Table 1.3.1 VFD A/C Units Under-voltage Tripping / Dropout Summary

Residential Air Conditioner with VFD Test Report
© Southern California Edison 2015
Advanced Technology 14799 Chestnut Street, Westminster, California 92683 USA DER Laboratory Research
Page 12 of 147
With the exception of VFD A/C unit #3, none of the other units displayed over-
voltage protection within the parameters of the over-voltage tests performed. In
order to avoid damaging any voltage sensitive power electronic equipment inside the
VFD A/C unit, each unit was subjected to balanced and unbalanced over-voltages
within the parameters of the ITIC (CBEMA) curve, a curve developed to signify the
tolerances of voltage sensitive loads. These tests included multiple voltage swells
performed in 2% increments for up to 120% nominal. Only VFD A/C unit #3
displayed tripping behavior during balanced over-voltages, tripping at 112% nominal
voltage in 1.2 cycles and at 118% nominal voltage in 0.6 cycles.
Additionally, none of the units displayed any frequency protection during multiple
under and over-frequency transient tests within 58 Hz and 62 Hz. However two of
units, VFD A/C #1 and #7, did trip during tests where frequency was ramped up to
70 Hz from 60 Hz. Both units tripped at approximately 67.7 Hz.
In general, the VFDs did an excellent job of managing the compressor motor speed
and power consumption during a variety of voltages and frequency deviation tests.
Real power remains relatively constant for each of the VFD A/C units during most of
these tests. Reactive power consumption is not as predictable and varies differently
for several units. Many of the devices also operate at high power factors, typically
above 0.97, which may be a reason for the varied response of the moderately low
reactive power load.
Conservation voltage reduction (CVR) will have little to no effect on motor loads
managed using this VFD technology. Real power consumption is held nearly
constant over the course of CVR for all of the units tested during the 1% incremental
voltage steps.

Residential Air Conditioner with VFD Test Report
© Southern California Edison 2015
Advanced Technology 14799 Chestnut Street, Westminster, California 92683 USA DER Laboratory Research
Page 13 of 147
2.0 EQUIPMENT SETUP & MEASUREMENTS
While testing the performance of the seven residential A/C units with VFD technology, the
sinusoidal voltages and currents were measured at the main disconnect terminals (split-phase
240 V). These sinusoidal waveforms were used to calculate the RMS equivalent
voltage/current values along with real power, reactive power, and frequency. Sinusoidal
voltages and currents were also measured on all three phases of the VFD compressor to
identify loading on the compressor before and during each test. In addition to these electrical
measurements, an accelerometer was placed on the compressor motor to observe the
mechanical vibration and serve as another indicator for when unit shuts down or if stalling
would occur. Multi-meters with thermocouples were placed in the lab and at the supply fan of
the indoor unit to verify and document temperature conditions.
VFD A/C # Manufacturer Outdoor P/N Indoor P/N Voltage BTU Refrigerant SEER
1 Friedrich MR36Y3J MW36Y3J 230 33,000 R-410A 16.5
2 Carrier 38GVQ024-3 40GVQ024-3 230 24,000 R-410A 16
3 Lennox MS8-HO-24P MS8-HI-24P 230 24,000 R-410A 18
4 Goodman MSH243E15MC MSH243E15AX 230 24,000 R-410A 15
5 Klimaire KSIO024-H219 230 24,000 R-410A 19
6 Panasonic CU-KE36NKU CS-KE36NKU 230 34,000 R-410A 16
7 LG LSU360HV3 LSN360HV3 230 33,100 R-410A 16.1
Table 2.0.1 Residential VFD A/C Units Tested
Figure 2.0.1 Split-phase VFD A/C Test Setup

Residential Air Conditioner with VFD Test Report
© Southern California Edison 2015
Advanced Technology 14799 Chestnut Street, Westminster, California 92683 USA DER Laboratory Research
Page 14 of 147
Figure 2.0.2 Typical VFD A/C Wiring Diagram

Residential Air Conditioner with VFD Test Report
© Southern California Edison 2015
Advanced Technology 14799 Chestnut Street, Westminster, California 92683 USA DER Laboratory Research
Page 15 of 147
3.0 VFD AIR CONDITIONER #1 TEST RESULTS
The figure below shows a snapshot of VFD A/C unit #1 sinusoidal voltages and currents
captured at the main terminals and compressor motor using a filter on the digital scope. Notice
the distortion in the main currents compared to main voltages. The compressor is operating at
approximately 290 Volts peak, 6.3 Amps peak, and 235 Hz at the observed loading condition.
The specifications for the VFD A/C #1 components are provided in the table below.
Figure 3.0.1 VFD A/C #1 Voltage and Current Waveforms
Manufacturer Friedrich
Voltage (V) 230
Refrig. R-410A
SEER 16.5
Compressor, Model # CRSS C-6RZ146H1A
Compressor, RLA (Amps) 17.3
Compressor, LRA (Amps) -
Outdoor Fan Motor, FLA (Amps) 0.25
Indoor Fan Motor, FLA (Amps) 0.5
Design Pressure High (PSI) 450
Design Pressure Low (PSI) 240
Table 3.0.1 VFD A/C #1 Specifications

Residential Air Conditioner with VFD Test Report
© Southern California Edison 2015
Advanced Technology 14799 Chestnut Street, Westminster, California 92683 USA DER Laboratory Research
Page 16 of 147
3.1 Compressor Shutdown
VFD A/C #1 was shut down during normal operation using the programmable
thermostat remote for the indoor blower unit. The figure below displays the
measurements taken at the main terminal connections of the entire A/C unit.
The compressor and fans shut down almost immediately at the same time after
adjusting the thermostat. The delay time is minuscule where current decreases from
normal operation to standby within 2.4 cycles. While in standby mode, the device’s
power consumption is less than 0.6 Amps.
Figure 3.1.1 VFD A/C #1 Compressor Shutdown

Residential Air Conditioner with VFD Test Report
© Southern California Edison 2015
Advanced Technology 14799 Chestnut Street, Westminster, California 92683 USA DER Laboratory Research
Page 17 of 147
3.2 Inrush Current
After starting up the VFD A/C unit via the programmable thermostat remote, the fan
motor starts up first with an inrush current of approximately 11.3 Amps for a duration
of 1.8 cycles. This is followed by the compressor slowly ramping up over the course
of roughly 25 seconds until the unit is drawing 3.7 Amps as shown in the figure
below. The indoor blower unit also experiences an inrush bringing total current to
nearly 7 Amps within 3 cycles. The VFD compressor will increase in intervals over
the course of several minutes to meet temperature demand until the unit is more
heavily loaded. The room temperature was approximately 80 degrees Fahrenheit
and the unit would typically operate near 9.7 Amps steady state.
Figure 3.2.1 VFD A/C #1 Inrush Current

Residential Air Conditioner with VFD Test Report
© Southern California Edison 2015
Advanced Technology 14799 Chestnut Street, Westminster, California 92683 USA DER Laboratory Research
Page 18 of 147
3.3 Balanced & Unbalanced Under-voltages
Performing balanced voltage sags on VFD A/C #1 in decrements of 10% revealed
that the compressor is typically disconnected at 50% nominal voltage. Despite a few
instances where the device rides through this voltage and does not trip until reaching
40% voltage, most voltage transients resulted in compressor tripping at the 50%
voltage sags that had duration times of 3 to 130 cycles. Longer duration voltage
sags (130 cycles) caused compressor tripping up to 18 cycles after the start of the
voltage sag. However the remaining under-voltage tests in Table 3.3.1 consistently
revealed compressor tripping at either at the end of the voltage sag or up to 1.4
cycles after voltage already recovered. This may be the result of the increasing
spikes of inrush current at the end of each voltage sag or possibly the logic on the
controller PCB is preventing load disconnection until voltage returns to nominal.
Data captured several seconds after the disconnection of the compressors did not
reveal restarting behavior and therefore reclose times were not captured. This
indicates that there must be a protective relay and associated delay times
programmed into the local controller of the VFD A/C unit to prevent immediate
restarting. The compressor would only restart several minutes after tripping occurred
and there were no signs of stalling.
The only instance where the compressor did not trip and rode through all under-
voltage sags (down to 0% voltage) occurred during transients that lasted only 1
cycle. However these 1 cycle tests were not as consistent as other under-voltage
tests, causing the compressor to be tripped off at a variety of voltage magnitudes.
The following figure visually displays one of these balanced tests where the under-
voltage sags have a duration time of 130 cycles. In this particular test, the
compressor is observed being disconnected at 50% voltage after 18 cycles. The
following table provides additional details regarding the compressor operation during
a variety of balanced under-voltage transient tests including the voltage where the
unit was tripped (Vtrip) as well as the time it took for the unit controls to trip it offline
after the voltage sag was initiated (ttrip).

Residential Air Conditioner with VFD Test Report
© Southern California Edison 2015
Advanced Technology 14799 Chestnut Street, Westminster, California 92683 USA DER Laboratory Research
Page 19 of 147
Figure 3.3.1 VFD A/C #1 Balanced Under-voltage Response (130 cycles)
Under-Voltage Transient Compressor
Volt Range Duration (cyc) Vtrip (%) ttrip (cyc)
100%, 90%, 80%,... 0% 130
50% 18
50% 16.2
50% 13.8
100%, 90%, 80%,... 0% 12
50% 11.4
50% 10.8
50% 12
100%, 90%, 80%,... 0% 9
40% 9
50% 9
50% 9
100%, 90%, 80%,... 0% 6
50% 6
50% 7.2
50% 6
100%, 90%, 80%,... 0% 3
40% 4.2
50% 3
50% 4.2
100%, 90%, 80%,... 0% 1
50% 2.4
N/A N/A
30% 1.8
Table 3.3.1 VFD A/C #1 Balanced Under-voltages in 10% Decrements Results

Residential Air Conditioner with VFD Test Report
© Southern California Edison 2015
Advanced Technology 14799 Chestnut Street, Westminster, California 92683 USA DER Laboratory Research
Page 20 of 147
Identifying the specific voltage where the compressors are disconnected and/or the
controls dropped out requires additional balanced under-voltage tests in decrements
of 1% nominal voltage. Several tests with different duration times showed that the
compressor could begin tripping off for voltage sags as high as 55% and as low as
51% of nominal where the trip times typically occur at the end of the voltage sag or
even up to 1.2 cycles after voltage recovers. This behavior may also be due to the
inrush current as voltage returns to steady state or possibly a result of the controller
PCB logic on the outdoor unit. The following table provides the details of the
compressor disconnection behavior during these 1% voltage decrement tests.
Under-Voltage Transient Compressor
Volt Range Duration (cyc) Vtrip (%) ttrip (cyc)
60%, 59%, 58%,… 180 55% 179.4
60%, 59%, 58%,… 130 52% 15
60%, 59%, 58%,… 12 55% 13.2
60%, 59%, 58%,… 3 51% 3.6
Table 3.3.2 VFD A/C #1 Balanced Under-voltages in 1% Decrements Results
Unbalanced under-voltages on this VFD A/C unit resulted in compressor trip
voltages and trip times similar to those observed during balanced under-voltage
conditions with respect to the line-to-line voltage. Although the unit does not trip until
the single line under-voltage sags with a duration of 3 to 130 cycles reach either
10% or 0% line-to-neutral when measuring one of the legs. Therefore the line-to-line
trip voltages are 55% or 50% nominal voltage when measuring across both legs
since one of the legs is being held at nominal voltage. These results suggest that the
power electronic controls that operate the compressor of this particular VFD unit rely
on the voltage potential across both lines. The 1 cycle voltage sags, which were
performed to represent switching transients, did not cause any tripping behavior.
The following figure shows an example of these unbalanced cases (Line 1 under-
voltages for 130 cycles). The following table provides the compressor disconnection
behavior during unbalanced voltage transients observed at the main terminals of the
VFD A/C unit. Notice that the shorter duration voltage sags (12 cycles and less)

Residential Air Conditioner with VFD Test Report
© Southern California Edison 2015
Advanced Technology 14799 Chestnut Street, Westminster, California 92683 USA DER Laboratory Research
Page 21 of 147
result in tripping at the end of the transient or up to 1.2 cycles after voltage recovers,
similar to the behavior observed during balanced under-voltage tests.
Figure 3.3.2 VFD A/C #1 Balanced Under-voltage Response (Line 1, 130 cycles)
Under-Voltage Transient Compressor
Lines Volt Range Duration (cyc) Vtrip L-N (%) Vtrip L1-L2 (%) ttrip (cyc)
L1 100%, 90%, 80%,... 0%
130 0% 50% 13.8
12 10% 55% 12
9 0% 50% 9.6
6 10% 55% 6
3 10% 55% 4.2
1 N/A N/A N/A
L2 100%, 90%, 80%,... 0%
130 0% 50% 12
12 10% 55% 12.6
9 0% 50% 10.2
6 10% 55% 6
3 0% 50% 4.2
1 N/A N/A N/A
Table 3.3.3 VFD A/C #1 Unbalanced Under-voltage Results

Residential Air Conditioner with VFD Test Report
© Southern California Edison 2015
Advanced Technology 14799 Chestnut Street, Westminster, California 92683 USA DER Laboratory Research
Page 22 of 147
3.4 Balanced & Unbalanced Over-voltages
In order to avoid damaging any voltage sensitive power electronic equipment inside
the VFD A/C unit, it was subjected to balanced and unbalanced over-voltages within
the parameters of the ITIC (CBEMA) curve. These included multiple voltage swells
performed in 2% increments for up to 120% nominal voltage to identify any tripping
behavior. No over-voltage protection was observed during these tests and the VFD
A/C unit rode through all of the voltage transients operating normally. The following
figure and table display the details of this ride through performance.
Figure 3.4.1 VFD AC #1 Balanced Over-voltage Response (20 cycles)
Over-Voltage Transient Compressor
Lines Volt Range Duration (cyc) Vtrip L-N (%) Vtrip L1-L2 (%) ttrip (cyc)
L1 & L2 100%, 102%, 104%,... 120% 20 N/A N/A N/A
L1 100%, 102%, 104%,... 120% 20 N/A N/A N/A
L2 100%, 102%, 104%,... 120% 20 N/A N/A N/A
Table 3.4.1 VFD A/C #1 Balanced & Unbalanced Over-voltage Results

Residential Air Conditioner with VFD Test Report
© Southern California Edison 2015
Advanced Technology 14799 Chestnut Street, Westminster, California 92683 USA DER Laboratory Research
Page 23 of 147
3.5 Voltage Oscillations
The following figure shows the performance of the VFD A/C unit during voltage
oscillations between 100% and 90% nominal voltage for a variety of swing
frequencies or oscillation rates.
Current oscillates in the opposite direction of voltage, up to 12% above nominal, to
minimize any oscillations or deviations in real power. The consumption of real power
remains relatively constant, within 2% of nominal, due the rapid change in current
indicating that the VFD drive is attempting to keep the compressor motor speed
constant. This near constant power response holds true for all voltage oscillation
tests from 0.25 Hz to 2 Hz while voltage oscillates between 100% and 90%.
Reactive power consumption is very low since the power factor is greater than 0.99
for the device. Therefore any minor change in reactive load, even during steady
state, results in drastic changes to the per unit values. As a result, reactive power
was not included in the figure below.
Figure 3.5.1 VFD AC #1 Voltage Oscillation Response (0.10, 0.25, 0.70, 1.0, 2.0 Hz)

Residential Air Conditioner with VFD Test Report
© Southern California Edison 2015
Advanced Technology 14799 Chestnut Street, Westminster, California 92683 USA DER Laboratory Research
Page 24 of 147
3.6 Under-frequency Events
After subjecting this VFD A/C unit to multiple under-frequency transients with
different duration times, it is presumed that the unit does not have under-frequency
protection while operating between 60 Hz and 58 Hz. The device simply rides
through these under-frequency conditions. The compressor motor frequency
remains constant from the VFD despite changes in frequency at the unit’s main
terminals. The following figure and table identify the magnitude and duration of the
frequency transient tests that were performed.
Figure 3.6.1 VFD A/C #1 Under-frequency Response (130, 12, 3 cycles)
Under-Frequency Transient Compressor
Frequency Range Duration (cyc) Ftrip (Hz) ttrip (cyc)
60Hz, 59.8Hz, 59.6Hz,... 58Hz 130 N/A N/A
60Hz, 59.8Hz, 59.6Hz,... 58Hz 12 N/A N/A
60Hz, 59.8Hz, 59.6Hz,... 58Hz 3 N/A N/A
Table 3.6.1 VFD A/C #1 Under-frequency Test Results

Residential Air Conditioner with VFD Test Report
© Southern California Edison 2015
Advanced Technology 14799 Chestnut Street, Westminster, California 92683 USA DER Laboratory Research
Page 25 of 147
3.7 Over-frequency Events
Similar to the under-frequency tests, the VFD A/C unit was subjected to over-
frequency transients to 62 Hz without triggering any protection. The unit rode
through and continued operating during these frequency conditions. The compressor
motor frequency remains constant from the VFD despite changes in frequency at the
unit’s main terminals. The following figure and table identify the magnitude and
duration of the specific over-frequency tests that were performed.
Figure 3.7.1 VFD A/C #1 Over-frequency Response (130, 12, 3 cycles)
Over-Frequency Transient Compressor
Frequency Range Duration (cyc) Ftrip (Hz) ttrip (cyc)
60Hz, 59.8Hz, 59.6Hz,... 58Hz 130 N/A N/A
60Hz, 59.8Hz, 59.6Hz,... 58Hz 12 N/A N/A
60Hz, 59.8Hz, 59.6Hz,... 58Hz 3 N/A N/A
Table 3.7.1 VFD A/C #1 Over-frequency Test Results

Residential Air Conditioner with VFD Test Report
© Southern California Edison 2015
Advanced Technology 14799 Chestnut Street, Westminster, California 92683 USA DER Laboratory Research
Page 26 of 147
3.8 Frequency Oscillations
The following figure shows the performance of VFD A/C #1 during frequency
oscillations between 59 Hz and 61 Hz for different swing frequencies or oscillation
rates (0.10, 0.25, 0.70, 1.0, and 2.0 Hz).
Current does not oscillate or deviate in response to frequency oscillations at the
main terminals of the A/C unit. The active power consumption remains constant,
within +1% of nominal, along with current for all swing frequencies.
Reactive power was not included in the figure below because of its low consumption
(power factor is greater than 0.99). Even minor deviations that naturally occur during
steady state result in harsh changes to the per unit values plotted.
Figure 3.8.1 VFD A/C #1 Frequency Oscillation Response (0.10, 0.25, 0.70, 1.0, 2.0 Hz)

Residential Air Conditioner with VFD Test Report
© Southern California Edison 2015
Advanced Technology 14799 Chestnut Street, Westminster, California 92683 USA DER Laboratory Research
Page 27 of 147
3.9 Voltage Ramps
Voltage was ramped down and back up multiple times in 10% decrements until the
A/C unit tripped while ramping down to 50% nominal voltage. Accordingly, the
following figure shows the load performance at different voltage levels during
continuous operation (down to 60% nominal voltage).
Overall, the VFD is doing an excellent job maintaining constant power and a
constant speed for the compressor motor despite the drastic change in voltage.
Current ramps up to approximately 71% above nominal while maintaining near
constant power. Real power only deviates within +2% of steady state for the 8
second ramp test and within +5% for the 2 second ramp test. Reactive power
consumption is low, but ramps with the current to nearly 70% above it nominal value.
Figure 3.9.1 VFD A/C #1 Voltage Ramp Down to 60% (2 & 8 sec.)

Residential Air Conditioner with VFD Test Report
© Southern California Edison 2015
Advanced Technology 14799 Chestnut Street, Westminster, California 92683 USA DER Laboratory Research
Page 28 of 147
Voltage was ramped up to 110% and back down steady state voltage at different
ramp rates to demonstrate the load performance while operating at over-voltage
values.
Similarly, the VFD maintains the speed and real power consumption of the
compressor motor. Current is observed uniformly ramping down to nearly 10%
below nominal, resulting in constant power load behavior. Real power consumption
stays within +1% of steady state. Little reactive power is consumed during normal
operation, but it does ramp in the same direction as the current.
Figure 3.9.2 VFD A/C #1 Voltage Ramp Up to 110% (in 2 & 8 sec.)

Residential Air Conditioner with VFD Test Report
© Southern California Edison 2015
Advanced Technology 14799 Chestnut Street, Westminster, California 92683 USA DER Laboratory Research
Page 29 of 147
3.10 Frequency Ramps
Frequency was ramped down to 50 Hz and back up to 60 Hz at different ramp rates
to demonstrate the load performance while operating at lower frequency values as
shown in the figure below.
Current and real power remain constant throughout the entire under-frequency
ramp. Reactive power is relatively low (0.99 power factor) and therefore deviations in
the per unit values are observed even during steady state.
Figure 3.10.1 VFD A/C #1 Frequency Ramp Down to 50 Hz (in 2 & 8 sec.)

Residential Air Conditioner with VFD Test Report
© Southern California Edison 2015
Advanced Technology 14799 Chestnut Street, Westminster, California 92683 USA DER Laboratory Research
Page 30 of 147
Frequency was ramped up to 70 Hz and back down to 60 Hz at different ramp rates
to demonstrate the load performance while operating at higher frequency values.
However, VFD A/C #1 tripped at approximately 67.5 Hz and the test was redone
ramping frequency up to 65 Hz as shown in the figure below.
Current stays constant at the beginning of the test until frequency reaches 64 Hz. At
this point the current ramps up with frequency until peaking at 10% above nominal.
Real power consumption is constant throughout the entire test. Reactive power, like
current, begins ramping after frequency goes above 64 Hz and peaks at
approximately 336% of nominal before ramping down. The device is operating at a
power factor greater than 0.99 and therefore reactive power consumption is low.
Figure 3.10.2 VFD A/C #1 Frequency Ramp Up to 65 Hz (in 2 & 8 sec.)

Residential Air Conditioner with VFD Test Report
© Southern California Edison 2015
Advanced Technology 14799 Chestnut Street, Westminster, California 92683 USA DER Laboratory Research
Page 31 of 147
3.11 Harmonics Contribution
Steady state voltage and current sinusoidal waveform data was captured multiple
times without scope filters to calculate the actual harmonic contribution of VFD A/C
unit #1 to the grid. The total harmonic distortion of current was found to be almost
15% of the fundamental. The following table gives the total harmonic distortion
calculations and the figure plots the individual harmonic values.
Data Set #
THD (% of Fundamental)
V(L1-L2) I(L1) I(L2)
1 0.95 14.76 14.86
2 0.95 14.71 14.81
3 0.95 14.71 14.81
Table 3.11.1 VFD A/C #1 Total Harmonic Distortion
Figure 3.11.1 VFD A/C #1 Harmonics Contribution

Residential Air Conditioner with VFD Test Report
© Southern California Edison 2015
Advanced Technology 14799 Chestnut Street, Westminster, California 92683 USA DER Laboratory Research
Page 32 of 147
3.12 Conservation Voltage Reduction
Voltage was decreased by 1% nominal voltage in 5 second intervals down to 90%
before recovering back to steady state as shown in the figure below.
CVR will have little to no effect on power consumption for this type of A/C with VFD
technology based on the following results. Current increases by approximately 1.2%
of nominal current for every 1% decrease in nominal voltage over the course of the
CVR test. This results in constant real power, within +2% of normal consumption.
Reactive power does increase with current, but consumption is very low and difficult
to plot in per unit values with the other electrical measurements.
Figure 3.12.1 VFD A/C #1 CVR Response Down to 90% Voltage

Residential Air Conditioner with VFD Test Report
© Southern California Edison 2015
Advanced Technology 14799 Chestnut Street, Westminster, California 92683 USA DER Laboratory Research
Page 33 of 147
Alternatively, the main terminal voltage at the VFD A/C unit was increased by 1%
nominal voltage in 5 second intervals up to 105% before stepping back to steady
state as shown in the figure below.
Again, CVR does not have a significant impact on the load power consumption.
Current decreases by approximately 1% of its nominal value for every 1% increase
in nominal voltage. Therefore real power remains at steady state consumption.
Reactive power does decrease with current, but again is a very low value relative to
the other measurements.
Figure 3.12.2 VFD A/C #1 CVR Response Up to 105% Voltage

Residential Air Conditioner with VFD Test Report
© Southern California Edison 2015
Advanced Technology 14799 Chestnut Street, Westminster, California 92683 USA DER Laboratory Research
Page 34 of 147
4.0 VFD AIR CONDITIONER #2 TEST RESULTS
The figure below shows a snapshot of VFD A/C unit #2 sinusoidal voltages and currents
captured at the main terminals and compressor motor using a filter on the digital scope. Notice
the distortion in the main currents waveforms compared to the voltage waveforms. The
compressor is operating at approximately 172 Volts peak, 9 Amps peak, and 160 Hz at the
observed loading condition. The specifications for the VFD A/C #2 components are provided in
the table below.
Figure 4.0.1 VFD A/C #2 Voltage and Current Waveforms
Manufacturer Carrier
Voltage (V) 230
Refrig. R-410A
SEER 16
Compressor, Model # LG GJT240MBA
Compressor, RLA (Amps) 12.5
Compressor, LRA (Amps) 41
Outdoor Fan Motor, FLA (Amps) 0.62
Indoor Fan Motor, FLA (Amps) 0.45
Design Pressure High (PSI) 550
Design Pressure Low (PSI) 240
Table 4.0.1 VFD A/C #2 Specifications

Residential Air Conditioner with VFD Test Report
© Southern California Edison 2015
Advanced Technology 14799 Chestnut Street, Westminster, California 92683 USA DER Laboratory Research
Page 35 of 147
4.1 Compressor Shutdown
VFD A/C #2 was shut down during normal operation using the programmable
thermostat remote for the indoor blower unit. The figure below displays the
measurements taken at the main terminal connections of the entire A/C unit.
The indoor unit fan shuts down immediately after adjusting the thermostat followed
by the compressor starting to shut down within one second. The compressor current
decreases rapidly within 3 cycles and slowly decays over the next 10 cycles.
However, the outdoor unit fan continued operating for another 60 seconds before
shutting down and the A/C unit entered standby mode. While in standby mode, the
device’s power consumption is less than 0.4 Amps.
Figure 4.1.1 VFD A/C #2 Compressor Shutdown

Residential Air Conditioner with VFD Test Report
© Southern California Edison 2015
Advanced Technology 14799 Chestnut Street, Westminster, California 92683 USA DER Laboratory Research
Page 36 of 147
4.2 Inrush Current
After starting up the VFD A/C unit via the programmable thermostat remote, the fan
motors start up first with a maximum inrush current of 5.5 Amps in an 18 cycle
window. This is followed by the compressor slowly ramping up over the course of
roughly 45 seconds until the unit is drawing a minimum of 2.4 Amps. The VFD
compressor will increase in intervals over the course of several minutes to meet
temperature demand until the unit is more heavily loaded. The room temperature
was approximately 80 degrees Fahrenheit and the unit would operate up to 7.2
Amps steady state.
Figure 4.2.1 VFD A/C #2 Inrush Current

Residential Air Conditioner with VFD Test Report
© Southern California Edison 2015
Advanced Technology 14799 Chestnut Street, Westminster, California 92683 USA DER Laboratory Research
Page 37 of 147
4.3 Balanced & Unbalanced Under-voltages
VFD A/C #2 was subjected to a series of balanced under-voltage sags in
decrements of 10% to identify the conditions required to cause device dropout and
tripping behavior. The unit was consistently observed disconnecting the compressor
at 50% nominal voltage for sags with a duration of 6 to 130 cycles within 8.4 cycles
after the start of the voltage sag. Table 4.3.1 shows that the 6 cycle transients were
the only tests that resulted in the compressor shutting down after voltage already
recovered to nominal.
Data captured several seconds after the disconnection of the compressors did not
reveal restarting behavior and therefore reclose times were not captured. This
indicates that there must be a protective relay and associated delay times
programmed into the local controller of the VFD A/C unit to prevent immediate
restarting. The compressor was only observed restarting several minutes after
tripping occurred with no evidence of stalling behavior.
Voltage sags with a duration of 3 cycles and 1 cycle resulted in the compressor
riding through all voltage magnitudes (down to 0% voltage) and continuing to
operate normally. “N/A” or “not applicable” represents these ride through situations
where there is no trip voltage or trip time available in the following tables.
The following figure visually displays one of the longer balanced tests where the
under-voltage sags have a duration time of 130 cycles. The figure reveals that the
compressor motor slows down slightly at 70% voltage and more significantly at 60%
voltage before shutting down at 50% voltage within the first 2 cycles of the voltage
sag. The current spikes take place when voltage steps from one magnitude to
another are caused the compressor and fan motors. The real and reactive power
profiles indicate a change in power factor at the beginning of the voltage sag that
returns to normal before voltage recovers. The following table provides the voltage
(Vtrip) and time (ttrip) taken for the A/C unit’s controls to dropout and/or cause
compressor tripping. The trip time is measured from the start of the voltage sag prior
to the compressor shutting down.

Residential Air Conditioner with VFD Test Report
© Southern California Edison 2015
Advanced Technology 14799 Chestnut Street, Westminster, California 92683 USA DER Laboratory Research
Page 38 of 147
Figure 4.3.1 VFD A/C #2 Balanced Under-voltage Response (130 cycles)
Under-Voltage Transient Compressor
Volt Range Duration (cyc) Vtrip (%) ttrip (cyc)
100%, 90%, 80%,... 0% 130
50% 1.2
50% 1.2
50% 1.2
100%, 90%, 80%,... 0% 12
50% 4.8
50% 6
50% 3.6
100%, 90%, 80%,... 0% 9
50% 5.4
50% 4.8
50% 7.2
100%, 90%, 80%,... 0% 6
50% 6.6
50% 8.4
50% 6.6
100%, 90%, 80%,... 0% 3
N/A N/A
N/A N/A
N/A N/A
100%, 90%, 80%,... 0% 1
N/A N/A
N/A N/A
N/A N/A
Table 4.3.1 VFD A/C #2 Balanced Under-voltages in 10% Decrements Results

Residential Air Conditioner with VFD Test Report
© Southern California Edison 2015
Advanced Technology 14799 Chestnut Street, Westminster, California 92683 USA DER Laboratory Research
Page 39 of 147
Additional balanced under-voltage tests in decrements of 1% nominal voltage were
performed to verify at which point do the controls drop out causing the compressor
to be disconnected. Multiple tests suggested that the compressor would consistently
be disconnected between 55% and 56% nominal voltage within 7.8 cycles after the
start of the voltage sag. The following table provides the details of the compressor
disconnection behavior during some these 1% voltage decrement tests.
Under-Voltage Transient Compressor
Volt Range Duration (cyc) Vtrip (%) ttrip (cyc)
60%, 59%, 58%,… 130 56% 7.8
60%, 59%, 58%,… 130 56% 7.8
60%, 59%, 58%,… 130 55% 7.2
60%, 59%, 58%,… 12 55% 7.8
60%, 59%, 58%,… 12 55% 9
60%, 59%, 58%,… 12 55% 9
Table 4.3.2 VFD A/C #2 Balanced Under-voltages in 1% Decrements Results
The results for the unbalanced under-voltages on this VFD A/C unit were consistent
with the balanced under-voltage tests with respect to the line-to-line voltage at the
main terminals. The unit has dropout and tripping behavior when one line drops to
10% or 0% nominal of line-neutral voltage and the other line stays at nominal
voltage. This means that the line-to-line voltage measured across both legs is 55%
or 50% of nominal. Therefore the controls at the PCB that operate the compressor of
this VFD unit must be powered or stepped down using the line-to-line voltage. As
expected based on the balanced under-voltage results, the 3 and 1 cycle duration
unbalanced voltage sags of any magnitude did not cause any dropout/tripping
behavior.
The following figure shows an example of these unbalanced cases (Line 1 under-
voltages for 130 cycles) where the compressor shuts down at 10% nominal line-to-
neutral voltage within the first 7.8 cycles of the voltage sag. The following table
provides the compressor disconnection behavior during unbalanced voltage
transients as observed at the main terminals of the VFD A/C unit, including the

Residential Air Conditioner with VFD Test Report
© Southern California Edison 2015
Advanced Technology 14799 Chestnut Street, Westminster, California 92683 USA DER Laboratory Research
Page 40 of 147
voltage magnitudes where disconnection occurs and how long it takes to disconnect
after the voltage sag is initiated.
Figure 4.3.2 VFD A/C #2 Unbalanced Under-voltage Response (Line 1, 130 cycles)
Under-Voltage Transient Compressor
Lines Volt Range Duration (cyc) Vtrip L-N (%) Vtrip L1-L2 (%) ttrip (cyc)
L1 100%, 90%, 80%,... 0%
130 10% 55% 7.8
6 N/A N/A N/A
3 N/A N/A N/A
1 N/A N/A N/A
L2 100%, 90%, 80%,... 0%
130 10% 55% 7.8
6 0% 50% 5.4
3 N/A N/A N/A
1 N/A N/A N/A
Table 4.3.3 VFD A/C #2 Unbalanced Under-voltage Results

Residential Air Conditioner with VFD Test Report
© Southern California Edison 2015
Advanced Technology 14799 Chestnut Street, Westminster, California 92683 USA DER Laboratory Research
Page 41 of 147
4.4 Balanced & Unbalanced Over-voltages
Multiple voltage swells were performed in 2% increments for up to 120% nominal
voltage within the parameters of the ITIC (CBEMA) curve, a curve developed to
identify the tolerances of voltage sensitive loads. No over-voltage protection was
observed during these tests, only voltage ride-through. The following figure shows a
sample over-voltage test and the following table specifies the tests performed.
Figure 4.4.1 VFD AC #2 Balanced Over-voltage Response (20 cycles)
Over-Voltage Transient Compressor
Lines Volt Range Duration (cyc) Vtrip L-N (%) Vtrip L1-L2 (%) ttrip (cyc)
L1 & L2 100%, 102%, 104%,... 120% 20 N/A N/A N/A
L1 100%, 102%, 104%,... 120% 20 N/A N/A N/A
L2 100%, 102%, 104%,... 120% 20 N/A N/A N/A
Table 4.4.1 VFD A/C #2 Balanced & Unbalanced Over-voltage Results

Residential Air Conditioner with VFD Test Report
© Southern California Edison 2015
Advanced Technology 14799 Chestnut Street, Westminster, California 92683 USA DER Laboratory Research
Page 42 of 147
4.5 Voltage Oscillations
The following figure shows the performance of VFD A/C unit #2 during voltage
oscillations between 100% and 90% nominal voltage for a variety of swing
frequencies or oscillation rates.
Current oscillates in the opposite direction of voltage, up to 11% above nominal, to
minimize any oscillations or deviations in real power for 0.10 Hz and 0.25 Hz
oscillation rates. The current deviations become larger at faster oscillation rates (e.g.
14% above nominal at 2 Hz). As a result, real power remains within +3% of nominal
at 0.10 Hz and 0.25 Hz with larger deviations occurring at faster oscillation rates.
Reactive power also oscillates opposite of voltage, up to +3% above nominal at 0.10
Hz. Similar to current and real power, deviations during oscillation become larger at
higher swing frequencies or faster oscillation rates. Eventually reactive power
deviates up to 16% from nominal for the 2 Hz oscillation test.
Figure 4.5.1 VFD AC #2 Voltage Oscillation Response (0.10, 0.25, 0.70, 1.0, 2.0 Hz)

Residential Air Conditioner with VFD Test Report
© Southern California Edison 2015
Advanced Technology 14799 Chestnut Street, Westminster, California 92683 USA DER Laboratory Research
Page 43 of 147
4.6 Under-frequency Events
After subjecting the VFD A/C unit to multiple under-frequency transients with
different duration times, it is presumed that the unit does not have under-frequency
protection while operating between 60 Hz and 58 Hz. The device simply rides
through these under-frequency conditions. The compressor motor frequency
remains constant due to the VFD and maintains constant current consumption. The
following figure and table identify the magnitude and duration of the frequency
transient tests that were performed on VFD A/C #2.
Figure 4.6.1 VFD A/C #2 Under-frequency Response (130, 12, 3 cycles)
Under-Frequency Transient Compressor
Frequency Range Duration (cyc) Ftrip (Hz) ttrip (cyc)
60Hz, 59.8Hz, 59.6Hz,... 58Hz 130 N/A N/A
60Hz, 59.8Hz, 59.6Hz,... 58Hz 12 N/A N/A
60Hz, 59.8Hz, 59.6Hz,... 58Hz 3 N/A N/A
Table 4.6.1 VFD A/C #2 Under-frequency Test Results

Residential Air Conditioner with VFD Test Report
© Southern California Edison 2015
Advanced Technology 14799 Chestnut Street, Westminster, California 92683 USA DER Laboratory Research
Page 44 of 147
4.7 Over-frequency Events
Similar to the under-frequency tests, the VFD A/C unit was subjected to over-
frequency transients to 62 Hz without triggering any protection. The unit rode
through and continued operating during these frequency conditions. The compressor
motor frequency remains constant from the VFD despite changes in frequency at the
unit’s main terminals. The following figure and table identify the magnitude and
duration of the specific over-frequency tests that were performed on VFD A/C #2.
Figure 4.7.1 VFD A/C #2 Over-frequency Response (130, 12, 3 cycles)
Over-Frequency Transient Compressor
Frequency Range Duration (cyc) Ftrip (Hz) ttrip (cyc)
60Hz, 59.8Hz, 59.6Hz,... 58Hz 130 N/A N/A
60Hz, 59.8Hz, 59.6Hz,... 58Hz 12 N/A N/A
60Hz, 59.8Hz, 59.6Hz,... 58Hz 3 N/A N/A
Table 4.7.1 VFD A/C #2 Over-frequency Test Results

Residential Air Conditioner with VFD Test Report
© Southern California Edison 2015
Advanced Technology 14799 Chestnut Street, Westminster, California 92683 USA DER Laboratory Research
Page 45 of 147
4.8 Frequency Oscillations
The following figure shows the performance of VFD A/C #2 during frequency
oscillations between 59 Hz and 61 Hz for different swing frequencies or oscillation
rates (0.10, 0.25, 0.70, 1.0, and 2.0 Hz).
Although the deviations from nominal become slightly larger for faster oscillation
rates, current and real power measured at the main terminals of the VFD A/C unit
remain relatively constant. Both remain within +3% of their respective steady state
values.
Reactive power oscillates in the opposite direction of voltage and deviations from
nominal increase at faster oscillation rates. Reactive power consumption remains
within +14% of nominal.
Figure 4.8.1 VFD A/C #2 Frequency Oscillation Response (0.10, 0.25, 0.70, 1.0, 2.0 Hz)

Residential Air Conditioner with VFD Test Report
© Southern California Edison 2015
Advanced Technology 14799 Chestnut Street, Westminster, California 92683 USA DER Laboratory Research
Page 46 of 147
4.9 Voltage Ramps
Voltage was ramped down and back up multiple times in 10% decrements until the
VFD A/C unit tripped while ramping down to 50% nominal voltage. Accordingly, the
following figure shows the load performance at different voltage levels during
continuous operation (down to 60% nominal voltage).
Current ramps up to approximately 60% above nominal in response to the voltage
ramp. Real power consumption decreases, deviating by 13% below steady state for
the 8 second ramp test and below by 16% for the 2 second ramp test. Reactive
power increases during the voltage ramp, up to 14% above steady state for the 8
second ramp test and 24% above steady state for the 2 second ramp test.
Figure 4.9.1 VFD A/C #2 Voltage Ramp Down to 60% (2 & 8 sec.)

Residential Air Conditioner with VFD Test Report
© Southern California Edison 2015
Advanced Technology 14799 Chestnut Street, Westminster, California 92683 USA DER Laboratory Research
Page 47 of 147
Voltage was ramped up to 110% and back down steady state voltage at different
ramp rates to demonstrate the load performance while operating at over-voltage
values.
Current is observed ramping down to nearly 10% below nominal in response to the
voltage ramp. Real power consumption increases slightly, up to 4% above steady
state for the 8 second ramp test and up to 6% above steady state for the 2 second
ramp test. Reactive power decreases with current, deviating by 4% below nominal
during the 8 second ramp test and by 9% below nominal during the 2 second ramp
test.
Figure 4.9.2 VFD A/C #2 Voltage Ramp Up to 110% (in 2 & 8 sec.)

Residential Air Conditioner with VFD Test Report
© Southern California Edison 2015
Advanced Technology 14799 Chestnut Street, Westminster, California 92683 USA DER Laboratory Research
Page 48 of 147
4.10 Frequency Ramps
Frequency was ramped down to 50 Hz and back up to 60 Hz at different ramp rates
to demonstrate the load performance while operating at lower frequency values as
shown in the figure below.
The VFD does a good job maintaining constant speed on the compressor motor and
holding real power consumption constant. Current slowly increases until it begins
plateauing at approximately 12% above nominal as frequency falls below 54 Hz.
Real power consumption remains constant throughout the entire under-frequency
ramp (within +3%). Reactive power experiences a dramatic increase as frequency
begins ramping down and then the rate of change in reactive power consumption
decreases at lower frequency values. Reactive power peaks at approximately 70%
above nominal.
Figure 4.10.1 VFD A/C #2 Frequency Ramp Down to 50 Hz (in 2 & 8 sec.)

Residential Air Conditioner with VFD Test Report
© Southern California Edison 2015
Advanced Technology 14799 Chestnut Street, Westminster, California 92683 USA DER Laboratory Research
Page 49 of 147
Frequency was ramped up to 70 Hz and back down to 60 Hz at different ramp rates
to demonstrate the load performance while operating at higher frequency values as
shown in the figure below.
Similarly, the VFD maintains the speed and real power consumption of the
compressor motor. Current and real power experience some deviation during the
frequency ramp test, but remain within +6% of their nominal values. Reactive power
begins decreasing until reaching approximately 13% below nominal when the device
is operating at 65 Hz. Reactive power then increases until reaching 7% below
nominal at 70 Hz. Finally, the reactive power consumption follows this same
behavior as frequency ramps back down to nominal.
Figure 4.10.2 VFD A/C #2 Frequency Ramp Up to 70 Hz (in 2 & 8 sec.)

Residential Air Conditioner with VFD Test Report
© Southern California Edison 2015
Advanced Technology 14799 Chestnut Street, Westminster, California 92683 USA DER Laboratory Research
Page 50 of 147
4.11 Harmonics Contribution
Steady state voltage and current sinusoidal waveform data was captured multiple
times without scope filters to calculate the actual harmonic contribution of VFD A/C
unit #2 to the grid. The total harmonic distortion of current was significant and
calculated to be just above 39% of the fundamental. The total harmonic distortion is
not surprising based the distortion of current waveform seen in Figure 4.0.1. The
following table gives the total harmonic distortion calculations and the figure plots the
individual harmonic values.
Data Set #
THD (% of Fundamental)
V(L1-L2) I(L1) I(L2)
1 0.48 38.99 39.05
2 0.47 39.07 39.13
3 0.45 39.05 39.11
Table 4.11.1 VFD A/C #2 Total Harmonic Distortion
Figure 4.11.1 VFD A/C #2 Harmonics Contribution

Residential Air Conditioner with VFD Test Report
© Southern California Edison 2015
Advanced Technology 14799 Chestnut Street, Westminster, California 92683 USA DER Laboratory Research
Page 51 of 147
4.12 Conservation Voltage Reduction
Voltage was decreased by 1% nominal voltage in 5 second intervals down to 90%
before recovering back to steady state as shown in the figure below.
CVR will have little to no effect on real power consumption for this specific VFD A/C
unit based on the following results. Current increases by approximately 1.1% of
nominal current for every 1% decrease in nominal voltage. Real power remains
relatively close to steady state over the course of the CVR test.
Figure 4.12.1 VFD A/C #2 CVR Response Down to 90% Voltage

Residential Air Conditioner with VFD Test Report
© Southern California Edison 2015
Advanced Technology 14799 Chestnut Street, Westminster, California 92683 USA DER Laboratory Research
Page 52 of 147
Alternatively, the main terminal voltage at the VFD A/C unit was increased by 1%
nominal voltage in 5 second intervals up to 105% before stepping back to steady
state as shown in the figure below.
CVR does not have a significant impact on the VFD controlled load. Current
decreases by approximately 0.8% of its nominal value for every 1% increase in
nominal voltage. Therefore real power remains relatively close to steady state
consumption.
Figure 4.12.2 VFD A/C #2 CVR Response Up to 105% Voltage

Residential Air Conditioner with VFD Test Report
© Southern California Edison 2015
Advanced Technology 14799 Chestnut Street, Westminster, California 92683 USA DER Laboratory Research
Page 53 of 147
5.0 VFD AIR CONDITIONER #3 TEST RESULTS
The figure below shows a snapshot of VFD A/C unit #3 sinusoidal voltages and currents
captured at the main terminals and compressor motor using a filter on the digital scope. Notice
the distortion in the main current waveforms compared to voltage waveforms. The compressor
is shown operating at approximately 300 Volts peak, 3.8 Amps peak, and 227 Hz at the
present loading condition. The specifications for the VFD A/C #3 components are provided in
the table below.
Figure 5.0.1 VFD A/C #3 Voltage and Current Waveforms
Manufacturer Lennox
Voltage (V) 230
Refrig. R-410A
SEER 18
Compressor, Model # Mitsubishi SNB150FGAMC
Compressor, RLA (Amps) 11.04
Compressor, LRA (Amps) -
Outdoor Fan Motor, FLA (Amps) 1.10
Indoor Fan Motor, FLA (Amps) 0.24
Design Pressure High (PSI) 550
Design Pressure Low (PSI) 240
Table 5.0.1 VFD A/C #3 Specifications
Residential Air Conditioner with VFD Test Report
© Southern California Edison 2015
Advanced Technology 14799 Chestnut Street, Westminster, California 92683 USA DER Laboratory Research
Page 54 of 147
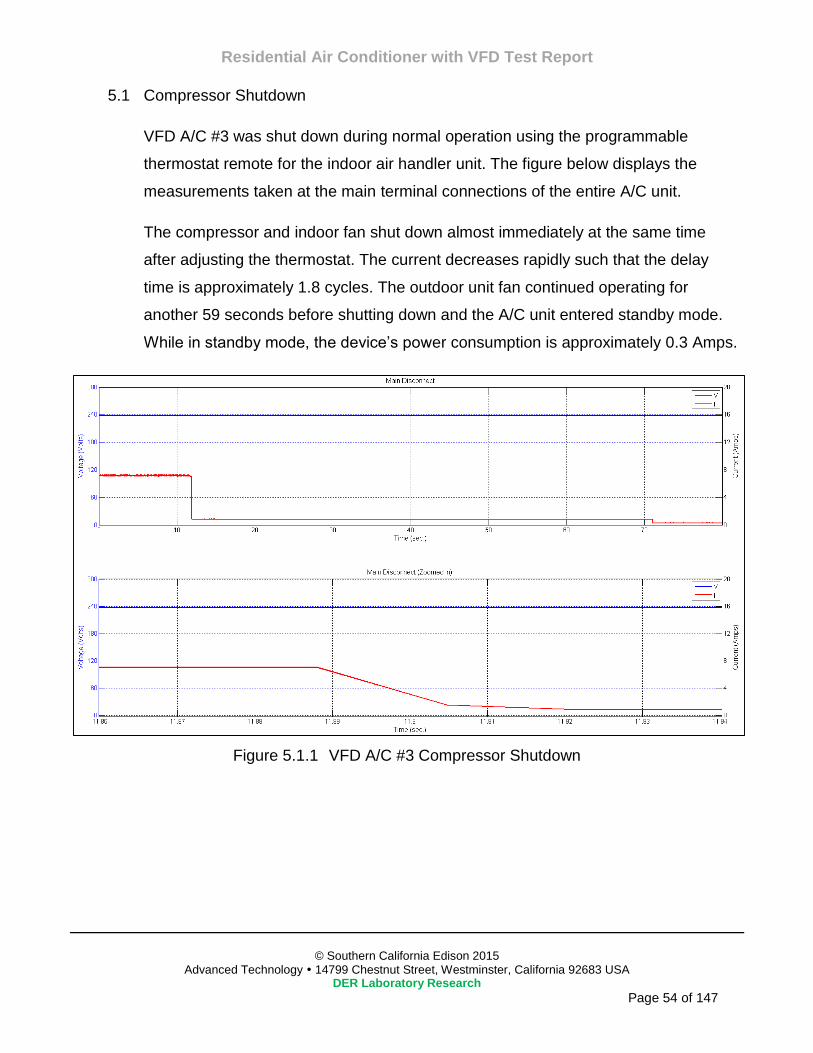
5.1 Compressor Shutdown
VFD A/C #3 was shut down during normal operation using the programmable
thermostat remote for the indoor air handler unit. The figure below displays the
measurements taken at the main terminal connections of the entire A/C unit.
The compressor and indoor fan shut down almost immediately at the same time
after adjusting the thermostat. The current decreases rapidly such that the delay
time is approximately 1.8 cycles. The outdoor unit fan continued operating for
another 59 seconds before shutting down and the A/C unit entered standby mode.
While in standby mode, the device’s power consumption is approximately 0.3 Amps.
Figure 5.1.1 VFD A/C #3 Compressor Shutdown

Residential Air Conditioner with VFD Test Report
© Southern California Edison 2015
Advanced Technology 14799 Chestnut Street, Westminster, California 92683 USA DER Laboratory Research
Page 55 of 147
5.2 Inrush Current
After starting up the VFD A/C unit via the programmable thermostat remote, there
appears to be two successive inrush currents. The first inrush value peaks at 1.4
Amps for a duration of 3 cycles and the second peaks at 7.6 Amps before decaying
over approximately 9 cycles. This is followed by the compressor slowly ramping up
over the course of roughly 50 seconds until the unit is drawing 2.5 Amps. The VFD
compressor will increase in intervals over the course of several minutes to meet
temperature demand until the unit is more heavily loaded. The room temperature
was approximately 77 degrees Fahrenheit and the unit would typically operate near
6 to 7.1 Amps steady state.
Figure 5.2.1 VFD A/C #3 Inrush Current

Residential Air Conditioner with VFD Test Report
© Southern California Edison 2015
Advanced Technology 14799 Chestnut Street, Westminster, California 92683 USA DER Laboratory Research
Page 56 of 147
5.3 Balanced & Unbalanced Under-voltages
After performing under-voltages on VFD A/C #3 in decrements of 10%, the
compressor is observed typically disconnecting at either 50% or 60% nominal
voltage for voltage sags with a duration of 6 to 130 cycles. The 3 cycle tests were
not as consistent as others displaying tripping behavior at various voltage
magnitudes and the 1 cycle tests were much more consistent, resulting in tripping at
30% nominal voltage.
As shown in Table 5.3.1 every time the compressor was disconnected, it occurred
as voltage was recovering from a sag or up to 1.2 cycles after voltage already
recovered. A theory is that this tripping behavior may be caused by increasing inrush
currents observed at the end of each voltage sag. Another, less likely, possibility is
that the logic in the controller PCB is preventing load disconnection until voltage
returns to nominal. None of the voltage sags resulted in voltage ride through for all
magnitudes down to 0% voltage and no stalling behavior was observed during any
of these tests.
Data captured several seconds after the disconnection of the compressors did not
reveal restarting behavior and therefore reclose times were not captured. This
indicates that there must be a protective relay and associated delay times
programmed into the local controller of the VFD A/C unit to prevent immediate
restarting. The compressor would only restart several minutes after tripping
occurred.
The following figure visually displays one of these balanced tests where the under-
voltage sags have a duration time of 130 cycles. The compressor is observed being
disconnected immediately after voltage recovers from a 50% voltage sag. The
following table provides additional details regarding the compressor operation during
the various balanced under-voltage transient tests including the voltage where the
unit was tripped (Vtrip) as well as the time it took for the unit controls to trip it offline
(ttrip), measuring from the start of the voltage sag.

Residential Air Conditioner with VFD Test Report
© Southern California Edison 2015
Advanced Technology 14799 Chestnut Street, Westminster, California 92683 USA DER Laboratory Research
Page 57 of 147
Figure 5.3.1 VFD A/C #3 Balanced Under-voltage Response (130 cycles)
Under-Voltage Transient Compressor
Volt Range Duration (cyc) Vtrip (%) ttrip (cyc)
100%, 90%, 80%,... 0% 130
50% 130.8
50% 130.8
50% 130.8
100%, 90%, 80%,... 0% 12
60% 13.2
50% 13.2
50% 13.2
100%, 90%, 80%,... 0% 9
60% 10.2
50% 9
60% 9.6
100%, 90%, 80%,... 0% 6
50% 7.2
60% 6.6
60% 6.8
100%, 90%, 80%,... 0% 3
60% 3.2
40% 3.6
50% 4
100%, 90%, 80%,... 0% 1
30% 1.8
30% 1.8
30% 1.8
Table 5.3.1 VFD A/C #3 Balanced Under-voltages in 10% Decrements Results

Residential Air Conditioner with VFD Test Report
© Southern California Edison 2015
Advanced Technology 14799 Chestnut Street, Westminster, California 92683 USA DER Laboratory Research
Page 58 of 147
Identifying the specific voltage where the compressors are disconnected and/or the
controls dropped out requires additional balanced under-voltage tests in decrements
of 1% nominal voltage. Several tests with duration times from 3 to 130 cycles
revealed that the compressor could begin tripping off for voltage sags between 59%
and 58% nominal voltage and again occurred after voltage already recovered, likely
due to the inrush current at the end of the voltage sag or possibly the logic of the
controller PCB on the outdoor unit. Switching transients (represented using 1 cycle)
showed tripping at 23% nominal voltage after voltage recovers. The following table
provides the details of the compressor disconnection behavior during each of these
1% voltage decrement tests.
Under-Voltage Transient Compressor
Volt Range Duration (cyc) Vtrip (%) ttrip (cyc)
60%, 59%, 58%, … 130 58% 130.8
60%, 59%, 58%, … 12 58% 12.6
60%, 59%, 58%, … 3 59% 4.2
60%, 59%, 58%, … 1 23% 1.8
Table 5.3.2 VFD A/C #3 Balanced Under-voltages in 1% Decrements Results
Unlike other units, VFD A/C #3 compressor trip voltages and trip times for
unbalanced under-voltage tests were not as consistent with their balanced under-
voltage counterparts. There are several cases where the unit trips off at either 20%
or 0% line-to-neutral on one line, which means the line-to-line values are 60% or
50% nominal voltage which is where tripping occurred for balanced conditions.
However there are other cases where the unit appears more sensitive to tripping at
slightly higher voltages (30% line-to-neutral or 65% line-to-line nominal voltage). The
switching transients or 1 cycle voltage sags, rode through all unbalanced under-
voltages as expected since the lowest voltage magnitude possible is 50% line-to-line
nominal voltage during these unbalanced tests.
The following figure shows an example of these unbalanced cases (Line 2 under-
voltages for 130 cycles) where the compressor shut down at 30% line-to-neutral
nominal voltage just as the voltage sag is recovering. The following table provides

Residential Air Conditioner with VFD Test Report
© Southern California Edison 2015
Advanced Technology 14799 Chestnut Street, Westminster, California 92683 USA DER Laboratory Research
Page 59 of 147
the compressor disconnection behavior during unbalanced voltage transients
observed at the main terminals of the VFD A/C unit. Similar to the balanced under-
voltage tests, unbalanced voltage tests also result in the compressor disconnecting
at the very end of the voltage sag or up to 1.8 cycles after voltage has already
recovered to steady state.
Figure 5.3.2 VFD A/C #3 Unbalanced Under-voltage Response (Line 2, 130 cycles)
Under-Voltage Transient Compressor
Lines Volt Range Duration (cyc) Vtrip L-N (%) Vtrip L1-L2 (%) ttrip (cyc)
L1 100%, 90%, 80%,... 0%
130 30% 65% 131.8
12 0% 50% 13.2
6 20% 60% 6.6
3 30% 65% 4.2
1 N/A N/A N/A
L2 100%, 90%, 80%,... 0%
130 30% 65% 129.6
12 20% 60% 13.2
6 30% 65% 7.2
3 0% 50% 4.2
1 N/A N/A N/A
Table 5.3.3 VFD A/C #3 Unbalanced Under-voltage Results

Residential Air Conditioner with VFD Test Report
© Southern California Edison 2015
Advanced Technology 14799 Chestnut Street, Westminster, California 92683 USA DER Laboratory Research
Page 60 of 147
5.4 Balanced & Unbalanced Over-voltages
VFD A/C #3 was subjected to balanced and unbalanced over-voltages within the
parameters of the ITIC (CBEMA) curve. These included multiple voltage swells
performed in 2% increments for up to 120% nominal voltage to identify any tripping
behavior. During balanced conditions, the VFD A/C unit tripped at 112% nominal
voltage in the first 1.2 cycles of the voltage swell and tripped at 118% nominal
voltage after 0.6 cycles of the voltage swell. However the unit did ride through all of
the unbalanced over-voltage transients while operating normally.
Figure 5.4.1 VFD AC #3 Balanced Over-voltage Response (20 cycles)
Lines Volt Range Duration (cyc) Vtrip L-N (%) Vtrip L1-L2 (%) ttrip (cyc)
L1 & L2 100%, 102%, 104%,... 120%
20 112% 112% 1.2
3 112% 112% 1.2
1 118% 118% 0.6
L1 100%, 102%, 104%,... 120% 20 N/A N/A N/A
L2 100%, 102%, 104%,... 120% 20 N/A N/A N/A
Table 5.4.1 VFD A/C #3 Balanced & Unbalanced Over-voltage Results

Residential Air Conditioner with VFD Test Report
© Southern California Edison 2015
Advanced Technology 14799 Chestnut Street, Westminster, California 92683 USA DER Laboratory Research
Page 61 of 147
5.5 Voltage Oscillations
The following figure shows the performance of VFD A/C #3 during voltage
oscillations between 100% and 90% nominal voltage for a variety of swing
frequencies or oscillation rates.
Current oscillates in the opposite direction of voltage, up to 10% above nominal, to
minimize any oscillations or deviations in real power. The consumption of real power
remains relatively constant, within 3% of nominal, due the rapid change in current
and the VFD drive is attempting to keep the motor speed constant. This near
constant power response holds true for all voltage oscillations from 0.25 Hz to 2 Hz.
Reactive power consumption is very low since the power factor is greater than 0.99
for the device. Therefore any minor change in reactive load, even during steady
state, results in drastic changes to the per unit values. As a result, reactive power
was not included in the figure below.
Figure 5.5.1 VFD AC #3 Voltage Oscillation Response (0.10, 0.25, 0.70, 1.0, 2.0 Hz)

Residential Air Conditioner with VFD Test Report
© Southern California Edison 2015
Advanced Technology 14799 Chestnut Street, Westminster, California 92683 USA DER Laboratory Research
Page 62 of 147
5.6 Under-frequency Events
After subjecting VFD A/C #3 to multiple under-frequency transients with different
duration times, it is presumed that the unit does not have under-frequency protection
while operating between 60 Hz and 58 Hz. The device simply rides through these
under-frequency conditions. Current remains constant suggesting that the VFD is
keeping the motor frequency constant. The following figure and table identify the
magnitude and duration of the frequency transient tests that were performed.
Figure 5.6.1 VFD A/C #3 Under-frequency Response (130, 12, 3 cycles)
Under-Frequency Transient Compressor
Frequency Range Duration (cyc) Ftrip (Hz) ttrip (cyc)
60Hz, 59.8Hz, 59.6Hz,... 58Hz 130 N/A N/A
60Hz, 59.8Hz, 59.6Hz,... 58Hz 12 N/A N/A
60Hz, 59.8Hz, 59.6Hz,... 58Hz 3 N/A N/A
Table 5.6.1 VFD A/C #3 Under-frequency Test Results

Residential Air Conditioner with VFD Test Report
© Southern California Edison 2015
Advanced Technology 14799 Chestnut Street, Westminster, California 92683 USA DER Laboratory Research
Page 63 of 147
5.7 Over-frequency Events
Similar to the under-frequency tests, VFD A/C #3 was subjected to over-frequency
transients to 62 Hz without triggering any protection. The unit rode through and
continued operating during these frequency conditions. The compressor motor
frequency remains constant from the VFD despite changes in frequency at the unit’s
main terminals. The following figure and table identify the magnitude and duration of
the specific over-frequency tests that were performed.
Figure 5.7.1 VFD A/C #3 Over-frequency Response (130, 12, 3 cycles)
Over-Frequency Transient Compressor
Frequency Range Duration (cyc) Ftrip (Hz) ttrip (cyc)
60Hz, 59.8Hz, 59.6Hz,... 58Hz 130 N/A N/A
60Hz, 59.8Hz, 59.6Hz,... 58Hz 12 N/A N/A
60Hz, 59.8Hz, 59.6Hz,... 58Hz 3 N/A N/A
Table 5.7.1 VFD A/C #3 Over-frequency Test Results

Residential Air Conditioner with VFD Test Report
© Southern California Edison 2015
Advanced Technology 14799 Chestnut Street, Westminster, California 92683 USA DER Laboratory Research
Page 64 of 147
5.8 Frequency Oscillations
The following figure shows the performance of VFD A/C #3 during frequency
oscillations between 59 Hz and 61 Hz for different swing frequencies or oscillation
rates (0.10, 0.25, 0.70, 1.0, and 2.0 Hz).
The response of the load suggests that the VFD is effectively maintaining frequency
at the compressor motor. The main current does not oscillate or deviate in response
to frequency oscillations at the main terminals of the A/C unit. The active power
consumption remains constant, within +1% of its steady state value along with
current for all swing frequencies.
Reactive power was not included in the figure below because of its low consumption
(power factor is greater than 0.99). Even minor deviations that naturally occur during
steady state result in harsh changes to the per unit values plotted.
Figure 5.8.1 VFD A/C #3 Frequency Oscillation Response (0.10, 0.25, 0.70, 1.0, 2.0 Hz)

Residential Air Conditioner with VFD Test Report
© Southern California Edison 2015
Advanced Technology 14799 Chestnut Street, Westminster, California 92683 USA DER Laboratory Research
Page 65 of 147
5.9 Voltage Ramps
Voltage was ramped down and back up multiple times in 10% decrements until the
A/C unit tripped while ramping down to 50% nominal voltage. Accordingly, the
following figure shows the load performance at different voltage levels during
continuous operation (down to 60% nominal voltage).
The VFD is attempting to maintain a constant speed at the compressor motor.
Current ramps up to approximately 53% above nominal while voltage ramps down to
40% below nominal. Real power consumption is steadily reduced to as low as 8%
below nominal for both ramp tests. Reactive power consumption is low due to the
large power factor, but it ramps down to nearly 0% of its nominal value.
Figure 5.9.1 VFD A/C #3 Voltage Ramp Down to 60% (2 & 8 sec.)

Residential Air Conditioner with VFD Test Report
© Southern California Edison 2015
Advanced Technology 14799 Chestnut Street, Westminster, California 92683 USA DER Laboratory Research
Page 66 of 147
Voltage was ramped up to 110% and back down steady state voltage at different
ramp rates to demonstrate the load performance while operating at over-voltage
values.
Current and real power appear to oscillate during this test due the changing shape of
the current sinusoidal waveform towards the peak of the voltage ramp. Current is
slowly reduced down to nearly 6% below nominal for the 2 second ramp test and 8%
below nominal for the 8 second ramp test in response to voltage. Real power
consumption steadily increases to approximately 5% above steady state. Little
reactive power is consumed during normal operation and therefore was not plotted.
Figure 5.9.2 VFD A/C #3 Voltage Ramp Up to 110% (in 2 & 8 sec.)

Residential Air Conditioner with VFD Test Report
© Southern California Edison 2015
Advanced Technology 14799 Chestnut Street, Westminster, California 92683 USA DER Laboratory Research
Page 67 of 147
5.10 Frequency Ramps
Frequency was ramped down to 50 Hz and back up to 60 Hz at different ramp rates
to demonstrate the load performance while operating at lower frequency values as
shown in the figure below.
Current and real power remain relatively constant throughout the entire under-
frequency ramp, but there is a slight reduction in consumption by approximately 4%
of nominal. Overall, the VFD helps the compressor motor maintain frequency and
constant current. Reactive power does not follow a linear response in relation to
frequency, but does deviate as low as 20% below steady state.
Figure 5.10.1 VFD A/C #3 Frequency Ramp Down to 50 Hz (in 2 & 8 sec.)

Residential Air Conditioner with VFD Test Report
© Southern California Edison 2015
Advanced Technology 14799 Chestnut Street, Westminster, California 92683 USA DER Laboratory Research
Page 68 of 147
Frequency was ramped up to 70 Hz and back down to 60 Hz at different ramp rates
to demonstrate the load performance while operating at higher frequency values as
shown in the figure below.
Current and real power remain relatively constant throughout the entire over-
frequency ramp, but there is a slight increase in consumption by approximately 4%
of nominal. Reactive power consumption for the unit is already low due to a large
power factor and the response to frequency is not consistent. Reactive power is
reduced by 16% below steady state during the 2 second ramp test and slightly
increases to 8% above steady state during the 8 second ramp test.
Figure 5.10.2 VFD A/C #3 Frequency Ramp Up to 70 Hz (in 2 & 8 sec.)

Residential Air Conditioner with VFD Test Report
© Southern California Edison 2015
Advanced Technology 14799 Chestnut Street, Westminster, California 92683 USA DER Laboratory Research
Page 69 of 147
5.11 Harmonics Contribution
Steady state voltage and current sinusoidal waveform data was captured multiple
times without scope filters to calculate the actual harmonic contribution of VFD A/C
unit #3 to the grid. The maximum total harmonic distortion of current was found to be
just above 29.43% of the fundamental. The following table gives the total harmonic
distortion calculations and the figure plots the individual harmonic values.
Data Set #
THD (% of Fundamental)
V(L1-L2) I(L1) I(L2)
1 0.36 27.68 27.71
2 0.37 29.40 29.43
3 0.38 28.25 28.28
Table 5.11.1 VFD A/C #3 Total Harmonic Distortion
Figure 5.11.1 VFD A/C #3 Harmonics Contribution

Residential Air Conditioner with VFD Test Report
© Southern California Edison 2015
Advanced Technology 14799 Chestnut Street, Westminster, California 92683 USA DER Laboratory Research
Page 70 of 147
5.12 Conservation Voltage Reduction
Voltage was decreased by 1% nominal voltage in 5 second intervals down to 90%
before recovering back to steady state as shown in the figure below.
CVR would not be effective since it has little impact on the real power consumption
of the VFD A/C unit. Current increases by approximately 0.9% of nominal current for
every 1% decrease in nominal voltage over the course of the CVR test. This results
in nearly constant real power, within +3% of normal consumption. Reactive power
decreases with voltage, but consumption is very low and difficult to plot in per unit
values with the other electrical measurements.
Figure 5.12.1 VFD A/C #3 CVR Response Down to 90% Voltage

Residential Air Conditioner with VFD Test Report
© Southern California Edison 2015
Advanced Technology 14799 Chestnut Street, Westminster, California 92683 USA DER Laboratory Research
Page 71 of 147
Alternatively, the main terminal voltage at the VFD A/C unit was increased by 1%
nominal voltage in 5 second intervals up to 105% before stepping back to steady
state as shown in the figure below.
Current decreases by approximately 0.8% of its nominal value for every 1% increase
in nominal voltage. Therefore real power remains near steady state consumption,
with +2% of nominal. Reactive power does increase with voltage, but again is a very
low value relative to the other measurements.
Figure 5.12.2 VFD A/C #3 CVR Response Up to 105% Voltage

Residential Air Conditioner with VFD Test Report
© Southern California Edison 2015
Advanced Technology 14799 Chestnut Street, Westminster, California 92683 USA DER Laboratory Research
Page 72 of 147
6.0 VFD AIR CONDITIONER #4 TEST RESULTS
The figure below shows a snapshot of VFD A/C unit #4 sinusoidal voltages and currents
captured at the main terminals and compressor motor using a filter on the digital scope. Notice
the slight distortion in the main currents waveforms. The compressor motor is seen operating
at approximately 210 Volts peak, 5.5 Amps peak, and 133 Hz at this particular loading
condition. The specifications for the VFD A/C #4 components are provided in the table below.
Figure 6.0.1 VFD A/C #4 Voltage and Current Waveforms
Manufacturer Goodman
Voltage (V) 230
Refrig. R-410A
SEER 15
Compressor, Model # GMCC DA150S1C-20FZ
Compressor, RLA (Amps) 11.5
Compressor, LRA (Amps) -
Outdoor Fan Motor, FLA (Amps) 0.6
Indoor Fan Motor, FLA (Amps) 0.4
Design Pressure High (PSI) 550
Design Pressure Low (PSI) 340
Table 6.0.1 VFD A/C #4 Specifications

Residential Air Conditioner with VFD Test Report
© Southern California Edison 2015
Advanced Technology 14799 Chestnut Street, Westminster, California 92683 USA DER Laboratory Research
Page 73 of 147
6.1 Compressor Shutdown
VFD A/C #4 was shut down during normal operation using the programmable
thermostat remote for the indoor blower unit. The figure below displays the
measurements taken at the main terminal connections of the entire A/C unit.
The indoor unit shuts down after adjusting the thermostat followed by the
compressor shutting down 1 second later. The delay time for compressor current to
ramp down is short, within 9 cycles. However, the outdoor unit fan continued
operating for another 29.3 seconds before shutting down. While in standby mode,
the device’s power consumption is less than 0.3 Amps.
Figure 6.1.1 VFD A/C #4 Compressor Shutdown

Residential Air Conditioner with VFD Test Report
© Southern California Edison 2015
Advanced Technology 14799 Chestnut Street, Westminster, California 92683 USA DER Laboratory Research
Page 74 of 147
6.2 Inrush Current
After starting up the VFD A/C unit via the programmable thermostat remote, the
device does not display any sign of significant inrush current. The unit slowly ramps
up over the course of nearly 45 seconds until the unit is drawing a minimum of 4.5
Amps. The VFD compressor will increase in intervals over the course of several
minutes to meet temperature demand until the unit is more heavily loaded. The room
temperature was approximately 77 degrees Fahrenheit and the unit would typically
operate between 5.6 and 6.1 Amps steady state.
Figure 6.2.1 VFD A/C #4 Inrush Current

Residential Air Conditioner with VFD Test Report
© Southern California Edison 2015
Advanced Technology 14799 Chestnut Street, Westminster, California 92683 USA DER Laboratory Research
Page 75 of 147
6.3 Balanced & Unbalanced Under-voltages
VFD A/C #4 was subjected to a series of balanced under-voltage sags in
decrements of 10% to identify the conditions required to cause device dropout and
tripping behavior. The unit consistently disconnected the compressor at 70%
nominal voltage for longer sags with a duration of 130 cycles. Shorter voltage sags
with a duration of 12 cycles resulted in the compressor being tripped at either 50%
or 40% nominal voltage. This VFD A/C unit, as shown in Table 6.3.1, would always
disconnect either towards the very end of the voltage sag or within 2 cycles after
voltage recovered. This may be due to the spike in current observed at the end of
each voltage sag or possibly logic on the controller PCB to preventing load
disconnection until voltage is near nominal.
Although data points were captured several seconds after the compressors were
disconnected, no restarting behavior was observed and therefore reclose times were
not captured. This indicates that there must be a protective relay and associated
delay times programmed into the local controller of the VFD A/C unit to prevent
immediate restarting. The compressor was only observed restarting several minutes
after tripping occurred. No stalling behavior was observed at any time during the
transients or after the compressor restarted.
Any voltage sags with a duration less than 6 cycles did not cause the compressor to
disconnect, allowing ride through for all voltage magnitudes (down to 0% voltage).
“N/A” or “not applicable” represents these ride through situations where there is no
trip voltage or trip time available in the following tables.
The following figure visually displays one of the balanced tests where the under-
voltage sags have a duration time of 130 cycles. The figure reveals that the
compressor began slowing down and was eventually disconnected at 70% voltage
towards the end of the 130 cycle voltage sag. The following table provides the
voltage magnitude (Vtrip) where the compressor shut down and time (ttrip) taken after
the under-voltage was initiated for the A/C unit’s controls to dropout resulting in the
compressor tripping off.

Residential Air Conditioner with VFD Test Report
© Southern California Edison 2015
Advanced Technology 14799 Chestnut Street, Westminster, California 92683 USA DER Laboratory Research
Page 76 of 147
Figure 6.3.1 VFD A/C #4 Balanced Under-voltage Response (130 cycles)
Under-Voltage Transient Compressor
Volt Range Duration (cyc) Vtrip (%) ttrip (cyc)
100%, 90%, 80%,... 0% 130
70% 130
70% 130.2
70% 130.1
100%, 90%, 80%,... 0% 12
40% 11.9
50% 12.1
40% 12.1
100%, 90%, 80%,... 0% 9
0% 10.8
10% 10.8
0% 9.6
100%, 90%, 80%,... 0% 6
N/A N/A
N/A N/A
N/A N/A
100%, 90%, 80%,... 0% 3
N/A N/A
N/A N/A
N/A N/A
100%, 90%, 80%,... 0% 1
N/A N/A
N/A N/A
N/A N/A
Table 6.3.1 VFD A/C #4 Balanced Under-voltages in 10% Decrements Results

Residential Air Conditioner with VFD Test Report
© Southern California Edison 2015
Advanced Technology 14799 Chestnut Street, Westminster, California 92683 USA DER Laboratory Research
Page 77 of 147
Additional balanced under-voltage tests in decrements of 1% nominal voltage were
performed to verify where the controls drop out and result in the compressor being
disconnected. The tests suggested that the compressor would consistently be
disconnected at 69% nominal and 49% nominal voltage after voltage recovers from
the 130 cycle and 12 cycle voltage sags. This may be the result of the inrush current
as voltage steps up or even the controller PCB. The following table provides the
details of the compressor disconnection behavior during some these 1% voltage
decrement tests.
Under-Voltage Transient Compressor
Volt Range Duration (cyc) Vtrip (%) ttrip (cyc)
70%, 69%, 68%,… 130 69% 130.1
70%, 69%, 68%,… 130 69% 130.2
60%, 59%, 58%,… 12 49% 12.9
60%, 59%, 58%,… 12 49% 12.9
Table 6.3.2 VFD A/C #4 Balanced Under-voltages in 1% Decrements Results
The unbalanced under-voltages on VFD A/C #4 unit remained consistent with the
balanced under-voltage tests with respect to the line-to-line voltage at the main
terminals. The unit has dropout and tripping behavior at 40% nominal of the line-
neutral voltage with the line-to-line voltage at 70% of nominal. Therefore the voltage
at the PCB that operates the controls for the compressor must be supplied by the
line-to-line voltage. Since the lowest line-to-line voltage from an unbalanced test is
50% of nominal, unbalanced voltage sags with a duration less than 12 cycles did not
cause any dropout/tripping behavior.
The following figure shows an example of these unbalanced cases (Line 1 under-
voltages for 130 cycles) where the compressor shut down at 40% nominal line-to-
neutral voltage as the voltage sag is recovering. The following table provides the
compressor disconnection behavior during unbalanced voltage transients as
observed at the main terminals of the VFD A/C unit, including the voltage
magnitudes where disconnection occurs and how long it takes to disconnect after
the voltage sag begins.

Residential Air Conditioner with VFD Test Report
© Southern California Edison 2015
Advanced Technology 14799 Chestnut Street, Westminster, California 92683 USA DER Laboratory Research
Page 78 of 147
Figure 6.3.2 VFD A/C #4 Unbalanced Under-voltage Response (Line 1, 130 cycles)
Under-Voltage Transient Compressor
Lines Volt Range Duration (cyc) Vtrip L-N (%) Vtrip L1-L2 (%) ttrip (cyc)
L1 100%, 90%, 80%,... 0%
130 40% 70% 130.8
12 N/A N/A N/A
6 N/A N/A N/A
3 N/A N/A N/A
1 N/A N/A N/A
L2 100%, 90%, 80%,... 0%
130 40% 70% 130.8
12 N/A N/A N/A
6 N/A N/A N/A
3 N/A N/A N/A
1 N/A N/A N/A
Table 6.3.3 VFD A/C #4 Unbalanced Under-voltage Results

Residential Air Conditioner with VFD Test Report
© Southern California Edison 2015
Advanced Technology 14799 Chestnut Street, Westminster, California 92683 USA DER Laboratory Research
Page 79 of 147
6.4 Balanced & Unbalanced Over-voltages
The VFD A/C unit was subjected to balanced and unbalanced over-voltages
performed in 2% increments for up to 120% nominal voltage within the parameters
of the ITIC (CBEMA) curve, a voltage tolerance curve, to avoid device damage. No
over-voltage protection was observed during any of these tests, only voltage ride-
through. The following figure shows a sample over-voltage test and the following
table specifies the types of tests performed.
Figure 6.4.1 VFD AC #4 Balanced Over-voltage Response (20 cycles)
Over-Voltage Transient Compressor
Lines Volt Range Duration (cyc) Vtrip L-N (%) Vtrip L1-L2 (%) ttrip (cyc)
L1 & L2 100%, 102%, 104%,... 120% 20 N/A N/A N/A
L1 100%, 102%, 104%,... 120% 20 N/A N/A N/A
L2 100%, 102%, 104%,... 120% 20 N/A N/A N/A
Table 6.4.1 VFD A/C #4 Balanced & Unbalanced Over-voltage Results

Residential Air Conditioner with VFD Test Report
© Southern California Edison 2015
Advanced Technology 14799 Chestnut Street, Westminster, California 92683 USA DER Laboratory Research
Page 80 of 147
6.5 Voltage Oscillations
The following figure shows the performance of VFD A/C unit #4 during voltage
oscillations between 100% and 90% nominal voltage for a variety of swing
frequencies or oscillation rates.
Current oscillates in the opposite direction of voltage, up to 10% above nominal, for
oscillation rates between 0.10 Hz and 0.25 Hz. In response to current, the real
power deviates within +4% of nominal. As the oscillation rate increases, the current
deviations become larger (e.g. 12% above nominal at 2 Hz) and the shape of the
current profile becomes less linear. During these faster oscillation rates, the real
power profile begins deviating nonlinearly like current within +11% of nominal.
Reactive power oscillates in the same direction as voltage. Similar to current and
real power, deviations during oscillation become slightly larger at higher swing
frequencies or faster oscillation rates. Reactive linearly ramps down 55% to 58%
below steady state.
Figure 6.5.1 VFD AC #4 Voltage Oscillation Response (0.10, 0.25, 0.70, 1.0, 2.0 Hz)

Residential Air Conditioner with VFD Test Report
© Southern California Edison 2015
Advanced Technology 14799 Chestnut Street, Westminster, California 92683 USA DER Laboratory Research
Page 81 of 147
6.6 Under-frequency Events
After subjecting the VFD A/C unit to multiple under-frequency transients with
different duration times, it is presumed that the unit does not have under-frequency
protection while operating between 60 Hz and 58 Hz. The device simply rides
through these under-frequency conditions. The constant current suggests that the
VFD is maintaining frequency at the motor. The following figure and table identify the
magnitude and duration of the frequency transient tests that were performed on VFD
A/C #4.
Figure 6.6.1 VFD A/C #4 Under-frequency Response (130, 12, 3 cycles)
Under-Frequency Transient Compressor
Frequency Range Duration (cyc) Ftrip (Hz) ttrip (cyc)
60Hz, 59.8Hz, 59.6Hz,... 58Hz 130 N/A N/A
60Hz, 59.8Hz, 59.6Hz,... 58Hz 12 N/A N/A
60Hz, 59.8Hz, 59.6Hz,... 58Hz 3 N/A N/A
Table 6.6.1 VFD A/C #4 Under-frequency Test Results
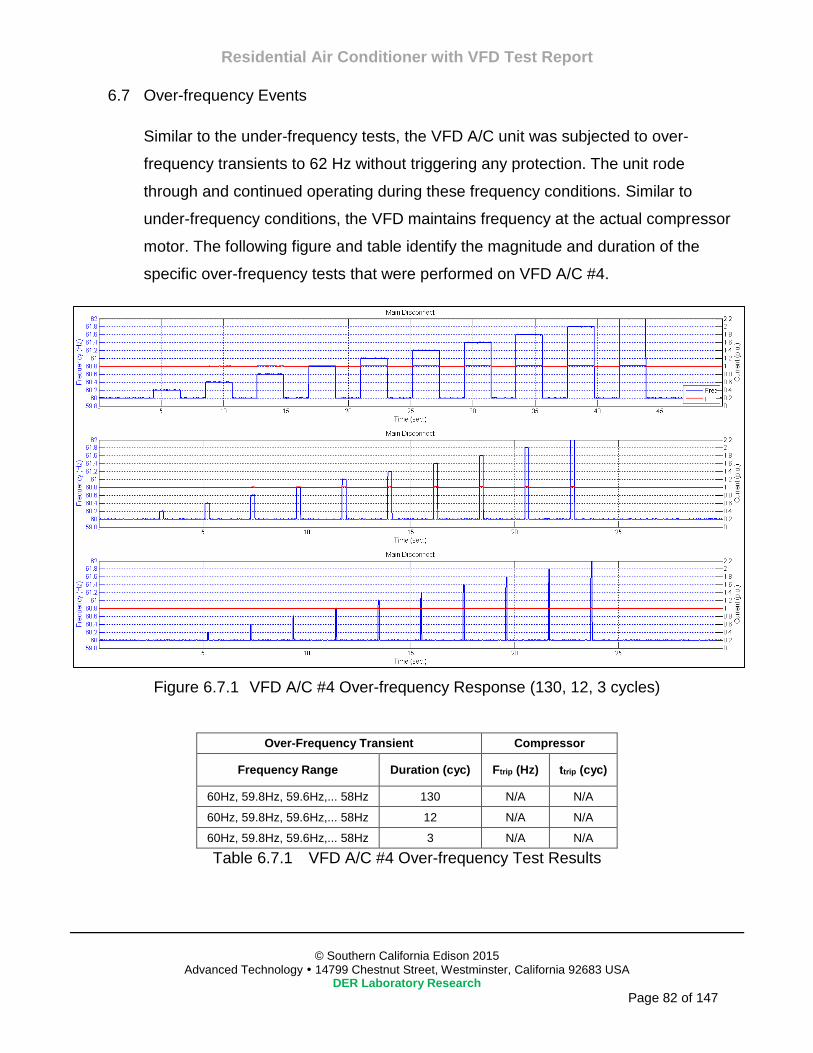
Residential Air Conditioner with VFD Test Report
© Southern California Edison 2015
Advanced Technology 14799 Chestnut Street, Westminster, California 92683 USA DER Laboratory Research
Page 82 of 147
6.7 Over-frequency Events
Similar to the under-frequency tests, the VFD A/C unit was subjected to over-
frequency transients to 62 Hz without triggering any protection. The unit rode
through and continued operating during these frequency conditions. Similar to
under-frequency conditions, the VFD maintains frequency at the actual compressor
motor. The following figure and table identify the magnitude and duration of the
specific over-frequency tests that were performed on VFD A/C #4.
Figure 6.7.1 VFD A/C #4 Over-frequency Response (130, 12, 3 cycles)
Over-Frequency Transient Compressor
Frequency Range Duration (cyc) Ftrip (Hz) ttrip (cyc)
60Hz, 59.8Hz, 59.6Hz,... 58Hz 130 N/A N/A
60Hz, 59.8Hz, 59.6Hz,... 58Hz 12 N/A N/A
60Hz, 59.8Hz, 59.6Hz,... 58Hz 3 N/A N/A
Table 6.7.1 VFD A/C #4 Over-frequency Test Results

Residential Air Conditioner with VFD Test Report
© Southern California Edison 2015
Advanced Technology 14799 Chestnut Street, Westminster, California 92683 USA DER Laboratory Research
Page 83 of 147
6.8 Frequency Oscillations
The following figure shows the performance of VFD A/C #4 during frequency
oscillations between 59 Hz and 61 Hz for different swing frequencies or oscillation
rates (0.10, 0.25, 0.70, 1.0, and 2.0 Hz).
Although the current and real power measured at the main terminals of the VFD A/C
slightly oscillate in the same direction as voltage, both values stay relatively
constant. Both remain within +2% of their respective steady state values. Therefore,
the VFD does an excellent job keeping the motor consumption constant.
Reactive power oscillates in the same direction of voltage and deviations from
nominal are similar for all oscillation rates. Reactive power consumption remains
within +13% of nominal.
Figure 6.8.1 VFD A/C #4 Frequency Oscillation Response (0.10, 0.25, 0.70, 1.0, 2.0 Hz)

Residential Air Conditioner with VFD Test Report
© Southern California Edison 2015
Advanced Technology 14799 Chestnut Street, Westminster, California 92683 USA DER Laboratory Research
Page 84 of 147
6.9 Voltage Ramps
Voltage was ramped down and back up multiple times in 10% decrements until the
VFD A/C unit tripped while ramping down to 50% nominal voltage. Accordingly, the
following figure shows the load performance at different voltage levels during
continuous operation (down to 60% nominal voltage).
There appears to be a delay in the response of the A/C load. Current does not
behave linearly in response to the voltage ramp decreasing initially by 8% below
nominal for the 2 second ramp and increasing to approximately 30% above nominal
during both tests. Real power consumption decreases in both cases, deviating by
42% below steady state for the 2 second ramp test and 30% below steady state for
the 8 second ramp test. Reactive power also decreases nonlinearly during the
voltage ramp, reaching approximately 0% of nominal in both ramp tests.
Figure 6.9.1 VFD A/C #4 Voltage Ramp Down to 60% (2 & 8 sec.)

Residential Air Conditioner with VFD Test Report
© Southern California Edison 2015
Advanced Technology 14799 Chestnut Street, Westminster, California 92683 USA DER Laboratory Research
Page 85 of 147
Voltage was ramped up to 110% and back down steady state voltage at different
ramp rates to demonstrate the load performance while operating at over-voltage
values.
Current is observed ramping down to nearly 7% below nominal in response to the
voltage ramp. Real power consumption increases slightly, up to 3% above steady
state for both ramp tests and also falls to 3% below steady state for the 2 second
ramp test. Reactive power is ramps up and back down with voltage, peaking at
approximately 52% of nominal for both ramp tests.
Figure 6.9.2 VFD A/C #4 Voltage Ramp Up to 110% (in 2 & 8 sec.)

Residential Air Conditioner with VFD Test Report
© Southern California Edison 2015
Advanced Technology 14799 Chestnut Street, Westminster, California 92683 USA DER Laboratory Research
Page 86 of 147
6.10 Frequency Ramps
Frequency was ramped down to 50 Hz and back up to 60 Hz at different ramp rates
to demonstrate the load performance while operating at lower frequency values as
shown in the figure below.
Current and real power slowly decrease during the frequency ramp test, but remain
within 4% of their respective nominal values. Reactive power begins decreasing as
frequency ramps down and begins plateauing at approximately 50% of nominal once
frequency reaches 55 Hz. As frequency continues decreasing, reactive power
consumption then increases until peaking at 17% below nominal. Afterwards
reactive power follows the same pattern of behavior as frequency ramps up to
nominal.
Figure 6.10.1 VFD A/C #4 Frequency Ramp Down to 50 Hz (in 2 & 8 sec.)

Residential Air Conditioner with VFD Test Report
© Southern California Edison 2015
Advanced Technology 14799 Chestnut Street, Westminster, California 92683 USA DER Laboratory Research
Page 87 of 147
Frequency was ramped up to 70 Hz and back down to 60 Hz at different ramp rates
to demonstrate the load performance while operating at higher frequency values as
shown in the figure below.
Current slowly ramps up with frequency until peaking at approximately 15% above
nominal current. Real power also displays this same behavior but at a slower rate
until peaking at 6% above steady state. Reactive power displays the greatest
increase in consumption as it ramps up until it is at 240% of nominal reactive power
(or 140% above nominal).
Figure 6.10.2 VFD A/C #4 Frequency Ramp Up to 70 Hz (in 2 & 8 sec.)

Residential Air Conditioner with VFD Test Report
© Southern California Edison 2015
Advanced Technology 14799 Chestnut Street, Westminster, California 92683 USA DER Laboratory Research
Page 88 of 147
6.11 Harmonics Contribution
Steady state voltage and current sinusoidal waveform data was captured multiple
times without scope filters to calculate the actual harmonic contribution of VFD A/C
unit #4 to the grid. The maximum total harmonic distortion of current was calculated
as 11.28% of the fundamental. This is the smallest total harmonic distortion of all the
VFD A/C units. The following table gives the total harmonic distortion calculations
and the figure plots the individual harmonic values.
Data Set #
THD (% of Fundamental)
V(L1-L2) I(L1) I(L2)
1 0.39 11.26 11.28
2 0.40 11.09 11.11
3 0.40 11.21 11.23
Table 6.11.1 VFD A/C #4 Total Harmonic Distortion
Figure 6.11.1 VFD A/C #4 Harmonics Contribution

Residential Air Conditioner with VFD Test Report
© Southern California Edison 2015
Advanced Technology 14799 Chestnut Street, Westminster, California 92683 USA DER Laboratory Research
Page 89 of 147
6.12 Conservation Voltage Reduction
Voltage was decreased by 1% nominal voltage in 5 second intervals down to 90%
before recovering back to steady state as shown in the figure below.
CVR has little impact on this specific load. Current increases by approximately 0.8%
of nominal current for every 1% decrease in nominal voltage. Real power remains
relatively constant, within +2% of nominal, over the course of the CVR test. Reactive
power is observed decreasing by approximately 6% of nominal for every 1%
decrease in voltage.
Figure 6.12.1 VFD A/C #4 CVR Response Down to 90% Voltage

Residential Air Conditioner with VFD Test Report
© Southern California Edison 2015
Advanced Technology 14799 Chestnut Street, Westminster, California 92683 USA DER Laboratory Research
Page 90 of 147
Alternatively, the main terminal voltage at the VFD A/C unit was increased by 1%
nominal voltage in 5 second intervals up to 105% before stepping back to steady
state as shown in the figure below.
Current decreases by approximately 0.6% of its nominal value for every 1% increase
in nominal voltage over the course of the CVR test. Real power consumption
remains at its steady state value within 2% of nominal. Reactive power is observed
increasing by approximately 5.4% of its nominal value for every 1% increase in
nominal voltage.
Figure 6.12.2 VFD A/C #4 CVR Response Up to 105% Voltage

Residential Air Conditioner with VFD Test Report
© Southern California Edison 2015
Advanced Technology 14799 Chestnut Street, Westminster, California 92683 USA DER Laboratory Research
Page 91 of 147
7.0 VFD AIR CONDITIONER #5 TEST RESULTS
The figure below shows a snapshot of VFD A/C unit #5 sinusoidal voltages and currents
captured at the main terminals and compressor motor using a filter on the digital scope. Notice
the distortion in the main current waveforms. The compressor is operating at approximately
155 Volts peak, 10 Amps peak, and 95 Hz at the observed loading condition. The
specifications for the VFD A/C #5 components are provided in the table below.
Figure 7.0.1 VFD A/C #5 Voltage and Current Waveforms
Manufacturer Klimaire
Voltage (V) 230
Refrig. R-410A
SEER 19
Compressor, Model # GMCC DA250S2C-30MT
Compressor, RLA (Amps) 11.0
Compressor, LRA (Amps) -
Outdoor Fan Motor, FLA (Amps) 0.55
Indoor Fan Motor, FLA (Amps) 0.36
Design Pressure High (PSI) 550
Design Pressure Low (PSI) 340
Table 7.0.1 VFD A/C #5 Specifications

Residential Air Conditioner with VFD Test Report
© Southern California Edison 2015
Advanced Technology 14799 Chestnut Street, Westminster, California 92683 USA DER Laboratory Research
Page 92 of 147
7.1 Compressor Shutdown
VFD A/C #5 was shut down during normal operation using the programmable
thermostat remote for the indoor blower unit. The figure below displays the
measurements taken at the main terminal connections of the entire A/C unit.
After adjusting the thermostat, the indoor unit shuts down immediately and
compressor shuts down shortly after, within 1 second. The delay time for
compressor current to ramp down is approximately 2 cycles. The outdoor unit fan
continued operating for another 28.9 seconds before shutting down. While in
standby mode, the device’s power consumption is less than 0.4 Amps.
Figure 7.1.1 VFD A/C #5 Compressor Shutdown

Residential Air Conditioner with VFD Test Report
© Southern California Edison 2015
Advanced Technology 14799 Chestnut Street, Westminster, California 92683 USA DER Laboratory Research
Page 93 of 147
7.2 Inrush Current
After starting up the VFD A/C unit via the programmable thermostat remote, the
device does not display any sign of significant inrush current. The unit slowly ramps
up over the course of nearly 30 seconds until the unit is drawing a minimum of 4.5
Amps. Only a small spike in current, 2 Amps, is observed as the ramp up begins.
The VFD controlled compressor will increase in intervals over the course of several
minutes to meet temperature demand until the unit is more heavily loaded. The room
temperature was approximately 79 degrees Fahrenheit and the unit would typically
operate near 6.2 to 6.9 Amps steady state.
Figure 7.2.1 VFD A/C #5 Inrush Current

Residential Air Conditioner with VFD Test Report
© Southern California Edison 2015
Advanced Technology 14799 Chestnut Street, Westminster, California 92683 USA DER Laboratory Research
Page 94 of 147
7.3 Balanced & Unbalanced Under-voltages
After performing various under-voltages on VFD A/C #5 in decrements of 10%, the
compressor is observed disconnecting at different voltage magnitudes depending on
the duration of the under-voltage transient. Longer voltage sags with a duration of
130 cycles caused the compressor to shut down consistently at 40% nominal
voltage within 114 and 127.8 cycles. Voltage sags with a duration time of 12 and 9
cycles typically caused the compressor to disconnect at 10% nominal voltage near
the end of the sag or even up to 1.2 cycles after voltage recovered. Tripping at the
end of the voltage sag may be due to the spike in current at that time or even some
form of logic from the unit controller.
Data captured several seconds after the disconnection of the compressors did not
reveal restarting behavior and therefore reclose times were not captured. This
indicates that there must be a protective relay and associated delay times
programmed into the local controller of the VFD A/C unit to prevent immediate
restarting. The compressor would only restart approximately 4 minutes after tripping
occurred.
The VFD A/C unit rode through all voltage sags (down to 0% voltage) with a duration
less than or equal to 6 cycles. “N/A” or “not applicable” represents these ride through
situations where there is no trip voltage or trip time available in the following tables.
The following figure visually displays one of these balanced tests where the under-
voltage sags have a duration time of 130 cycles. Less under-voltage tests are shown
in the following figure because the time between voltage sags was increased for this
unit to ensure the load returned to steady state before performing the next voltage
sag test in the sequence. The compressor is observed being disconnected towards
the end of the 40% voltage sag. The following table provides additional details
regarding the compressor operation during a variety of balanced under-voltage
transient tests including the voltage where the unit was tripped (Vtrip) as well as the
time it took for the unit controls to trip it offline after the voltage sag was initiated
(ttrip).

Residential Air Conditioner with VFD Test Report
© Southern California Edison 2015
Advanced Technology 14799 Chestnut Street, Westminster, California 92683 USA DER Laboratory Research
Page 95 of 147
Figure 7.3.1 VFD A/C #5 Balanced Under-voltage Response (130 cycles)
Under-Voltage Transient Compressor
Volt Range Duration (cyc) Vtrip (%) ttrip (cyc)
100%, 90%, 80%,... 0% 130
40% 115.8
40% 127.8
40% 114
100%, 90%, 80%,... 0% 12
10% 9.6
20% 12.6
10% 10.2
100%, 90%, 80%,... 0% 9
10% 10.2
10% 9.6
10% 9.6
100%, 90%, 80%,... 0% 6
N/A N/A
N/A N/A
N/A N/A
100%, 90%, 80%,... 0% 3
N/A N/A
N/A N/A
N/A N/A
100%, 90%, 80%,... 0% 1
N/A N/A
N/A N/A
N/A N/A
Table 7.3.1 VFD A/C #5 Balanced Under-voltages in 10% Decrements Results

Residential Air Conditioner with VFD Test Report
© Southern California Edison 2015
Advanced Technology 14799 Chestnut Street, Westminster, California 92683 USA DER Laboratory Research
Page 96 of 147
The specific voltage where the compressors are disconnected and/or the controls
dropped were identified by performing additional balanced under-voltage tests in
decrements of 1% nominal voltage. The voltage sags with longer duration times
showed that the compressor could begin tripping off for voltage sags between 41%
and 39% nominal voltage. Under-voltage transients in the range of 12 cycles
revealed tripping at 19% nominal voltage. Each of these tests resulted in the
compressor disconnecting after voltage recovered from the sag (up to 1.2 cycles
after recovery). This could be the result of the spike in inrush current as voltage
steps up to nominal or even the outdoor condensing unit’s controller PCB preventing
loss of load until voltage is near steady state. The following table provides the details
of the compressor disconnection behavior during these 1% voltage decrement tests.
Under-Voltage Transient Compressor
Volt Range Duration (cyc) Vtrip (%) ttrip (cyc)
50%, 49%, 48%,… 130 41% 130.8
50%, 49%, 48%,… 60 39% 61.2
50%, 49%, 48%,… 12 19% 12.6
Table 7.3.2 VFD A/C #5 Balanced Under-voltages in 1% Decrements Results
The unbalanced under-voltages on VFD A/C #5 did not reveal any tripping or
disconnection of the compressor. The unit rode through these transients and
continued operating normally. This is expected since the lowest voltage magnitude
possible is 50% line-to-line nominal voltage and balanced under-voltages did not
cause tripping until voltage reached approximately 40% nominal voltage. Therefore
the voltage at the PCB that operates the controls for the compressor is likely
supplied by the line-to-line voltage.
The following figure shows an example of these unbalanced cases (Line 1 under-
voltages for 130 cycles) where the compressor rides through a 0% line-to-neutral
nominal voltage. The following table provides details on the unbalanced voltage
transients performed at the main terminals of the VFD A/C unit.
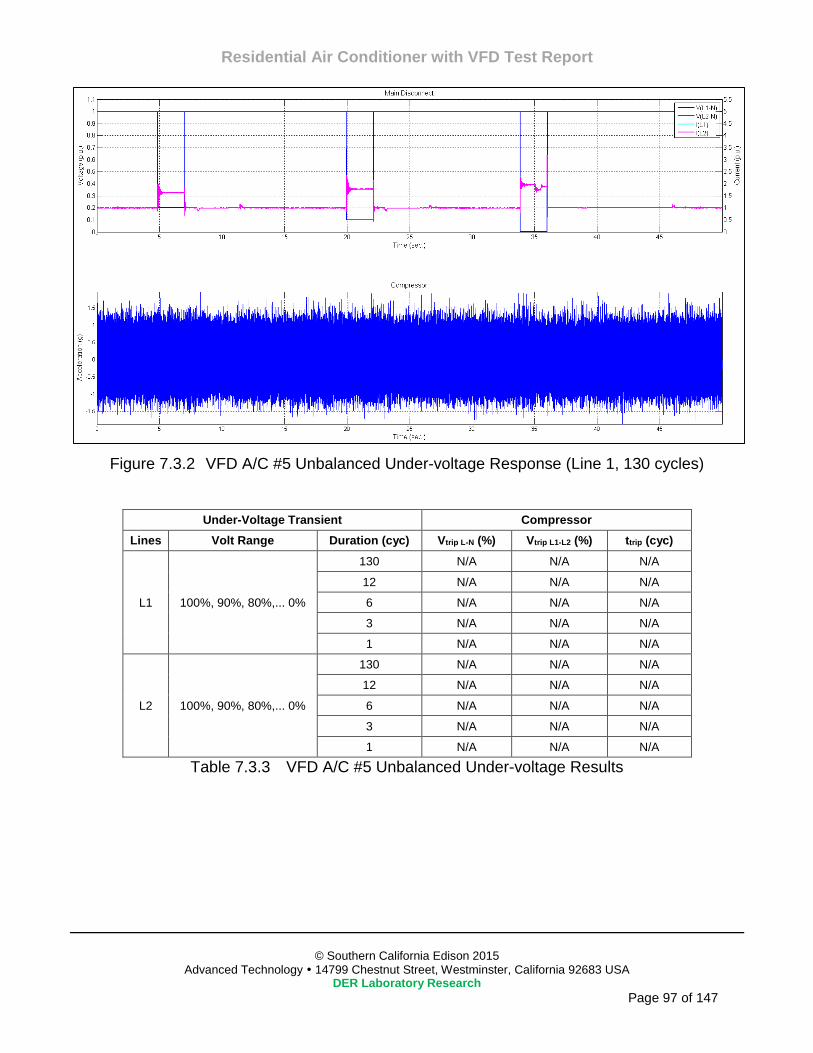
Residential Air Conditioner with VFD Test Report
© Southern California Edison 2015
Advanced Technology 14799 Chestnut Street, Westminster, California 92683 USA DER Laboratory Research
Page 97 of 147
Figure 7.3.2 VFD A/C #5 Unbalanced Under-voltage Response (Line 1, 130 cycles)
Under-Voltage Transient Compressor
Lines Volt Range Duration (cyc) Vtrip L-N (%) Vtrip L1-L2 (%) ttrip (cyc)
L1 100%, 90%, 80%,... 0%
130 N/A N/A N/A
12 N/A N/A N/A
6 N/A N/A N/A
3 N/A N/A N/A
1 N/A N/A N/A
L2 100%, 90%, 80%,... 0%
130 N/A N/A N/A
12 N/A N/A N/A
6 N/A N/A N/A
3 N/A N/A N/A
1 N/A N/A N/A
Table 7.3.3 VFD A/C #5 Unbalanced Under-voltage Results

Residential Air Conditioner with VFD Test Report
© Southern California Edison 2015
Advanced Technology 14799 Chestnut Street, Westminster, California 92683 USA DER Laboratory Research
Page 98 of 147
7.4 Balanced & Unbalanced Over-voltages
VFD A/C #5 was subjected to balanced and unbalanced over-voltages within the
parameters of the ITIC (CBEMA) curve to avoid damaging any voltage sensitive
equipment. These tests include multiple voltage swells performed in 2% increments
for up to 120% nominal voltage to identify any tripping behavior. No over-voltage
protection was observed during any of these tests, only voltage ride-through. The
following figure shows a sample over-voltage test and the following table specifies
the types of tests performed.
Figure 7.4.1 VFD AC #5 Balanced Over-voltage Response (20 cycles)
Over-Voltage Transient Compressor
Lines Volt Range Duration (cyc) Vtrip L-N (%) Vtrip L1-L2 (%) ttrip (cyc)
L1 & L2 100%, 102%, 104%,... 120% 20 N/A N/A N/A
L1 100%, 102%, 104%,... 120% 20 N/A N/A N/A
L2 100%, 102%, 104%,... 120% 20 N/A N/A N/A
Table 7.4.1 VFD A/C #5 Balanced & Unbalanced Over-voltage Results

Residential Air Conditioner with VFD Test Report
© Southern California Edison 2015
Advanced Technology 14799 Chestnut Street, Westminster, California 92683 USA DER Laboratory Research
Page 99 of 147
7.5 Voltage Oscillations
The following figure shows the performance of VFD A/C #5 during voltage
oscillations between 100% and 90% nominal voltage for a variety of swing
frequencies or oscillation rates.
Current oscillates in the opposite direction of voltage, between 11% and 13% above
nominal, to minimize any oscillations or deviations in real power for all swing
frequencies. The consumption of real power remains relatively constant within 3% of
nominal during a periods of the voltage oscillations. However, there appear to be
sudden swings in real power as voltage and current return to nominal following each
oscillation caused by changes in the shape of the current sinusoidal waveform.
Reactive power consumption is very low since the power factor is greater than 0.98
for the device. Therefore any minor change in reactive load, even during steady
state, results in drastic changes to the per unit values. As a result, reactive power
was not included in the figure below.
Figure 7.5.1 VFD AC #5 Voltage Oscillation Response (0.10, 0.25, 0.70, 1.0, 2.0 Hz)

Residential Air Conditioner with VFD Test Report
© Southern California Edison 2015
Advanced Technology 14799 Chestnut Street, Westminster, California 92683 USA DER Laboratory Research
Page 100 of 147
7.6 Under-frequency Events
After subjecting VFD A/C #5 to multiple under-frequency transients with different
duration times, it is presumed that the unit does not have under-frequency protection
while operating between 60 Hz and 58 Hz. The device simply rides through these
under-frequency conditions. Constant current suggests that the VFD is maintaining
frequency of the motor. The following figure and table identify the magnitude and
duration of the frequency transient tests that were performed.
Figure 7.6.1 VFD A/C #5 Under-frequency Response (130, 12, 3 cycles)
Under-Frequency Transient Compressor
Frequency Range Duration (cyc) Ftrip (Hz) ttrip (cyc)
60Hz, 59.8Hz, 59.6Hz,... 58Hz 130 N/A N/A
60Hz, 59.8Hz, 59.6Hz,... 58Hz 12 N/A N/A
60Hz, 59.8Hz, 59.6Hz,... 58Hz 3 N/A N/A
Table 7.6.1 VFD A/C #5 Under-frequency Test Results

Residential Air Conditioner with VFD Test Report
© Southern California Edison 2015
Advanced Technology 14799 Chestnut Street, Westminster, California 92683 USA DER Laboratory Research
Page 101 of 147
7.7 Over-frequency Events
Similar to the under-frequency tests, VFD A/C #5 was subjected to over-frequency
transients to 62 Hz without triggering any protection. The unit rode through and
continued operating during these frequency conditions. Again, frequency of the
motor is constant due to the VFD operations. The following figure and table identify
the magnitude and duration of the specific over-frequency tests that were performed.
Figure 7.7.1 VFD A/C #5 Over-frequency Response (130, 12, 3 cycles)
Over-Frequency Transient Compressor
Frequency Range Duration (cyc) Ftrip (Hz) ttrip (cyc)
60Hz, 59.8Hz, 59.6Hz,... 58Hz 130 N/A N/A
60Hz, 59.8Hz, 59.6Hz,... 58Hz 12 N/A N/A
60Hz, 59.8Hz, 59.6Hz,... 58Hz 3 N/A N/A
Table 7.7.1 VFD A/C #5 Over-frequency Test Results

Residential Air Conditioner with VFD Test Report
© Southern California Edison 2015
Advanced Technology 14799 Chestnut Street, Westminster, California 92683 USA DER Laboratory Research
Page 102 of 147
7.8 Frequency Oscillations
The following figure shows the performance of VFD A/C #5 during frequency
oscillations between 59 Hz and 61 Hz for different swing frequencies or oscillation
rates (0.10, 0.25, 0.70, 1.0, and 2.0 Hz).
Current does not oscillate or deviate in response to frequency oscillations at the
main terminals of the A/C unit. The active power consumption remains constant as
well, within +2% of its steady state value along with current for all swing frequencies
or oscillation rates.
Reactive power was not included in the figure below because of its low consumption
(power factor is greater than 0.97). Even minor deviations that naturally occur during
steady state cause significant changes to the per unit values plotted, making other
measurements difficult to interpret.
Figure 7.8.1 VFD A/C #5 Frequency Oscillation Response (0.10, 0.25, 0.70, 1.0, 2.0 Hz)

Residential Air Conditioner with VFD Test Report
© Southern California Edison 2015
Advanced Technology 14799 Chestnut Street, Westminster, California 92683 USA DER Laboratory Research
Page 103 of 147
7.9 Voltage Ramps
Voltage was ramped down and back up multiple times in 10% decrements until the
A/C unit tripped while ramping down to 40% nominal voltage. Accordingly, the
following figure shows the load performance at different voltage levels during
continuous operation (down to 50% nominal voltage).
Current ramps up to approximately 98% above nominal while voltage ramps down to
50% below nominal. Real power consumption is held constant for most of the
voltage ramp test, within +2% of nominal. However during both the 2 and 8 second
ramp tests, current does experience a sudden decrease while ramping down to
nominal which results in a reduction of real power consumption.
Reactive power consumption is low due to the large power factor, but it ramps down
to nearly 17% of its nominal value at the bottom of the voltage ramp. Its behavior
changes dramatically during voltage recovery, which was consistent in a number of
voltage ramp tests.
Figure 7.9.1 VFD A/C #5 Voltage Ramp Down to 50% (2 & 8 sec.)

Residential Air Conditioner with VFD Test Report
© Southern California Edison 2015
Advanced Technology 14799 Chestnut Street, Westminster, California 92683 USA DER Laboratory Research
Page 104 of 147
Voltage was ramped up to 110% and back down steady state voltage at different
ramp rates to demonstrate the load performance while operating at over-voltage
values.
Current is observed ramping down to nearly 10% below nominal in response to
voltage. Real power consumption remain relatively close to nominal for most of the
voltage ramp, within +3% of steady state. Both current and real power take a sudden
dip in consumption at the peak of the voltage ramp for faster 2 second test. Little
reactive power is consumed during normal operation and therefore displays the
greatest deviation from nominal.
Figure 7.9.2 VFD A/C #5 Voltage Ramp Up to 110% (in 2 & 8 sec.)

Residential Air Conditioner with VFD Test Report
© Southern California Edison 2015
Advanced Technology 14799 Chestnut Street, Westminster, California 92683 USA DER Laboratory Research
Page 105 of 147
7.10 Frequency Ramps
Frequency was ramped down to 50 Hz and back up to 60 Hz at different ramp rates
to demonstrate the load performance while operating at lower frequency values as
shown in the figure below.
The VFD does a good job maintaining the motor consumption at varying grid
frequencies. Current and real power remain relatively constant, within +3% of
respective nominal values. Reactive power is low and also remains close to its value
at steady state.
Figure 7.10.1 VFD A/C #5 Frequency Ramp Down to 50 Hz (in 2 & 8 sec.)

Residential Air Conditioner with VFD Test Report
© Southern California Edison 2015
Advanced Technology 14799 Chestnut Street, Westminster, California 92683 USA DER Laboratory Research
Page 106 of 147
Frequency was ramped up to 70 Hz and back down to 60 Hz at different ramp rates
to demonstrate the load performance while operating at higher frequency values as
shown in the figure below.
Similar to the under-frequency ramp test, current and real power remain relatively
constant throughout the entire over-frequency ramp, within +3% of nominal.
Reactive power consumption for the unit is already low due to a large power factor
and does not reveal any type of response due to the increase in frequency.
Figure 7.10.2 VFD A/C #5 Frequency Ramp Up to 70 Hz (in 2 & 8 sec.)

Residential Air Conditioner with VFD Test Report
© Southern California Edison 2015
Advanced Technology 14799 Chestnut Street, Westminster, California 92683 USA DER Laboratory Research
Page 107 of 147
7.11 Harmonics Contribution
Steady state voltage and current sinusoidal waveform data was captured multiple
times without scope filters to calculate the actual harmonic contribution of VFD A/C
unit #5 to the grid. The maximum total harmonic distortion of current discovered was
16.87% of the fundamental. The following table gives the total harmonic distortion
calculations and the figure plots the individual harmonic values.
Data Set #
THD (% of Fundamental)
V(L1-L2) I(L1) I(L2)
1 0.22 16.82 16.87
2 0.23 16.34 16.40
3 0.22 16.25 16.30
Table 7.11.1 VFD A/C #5 Total Harmonic Distortion
Figure 7.11.1 VFD A/C #5 Harmonics Contribution

Residential Air Conditioner with VFD Test Report
© Southern California Edison 2015
Advanced Technology 14799 Chestnut Street, Westminster, California 92683 USA DER Laboratory Research
Page 108 of 147
7.12 Conservation Voltage Reduction
Voltage was decreased by 1% nominal voltage in 5 second intervals down to 90%
before recovering back to steady state as shown in the figure below.
CVR would not be effective on this type of load device. Current increases by
approximately 1.1% of nominal current for every 1% decrease in nominal voltage
over the course of the CVR test. Therefore the real power consumption is fairly
constant. Reactive power slowly decreases over time. All electrical measurements
appear deviate in response to the shape of the current waveform as voltage begins
recovering to nominal.
Figure 7.12.1 VFD A/C #5 CVR Response Down to 90% Voltage

Residential Air Conditioner with VFD Test Report
© Southern California Edison 2015
Advanced Technology 14799 Chestnut Street, Westminster, California 92683 USA DER Laboratory Research
Page 109 of 147
Alternatively, the main terminal voltage at the VFD A/C unit was increased by 1%
nominal voltage in 5 second intervals up to 105% before stepping back to steady
state as shown in the figure below.
The average current decreases down to 7% below nominal as voltage increases.
Therefore real power remains near steady state consumption, with +2% of nominal.
Reactive power consumption is low but progressively decreases in response to the
voltage increase.
Figure 7.12.2 VFD A/C #5 CVR Response Up to 105% Voltage

Residential Air Conditioner with VFD Test Report
© Southern California Edison 2015
Advanced Technology 14799 Chestnut Street, Westminster, California 92683 USA DER Laboratory Research
Page 110 of 147
8.0 VFD AIR CONDITIONER #6 TEST RESULTS
The figure below shows a snapshot of VFD A/C unit #6 sinusoidal voltages and currents
captured at the main terminals and compressor motor using a filter on the digital scope. The
main currents are significantly different from a traditional sinusoidal shaped waveform. The
compressor is operating at approximately 170 Volts peak, 20 Amps peak, and 111 Hz at the
observed loading condition. The specifications for the VFD A/C #6 components are provided in
the table below.
Figure 8.0.1 VFD A/C #6 Voltage and Current Waveforms
Manufacturer Panasonic
Voltage (V) 230
Refrig. R-410A
SEER 16
Compressor, Model # SANYO C-9RVN273HOH
Compressor, RLA (Amps) 18.9
Compressor, LRA (Amps) -
Outdoor Fan Motor, FLA (Amps) 0.7
Indoor Fan Motor, FLA (Amps) 0.7
Design Pressure High (PSI) 489
Design Pressure Low (PSI) 235
Table 8.0.1 VFD A/C #6 Specifications

Residential Air Conditioner with VFD Test Report
© Southern California Edison 2015
Advanced Technology 14799 Chestnut Street, Westminster, California 92683 USA DER Laboratory Research
Page 111 of 147
8.1 Compressor Shutdown
VFD A/C #6 was shut down during normal operation using the programmable
thermostat remote for the indoor blower unit. The figure below displays the
measurements taken at the main terminal connections of the entire A/C unit.
The fans and compressor shut down immediately after changing settings on the
programmable thermostat. The delay time for current to ramp down is incredibly
short, within 5 cycles. Once the unit is in standby mode, the device’s power
consumption is less than 0.5 Amps.
Figure 8.1.1 VFD A/C #6 Compressor Shutdown

Residential Air Conditioner with VFD Test Report
© Southern California Edison 2015
Advanced Technology 14799 Chestnut Street, Westminster, California 92683 USA DER Laboratory Research
Page 112 of 147
8.2 Inrush Current
After starting up the VFD A/C unit via the programmable thermostat remote, the
device does not display any sign of significant inrush current. The unit compressor
load ramps up in nearly to steady state in approximately 20 seconds and then
slightly increases over the next 10 seconds. The VFD compressor will increase in
intervals over the course of several minutes to meet temperature demand until the
unit is more heavily loaded. The room temperature was approximately 78 degrees
Fahrenheit and the unit would typically operate between 12.8 and 13.8 Amps steady
state.
Figure 8.2.1 VFD A/C #6 Inrush Current

Residential Air Conditioner with VFD Test Report
© Southern California Edison 2015
Advanced Technology 14799 Chestnut Street, Westminster, California 92683 USA DER Laboratory Research
Page 113 of 147
8.3 Balanced & Unbalanced Under-voltages
VFD A/C #6 was subjected to a series of balanced under-voltage sags in
decrements of 10% to identify the conditions required to cause device dropout and
tripping behavior. The unit consistently disconnected the compressor at 80%
nominal voltage for longer sags with a duration of 130 cycles. Shorter voltage sags
with a duration of 12 cycles to 6 cycles typically resulted in the compressor being
tripped at 50% nominal voltage. An important observation in Table 8.3.1 is that the
VFD A/C unit would always disconnect the compressor within 3 cycles after voltage
recovered from a sag. A theory is that this may be caused by the spike or inrush
current observed when voltage returns to nominal at the end of the sag. Another,
less likely, possibility is that the controller PCB on the outdoor condensing unit
operating to prevent loss of load until voltage recovers.
Although data points were captured several seconds after the compressors were
disconnected, no restarting behavior was observed and therefore reclose times were
not captured. This indicates that there must be a protective relay and associated
delay times programmed into the local controller of the VFD A/C unit to prevent
immediate restarting. The compressor was only observed restarting several minutes
after tripping occurred. No stalling was observed during transients or upon restarting.
Any voltage sags with a duration less than 3 cycles usually did not cause the
compressor to disconnect, allowing it to ride through all voltage magnitudes (down to
0% voltage). “N/A” or “not applicable” represents these ride through situations where
there is no trip voltage or trip time available in the following tables.
The following figure visually displays one of the balanced tests where the under-
voltage sags have a duration time of 130 cycles. The figure reveals that the
compressor was disconnected at 80% voltage almost immediately after voltage
recovers from the 130 cycle voltage sag. The following table provides the voltage
magnitude (Vtrip) where the compressor shut down and time (ttrip) taken after the
under-voltage started for the A/C unit’s controls to trip it off.

Residential Air Conditioner with VFD Test Report
© Southern California Edison 2015
Advanced Technology 14799 Chestnut Street, Westminster, California 92683 USA DER Laboratory Research
Page 114 of 147
Figure 8.3.1 VFD A/C #6 Balanced Under-voltage Response (130 cycles)
Under-Voltage Transient Compressor
Volt Range Duration (cyc) Vtrip (%) ttrip (cyc)
100%, 90%, 80%,... 0% 130
80% 131.9
80% 132.9
80% 131.8
100%, 90%, 80%,... 0% 12
50% 13.2
50% 12.6
50% 13.8
100%, 90%, 80%,... 0% 9
60% 11.4
50% 10.8
50% 10.2
100%, 90%, 80%,... 0% 6
50% 7.2
50% 7.8
50% 8.4
100%, 90%, 80%,... 0% 3
0% 3.6
N/A N/A
N/A N/A
100%, 90%, 80%,... 0% 1
N/A N/A
N/A N/A
N/A N/A
Table 8.3.1 VFD A/C #6 Balanced Under-voltages in 10% Decrements Results

Residential Air Conditioner with VFD Test Report
© Southern California Edison 2015
Advanced Technology 14799 Chestnut Street, Westminster, California 92683 USA DER Laboratory Research
Page 115 of 147
Additional balanced under-voltage tests in decrements of 1% nominal voltage were
performed to verify where the controls drop out causing the compressor to be
disconnected. The tests showed that the compressor would consistently be
disconnected between 81% and 84% nominal voltage for 130 cycle voltage sags
and at 56% nominal voltage for 12 cycle voltage sags. Again, the compressor is
consistently disconnected within 1.8 cycles after voltage recovers from the sag likely
due to the sudden increase in current at the end of the voltage sag. The following
table provides the details of the compressor disconnection behavior during some
these 1% voltage decrement tests.
Under-Voltage Transient Compressor
Volt Range Duration (cyc) Vtrip (%) ttrip (cyc)
90%, 89%, 88%,… 130 81% 130.1
90%, 89%, 88%,… 130 85% 130.2
90%, 89%, 88%,… 130 84% 131.8
60%, 59%, 58%,… 12 56% 12.2
Table 8.3.2 VFD A/C #6 Balanced Under-voltages in 1% Decrements Results
The unbalanced under-voltages on VFD A/C #6 were consistent with some of the
balanced under-voltage tests with respect to the line-to-line voltage at the main
terminals, but not all voltage sag tests. The unit has similar dropout/tripping behavior
as the balanced tests for 130 cycle and 6 cycle voltage sags (80% - 85% and 55%
line-to-line nominal voltage). However, the dropout/tripping voltages for 12 and 3
cycles are higher than observed during balanced under-voltage tests. Tripping
doesn’t occur until voltage already recovers from an under-voltage condition, up to 3
cycles after voltage recovered. Ride through behavior for all voltage magnitudes was
consistent for 1 cycle sags.
The following figure shows an example of these unbalanced cases (Line 2 under-
voltages for 130 cycles) where the compressor shut down after recovering from the
70% nominal line-to-neutral voltage sag. The following table provides the
compressor disconnection behavior during unbalanced voltage transients as
observed at the main terminals of the VFD A/C unit, including the voltage

Residential Air Conditioner with VFD Test Report
© Southern California Edison 2015
Advanced Technology 14799 Chestnut Street, Westminster, California 92683 USA DER Laboratory Research
Page 116 of 147
magnitudes where disconnection occurs and how long it takes to disconnect after
the voltage sag begins. As previously noted, the trip times for this A/C unit were
longer than the actual voltage sag.
Figure 8.3.2 VFD A/C #6 Unbalanced Under-voltage Response (Line 2, 130 cycles)
Under-Voltage Transient Compressor
Lines Volt Range Duration (cyc) Vtrip L-N (%) Vtrip L1-L2 (%) ttrip (cyc)
L1 100%, 90%, 80%,... 0%
130 60% 80% 130.8
12 50% 75% 12.6
6 10% 55% 7.2
3 50% 75% 5.4
1 N/A N/A N/A
L2 100%, 90%, 80%,... 0%
130 70% 85% 132
12 70% 85% 13
6 10% 55% 9
3 50% 75% 4.8
1 N/A N/A N/A
Table 8.3.3 VFD A/C #6 Unbalanced Under-voltage Results

Residential Air Conditioner with VFD Test Report
© Southern California Edison 2015
Advanced Technology 14799 Chestnut Street, Westminster, California 92683 USA DER Laboratory Research
Page 117 of 147
8.4 Balanced & Unbalanced Over-voltages
The VFD A/C unit was subjected to balanced and unbalanced over-voltages
performed in 2% increments for up to 120% nominal voltage within the parameters
of the ITIC (CBEMA) curve, a voltage tolerance curve, to avoid device damage. No
over-voltage protection was observed during any of these tests, only voltage ride-
through. The following figure shows a sample over-voltage test and the following
table specifies the types of tests performed.
Figure 8.4.1 VFD AC #6 Balanced Over-voltage Response (20 cycles)
Over-Voltage Transient Compressor
Lines Volt Range Duration (cyc) Vtrip L-N (%) Vtrip L1-L2 (%) ttrip (cyc)
L1 & L2 100%, 102%, 104%,... 120% 20 N/A N/A N/A
L1 100%, 102%, 104%,... 120% 20 N/A N/A N/A
L2 100%, 102%, 104%,... 120% 20 N/A N/A N/A
Table 8.4.1 VFD A/C #6 Balanced & Unbalanced Over-voltage Results

Residential Air Conditioner with VFD Test Report
© Southern California Edison 2015
Advanced Technology 14799 Chestnut Street, Westminster, California 92683 USA DER Laboratory Research
Page 118 of 147
8.5 Voltage Oscillations
The following figure shows the performance of VFD A/C unit #6 during voltage
oscillations between 100% and 90% nominal voltage for a variety of swing
frequencies or oscillation rates.
Current oscillates in the opposite direction of voltage, up to 9% or 10% above
nominal, for oscillation rates between 0.10 Hz and 0.25 Hz. In response to current,
the real power deviates within +4% of nominal. As the oscillation rate increases, the
current deviations become larger (e.g. up to 15% above nominal at 2 Hz) and the
shape of the current profile becomes less linear. During these faster oscillation rates,
the real power profile begins deviating with current within +15% of nominal.
Reactive power oscillates in the same direction as voltage. Deviations remain similar
during oscillations at higher swing frequencies or faster oscillation rates. Reactive
linearly ramps down 15% below steady state.
Figure 8.5.1 VFD AC #6 Voltage Oscillation Response (0.10, 0.25, 0.70, 1.0, 2.0 Hz)

Residential Air Conditioner with VFD Test Report
© Southern California Edison 2015
Advanced Technology 14799 Chestnut Street, Westminster, California 92683 USA DER Laboratory Research
Page 119 of 147
8.6 Under-frequency Events
After subjecting the VFD A/C unit to multiple under-frequency transients with
different duration times, it is presumed that the unit does not have under-frequency
protection while operating between 60 Hz and 58 Hz. The device simply rides
through these under-frequency conditions. The constant current suggests that the
VFD is effectively maintaining motor load. The following figure and table identify the
magnitude and duration of the frequency transient tests that were performed on VFD
A/C #6.
Figure 8.6.1 VFD A/C #6 Under-frequency Response (130, 12, 3 cycles)
Under-Frequency Transient Compressor
Frequency Range Duration (cyc) Ftrip (Hz) ttrip (cyc)
60Hz, 59.8Hz, 59.6Hz,... 58Hz 130 N/A N/A
60Hz, 59.8Hz, 59.6Hz,... 58Hz 12 N/A N/A
60Hz, 59.8Hz, 59.6Hz,... 58Hz 3 N/A N/A
Table 8.6.1 VFD A/C #6 Under-frequency Test Results

Residential Air Conditioner with VFD Test Report
© Southern California Edison 2015
Advanced Technology 14799 Chestnut Street, Westminster, California 92683 USA DER Laboratory Research
Page 120 of 147
8.7 Over-frequency Events
Similar to the under-frequency tests, the VFD A/C unit was subjected to over-
frequency transients to 62 Hz without triggering any protection. The unit rode
through and continued operating during these frequency conditions. The constant
current suggests that the VFD is effectively maintaining motor load. The following
figure and table identify the magnitude and duration of the specific over-frequency
tests that were performed on VFD A/C #6.
Figure 8.7.1 VFD A/C #6 Over-frequency Response (130, 12, 3 cycles)
Over-Frequency Transient Compressor
Frequency Range Duration (cyc) Ftrip (Hz) ttrip (cyc)
60Hz, 59.8Hz, 59.6Hz,... 58Hz 130 N/A N/A
60Hz, 59.8Hz, 59.6Hz,... 58Hz 12 N/A N/A
60Hz, 59.8Hz, 59.6Hz,... 58Hz 3 N/A N/A
Table 8.7.1 VFD A/C #6 Over-frequency Test Results

Residential Air Conditioner with VFD Test Report
© Southern California Edison 2015
Advanced Technology 14799 Chestnut Street, Westminster, California 92683 USA DER Laboratory Research
Page 121 of 147
8.8 Frequency Oscillations
The following figure shows the performance of VFD A/C #6 during frequency
oscillations between 59 Hz and 61 Hz for different swing frequencies or oscillation
rates (0.10, 0.25, 0.70, 1.0, and 2.0 Hz).
Although the current and real power measured at the main terminals of the VFD A/C
slightly oscillate in the opposite direction as voltage at faster oscillation rates, both
values stay relatively constant for 0.10 Hz and 0.25 Hz. Overall, both remain within
+5% of their respective steady state values.
Reactive power oscillates in the opposite direction of voltage as well and deviations
from nominal are similar for all oscillation rates. Reactive power consumption
remains within +5% of nominal.
Figure 8.8.1 VFD A/C #6 Frequency Oscillation Response (0.10, 0.25, 0.70, 1.0, 2.0 Hz)

Residential Air Conditioner with VFD Test Report
© Southern California Edison 2015
Advanced Technology 14799 Chestnut Street, Westminster, California 92683 USA DER Laboratory Research
Page 122 of 147
8.9 Voltage Ramps
Voltage was ramped down and back up multiple times in 10% decrements until the
VFD A/C unit tripped while ramping down to 60% nominal voltage. Accordingly, the
following figure shows the load performance at different voltage levels during
continuous operation (down to 70% nominal voltage).
Similar to VFD A/C #4, the unit has a delay in the control response for current and
real power. Current initially decreases initially by 11% below nominal at the
beginning of the 2 second ramp and increases to approximately 15% above nominal
as voltage recovers. For the 8 second ramp test however, current ramps up to 45%
above nominal before reducing during voltage recovery. Current, real, and reactive
power are all above their nominal values as voltage returns to steady state and take
approximately 1.5 to 4 seconds before they reach steady state.
Figure 8.9.1 VFD A/C #6 Voltage Ramp Down to 70% (2 & 8 sec.)

Residential Air Conditioner with VFD Test Report
© Southern California Edison 2015
Advanced Technology 14799 Chestnut Street, Westminster, California 92683 USA DER Laboratory Research
Page 123 of 147
Voltage was ramped up to 110% and back down steady state voltage at different
ramp rates to demonstrate the load performance while operating at over-voltage
values.
Current is decreases as low as 10% below nominal in response to the voltage ramp.
Real power consumption stays within +4% of steady state for the 8 second ramp
tests, but increases up to 10% above nominal for the 2 second ramp test due to the
delayed response of current. Reactive power is ramps up and back down with
voltage, peaking at approximately 11% of nominal.
Figure 8.9.2 VFD A/C #6 Voltage Ramp Up to 110% (in 2 & 8 sec.)

Residential Air Conditioner with VFD Test Report
© Southern California Edison 2015
Advanced Technology 14799 Chestnut Street, Westminster, California 92683 USA DER Laboratory Research
Page 124 of 147
8.10 Frequency Ramps
Frequency was ramped down to 50 Hz and back up to 60 Hz at different ramp rates
to demonstrate the load performance while operating at lower frequency values as
shown in the figure below.
It appears the VFD is attempting to maintain motor load when there are large
deviations in grid frequency. Following an increase of 10%, current slowly decreases
during the frequency ramp test as low as 6% below nominal. Real power does not
fall below its nominal consumption. Reactive power decreases down to 20% below
steady state during the under-frequency ramp.
Figure 8.10.1 VFD A/C #6 Frequency Ramp Down to 50 Hz (in 2 & 8 sec.)

Residential Air Conditioner with VFD Test Report
© Southern California Edison 2015
Advanced Technology 14799 Chestnut Street, Westminster, California 92683 USA DER Laboratory Research
Page 125 of 147
Frequency was ramped up to 70 Hz and back down to 60 Hz at different ramp rates
to demonstrate the load performance while operating at higher frequency values as
shown in the figure below.
Current slowly ramps down until plateauing at approximately 15% below nominal
current. Real power remains relatively close to steady state consumption throughout
the frequency ramp. Reactive power displays the greatest decrease in consumption
as it ramps up until it at 43% below its nominal value.
Figure 8.10.2 VFD A/C #6 Frequency Ramp Up to 70 Hz (in 2 & 8 sec.)

Residential Air Conditioner with VFD Test Report
© Southern California Edison 2015
Advanced Technology 14799 Chestnut Street, Westminster, California 92683 USA DER Laboratory Research
Page 126 of 147
8.11 Harmonics Contribution
Steady state voltage and current sinusoidal waveform data was captured multiple
times without scope filters to calculate the actual harmonic contribution of VFD A/C
unit #6 to the grid. The maximum total harmonic distortion for current was found to
be nearly 47.5% of the fundamental. This unit has that largest current harmonic
distortion of all the VFD A/C units which is clear when observing the current
waveforms in Figure 8.0.1. The following table gives the total harmonic distortion
calculations and the figure plots the individual harmonic values.
Data Set #
THD (% of Fundamental)
V(L1-L2) I(L1) I(L2)
1 0.41 46.55 46.28
2 0.40 46.48 46.11
3 0.39 47.43 47.49
Table 8.11.1 VFD A/C #6 Total Harmonic Distortion
Figure 8.11.1 VFD A/C #6 Harmonics Contribution

Residential Air Conditioner with VFD Test Report
© Southern California Edison 2015
Advanced Technology 14799 Chestnut Street, Westminster, California 92683 USA DER Laboratory Research
Page 127 of 147
8.12 Conservation Voltage Reduction
Voltage was decreased by 1% nominal voltage in 5 second intervals down to 90%
before recovering back to steady state as shown in the figure below.
Current increases by approximately 0.9% of nominal current for every 1% decrease
in nominal voltage. Real power remains relatively constant, within +4% of nominal,
over the course of the CVR test. Reactive power is observed decreasing by
approximately 1.2% of nominal for every 1% decrease in voltage.
Figure 8.12.1 VFD A/C #6 CVR Response Down to 90% Voltage

Residential Air Conditioner with VFD Test Report
© Southern California Edison 2015
Advanced Technology 14799 Chestnut Street, Westminster, California 92683 USA DER Laboratory Research
Page 128 of 147
Alternatively, the main terminal voltage at the VFD A/C unit was increased by 1%
nominal voltage in 5 second intervals up to 105% before stepping back to steady
state as shown in the figure below.
Current does not decrease as expected over the course of the CVR test. Current
steps to as low as 3% below nominal when voltage is 3% above nominal during
recovery. Real power consumption increases as much as 4.5% above its nominal
value. Reactive power increases as much as 8.5% above its nominal value.
Figure 8.12.2 VFD A/C #6 CVR Response Up to 105% Voltage

Residential Air Conditioner with VFD Test Report
© Southern California Edison 2015
Advanced Technology 14799 Chestnut Street, Westminster, California 92683 USA DER Laboratory Research
Page 129 of 147
9.0 VFD AIR CONDITIONER #7 TEST RESULTS
The figure below shows a snapshot of VFD A/C unit #7 sinusoidal voltages and currents
captured at the main terminals and compressor motor using a filter on the digital scope. Notice
the slight distortion in the main current waveforms compared to the voltage waveforms. The
compressor is shown operating at approximately 265 Volts peak, 10 Amps peak, and 240 Hz
at the present loading condition. The specifications for the VFD A/C #7 components are
provided in the table below.
Figure 9.0.1 VFD A/C #7 Voltage and Current Waveforms
Manufacturer LG
Voltage (V) 230
Refrig. R-410A
SEER 16.1
Compressor, Model # LG GJT240MBA
Compressor, RLA (Amps) 14.6
Compressor, LRA (Amps) -
Outdoor Fan Motor, FLA (Amps) 0.25
Indoor Fan Motor, FLA (Amps) 0.50
Design Pressure High (PSI) 450
Design Pressure Low (PSI) 240
Table 9.0.1 VFD A/C #7 Specifications

Residential Air Conditioner with VFD Test Report
© Southern California Edison 2015
Advanced Technology 14799 Chestnut Street, Westminster, California 92683 USA DER Laboratory Research
Page 130 of 147
9.1 Compressor Shutdown
VFD A/C #7 was shut down during normal operation using the programmable
thermostat remote for the indoor blower unit. The figure below displays the
measurements taken at the main terminal connections of the entire A/C unit.
After adjusting the thermostat, the indoor unit, outdoor unit, and compressor shut
down right away. The delay time for air conditioner current to ramp down is
approximately 2.4 cycles. While in standby mode, the device’s power consumption is
less than 0.65 Amps.
Figure 9.1.1 VFD A/C #7 Compressor Shutdown

Residential Air Conditioner with VFD Test Report
© Southern California Edison 2015
Advanced Technology 14799 Chestnut Street, Westminster, California 92683 USA DER Laboratory Research
Page 131 of 147
9.2 Inrush Current
After starting up the VFD A/C unit via the programmable thermostat remote, the
device does not initially display any sign of significant inrush current. The unit slowly
ramps up over the course of approximately 27 seconds until the unit is drawing a
minimum of 3.6 Amps. A spike in current 5.6 Amps, is observed at the end of the
current ramp up. The VFD controlled compressor will increase in intervals over the
course of several minutes to meet temperature demand until the unit is more heavily
loaded. The room temperature was approximately 79 degrees Fahrenheit and the
unit would typically operate between 11 and 12 Amps steady state.
Figure 9.2.1 VFD A/C #7 Inrush Current

Residential Air Conditioner with VFD Test Report
© Southern California Edison 2015
Advanced Technology 14799 Chestnut Street, Westminster, California 92683 USA DER Laboratory Research
Page 132 of 147
9.3 Balanced & Unbalanced Under-voltages
After performing various under-voltages on VFD A/C #7 in decrements of 10%, the
compressor is observed disconnecting at different voltage magnitudes depending on
the duration of the under-voltage transient. Longer voltage sags with a duration of
130 cycles to 9 cycles caused the compressor to shut down consistently at 60%
nominal voltage. Voltage sags with a duration time of 6 and 3 cycles typically caused
the compressor to disconnect at 50% nominal voltage. Finally, voltage sags with a
duration time of 1 cycle typically caused the compressor to disconnect at 40%
nominal voltage. The VFD A/C unit often disconnects the compressor up to 1.2
cycles after voltage recovered for the quicker voltage sags as shown in Table 9.3.1.
This may be caused by the sudden increase in current as voltage returns to nominal
or logic on the PCB controller.
Data captured several seconds after the disconnection of the compressors did not
reveal restarting behavior and therefore reclose times were not captured. This
indicates that there must be a protective relay and associated delay times
programmed into the local controller of the VFD A/C unit to prevent immediate
restarting. The compressor would only restart approximately 5 minutes or so after
tripping occurred.
The following figure visually displays one of these balanced tests where the under-
voltage sags have a duration time of 130 cycles. The compressor is observed being
disconnected towards the beginning of the 60% voltage sag, within 15 cycles. The
following table provides additional details regarding the compressor operation during
a variety of balanced under-voltage transient tests including the voltage where the
unit was tripped (Vtrip) as well as the time it took for the unit controls to trip it offline
after the start of the voltage sag (ttrip).

Residential Air Conditioner with VFD Test Report
© Southern California Edison 2015
Advanced Technology 14799 Chestnut Street, Westminster, California 92683 USA DER Laboratory Research
Page 133 of 147
Figure 9.3.1 VFD A/C #7 Balanced Under-voltage Response (130 cycles)
Under-Voltage Transient Compressor
Volt Range Duration (cyc) Vtrip (%) ttrip (cyc)
100%, 90%, 80%,... 0% 130
60% 15
60% 13.8
60% 11.4
100%, 90%, 80%,... 0% 12
60% 10.2
50% 7.2
50% 10.2
100%, 90%, 80%,... 0% 9
60% 10.2
60% 9.6
60% 9.6
100%, 90%, 80%,... 0% 6
50% 7.2
50% 6
50% 6.6
100%, 90%, 80%,... 0% 3
50% 4.2
50% 4.2
50% 4.2
100%, 90%, 80%,... 0% 1
40% 1.4
10% 1.4
40% 1
Table 9.3.1 VFD A/C #7 Balanced Under-voltages in 10% Decrements Results

Residential Air Conditioner with VFD Test Report
© Southern California Edison 2015
Advanced Technology 14799 Chestnut Street, Westminster, California 92683 USA DER Laboratory Research
Page 134 of 147
The specific voltage where the compressors are disconnected and/or the controls
dropped were identified by performing additional balanced under-voltage tests in
decrements of 1% nominal voltage. Most tests showed that the compressor could
begin tripping off for voltage sags between 62% and 60% nominal voltage. Under-
voltage transients lasting 3 cycles revealed tripping at 54% nominal voltage and 1
cycle transients revealed tripping at 49% nominal voltage. In each test, the
compressor was tripped either at the end of the voltage sag or within 1.2 cycles after
the voltage had already recovered. This could be caused by the inrush current at the
end of the voltage sag or possibly the controller PCB to preventing loss of load until
voltage is at or near steady state. The following table provides the details of the
compressor disconnection behavior during these 1% voltage decrement tests.
Under-Voltage Transient Compressor
Volt Range Duration (cyc) Vtrip (%) ttrip (cyc)
70%, 69%, 68%,… 130 62% 129.6
70%, 69%, 68%,… 12 60% 12
70%, 69%, 68%,… 9 62% 10.2
70%, 69%, 68%,… 6 62% 7.2
60%, 59%, 58%,… 3 54% 4.2
60%, 59%, 58%,… 1 49% 1.9
Table 9.3.2 VFD A/C #7 Balanced Under-voltages in 1% Decrements Results
The unbalanced under-voltages on VFD A/C #7 resulted in compressor trip voltages
and trip times similar to those observed during balanced under-voltage conditions
with respect to the line-to-line voltage. Although the unit does not trip until one line
under-voltage sags with a duration of 3 to 130 cycles reach either 20% or 10% line-
to-neutral, this is equivalent to 60% or 55% line-to-line nominal voltage. The 1 cycle
voltage sags were similarly consistent tripping at 50% line-to-line nominal voltage.
These results suggest that the power electronic controls that operate the
compressor of this particular VFD unit rely on the voltage potential across both lines.
The following figure shows an example of these unbalanced cases (Line 2 under-
voltages for 130 cycles) where the compressor is disconnected at 20% line-to-
neutral nominal voltage 18.6 cycles after the beginning of the voltage sag. The

Residential Air Conditioner with VFD Test Report
© Southern California Edison 2015
Advanced Technology 14799 Chestnut Street, Westminster, California 92683 USA DER Laboratory Research
Page 135 of 147
following table provides the unbalanced voltage transients performed at the main
terminals of the VFD A/C unit. Please note that many of the unbalanced tests shown
in the table exhibit tripping either at the end of the voltage sag or after voltage
recovers to nominal, similar to some of the balanced under-voltage tests.
Figure 9.3.2 VFD A/C #7 Unbalanced Under-voltage Response (Line 1, 130 cycles)
Under-Voltage Transient Compressor
Lines Volt Range Duration (cyc) Vtrip L-N (%) Vtrip L1-L2 (%) ttrip (cyc)
L1 100%, 90%, 80%,... 0%
130 10% 55% 15
12 20% 60% 12.6
6 20% 60% 6
3 20% 60% 3
1 0% 50% 1.8
L2 100%, 90%, 80%,... 0%
130 20% 60% 18.6
12 20% 60% 12
6 20% 60% 6
3 10% 55% 3
1 0% 50% 2.4
Table 9.3.3 VFD A/C #7 Unbalanced Under-voltage Results

Residential Air Conditioner with VFD Test Report
© Southern California Edison 2015
Advanced Technology 14799 Chestnut Street, Westminster, California 92683 USA DER Laboratory Research
Page 136 of 147
9.4 Balanced & Unbalanced Over-voltages
VFD A/C #7 was subjected to balanced and unbalanced over-voltages within the
parameters of the ITIC (CBEMA) curve to avoid damaging any voltage sensitive
equipment. These tests include multiple voltage swells performed in 2% increments
for up to 120% nominal voltage to identify any tripping behavior. No over-voltage
protection was observed during any of these tests, only voltage ride-through. The
following figure shows a sample over-voltage test and the following table specifies
the types of tests performed.
Figure 9.4.1 VFD AC #7 Balanced Over-voltage Response (20 cycles)
Over-Voltage Transient Compressor
Lines Volt Range Duration (cyc) Vtrip L-N (%) Vtrip L1-L2 (%) ttrip (cyc)
L1 & L2 100%, 102%, 104%,... 120% 20 N/A N/A N/A
L1 100%, 102%, 104%,... 120% 20 N/A N/A N/A
L2 100%, 102%, 104%,... 120% 20 N/A N/A N/A
Table 9.4.1 VFD A/C #7 Balanced & Unbalanced Over-voltage Results

Residential Air Conditioner with VFD Test Report
© Southern California Edison 2015
Advanced Technology 14799 Chestnut Street, Westminster, California 92683 USA DER Laboratory Research
Page 137 of 147
9.5 Voltage Oscillations
The following figure shows the performance of VFD A/C #7 during voltage
oscillations between 100% and 90% nominal voltage for a variety of swing
frequencies or oscillation rates.
The VFD appears to be maintaining the speed and consumption of the compressor
motor. Current at the main terminals of the unit oscillates in the opposite direction of
voltage, between 10% and 11% above nominal, to minimize any oscillations or
deviations in real power for all swing frequencies. The consumption of real power
remains relatively constant within 3% of nominal during the voltage oscillations.
However, deviates further from steady state at higher swing frequencies.
Reactive power consumption is very low since the power factor is greater than 0.99
for the device. Therefore any minor change in reactive load, even during steady
state, results in drastic changes to the per unit values. As a result, reactive power
was not included in the figure below.
Figure 9.5.1 VFD AC #7 Voltage Oscillation Response (0.10, 0.25, 0.70, 1.0, 2.0 Hz)

Residential Air Conditioner with VFD Test Report
© Southern California Edison 2015
Advanced Technology 14799 Chestnut Street, Westminster, California 92683 USA DER Laboratory Research
Page 138 of 147
9.6 Under-frequency Events
After subjecting VFD A/C #7 to multiple under-frequency transients with different
duration times, it is presumed that the unit does not have under-frequency protection
while operating between 60 Hz and 58 Hz. The device simply rides through these
under-frequency conditions. The constant current suggests the VFD is also
maintaining frequency at the motor. The following figure and table identify the
magnitude and duration of the frequency transient tests that were performed.
Figure 9.6.1 VFD A/C #7 Under-frequency Response (130, 12, 3 cycles)
Under-Frequency Transient Compressor
Frequency Range Duration (cyc) Ftrip (Hz) ttrip (cyc)
60Hz, 59.8Hz, 59.6Hz,... 58Hz 130 N/A N/A
60Hz, 59.8Hz, 59.6Hz,... 58Hz 12 N/A N/A
60Hz, 59.8Hz, 59.6Hz,... 58Hz 3 N/A N/A
Table 9.6.1 VFD A/C #7 Under-frequency Test Results

Residential Air Conditioner with VFD Test Report
© Southern California Edison 2015
Advanced Technology 14799 Chestnut Street, Westminster, California 92683 USA DER Laboratory Research
Page 139 of 147
9.7 Over-frequency Events
Similar to the under-frequency tests, VFD A/C #7 was subjected to over-frequency
transients to 62 Hz without triggering any protection. The unit rode through and
continued operating during these frequency conditions. The motor frequency is
maintained by the VFD. The following figure and table identify the magnitude and
duration of the specific over-frequency tests that were performed.
Figure 9.7.1 VFD A/C #7 Over-frequency Response (130, 12, 3 cycles)
Over-Frequency Transient Compressor
Frequency Range Duration (cyc) Ftrip (Hz) ttrip (cyc)
60Hz, 59.8Hz, 59.6Hz,... 58Hz 130 N/A N/A
60Hz, 59.8Hz, 59.6Hz,... 58Hz 12 N/A N/A
60Hz, 59.8Hz, 59.6Hz,... 58Hz 3 N/A N/A
Table 9.7.1 VFD A/C #7 Over-frequency Test Results

Residential Air Conditioner with VFD Test Report
© Southern California Edison 2015
Advanced Technology 14799 Chestnut Street, Westminster, California 92683 USA DER Laboratory Research
Page 140 of 147
9.8 Frequency Oscillations
The following figure shows the performance of VFD A/C #7 during frequency
oscillations between 59 Hz and 61 Hz for different swing frequencies or oscillation
rates (0.10, 0.25, 0.70, 1.0, and 2.0 Hz).
Motor consumption is held near constant by the performance of the VFD. Current
does not oscillate or deviate in response to frequency oscillations at the main
terminals of the A/C unit. The active power consumption remains constant as well,
within +1% of its steady state value along with current for all swing frequencies or
oscillation rates.
Reactive power was not included in the figure below because of its low consumption
(power factor is greater than 0.99). Even minor deviations that naturally occur during
steady state cause significant changes to the per unit values plotted.
Figure 9.8.1 VFD A/C #7 Frequency Oscillation Response (0.10, 0.25, 0.70, 1.0, 2.0 Hz)

Residential Air Conditioner with VFD Test Report
© Southern California Edison 2015
Advanced Technology 14799 Chestnut Street, Westminster, California 92683 USA DER Laboratory Research
Page 141 of 147
9.9 Voltage Ramps
Voltage was ramped down and back up multiple times in 10% decrements until the
A/C unit tripped while ramping down to 60% nominal voltage. Accordingly, the
following figure shows the load performance at different voltage levels during
continuous operation (down to 70% nominal voltage).
The VFD is doing an excellent job managing the consumption and speed of the
compressor motor. Current ramps up to approximately 45% above nominal while
voltage ramps down to 30% below nominal. Real power consumption is held
constant for both the 2 and 8 second voltage ramp tests, within +3% of nominal.
Reactive power consumption is low due to the large power factor, but it ramps up to
nearly 80% above of its nominal value.
Figure 9.9.1 VFD A/C #7 Voltage Ramp Down to 70% (2 & 8 sec.)

Residential Air Conditioner with VFD Test Report
© Southern California Edison 2015
Advanced Technology 14799 Chestnut Street, Westminster, California 92683 USA DER Laboratory Research
Page 142 of 147
Voltage was ramped up to 110% and back down steady state voltage at different
ramp rates to demonstrate the load performance while operating at over-voltage
values.
Similar to the under-voltage ramp test, motor speed is held constant by the VFD.
Current is observed ramping down to nearly 10% below nominal in response to
voltage. Real power consumption remain relatively close to nominal for most of the
voltage ramp, within +2% of steady state. Reactive power ramps down to 35% below
its nominal value. However, little reactive power is consumed during normal
operation due to a large power factor.
Figure 9.9.2 VFD A/C #7 Voltage Ramp Up to 110% (in 2 & 8 sec.)

Residential Air Conditioner with VFD Test Report
© Southern California Edison 2015
Advanced Technology 14799 Chestnut Street, Westminster, California 92683 USA DER Laboratory Research
Page 143 of 147
9.10 Frequency Ramps
Frequency was ramped down to 50 Hz and back up to 60 Hz at different ramp rates
to demonstrate the load performance while operating at lower frequency values as
shown in the figure below.
Current and real power remain relatively constant throughout the entire under-
frequency ramp, within +2% of respective nominal values. Reactive power
consumption is low, but does deviate by up to 8% from nominal.
Figure 9.10.1 VFD A/C #7 Frequency Ramp Down to 50 Hz (in 2 & 8 sec.)

Residential Air Conditioner with VFD Test Report
© Southern California Edison 2015
Advanced Technology 14799 Chestnut Street, Westminster, California 92683 USA DER Laboratory Research
Page 144 of 147
Frequency was ramped up to 70 Hz and back down to 60 Hz at different ramp rates
to demonstrate the load performance while operating at higher frequency values.
However, VFD A/C #7 tripped at approximately 67.5 Hz and the test was redone
ramping frequency up to 65 Hz as shown in the figure below.
Similar to VFD A/C #1, current stays constant at the beginning of the test until
frequency reaches 64 Hz. At this point the current ramps up with frequency until
peaking at 6% above nominal. Real power consumption is constant throughout the
entire test. Reactive power, like current, begins ramping after frequency goes above
64 Hz and peaks at approximately 268% of nominal before ramping down. The
device is operating at a power factor greater than 0.99 and therefore this amount of
reactive power consumption is low.
Figure 9.10.2 VFD A/C #7 Frequency Ramp Up to 65 Hz (in 2 & 8 sec.)

Residential Air Conditioner with VFD Test Report
© Southern California Edison 2015
Advanced Technology 14799 Chestnut Street, Westminster, California 92683 USA DER Laboratory Research
Page 145 of 147
9.11 Harmonics Contribution
Steady state voltage and current sinusoidal waveform data was captured multiple
times without scope filters to calculate the actual harmonic contribution of VFD A/C
unit #7 to the grid. The maximum total harmonic distortion of current was calculated
as 14.41% of the fundamental. The following table gives the total harmonic distortion
calculations and the figure plots the individual harmonic values.
Data Set #
THD (% of Fundamental)
V(L1-L2) I(L1) I(L2)
1 0.48 14.36 14.41
2 0.47 14.30 14.34
3 0.46 14.21 14.26
Table 9.11.1 VFD A/C #7 Total Harmonic Distortion
Figure 9.11.1 VFD A/C #7 Harmonics Contribution

Residential Air Conditioner with VFD Test Report
© Southern California Edison 2015
Advanced Technology 14799 Chestnut Street, Westminster, California 92683 USA DER Laboratory Research
Page 146 of 147
9.12 Conservation Voltage Reduction
Voltage was decreased by 1% nominal voltage in 5 second intervals down to 90%
before recovering back to steady state as shown in the figure below.
CVR will not be effective on this particular load based on the following results.
Current increases by approximately 1.1% of nominal current for every 1% decrease
in nominal voltage over the course of the CVR test. Therefore the real power
consumption is nearly constant, within +2% of nominal. Reactive power slowly
increases over time, but the nominal consumption is still low due to high power
factor.
Figure 9.12.1 VFD A/C #7 CVR Response Down to 90% Voltage

Residential Air Conditioner with VFD Test Report
© Southern California Edison 2015
Advanced Technology 14799 Chestnut Street, Westminster, California 92683 USA DER Laboratory Research
Page 147 of 147
Alternatively, the main terminal voltage at the VFD A/C unit was increased by 1%
nominal voltage in 5 second intervals up to 105% before stepping back to steady
state as shown in the figure below.
Again, CVR does not have a beneficial impact on the load consumption. The current
decreases by approximately 1% of nominal for every 1% increase in nominal
voltage. Therefore real power remains near its steady state consumption, with +2%
of nominal. Reactive power consumption slowly decreases during the CVR test, but
is consumption is low during steady state as well.
Figure 9.12.2 VFD A/C #7 CVR Response Up to 105% Voltage