Matthew O. Akpan et al., IJSIT, 2014, 3(5), 505-515
IJSIT (www.ijsit.com), Volume 3, Issue 5, September-October 2014
505
RESERVOIR GEOLOGY AND SEQUENCE STRATIGRAPHY OF DEEP WATER
SEDIMENTS, OFFSHORE DEPOBELT, NIGER DELTA, NIGERIA
Matthew O. Akpan1, M.N.Oti2 and Monday U. Udoh3
1,2Department of Geology, University of Port Harcourt, Port Harcourt, Nigeria.
3Pioneer Alfa Petroleum Services Ltd, Benin City, Nigeria.
ABSTRACT
Lithofacies, depositional sequences and reservoir stratigraphy of the Deep Offshore Field, otherwise
tagged ‘E-Field’, located in the Southeastern Niger Delta; were studied by employing log-motif patterns
defined for fluvial, deltaic, shelfal, slope and basinal facies. Gas-bearing sands and gas/oil contacts were
identified from density logs in combination with neutron porosity logs. The resulting analyses and
interpretation of wells in this field showed that there are nine (9) hydrocarbon-bearing reservoirs: E-R1, E-
R2, E-R3, E-R4, E-R5, E-R6, E-R7, E-R8 and E-R9. These reservoirs were easily identified on the logs and they
have different characteristics and quality which are controlled by the environments of deposition. A total of
twenty-four (24) reservoir sand bodies with variable net thicknesses varying from 25–150m in places had
been inferred. The average net thickness (h), porosity, effective porosity, clay volume and water saturation of
135m (approximately 473ft), 0.26, 0.22, 0.16 and 0.00252, respectively were estimated. These sands are
Miocene to Early Pliocene in age and could be interpreted to relate to the periods of base level fall, if not
Global Eustatic Lowstands. The E-field reservoir sands consist principally of one or more of the following
genetic types: deltaic distributary mouth bars, channel and shoreface sands, barrier beach, shelf and offshore
turbidite sands. The recognition of depositional surfaces on the stratigraphic cross-sections allows
subdivision of the stratigraphy into systems tracts: HST, FSST, TST and LST. The pinch-out channel sands and
lenticular reservoir sand-bodies are common stratigraphic traps duly observed.
Matthew O. Akpan et al., IJSIT, 2014, 3(5), 505-515
IJSIT (www.ijsit.com), Volume 3, Issue 5, September-October 2014
506
INTRODUCTION
Detailed studies on Niger Delta tectonics, stratigraphy, depositional environments, petro-physics,
sedimentology and hydrocarbon potential are well documented in the literature, but only a few full papers
have been published (e.g; Weber,1971,Oomkens,1974; Weber and Daukoru,1975; Evamy et al; 1978; Peters,
1983; Knox and Omatsola, 1989; Beka and Oti,1995; Oti and Postma, 1995; Amajor, 1991, Hooper et al, 2002;
Peters and Reijers, 1990, Nton and Adesina, 2009; Koledoye et al, 2003). Some studies such as Doust and
Omatsola, 1990; Reijers et al, 1997 and Bruso et al; 2004 have related the depositional units of the delta to
those of the surrounding basins in southern and southeastern Nigeria.
Sequence analyses of well-log suite, seismic and biostratigraphic data employed in this study were on
the basis of identification of periods of basin margin progradation, aggradation and retrogradation and the
recognition of variations of relative sea level.
Wireline logs measure the electrical, radioactive and acoustic properties of rocks, which were used to
derive information on lithology, grain size, density, porosity and pore fluids. Using these data, log facies were
defined and depositional sequences identified. Here, the nature of the parasequence geology depends on the
facies associations and several end-members are described. The most common is the coarsening-up signature
widely recognized in parasequence from non-marine to marine settings.
The study of E-Field Wells reveals that there are nine (9) hydrocarbon - bearing reservoirs: E-R1, E-
R2, E-R3, E-R4, E-R5, E-R6, E-R7, E-R8 and E-R9. Each reservoir in the E-Field was easily identified on the logs.
The gamma ray log shows the E-field reservoir sandstone as a low gamma ray reading unit. Interrelated
siltstone, mudstone and shaly partings show as minor deflections within the sandstone unit. The log is
characterized by relatively higher resistivities opposite the sandstone than the subjacent and superjacent
shales. On the neutron density curve, the gross ‘E-Field’ well sandstone shows increasing density porosity
values, and decreasing neutron porosity values. This depicts gas-bearing effect superimposed on the lithology
effect as evidenced by the divergence of the two (2) curves. In addition, minor influence on the separation of
the two (2) curves indicates oil bearing reservoir.
The excellent reservoir characteristics in the E-field are probably a consequence of several factors:
their quartz-dominated mineralogy; long residence in mildly over-pressured environments that probably
built diagenetic effects; and their easily hydrocarbon charge in a multi-source, evaporative – fractionated
petroleum system that has been generating and pooling hydrocarbons since, at least, the Neogene.
In addition, the hydrocarbon filled sandstones: E-R1, E-R2, E-R3, E-R4, E-R5, E-R6, E-R7, E-R8 and E-R9
were seismically represented by a high amplitude reflection event. Lower E-R2 sandstones are more
lenticular and underlain by slope shales. E-R7 sandstones are the main oil producing and averaged
approximately 64.2m; which is equivalent of 210.53 feet in thickness. On the stratigraphic cross-section, the
reservoirs consist of series of shallow-marine and marine parasequences arranged in progradational and
retrogradational stacks. The maximum flooding surfaces and maximum progradation surfaces were used to
guide the reservoir stratigraphy.
Matthew O. Akpan et al., IJSIT, 2014, 3(5), 505-515
IJSIT (www.ijsit.com), Volume 3, Issue 5, September-October 2014
507
The maximum prograding surface in a type 1 sequence lies at the top of the lowstand prograding
wedge and marks the time of turn-around between progradation and retreat.
METHODOLOGY
The methodology employed in this study is fully discussed in Vail and Wornardt,1990, 1991;
Mitchum et al,1993; Van Wagoner et al, 1990; Armentrout et al; 1990; Vail and Jervey,1977;1988; amongst
others. Conceptual models for depositional systems tracts are also presented in Posamentier and Vail, 1988;
1992; Emery and Myers, 1996; Catuneanu, 2006; Embry, 2009.
The boundaries of systems tracts identified on well logs were marked on two-way-time logs and then
correlated with the corresponding systems tracts that had been independently identified on the seismic
profiles using seismic-stratigraphic principles. Faunal abundance and diversity data plus paleo-bathymetric
interpretation provided extremely valuable data to make reproducible chronostratigraphic correlations and
to identify the rock types in relation to the depositional environments and systems tracts.
The well logs data provided for this study includes: Gamma ray (GR) logs; Porosity logs which are:
Neutron log (NPHI); Bulk Density log (RHOB) and Sonic log (Acoustic velocity log) (DT). Others include:
Resistivity logs:(Deep induction log (ILD); Deep Laterology (LLD); Shallow Laterology (LLS); Short Normal
Induction Log (SN).The well logs and seismic section are scaled 1/10,000 and 50,000 or 10.0cm/second,
respectively.
Neutron log (NPHI) was used in combination with the density log (RHOB) and sandstone porosity log
scaled from + 1.55 to 2.75 g/cm3 and +63 to – 9%, respectively. The Neutron log (NPHI) and Bulk density logs
(RHOB) are recorded on a compatible sandstone porosity scale allowing immediate hydrocarbon
identification as well as a quick estimate of true porosity.
In this study, neutron and density curves practically overlay over the whole porosity range in clean
water-bearing sandstones. A departure between these two curves, according to Schlumberger, 1989,
indicates that the lithology or fluid content does not correspond to that of clean water-bearing sandstone. The
separation of the NPHI and RHOB curves indicates that there is obviously a considerable amount of residual
hydrocarbons and/or shallow invasion.
The stratigraphic column covering the study area was used as a basic tool for interpreting facies,
mapping description or correlation, and virtually any other approach to understanding strata and their origin.
The biostratigraphic / paleobathymetric reports of reference wells: EW-E and EW-F were provided for
mapping and interpreting the first appearance or inception (FAD) and the last appearance or extinction
(LAD) of fossil species in the rock record and to establish useful markers for biostratigraphic correlation. Bio-
facies data were used in conjunction with facies interpretation derived from seismic and well logs studies.
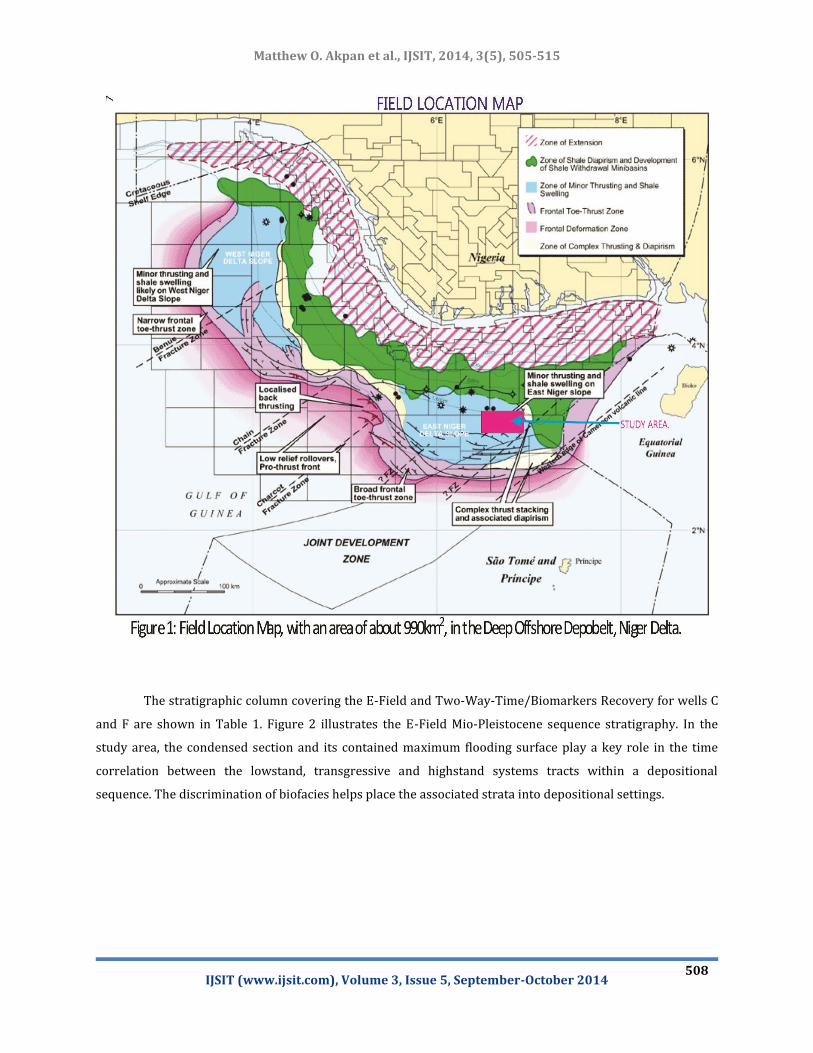
Detailed study of the seismic data provided for this work shows that the ‘E-Field’ strata were deposited in the
south eastern Niger Delta; a broad region from the shelf – slope break extending to the Ultra Deep Waters (>
1500m) (Figure 1).
Matthew O. Akpan et al., IJSIT, 2014, 3(5), 505-515
IJSIT (www.ijsit.com), Volume 3, Issue 5, September-October 2014
508
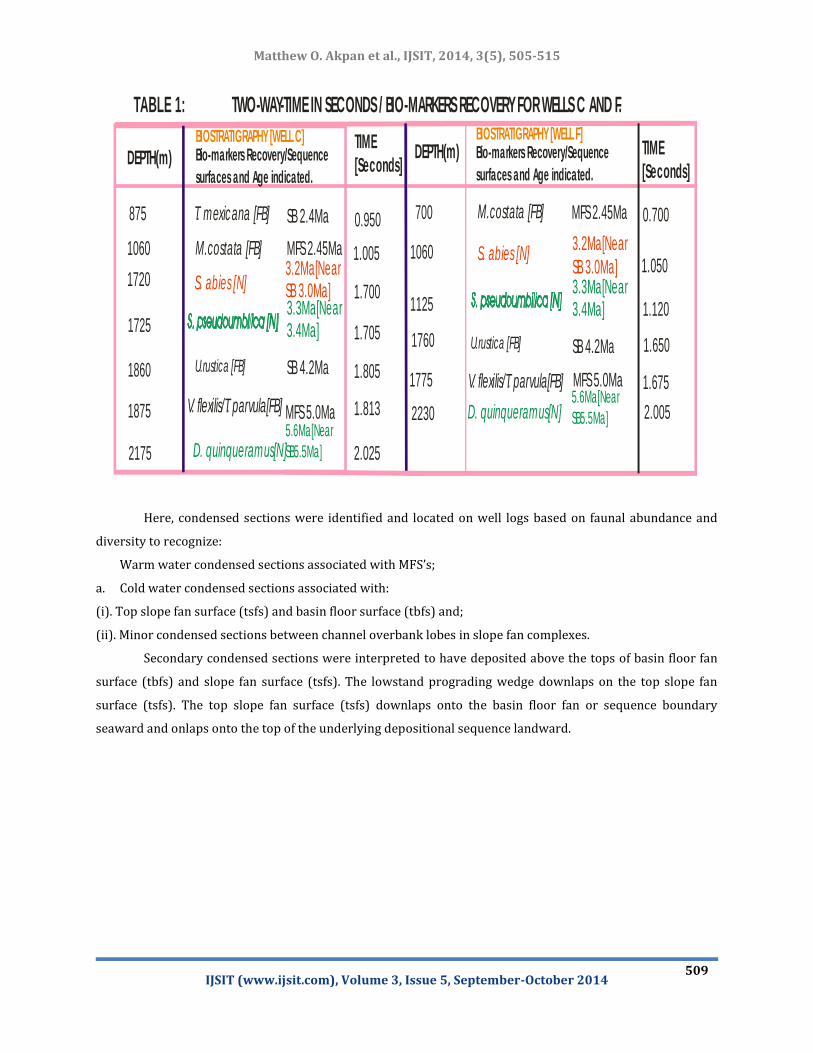
The stratigraphic column covering the E-Field and Two-Way-Time/Biomarkers Recovery for wells C
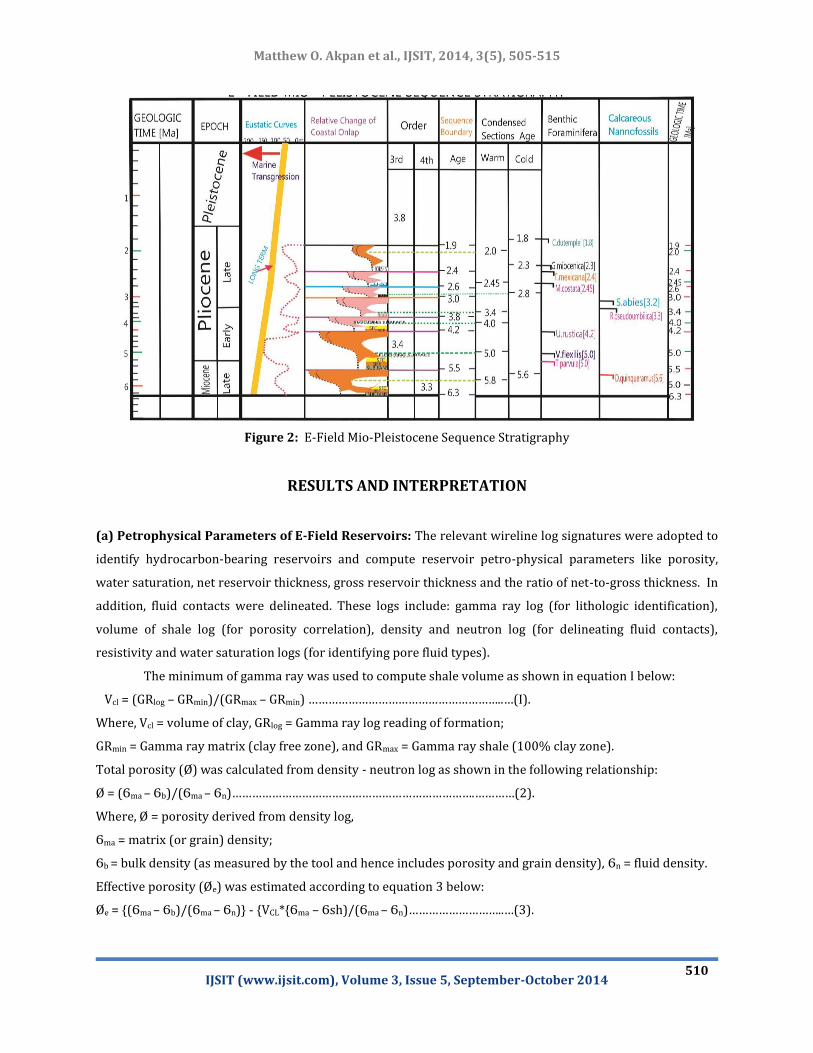
and F are shown in Table 1. Figure 2 illustrates the E-Field Mio-Pleistocene sequence stratigraphy. In the
study area, the condensed section and its contained maximum flooding surface play a key role in the time
correlation between the lowstand, transgressive and highstand systems tracts within a depositional
sequence. The discrimination of biofacies helps place the associated strata into depositional settings.
Matthew O. Akpan et al., IJSIT, 2014, 3(5), 505-515
IJSIT (www.ijsit.com), Volume 3, Issue 5, September-October 2014
509
DEPTH(m) DEPTH(m)BIOSTRATIGRAPHY [WELL C]Bio-markers Recovery/Sequence
surfaces and Age indicated.
BIOSTRATIGRAPHY [WELL F]Bio-markers Recovery/Sequence
surfaces and Age indicated.
TIME
[Seconds]TIME
[Seconds]
875 T. mexicana [FB] SB 2.4Ma
1060 1060 M.costata [FB]
M.costata [FB]
MFS 2.45Ma
MFS 2.45Ma
1720 S. abies [N]
S. abies [N]3.2Ma[Near SB 3.0Ma]
3.2Ma[Near
SB 3.0Ma]
17253.3Ma[Near 3.4Ma]
3.3Ma[Near 3.4Ma]
1860 U.rustica [FB]
U.rustica [FB]
SB 4.2MaSB 4.2Ma
1875 V. flexilis/T. parvula[FB]
V. flexilis/T. parvula[FB]
MFS 5.0Ma
MFS 5.0Ma
2175 D. quinqueramus[N]
D. quinqueramus[N]5.6Ma[Near
SB5.5Ma]
5.6Ma[Near
SB5.5Ma]
700
1125
1760
1775
2230
0.950
1.005
1.700
1.705
0.700
1.650
1.675
2.005
1.120
1.050
1.805
1.813
2.025
TWO-WAY-TIME IN SECONDS / BIO-MARKERS RECOVERY FOR WELLS C AND F.TABLE 1:
Here, condensed sections were identified and located on well logs based on faunal abundance and
diversity to recognize:
Warm water condensed sections associated with MFS’s;
a. Cold water condensed sections associated with:
(i). Top slope fan surface (tsfs) and basin floor surface (tbfs) and;
(ii). Minor condensed sections between channel overbank lobes in slope fan complexes.
Secondary condensed sections were interpreted to have deposited above the tops of basin floor fan
surface (tbfs) and slope fan surface (tsfs). The lowstand prograding wedge downlaps on the top slope fan
surface (tsfs). The top slope fan surface (tsfs) downlaps onto the basin floor fan or sequence boundary
seaward and onlaps onto the top of the underlying depositional sequence landward.
Matthew O. Akpan et al., IJSIT, 2014, 3(5), 505-515
IJSIT (www.ijsit.com), Volume 3, Issue 5, September-October 2014
510
Figure 2: E-Field Mio-Pleistocene Sequence Stratigraphy
RESULTS AND INTERPRETATION
(a) Petrophysical Parameters of E-Field Reservoirs: The relevant wireline log signatures were adopted to
identify hydrocarbon-bearing reservoirs and compute reservoir petro-physical parameters like porosity,
water saturation, net reservoir thickness, gross reservoir thickness and the ratio of net-to-gross thickness. In
addition, fluid contacts were delineated. These logs include: gamma ray log (for lithologic identification),
volume of shale log (for porosity correlation), density and neutron log (for delineating fluid contacts),
resistivity and water saturation logs (for identifying pore fluid types).
The minimum of gamma ray was used to compute shale volume as shown in equation I below:
Vcl = (GRlog – GRmin)/(GRmax – GRmin) …………………………………………………..…(I).
Where, Vcl = volume of clay, GRlog = Gamma ray log reading of formation;
GRmin = Gamma ray matrix (clay free zone), and GRmax = Gamma ray shale (100% clay zone).
Total porosity (Ø) was calculated from density - neutron log as shown in the following relationship:
Ø = (Ϭma – Ϭb)/(Ϭma – Ϭn)……………………………………………………………….…………(2).
Where, Ø = porosity derived from density log,
Ϭma = matrix (or grain) density;
Ϭb = bulk density (as measured by the tool and hence includes porosity and grain density), Ϭn = fluid density.
Effective porosity (Øe) was estimated according to equation 3 below:
Øe = {(Ϭma – Ϭb)/(Ϭma – Ϭn)} - {VCL*{Ϭma – Ϭsh)/(Ϭma – Ϭn)………………………..…(3).

Matthew O. Akpan et al., IJSIT, 2014, 3(5), 505-515
IJSIT (www.ijsit.com), Volume 3, Issue 5, September-October 2014
511
Where, Øe = Effective Porosity;
Ϭsh = Density of shale; and
VCL = {(Ϭma – Ϭsh)/(Ϭma – Ϭn) = Clay Bound Water.
Average water saturation [(Sw(aveg)] of three wells: Wells C, E and F is 0.0252. Therefore, average
So or (1 – Sw) = Oil Saturation = 1 – 0.0252 = 0.975. In addition, the calculations show that the resistivity
index, Rt/Ro in this field is between 2 and 4. This is probably due to shallow invasion (e.g.; Schlumberger,
1984).In clean water–bearing formations, Rxo/Rt= Rmf/Rw, and Sw = Sxo = 1; and thus: Rxo/Rt < Rmf/Rw.
In the Niger Delta, of which the E-field is a part, hydrocarbons have occasionally been found in
commercial quantities when the measured resistivities are usually low. These low resistivities, according to
Schlumberger, 1984; have been found to be due to one or a combination of the following:
High shale / clay content
High silt content
High irreducible water saturation; and
Very deep invasion.
The study of E-Field Wells reveals that there are nine (9) hydrocarbon-bearing reservoirs. The sands
encountered in these reservoirs are correlatable indicating a relatively longer period of depositional cycle.
A brief description of each reservoir is as follows:
(a) Reservoirs E-R1-3: In a basinal position in the prograding complex, these are well-developed alluvial
channel sands immediately above HFSB/TSF 4.1 Ma. These sands have a blocking log shape somewhat
resembling a basin floor fan, but with a more thinly bedded character. This bedding is reflected in a ragged or
“ratty” well log pattern (Armentrouct et al; 1993). High - resolution logs show better the interbedding of thin
sands and shales. These sands may occur in levees adjacent to the channels. The retrogradational
(backstepping) parasequence represents consecutive flooding events of the shelf. The gross thickness of the
reservoir sand is 250m (820.25 ft), while the net thickness is 175m (574.18ft). Volume of clay, porosity and
effective porosity were estimated at 0.13, 0.184 and 0.16, respectively.
(b) Reservoir E-R4: These sands were interpreted as shingled turbidite reservoir sands deposited in the
bottom-set area or near the toe of the lowstand prograding complex. These sands are of limited extent and
have less reservoir potential than those in the basin – floor fan and slope fan systems because they tend to
leak up-dip (Mitchum et al; 1993). Here, clinoform slope sediments are shales and are generally lean and gas-
prone. These sands are commonly found in the expanded section down-dip of growth faults, with traps
enhanced by roll-over anticline. The E-R4 reservoir sands reflect delta lobes or near-shore to coastal plain
transitions. The net thickness of the E-R4 reservoir is within the depths of 1575m to 1625m.
Well A1, tagged E-WA1, has one or more parasequences within an overall coarsening-upward pattern.
The pattern was interpreted as a gradual overall shallowing - upward pattern from upper bathyal or outer
neritic to inner neritic or non-marine environments. The entire complex represents a pile of alluvial fan
conglomerates coarsening-upward over 1025m (3363.03ft). Within this sequence, each of the seven (7)
Matthew O. Akpan et al., IJSIT, 2014, 3(5), 505-515
IJSIT (www.ijsit.com), Volume 3, Issue 5, September-October 2014
512
individual units (approximately 35m – 375m thick) passes from proximal alluvial fan conglomerates to
beachface, shoreface, mouth bar sands and gravels, and finally to offshore fines.
E-R3 and E-R4 Reservoirs occur in an intermediate position in the prograding complex. These
reservoirs are hydrocarbon bearing. The sands are interpreted as incised valley fills (IVFs). These sands are
associated with a type 1 sequence boundary and represent a basinward shift in facies. They have a
characteristic irregular, blocky pattern and are within depths of 1512.5m to 1725m or 1.4625s to 1.645s
intervals, respectively.
Hydrocarbon entrapment in this prograding complex requires a structural closure to trap large
reserves. Entrapment against tilted toe pinch-outs of the shingled turbidites is also a potential stratigraphic
trap.
Well B, tagged E-WB, has progradational appearance sets with identical appearance. These sands are
found in shelf environments of both a lowstand prograding wedge and a highstand systems tract. Sands
forming this log pattern were interpreted as undifferentiated deltaic distributary mouth bar, crevasse splays
and other related deltaic sands.
Well E-WC, in an expanded intermediate position, has a ‘classic’ prograding complex character, with
several upward-coarsening parasequences. The expanded sections of Well E-WC are commonly found on the
downthrown sides of faults that moved contemporaneously with sedimentation. The important
morphological elements in well–WC are offshore, shoreface and foreshore depozones. The offshore zone is
characterized by sedimentation under low-energetic hydrodynamic conditions below the fair weather wave
base (FWWB). The shale litho-facies is a representative of this depozone and effected by high-energetic
conditions only during storms. Reservoir E-R4 is located within the depths of 1512.m to 1712.5m in this well.
The computed porosity and effective porosity values are 0.30 and 0.21, respectively. The reservoir contains
oil and gas. Hydrocarbon entrapment involves unconformity enhanced, doubly plunging anticlines in growth
fault expanded sandstone reservoirs.
Well WD, in a sheltal position, typifies the formation of fourth-order incised valley fills in
stratigraphically up-dip portion.
Reservoir in this well contains ER-B1, ER-S1 and ER-S2 sands classified on the basis of lithofacies type.
The reservoir is hydrocarbon bearing and contains oil and gas.
Lowstand fans (basis floor fan, slope fans and a variety of ramp geometries) exist containing
reservoir sands deposited by various gravity-flow (turbidite-related) processes.
Here, basis floor fan is the most obvious reservoir but stratigraphic trapping is more common in the
smaller individual sand bodies observed within the more shale-prone slope fans.
The gross reservoir thickness of this reservoir is 612.5m (2009.6ft) and net thickness is 176m
(572.5ft).
In Well WE, the reservoir comprising S-IB, S-I and S-2 sands is hydrocarbon bearing and located
within the depths of 1762.5m to 2125m.

Matthew O. Akpan et al., IJSIT, 2014, 3(5), 505-515
IJSIT (www.ijsit.com), Volume 3, Issue 5, September-October 2014
513
It contains oil and gas. Porosity (Ø) and effective porosity (Øe) values are 0.22 and 0.21, respectively.
Trap potential and reservoir quality are best in onlapping submarine fans and fault-controlled onlap facies
(i.e. onlap facies contemporaneous with faulting) but poorest in off-lap fans (Mitchum et al; 1992). This is
because stratigraphic trap and reservoir potential is higher in onlap slope facies and lower in off-lap slope
facies.
Wells WF, WG and WH reservoirs are located within the depths of 1625-2250m; 1775-2010m and
1800 – 2025m, respectively. These reservoirs require a four-way structural closure, but because of the
abundance of sands, they will form good hydrocarbon migration pathways. The maximum flooding surface
(MFS) forms a major stratigraphic surface associated with widespread shale deposits over the shelf, which
forms good regional markers and hydrocarbon seals. The maximum flooding surface (MFS) represents the
best potential for stratigraphic trapping because it contains isolated reservoirs and is overlain by a regional
shale seal. Average porosity (Ø aveg.) of these reservoirs, which is 0.386 or 38.6%, was calculated from
neutron; density and sonic logs.
The existence of a type I or a type 2 sequence can be a function of local factors such as the rate of
tectonic subsidence(Posamentier and Allen, 1993); and major drops in relative sea level (Oboh-Ikuenobe et
al; 2004). In this E-field, a type I sequence was interpreted as one in which there is a relative fall in sea level
below the position of present shoreline and a type 2 sequence refers to a sequence in which the relative fall in
sea level does not force a shift in the position of the shoreline. The sequence boundary in the interfluve wells
in this field is stratigraphically equivalent to the erosional surface at the base of the incised valley. The best
basis for correlating the wells in this field was to pick a prominent maximum regressive surface (MRS) at the
top of the LST (PGC). BY flattening the section on this datum, it was possible to determine the amount of
erosion by the fluid incision and to local where the underlying HST markers are truncated by the
unconformity.
The depozones of the “foreshore – shoreface – offshore” model of Walker and and Plint, 1992) can be
filled with various depositional elements that were identified by the lithofacies and ichnofacies analyses. The
differing facies types represent a continuum of laterally adjacent, high-to-low energetic depozones with
characteristic hydrodynamic conditions. These diagnostic, compositional and textural sedimentological
aspects of foreshore, shoreface and offshore environments in the E-field are are documented in the analyzed
Isopach/Isochron maps on tops of ERS-2 Sands and Horizon H1(Base of Miocene)
CONCLUSION
Working within well-log sequence stratigraphic framework, seismic and biostratigraphy, eight (8)
sequences have been delineated on the basis of tying log-motif patterns to biostratigraphy. The major
sequences were related to a sea level fall during which the shelf was exposed. The presence of type 1 and type
2 sequence boundaries is indicative of stratigraphic signature of major drops in relative sea level during the
Paleocene and Eocene.

Matthew O. Akpan et al., IJSIT, 2014, 3(5), 505-515
IJSIT (www.ijsit.com), Volume 3, Issue 5, September-October 2014
514
Depositional environments in this field have been delineated to characterize the distribution of
reservoir facies. Reservoir sand bodies consist principally of one or more of the following genetic types:
deltaic distributary mouth bars, channel and shoreface sands, barrier beach, shelf and offshore turbidite
sands. From this study, the basin floor fans have customary porosity values (average of 0.22). Slope fans
exhibit several depositional styles depending on the vertical gradient of the slope.
This can be the reason for the range of porosity values observed in them (e.g. 0.22, 0.31 and 0.35).
Within the E-field, the differing facies types represent a continuum of laterally adjacent high – to low-
energetic depozones with characteristic hydrodynamic conditions. The variation in lithofacies thickness
observed could be attributed to variations in sediment supply, rate of sea level rise and fall (eustacy), syn –
sedimentary tectonics or error in data processing. In spite of these variations, there exists a good correlation
between the wells.
The most prolific sandstone reservoirs in this field are from deltaic distributary mouth bars, channel
sands and shallow marine sediments. Petroleum in subaqueous (submarine) fans is mainly from upper and
middle channel and proximal turbidite sands. In this study area, submarine fans are relatively under-
explored reservoir types that hold great promise because of the amount of sand that is present, the potential
for stacking fan lobes, and the likely proximity to deep basinal rocks.
The oldest sequence in this field onlapped onto a major upper Neogene unconformity surface
otherwise called Basal Qua Iboe unconformity – SB 6.3Ma. This late Miocene disconformity surface was
formed when southern margin of the Niger Delta underwent catastrophic failure and slid ocean ward around
6.3 million years. The Mio-Pliocene channels gradually evolved in slope canyon systems that were backfilled
with sandstone units and eventually covered with fine grained clastics during Qua Iboe time. Most of the E-
field reservoirs are lenticular deposits and traps are not always coincident with the structural closure. .
REFERENCES
1. Adaeze, I. U., Samuel, O. O. and Iwuagwu, C. J., 2012: Petro-physical evaluation of Uzek well using well log
and core data, offshore depobelt, Niger Delta, Nigeria. In: Advances in applied science research, 2012,
3(5): 2966 – 2991.
2. Allen, J. R. L., 1997: Principles of siliciclastic sequence stratigraphy and applications to fluvial of shelf
deposits; P. 1 – 58.
3. Amajor, L. C. and Agbaire, D. W. 1989: Depositional history of the reservoir sandstones, Akpor and
Akpara Oil-Fields, Eastern Niger Delta, Nigeria.Journ.Petrol.Geol, Vol. 12, (6); P.453– 464.
4. Armentrout, J. M., Malecek, S. J., Fearn, L. B., 1993: Log Motif Analysis of Paleogene depositional systems
tracts; Central and Northern North Sea; Define by Sequence–Stratigraphic Analysis: London Geological
Society, P. 1 – 41.
5. Beka, F. T. and M. N. Oti, 1995: The distal offshore Niger Delta: Frontier prospects of mature petroleum
province. In: Oti, M. N. and Postma, G; eds. Geology of Deltas: Rotterdam, A. A. Balkema, P. 237 – 241.
Matthew O. Akpan et al., IJSIT, 2014, 3(5), 505-515
IJSIT (www.ijsit.com), Volume 3, Issue 5, September-October 2014
515
6. Bruso, J., Getz, S. L; and Wallace, R; 2004: Gulf of Guinea Geology. Exploration and Development; In: Oil
and Gas Journal, Penn-Well Corporation, P. 1 – 8.
7. Emery, D. and Myers, K. J., 1996: Sequence Stratigraphy, Blackwell Science, Oxford.
8. Evamy, B. D., J. Haremboure, P. Kamerling, W. A. Knaap, F. A. Molloy, and P. H. Rowlands, 1978:
Hydrocarbon Habitat of Tertiary Niger Delta: AAPG Bulletin, Vol. 62, P. 1 – 39.
9. Oboh-Ikuenobe, F. E.Obi, C.G.; Jaramille, C. A., 2005: Lithofacies, Palynofacies, and Sequence Stratigraphy
of Palaeogene Strata Southeastern Nigeria; 2005 Elsevier Ltd., P. 79 – 83.
10. Oomkens, E. 1974: Litho-facies relations in the late Quaternary Niger Delta Complex: Sedimentology, V.
2; P. 195 – 222.
11. Oti, M. N. and Postma, G.,eds; Geology of Deltas: Rotterdam, A. A., Ballzerna, P. 257 – 267.
12. Peters, S. W;1982: Central West African Cretoceous Tertiary Benthic Foramimifera and Stratigraphy,
Palaeontographic A. bd: Ltd. 1 – 3; P. 1 – 104.
13. Posamentier, H. W.,Jersey, M. T.,and Vail R. R., 1988: Eustatic Controls on Clastic Deposition I –
Conceptual Framework; In: Wilgus, C. K: Hostings, B. S, Kendall, C. G. St. C., Posementier, H. W., Ross, C. A,
and Van Wagoner, J. C, eds, Sea-level Changes –
14. Van Wagoner, J. C., Mitchum, R. M. Campion, K. M, and Rahmanian, V. D. 1990: Siliciclastic Sequence
Stratigraphy in Well logs, Cores, and Outcrops. American Association of Petroleum Geologists. Methods
in Exploration Sens; No. 7; P. 55.
15. Walker, R. G. and Plint, A. G., 1992: Wave and storm-dominated shallow marine systems. In: Facies
models (Eds.): Walker, R. G, and James, N; P. 219 – 238; Toronto: Geological Association of
Canada.P.409.