DAVID Y. IGE GOVERNOR
SHAN TSUTSUI LT. GOVERNOR
Report Title
Hawaii Individual Income Tax Statistics, Tax Year 201 5 Department of Taxation Annual Report, 201 6-201 7
STATE OF HAWAII
Legal Reference
5231-3.4(a)(l), HRS §231-3(8), HRS
LINDA CHU TAUAYAMA DIRECTOR OF TAXATION
DAM~ENA'ELEFANTE D E P U ~ D!RECTOR .
1 a t .
Hawaii Business Income Tax Statistics, Tax Year 201 5 Tax Credits Claimed by Hawaii Taxpayers, Tax Year 201 5 General Excise and Use Tax Exemptions, Tax Year 201 7 Electronic Funds Transfer Penalty Payments Report
DEPARTMENT OF TAXATION P.O. BOX 259
HONOLULU, HAWAII 96809 PHONE NO: (808) 587-1540
FAX NO: (808) 587-1560
§231.3.4(a)(2), HRS ~~
§231.3.4(a)(3), HRS §231.3.4(a)(4), HRS 5231-9.9, HRS
December 21 , 201 7
The Honorable Ronald D. Kouchi, President and Members of the Senate Twenty-Ninth Legislature State of Hawaii State Capitol, Room 409 Honolulu, Hawaii 96813
The Honorable Scott Saiki, Speaker and Members of the House of Representatives Twenty-Ninth Legislature State of Hawaii State Capitol, Room 431 Honolulu, Hawaii 9681 3
Dear President Kouchi, Speaker Saiki, and Members of the Legislature:
For your information and consideration, I am transmitting copies the following reports in accordance to the following laws as detailed in the table below.
1 Department Goals and Objectives, 201 8 I Act 100, SLH 1999
In accordance Section 93-16, Hawaii Revised Statutes, I am also informing you that the reports may be viewed electronically at http://tax. hawaii.gov/stats/.
Sincerely,
LINDA CHU TAKAYAMA Director of Taxation
Enclosures
DEPARTMENT OF TAXATION
VISION
"The Department of Taxation will efficiently and effectively collect the revenue for
funding programs and services for the people of Hawaii."
MISSION
"Our mission is to administer the tax laws for the State of Hawaii in a consistent,
fair and uniform manner."
GOALS
1. To "Increase Voluntary Compliance" by
a. Increasing oversight utilizing various branches/areas of our Compliance
Division
b. Developing procedures to ensure a more efficient and timely audit process
2. To "Reduce Tax Fraud," through
a. Identification and preventing payment of fraudulent funds
3. To "Improve customer service to all stakeholders" by
a. Providing services to taxpayers whose issues/concerns cannot be resolved
through normal channels
b. Providing specialized service to the tax practitioner community
4. To "Improve technology and efficiencies through the successful implementation
of the Tax System Modernization (TSM) project during this period"
a. Complete Rollout 4 of the TSM project
b. Re-engineer business processes
5. "Actively address tax receivable balances" by
a. Collaboration with the Attorney General's office
b. Utilization of third parties to improve collections
6. To "Foster and empower staff" by
a. Developing each employee to his/her full potential
DAVID Y. IGE GOVERNOR
SHAN TSUTSUI LT. GOVERNOR
STATE OF HAWAII
DEPARTMENT OF TAXATION P.O. BOX 259
HONOLULU, HAWAII 96809
PHONE NO: (808) 587-1540 FAX NO: (808) 587-1560
MARIA E. ZIELINSKI DIRECTOR OF TAXATION
DAMIEN A. ELEFANTE DEPUTY DIRECTOR
December 6, 2017
The Honorable David Y. Ige
Governor, State of Hawaii
Executive Chambers, State Capitol
Dear Governor Ige:
Thank you for the opportunity to present you with the attached Annual Report summarizing the
operations of the Department of Taxation (Department) for the fiscal year (FY) ending June 30,
2017. The Department collected $6.94 billion in tax revenue in FY2017, or 95% of the $7.34
billion that was collected from all taxes administered by the State. The General Excise Tax (GET)
is Hawaii's largest source of revenue and accounted for 44% of the State's total tax collections in
FY2017. Revenue from the GET rose to $3.24 billion in FY2017 from $3.21 billion in FY2016, an
increase of 1.0%. Revenue from Hawaii's Individual Income Tax (IIT), Hawaii's second largest
tax, increased to $2.19 billion in FY2017, up by 3.6% from $2.12 billion in FY2016. The IIT
accounted for 30% of the State's total tax collections in FY2017.
During FY2017, the Department continued with the Tax System Modernization (TSM) project.
The TSM project is a multi-year project with five rollout phases that will completely replace the
existing system. The project will expand electronic services, providing taxpayers with online access
to accounts and enabling full electronic filing and payment. The project will also automate the
licensing, tax clearance, and compliance processes. Additionally, TSM will provide the State with
critical data capture capabilities, metrics, and cross-check controls that are not available in the
existing legacy system. The Department has been able to increase taxpayer compliance utilizing
TSM tools to identify non-filers, industry segment comparisons, and identity theft to name a few.
Likewise, TSM increased data availability which in turn improved the analytical capabilities of the
Department’s research branch. With the adoption of online tax filing, which can be done at no-
cost, the Department expects to see an increase in electronic filing in future years.
During FY2017, the Department completed Rollout 2 and prepared for Rollout 3. The Department
completed Rollout 2 on time as of August 15, 2016 which covered the general excise & use tax,
seller's collection, country surcharge, and rental motor vehicle tax types, which covers over 40% of
State revenue collections. On August 15, 2017, the Department successfully executed Rollout 3 for
tax types: corporate income, franchise, public service company, and withholding. The Department
remains on schedule to complete the entire project by mid-2019.
The Department continues to achieve its goals with a small operating budget. In FY2017, the
Department's operating expenses were $24.3 million down from $25.5 million in FY2009. The
Department collected $6.94 billion in taxes; the cost of collecting each $100 dollars of taxes was
only roughly 35 cents.
In FY 2017, Hawaii Tax Online (HTO), the Department's web portal for payments and filing of tax
returns, was launched. More than 45% of general excise and transient accommodation taxpayers
registered and used the web portal. While the Department has encouraged taxpayers to use
electronic transmission rather than paper return, it processed over 1 million paper checks and over
2 million paper tax returns and other documents this fiscal year.
The Department continues to improve service to taxpayers and tax practitioners. This is important
for maintaining and improving voluntary compliance. The total number of calls answered
increased from 287,616 in FY2017 up from 275,924 in FY 2016.
The Department aggressively recruited to fill vacancies in other areas as well. While the
Department's total vacancy rate for permanent positions increased 12.9% or 8 position due to
retirements, internal promotions, and resignations, vacancies in the staff offices decreased by
38.5%.
The Compliance Division continued to make significant assessments worth $146 million in FY
2017. The total number of completed audit cases increased by 5.1% % from 17,065 cases in
FY2016 to 17,936 cases in FY2017. The amount collected from assessments decreased from $39.9
million in FY2015 to $37.0 million in FY2016.
The Department continues to pursue its goals of increased voluntary compliance, improved
processing, enhanced productivity, and improved customer service for all of our stakeholders. We
are proud and appreciative of all that our staff has accomplished during the past year. Empowered
with new tools and technological enhancements, our Department has increased the efficiency and
effectiveness of revenue collection that pay for the public services that the citizens of Hawaii enjoy.
Sincerely,
/s/
MARIA E. ZIELINSKI
Director of Taxation
TABLE OF CONTENTS
LETTER OF TRANSMITTAL TO THE GOVERNOR
COLLECTION AND DISTRIBUTION OF TAXES ......................................................................1
Overview .............................................................................................................................. 1
General Excise and Use Taxes ............................................................................................. 3
Individual Income Tax ......................................................................................................... 6
Corporate Income Tax ......................................................................................................... 9
Transient Accommodations Tax ........................................................................................ 10
Fuel Taxes ......................................................................................................................... 14
Motor Vehicle Taxes ......................................................................................................... 20
Cigarette and Tobacco Tax ............................................................................................... 21
Public Service Company Tax ............................................................................................ 23
Unemployment Insurance Tax .......................................................................................... 24
Insurance Premium Tax .................................................................................................... 25
Liquor Tax ........................................................................................................................ 26
Conveyance Tax ................................................................................................................ 27
Tax on Bank and Other Financial Corporations ............................................................... 28
Estate and Transfer Taxes ................................................................................................. 29
City and County of Honolulu Surcharge Tax ................................................................... 30
Total Tax Collections ........................................................................................................ 31
Distribution of Taxes ........................................................................................................ 32
Trends in Tax Collections ................................................................................................. 35
TAX ADMINISTRATION ............................................................................................................37
Overall Performance ......................................................................................................... 37
Tax Services and Processing Division .............................................................................. 37
Compliance Division ........................................................................................................ 41 Staff Offices ...................................................................................................................... 52
MANAGEMENT PERSONNEL ...................................................................................................59
ORGANIZATION CHART ...........................................................................................................60
DISTRICT OFFICES .....................................................................................................................61
TAX APPEALS AND LITIGATION ............................................................................................ 63
Administrative Appeals Office ........................................................................................... 63
Boards of Taxation Review ................................................................................................ 63
Civil Decisions, Settlements, and Other Legal Matters .................................................... 64
ADMINISTRATIVELY ATTACHED ENTITIES .......................................................................79
Council on Revenues ........................................................................................................ 79
Boards of Taxation Review .............................................................................................. 79
1
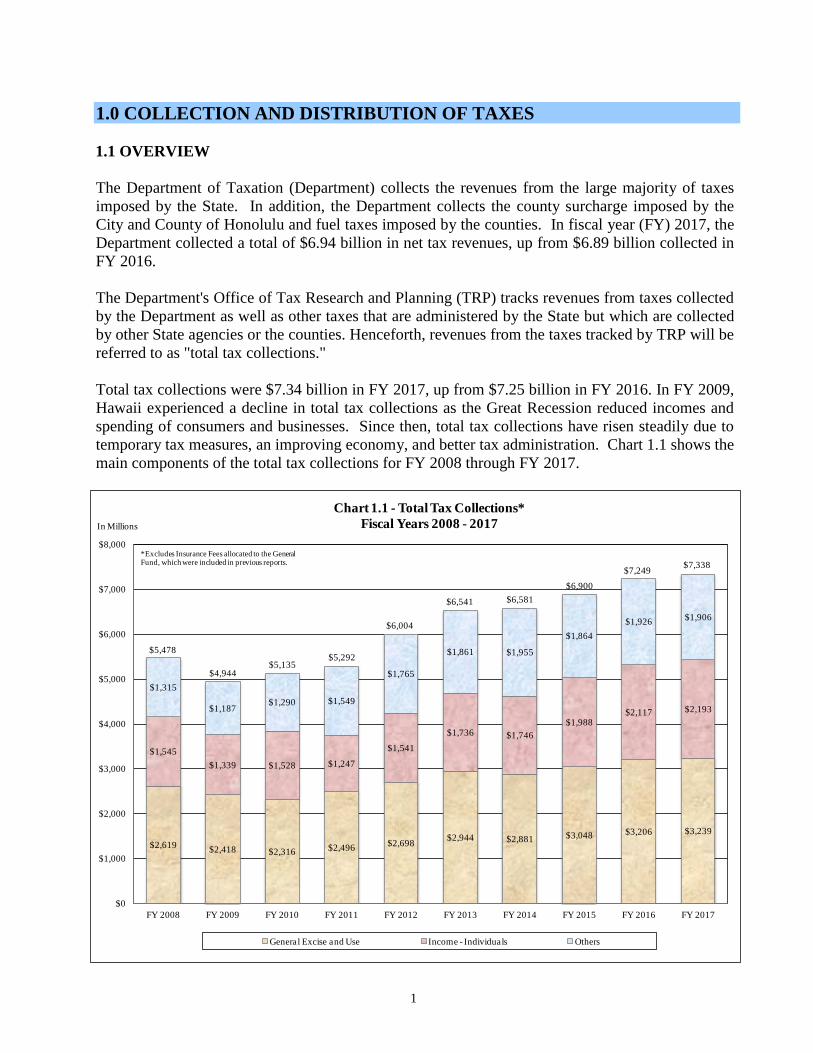
1.0 COLLECTION AND DISTRIBUTION OF TAXES 1.1 OVERVIEW
The Department of Taxation (Department) collects the revenues from the large majority of taxes
imposed by the State. In addition, the Department collects the county surcharge imposed by the
City and County of Honolulu and fuel taxes imposed by the counties. In fiscal year (FY) 2017, the
Department collected a total of $6.94 billion in net tax revenues, up from $6.89 billion collected in
FY 2016.
The Department's Office of Tax Research and Planning (TRP) tracks revenues from taxes collected
by the Department as well as other taxes that are administered by the State but which are collected
by other State agencies or the counties. Henceforth, revenues from the taxes tracked by TRP will be
referred to as "total tax collections."
Total tax collections were $7.34 billion in FY 2017, up from $7.25 billion in FY 2016. In FY 2009,
Hawaii experienced a decline in total tax collections as the Great Recession reduced incomes and
spending of consumers and businesses. Since then, total tax collections have risen steadily due to
temporary tax measures, an improving economy, and better tax administration. Chart 1.1 shows the
main components of the total tax collections for FY 2008 through FY 2017.
$2,619$2,418 $2,316 $2,496
$2,698$2,944 $2,881 $3,048 $3,206 $3,239
$1,545
$1,339 $1,528 $1,247
$1,541
$1,736 $1,746
$1,988$2,117 $2,193
$1,315
$1,187$1,290 $1,549
$1,765
$1,861 $1,955
$1,864
$1,926$1,906
$0
$1,000
$2,000
$3,000
$4,000
$5,000
$6,000
$7,000
$8,000
FY 2008 FY 2009 FY 2010 FY 2011 FY 2012 FY 2013 FY 2014 FY 2015 FY 2016 FY 2017
Chart 1.1 - Total Tax Collections*
Fiscal Years 2008 - 2017
General Excise and Use Income - Individuals Others
In Millions
$7,249$7,338
$5,478
$4,944$5,135
$5,292
$6,004
$6,541 $6,581
$6,900
*Excludes Insurance Fees allocated to the General Fund, which were included in previous reports.
2
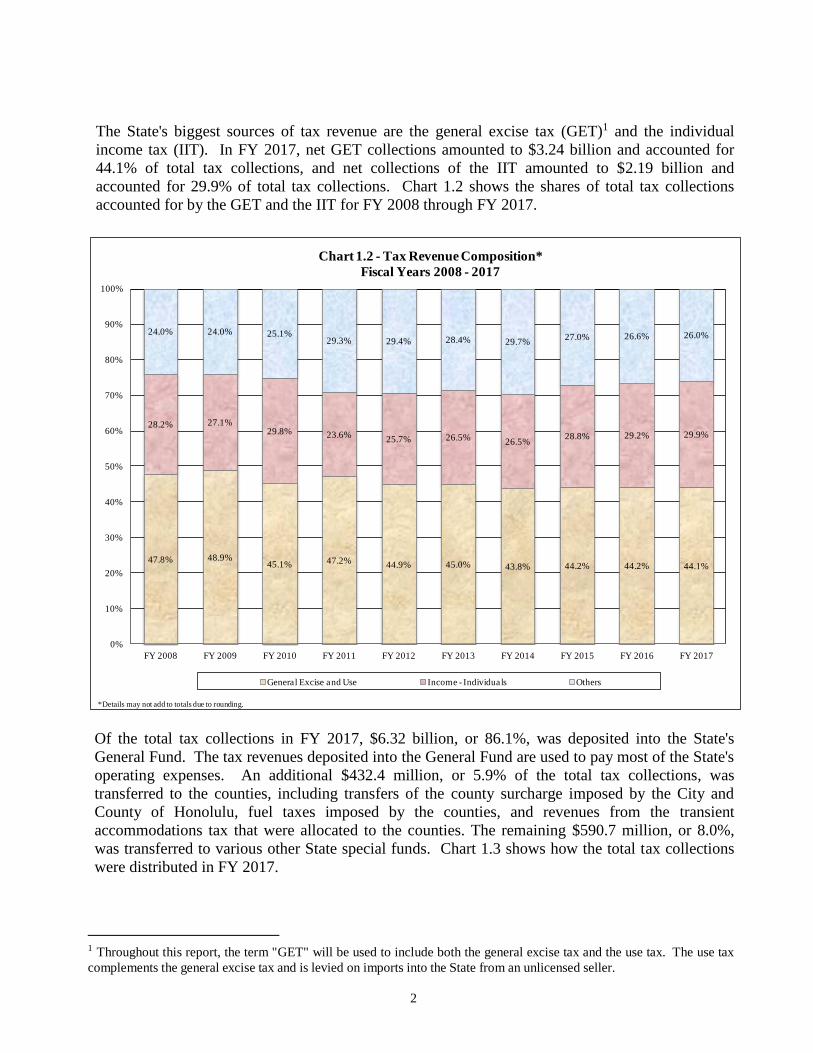
The State's biggest sources of tax revenue are the general excise tax (GET)1 and the individual
income tax (IIT). In FY 2017, net GET collections amounted to $3.24 billion and accounted for
44.1% of total tax collections, and net collections of the IIT amounted to $2.19 billion and
accounted for 29.9% of total tax collections. Chart 1.2 shows the shares of total tax collections
accounted for by the GET and the IIT for FY 2008 through FY 2017.
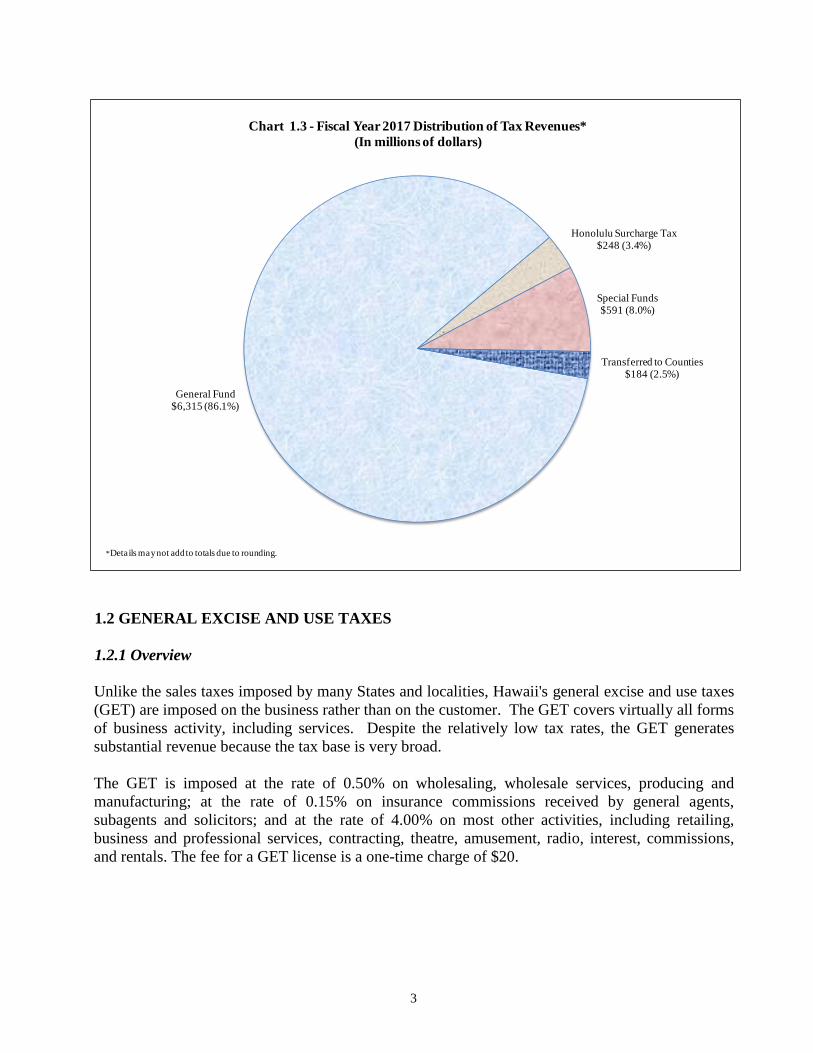
Of the total tax collections in FY 2017, $6.32 billion, or 86.1%, was deposited into the State's
General Fund. The tax revenues deposited into the General Fund are used to pay most of the State's
operating expenses. An additional $432.4 million, or 5.9% of the total tax collections, was
transferred to the counties, including transfers of the county surcharge imposed by the City and
County of Honolulu, fuel taxes imposed by the counties, and revenues from the transient
accommodations tax that were allocated to the counties. The remaining $590.7 million, or 8.0%,
was transferred to various other State special funds. Chart 1.3 shows how the total tax collections
were distributed in FY 2017.
1 Throughout this report, the term "GET" will be used to include both the general excise tax and the use tax. The use tax
complements the general excise tax and is levied on imports into the State from an unlicensed seller.
47.8% 48.9%45.1% 47.2% 44.9% 45.0% 43.8% 44.2% 44.2% 44.1%
28.2% 27.1%29.8% 23.6%
25.7% 26.5%26.5%
28.8% 29.2% 29.9%
24.0% 24.0% 25.1%29.3% 29.4% 28.4% 29.7%
27.0% 26.6% 26.0%
0%
10%
20%
30%
40%
50%
60%
70%
80%
90%
100%
FY 2008 FY 2009 FY 2010 FY 2011 FY 2012 FY 2013 FY 2014 FY 2015 FY 2016 FY 2017
General Excise and Use Income - Individuals Others
Chart 1.2 - Tax Revenue Composition*
Fiscal Years 2008 - 2017
*Details may not add to totals due to rounding.
3
1.2 GENERAL EXCISE AND USE TAXES
1.2.1 Overview
Unlike the sales taxes imposed by many States and localities, Hawaii's general excise and use taxes
(GET) are imposed on the business rather than on the customer. The GET covers virtually all forms
of business activity, including services. Despite the relatively low tax rates, the GET generates
substantial revenue because the tax base is very broad.
The GET is imposed at the rate of 0.50% on wholesaling, wholesale services, producing and
manufacturing; at the rate of 0.15% on insurance commissions received by general agents,
subagents and solicitors; and at the rate of 4.00% on most other activities, including retailing,
business and professional services, contracting, theatre, amusement, radio, interest, commissions,
and rentals. The fee for a GET license is a one-time charge of $20.
General Fund$6,315 (86.1%)
Honolulu Surcharge Tax$248 (3.4%)
Special Funds$591 (8.0%)
Transferred to Counties$184 (2.5%)
Chart 1.3 - Fiscal Year 2017 Distribution of Tax Revenues*
(In millions of dollars)
*Details may not add to totals due to rounding.
4
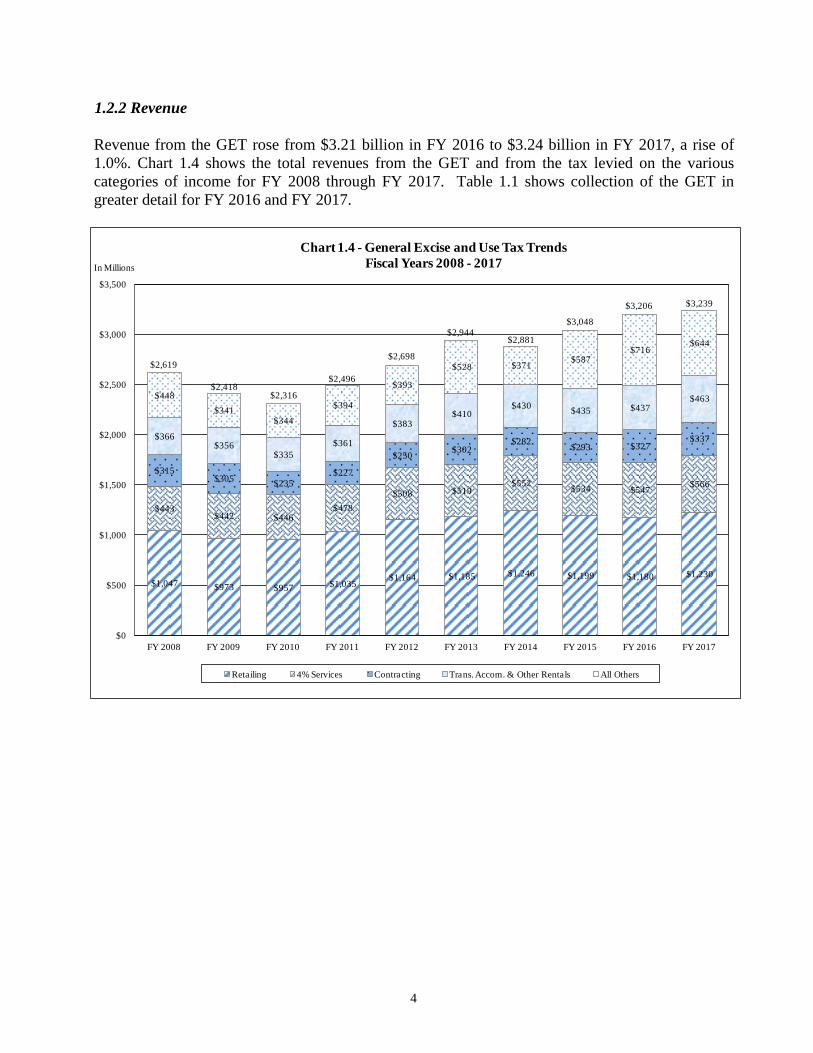
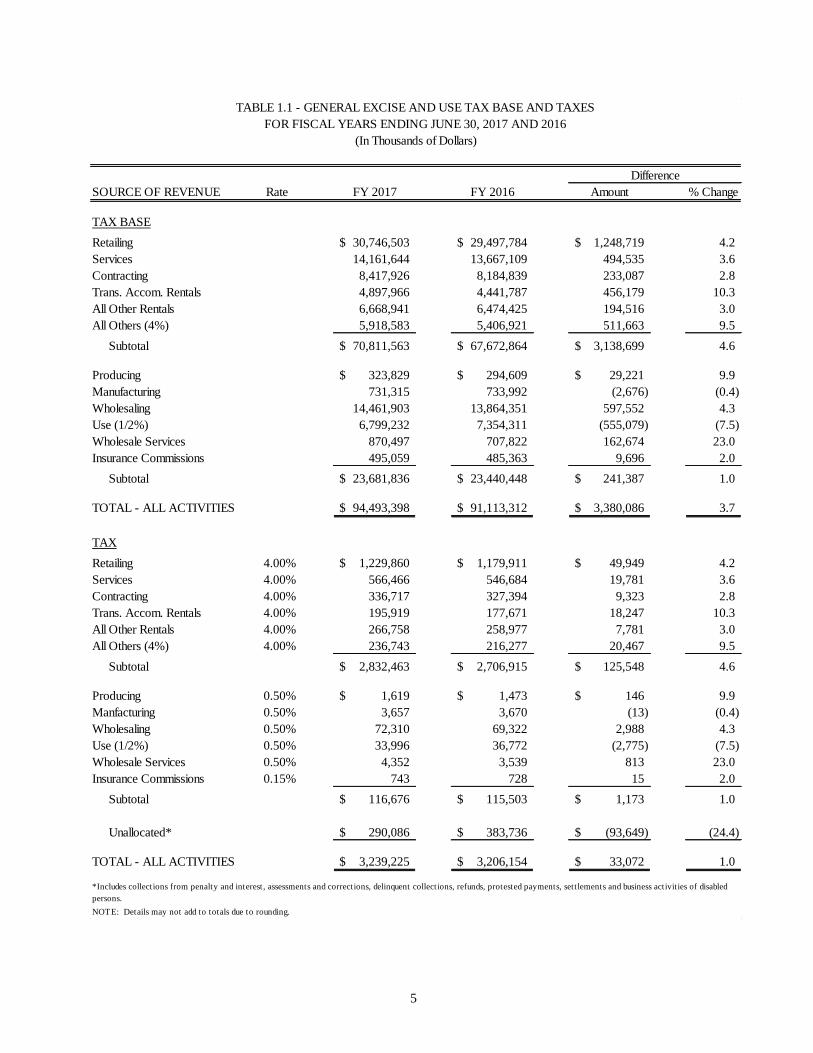
1.2.2 Revenue
Revenue from the GET rose from $3.21 billion in FY 2016 to $3.24 billion in FY 2017, a rise of
1.0%. Chart 1.4 shows the total revenues from the GET and from the tax levied on the various
categories of income for FY 2008 through FY 2017. Table 1.1 shows collection of the GET in
greater detail for FY 2016 and FY 2017.
$1,047 $973 $957 $1,035 $1,164 $1,185 $1,246 $1,199 $1,180 $1,230
$443 $442 $446
$478
$508 $519 $552
$534 $547 $566
$315 $305
$235
$227
$250 $302
$282 $293 $327
$337 $366 $356
$335
$361
$383 $410
$430 $435 $437
$463 $448
$341 $344
$394
$393
$528 $371 $587
$716 $644
$0
$500
$1,000
$1,500
$2,000
$2,500
$3,000
$3,500
FY 2008 FY 2009 FY 2010 FY 2011 FY 2012 FY 2013 FY 2014 FY 2015 FY 2016 FY 2017
In Millions
Chart 1.4 - General Excise and Use Tax Trends
Fiscal Years 2008 - 2017
Retailing 4% Services Contracting Trans. Accom. & Other Rentals All Others
$3,048
$3,206 $3,239
$2,619
$2,418$2,316
$2,496
$2,698
$2,944$2,881
5
SOURCE OF REVENUE Rate FY 2017 FY 2016 Amount % Change
TAX BASE
Retailing 30,746,503$ 29,497,784$ 1,248,719$ 4.2
Services 14,161,644 13,667,109 494,535 3.6
Contracting 8,417,926 8,184,839 233,087 2.8
Trans. Accom. Rentals 4,897,966 4,441,787 456,179 10.3
All Other Rentals 6,668,941 6,474,425 194,516 3.0
All Others (4%) 5,918,583 5,406,921 511,663 9.5
Subtotal 70,811,563$ 67,672,864$ 3,138,699$ 4.6
Producing 323,829$ 294,609$ 29,221$ 9.9
Manufacturing 731,315 733,992 (2,676) (0.4)
Wholesaling 14,461,903 13,864,351 597,552 4.3
Use (1/2%) 6,799,232 7,354,311 (555,079) (7.5)
Wholesale Services 870,497 707,822 162,674 23.0
Insurance Commissions 495,059 485,363 9,696 2.0
Subtotal 23,681,836$ 23,440,448$ 241,387$ 1.0
TOTAL - ALL ACTIVITIES 94,493,398$ 91,113,312$ 3,380,086$ 3.7
TAX
Retailing 4.00% 1,229,860$ 1,179,911$ 49,949$ 4.2
Services 4.00% 566,466 546,684 19,781 3.6
Contracting 4.00% 336,717 327,394 9,323 2.8
Trans. Accom. Rentals 4.00% 195,919 177,671 18,247 10.3
All Other Rentals 4.00% 266,758 258,977 7,781 3.0
All Others (4%) 4.00% 236,743 216,277 20,467 9.5
Subtotal 2,832,463$ 2,706,915$ 125,548$ 4.6
Producing 0.50% 1,619$ 1,473$ 146$ 9.9
Manfacturing 0.50% 3,657 3,670 (13) (0.4)
Wholesaling 0.50% 72,310 69,322 2,988 4.3
Use (1/2%) 0.50% 33,996 36,772 (2,775) (7.5)
Wholesale Services 0.50% 4,352 3,539 813 23.0
Insurance Commissions 0.15% 743 728 15 2.0
Subtotal 116,676$ 115,503$ 1,173$ 1.0
Unallocated* 290,086$ 383,736$ (93,649)$ (24.4)
TOTAL - ALL ACTIVITIES 3,239,225$ 3,206,154$ 33,072$ 1.0
NOTE: Details may not add to totals due to rounding.
Difference
TABLE 1.1 - GENERAL EXCISE AND USE TAX BASE AND TAXES
FOR FISCAL YEARS ENDING JUNE 30, 2017 AND 2016
(In Thousands of Dollars)
*Includes collections from penalty and interest, assessments and corrections, delinquent collections, refunds, protested payments, settlements and business activities of disabled
persons.
6
1.2.3 Recent Legislation
Act 54, SLH 2017, adds a new category of affordable housing projects that qualifies for the GET
exemption. The exemption for the new category is limited to contractors. The Act also limits the
total amount of the exemption to $7 million per year. The Act applies to taxable years beginning
after December 31, 2017, and ending before July 1, 2022.
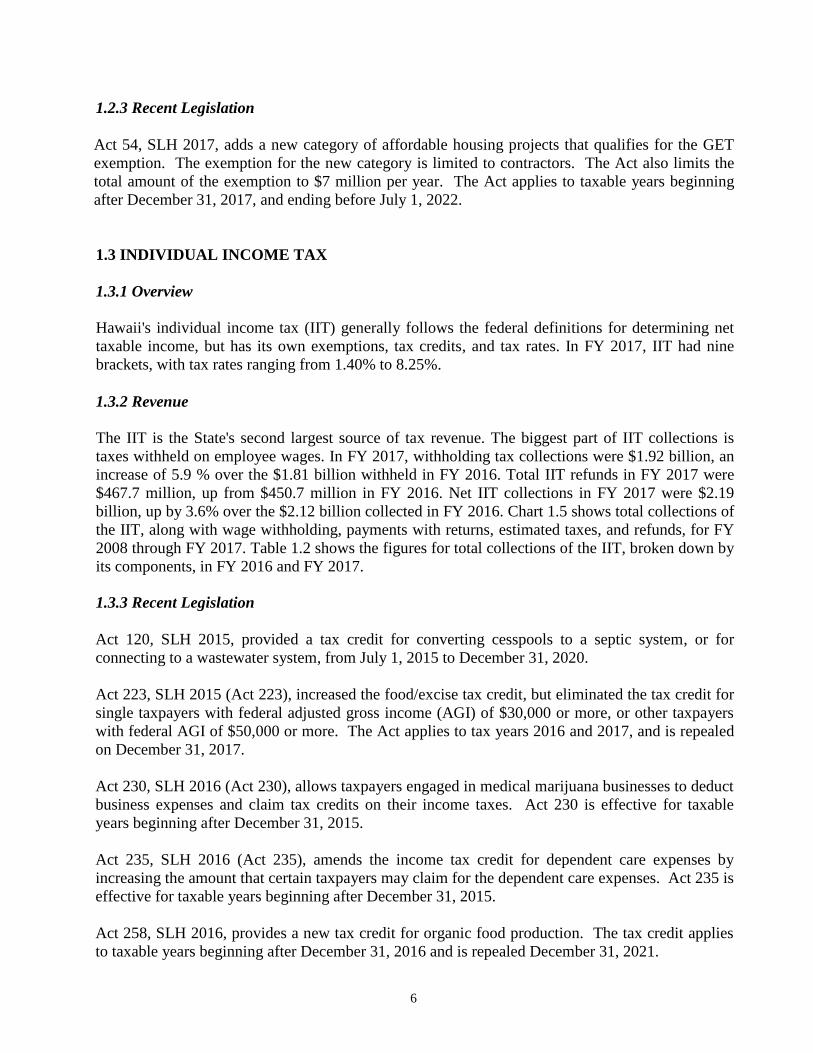
1.3 INDIVIDUAL INCOME TAX
1.3.1 Overview
Hawaii's individual income tax (IIT) generally follows the federal definitions for determining net
taxable income, but has its own exemptions, tax credits, and tax rates. In FY 2017, IIT had nine
brackets, with tax rates ranging from 1.40% to 8.25%.
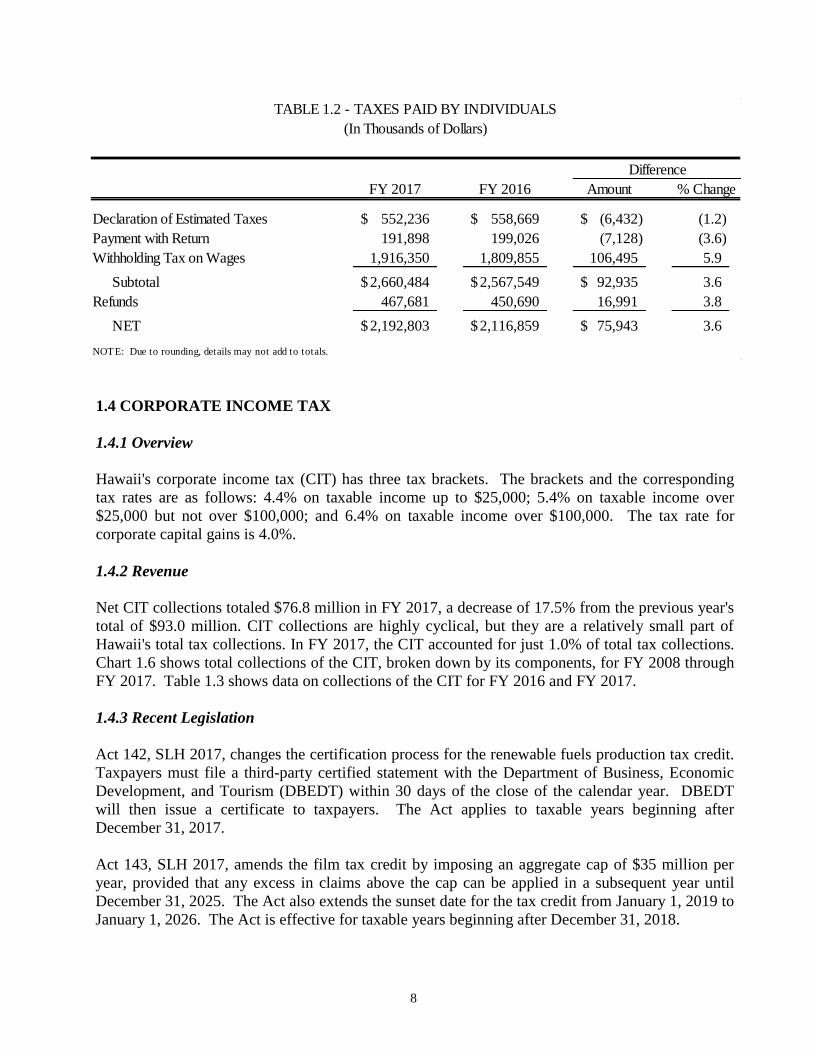
1.3.2 Revenue
The IIT is the State's second largest source of tax revenue. The biggest part of IIT collections is
taxes withheld on employee wages. In FY 2017, withholding tax collections were $1.92 billion, an
increase of 5.9 % over the $1.81 billion withheld in FY 2016. Total IIT refunds in FY 2017 were
$467.7 million, up from $450.7 million in FY 2016. Net IIT collections in FY 2017 were $2.19
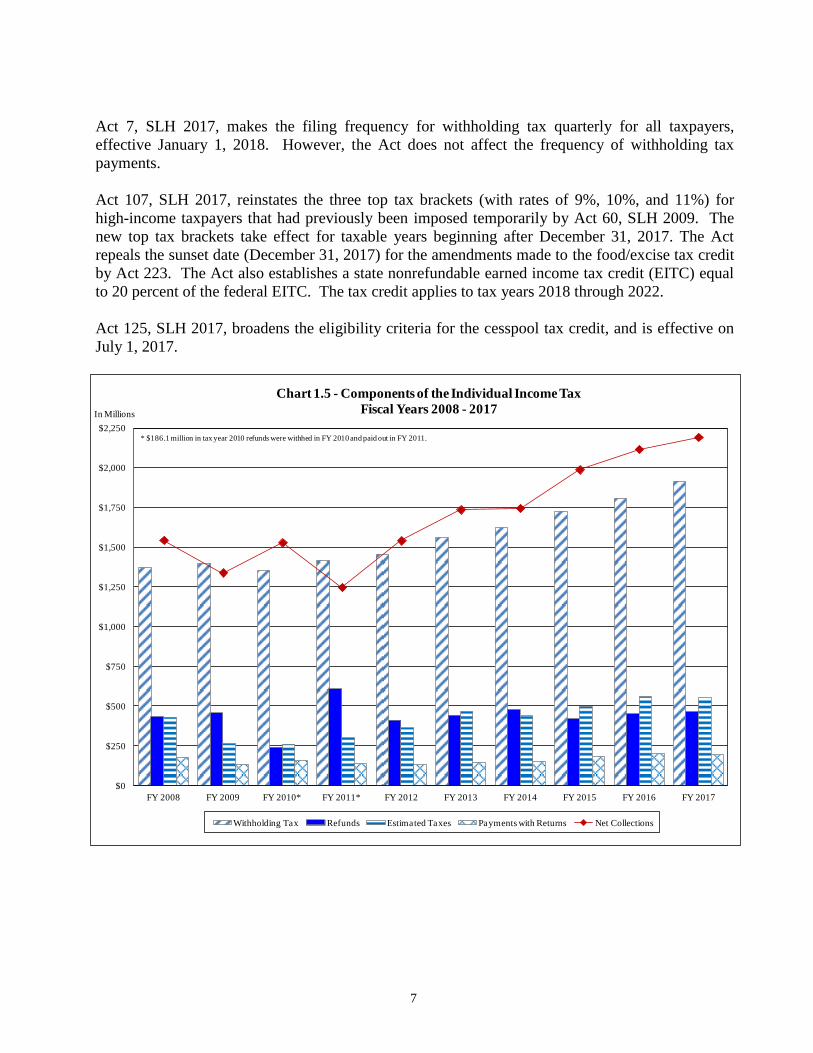
billion, up by 3.6% over the $2.12 billion collected in FY 2016. Chart 1.5 shows total collections of
the IIT, along with wage withholding, payments with returns, estimated taxes, and refunds, for FY
2008 through FY 2017. Table 1.2 shows the figures for total collections of the IIT, broken down by
its components, in FY 2016 and FY 2017.
1.3.3 Recent Legislation
Act 120, SLH 2015, provided a tax credit for converting cesspools to a septic system, or for
connecting to a wastewater system, from July 1, 2015 to December 31, 2020.
Act 223, SLH 2015 (Act 223), increased the food/excise tax credit, but eliminated the tax credit for
single taxpayers with federal adjusted gross income (AGI) of $30,000 or more, or other taxpayers
with federal AGI of $50,000 or more. The Act applies to tax years 2016 and 2017, and is repealed
on December 31, 2017.
Act 230, SLH 2016 (Act 230), allows taxpayers engaged in medical marijuana businesses to deduct
business expenses and claim tax credits on their income taxes. Act 230 is effective for taxable
years beginning after December 31, 2015.
Act 235, SLH 2016 (Act 235), amends the income tax credit for dependent care expenses by
increasing the amount that certain taxpayers may claim for the dependent care expenses. Act 235 is
effective for taxable years beginning after December 31, 2015.
Act 258, SLH 2016, provides a new tax credit for organic food production. The tax credit applies
to taxable years beginning after December 31, 2016 and is repealed December 31, 2021.
7
Act 7, SLH 2017, makes the filing frequency for withholding tax quarterly for all taxpayers,
effective January 1, 2018. However, the Act does not affect the frequency of withholding tax
payments.
Act 107, SLH 2017, reinstates the three top tax brackets (with rates of 9%, 10%, and 11%) for
high-income taxpayers that had previously been imposed temporarily by Act 60, SLH 2009. The
new top tax brackets take effect for taxable years beginning after December 31, 2017. The Act
repeals the sunset date (December 31, 2017) for the amendments made to the food/excise tax credit
by Act 223. The Act also establishes a state nonrefundable earned income tax credit (EITC) equal
to 20 percent of the federal EITC. The tax credit applies to tax years 2018 through 2022.
Act 125, SLH 2017, broadens the eligibility criteria for the cesspool tax credit, and is effective on
July 1, 2017.
$0
$250
$500
$750
$1,000
$1,250
$1,500
$1,750
$2,000
$2,250
FY 2008 FY 2009 FY 2010* FY 2011* FY 2012 FY 2013 FY 2014 FY 2015 FY 2016 FY 2017
In Millions
Chart 1.5 - Components of the Individual Income Tax
Fiscal Years 2008 - 2017
Withholding Tax Refunds Estimated Taxes Payments with Returns Net Collections
* $186.1 million in tax year 2010 refunds were withhed in FY 2010 and paid out in FY 2011.
8
1.4 CORPORATE INCOME TAX
1.4.1 Overview
Hawaii's corporate income tax (CIT) has three tax brackets. The brackets and the corresponding
tax rates are as follows: 4.4% on taxable income up to $25,000; 5.4% on taxable income over
$25,000 but not over $100,000; and 6.4% on taxable income over $100,000. The tax rate for
corporate capital gains is 4.0%.
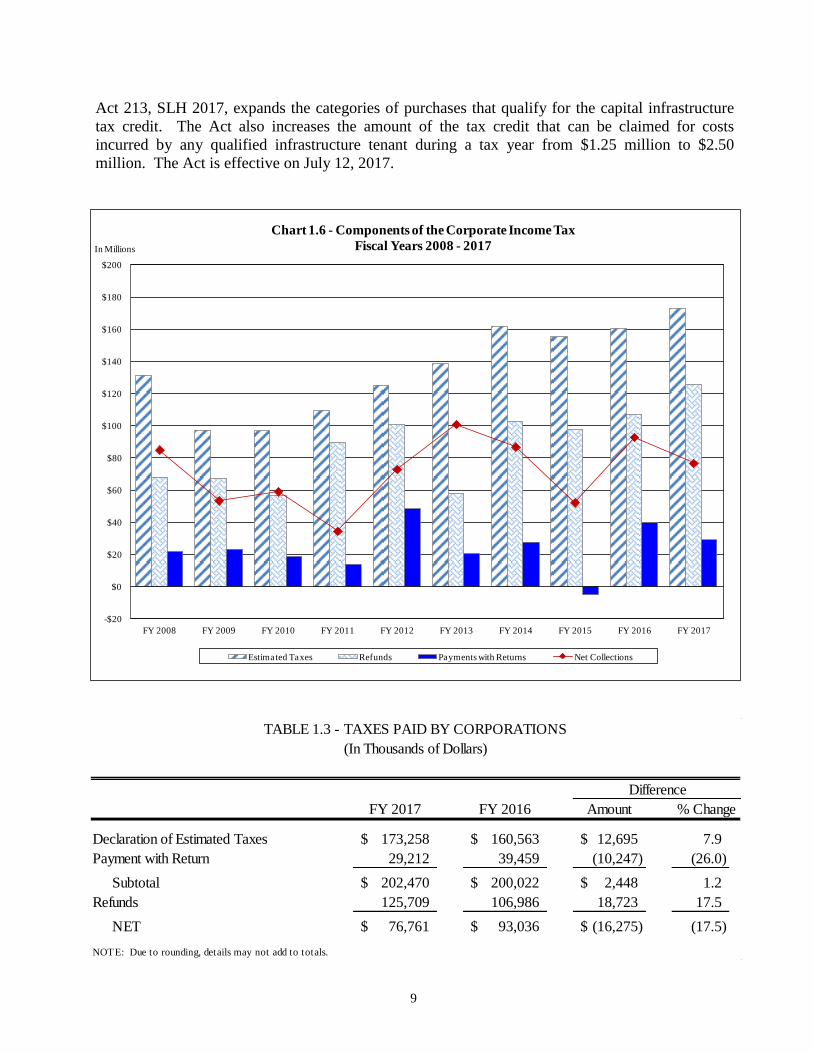
1.4.2 Revenue
Net CIT collections totaled $76.8 million in FY 2017, a decrease of 17.5% from the previous year's
total of $93.0 million. CIT collections are highly cyclical, but they are a relatively small part of
Hawaii's total tax collections. In FY 2017, the CIT accounted for just 1.0% of total tax collections.
Chart 1.6 shows total collections of the CIT, broken down by its components, for FY 2008 through
FY 2017. Table 1.3 shows data on collections of the CIT for FY 2016 and FY 2017.
1.4.3 Recent Legislation
Act 142, SLH 2017, changes the certification process for the renewable fuels production tax credit.
Taxpayers must file a third-party certified statement with the Department of Business, Economic
Development, and Tourism (DBEDT) within 30 days of the close of the calendar year. DBEDT
will then issue a certificate to taxpayers. The Act applies to taxable years beginning after
December 31, 2017.
Act 143, SLH 2017, amends the film tax credit by imposing an aggregate cap of $35 million per
year, provided that any excess in claims above the cap can be applied in a subsequent year until
December 31, 2025. The Act also extends the sunset date for the tax credit from January 1, 2019 to
January 1, 2026. The Act is effective for taxable years beginning after December 31, 2018.
FY 2017 FY 2016 Amount
Declaration of Estimated Taxes 552,236$ 558,669$ (6,432)$ (1.2)
Payment with Return 191,898 199,026 (7,128) (3.6)
Withholding Tax on Wages 1,916,350 1,809,855 106,495 5.9
Subtotal 2,660,484$ 2,567,549$ 92,935$ 3.6
Refunds 467,681 450,690 16,991 3.8
NET 2,192,803$ 2,116,859$ 75,943$ 3.6
NOTE: Due to rounding, details may not add to totals.
TABLE 1.2 - TAXES PAID BY INDIVIDUALS
(In Thousands of Dollars)
Difference
% Change
9
Act 213, SLH 2017, expands the categories of purchases that qualify for the capital infrastructure
tax credit. The Act also increases the amount of the tax credit that can be claimed for costs
incurred by any qualified infrastructure tenant during a tax year from $1.25 million to $2.50
million. The Act is effective on July 12, 2017.
-$20
$0
$20
$40
$60
$80
$100
$120
$140
$160
$180
$200
FY 2008 FY 2009 FY 2010 FY 2011 FY 2012 FY 2013 FY 2014 FY 2015 FY 2016 FY 2017
In Millions
Chart 1.6 - Components of the Corporate Income Tax
Fiscal Years 2008 - 2017
Estimated Taxes Refunds Payments with Returns Net Collections
FY 2017 FY 2016 Amount
Declaration of Estimated Taxes 173,258$ 160,563$ 12,695$ 7.9
Payment with Return 29,212 39,459 (10,247) (26.0)
Subtotal 202,470$ 200,022$ 2,448$ 1.2
Refunds 125,709 106,986 18,723 17.5
NET 76,761$ 93,036$ (16,275)$ (17.5)
NOTE: Due to rounding, details may not add to totals.
TABLE 1.3 - TAXES PAID BY CORPORATIONS
(In Thousands of Dollars)
Difference
% Change
10
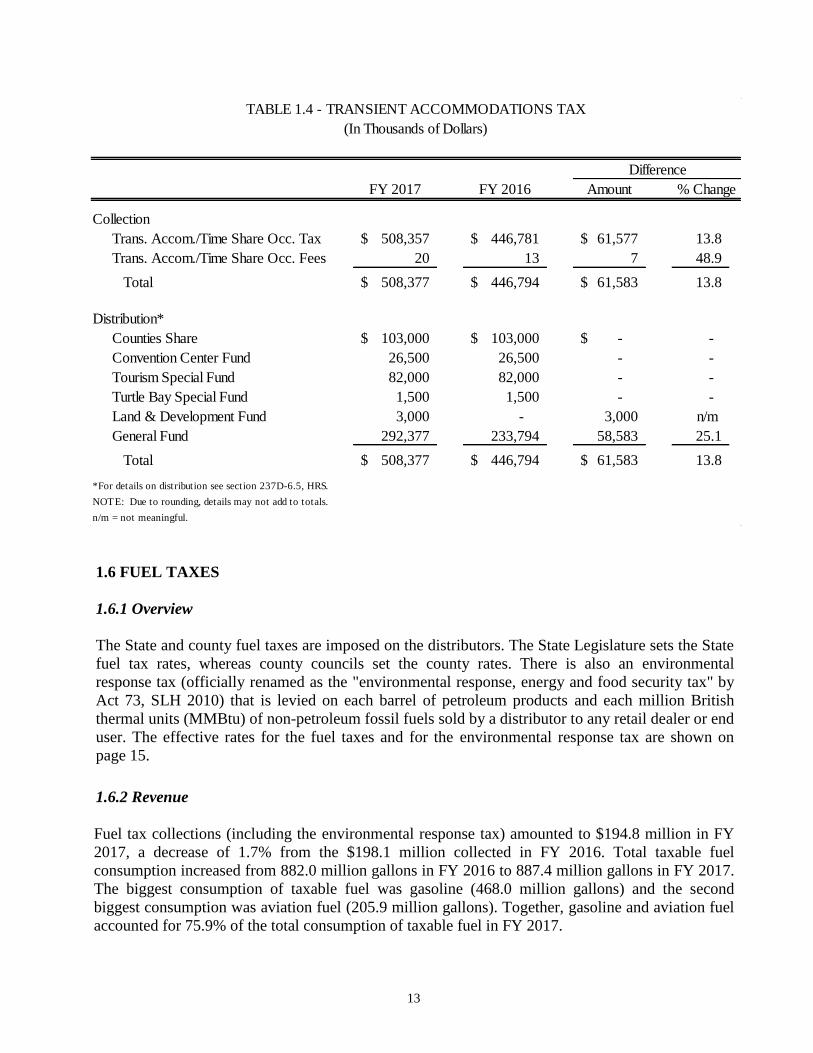
1.5 TRANSIENT ACCOMMODATIONS TAX
1.5.1 Overview
The transient accommodations tax (TAT) is levied on the furnishing of a room, apartment, suite, or
the like, which is customarily occupied by the transient for less than 180 consecutive days. The rate
for the TAT has been 9.25% since July 1, 2010. The registration fee for transient accommodations
operators is a one-time fee of $5 for each registration consisting of 1 to 5 units and $15 for each
registration of 6 or more units. In FY 2017, plan managers of time share units paid TAT at the rate
of 8.25% on the fair market rental value of the units from July 1, 2016 through December 31, 2016
and at the rate of 9.25% from January 1, 2017 through June 30, 2017.
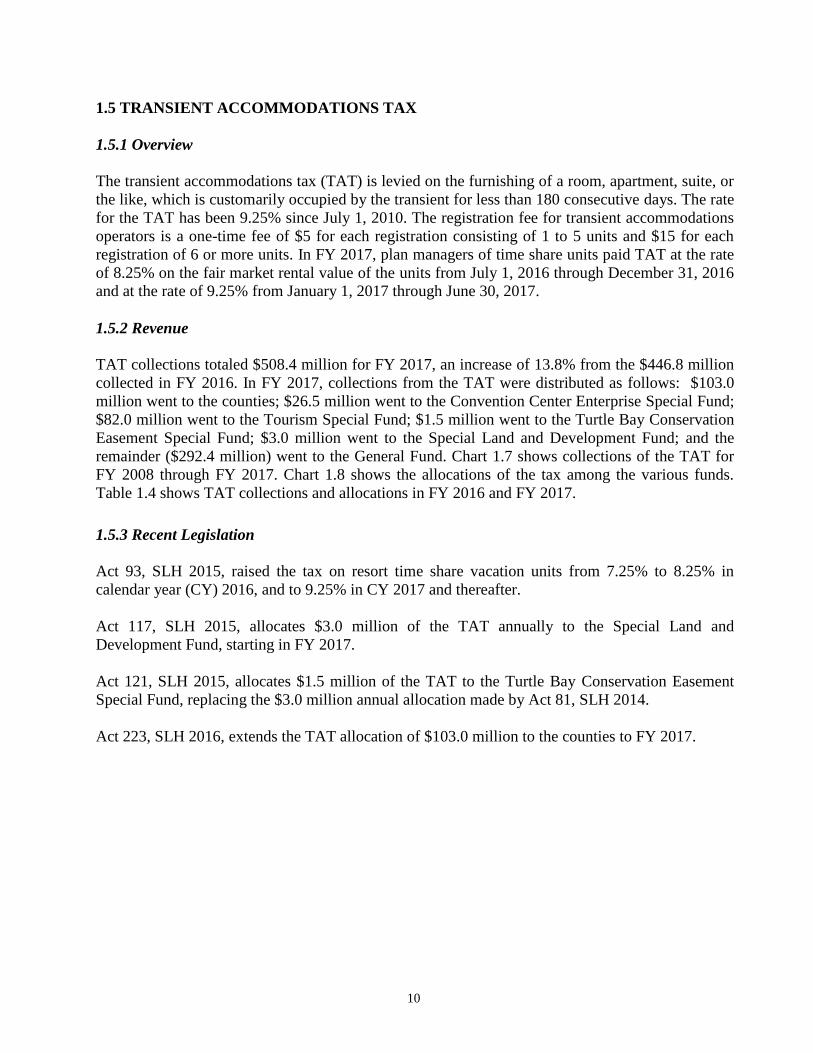
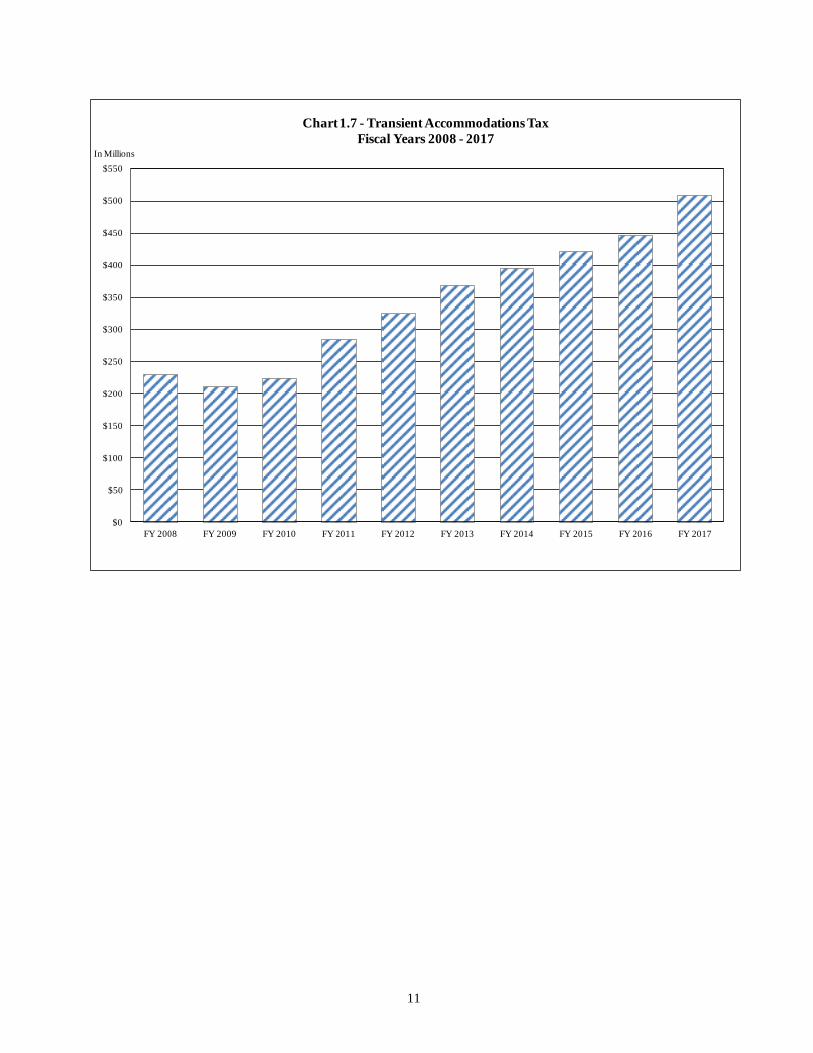
1.5.2 Revenue
TAT collections totaled $508.4 million for FY 2017, an increase of 13.8% from the $446.8 million
collected in FY 2016. In FY 2017, collections from the TAT were distributed as follows: $103.0
million went to the counties; $26.5 million went to the Convention Center Enterprise Special Fund;
$82.0 million went to the Tourism Special Fund; $1.5 million went to the Turtle Bay Conservation
Easement Special Fund; $3.0 million went to the Special Land and Development Fund; and the
remainder ($292.4 million) went to the General Fund. Chart 1.7 shows collections of the TAT for
FY 2008 through FY 2017. Chart 1.8 shows the allocations of the tax among the various funds.
Table 1.4 shows TAT collections and allocations in FY 2016 and FY 2017.
1.5.3 Recent Legislation
Act 93, SLH 2015, raised the tax on resort time share vacation units from 7.25% to 8.25% in
calendar year (CY) 2016, and to 9.25% in CY 2017 and thereafter.
Act 117, SLH 2015, allocates $3.0 million of the TAT annually to the Special Land and
Development Fund, starting in FY 2017.
Act 121, SLH 2015, allocates $1.5 million of the TAT to the Turtle Bay Conservation Easement
Special Fund, replacing the $3.0 million annual allocation made by Act 81, SLH 2014.
Act 223, SLH 2016, extends the TAT allocation of $103.0 million to the counties to FY 2017.
11
$0
$50
$100
$150
$200
$250
$300
$350
$400
$450
$500
$550
FY 2008 FY 2009 FY 2010 FY 2011 FY 2012 FY 2013 FY 2014 FY 2015 FY 2016 FY 2017
In Millions
Chart 1.7 - Transient Accommodations Tax
Fiscal Years 2008 - 2017
12
$32.5 $30.7 $32.8 $36.8 $35.6 $33.0 $33.0 $33.0 $26.5 $26.5
$78.2 $72.0 $69.1 $85.0
$69.0 $71.0 $82.0 $82.0 $82.0 $82.0
$3.0
$102.8 $94.4 $90.6
$102.9
$93.0 $93.0 $93.0 $103.0 $103.0 $103.0
$1.5 $1.5 $15.9
$13.6 $31.7
$59.8 $126.3
$171.6
$187.2
$203.0 $233.8
$292.4
$0
$50
$100
$150
$200
$250
$300
$350
$400
$450
$500
$550
FY 2008 FY 2009 FY 2010 FY 2011 FY 2012 FY 2013 FY 2014 FY 2015 FY 2016 FY 2017
In Millions
Chart 1.8 - Transient AccommodationsTax Distributions
Fiscal Years 2008 - 2017
Convention Center Fund Tourism Special Fund Land & Development Fund Counties' Share Turtle Bay Conservation Fund General Fund
$421.0
$446.8
$508.4
$229.4
$210.6$224.3
$284.5
$324.0
$368.6
$395.2
13
1.6 FUEL TAXES
1.6.1 Overview
The State and county fuel taxes are imposed on the distributors. The State Legislature sets the State
fuel tax rates, whereas county councils set the county rates. There is also an environmental
response tax (officially renamed as the "environmental response, energy and food security tax" by
Act 73, SLH 2010) that is levied on each barrel of petroleum products and each million British
thermal units (MMBtu) of non-petroleum fossil fuels sold by a distributor to any retail dealer or end
user. The effective rates for the fuel taxes and for the environmental response tax are shown on
page 15.
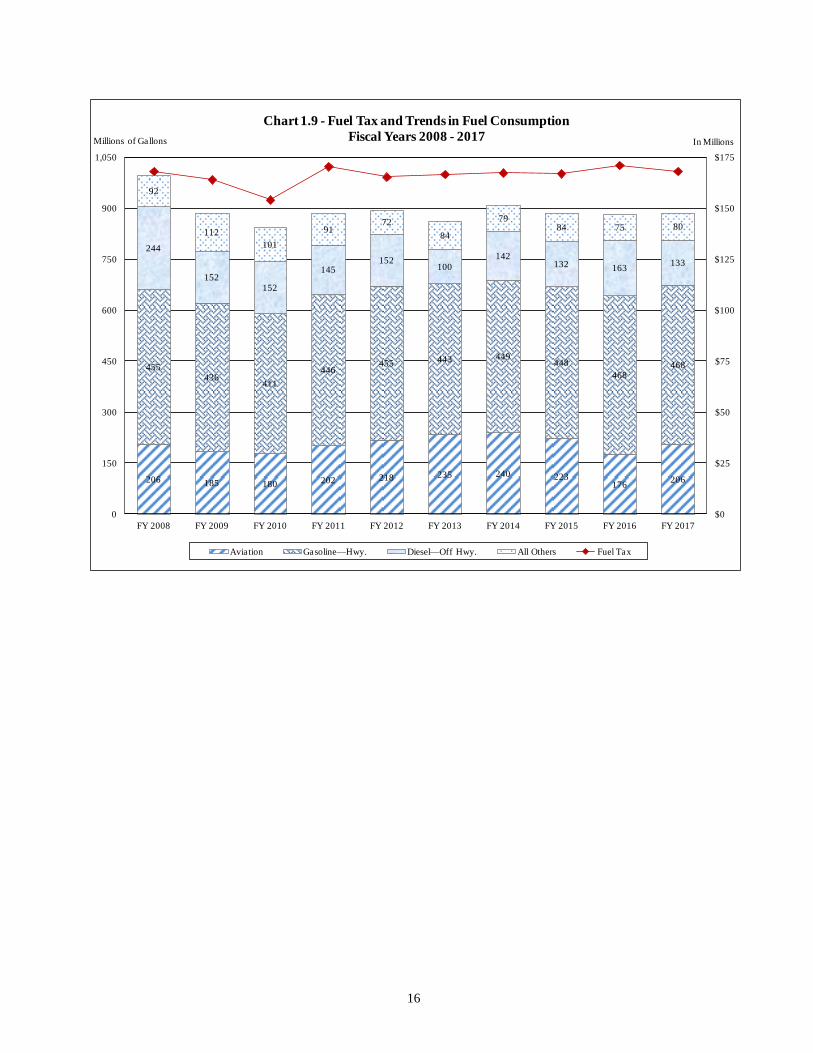
1.6.2 Revenue
Fuel tax collections (including the environmental response tax) amounted to $194.8 million in FY
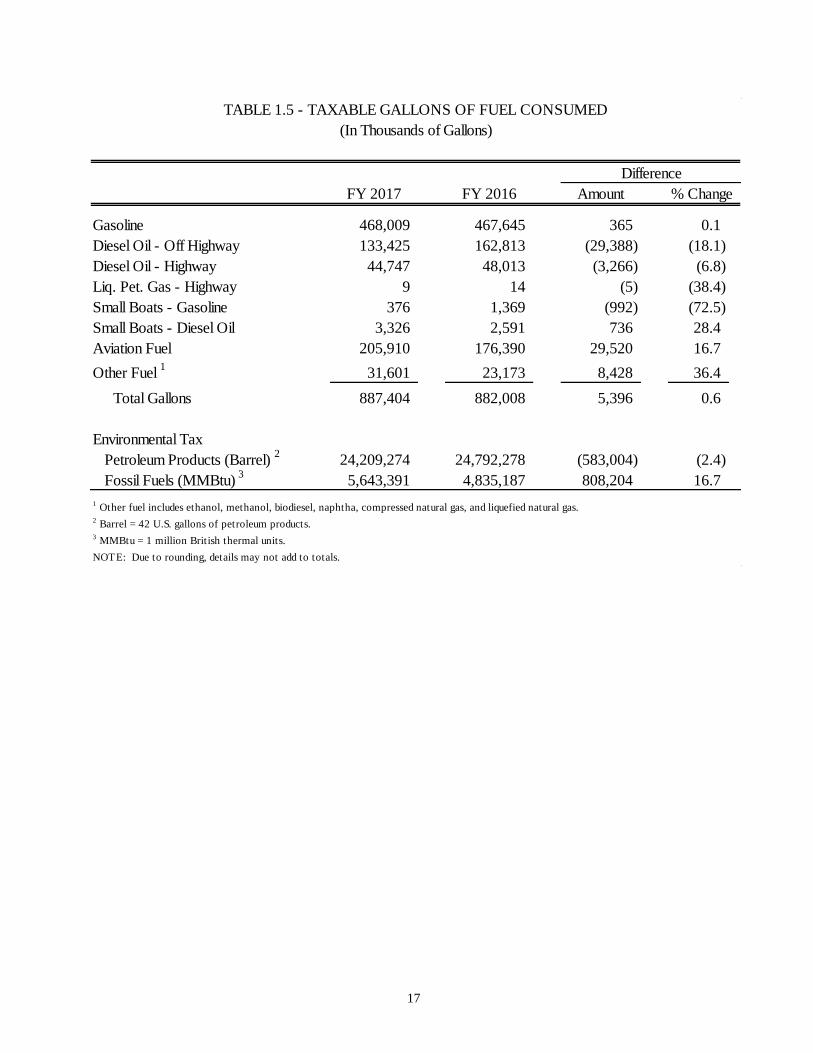
2017, a decrease of 1.7% from the $198.1 million collected in FY 2016. Total taxable fuel
consumption increased from 882.0 million gallons in FY 2016 to 887.4 million gallons in FY 2017.
The biggest consumption of taxable fuel was gasoline (468.0 million gallons) and the second
biggest consumption was aviation fuel (205.9 million gallons). Together, gasoline and aviation fuel
accounted for 75.9% of the total consumption of taxable fuel in FY 2017.
FY 2017 FY 2016 Amount
Collection
Trans. Accom./Time Share Occ. Tax 508,357$ 446,781$ 61,577$ 13.8
Trans. Accom./Time Share Occ. Fees 20 13 7 48.9
Total 508,377$ 446,794$ 61,583$ 13.8
Distribution*
Counties Share 103,000$ 103,000$ -$ -
Convention Center Fund 26,500 26,500 - -
Tourism Special Fund 82,000 82,000 - -
Turtle Bay Special Fund 1,500 1,500 - -
Land & Development Fund 3,000 - 3,000 n/m
General Fund 292,377 233,794 58,583 25.1
Total 508,377$ 446,794$ 61,583$ 13.8
*For details on distribution see section 237D-6.5, HRS.
NOTE: Due to rounding, details may not add to totals.
n/m = not meaningful.
% Change
(In Thousands of Dollars)
Difference
TABLE 1.4 - TRANSIENT ACCOMMODATIONS TAX
14
Collections of the environmental response tax amounted to $26.5 million in FY 2017, a decrease of
1.7% from the $27.0 million collected in FY 2016. The environmental response tax rate on each
barrel of petroleum product was $1.05. The tax was levied on 24.2 million barrels of petroleum in
FY 2017, down from 24.8 million barrels in FY 2016. The environmental response tax rate on each
MMBtu of non-petroleum fossil fuels was nineteen cents. The tax was levied on 5.6 million
MMBtu of non-petroleum fossil fuels in FY 2017, up from 4.8 million MMBtu in FY 2016. Chart
1.9 shows collections of the fuel taxes and the gallons consumed of the various fuel types, for FY
2008 through FY 2017. Data for taxable gallons consumed in FY 2016 and FY 2017 are given in
Table 1.5.
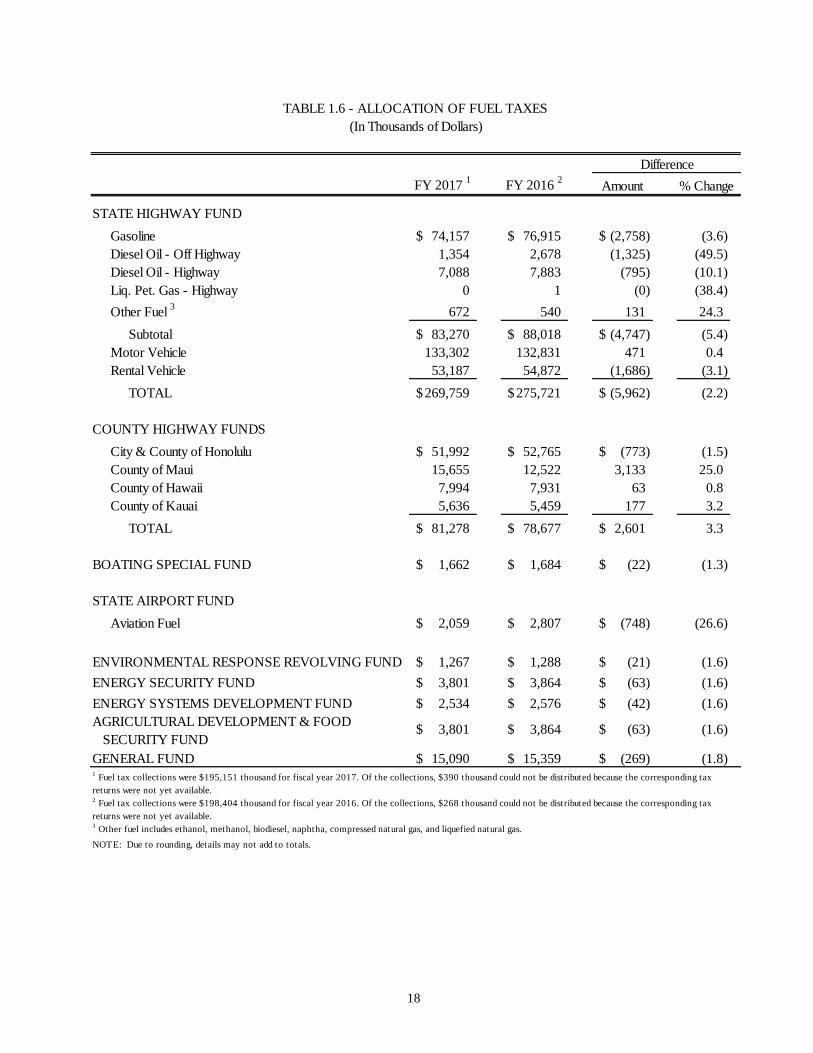
The revenues from fuel taxes are distributed to several special funds. One percent of the fuel taxes
paid on liquid fuel, not including aviation fuel, are deposited into the Boating Special Fund. Fuel
taxes paid on sales of aviation fuel are deposited into the Airport Revenue Fund. Remaining
revenues from the State fuel taxes are deposited into the State Highway Fund, whereas remaining
revenues from county fuel taxes are deposited into the counties' highway funds.
Revenues from the environmental response tax were distributed as follows in FY 2017: For each
barrel taxed at $1.05, five cents went to the Environmental Response Revolving Fund administered
by the Department of Health for oil spill prevention and remediation programs; fifteen cents went to
the Energy Security Special Fund administered by the Department of Business, Economic
Development, and Tourism to support the Hawaii clean energy initiative program; fifteen cents
went to the Agricultural Development & Food Security Special Fund administered by the
Department of Agriculture to fund activities intended to increase agricultural production or
processing that may lead to reduced importation of food, fodder, or feed from outside the state; ten
cents went to the Energy Systems Development Special Fund, and the remainder (sixty cents) went
to the General Fund. For each MMBtu taxed at nineteen cents, one cent went to the Environmental
Response Revolving Fund, three cents went to the Energy Security Special Fund, three cents went
to the Agricultural Development & Food Security Special Fund, two cents went to the Energy
Systems Development Special Fund, and the remainder (ten cents) went to the General Fund.
Table 1.6 shows how the fuel taxes and the environmental response tax were allocated in FY 2016
and FY 2017. The table also shows allocations of the motor vehicle taxes and fees to the State
Highway Fund.
1.6.3 Recent Legislation
Act 107, SLH 2014, reestablished the Energy Systems Development Special Fund and extended the
$1.05 per barrel rate for the environmental response tax through fiscal year 2030. (The tax rate was
scheduled to go back to $0.05 per barrel at the end of fiscal year 2015.)
Act 185, SLH 2015, applies the environmental response tax to non-petroleum fossil fuels at
nineteen cents per million British thermal units effective July 1, 2015, and removes the sunsets to
various funds related to the tax.
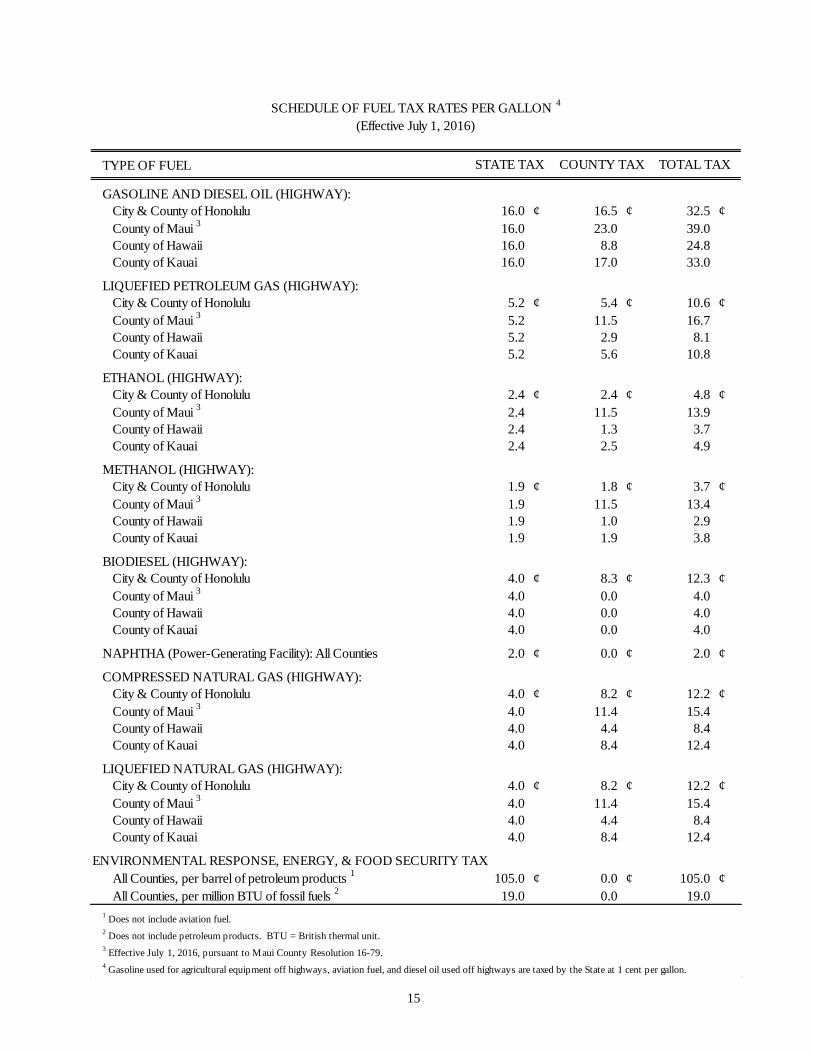
15
TYPE OF FUEL
GASOLINE AND DIESEL OIL (HIGHWAY):
City & County of Honolulu 16.0 ¢ 16.5 ¢ 32.5 ¢
County of Maui 3
16.0 23.0 39.0
County of Hawaii 16.0 8.8 24.8
County of Kauai 16.0 17.0 33.0
LIQUEFIED PETROLEUM GAS (HIGHWAY):
City & County of Honolulu 5.2 ¢ 5.4 ¢ 10.6 ¢
County of Maui 3
5.2 11.5 16.7
County of Hawaii 5.2 2.9 8.1
County of Kauai 5.2 5.6 10.8
ETHANOL (HIGHWAY):
City & County of Honolulu 2.4 ¢ 2.4 ¢ 4.8 ¢
County of Maui 3
2.4 11.5 13.9
County of Hawaii 2.4 1.3 3.7
County of Kauai 2.4 2.5 4.9
METHANOL (HIGHWAY):
City & County of Honolulu 1.9 ¢ 1.8 ¢ 3.7 ¢
County of Maui 3
1.9 11.5 13.4
County of Hawaii 1.9 1.0 2.9
County of Kauai 1.9 1.9 3.8
BIODIESEL (HIGHWAY):
City & County of Honolulu 4.0 ¢ 8.3 ¢ 12.3 ¢
County of Maui 3
4.0 0.0 4.0
County of Hawaii 4.0 0.0 4.0
County of Kauai 4.0 0.0 4.0
NAPHTHA (Power-Generating Facility): All Counties 2.0 ¢ 0.0 ¢ 2.0 ¢
COMPRESSED NATURAL GAS (HIGHWAY):
City & County of Honolulu 4.0 ¢ 8.2 ¢ 12.2 ¢
County of Maui 3
4.0 11.4 15.4
County of Hawaii 4.0 4.4 8.4
County of Kauai 4.0 8.4 12.4
LIQUEFIED NATURAL GAS (HIGHWAY):
City & County of Honolulu 4.0 ¢ 8.2 ¢ 12.2 ¢
County of Maui 3
4.0 11.4 15.4
County of Hawaii 4.0 4.4 8.4
County of Kauai 4.0 8.4 12.4
ENVIRONMENTAL RESPONSE, ENERGY, & FOOD SECURITY TAX
All Counties, per barrel of petroleum products 1
105.0 ¢ 0.0 ¢ 105.0 ¢
All Counties, per million BTU of fossil fuels 2
19.0 0.0 19.0
1 Does not include aviation fuel.
2 Does not include petroleum products. BTU = British thermal unit.
3 Effective July 1, 2016, pursuant to Maui County Resolution 16-79.
4 Gasoline used for agricultural equipment off highways, aviation fuel, and diesel oil used off highways are taxed by the State at 1 cent per gallon.
SCHEDULE OF FUEL TAX RATES PER GALLON 4
(Effective July 1, 2016)
STATE TAX COUNTY TAX TOTAL TAX
16
206 185 180 202 218 235 240 223176
206
455436
411
446455 443 449
448
468468
244
152152
145152
100
142132 163
133
92
112
101
9172
84
7984 75 80
$0
$25
$50
$75
$100
$125
$150
$175
0
150
300
450
600
750
900
1,050
FY 2008 FY 2009 FY 2010 FY 2011 FY 2012 FY 2013 FY 2014 FY 2015 FY 2016 FY 2017
Millions of Gallons
Chart 1.9 - Fuel Tax and Trends in Fuel Consumption
Fiscal Years 2008 - 2017
Aviation Gasoline—Hwy. Diesel—Off Hwy. All Others Fuel Tax
In Millions
17
FY 2017 FY 2016 Amount % Change
Gasoline 468,009 467,645 365 0.1
Diesel Oil - Off Highway 133,425 162,813 (29,388) (18.1)
Diesel Oil - Highway 44,747 48,013 (3,266) (6.8)
Liq. Pet. Gas - Highway 9 14 (5) (38.4)
Small Boats - Gasoline 376 1,369 (992) (72.5)
Small Boats - Diesel Oil 3,326 2,591 736 28.4
Aviation Fuel 205,910 176,390 29,520 16.7
Other Fuel 1
31,601 23,173 8,428 36.4
Total Gallons 887,404 882,008 5,396 0.6
Environmental Tax
Petroleum Products (Barrel) 2
24,209,274 24,792,278 (583,004) (2.4)
Fossil Fuels (MMBtu) 3
5,643,391 4,835,187 808,204 16.7
NOTE: Due to rounding, details may not add to totals.
1 Other fuel includes ethanol, methanol, biodiesel, naphtha, compressed natural gas, and liquefied natural gas.2 Barrel = 42 U.S. gallons of petroleum products. 3 MMBtu = 1 million British thermal units.
TABLE 1.5 - TAXABLE GALLONS OF FUEL CONSUMED
(In Thousands of Gallons)
Difference
18
FY 2017 1
FY 2016 2
Amount % Change
STATE HIGHWAY FUND
Gasoline 74,157$ 76,915$ (2,758)$ (3.6)
Diesel Oil - Off Highway 1,354 2,678 (1,325) (49.5)
Diesel Oil - Highway 7,088 7,883 (795) (10.1)
Liq. Pet. Gas - Highway 0 1 (0) (38.4)
Other Fuel 3
672 540 131 24.3
Subtotal 83,270$ 88,018$ (4,747)$ (5.4)
Motor Vehicle 133,302 132,831 471 0.4
Rental Vehicle 53,187 54,872 (1,686) (3.1)
TOTAL 269,759$ 275,721$ (5,962)$ (2.2)
COUNTY HIGHWAY FUNDS
City & County of Honolulu 51,992$ 52,765$ (773)$ (1.5)
County of Maui 15,655 12,522 3,133 25.0
County of Hawaii 7,994 7,931 63 0.8
County of Kauai 5,636 5,459 177 3.2
TOTAL 81,278$ 78,677$ 2,601$ 3.3
BOATING SPECIAL FUND 1,662$ 1,684$ (22)$ (1.3)
STATE AIRPORT FUND
Aviation Fuel 2,059$ 2,807$ (748)$ (26.6)
ENVIRONMENTAL RESPONSE REVOLVING FUND 1,267$ 1,288$ (21)$ (1.6)
ENERGY SECURITY FUND 3,801$ 3,864$ (63)$ (1.6)
ENERGY SYSTEMS DEVELOPMENT FUND 2,534$ 2,576$ (42)$ (1.6)
3,801$ 3,864$ (63)$ (1.6)
GENERAL FUND 15,090$ 15,359$ (269)$ (1.8)
3 Other fuel includes ethanol, methanol, biodiesel, naphtha, compressed natural gas, and liquefied natural gas.
NOTE: Due to rounding, details may not add to totals.
2 Fuel tax collections were $198,404 thousand for fiscal year 2016. Of the collections, $268 thousand could not be distributed because the corresponding tax
returns were not yet available.
TABLE 1.6 - ALLOCATION OF FUEL TAXES
(In Thousands of Dollars)
Difference
AGRICULTURAL DEVELOPMENT & FOOD
SECURITY FUND
1 Fuel tax collections were $195,151 thousand for fiscal year 2017. Of the collections, $390 thousand could not be distributed because the corresponding tax
returns were not yet available.
19
1.7 MOTOR VEHICLE TAXES AND FEES
1.7.1 Overview
The State levies an annual registration fee per vehicle and a tax based on vehicle weight. The State
also levies the rental motor vehicle, tour vehicle, and car-sharing vehicle surcharge tax (RVST).
The tax on rentals of motor vehicles is imposed on the lessor. The rate of the tax is $3.00 per day.
The tax on tour vehicles is imposed on the tour vehicle operator. The rate of the tax is $65 per
month for each tour vehicle in the 26 passenger seat and over category, and $15 per month for each
tour vehicle in the 8 to 25 passenger seat category. The tax on motor vehicles that are rented or
leased by a car-sharing organization is imposed on the car-sharing organization. The rate of the tax
is 25 cents per half-hour. There is a one-time $20 registration fee for those subject to any part of
the RVST.
1.7.2 Revenue
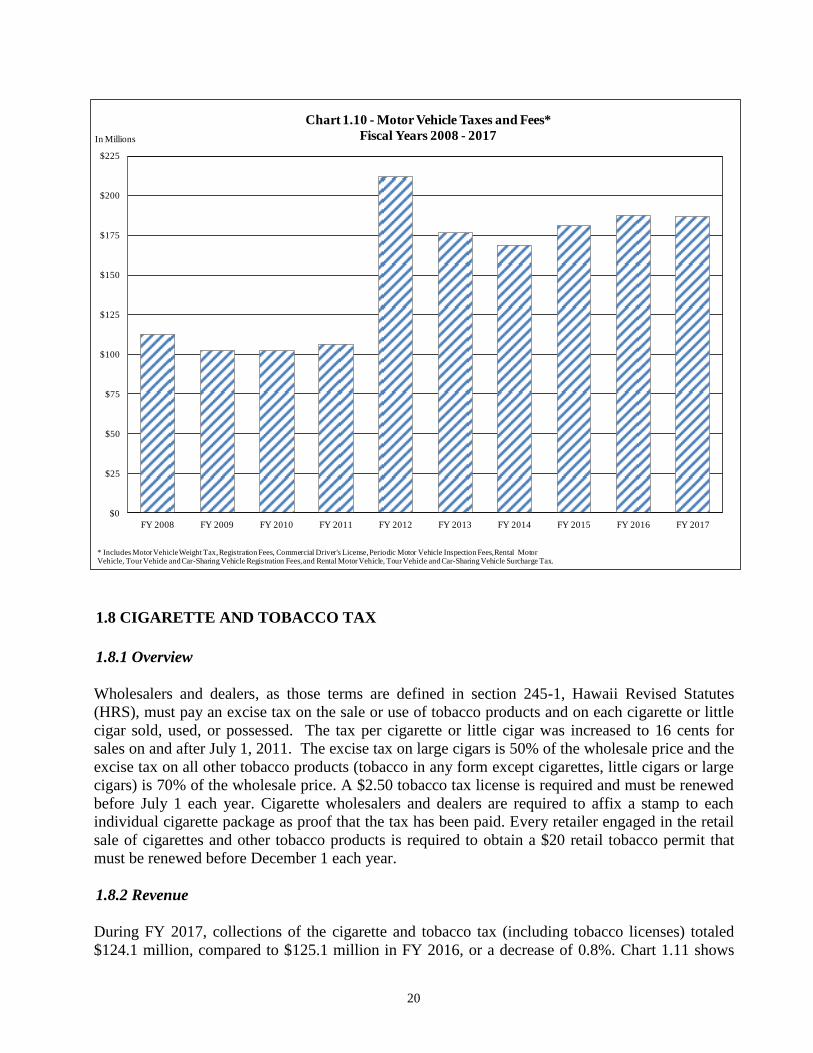
For FY 2017, the State's motor vehicle taxes and fees (including the RVST) totaled $186.5 million,
compared to $187.7 million in FY 2016, a decrease of 0.6%. Chart 1.10 shows the total motor
vehicle taxes and fees for FY 2008 through FY 2017. The large increase in FY 2012 was caused by
a temporary increase in the rate of the RVST to $7.50 per day, which was in place for the period
from July 1, 2011 to June 30, 2012. The collections for FY 2013 also reflect one month of
collections at the higher tax rate, since the collections lag the liabilities incurred by one month.
20
1.8 CIGARETTE AND TOBACCO TAX
1.8.1 Overview
Wholesalers and dealers, as those terms are defined in section 245-1, Hawaii Revised Statutes
(HRS), must pay an excise tax on the sale or use of tobacco products and on each cigarette or little
cigar sold, used, or possessed. The tax per cigarette or little cigar was increased to 16 cents for
sales on and after July 1, 2011. The excise tax on large cigars is 50% of the wholesale price and the
excise tax on all other tobacco products (tobacco in any form except cigarettes, little cigars or large
cigars) is 70% of the wholesale price. A $2.50 tobacco tax license is required and must be renewed
before July 1 each year. Cigarette wholesalers and dealers are required to affix a stamp to each
individual cigarette package as proof that the tax has been paid. Every retailer engaged in the retail
sale of cigarettes and other tobacco products is required to obtain a $20 retail tobacco permit that
must be renewed before December 1 each year.
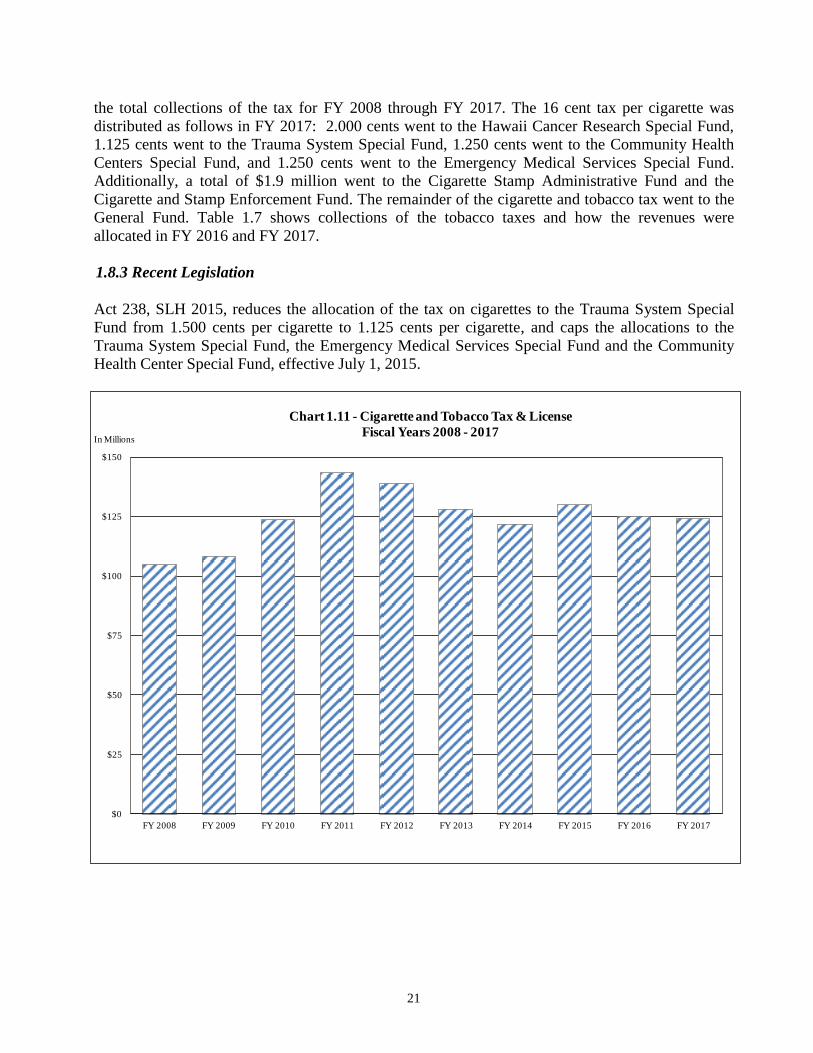
1.8.2 Revenue
During FY 2017, collections of the cigarette and tobacco tax (including tobacco licenses) totaled
$124.1 million, compared to $125.1 million in FY 2016, or a decrease of 0.8%. Chart 1.11 shows
$0
$25
$50
$75
$100
$125
$150
$175
$200
$225
FY 2008 FY 2009 FY 2010 FY 2011 FY 2012 FY 2013 FY 2014 FY 2015 FY 2016 FY 2017
In Millions
Chart 1.10 - Motor Vehicle Taxes and Fees*
Fiscal Years 2008 - 2017
* Includes Motor Vehicle Weight Tax, Registration Fees, Commercial Driver's License, Periodic Motor Vehicle Inspection Fees, Rental Motor Vehicle, Tour Vehicle andCar-Sharing Vehicle Registration Fees,and Rental Motor Vehicle, Tour Vehicle and Car-Sharing Vehicle Surcharge Tax.
21
the total collections of the tax for FY 2008 through FY 2017. The 16 cent tax per cigarette was
distributed as follows in FY 2017: 2.000 cents went to the Hawaii Cancer Research Special Fund,
1.125 cents went to the Trauma System Special Fund, 1.250 cents went to the Community Health
Centers Special Fund, and 1.250 cents went to the Emergency Medical Services Special Fund.
Additionally, a total of $1.9 million went to the Cigarette Stamp Administrative Fund and the
Cigarette and Stamp Enforcement Fund. The remainder of the cigarette and tobacco tax went to the
General Fund. Table 1.7 shows collections of the tobacco taxes and how the revenues were
allocated in FY 2016 and FY 2017.
1.8.3 Recent Legislation
Act 238, SLH 2015, reduces the allocation of the tax on cigarettes to the Trauma System Special
Fund from 1.500 cents per cigarette to 1.125 cents per cigarette, and caps the allocations to the
Trauma System Special Fund, the Emergency Medical Services Special Fund and the Community
Health Center Special Fund, effective July 1, 2015.
$0
$25
$50
$75
$100
$125
$150
FY 2008 FY 2009 FY 2010 FY 2011 FY 2012 FY 2013 FY 2014 FY 2015 FY 2016 FY 2017
In Millions
Chart 1.11 - Cigarette and Tobacco Tax & License
Fiscal Years 2008 - 2017
22
1.9 PUBLIC SERVICE COMPANY TAX
1.9.1 Overview
The public service company (PSC) tax is levied on public utility businesses in lieu of all taxes
except income taxes, vehicular taxes imposed under chapter 249, HRS, the franchise tax on public
utilities imposed under chapter 240, HRS, and the use tax imposed under chapter 238, HRS.
Generally, the tax is applied to gross income from the business of public utilities for the preceding
calendar year. The tax rates on the PSC's range from 0.50% (levied on sales for resale) to 8.20%.
For a public utility, only the first 4.0% is realized by the State; any excess over 4.0% is distributed
to counties that provide a real property tax exemption for property used by the public utility in its
business. For a carrier of passengers by land between points on a scheduled route, the gross income
from passenger fares is taxed at 5.35%, all of which is realized by the State.
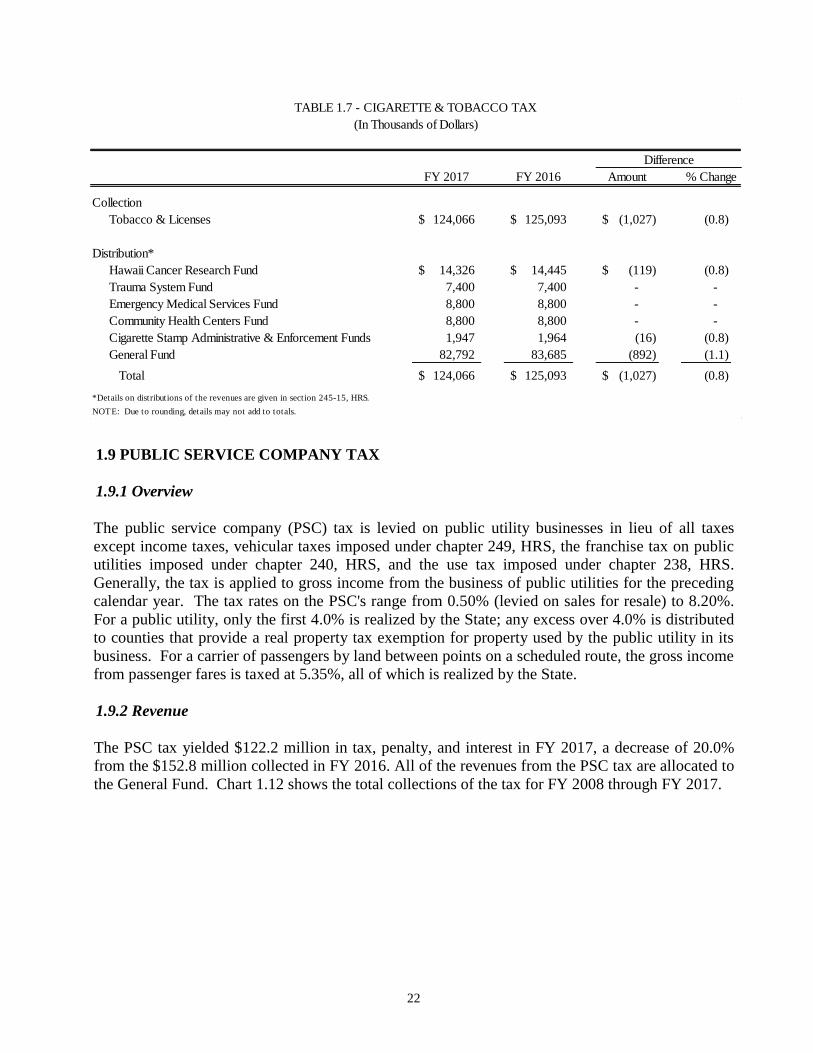
1.9.2 Revenue
The PSC tax yielded $122.2 million in tax, penalty, and interest in FY 2017, a decrease of 20.0%
from the $152.8 million collected in FY 2016. All of the revenues from the PSC tax are allocated to
the General Fund. Chart 1.12 shows the total collections of the tax for FY 2008 through FY 2017.
FY 2017 FY 2016 Amount
Collection
Tobacco & Licenses 124,066$ 125,093$ (1,027)$ (0.8)
Distribution*
Hawaii Cancer Research Fund 14,326$ 14,445$ (119)$ (0.8)
Trauma System Fund 7,400 7,400 - -
Emergency Medical Services Fund 8,800 8,800 - -
Community Health Centers Fund 8,800 8,800 - -
Cigarette Stamp Administrative & Enforcement Funds 1,947 1,964 (16) (0.8)
General Fund 82,792 83,685 (892) (1.1)
Total 124,066$ 125,093$ (1,027)$ (0.8)
*Details on distributions of the revenues are given in section 245-15, HRS.
NOTE: Due to rounding, details may not add to totals.
% Change
TABLE 1.7 - CIGARETTE & TOBACCO TAX
(In Thousands of Dollars)
Difference
23
1.10 UNEMPLOYMENT INSURANCE TAX
1.10.1 Overview
The unemployment insurance (UI) tax (officially "employment security contributions") is imposed
on wages paid by employers with one or more employees, with certain exemptions. The tax is
experience rated. The UI tax rate for each year depends on the condition of the UI Trust Fund. The
tax base represents the state's average annual wages reported by employers contributing to the
Unemployment Trust Fund. For FY 2017, the tax base ranged from $42,200 in CY 2016 to $44,000
in CY 2017 and the contribution rate for new employers was 2.4% in both CY 2016 and CY 2017.
Revenues from the tax go to the Unemployment Trust Fund. The Department of Labor and
Industrial Relations administers the UI tax and the Department of Taxation collects the tax.
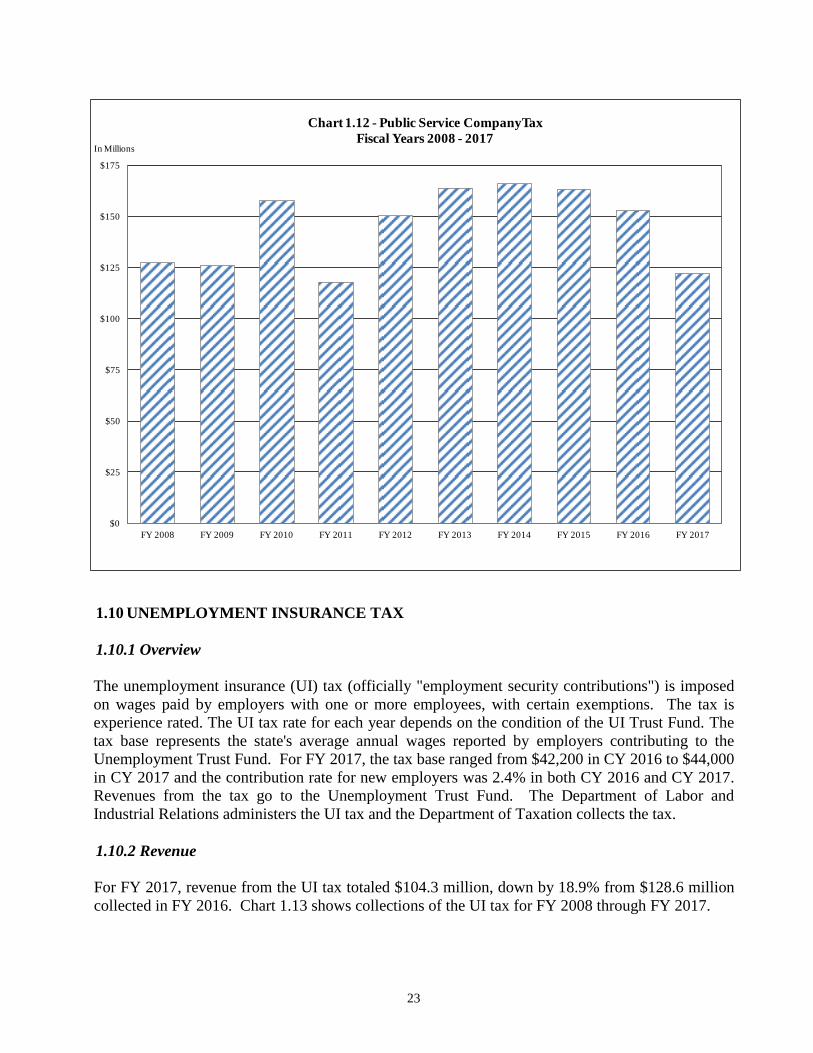
1.10.2 Revenue
For FY 2017, revenue from the UI tax totaled $104.3 million, down by 18.9% from $128.6 million
collected in FY 2016. Chart 1.13 shows collections of the UI tax for FY 2008 through FY 2017.
$0
$25
$50
$75
$100
$125
$150
$175
FY 2008 FY 2009 FY 2010 FY 2011 FY 2012 FY 2013 FY 2014 FY 2015 FY 2016 FY 2017
In Millions
Chart 1.12 - Public Service CompanyTax
Fiscal Years 2008 - 2017
24
1.11 INSURANCE PREMIUM TAX
1.11.1 Overview
The tax on insurance premiums applies to insurance companies (underwriters) based on premiums
written in Hawaii. The insurance premium tax is in lieu of all taxes except property tax and taxes on
the purchase, use or ownership of tangible personal property. The tax rates are as follows: (1) Life
Insurance, 2.75%; (2) Surplus Lines, 4.68%; (3) Ocean Marine, 0.8775% on gross underwriting
profit; and (4) Other Insurance, 4.265%. To insurers who qualify, there is a 1.0% tax credit to
facilitate regulatory oversight. The tax is administered and collected by the Insurance
Commissioner, who is required to report to the Director of Taxation the amounts of all taxes
collected under chapter 431, HRS.
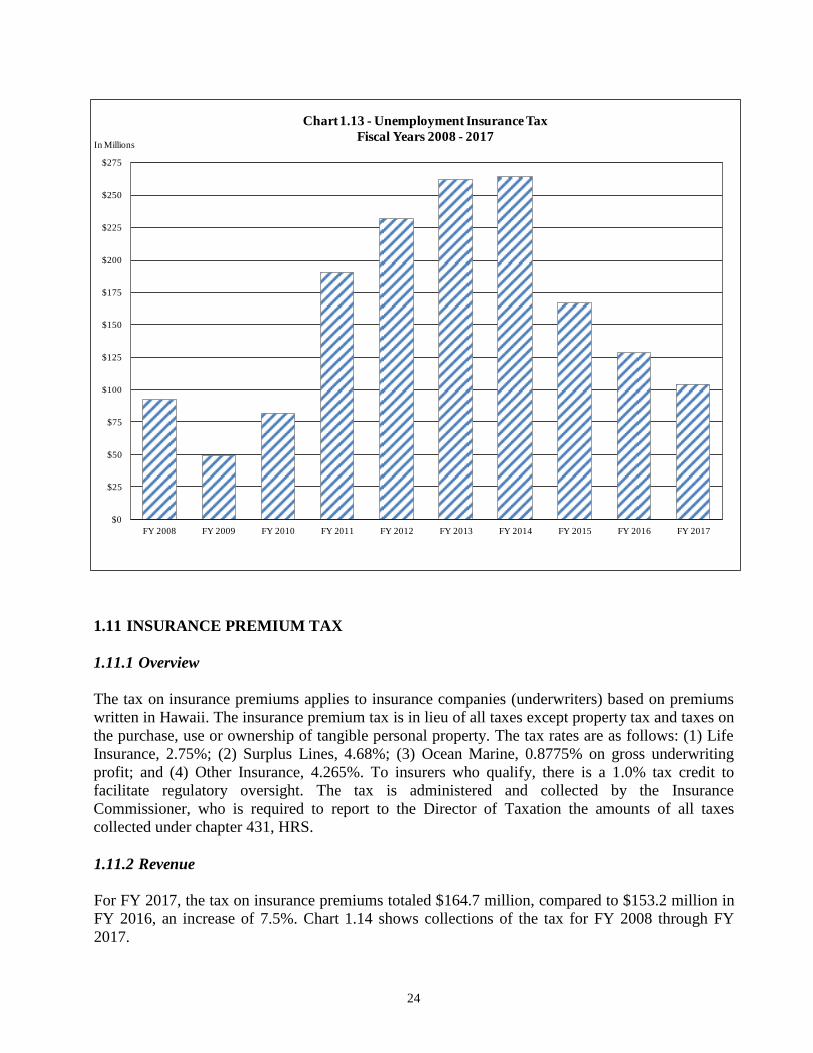
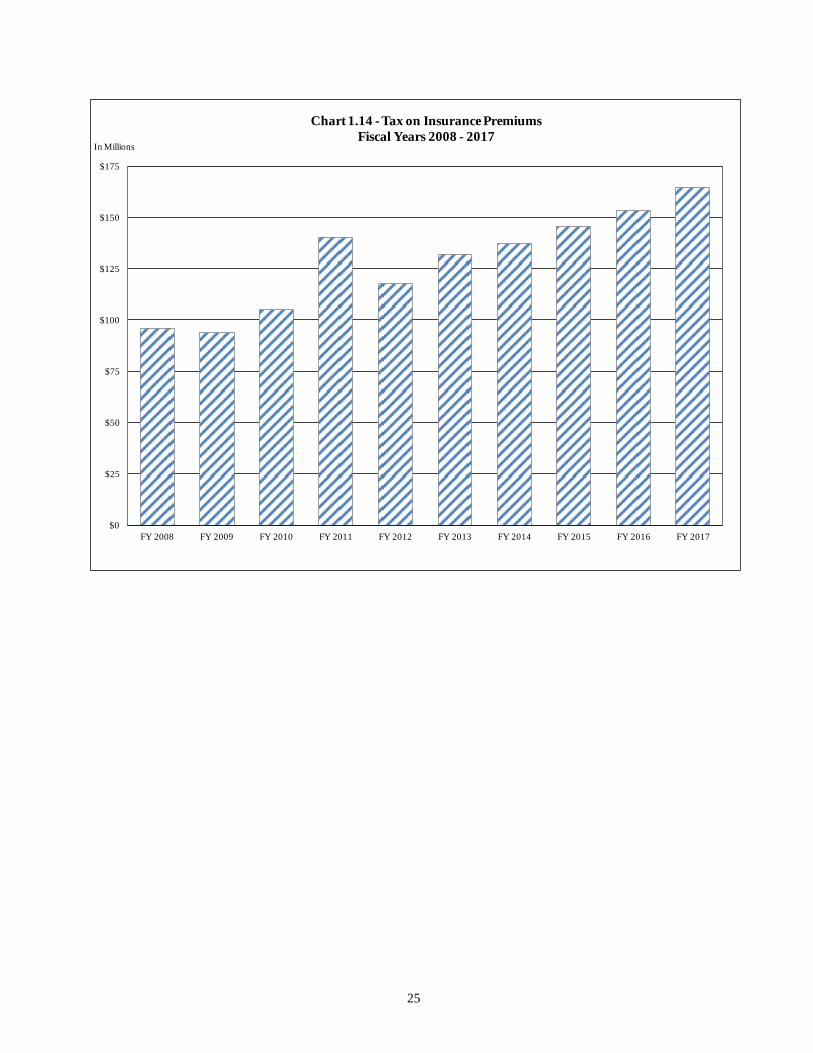
1.11.2 Revenue
For FY 2017, the tax on insurance premiums totaled $164.7 million, compared to $153.2 million in
FY 2016, an increase of 7.5%. Chart 1.14 shows collections of the tax for FY 2008 through FY
2017.
$0
$25
$50
$75
$100
$125
$150
$175
$200
$225
$250
$275
FY 2008 FY 2009 FY 2010 FY 2011 FY 2012 FY 2013 FY 2014 FY 2015 FY 2016 FY 2017
In Millions
Chart 1.13 - Unemployment Insurance Tax
Fiscal Years 2008 - 2017
25
$0
$25
$50
$75
$100
$125
$150
$175
FY 2008 FY 2009 FY 2010 FY 2011 FY 2012 FY 2013 FY 2014 FY 2015 FY 2016 FY 2017
In Millions
Chart 1.14 - Tax on Insurance Premiums
Fiscal Years 2008 - 2017
26
1.12 LIQUOR TAX
1.12.1 Overview
The tax on liquor is a gallonage tax imposed on dealers as defined in section 244D-1, HRS, and
upon certain others who sell or use liquor. A $2.50 liquor tax permit is required and must be
renewed before July 1 each year. See section 244D-4, HRS, for exemptions from the tax. The tax
rates per wine gallon are $5.98 on distilled spirits, $2.12 on sparkling wine, $1.38 on still wine,
$0.85 on cooler beverages, $0.93 on beer other than draft beer, and $0.54 on draft beer.
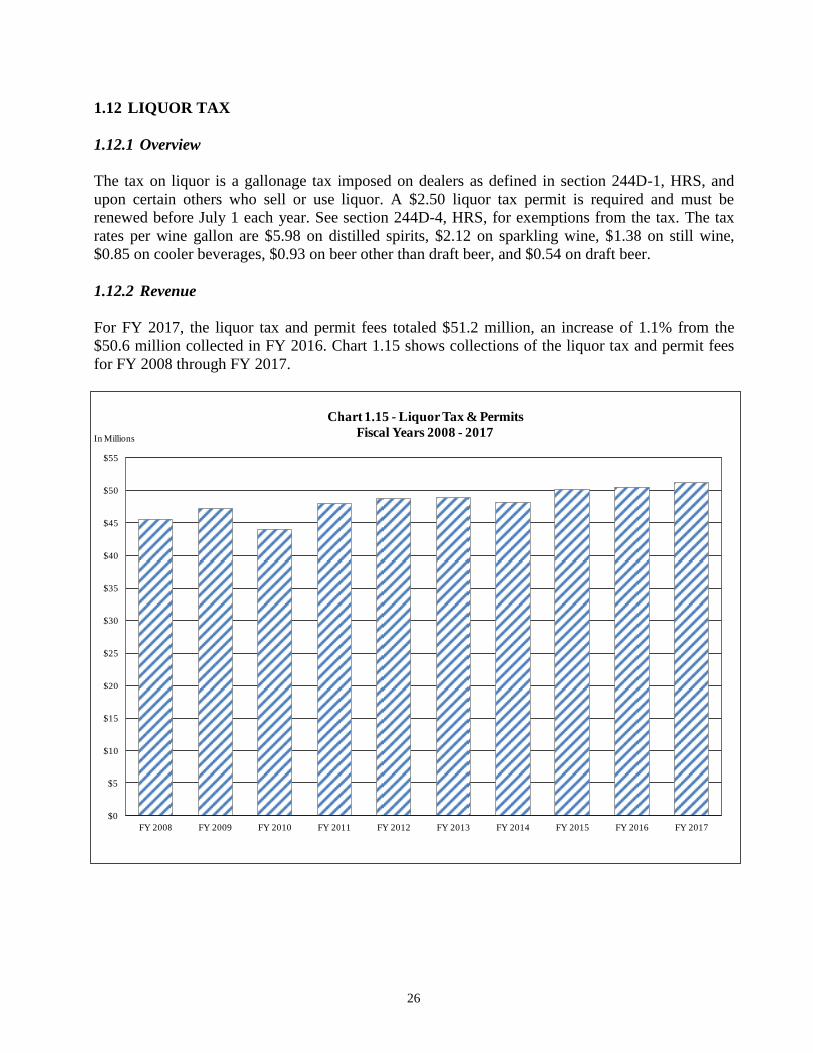
1.12.2 Revenue
For FY 2017, the liquor tax and permit fees totaled $51.2 million, an increase of 1.1% from the
$50.6 million collected in FY 2016. Chart 1.15 shows collections of the liquor tax and permit fees
for FY 2008 through FY 2017.
$0
$5
$10
$15
$20
$25
$30
$35
$40
$45
$50
$55
FY 2008 FY 2009 FY 2010 FY 2011 FY 2012 FY 2013 FY 2014 FY 2015 FY 2016 FY 2017
In Millions
Chart 1.15 - Liquor Tax & Permits
Fiscal Years 2008 - 2017
27
1.13 CONVEYANCE TAX
1.13.1 Overview
The conveyance tax is imposed on all documents transferring ownership or interest in real property
and is based on the actual and full consideration paid or to be paid. For a sale of a condominium or
single family residence, the rate of the conveyance tax depends on whether the purchaser is eligible
for a county homeowners' exemption from the real property tax. If the purchaser is eligible for the
exemption, or if the sale is of real property other than a condominium or single family residence,
then the tax rate ranges from 10 cents per $100 for properties with a value of less than $600,000 to
$1 per $100 for properties with a value of $10,000,000 or more. If the purchaser is ineligible for the
exemption, the tax rate for a sale of a condominium or single family residence ranges from 15 cents
per $100 for properties with a value of less than $600,000 to $1.25 per $100 for properties with a
value of $10,000,000 or more. The conveyance tax is administered by the Department of Taxation,
but it is collected by the Bureau of Conveyances in the Department of Land and Natural Resources.
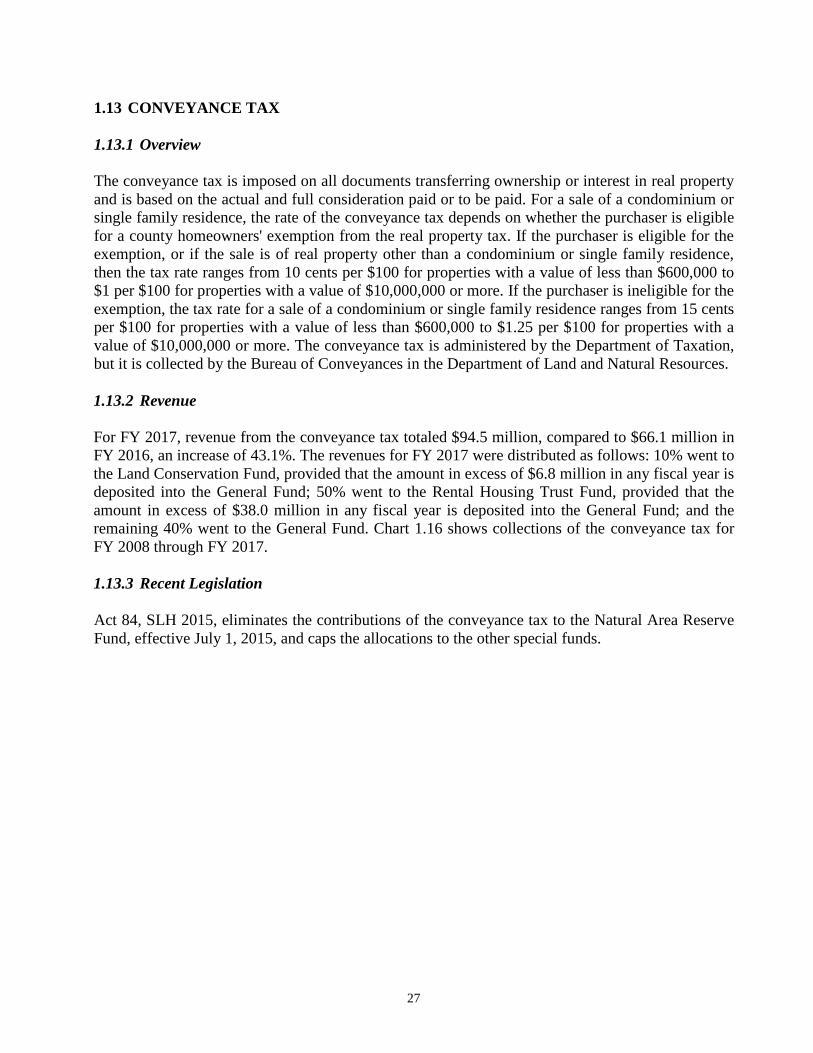
1.13.2 Revenue
For FY 2017, revenue from the conveyance tax totaled $94.5 million, compared to $66.1 million in
FY 2016, an increase of 43.1%. The revenues for FY 2017 were distributed as follows: 10% went to
the Land Conservation Fund, provided that the amount in excess of $6.8 million in any fiscal year is
deposited into the General Fund; 50% went to the Rental Housing Trust Fund, provided that the
amount in excess of $38.0 million in any fiscal year is deposited into the General Fund; and the
remaining 40% went to the General Fund. Chart 1.16 shows collections of the conveyance tax for
FY 2008 through FY 2017.
1.13.3 Recent Legislation
Act 84, SLH 2015, eliminates the contributions of the conveyance tax to the Natural Area Reserve
Fund, effective July 1, 2015, and caps the allocations to the other special funds.
28
1.14 TAX ON BANKS AND OTHER FINANCIAL CORPORATIONS
1.14.1 Overview
The tax on banks and other financial corporations (the franchise tax) is levied on net income of
banks, building and loan associations, development companies, financial corporations, financial
services loan companies, trust companies, mortgage loan companies, financial holding companies,
small business investment companies, and subsidiaries not subject to the tax imposed by chapter
235, HRS. The tax is in lieu of the net income tax imposed under chapter 235, HRS, and of the
GET, but it uses the definition of net income from chapter 235, with modifications. The tax is
levied on net income at the rate of 7.92%. The assessment date is January 1 of each year.
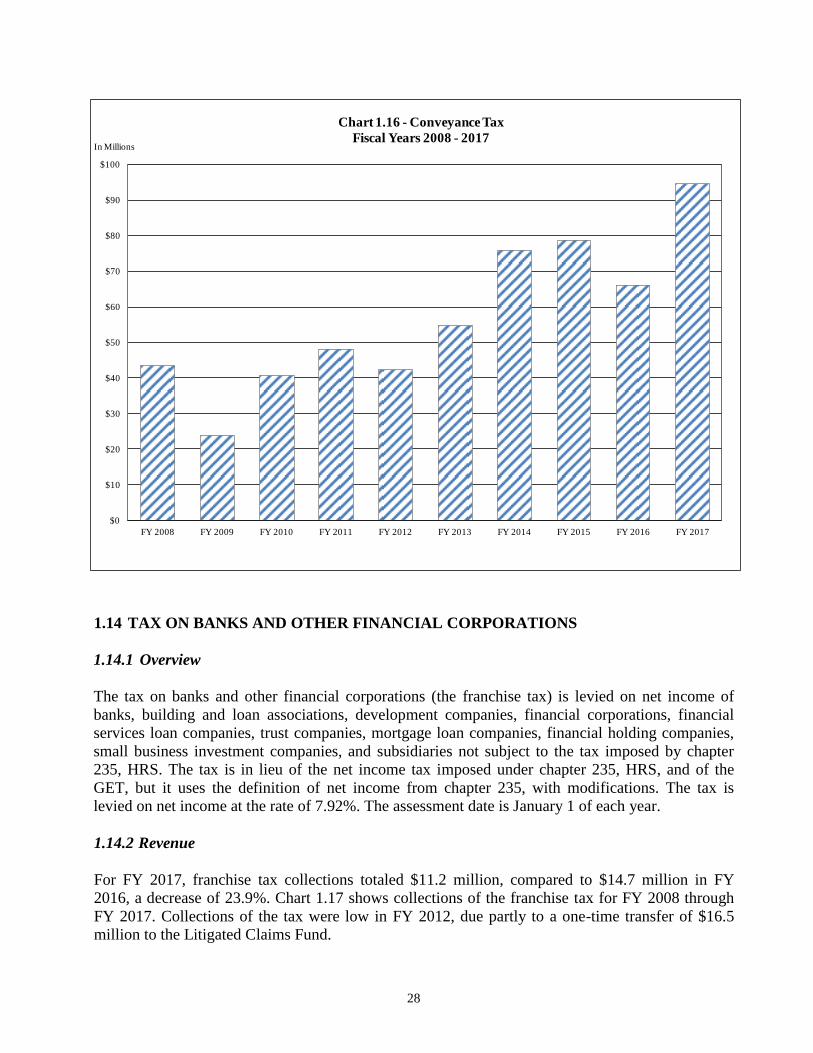
1.14.2 Revenue
For FY 2017, franchise tax collections totaled $11.2 million, compared to $14.7 million in FY
2016, a decrease of 23.9%. Chart 1.17 shows collections of the franchise tax for FY 2008 through
FY 2017. Collections of the tax were low in FY 2012, due partly to a one-time transfer of $16.5
million to the Litigated Claims Fund.
$0
$10
$20
$30
$40
$50
$60
$70
$80
$90
$100
FY 2008 FY 2009 FY 2010 FY 2011 FY 2012 FY 2013 FY 2014 FY 2015 FY 2016 FY 2017
In Millions
Chart 1.16 - Conveyance Tax
Fiscal Years 2008 - 2017
29
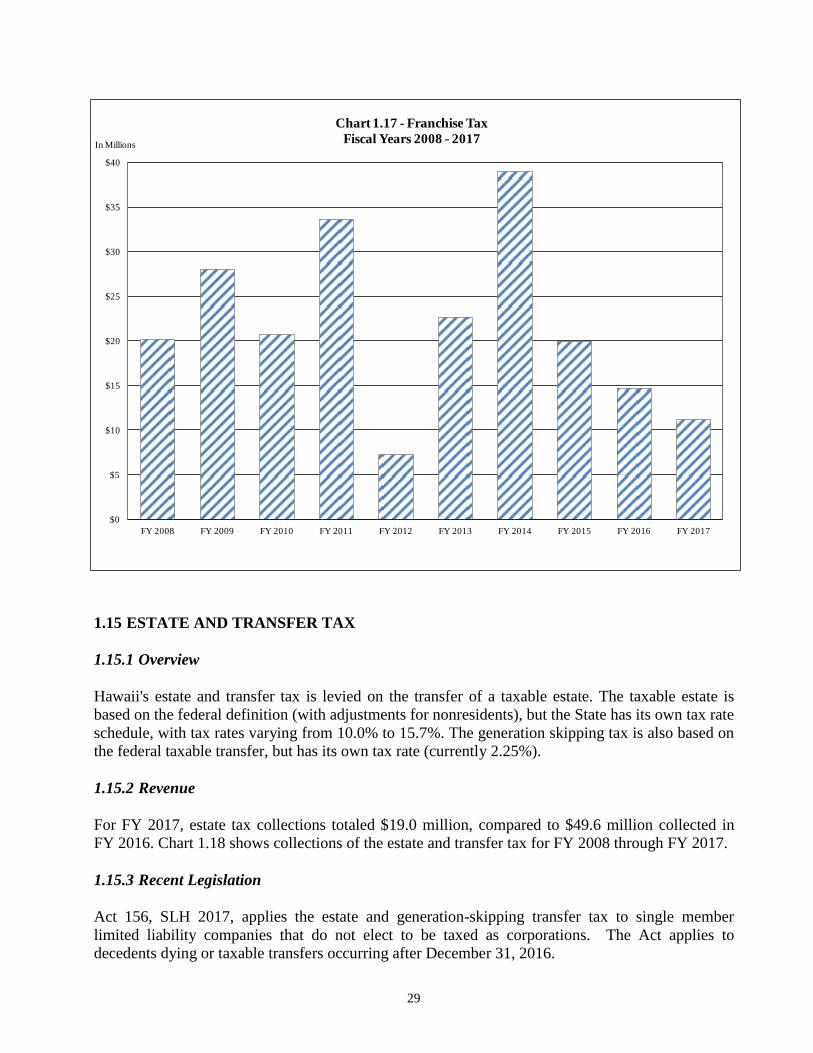
1.15 ESTATE AND TRANSFER TAX
1.15.1 Overview
Hawaii's estate and transfer tax is levied on the transfer of a taxable estate. The taxable estate is
based on the federal definition (with adjustments for nonresidents), but the State has its own tax rate
schedule, with tax rates varying from 10.0% to 15.7%. The generation skipping tax is also based on
the federal taxable transfer, but has its own tax rate (currently 2.25%).
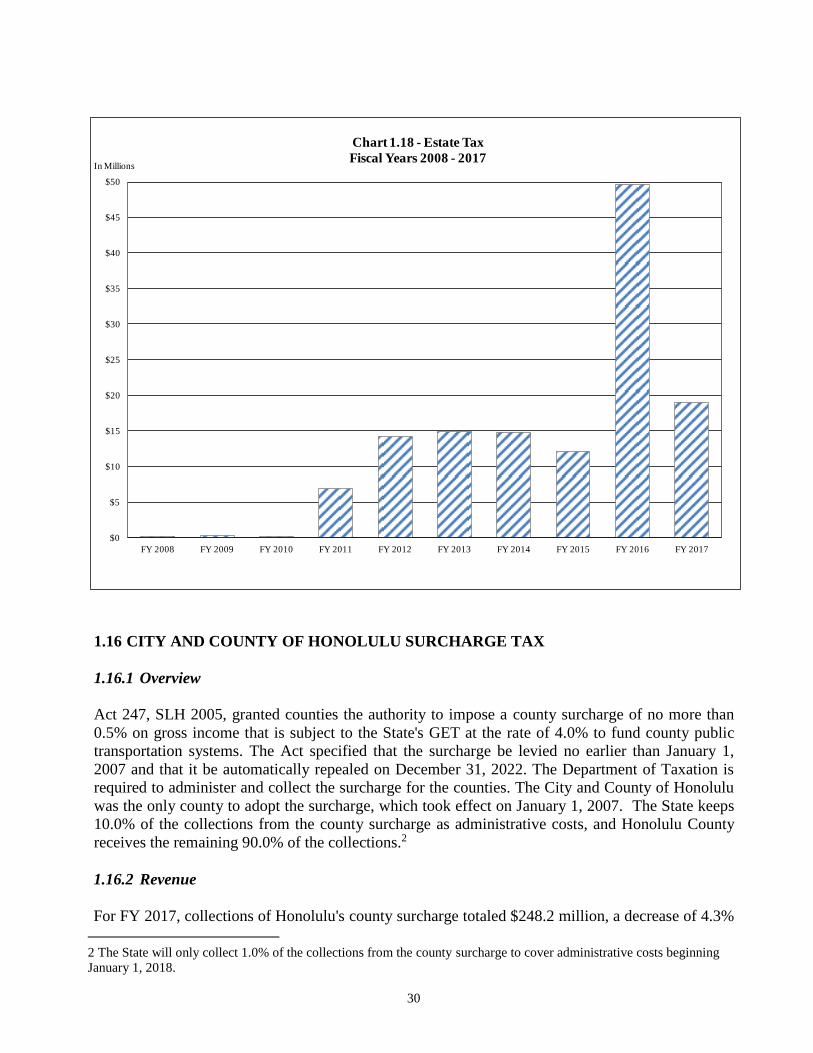
1.15.2 Revenue
For FY 2017, estate tax collections totaled $19.0 million, compared to $49.6 million collected in
FY 2016. Chart 1.18 shows collections of the estate and transfer tax for FY 2008 through FY 2017.
1.15.3 Recent Legislation
Act 156, SLH 2017, applies the estate and generation-skipping transfer tax to single member
limited liability companies that do not elect to be taxed as corporations. The Act applies to
decedents dying or taxable transfers occurring after December 31, 2016.
$0
$5
$10
$15
$20
$25
$30
$35
$40
FY 2008 FY 2009 FY 2010 FY 2011 FY 2012 FY 2013 FY 2014 FY 2015 FY 2016 FY 2017
In Millions
Chart 1.17 - Franchise Tax
Fiscal Years 2008 - 2017
30
1.16 CITY AND COUNTY OF HONOLULU SURCHARGE TAX
1.16.1 Overview
Act 247, SLH 2005, granted counties the authority to impose a county surcharge of no more than
0.5% on gross income that is subject to the State's GET at the rate of 4.0% to fund county public
transportation systems. The Act specified that the surcharge be levied no earlier than January 1,
2007 and that it be automatically repealed on December 31, 2022. The Department of Taxation is
required to administer and collect the surcharge for the counties. The City and County of Honolulu
was the only county to adopt the surcharge, which took effect on January 1, 2007. The State keeps
10.0% of the collections from the county surcharge as administrative costs, and Honolulu County
receives the remaining 90.0% of the collections.2
1.16.2 Revenue
For FY 2017, collections of Honolulu's county surcharge totaled $248.2 million, a decrease of 4.3%
2 The State will only collect 1.0% of the collections from the county surcharge to cover administrative costs beginning
January 1, 2018.
$0
$5
$10
$15
$20
$25
$30
$35
$40
$45
$50
FY 2008 FY 2009 FY 2010 FY 2011 FY 2012 FY 2013 FY 2014 FY 2015 FY 2016 FY 2017
In Millions
Chart 1.18 - Estate Tax
Fiscal Years 2008 - 2017
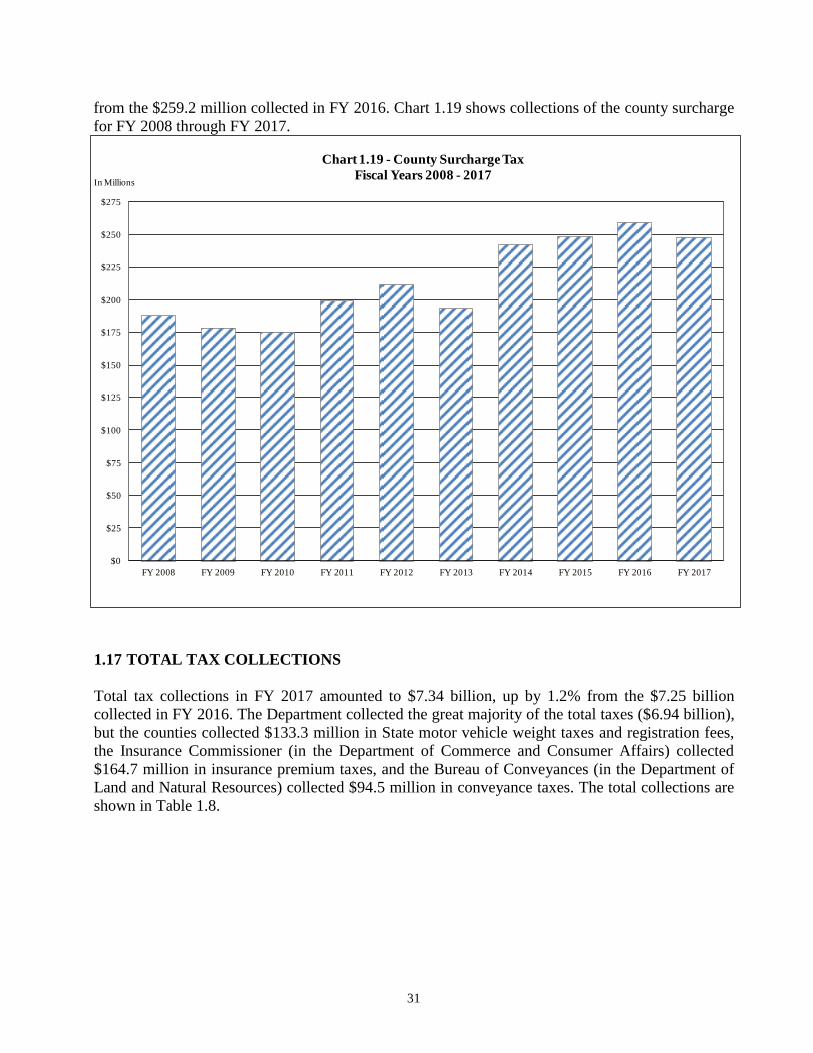
31
from the $259.2 million collected in FY 2016. Chart 1.19 shows collections of the county surcharge
for FY 2008 through FY 2017.
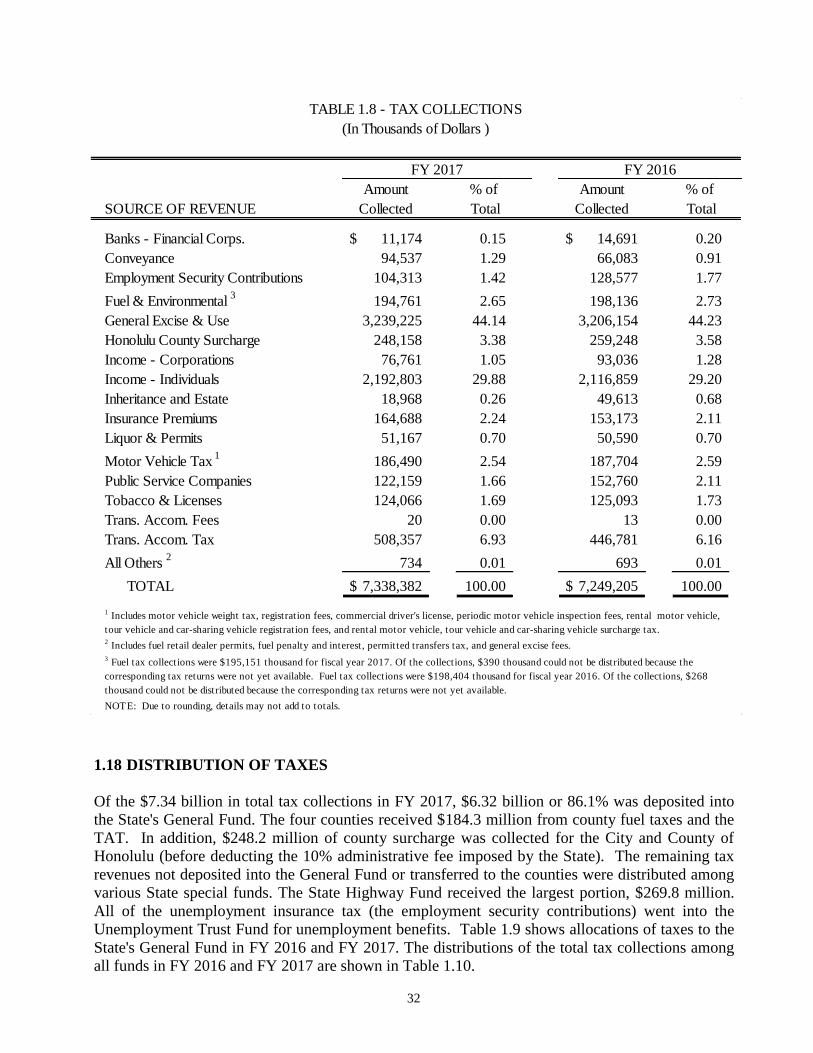
1.17 TOTAL TAX COLLECTIONS
Total tax collections in FY 2017 amounted to $7.34 billion, up by 1.2% from the $7.25 billion
collected in FY 2016. The Department collected the great majority of the total taxes ($6.94 billion),
but the counties collected $133.3 million in State motor vehicle weight taxes and registration fees,
the Insurance Commissioner (in the Department of Commerce and Consumer Affairs) collected
$164.7 million in insurance premium taxes, and the Bureau of Conveyances (in the Department of
Land and Natural Resources) collected $94.5 million in conveyance taxes. The total collections are
shown in Table 1.8.
$0
$25
$50
$75
$100
$125
$150
$175
$200
$225
$250
$275
FY 2008 FY 2009 FY 2010 FY 2011 FY 2012 FY 2013 FY 2014 FY 2015 FY 2016 FY 2017
In Millions
Chart 1.19 - County Surcharge Tax
Fiscal Years 2008 - 2017
32
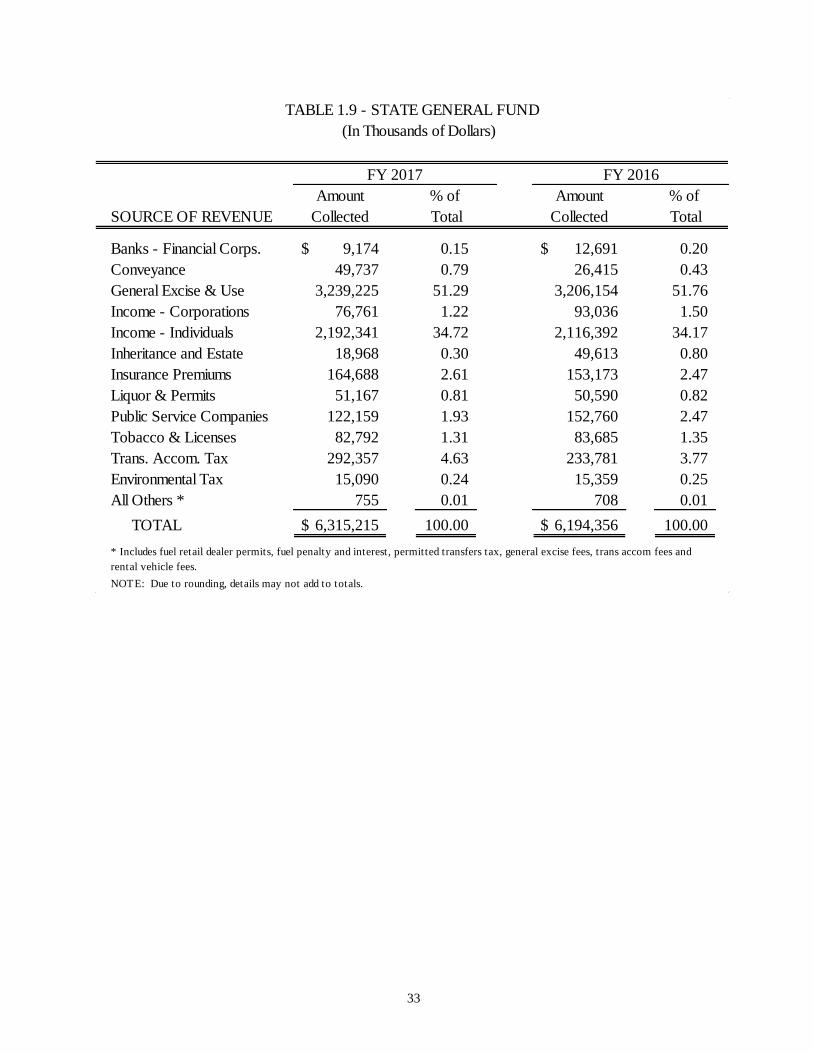
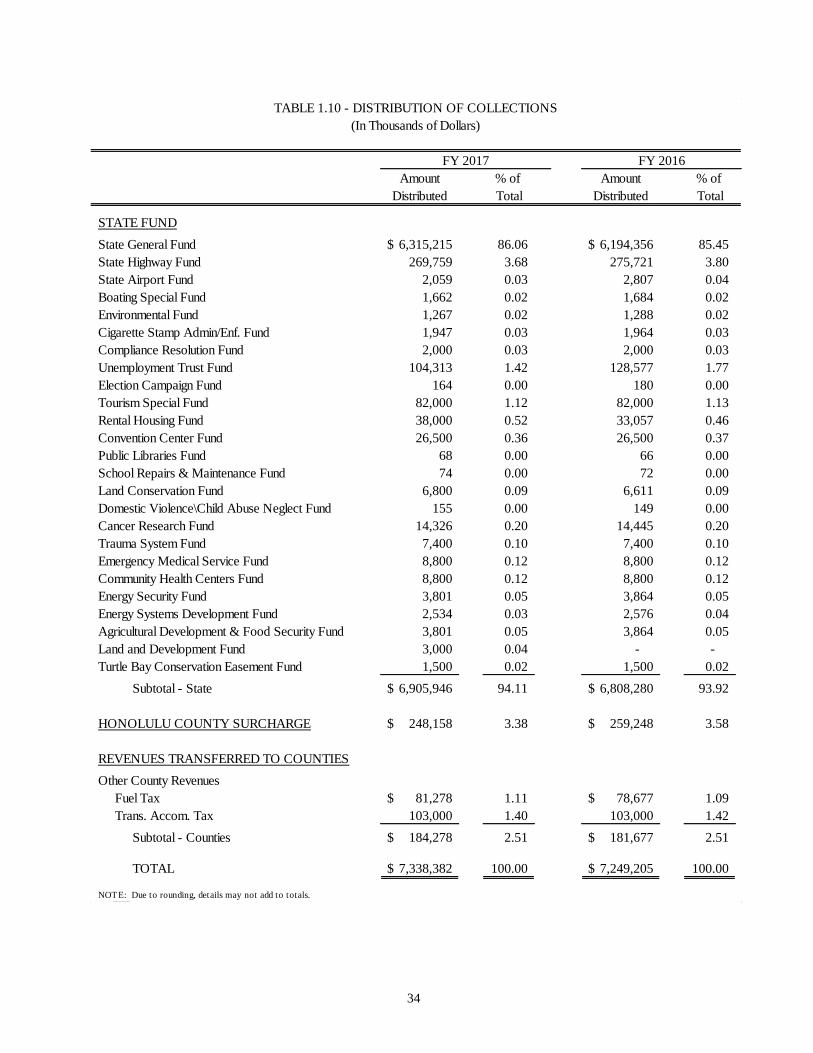
1.18 DISTRIBUTION OF TAXES
Of the $7.34 billion in total tax collections in FY 2017, $6.32 billion or 86.1% was deposited into
the State's General Fund. The four counties received $184.3 million from county fuel taxes and the
TAT. In addition, $248.2 million of county surcharge was collected for the City and County of
Honolulu (before deducting the 10% administrative fee imposed by the State). The remaining tax
revenues not deposited into the General Fund or transferred to the counties were distributed among
various State special funds. The State Highway Fund received the largest portion, $269.8 million.
All of the unemployment insurance tax (the employment security contributions) went into the
Unemployment Trust Fund for unemployment benefits. Table 1.9 shows allocations of taxes to the
State's General Fund in FY 2016 and FY 2017. The distributions of the total tax collections among
all funds in FY 2016 and FY 2017 are shown in Table 1.10.
Amount % of Amount % of
SOURCE OF REVENUE Collected Total Collected Total
Banks - Financial Corps. 11,174$ 0.15 14,691$ 0.20
Conveyance 94,537 1.29 66,083 0.91
Employment Security Contributions 104,313 1.42 128,577 1.77
Fuel & Environmental 3
194,761 2.65 198,136 2.73
General Excise & Use 3,239,225 44.14 3,206,154 44.23
Honolulu County Surcharge 248,158 3.38 259,248 3.58
Income - Corporations 76,761 1.05 93,036 1.28
Income - Individuals 2,192,803 29.88 2,116,859 29.20
Inheritance and Estate 18,968 0.26 49,613 0.68
Insurance Premiums 164,688 2.24 153,173 2.11
Liquor & Permits 51,167 0.70 50,590 0.70
Motor Vehicle Tax 1
186,490 2.54 187,704 2.59
Public Service Companies 122,159 1.66 152,760 2.11
Tobacco & Licenses 124,066 1.69 125,093 1.73
Trans. Accom. Fees 20 0.00 13 0.00
Trans. Accom. Tax 508,357 6.93 446,781 6.16
All Others 2
734 0.01 693 0.01
TOTAL 7,338,382$ 100.00 7,249,205$ 100.00
NOTE: Due to rounding, details may not add to totals.
TABLE 1.8 - TAX COLLECTIONS
(In Thousands of Dollars )
3 Fuel tax collections were $195,151 thousand for fiscal year 2017. Of the collections, $390 thousand could not be distributed because the
corresponding tax returns were not yet available. Fuel tax collections were $198,404 thousand for fiscal year 2016. Of the collections, $268
thousand could not be distributed because the corresponding tax returns were not yet available.
2 Includes fuel retail dealer permits, fuel penalty and interest, permitted transfers tax, and general excise fees.
FY 2017 FY 2016
1 Includes motor vehicle weight tax, registration fees, commercial driver's license, periodic motor vehicle inspection fees, rental motor vehicle,
tour vehicle and car-sharing vehicle registration fees, and rental motor vehicle, tour vehicle and car-sharing vehicle surcharge tax.
33
Amount % of Amount % of
SOURCE OF REVENUE Collected Total Collected Total
Banks - Financial Corps. 9,174$ 0.15 12,691$ 0.20
Conveyance 49,737 0.79 26,415 0.43
General Excise & Use 3,239,225 51.29 3,206,154 51.76
Income - Corporations 76,761 1.22 93,036 1.50
Income - Individuals 2,192,341 34.72 2,116,392 34.17
Inheritance and Estate 18,968 0.30 49,613 0.80
Insurance Premiums 164,688 2.61 153,173 2.47
Liquor & Permits 51,167 0.81 50,590 0.82
Public Service Companies 122,159 1.93 152,760 2.47
Tobacco & Licenses 82,792 1.31 83,685 1.35
Trans. Accom. Tax 292,357 4.63 233,781 3.77
Environmental Tax 15,090 0.24 15,359 0.25
All Others * 755 0.01 708 0.01
TOTAL 6,315,215$ 100.00 6,194,356$ 100.00
NOTE: Due to rounding, details may not add to totals.
* Includes fuel retail dealer permits, fuel penalty and interest, permitted transfers tax, general excise fees, trans accom fees and
rental vehicle fees.
TABLE 1.9 - STATE GENERAL FUND
(In Thousands of Dollars)
FY 2017 FY 2016
34
Amount % of Amount % of
Distributed Total Distributed Total
STATE FUND
State General Fund 6,315,215$ 86.06 6,194,356$ 85.45
State Highway Fund 269,759 3.68 275,721 3.80
State Airport Fund 2,059 0.03 2,807 0.04
Boating Special Fund 1,662 0.02 1,684 0.02
Environmental Fund 1,267 0.02 1,288 0.02
Cigarette Stamp Admin/Enf. Fund 1,947 0.03 1,964 0.03
Compliance Resolution Fund 2,000 0.03 2,000 0.03
Unemployment Trust Fund 104,313 1.42 128,577 1.77
Election Campaign Fund 164 0.00 180 0.00
Tourism Special Fund 82,000 1.12 82,000 1.13
Rental Housing Fund 38,000 0.52 33,057 0.46
Convention Center Fund 26,500 0.36 26,500 0.37
Public Libraries Fund 68 0.00 66 0.00
School Repairs & Maintenance Fund 74 0.00 72 0.00
Land Conservation Fund 6,800 0.09 6,611 0.09
Domestic Violence\Child Abuse Neglect Fund 155 0.00 149 0.00
Cancer Research Fund 14,326 0.20 14,445 0.20
Trauma System Fund 7,400 0.10 7,400 0.10
Emergency Medical Service Fund 8,800 0.12 8,800 0.12
Community Health Centers Fund 8,800 0.12 8,800 0.12
Energy Security Fund 3,801 0.05 3,864 0.05
Energy Systems Development Fund 2,534 0.03 2,576 0.04
Agricultural Development & Food Security Fund 3,801 0.05 3,864 0.05
Land and Development Fund 3,000 0.04 - -
Turtle Bay Conservation Easement Fund 1,500 0.02 1,500 0.02
Subtotal - State 6,905,946$ 94.11 6,808,280$ 93.92
HONOLULU COUNTY SURCHARGE 248,158$ 3.38 259,248$ 3.58
REVENUES TRANSFERRED TO COUNTIES
Other County Revenues
Fuel Tax 81,278$ 1.11 78,677$ 1.09
Trans. Accom. Tax 103,000 1.40 103,000 1.42
Subtotal - Counties 184,278$ 2.51 181,677$ 2.51
TOTAL 7,338,382$ 100.00 7,249,205$ 100.00
NOTE: Due to rounding, details may not add to totals.
TABLE 1.10 - DISTRIBUTION OF COLLECTIONS
(In Thousands of Dollars)
FY 2017 FY 2016
35
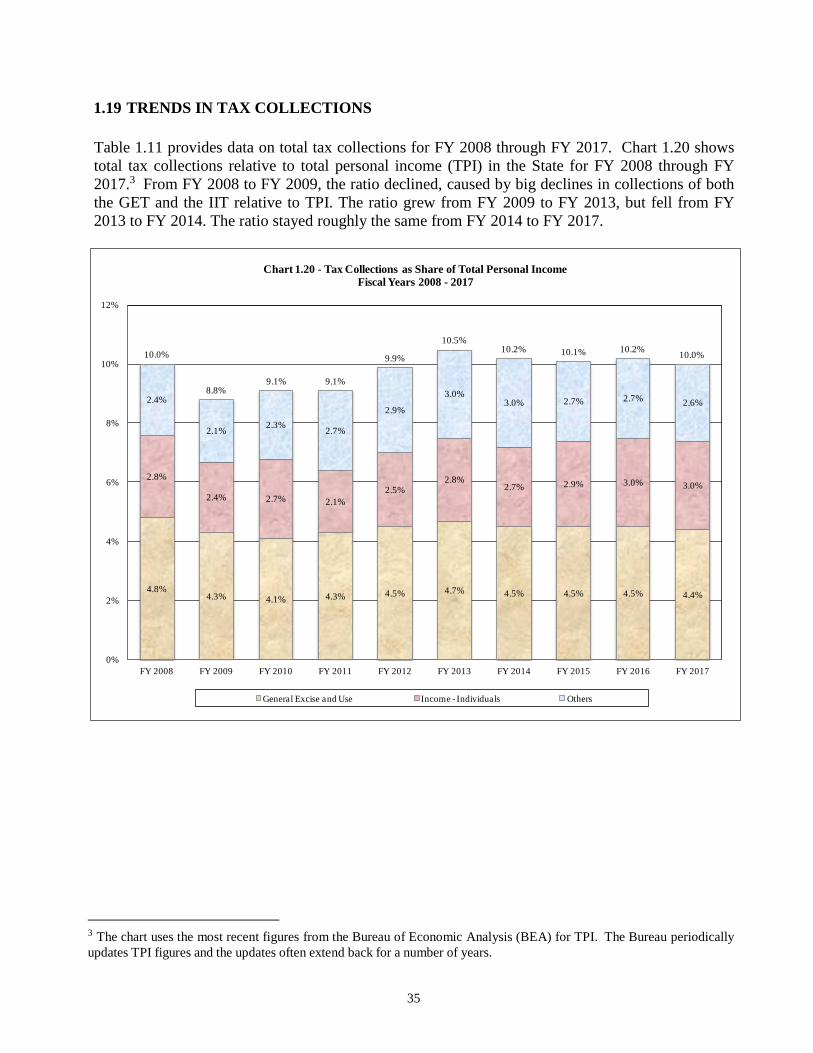
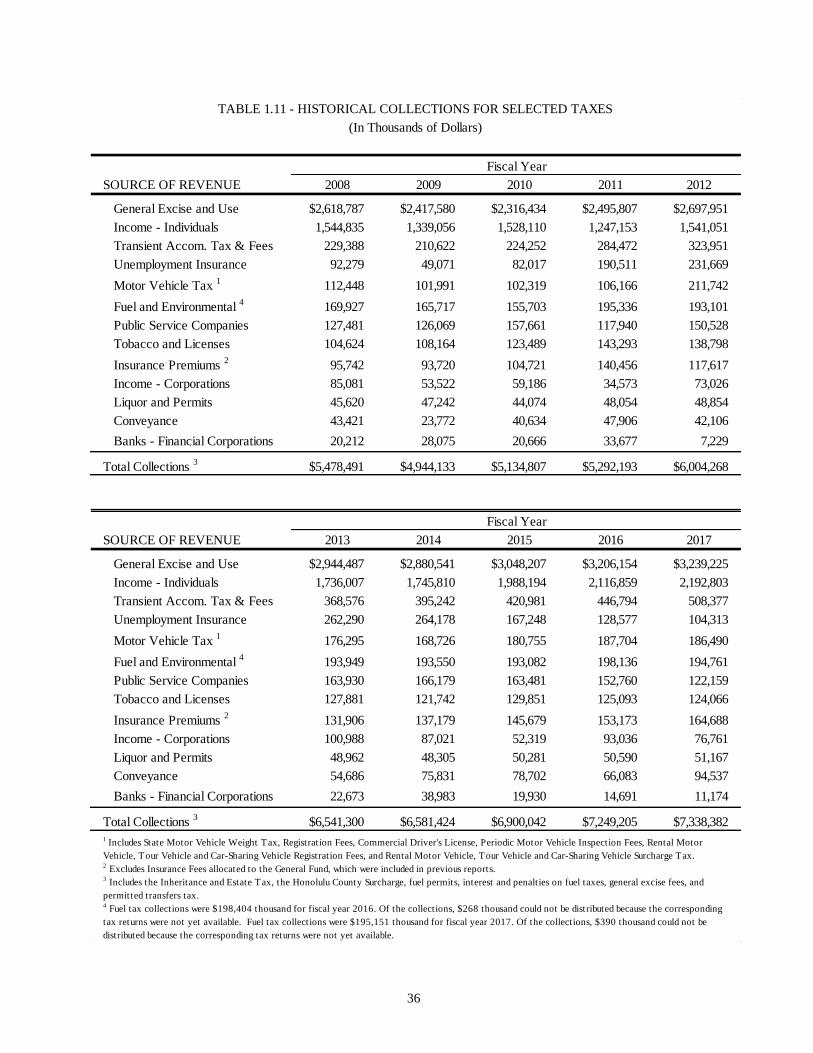
1.19 TRENDS IN TAX COLLECTIONS
Table 1.11 provides data on total tax collections for FY 2008 through FY 2017. Chart 1.20 shows
total tax collections relative to total personal income (TPI) in the State for FY 2008 through FY
2017.3 From FY 2008 to FY 2009, the ratio declined, caused by big declines in collections of both
the GET and the IIT relative to TPI. The ratio grew from FY 2009 to FY 2013, but fell from FY
2013 to FY 2014. The ratio stayed roughly the same from FY 2014 to FY 2017.
3 The chart uses the most recent figures from the Bureau of Economic Analysis (BEA) for TPI. The Bureau periodically
updates TPI figures and the updates often extend back for a number of years.
4.8%4.3% 4.1% 4.3% 4.5% 4.7% 4.5% 4.5% 4.5% 4.4%
2.8%
2.4% 2.7% 2.1%
2.5%2.8%
2.7% 2.9% 3.0% 3.0%
2.4%
2.1%2.3%
2.7%
2.9%
3.0%3.0% 2.7% 2.7%
2.6%
0%
2%
4%
6%
8%
10%
12%
FY 2008 FY 2009 FY 2010 FY 2011 FY 2012 FY 2013 FY 2014 FY 2015 FY 2016 FY 2017
Chart 1.20 - Tax Collections as Share of Total Personal Income
Fiscal Years 2008 - 2017
General Excise and Use Income - Individuals Others
10.2%10.0%
10.2%10.0%
8.8%9.1% 9.1%
9.9%
10.5%
10.1%
36
SOURCE OF REVENUE
General Excise and Use $2,618,787 $2,417,580 $2,316,434 $2,495,807 $2,697,951
Income - Individuals 1,544,835 1,339,056 1,528,110 1,247,153 1,541,051
Transient Accom. Tax & Fees 229,388 210,622 224,252 284,472 323,951
Unemployment Insurance 92,279 49,071 82,017 190,511 231,669
Motor Vehicle Tax 1
112,448 101,991 102,319 106,166 211,742
Fuel and Environmental 4
169,927 165,717 155,703 195,336 193,101
Public Service Companies 127,481 126,069 157,661 117,940 150,528
Tobacco and Licenses 104,624 108,164 123,489 143,293 138,798
Insurance Premiums 2
95,742 93,720 104,721 140,456 117,617
Income - Corporations 85,081 53,522 59,186 34,573 73,026
Liquor and Permits 45,620 47,242 44,074 48,054 48,854
Conveyance 43,421 23,772 40,634 47,906 42,106
Banks - Financial Corporations 20,212 28,075 20,666 33,677 7,229
Total Collections 3
$5,478,491 $4,944,133 $5,134,807 $5,292,193 $6,004,268
SOURCE OF REVENUE
General Excise and Use $2,944,487 $2,880,541 $3,048,207 $3,206,154 $3,239,225
Income - Individuals 1,736,007 1,745,810 1,988,194 2,116,859 2,192,803
Transient Accom. Tax & Fees 368,576 395,242 420,981 446,794 508,377
Unemployment Insurance 262,290 264,178 167,248 128,577 104,313
Motor Vehicle Tax 1
176,295 168,726 180,755 187,704 186,490
Fuel and Environmental 4
193,949 193,550 193,082 198,136 194,761
Public Service Companies 163,930 166,179 163,481 152,760 122,159
Tobacco and Licenses 127,881 121,742 129,851 125,093 124,066
Insurance Premiums 2
131,906 137,179 145,679 153,173 164,688
Income - Corporations 100,988 87,021 52,319 93,036 76,761
Liquor and Permits 48,962 48,305 50,281 50,590 51,167
Conveyance 54,686 75,831 78,702 66,083 94,537
Banks - Financial Corporations 22,673 38,983 19,930 14,691 11,174
Total Collections 3
$6,541,300 $6,581,424 $6,900,042 $7,249,205 $7,338,382
TABLE 1.11 - HISTORICAL COLLECTIONS FOR SELECTED TAXES
(In Thousands of Dollars)
1 Includes State Motor Vehicle Weight Tax, Registration Fees, Commercial Driver's License, Periodic Motor Vehicle Inspection Fees, Rental Motor
Vehicle, Tour Vehicle and Car-Sharing Vehicle Registration Fees, and Rental Motor Vehicle, Tour Vehicle and Car-Sharing Vehicle Surcharge Tax.2 Excludes Insurance Fees allocated to the General Fund, which were included in previous reports.
3 Includes the Inheritance and Estate Tax, the Honolulu County Surcharge, fuel permits, interest and penalties on fuel taxes, general excise fees, and
permitted transfers tax.4 Fuel tax collections were $198,404 thousand for fiscal year 2016. Of the collections, $268 thousand could not be distributed because the corresponding
tax returns were not yet available. Fuel tax collections were $195,151 thousand for fiscal year 2017. Of the collections, $390 thousand could not be
distributed because the corresponding tax returns were not yet available.
2011 2012
2013 2014 2015 2016 2017
2008
Fiscal Year
Fiscal Year
2009 2010
37
2.0 TAX ADMINISTRATION
2.1 OVERALL PERFORMANCE
The Department of Taxation consists of two divisions, s i x staff offices, a P ublic Information
Officer, and a Taxpayer Advocate. The two divisions are the Tax Services and Processing Division
and the Compliance Division. The six staff offices are the Administrative Services Office, the Rules
Office, the Tax Research and Planning Office, the Information Technology Services Office, the
Administrative Appeals Office and the Tax Practitioner Priority Office.
The total number of authorized permanent positions in the Department increased from 384
positions in FY 2016 to 388 positions in FY 2017. The Department's operating budget is a small
fraction of total tax revenue. In FY 2017, the Department's operating expenses were $24.3 million,
down from $25.5 million in FY 2009. The Department collected $6.94 billion in taxes in FY 2017,
so the cost of collecting each $100 dollars of taxes was about 35 cents.
The Department has continued to encourage taxpayers to use electronic transmissions rather than
paper returns. Although there has been a significant increase in electronic filing of tax returns and
payments, over 1 million paper checks and over 2 million paper tax returns and other documents
were manually processed by the Department in FY 2017.
The total number of audit cases completed by the Compliance Division (the Office Audit Branch
and Field Audit Branch combined) increased by 5.1%, from 17,065 in FY 2016 to 17,936
in FY 2017. Total assessments, however, declined by 27.0%, from $200.6 million in FY 2016 to
$146.4 million in FY 2017.
2.2 TAX SERVICES AND PROCESSING DIVISION
2.2.1 Overview
The Tax Services and Processing Division (TSP) is comprised of three branches: Taxpayer
Services, Document Processing and Revenue Accounting. Aside from providing various services to
both individual and business taxpayers, the Taxpayer Services Branch (TPS) performs functions
relating to licensing and taxpayer account management. The Document Processing Branch (DP)
manages the receiving, editing and centralized processing of tax information and processes
payments received from both paper and electronic filings, and is further responsible for securing
and depositing tax payments. The Revenue Accounting Branch (RA) maintains revenue control
and reconciliation functions for all State tax revenues. RA is also responsible for the preparation of
various revenue related reports, such as the monthly Preliminary Report (on revenues collected) and
the Statement of Tax Operations (STO).
Based on DOTAX's Strategic Plan, the TSP Division continues to support initiatives that improve
efficiency, effectiveness, and accountability. In FY 2017, the second rollout of the Tax System
Modernization Project (TSM) was implemented to include processing of general excise tax,
transient accommodations tax, use tax, rental motor vehicle and tour vehicle surcharge and county
surcharge. This phase covers over 40% of State revenue collections. Additionally, Hawaii Tax
Online (HTO), the department's web portal for payments and filing of tax returns, was launched. In
38
the first eleven months since the launch of HTO, more than 45% of the general excise and transient
accommodations tax payers registered and used this web portal.
Key individuals from TSP continue to participate in the entire process of testing and
implementation of the TSM. The third rollout, which occurred in August 2017, included processing
of corporate, withholding, franchise, use and public service company tax types.
The Division's strategic plan for upcoming years continues to include the ongoing promotion of
electronic filing and electronic payment transactions. These options make processing more efficient
while minimizing reliance on staffing resources, particularly during peak filing periods. Electronic
data further ensures accuracy and allows flexibility in reporting. With TSM underway, the Division
looks forward to utilizing new technology and transforming business processes in order to shift
focus toward higher levels of customer service to the taxpayer and precision in reporting, which
helps fulfill our fundamental goals of increasing voluntary compliance and modernizing processing.
The Division has begun organizational change management to bring forth an efficient and
productive operation.
2.2.2 Taxpayer Services Branch
The Taxpayer Services (TPS) Branch is made up of three main sections:
(1) Customer Inquiry – provides information and taxpayer assistance pertaining to all taxes
administered by the Department
(2) Account Management – performs computer-based error correction activities to allow
expedient processing, posting and updating of tax returns and payments, and
(3) Licensing – processes, issues and updates all licenses and permits issued by the Department
Customer Inquiry
The Division has continued to recruit and train appropriate candidates for vacant positions in
Taxpayer Services during FY 2017. Below are statistics for the incoming calls to this Division. It
is noted for FY2017 a large spike in calls, mostly due to the conversion of taxpayer identification
numbers for the Rollout 2 tax types as well as taxpayers needing assistance with the new look and
feel of Hawaii Tax Online. The greatest increase in calls occurred between January and March.
39
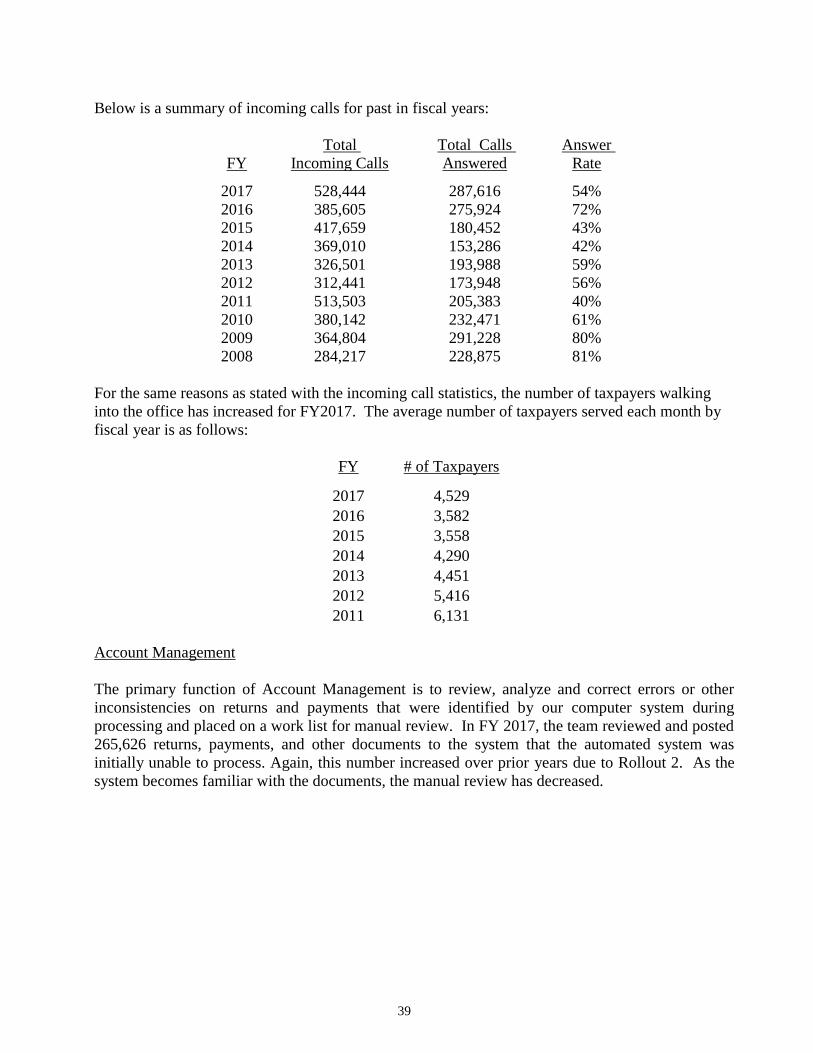
Below is a summary of incoming calls for past in fiscal years:
FY
Total
Incoming Calls
Total Calls
Answered
Answer
Rate
2017 528,444 287,616 54%
2016 385,605 275,924 72%
2015 417,659 180,452 43%
2014 369,010 153,286 42%
2013 326,501 193,988 59%
2012 312,441 173,948 56%
2011 513,503 205,383 40%
2010 380,142 232,471 61%
2009 364,804 291,228 80%
2008 284,217 228,875 81%
For the same reasons as stated with the incoming call statistics, the number of taxpayers walking
into the office has increased for FY2017. The average number of taxpayers served each month by
fiscal year is as follows:
FY # of Taxpayers
2017 4,529
2016 3,582
2015 3,558
2014 4,290
2013 4,451
2012 5,416
2011 6,131
Account Management
The primary function of Account Management is to review, analyze and correct errors or other
inconsistencies on returns and payments that were identified by our computer system during
processing and placed on a work list for manual review. In FY 2017, the team reviewed and posted
265,626 returns, payments, and other documents to the system that the automated system was
initially unable to process. Again, this number increased over prior years due to Rollout 2. As the
system becomes familiar with the documents, the manual review has decreased.
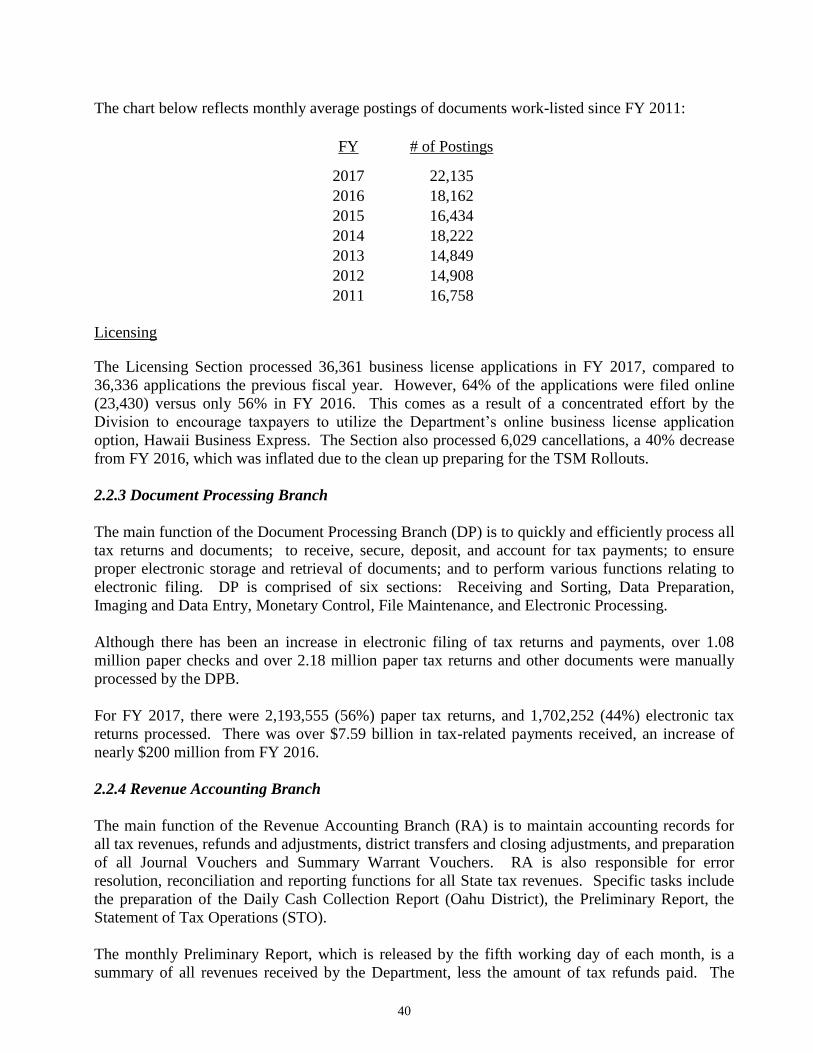
40
The chart below reflects monthly average postings of documents work-listed since FY 2011:
FY # of Postings
2017 22,135
2016 18,162
2015 16,434
2014 18,222
2013 14,849
2012 14,908
2011 16,758
Licensing
The Licensing Section processed 36,361 business license applications in FY 2017, compared to
36,336 applications the previous fiscal year. However, 64% of the applications were filed online
(23,430) versus only 56% in FY 2016. This comes as a result of a concentrated effort by the
Division to encourage taxpayers to utilize the Department’s online business license application
option, Hawaii Business Express. The Section also processed 6,029 cancellations, a 40% decrease
from FY 2016, which was inflated due to the clean up preparing for the TSM Rollouts.
2.2.3 Document Processing Branch
The main function of the Document Processing Branch (DP) is to quickly and efficiently process all
tax returns and documents; to receive, secure, deposit, and account for tax payments; to ensure
proper electronic storage and retrieval of documents; and to perform various functions relating to
electronic filing. DP is comprised of six sections: Receiving and Sorting, Data Preparation,
Imaging and Data Entry, Monetary Control, File Maintenance, and Electronic Processing.
Although there has been an increase in electronic filing of tax returns and payments, over 1.08
million paper checks and over 2.18 million paper tax returns and other documents were manually
processed by the DPB.
For FY 2017, there were 2,193,555 (56%) paper tax returns, and 1,702,252 (44%) electronic tax
returns processed. There was over $7.59 billion in tax-related payments received, an increase of
nearly $200 million from FY 2016.
2.2.4 Revenue Accounting Branch
The main function of the Revenue Accounting Branch (RA) is to maintain accounting records for
all tax revenues, refunds and adjustments, district transfers and closing adjustments, and preparation
of all Journal Vouchers and Summary Warrant Vouchers. RA is also responsible for error
resolution, reconciliation and reporting functions for all State tax revenues. Specific tasks include
the preparation of the Daily Cash Collection Report (Oahu District), the Preliminary Report, the
Statement of Tax Operations (STO).
The monthly Preliminary Report, which is released by the fifth working day of each month, is a
summary of all revenues received by the Department, less the amount of tax refunds paid. The
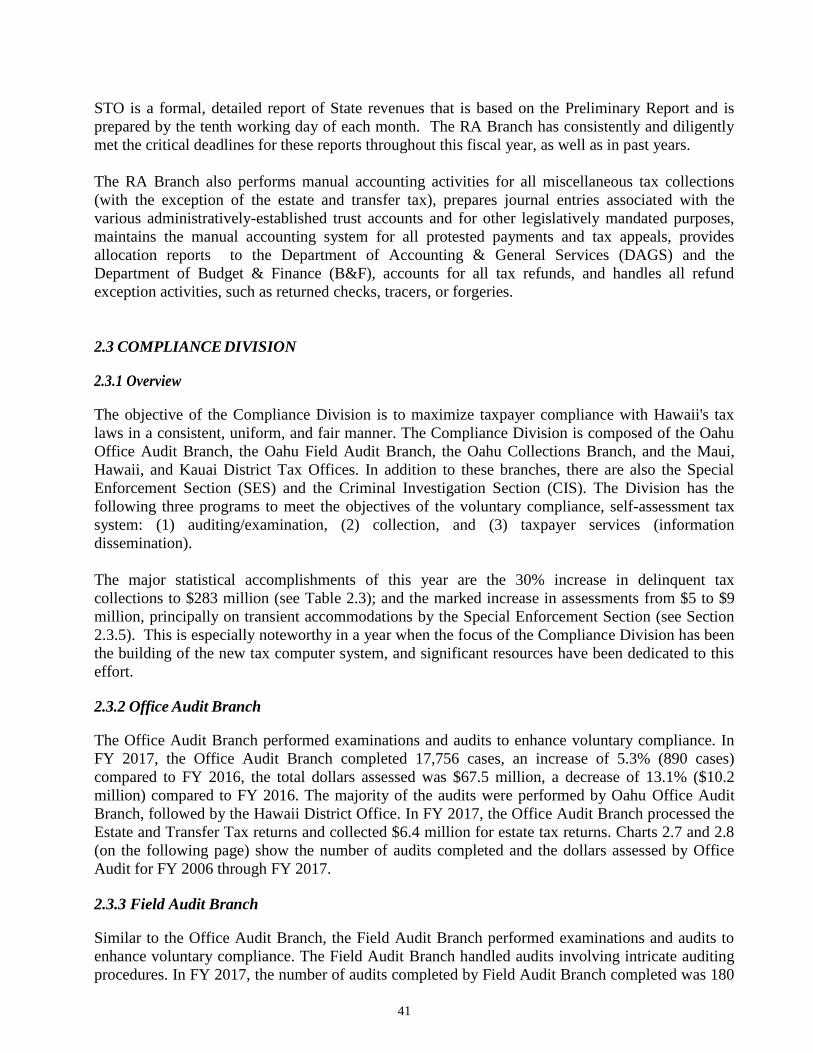
41
STO is a formal, detailed report of State revenues that is based on the Preliminary Report and is
prepared by the tenth working day of each month. The RA Branch has consistently and diligently
met the critical deadlines for these reports throughout this fiscal year, as well as in past years.
The RA Branch also performs manual accounting activities for all miscellaneous tax collections
(with the exception of the estate and transfer tax), prepares journal entries associated with the
various administratively-established trust accounts and for other legislatively mandated purposes,
maintains the manual accounting system for all protested payments and tax appeals, provides
allocation reports to the Department of Accounting & General Services (DAGS) and the
Department of Budget & Finance (B&F), accounts for all tax refunds, and handles all refund
exception activities, such as returned checks, tracers, or forgeries.
2.3 COMPLIANCE DIVISION 2.3.1 Overview The objective of the Compliance Division is to maximize taxpayer compliance with Hawaii's tax
laws in a consistent, uniform, and fair manner. The Compliance Division is composed of the Oahu
Office Audit Branch, the Oahu Field Audit Branch, the Oahu Collections Branch, and the Maui,
Hawaii, and Kauai District Tax Offices. In addition to these branches, there are also the Special
Enforcement Section (SES) and the Criminal Investigation Section (CIS). The Division has the
following three programs to meet the objectives of the voluntary compliance, self-assessment tax
system: (1) auditing/examination, (2) collection, and (3) taxpayer services (information
dissemination).
The major statistical accomplishments of this year are the 30% increase in delinquent tax
collections to $283 million (see Table 2.3); and the marked increase in assessments from $5 to $9
million, principally on transient accommodations by the Special Enforcement Section (see Section
2.3.5). This is especially noteworthy in a year when the focus of the Compliance Division has been
the building of the new tax computer system, and significant resources have been dedicated to this
effort. 2.3.2 Office Audit Branch The Office Audit Branch performed examinations and audits to enhance voluntary compliance. In
FY 2017, the Office Audit Branch completed 17,756 cases, an increase of 5.3% (890 cases)
compared to FY 2016, the total dollars assessed was $67.5 million, a decrease of 13.1% ($10.2
million) compared to FY 2016. The majority of the audits were performed by Oahu Office Audit
Branch, followed by the Hawaii District Office. In FY 2017, the Office Audit Branch processed the
Estate and Transfer Tax returns and collected $6.4 million for estate tax returns. Charts 2.7 and 2.8
(on the following page) show the number of audits completed and the dollars assessed by Office
Audit for FY 2006 through FY 2017. 2.3.3 Field Audit Branch Similar to the Office Audit Branch, the Field Audit Branch performed examinations and audits to
enhance voluntary compliance. The Field Audit Branch handled audits involving intricate auditing
procedures. In FY 2017, the number of audits completed by Field Audit Branch completed was 180
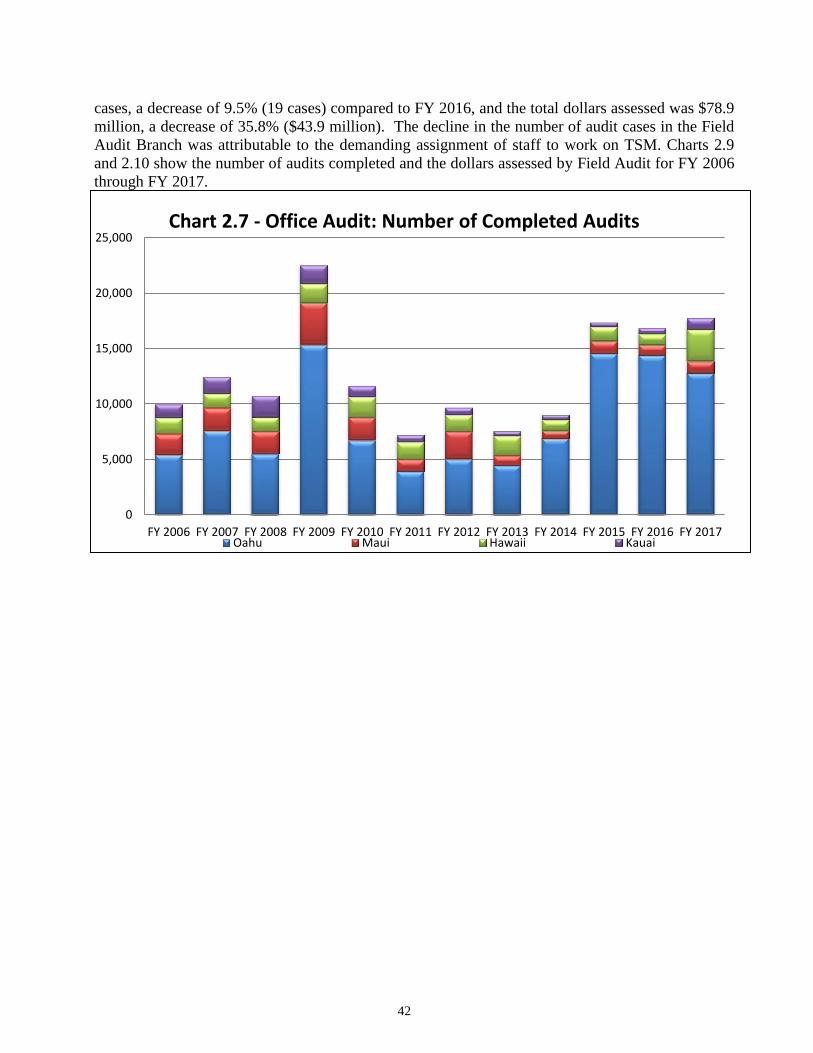
42
cases, a decrease of 9.5% (19 cases) compared to FY 2016, and the total dollars assessed was $78.9
million, a decrease of 35.8% ($43.9 million). The decline in the number of audit cases in the Field
Audit Branch was attributable to the demanding assignment of staff to work on TSM. Charts 2.9
and 2.10 show the number of audits completed and the dollars assessed by Field Audit for FY 2006
through FY 2017.
0
5,000
10,000
15,000
20,000
25,000
FY 2006 FY 2007 FY 2008 FY 2009 FY 2010 FY 2011 FY 2012 FY 2013 FY 2014 FY 2015 FY 2016 FY 2017
Chart 2.7 - Office Audit: Number of Completed Audits
Oahu Maui Hawaii Kauai
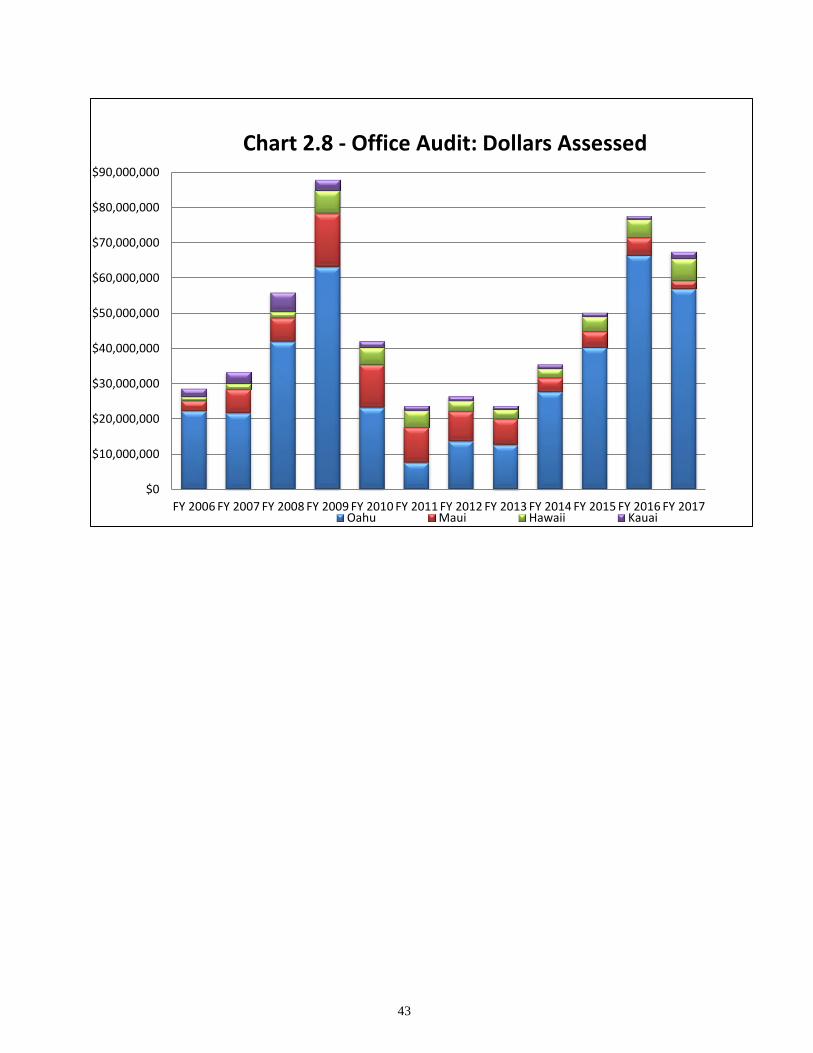
43
$0
$10,000,000
$20,000,000
$30,000,000
$40,000,000
$50,000,000
$60,000,000
$70,000,000
$80,000,000
$90,000,000
FY 2006 FY 2007 FY 2008 FY 2009 FY 2010 FY 2011 FY 2012 FY 2013 FY 2014 FY 2015 FY 2016 FY 2017
Chart 2.8 - Office Audit: Dollars Assessed
Oahu Maui Hawaii Kauai
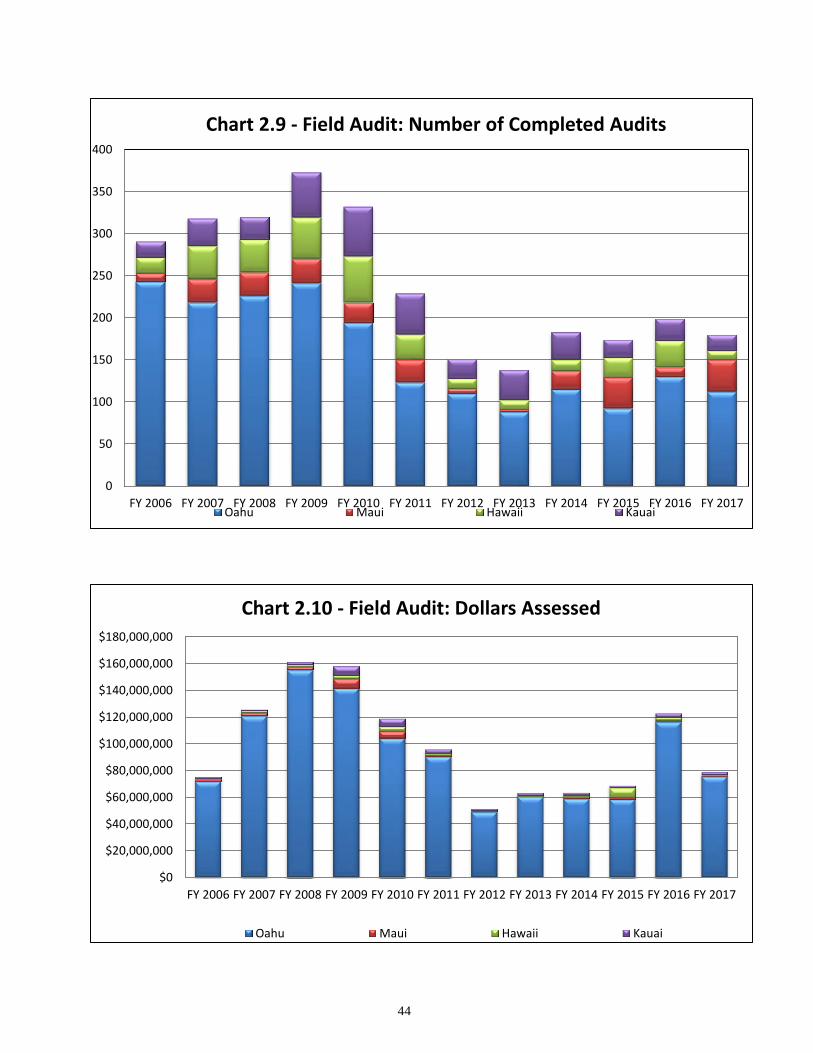
44
0
50
100
150
200
250
300
350
400
FY 2006 FY 2007 FY 2008 FY 2009 FY 2010 FY 2011 FY 2012 FY 2013 FY 2014 FY 2015 FY 2016 FY 2017
Chart 2.9 - Field Audit: Number of Completed Audits
Oahu Maui Hawaii Kauai
$0
$20,000,000
$40,000,000
$60,000,000
$80,000,000
$100,000,000
$120,000,000
$140,000,000
$160,000,000
$180,000,000
FY 2006 FY 2007 FY 2008 FY 2009 FY 2010 FY 2011 FY 2012 FY 2013 FY 2014 FY 2015 FY 2016 FY 2017
Chart 2.10 - Field Audit: Dollars Assessed
Oahu Maui Hawaii Kauai
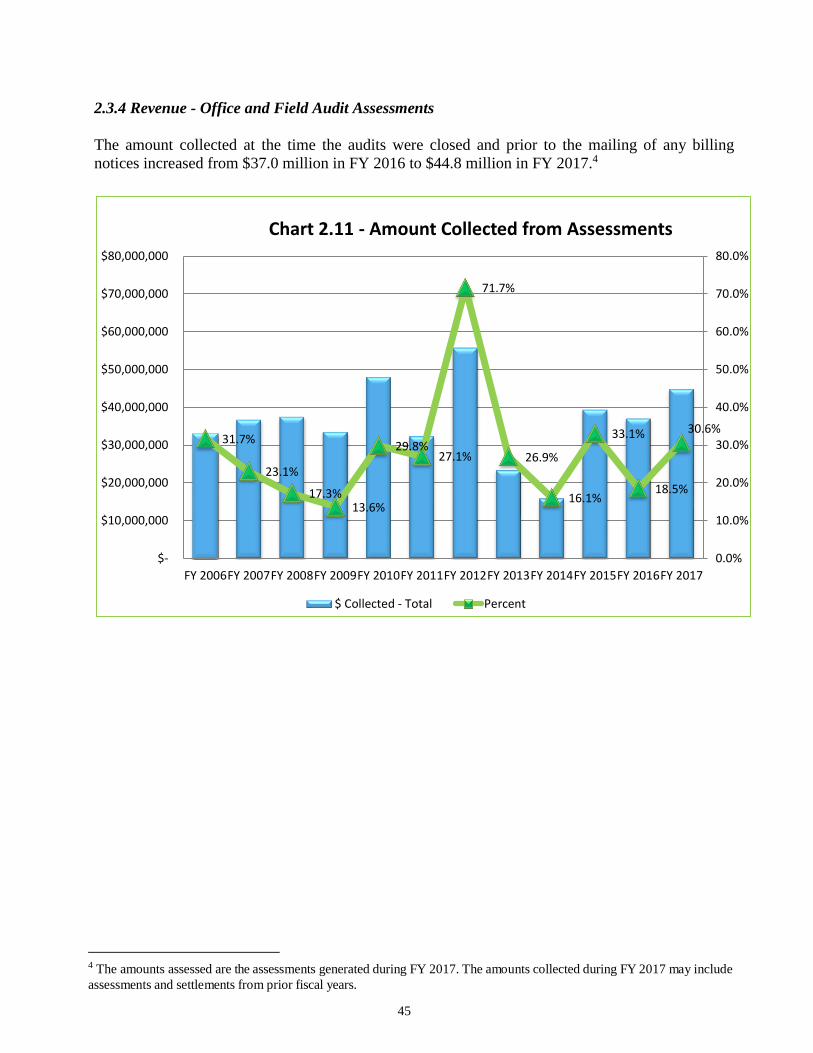
45
2.3.4 Revenue - Office and Field Audit Assessments
The amount collected at the time the audits were closed and prior to the mailing of any billing
notices increased from $37.0 million in FY 2016 to $44.8 million in FY 2017.4
4 The amounts assessed are the assessments generated during FY 2017. The amounts collected during FY 2017 may include
assessments and settlements from prior fiscal years.
31.7%
23.1%
17.3%13.6%
29.8%27.1%
71.7%
26.9%
16.1%
33.1%
18.5%
30.6%
0.0%
10.0%
20.0%
30.0%
40.0%
50.0%
60.0%
70.0%
80.0%
$-
$10,000,000
$20,000,000
$30,000,000
$40,000,000
$50,000,000
$60,000,000
$70,000,000
$80,000,000
FY 2006FY 2007FY 2008FY 2009FY 2010FY 2011FY 2012FY 2013FY 2014FY 2015FY 2016FY 2017
Chart 2.11 - Amount Collected from Assessments
$ Collected - Total Percent
46
TABLE 2.1 - AMOUNTS ASSESSED FOR FY 2017
Office Audit Field Audit
Number of Audits Dollar Assessed Number of Audits Dollar Assessed
Oahu 12,779 $56,912,954 112 $75,600,841
Maui 1,067 $2,375,607 38 $524,561
Hawaii 2,878 $6,189,179 11 $661,650
Kauai 1,032 $2,058,733 19 $2,118,784
Total FY 2017 17,756 $67,536,473 180 $ 78,905,836
Total FY 2016 16,866 $77,696,490 199 $122,880,670
Difference 890 $(10,160,017) (19) $(43,974,834)
2.3.5 Special Projects
Oahu Office Audit Branch conducted the following special projects during the fiscal year:
• Renewable Energy T a x Credit: The review of the tax c r e d i t s c l a i m e d
resulted in $290,792 in assessments and adjustments.
• 1099-MISC: The examination of tax returns resulted in $3.8 million in assessments and
adjustments.
• Non-Filers: The examination of tax returns resulted in $21.0 million in assessments and
adjustments.
• HARPTA: During the fiscal year Oahu office audit examined gain computations inclusive of
reviewing basis of properties resulting in $135,138 in assessments.
• Itemized Deductions: The examination of tax returns resulted in $1.8 million in
assessments and adjustments.
Oahu Field Audit Branch conducted the following special projects during the fiscal year:
• Federal Contractors Project: This project, which targets unlicensed contractors working
on federal installations, was started in 1983 and is an ongoing activity. This fiscal year, 4
audits were completed and resulted in $332,829 in assessments.
• Referral Cases from the Criminal Investigation Unit: During this fiscal year, 1 case that
was either originally considered for possible criminal prosecution or that arose pursuant to a
criminal investigation was completed, resulting in a $422,744 assessment.
• Research Tax Credit: During this fiscal year, 12 audit cases involving the research tax
credit were completed resulting in $2,791,295 in assessments.
47
• HARPTA: During this fiscal year, Field Audit has 2 cases of HARPTA issue, resulting in
$20,329,475.04 assessments.
• Multistate Tax Commission: During this fiscal year, 6 audit cases were completed that
resulted in $1,473,544 in assessments.
The Maui Office Audit Section conducted the following special projects during the fiscal year:
• Miscellaneous Deduction Project: Maui Office Audit assessed 93 taxpayers a total of
$177,331 in tax, $4,493 in late filing penalties, and $24,158 in interest.
• Renewable Energy Technologies Income Tax Credits: Maui Office Audit examined
renewable energy income tax credits claimed in the amount of $3,964,840 which resulted in
the disallowance/assessments of credits in the amount of $202,657.
• HARPTA Reviews: Maui Office Audit examined HARPTA/capital gains with the total of
selling prices of $278,259,110 which resulted in assessments or adjustments of $33,500.
• The Maui Field Audit Section conducted the following special project during the fiscal year:
• Renewable Energy Technologies Income Tax Credits: Maui Field Audit reviewed
renewable energy income tax credits claimed in the amount of $10,751,933 which resulted in
the disallowance of credits in the amount of $357,611.
• HARPTA Reviews: Maui Field Audit examined HARPTA/capital gains with the total of
selling prices of $12,575,014 which resulted in assessments or adjustments of $22,413.
The Hawaii District Office Audit Section conducted the following special projects during the fiscal
year:
• Renewable Energy Tax Credits: The review of renewable energy tax credits claimed
resulted in $90,070 in assessments and adjustments.
• HARPTA Review: Examinations resulted in $487,983 in assessments and adjustments of
income, general excise, and transient accommodations taxes.
• 1099-MISC: Examinations in this area resulted in $570,311 in general excise tax
assessments.
• Other Leads: Examinations in this area resulted in $258,454 in general excise tax
assessments.
• Hawaii District Field Audit Section conducted the following special project during the fiscal
year:
• Selected Exemptions: The Field Audit Section audited $14,014,421 in exemptions claimed
that resulted in tax assessments of $327,877.
48
Kauai District Office Audit Section conducted the following special projects during the fiscal year:
• Referrals from Criminal Investigation Unit: The examination of tax returns resulted in
$42,500 in assessments and adjustments.
• 1099-MISC: The examination of tax returns resulted in $69,400 in assessments and
adjustments.
• Non-Filer: The examination of tax returns resulted in $82,000 in assessments and
adjustments.
The Kauai District Field Audit Section conducted the following special projects during the fiscal
year:
• Renewable Energy Tax Credits: The review of renewable energy tax credits claimed totaling
$1,574,000 resulted in the disallowance of credits of $197,100.
• Capital Goods Excise Tax Credit: The review of capital goods excise tax credits claimed
totaling $569,000 resulted in the disallowance of credits of $500,000.
2.3.6 Taxpayer Assistance Provided
During FY 2017, the personnel in neighbor island district tax offices helped taxpayers properly file numerous tax returns and other documents over the telephone, at the service counter, and via
correspondence. The Oahu Office Audit, Field Audit, and Collection units also provided support services to the neighbor island district tax offices and to the Oahu Taxpayer Services Branch when requested. Table 2.2 summarizes the number of times that taxpayer assistance was provided by the Maui, Hawaii, and Kauai District Tax Offices.
TABLE 2.2 – TAXPAYER ASSISTANCE PROVIDED BY MAUI, HAWAII AND KAUAI DISTRICT OFFICES
Difference
FY2017 FY2016 Number Percentage
Counter 70,942 73,568 (2,626) (3.6)
Phone Services 45,988 51,694 (5,706) (11.0)
Tax Clearances 5,589 5,542 47 0.8
Correspondence 15,041 19,872 (4,831) (24.3)
The taxpayer services sections in the districts provide telephone and counter services,
supplementing the centralized customer services provided by the Oahu TSP Division. The districts
continue to receive a steady flow of telephone inquiries, and can use the statewide tax data system
to assist with any tax inquiry.
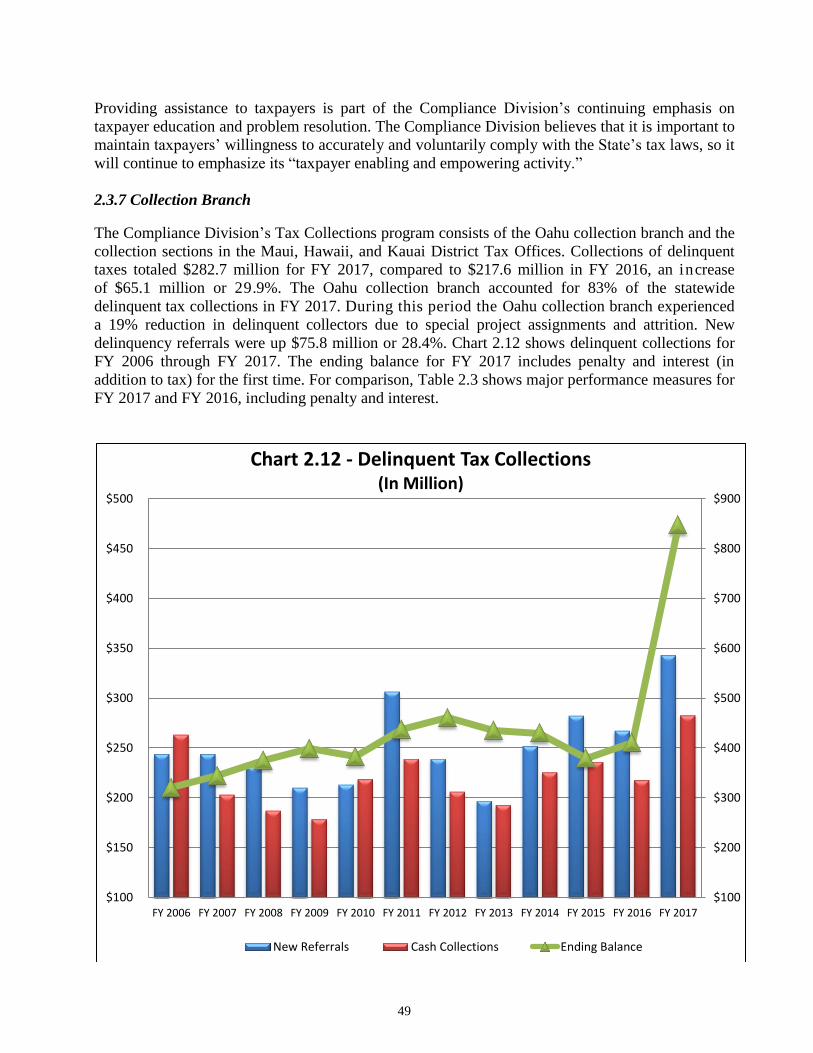
49
Providing assistance to taxpayers is part of the Compliance Division’s continuing emphasis on
taxpayer education and problem resolution. The Compliance Division believes that it is important to
maintain taxpayers’ willingness to accurately and voluntarily comply with the State’s tax laws, so it
will continue to emphasize its “taxpayer enabling and empowering activity.”
2.3.7 Collection Branch
The Compliance Division’s Tax Collections program consists of the Oahu collection branch and the
collection sections in the Maui, Hawaii, and Kauai District Tax Offices. Collections of delinquent
taxes totaled $282.7 million for FY 2017, compared to $217.6 million in FY 2016, an increase
of $65.1 million or 29.9%. The Oahu collection branch accounted for 83% of the statewide
delinquent tax collections in FY 2017. During this period the Oahu collection branch experienced
a 19% reduction in delinquent collectors due to special project assignments and attrition. New
delinquency referrals were up $75.8 million or 28.4%. Chart 2.12 shows delinquent collections for
FY 2006 through FY 2017. The ending balance for FY 2017 includes penalty and interest (in
addition to tax) for the first time. For comparison, Table 2.3 shows major performance measures for
FY 2017 and FY 2016, including penalty and interest.
$100
$200
$300
$400
$500
$600
$700
$800
$900
$100
$150
$200
$250
$300
$350
$400
$450
$500
FY 2006 FY 2007 FY 2008 FY 2009 FY 2010 FY 2011 FY 2012 FY 2013 FY 2014 FY 2015 FY 2016 FY 2017
Chart 2.12 - Delinquent Tax Collections(In Million)
New Referrals Cash Collections Ending Balance
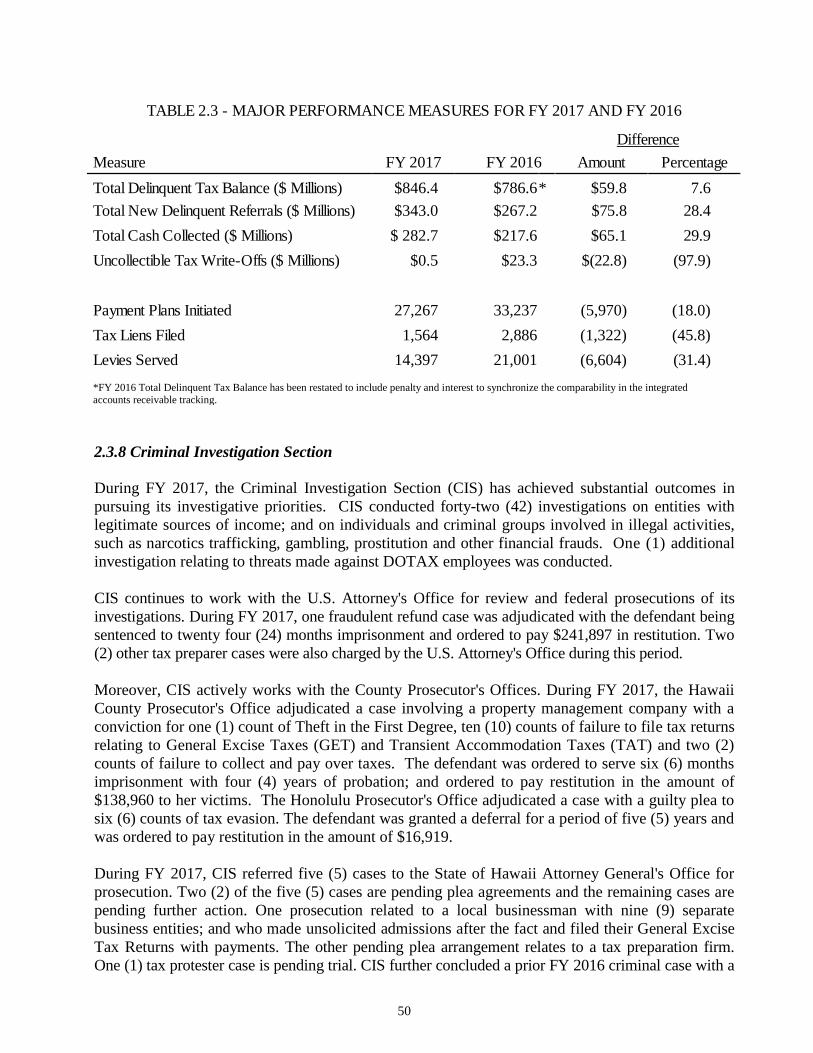
50
TABLE 2.3 - MAJOR PERFORMANCE MEASURES FOR FY 2017 AND FY 2016
Difference
Measure FY 2017 FY 2016 Amount Percentage
Total Delinquent Tax Balance ($ Millions) $846.4 $786.6 * $59.8 7.6
Total New Delinquent Referrals ($ Millions) $343.0 $267.2 $75.8 28.4
Total Cash Collected ($ Millions) $ 282.7 $217.6 $65.1 29.9
Uncollectible Tax Write-Offs ($ Millions) $0.5 $23.3 $(22.8) (97.9)
Payment Plans Initiated 27,267 33,237 (5,970) (18.0)
Tax Liens Filed 1,564 2,886 (1,322) (45.8)
Levies Served 14,397 21,001 (6,604) (31.4)
*FY 2016 Total Delinquent Tax Balance has been restated to include penalty and interest to synchronize the comparability in the integrated
accounts receivable tracking.
2.3.8 Criminal Investigation Section
During FY 2017, the Criminal Investigation Section (CIS) has achieved substantial outcomes in
pursuing its investigative priorities. CIS conducted forty-two (42) investigations on entities with
legitimate sources of income; and on individuals and criminal groups involved in illegal activities,
such as narcotics trafficking, gambling, prostitution and other financial frauds. One (1) additional
investigation relating to threats made against DOTAX employees was conducted.
CIS continues to work with the U.S. Attorney's Office for review and federal prosecutions of its
investigations. During FY 2017, one fraudulent refund case was adjudicated with the defendant being
sentenced to twenty four (24) months imprisonment and ordered to pay $241,897 in restitution. Two
(2) other tax preparer cases were also charged by the U.S. Attorney's Office during this period.
Moreover, CIS actively works with the County Prosecutor's Offices. During FY 2017, the Hawaii
County Prosecutor's Office adjudicated a case involving a property management company with a
conviction for one (1) count of Theft in the First Degree, ten (10) counts of failure to file tax returns
relating to General Excise Taxes (GET) and Transient Accommodation Taxes (TAT) and two (2)
counts of failure to collect and pay over taxes. The defendant was ordered to serve six (6) months
imprisonment with four (4) years of probation; and ordered to pay restitution in the amount of
$138,960 to her victims. The Honolulu Prosecutor's Office adjudicated a case with a guilty plea to
six (6) counts of tax evasion. The defendant was granted a deferral for a period of five (5) years and
was ordered to pay restitution in the amount of $16,919.
During FY 2017, CIS referred five (5) cases to the State of Hawaii Attorney General's Office for
prosecution. Two (2) of the five (5) cases are pending plea agreements and the remaining cases are
pending further action. One prosecution related to a local businessman with nine (9) separate
business entities; and who made unsolicited admissions after the fact and filed their General Excise
Tax Returns with payments. The other pending plea arrangement relates to a tax preparation firm.
One (1) tax protester case is pending trial. CIS further concluded a prior FY 2016 criminal case with a
51
civil settlement of over $175,000.
CIS is currently investigating other tax preparers covering all of the islands. These cases will be
referred to the State of Hawaii Attorney General's Office upon completion. CIS continues to pursue
investigations on mainland companies doing business in the State of Hawaii; and on individuals and
criminal groups involved in illegal activities.
Completed investigations that were not referred for criminal prosecution were turned over to the
appropriate Oahu Office Audit Branch, Field Audit Branch or Outer Island District Offices for
further civil examination. Over four hundred (400) referrals were made for civil assessments. For
FY 2017, these referrals amounted to over $984,976 in additional assessments. These assessments
were mutually exclusive to those made for prior year adjudicated criminal cases.
The Criminal Investigation Section will continue to be innovative in its investigative approach and
strive to improve its processes for the Department of Taxation.
Criminal Investigation/Enforcement Action
During FY 2017, the Criminal Investigation Section continued to promote voluntary compliance
through the aggressive enforcement of Hawaii Tax Laws and Regulations. It is estimated that CIS
investigative efforts will have yielded approximately $4,733,960 in restitution, assessments,
penalties, and interest that would have otherwise not been realized by the State of Hawaii. In FY
2016, CIS investigative efforts yielded $4,415,603. An additional $872,380 in criminal collections
was made in FY 2017.
2.3.9 Special Enforcement Section
The Special Enforcement Section (SES) was established in 2009, through the Cash Economy
Enforcement Act. Its goal is to ensure that all sectors of Hawaii's economy, especially those that
conduct a significant portion of business transactions in cash ("cash economy"), pay their fair share
of taxes. In FY 2016, SES was given additional responsibilities for ensuring that short-term
vacation rental operators comply with the state's transient accommodations tax laws.
The SES has broad legal authority to conduct civil investigations of reported or suspected violations
of tax laws. It conducts complex financial investigations to determine correct income subject to tax
by securing and examining books, records and other corroborating evidence. It executes a wide
range of activities which include receiving and investigating complaints, developing leads through
various sources, securing delinquent and amended tax returns and payments from taxpayers,
conducting site visits, inspections, surveys, and training sessions at various events, business
locations, and short-term rental sites throughout the state for the purpose of educating the public
and business operators about their tax obligations and checking on tax compliance.
During FY 2017, SES initiated several projects that utilize publicly available and confidential
database sources to develop leads on taxpayers who are potentially not compliant with transient
accommodations and general excise tax laws. These projects utilized new resources made available
by TSM to evaluate large amounts of data. As a result, significant numbers of leads have been
generated indicative of unreported and under-reported income subject to transient accommodations
52
and general excise taxes. It is anticipated that these projects will result in substantial additional
transient accommodations and related general excise tax collections in FY 2018 and beyond.
In FY 2017, SES continued to achieve significant gains in bringing taxpayers into compliance and
in collecting tax revenues. SES collected $5,268,362 in total revenue in FY 2017, as compared
with $3,505,618 in FY 2016, an increase of over 50%. Furthermore, with the assistance of Office
Audits, $487,245 of taxes were also assessed in FY 2017. Additional details of SES's
accomplishments are as follows:
FY 2017 FY 2016 FY 2015
Complaints Received 307 364 391
Vendors Educated on Compliance of Tax Laws 1,331 1,470 1,554
Number of Events Visited Throughout the State 25 28 60
Number of Extensive Investigations Completed 76 31 34
Total Liability on Returns Secured from Taxpayers $8,724,539 $4,583,190 $2,332,782
Total Revenue Collected from Taxpayers $5,268,362 $3,505,618 $1,619,235
2.4 STAFF OFFICES
2.4.1 Administrative Services Office
2.4.1.1 Fiscal Office
The Administrative Services Office submitted the biennium budget for FY 2018 to the 2017
Legislature. The Legislature appropriated $28.4 million for FY 2018 for operating expenses. The
Legislature did not approve the requested $18.8 million CIP funding for the Department's Tax
System Modernization Project (TSM), therefore the required funds to continue the TSM Project
will impact FY 2018 Operating Budget. To prepare for medical marijuana tax payments the
Legislature appropriated $500,000 to improve the safety and security of the Department's facilities.
For fiscal year 2017, $28.8 million was appropriated for the Department. In discharging its duties
and responsibilities, the Department incurred operating expenses of $24.3 million for the year. The
Department collected $6.94 billion in net tax revenues in fiscal year 2017, so the cost to collect
$100 of taxes was about 35 cents.
2.4.1.2 Personnel Management
In FY 2017 the Personnel Department's focused on filling vacancies, outside recruitment, internal
promotions and retention programs. Personnel staff also participated in the development of the new
payroll system, reviewing and organizing files to transition into the new payroll system.
During that fiscal year, the Department's total vacancy rate for permanent positions increased
12.9% or 8 positions attributed to retirements, internal promotions, and resignations. Vacancies in
the Staff Offices decreased by 38.5%, Compliance Division increased by 38.7% and Tax Services
& Processing increased by 5.6%. The Department has a total of 388 authorized permanent
53
positions: 316 Oahu, 29 Hawaii (Hilo/Kona), 25 Maui/Molokai, and 18 Kauai.
2.4.2 Rules Office
The Rules Office is comprised of the Rules staff and the Technical Section. The function of the
Rules Office is to serve as a resource for complex policy recommendations and complex internal
support. The Rules Office also assists in the Department's implementation of new legislation and in
creating and maintaining the Department's tax forms, form instructions, and publications.
2.4.2.1 Rules Staff
The Rules staff serves as the Department's internal advisory arm to the Director of Taxation on tax
policy and advises the Director's Office and the Department on legislative and tax policy issues.
Litigation and other external legal matters are handled exclusively by the Tax Division of the
Department of the Attorney General.
In addition, the Rules staff assists, counsels, and represents the Department's compliance personnel
with tax disputes and other administrative tax controversies. For example, the Rules staff provided
assistance to the Department's compliance function in interpreting issues under audit, settlement
negotiations and closings, and appeared on behalf of the Department before the Boards of Review.
The Rules staff also assisted the Tax Division of the Department of the Attorney General with the
judicial tax appeals and provided support to the Department’s Tax System Modernization project.
The Rules staff also testified at legislative hearings on behalf of the Director, provided training for
Department personnel, and spoke at several workshops for tax practitioners. For the 2017
legislative session, the Rules staff drafted and submitted 6 bills sponsored by the administration,
which were submitted to both the House of Representatives and the Senate. Prior to the start of the
legislative session, the Rules staff also reviewed and commented on proposed tax legislation
submitted by other executive departments.
After reviewing the bills introduced to the 2017 Legislature, the Director's Office and the Rules
staff determined there were approximately 370 measures proposing tax law changes and analyzed
them in depth. The measures were tracked throughout the legislative session and written
testimonies were prepared each time a tax measure was heard by the Legislature. In addition, the
Rules staff drafted letters to legislative committee chairs to respond to specific questions raised
during hearings or to address specific concerns of committee members.
During the fiscal year, the Rules staff prepared Tax Announcements, Tax Information Releases,
letter rulings, Administrative Directives, and other publications. During FY 2017, 8 Tax
Announcements were issued. Since 2009, when it became the Department’s policy to publicly
release taxpayer letter rulings in redacted form, 60 redacted letter rulings have been released.
In FY 2017, the Department promulgated administrative rules relating to the Motion Picture,
Digital Media, and Film Production Income Tax Credit, Relating to Payments by EFT Program
Participants, Registration of Representatives, Last Known Address, and Substantial Gainful
Business or Occupation.
The Rules staff also reviewed and certified 52 requests for the credit for research activities pursuant
54
to HRS § 235-110.91.
2.4.2.2 Technical Section
The Technical Section is tasked with varying responsibilities to carry out the Department's projects,
goals and initiatives, and to support the Department's operational needs. Specifically, the Technical
Section assists and advises all divisions within the Department, as well as outside parties such as
individual and corporate taxpayers and tax professionals, on complex areas of the state tax laws.
For FY 2017, the Technical Section responded to 1,437 email inquiries and 3,626 telephone
inquiries. They also responded to formal requests which includes requests for letter rulings or
information letters, determinations of tax status (such as for eligibility for the general excise tax
exemptions for air-pollution control facilities), and multi-level marketing agreements as well as tax
surveys and questionnaires from other government agencies, educational institutions, and major tax
service product providers.
The Technical Section also reviews, researches, analyzes, and provides comments and
recommendations on the technical and procedural aspects of legislative bills, administrative rules,
and tax information releases. The staff is responsible for revising or creating the State's tax forms
and instructions, incorporating all applicable federal and state tax law changes. For FY 2017, the
Technical Section reviewed 289 tax forms, 55 tax form instructions, 77 Tax Modernization System
letter templates and 19 Tax Publications. The Technical Section also developed 1 new tax form and
1 new tax form instruction, and made obsolete 11 tax forms and 2 tax form instructions. As part of
the forms process, the department has a Forms Reproduction Policy under which companies who
reproduce state tax forms, such as tax preparation software companies, must submit their facsimiles
for review and for testing applicable forms through the department's tax return scanning machines.
For FY 2017, 694 tax forms were submitted to the Technical Section for review, testing and
approval.
Other duties of the Technical Section include analyzing and reviewing certain applications for tax
exemptions. In FY 2017, 144 applications for an exemption from the general excise tax were
received, 132 applications were reviewed and approved, 67 applications are pending further action
and 7 applications were cancelled due to lack of response to a request for additional information or
the organization did not qualify as exempt under §237-23(b), HRS. In addition, 2,931 applications
for conveyance tax exemptions were reviewed and processed.
2.4.3 Tax Research and Planning Office
The following are the main functions of the Tax Research and Planning (TRP) Office: (1) prepare
reports on data collected by the Department, including reports on collections of the State's various
taxes, on the income patterns of individual and business taxpayers, and on tax credits claimed by
taxpayers; (2) provide administrative and technical support to the Council on Revenues, assisting in
the preparation of forecasts for General Fund tax revenues and total personal income; (3) provide
economic and statistical analyses to help the Department execute its policies and programs; (4)
prepare reports on the revenue consequences of proposed tax legislation for the Legislature, the
Governor, and other agencies in the Administration; (5) conduct economic analysis and educate the
Legislature, the Governor, and other State agencies regarding the state's tax system; and (6)
provide administrative and technical support to the Tax Review Commission when it is in session.
55
The TRP Office prepares the following reports on a monthly, fiscal year, and calendar year basis:
(1) State Tax Collections and Distributions; (2) General Excise and Use Tax Collections;
(3) Liquid Fuel Tax Base and Collections; (4) Liquid Fuel Tax Allocations by Fund; (5) Liquor Tax
Collections and Permits; (6) Tobacco Tax Collections and Licenses, and (7) Preliminary
Comparative Statement of General Fund Tax Revenues.
In fiscal year 2017, the TRP Office worked on the Department of Taxation's Annual Report: 2015–
2016, which was completed and submitted in December of 2016. The Office also published reports
on tax credits claimed by Hawaii taxpayers in tax year 2014 and on statistics on Hawaii's individual
income tax in tax year 2014.
For the 2017 Legislative session, TRP staff reviewed and tracked tax-related legislative bills and
resolutions, and prepared more than 300 revenue estimates for various drafts of the bills. Revenue
estimates were also prepared for various proposals in response to requests from the Administration,
legislators, and others.
An important function of the TRP Office is to provide administrative and technical support to help
the Council on Revenues produce its forecasts of tax revenues. The seven members of the Council
are responsible for forecasting State General Fund revenues and the State's total personal income.
The Council provides forecasts of State revenue for the current and six subsequent fiscal years. The
forecasts are due on September 10, January 10, March 15, and June 1 of each year. The forecasts
are used by the Governor and by the Legislature to develop and administer the State's budget. The
Council also forecasts total personal income (TPI) for the current and immediately following
calendar years. The TPI forecasts are due on August 5 and November 5 of each year. The growth in
Hawaii total personal income is used to set the ceiling for expenditures from the State's General
Fund, as required by the State's Constitution.
TRP staff applied advanced econometric modeling techniques to data on State tax collections and to
data on other economic variables to help the Council produce its forecasts. The Council's last
General Fund forecast for fiscal year 2017 was produced on May 30, 2017. The forecast called for
tax collections dedicated to the Fund to grow by 2.5% compared with fiscal year 2016. Tax
collections actually grew by 2.0% The Council's last forecast for total personal income for calendar
year 2016 was produced on October 31, 2016 and called for growth of 4.5% over calendar year
2015.
The TRP Office updated its econometric models that were developed to predict General Fund tax
collections based on the Council's forecasts for economic variables, including its original model, the
model that was developed under a contract with UCLA Anderson Forecast, and the single-equation
model that the Office developed at the request of the Council on Revenues.
The TRP officer served as the co- Executive Director of the 2015-2017 Tax Review Commission.
The office provided information and research needed to support the Commission's activities,
delivering several presentation and preparing a report on the State's revenue system.
2.4.4 Information Technology Services Office
The Information Technology Services (ITS) Office is responsible for providing technical support
for the Department's computerized tax systems and applications, local area network, and network-
56
related components and infrastructures.
During FY 2017, the ITS Office continued to focus on managing, administering, and maintaining
the Integrated Tax Information Management System (ITIMS) and supporting network-related
components and infrastructures. The ITS Office also supported the multi-year Tax System
Modernization (TSM) Program, which will eventually replace all the Department's current
information technology systems and applications.
As the department progresses through its multi-year Tax System Modernization (TSM) Program, it
becomes increasingly important that its current Integrated Tax Information Management System
(ITIMS) remain stable with minimal changes introduced in order to facilitate the incremental,
multi-year changeover.
As defined by its charter, the TSM Program was overseen by an executive steering committee
consisting of senior Department officials, including the Director of Taxation, who acted as the
program executive sponsor. The TSM Program Manager directed the TSM Project Management
Office (PMO) and reported to the TSM Executive Steering Committee. The TSM PMO was tasked
with providing project management and information technology expertise to facilitate the
implementation of new technology and business process improvements.
The management of the TSM Program complied with recommendations made by the State Auditor
in 2010 and represented an unprecedented effort to leverage experienced professionals and best
practice methodologies to ensure the success of the Department's modernization initiative.
Managing information technology projects under a program structure allowed for coordination to
obtain benefits and control not available from managing projects individually.
Key initiatives continued or accomplished during FY 2017 include the following;
▪ Annual Tax Law Changes
▪ Upgrades to the department's networking infrastructure and devices
▪ A $30 million contract with FAST Enterprises, LLC for the implementation and support of
hardware, software, and services continued to be executed successfully. Full funding of the
awarded proposal will require $60 million to cover the implementation and maintenance of
new systems through FY2025.
o Production support for the first of five planned rollouts began as soon as it went into
operations. Aging information technology replaced as part of this rollout included
scanning and mail opening equipment, interactive voice response and telephony
equipment, and a system for processing electronic returns received through an
interface with the IRS.
o The second rollout of the TSM Program was successfully deployed as scheduled on
August 15, 2016. This entailed the deployment of a new tax information system for
General Excise; Use; Seller’s Collection; County Surcharge; Rental Motor Vehicle,
Tour Vehicle, and Car-Sharing Vehicle Surcharge tax types.
o The third rollout of the TSM Program, which involved adding support for Corporate
Income, Franchise, Public Service Company, and Withholding tax types to the new tax
information system, was successfully deployed on August 14, 2017.
57
▪ A contract with Advantech, LLC for independent verification and validation services
continued to be executed in support of the TSM Program. Under this contract, consultants
conducted a site visits and published four periodic assessments. Findings confirmed that the
progress of the TSM Program was within the normal range for successful implementations.
Items that will likely continue into the next reporting period include the following: 1) production
support for completed TSM Program rollouts; 2) provision of technical resources to facilitate
knowledge transfer in preparation for future TSM Program rollouts; 3) annual Tax Law Changes;
and 4) further strengthening measures to detect and stop fraudulent refunds.
While the complete replacement of existing legacy systems under the TSM Program is scheduled
for completion by mid-2019, the strategic prioritization of systems impairing the Department's
performance will allow the State to realize benefits as new systems are phased in.
2.4.5 Taxpayer Advocate
The Taxpayer Advocacy Program assists taxpayers who do not have a resolution to their tax related
issue after going through normal channels. This program provided assistance to 1737 taxpayers
during the Fiscal Year ending June 30, 2017.
In directly, the Taxpayer Advocate also assisted taxpayers in working to resolve systemic problems
within the Department. Examples of issues addressed include processing, inter-Departmental and
workflow problems which affect taxpayers.
Other accomplishments of this office included speaking, teaching and participating in tax
workshops and educational outreaches to tax professionals and the general public.
2.4.6 Tax Practitioner Priority Office
The Practitioner Priority Specialist (PPS) office provides tax practitioners a separate and dedicated
connection to the Department’s Taxpayer Services functions.
The PPS office has assisted 1,135 verified tax practitioners via telephone, email, and fax to resolve
tax account issues such as locating and applying payments, explaining notices and letters, providing
procedural guidance, and assisting with other taxpayer account inquiries. Tax issues outside these
parameters were referred for follow up to the appropriate functions within the Department.
In directly, the PPS also assisted verified tax practitioners by working within the Department to
improve services (including online) and workflows based on their input.
Other accomplishments of this office included speaking, teaching and participating in tax
workshops and educational outreaches to tax professionals.
In fiscal year ending June of 2017, the PPS office resolved and/or referred for resolution 8,595
inquiries (see inquiry chart below):
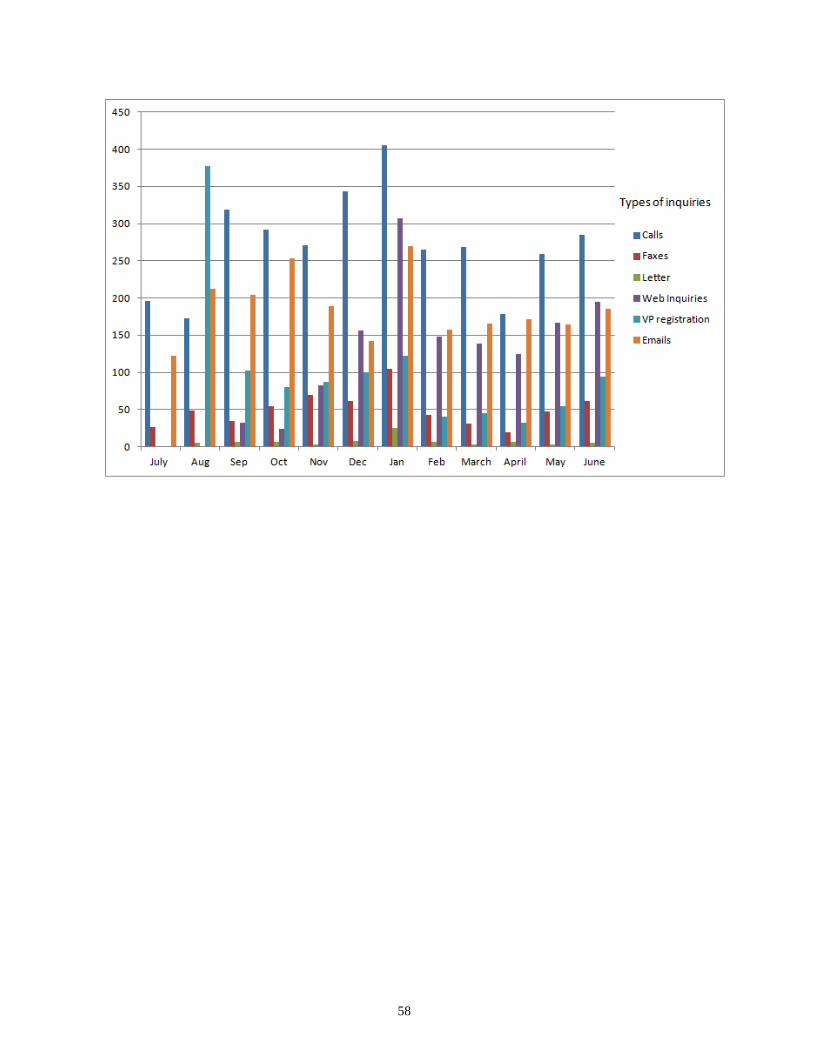
58
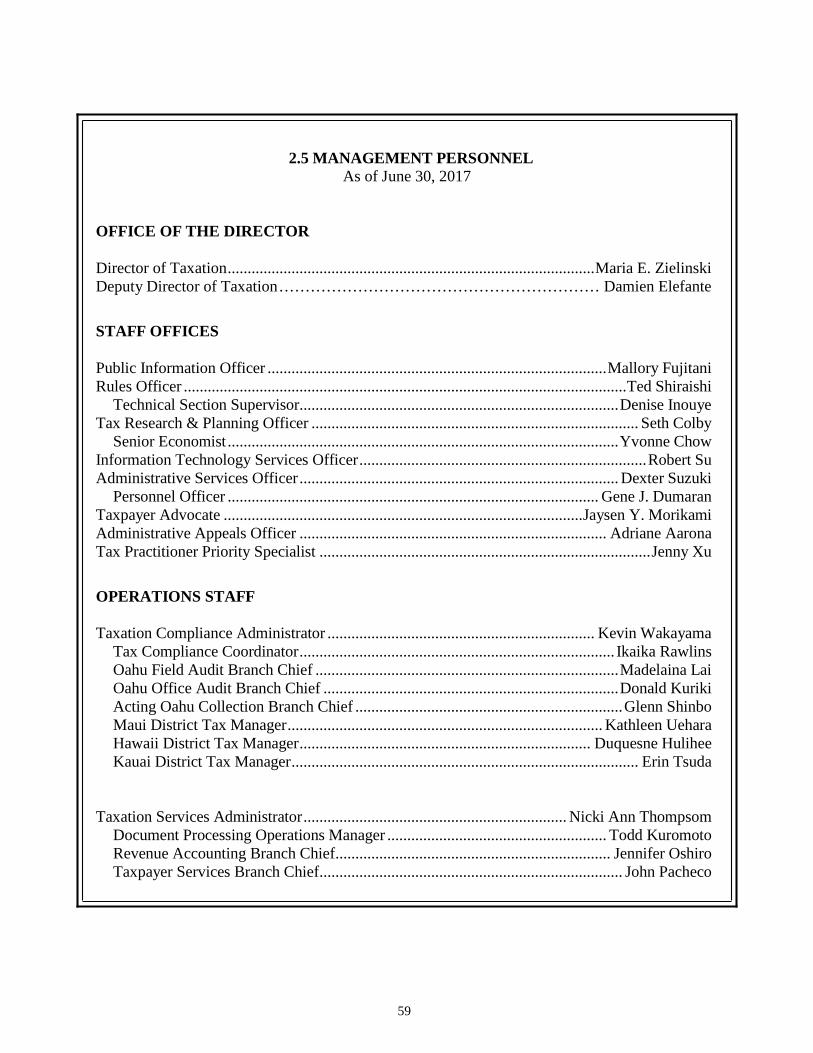
59
2.5 MANAGEMENT PERSONNEL
As of June 30, 2017
OFFICE OF THE DIRECTOR
Director of Taxation ............................................................................................ Maria E. Zielinski
Deputy Director of Taxation .. . . . . . . . . . . . . . . . . . . . . . . . . . . . . . . . . . . . . . . . . . . . . . . . . . . . . . . . . . . . Damien Elefante STAFF OFFICES
Public Information Officer ..................................................................................... Mallory Fujitani
Rules Officer ............................................................................................................... Ted Shiraishi
Technical Section Supervisor ................................................................................ Denise Inouye
Tax Research & Planning Officer .................................................................................. Seth Colby
Senior Economist .................................................................................................. Yvonne Chow
Information Technology Services Officer ........................................................................ Robert Su
Administrative Services Officer ................................................................................ Dexter Suzuki
Personnel Officer ............................................................................................. Gene J. Dumaran
Taxpayer Advocate .......................................................................................... Jaysen Y. Morikami
Administrative Appeals Officer ............................................................................. Adriane Aarona
Tax Practitioner Priority Specialist ................................................................................... Jenny Xu OPERATIONS STAFF
Taxation Compliance Administrator ................................................................... Kevin Wakayama
Tax Compliance Coordinator ............................................................................... Ikaika Rawlins
Oahu Field Audit Branch Chief ............................................................................ Madelaina Lai
Oahu Office Audit Branch Chief .......................................................................... Donald Kuriki
Acting Oahu Collection Branch Chief ................................................................... Glenn Shinbo
Maui District Tax Manager ............................................................................... Kathleen Uehara
Hawaii District Tax Manager ......................................................................... Duquesne Hulihee
Kauai District Tax Manager ....................................................................................... Erin Tsuda
Taxation Services Administrator .................................................................. Nicki Ann Thompsom
Document Processing Operations Manager ....................................................... Todd Kuromoto
Revenue Accounting Branch Chief ..................................................................... Jennifer Oshiro
Taxpayer Services Branch Chief ............................................................................ John Pacheco
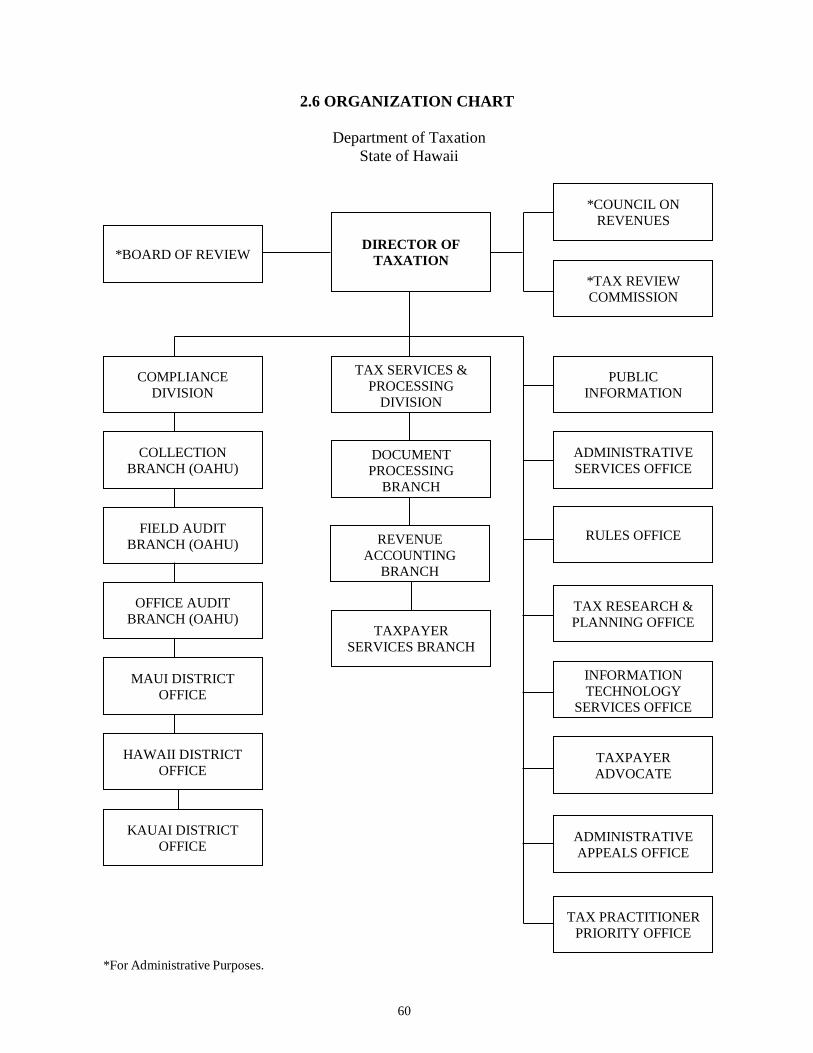
60
2.6 ORGANIZATION CHART
Department of Taxation
State of Hawaii
*For Administrative Purposes.
*COUNCIL ON
REVENUES
*TAX REVIEW
COMMISSION
PUBLIC
INFORMATION
ADMINISTRATIVE
SERVICES OFFICE
TAX PRACTITIONER
PRIORITY OFFICE
INFORMATION
TECHNOLOGY
SERVICES OFFICE
TAXPAYER
ADVOCATE
TAX RESEARCH &
PLANNING OFFICE
RULES OFFICE
ADMINISTRATIVE
APPEALS OFFICE
*BOARD OF REVIEW DIRECTOR OF
TAXATION
TAX SERVICES &
PROCESSING
DIVISION
DOCUMENT
PROCESSING
BRANCH
REVENUE
ACCOUNTING
BRANCH
TAXPAYER
SERVICES BRANCH
COMPLIANCE
DIVISION
COLLECTION
BRANCH (OAHU)
HAWAII DISTRICT
OFFICE
KAUAI DISTRICT
OFFICE
MAUI DISTRICT
OFFICE
OFFICE AUDIT
BRANCH (OAHU)
FIELD AUDIT
BRANCH (OAHU)
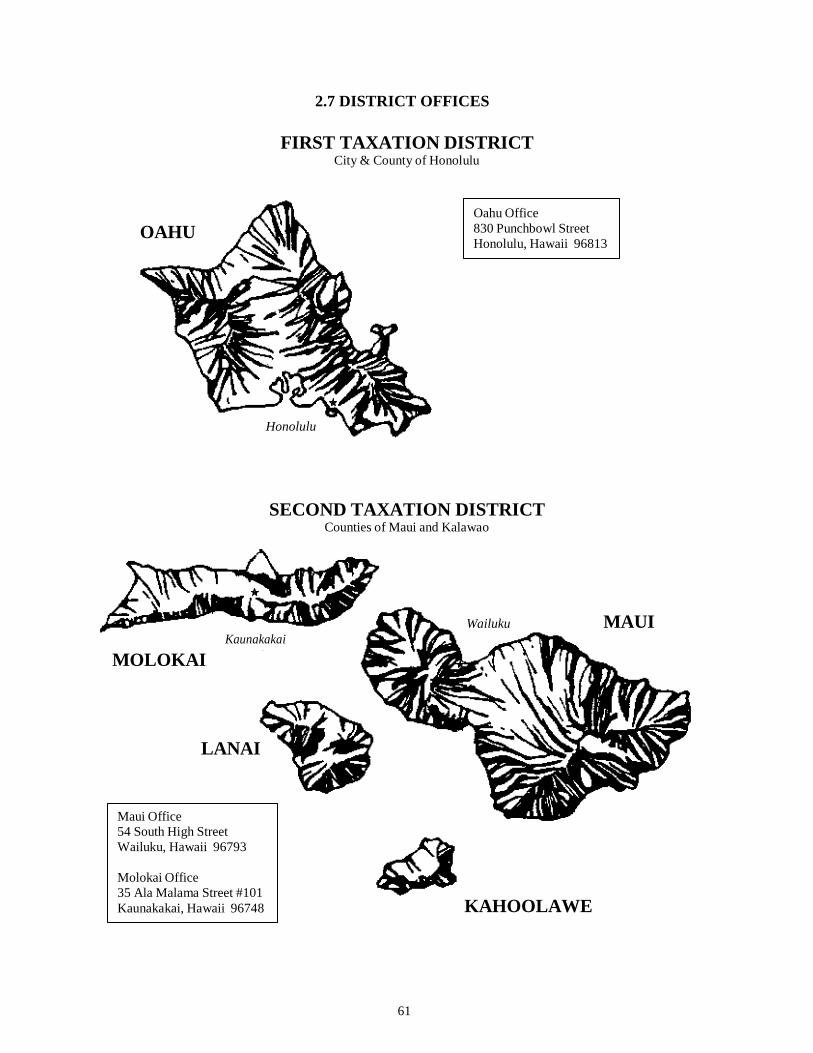
61
2.7 DISTRICT OFFICES
FIRST TAXATION DISTRICT City & County of Honolulu
OAHU Oahu Office
830 Punchbowl Street
Honolulu, Hawaii 96813
Honolulu
SECOND TAXATION DISTRICT Counties of Maui and Kalawao
MOLOKAI
Kaunakakai
Wailuku MAUI
LANAI
Maui Office
54 South High Street
Wailuku, Hawaii 96793
Molokai Office
35 Ala Malama Street #101
Kaunakakai, Hawaii 96748
KAHOOLAWE
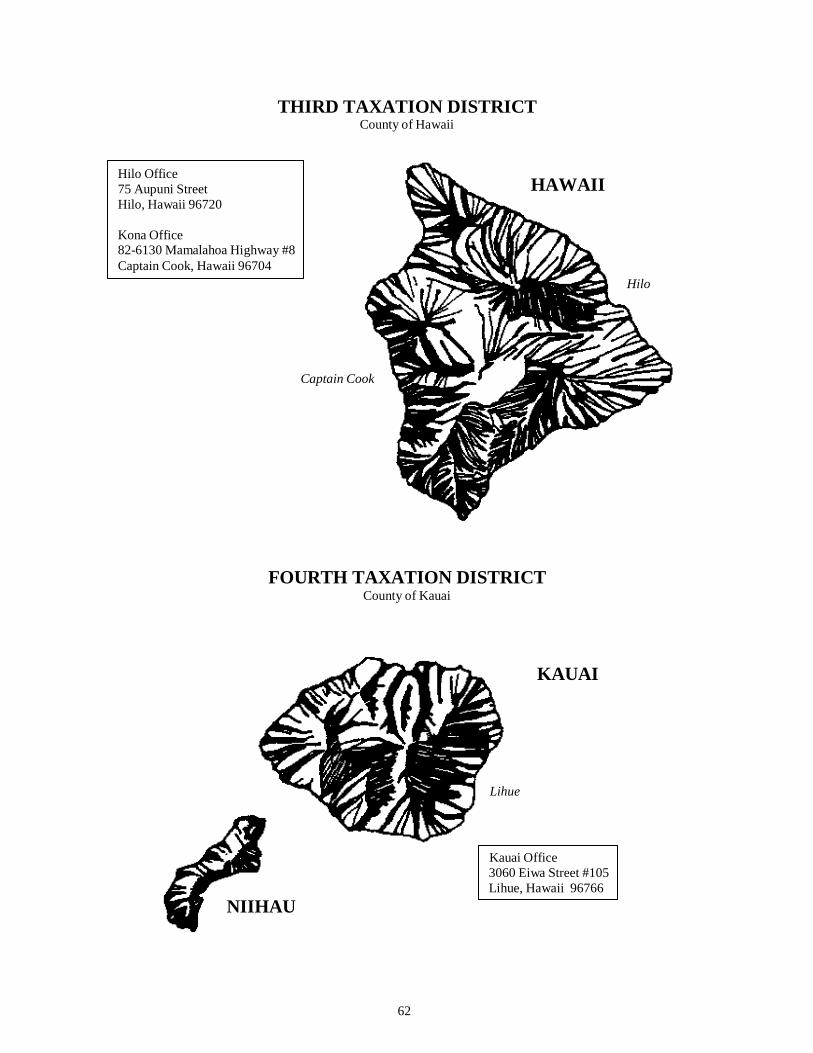
62
THIRD TAXATION DISTRICT County of Hawaii
Hilo Office
75 Aupuni Street
Hilo, Hawaii 96720
Kona Office 82-6130 Mamalahoa Highway #8
Captain Cook, Hawaii 96704
HAWAII
Hilo
Captain Cook
FOURTH TAXATION DISTRICT County of Kauai
KAUAI
Lihue
NIIHAU
Kauai Office
3060 Eiwa Street #105
Lihue, Hawaii 96766
63
3.0 TAX APPEALS AND LITIGATION
3.1 ADMINISTRATIVE APPEALS OFFICE
The Administrative Appeals Office administers the Administrative Appeals and Dispute Resolution
(AADR) program. AADR is a streamlined appeals process that assists taxpayers and return
preparers in resolving their disputes involving proposed assessments, final assessments, and return
preparer penalty assessments issued as a result of a DOTAX audit. Our mission is to help people
resolve tax disputes fairly, expeditiously, and without litigation. The AAO is separate and
independent of the Department offices that conduct audits and issue assessments.
This was a productive year for the AAO. In FY 2017, 86 appeals were filed and 62 cases closed.
The AAO's caseload data is described in further detail in the table below. The AAO is working to
integrate AADR into the Department's Tax System Modernization (TSM) project. Once the
integration is complete, taxpayers will be able to electronically file their appeal applications with
the AAO. For more information about the program, please visit our website at
tax.hawaii.gov/appeals.
AAO Caseload for Fiscal Year 2017
Type of Case Cases
Received
Cases
Closed1
Cases Pending
June 30, 2017
General Excise/Use Tax 33 24 12
Income Tax 42 29 20
Other2 11 9 2
Total Cases 86 62 34
1Cases closed includes cased received in Fiscal Year 2016. 2"Other" cases involve miscellaneous tax types such as franchise tax and transient accommodations
tax and cases where multiple tax types were appealed.
3.2 BOARDS OF TAXATION REVIEW
Each taxation district has an administrative (i.e., non-judicial) Board of Taxation Review consisting
of five members. Tax disputes that are not resolved at the district tax office level may be appealed
to a Board of Taxation Review unless the dispute involves the Constitution or laws of the United
States. Statewide, the boards began the fiscal year with 206 pending tax appeals. During FY 2017,
27 new appeals were filed, 8 appeals withdrawn, and 29 appeals settled; a total of 196 appeals to the
Boards of Taxation Review were pending at the end of the fiscal year.
64
The following table details appeals to the Boards of Taxation Review by taxation district:
Taxation District Total
First Second Third Fourth
Field Audit Office Audit
Appeals Pending (Beginning) 96 33 49 19 9 206
New Appeals 10 10 6 1 0 27
Appeals Withdrawn 4 1 2 1 0 8
Appeals Settled 11 0 11 7 0 29
Appeals Pending (Ending) 91 42 42 12 9 196
3.3 CIVIL DECISIONS, SETTLEMENTS AND OTHER LEGAL MATTERS
Matters Closed
During the last fiscal year, the Tax & Charities Division (“Division”) closed 826 Tax Department-
related legal matters (excluding legislative matters in our case management system that the
Department’s Legislative Division has not closed).
Appeals - 17
Bankruptcies - 435
Contracts - 32
Foreclosures - 236
Legislation (None closed yet)
Miscellaneous - 56
Opinions - 23
Quiet Title - 8
Subpoenas - 19
Amounts Collected
Last fiscal year, the Division collected the following amounts5:
Tax Appeals $ 66,214.39
Foreclosures $ 357,180.01
Bankruptcies $ 1,160,456.10
Trusts $ 22,508.38
Miscellaneous $ 163,468.20
TOTAL: $ 1,769,827.08
5 The Division also secured the dismissal of several tax appeals that would have potentially resulted in refunds to
taxpayers from the General Fund and won cases on appeal that will have fiscal impact on similarly situated taxpayers and
result in future tax collections that are impossible to forecast.
65
3.2.1 Settled Cases
Tax Appeal Court
In the Matter of the Tax Appeal of CBIP, Inc., Case No. 09-0203, Tax Appeal Court, State of
Hawaii.
Taxpayer appealed general excise tax assessments. The parties initially filed a stipulation for
partial dismissal of the case. In the appeal that remained, Taxpayer argued that: (1) the
assessment erroneously included general excise tax on amounts that were not gross income
but, rather, were rebates of expenses; and (2) penalties were erroneous because non-filing
and/or underpayment was not due to negligence or intentional disregard of rules. The parties
settled the remaining claims and filed a stipulation to dismiss the case.
In the Matter of Taxpayer Appeal of Stephen A. Cipres, Case Nos. 11-1-0084, 12-1-0436, 12-1-
0437, Tax Appeal Court, State of Hawaii.
Taxpayer challenged the Department’s general excise tax assessments on the basis that the
Department incorrectly increased his commissions for certain years and misinterpreted and
misapplied the penalty provisions in the Hawaii Revised Statutes. This case was settled.
In the Matter of Charles A. Shipman, Jr., Case No. 13-1-0301, Tax Appeal Court, State of Hawaii.
Taxpayer appealed his tax assessment for general excise and transient accommodation taxes
stating the assessed amounts were speculative/inflated and included improper stacking of
failure to file penalties with negligence penalties. The parties agreed to dismiss this case.
Maria E. Zielinski v. Chester M. and Prudence S. Kanehira, Case No. 1 T.X. 15-1-0227
Maria E. Zielinski v. Fred M. and Shirfeir S. Sunada, Case No. 1 T.X. 15-1-0226
Maria E. Zielinski v. Dale and Alison Ohama, Case No. 1 T.X. 15-1-0231
Maria E. Zielinski v. Morris S. and Jeanne A. Creel, Case No. 1 T.X. 15-1-0232
Maria E. Zielinski v. Mark W. Baker and Lisa A. Hendrickson, Case No. 1 T.X. 15-1-0225; Tax
Appeal Court, State of Hawaii;
Maria E. Zielinski v. Timothy M. and Iwalani O. Dayton, Case No. 1 T.X. 15-1-0229; Tax Appeal
Court, State of Hawaii;
Maria E. Zielinski v. Predrag & Doris Miocinovic, Case No. 1 T.X. 15-1-0234; Tax Appeal Court,
State of Hawaii; and
Maria E. Zielinski v. Neal S. and Linda Takase, Case No. 1 T.X. 15-1-0235; Tax Appeal Court,
State of Hawaii.
In these cases, the Director of Taxation appealed decisions of the Board of Review. The
Department denied Taxpayers’ fully refundable Renewable Energy Technologies tax credits
under Haw. Rev. Stat. § 235-12.5 because Taxpayers’ adjusted gross incomes exceeded the
statutory threshold entitling them to a fully refundable credit. The Board of Review ruled
that Taxpayers could revoke their elections to receive refundable tax credits. These cases
were settled.
In the Matter of Red Time Realty, LLC, Case No. 1 TX 15-1-0261, Tax Appeal Court, State of
Hawaii.
Taxpayer appealed from a final assessment of general excise tax on gross income under
Haw. Rev. Stat. §§ 237-38 and 237-39. The parties agreed to dismiss this case.
66
In the Matter of the Tax Appeal of New Cingular Wireless, Case No. 1 T.X. 15-1-0241, Tax Appeal
Court, State of Hawaii.
Taxpayer filed refund claims for the public service tax it paid to the State. Taxpayer claimed
it paid the tax on amounts not subject to the PSC. The Director denied the refund claims as
they were barred by the statute of limitations. This case was settled.
In the Matter of the Tax Appeal of Andrew Bernstein and Jacqueline S. Showback, Case No. 1 T.X.
15-1-0249, Tax Appeal Court, State of Hawaii.
Taxpayers appealed from a final assessment reducing their renewable energy tax credit
under Haw. Rev. Stat. § 235-12.5. This case was dismissed by stipulation.
In re Tax Appeal of Edward K. Fuller, Case No. 1 T.X. 15-1-0270, Tax Appeal Court, State of
Hawaii;
In re Tax Appeal of Edward K. Fuller, Case No. 1 T.X. 15-1-310, Tax Appeal Court, State of
Hawaii; and
In re Tax Appeal of Fuller Anesthesia, LLC, Case No. 1 T.X. 15-1-0309, Tax Appeal Court, State
of Hawaii.
These three cases involve the same Taxpayer and his LLC, appealing general excise and
income taxes for fiscal years 2006 through 2013, inclusive. The Department assessed
Taxpayers after it disallowed Taxpayers’ claims of the wholesale rate and certain
deductions. These cases were settled.
3.2.2 Closed Cases
Tax Appeal Court
In the Matter of the Tax Appeal of Kamaaina’s Food Service, Inc., Case Nos. 12-1-0237 and 12-1-
0244 (Consolidated), Tax Appeal Court, State of Hawaii.
Taxpayer was assessed general excise tax and county surcharge when applicable, for
unreported service income for tax years 1987 through 1992, 1994, 1995, 1997, 1998, and
2000 through 2009, inclusive, and/or imposed a 25 percent penalty for failure to file and a
25 percent penalty due to negligence or intentional disregard of rules. Taxpayer was
assessed for general excise tax for unreported service income for tax years 1993, 1996, and
1999; the Department imposed a 25 percent penalty for failure to file and a 25 percent
penalty due to negligence or intentional disregard of rules. Taxpayer disputed the
assessments, arguing that the imposition of both penalties is not authorized by statute. The
Court granted Director’s motions for summary judgment.
In the Matter of the Tax Appeal of Barbara Gilliss, Case No. 12-1-0303, Tax Appeal Court, State of
Hawaii.
Taxpayer was assessed general excise and county surcharge taxes, when applicable, for
rental income in tax years 2002 through 2011, inclusive. Taxpayer argued that the penalties
and interest should be waived. The Department filed a motion for summary judgment that
was heard and granted on April 18, 2016.
67
In re Tax Appeal of David J. Scroggin and Genya G. Scroggin, Case No. 1 T.X. 15-1-0286, Tax
Appeal Court, State of Hawaii.
Director prevailed on a motion to dismiss for failure to properly serve this appeal.
Subsequently, after the Order granting the motion and Judgment were filed, Taxpayers filed
a motion to set aside the dismissal claiming that they did not receive notice of the hearing on
the Motion to Dismiss. The Taxpayers’ Motion to Set Aside was denied.
In the Matter of the Tax Appeal of Steve F. Klein and Krista S. Bridges, Case No. 1 T.X. 15-1-
0322, Tax Appeal Court, State of Hawaii.
Taxpayers appealed the disallowance of the Renewable Technologies Income Tax Credit
under section Haw. Rev. Stat. 235-12.5 for failing to timely claim the credit. A notice of
dismissal was filed.
In the Matter of the Tax Appeal of Haruki and Kayoko Higashitai, Case No. 1 T.X. 16-1-0324, Tax
Appeal Court, State of Hawaii.
Taxpayer appealed income tax assessments disallowing itemized deductions for insufficient
substantiation. Taxpayers also claimed that the notice of proposed assessment were not
mailed to their current address and did not provide for translation services. The Court
granted the Director’s motion to dismiss.
3.2.3 Pending Appeals
Hawaii Supreme Court
In the Matter of Priceline.com, SCAP No. 17-0000367, Supreme Court, State of Hawaii. (and
consolidated cases).
These consolidated tax appeals are by online travel companies Priceline.com,
Travelocity.com, Orbitz.com, Hotels.com (“OTCs”) from assessments of general excise tax,
penalties and interest for the OTCs’ rental motor vehicle transactions in the State for tax
years 2000 through 2013, inclusive. The Department assessed the OTCs for their “stand
alone” car rentals as well as car rentals included as part of travel or tour packages. The
Department and various taxpayers filed cross-appeals of the tax appeal court ruling. The
parties submitted briefs to the Hawaii Supreme Court. No oral argument has been set.
Tax Foundation of the State of Hawaii, Inc. v. State of Hawaii, CAAP-16-0000462, Intermediate
Court of Appeals, State of Hawaii.
In this case, the Tax Foundation of the State of Hawaii brought an action for injunctive and
mandamus relief. At issue is the county surcharge on state tax, Haw. Rev. Stat. § 248-2.6,
that requires the Department of Budget and Finance to transfer ten percent of the amount
collected to the general fund to reimburse the Department of Taxation’s costs of assessment
and collection of the surcharge. Plaintiff argued that amounts transferred to the general fund
exceed the Department of Taxation’s actual costs and expenses. Under these facts, Plaintiff
alleges that the statute violates the due process and equal protection clauses of the United
States Constitution. The complaint seeks refunds on Plaintiff’s behalf and on behalf of the
City and County of Honolulu. The Department moved to dismiss the complaint for lack of
subject matter jurisdiction. The complaint was dismissed and Plaintiff appealed to the
Hawaii Supreme Court. The Hawaii Supreme Court heard oral arguments on July 6, 2017
and has not issued a ruling to date.
68
Intermediate Court of Appeals
In the Matter of the Tax Appeal of CompUSA Inc., CAAP No. 15-0000861, Intermediate Court of
Appeals, State of Hawaii.
Taxpayer appealed from the disallowance of a use tax refund request for tax years 2006,
2007, and 2008. Taxpayer argues that under the commerce and equal protection clauses of
the United States Constitution the imposition of Hawaii's use tax is unconstitutional. The
Tax Appeal Court determined that the use tax is constitutional under the commerce and
equal protection clauses of the United States Constitution. The issues were fully briefed and
the parties are waiting for a decision from the Intermediate Court of Appeals.
Tax Appeal Court
In the Matter of the Tax Appeals of TMI Management, Inc., Case Nos. 09-0071 and 09-0072, Tax
Appeal Court, State of Hawaii.
Taxpayer was assessed additional general excise taxes on amounts received for performing
work for the federal government. Taxpayer argues, among other things, that the disputed
income was exempt because Taxpayer was an employee leasing company and the disputed
income was for salaries and expenses of leased employees. This case has been taken off the
trial ready calendar to give the parties time to work on settlement.
In the Matter of the Tax Appeals of Bernard & Ellen Fuller and South Pacific Builders, Ltd., Case
Nos. 09-0087, 09-0088, and 09-0089, Tax Appeal Court, State of Hawaii.
Taxpayers were assessed additional general excise and net income taxes on amounts
received for performing work within the state. Taxpayers argue, among other things, that the
disputed income was exempt because Taxpayers paid certain amounts to other contractors.
Trial is set for July 16, 2018.
In the Matter of Tax Appeal of James J. Richard & Rachael D. Richard, Case No. 10-1-1805, Tax
Appeal Court, State of Hawaii.
Taxpayers were assessed additional income and general excise taxes. Taxpayers challenged
the Department's reclassification and recalculation of its liability that was based on
Taxpayers' IRC § 338(g) election on a sale of a business. The basis of Taxpayers' claim is
that they made an election error on the Form 8023 and the parties to the sale intended an
IRC § 338(h) (10) election instead of the IRC § 338(g) election. Taxpayers also challenge
the Department's reclassification of income that changed the amount received as personal
loans and/or advances from their business to wages. The case was taken off the trial ready
calendar to give the parties time to work on settlement.
In the Matter of the Tax Appeal of JN Group, Inc., Case No. 10-1808, Tax Appeal Court, State of
Hawaii.
Taxpayer appeals general excise assessments for tax years ending March 31, 1998 through
March 31, 2006, inclusive. Taxpayer claims that the amounts assessed constituted
reimbursements that were exempt under Haw. Rev. Stat. § 237-20 the assessments of
penalties were erroneous because any non-filing or underpayment was not due to negligence
or intentional disregard of rules; the assessments violated the due process, commerce, and/or
equal protection clauses of the United States Constitution and the Constitution of the State
of Hawaii. Trial is set for June 25, 2018.
69
In the Matter of the Tax Appeal of Patrick O’Brien, Case No. 11-1-0013, Tax Appeal Court, State
of Hawaii.
Taxpayer was assessed additional income taxes for unreported schedule C income from a
single member LLC the Taxpayer owned. Taxpayer denies the income is taxable to him.
Taxpayer’s counsel has withdrawn from this case and Taxpayer is seeking new counsel.
Trial is set for August 20, 2018.
In the Matter of the Tax Appeal of Security Resources, LLC, Case No. 11-1-0014; Tax Appeal
Court, State of Hawaii.
Taxpayer was assessed additional general excise taxes for underreporting the amount of
gross receipts it received. Taxpayer claims the assessments are overstated and that it is
entitled to be taxed at the wholesale rate of .5 percent. Taxpayer also claims some of its
sales are exempt because they were sales of tangible personal property to the federal
government. Taxpayer’s counsel has withdrawn from this case and Taxpayer is seeking new
counsel. Trial is set for August 20, 2018.
In the Matter of the Tax Appeal of Ronald Au, Case No. 11-1-0144, Tax Appeal Court, State of
Hawaii.
Taxpayer filed a petition to compel the Board of Review to prepare findings of fact and
conclusions of law. The court denied the petition but granted leave to the Taxpayer to file a
notice of appeal from general excise tax assessments for the period 2002 through 2005,
inclusive, totaling $175,000.00. The Tax Appeal Court granted the Department of
Taxation’s motion to dismiss the appeal for lack of subject matter jurisdiction by order filed
February 29, 2012; however, the Court granted Taxpayer’s motion for reconsideration of the
dismissal. The Court has taken the State’s motion for summary judgment under advisement
and a trial date has been scheduled for February 26, 2018.
In the Matter of the Tax Appeal of Julie A. Dunham, Case No. 12-1-0390, Tax Appeal Court, State
of Hawaii.
Taxpayer was assessed general excise and income taxes on non-filed returns for 1999
through 2010, inclusive. Taxpayer argues that the Department’s income figures are
incorrect. Trial is set for September 10, 2018.
In the Matter of the Tax Appeal of Ronald Au, Case No. 1 T.X. 12-1-0393, Tax Appeal Court, State
of Hawaii.
Taxpayer appeals the Department's income tax assessments on unreported income received
for tax years 2008 and 2009. Trial is set for October 11, 2017.
In the Matter of the Tax Appeal of William A. Bartenstein, Case No. 13-1-0228, Tax Appeal Court,
State of Hawaii.
Taxpayer was assessed additional general excise and/or use taxes, penalties and interest on
goods imported for resale. Taxpayer argues that the Department’s income figures were
incorrect and the stacking of the negligence and underpayment penalties was erroneous.
Trial is set for March 12, 2018.
In the Matter of the Tax Appeal of Ronald Au, Case No. 1 T.X. 14-1-0216, Tax Appeal Court, State
of Hawaii.
Taxpayer appeals to the Tax Appeal Court, State of Hawaii from assessments of general
70
excise taxes for 2009 and 2010 in the amount of $13,114.62. The Department moved to
dismiss the tax appeal because it was not timely filed and because Taxpayer failed to pay the
assessment in his appeal from the Board of Review. The motion was heard on March 17,
2014 and taken under advisement. Trial is scheduled for December 11, 2017.
In the Matter of the Tax Appeal of Skydiving School, Inc., Case Nos. 1 T.X. 14-1-0217 and 1 T.X.
14-1-0218, Tax Appeal Court, State of Hawaii.
Taxpayer appeals from the denial of a refund claim and assessments of general excise taxes
related to its skydiving business. Taxpayer’s major issue is that its gross receipts from
skydiving activities is not subject to the general excise tax because of federal preemption
under the Anti-Head Tax Act, P.L. 103-272, 108 Stat. 1111, as amended, and as codified in
49 U.S.C. § 40116. Trial is set for November 27, 2017. The parties are working on an
agreement to submit the matter on briefs in lieu of a trial.
In the Matter of the Tax Appeal of Edward A. Alquero, M.D., Inc., Case No. 1 T.X. 14-1-0219, Tax
Appeal Court, State of Hawaii.
Taxpayer was assessed additional income and general excise taxes, penalties, and interest
for underreported income related to his medical practice. Taxpayer claims he is entitled to
deductions for certain expenses that were disallowed by the Department. Trial is set for
January 22, 2018.
In the Matter of the Tax Appeal of Avery B. Chumbley, Case No. 1 T.X. 14-1-0226, Tax Appeal
Court, State of Hawaii.
Taxpayer was assessed general excise taxes and interest for underreported gross receipts of a
non-profit organization’s fund raising activities. Taxpayer was assessed personally as the
president of the organization at the time. Taxpayer claims he was entitled to deductions for
certain expenses that were disallowed by the Department. Trial is set for April 23, 2018.
In the Matter of the Tax Appeal of Darren Truitt, Case No. 1 T.X. 14-1-0228, Tax Appeal Court,
State of Hawaii.
Taxpayer appeals the Department’s assessment of additional income taxes, penalties, and
interest for income attributed to his wholly-owned LLC. Trial is set for June 4, 2018.
In the Matter of the Tax Appeal of Construction Servs. & Management LLC, Case No. 1 T.X. 14-1-
0229, Tax Appeal Court, State of Hawaii.
Taxpayer appeals the Department’s assessment of general excise taxes, penalties, and
interest for underreported gross receipts. Trial is set for June 24, 2018.
In the Matter of the Tax Appeal of Hawaiian Telcom Services Company, Inc., Case No. 1 14-1-
0231, Tax Appeal Court, State of Hawaii;
In the Matter of the Tax Appeal of Hawaiian Telcom Services Company, Inc., Case No. 1 15-1-
0245, Tax Appeal Court, State of Hawaii; and
In the Matter of the Tax Appeal of Hawaiian Telcom Services Company, Inc., Case No. 1 16-1-
0321, Tax Appeal Court, State of Hawaii.
Taxpayer appeals the denial of use tax refund claims. Taxpayer claims that Haw. Rev. Stat.
§§ 238-2 and 238-2.3 impermissibly imposes use tax in violation of the commerce clause
and the equal protection clause of the United States Constitution; the statutes discriminate
against interstate commerce and are not fairly apportioned; and that Taxpayer erroneously
paid use taxes with respect to services and/or contracting performed within the state by a
71
licensed seller. Trial is not set.
In the Matter of the Tax Appeal of Hawaiian Telcom, Inc., Case No. 1 T.X. 14-1-0232, Tax Appeal
Court, State of Hawaii;
In the Matter of the Tax Appeal of Hawaiian Telcom, Inc., Case No. 1 T.X. 15-1-0244, Tax Appeal
Court, State of Hawaii; and
In the Matter of the Tax Appeal of Hawaiian Telcom, Inc., Case No. 1 T.X. 16-0322, Tax Appeal
Court, State of Hawaii.
Taxpayer appeals the denial of use tax refund claims. Taxpayer claims that Haw. Rev. Stat.
§§ 238-2 and 238-2.3 impermissibly imposes use tax in violation of the commerce clause
and the equal protection clause of the United States Constitution; the statutes discriminate
against interstate commerce and are not fairly apportioned; and that Taxpayer erroneously
paid use taxes with respect to services and/or contracting performed within the state by a
licensed seller. Trial is not set.
In the Matter of the Tax Appeal of Hawaiian Telcom Communications, Inc., Case No. 1 T.X. 16-1-
0323, Tax Appeal Court, State of Hawaii.
Taxpayer appeals the denial of use tax refund claims. Taxpayer claims that Haw. Rev. Stat.
§§ 238-2 and 238-2.3 impermissibly imposes use tax in violation of the commerce clause
and the equal protection clause of the United States Constitution; the statutes discriminate
against interstate commerce and are not fairly apportioned; and that Taxpayer erroneously
paid use taxes with respect to services and/or contracting performed within the state by a
licensed seller. Trial is not set.
In the Matter of the Tax Appeal of Hawaiian Electric Company, Inc., Case No. 1 T.X. 14-1-0233,
Tax Appeal Court, State of Hawaii;
In the Matter of the Tax Appeal of Hawaiian Electric Company, Inc., Case No. 1 T.X. 15-1-0296,
Tax Appeal Court, State of Hawaii; and
In the Matter of the Tax Appeal of Hawaiian Electric Company, Inc., Case No. 1 T.X. 16-1-0316,
Tax Appeal Court, State of Hawaii.
Taxpayer appeals the denial of use tax refund claims. Taxpayer claims that Haw. Rev. Stat.
§§ 238-2 and 238-2.3 impermissibly imposes use tax in violation of the commerce clause
and the equal protection clause of the United States Constitution and that the statutes
discriminate against interstate commerce and were not fairly apportioned. Trial is not set.
In the Matter of the Tax Appeal of BAE Systems Holdings, Inc. & Subs, Case No. 1 T.X. 14-1-
0234, Tax Appeal Court, State of Hawaii.
Taxpayer’s claims for the High Tech Credit provided under Haw. Rev. Stat. § 235-110 were
denied because Taxpayer did not make an investment as defined by statute. Taxpayer
prevailed at the Board of Review and the Department filed this appeal. Trial is set for
November 19, 2018.
In the Matter of the Tax Appeal of Hawaiian Airlines, Inc., Case No. 1 T.X. 14-1-0258, Tax Appeal
Court, State of Hawaii.
Taxpayer appeals the denial of use tax refund claims. Taxpayer claims that Haw. Rev. Stat.
§§ 238-2 and 238-2.3 impermissibly imposes use tax in violation of the commerce clause
and the equal protection clause of the United States Constitution and that the statutes
discriminate against interstate commerce and are not fairly apportioned. Trial is not set.
72
In the Matter of the Tax Appeal of Hawaii Electric Light Company, Inc., Case No. 1 T.X. 14-1-
0259, Tax Appeal Court, State of Hawaii;
In the Matter of the Tax Appeal of Hawaii Electric Light Company, Inc., Case No. 1 T.X. 15-1-
0297, Tax Appeal Court, State of Hawaii; and
In the Matter of the Tax Appeal of Hawaii Electric Light Company, Inc., Case No. 1 T.X. 16-1-
0317, Tax Appeal Court, State of Hawaii.
Taxpayer appeals the denial of use tax refund claims. Taxpayer claims that Haw. Rev. Stat.
§§ 238-2 and 238-2.3 impermissibly imposes use tax in violation of the commerce clause
and the equal protection clause of the United States Constitution and that the statutes
discriminate against interstate commerce and are not fairly apportioned. Trial is not set.
In the Matter of the Tax Appeal of Maui Electric Company, Inc., Case No. 1 T.X. 14-1-260, Tax
Appeal Court, State of Hawaii;
In the Matter of the Tax Appeal of Maui Electric Company, Inc., Case No. 1 T.X. 15-1-0298, Tax
Appeal Court, State of Hawaii; and
In the Matter of the Tax Appeal of Maui Electric Company, Inc., Case No. 1 T.X. 16-1-0315, Tax
Appeal Court, State of Hawaii.
Taxpayer appeals the denial of use tax refund claims. Taxpayer claims that Haw. Rev. Stat.
§§ 238-2 and 238-2.3 impermissibly imposes use tax in violation of the commerce clause
and the equal protection clause of the United States Constitution and that the statutes
discriminate against interstate commerce and are not fairly apportioned. Trial is not set.
In re Tax Appeal of Longs Drug Stores Ca., LLC, Case No. 1 T.X. 14-1-0240, Tax Appeal Court,
State of Hawaii;
In re Tax Appeal of Longs Drug Stores Ca., LLC, Case No. 1 T.X. 15-1-0237, Tax Appeal Court,
State of Hawaii; and
In re Tax Appeal of Longs Drug Stores Ca., LLC, Case No. 1 T.X. 16-1-0314, Tax Appeal Court,
State of Hawaii.
These cases are on hold pending the outcome of In the Matter of the Tax Appeal of
CompUSA Inc., Case Nos. 12-1-0264, 12-1-0265, Tax Appeal Court, State of Hawaii. No
trial date will be set until the Tax Appeal Court is notified of a decision in the CompUSA
matter.
In the Matter of the Tax Appeal of Home Depot U.S.A., Inc., Case No. 1 T.X. 15-1-0218, Tax
Appeal Court, State of Hawaii.
Taxpayer appeals the Department’s disallowance of the wholesale rate on general excise
taxes due on sales to customers at its retail stores as well as the Department’s denial of the
subcontractor deduction related to work performed for customers. Trial is set for November
19, 2018.
In the Matter of the Tax Appeal of Dan S. Tetsutani, Case No. 1 T.X. 15-1-0219, Tax Appeal
Court, State of Hawaii.
Taxpayer appeals from a final assessment of additional general excise tax and/or use taxes
stating the assessments were improper or in the alternative that Taxpayer should pay the
wholesale rate of .5 percent. Trial is set for December 4, 2017.
73
Maria E. Zielinski v. Blake and Bianca Goodman, Case No. 1 T.X. 15-1-0221; Tax Appeal Court,
State of Hawaii.
The Department denied Taxpayers’ fully refundable Renewable Energy Technologies tax
credits under Haw. Rev. Stat. § 235-12.5 because Taxpayers’ adjusted gross income
exceeded the statutory threshold entitling them to a fully refundable credit. The Board of
Review ruled that Taxpayers could revoke their elections to receive refundable tax credits.
Cross motions for summary judgment were heard on July 17, 2017 and the court has not
ruled yet. Trial was taken off the trial ready calendar.
In re Tax Appeal of Escal Institute of Advanced Technologies, Inc., Case No. 1 T.X. 15-1-0276,
Tax Appeal Court, State of Hawaii.
Taxpayer, for itself and its shareholders, appeals assessments on tax years 2008 and 2010
for income tax refunds denied; 2011 through 2013, inclusive, for income taxes assessed; and
2008, 2009, 2011 through 2013, inclusive, for general excise taxes assessed, alleging that
refunds to shareholders were wrongly denied. Additionally, Taxpayer alleges that income
taxes and general excise taxes were assessed on income from services performed outside
Hawaii. Trial is scheduled for November 26, 2018.
In the Matter of Charles Mixon, Case No. 1 T.X. 15-1-0281, Tax Appeal Court, State of Hawaii.
Taxpayer appeals from a final assessment of general excise tax for underreported income
under Haw. Rev. Stat. § 237-13(6)(A). Trial is set for January 8, 2018.
In re Tax Appeal of Pacific Isles Equipment Rental Inc., Case No. 1 T.X. 15-1-0315, Tax Appeal
Court, State of Hawaii.
Taxpayer’s President, a non-attorney, initially filed a Notice of Appeal of general excise
taxes for tax years 2010, 2011, and 2012 and made payment “under protest.” Taxpayer hired
an attorney who filed a Complaint for Refund of Taxes in the tax appeal case. A motion to
dismiss was granted in part and denied in part; the appeal survived. Taxpayer claims that
pursuant to Haw. Rev. Stat. § 237-13, the 0.5 percent wholesale rate applies rather than the
4.5 percent contracting rate. Trial is not set.
In re Tax Appeal of Jeffrey Scott Lindner, Case No. 1 T.X. 16-1-0300, Tax Appeal Court, State of
Hawaii.
Taxpayer appeals income taxes for tax years 2012 through 2014, inclusive. Taxpayer claims
that he properly filed returns to qualify for HTBITC credits per Haw. Rev. Stat. § 235-
110.9; however, the Department claims that it did not receive the returns. Trial is not set.
In re Tax Appeal of WC Maui Coast, LLC, Case No. 1 T.X. 16-1-0271, Tax Appeal Court, State of
Hawaii.
Taxpayer appeals application of transient accommodations tax assessments for tax years
2012 and 2013 pursuant to Haw. Rev. Stat. § 237D-2. Taxpayer claims that amounts
received from long term contracts with airlines are exempt from Transient accommodations
taxes based on AG Opinion 90-6. Trial is scheduled for January 11, 2018.
In the Matter of the Tax Appeal of Polynesian Cultural Center, Case No. 1 T.X. 16-1-0290, Tax
Appeal Court, State of Hawaii.
Taxpayer appeals the Department’s assessment of additional general excise taxes based on
the disallowance of the income splitting provisions allowed under Haw. Rev. Stat. § 237-
74
18(f). Trial is not set.
In re Tax Appeal of Thomas Aki, Case No. 1 T.X. 16-1-0291, Tax Appeal Court, State of Hawaii.
Taxpayer appeals income tax assessments for tax years 2012, 2013, and 2014 in which the
Department disallowed business expenses and deductions under Haw. Rev. Stat. chapter
235, disallowed the personal exemption deduction, and disallowed the application of losses
from prior years. Trial is not set.
In re Tax Appeal of Editha C. Doctolero, Case No. 1 T.X. 16-1-0292, Tax Appeal Court, State of
Hawaii.
Taxpayer runs a wholesale flower-selling business and failed to fully pay general excise
taxes on tax years 2001, 2003, and 2005 through 2013, inclusive. Taxpayer argues that the
twelve-month limitation under Haw. Rev. Stat. § 237-9.3, HRS, does not apply because the
wholesale rate is not a tax benefit subject to denial under Haw. Rev. Stat. § 237-9.3, but
rather the regular rate of tax on wholesale sales. Trial is not set.
In the Matter of the Tax Appeal of Howard T. Chang and Jenifer M. Chang, Case No. 1 T.X. 16-1-
0318, Tax Appeal Court, State of Hawaii.
Taxpayers appeal final assessments of income taxes based on gambling winnings without
offset of gambling losses. Trial is not set.
In the Matter of the Tax Appeal of Gary Takahashi Sports Marketing Inc., Case No. 1 T.X. 16-1-
0319, Tax Appeal Court, State of Hawaii.
Taxpayer appeals final assessments of general excise tax based on information obtained
from the Internal Revenue Service. Taxpayer claims that assessments were improper
because all sales occurred outside of Hawaii. Trial is not set.
In the Matter of the Tax Appeal of Gary K. Takahashi, Case No. 1 T.X. 16-1-0320, Tax Appeal
Court, State of Hawaii.
Taxpayer appeals final assessments of general excise tax based on information obtained
from the Internal Revenue Service. Taxpayer claims that the assessments should have been
made on Gary Takahashi Sports Marketing Inc. and not on him individually. Trial is not set.
In the Matter of the Tax Appeal of Fung Yang, Case No. 1 T.X. 16-1-0325, Tax Appeal Court,
State of Hawaii.
Taxpayer claims the solar credit for a photovoltaic system used to operate chillers for his
farming operation. The Department disallowed the credit because (1) the credit was
improperly claimed for equipment not related to the photovoltaic system; and (2) it was not
clear that the system was installed for nonresidential use. Trial is not set.
In the Matter of the Tax Appeal of Woodley L. Hunt; Gayle G. Hunt; Hunt ELP, Ltd.; Hunt
Companies, Inc.; HB GP, LLC; Marion L. Hunt; and Norma H. Hunt, Case No. 1 T.X. 16-1-0340,
Tax Appeal Court, State of Hawaii.
Taxpayers appeal income tax assessments for underreported taxable income due to
understatement of partnership’s capital gains received from sale of real property in Hawaii.
Taxpayers argue that the capital gains in question should be excluded from the Hawaii sales
factor numerator and denominator for apportionment purposes. Trial is not set.
75
In the Matter of the Tax Appeal of Amerisourcebergen Drug Corporation, Case Nos. 1 T.X. 17-1-
0218 -1 T.X. 17-1-0222, Tax Appeal Court, State of Hawaii.
Taxpayer sold drugs to non-profit hospitals for resale and paid general excise tax on the
transactions at the wholesale rate. The Department assessed Taxpayer at the retail rate
because the non-profit hospitals did not pay four percent on their retail sales of the drugs.
Trial is not set.
In the Matter of the Tax Appeal of Janice P.C. Hori, Case No. 1 T.X. 17-1-1340, Tax Appeal Court,
State of Hawaii.
Taxpayer appeals final assessments of general excise taxes that were made based on
information obtained from Taxpayer’s income tax return. Taxpayer did not file general
excise tax returns for years listed on her income tax return. Trial is not set.
In the Matter of the Tax Appeal of Certified Erosion Control Hawaii LLC., Case No. 1 T.X. 17-1-
1341, Tax Appeal Court, State of Hawaii.
Taxpayer appeals final assessments of general excise tax claiming it was entitled to the
wholesale rate. Taxpayer was a non-filer and submitted unfiled returns with the auditor
during the audit phase. Although Taxpayer qualified for the wholesale rate, the rate was
disallowed because of Act 155. Trial is not set.
In the Matter of the Tax Appeal of Robert E. Atkinson, MD, Inc., Case No. 1 T.X. 17-1342, Tax
Appeal Court, State of Hawaii.
Taxpayer appeals final assessments of general excise tax of partnership payments. Trial is
not set.
In the Matter of the Tax Appeal of SMB I LLC, Case No. 1 T.X. 17-1-1343, Tax Appeal Court,
State of Hawaii.
Taxpayer appeals final assessments for the disallowance of the renewable energy
technologies income tax credit and the capital goods excise tax credit because the credits
were not properly claimed under Haw. Rev. Stat. §§ 235-12.5 and 235-110.7. The
Department’s Administrative Appeals Office is presently handling this case. Trial is not set.
In the Matter of the Tax Appeal of Samuel Fujikawa, Case No. 1 T.X. 17-1-1344, Tax Appeal
Court, State of Hawaii.
Taxpayers appeal final assessments for the disallowance of the renewable energy
technologies income tax credit and the capital goods excise tax credit because the credits
were not properly claimed under Haw. Rev. Stat. §§ 235-12.5 and 235-110.7. The
Department’s Administrative Appeals Office is presently handling this case. Trial is not set.
In the Matter of the Tax Appeal of Robert and Kimberli Fujikawa, Case No. 1 T.X. 17-1-1345, Tax
Appeal Court, State of Hawaii.
Taxpayers appeal final assessments for the disallowance of renewable energy technologies
income tax credit and the capital goods excise tax credit because the credits were not
properly claimed under Haw. Rev. Stat. §§ 235-12.5 and 235-110.7. The Department’s
Administrative Appeals Office is presently handling this case. Trial is not set.
76
In the Matter of the Tax Appeal Marc Unowitz and Ann Unowitz, Case No. 1 T.X. 17-1-1346, Tax
Appeal Court, State of Hawaii.
Taxpayers appeal final assessments for the disallowance of the renewable energy
technologies income tax credit and the capital goods excise tax credit because the credits
were not properly claimed under Haw. Rev. Stat. §§ 235-12.5 and 235-110.7. The
Department’s Administrative Appeals Office is presently handling this case. Trial is not set.
In the Matter of the Tax Appeal of Steven J. Bookatz and Debra S. Bookatz, Case No. 1 T.X. 17-
1347, Tax Appeal Court, State of Hawaii.
Taxpayers appeal final assessments of income based on gambling winnings that were not off
set by itemized deductions due to the cap set forth in Act 97, Session Laws of Hawaii 2011.
Trial is not set.
In the Matter of the Tax Appeal of Michelle Richardson, Case No. 1 T.X. 17-1-1349, Tax Appeal
Court, State of Hawaii.
Taxpayer appeals final assessments of income and general excise taxes that were based on
federal data because Taxpayer is a non-filer. Trial is not set.
In the Matter of the Tax Appeal of Hawaii & Lighting Rentals, Inc., Case No. 1 T.X. 17-1350, Tax
Appeal Court, State of Hawaii.
Taxpayer appeals final assessment of general excise taxes/use tax claiming it was entitled to
wholesale rate. Taxpayer would have qualified for wholesale rate but audit revealed that
Taxpayers customers either did not have a general excise license or did not file returns. Trial
is not set.
In the Matter of the Tax Appeal of Maui Fresh Fish Investors, LLC, Case No. 1 T.X. 17-1361, Tax
Appeal Court, State of Hawaii.
Taxpayer appeals a Board of Review’s decision that agreed with the Director who
disallowed credits that Taxpayer claimed for its investment in a Qualified High Technology
Business. Trial is not set.
In the Matter of the Tax Appeal of Saturn Development I, LLC fka PDC I, Inc., Case No. 1 T.X.
17-1-1362, Tax Appeal Court, State of Hawaii;
In the Matter of the Tax Appeal of Saturn Development, LLC fka Property Development Centers,
LLC, Case No. 1 T.X. 17-1-1363, Tax Appeal Court, State of Hawaii.
In these cases, Taxpayers appeal the denial of its conveyance tax refund claim. Taxpayers
allege that it entered into a tentative agreement to sell properties, some of which were still
under construction. It is claimed that the parties' tentative purchase price reflected
anticipated construction costs, and that this estimated purchase price was used in the original
Conveyance Tax Certificate and was subject to adjustment. Taxpayers later filed an
amended Conveyance Tax Certificate claiming the actual sales prices for some of the
parcels were lower than estimated and requested refunds for the overpayment of conveyance
tax, which the Department denied. Trial is not set.
In the Matter of the Tax Appeal of Escal Institute of Advanced Technologies, Inc., Case No. 1 T.X.
17-1-1374, Tax Appeal Court, State of Hawaii.
Taxpayer, for itself and its shareholders, appeals assessments on tax years 2012 and 2013
for income tax refunds denied, alleging that refunds to shareholders were denied.
77
Additionally, Taxpayer alleges that income taxes and general excise taxes were assessed on
income from services performed outside Hawaii. Trial is not set.
3.2.4 Criminal Investigations/Enforcement Actions
During FYE 2017, the Criminal Investigation Section (CIS) achieved substantial outcomes in
pursuing its investigative priorities. CIS conducted forty-two (42) investigations on entities with
legitimate sources of income and on individuals and criminal groups involved in illegal activities,
such as narcotics trafficking, gambling, prostitution, and other financial fraud. CIS conducted one
additional investigation relating to threats made against DOTAX employees.
CIS continues to work with the United States Attorney's Office for review and federal prosecution
of its investigations. During FYE 2017, one fraudulent refund case was adjudicated with the
defendant sentenced to twenty four (24) months imprisonment and $241,897 in restitution. The
United States Attorney’s Office also charged two tax preparer cases during this period.
CIS also actively works with County Prosecutors. During FYE 2017, the Hawaii County
Prosecutor's Office adjudicated a case involving a property management company with a conviction
for one count of Theft in the First Degree, ten counts of failure to file tax returns relating to General
Excise Taxes and Transient Accommodation Taxes and two counts of failure to collect and pay
over taxes. The defendant was ordered to serve six months imprisonment with four years of
probation and to pay restitution in the amount of $138,960 to her victims. The Honolulu
Prosecutor's Office adjudicated a case with a guilty plea to six counts of tax evasion. The defendant
was granted a deferral for a period of five years and was ordered to pay restitution in the amount of
$16,919.
During FYE 2017, CIS referred five cases to the Attorney General's Office for prosecution. Two of
the five cases are pending plea agreements and the remaining cases are pending further action. One
prosecution related to a local businessman with nine separate business entities who made
unsolicited admissions after the fact and filed General Excise Tax Returns with payments.
The other pending plea arrangement relates to a tax preparation firm. One tax protester case is
pending trial. CIS further concluded a prior FYE 2016 criminal case with a civil settlement of over
$175,000.
CIS is currently investigating other tax preparers covering all of the islands. These cases will be
referred to the Attorney General's Office upon completion. CIS continues to pursue investigations
on mainland companies doing business in the State of Hawaii and on individuals and criminal
groups involved in illegal activities.
Completed investigations that were not referred for criminal prosecution were turned over to the
appropriate Oahu Office Audit Branch, Field Audit Branch or Outer Island District Offices for
further civil examination. Over four hundred referrals were made for civil assessments. For FYE
2017, these referrals amounted to over $984,976 in additional assessments. These assessments were
mutually exclusive to those made for prior-year adjudicated criminal cases.
During FYE 2017, the Criminal Investigation Section continued to promote voluntary compliance
through the aggressive enforcement of Hawaii Tax Laws and Regulations. CIS contributed

78
$872,380 in criminal collections in FYE 2017. The Criminal Investigation Section continues to
innovate its investigative approach and to strive to improve its processes for the Department of
Taxation.
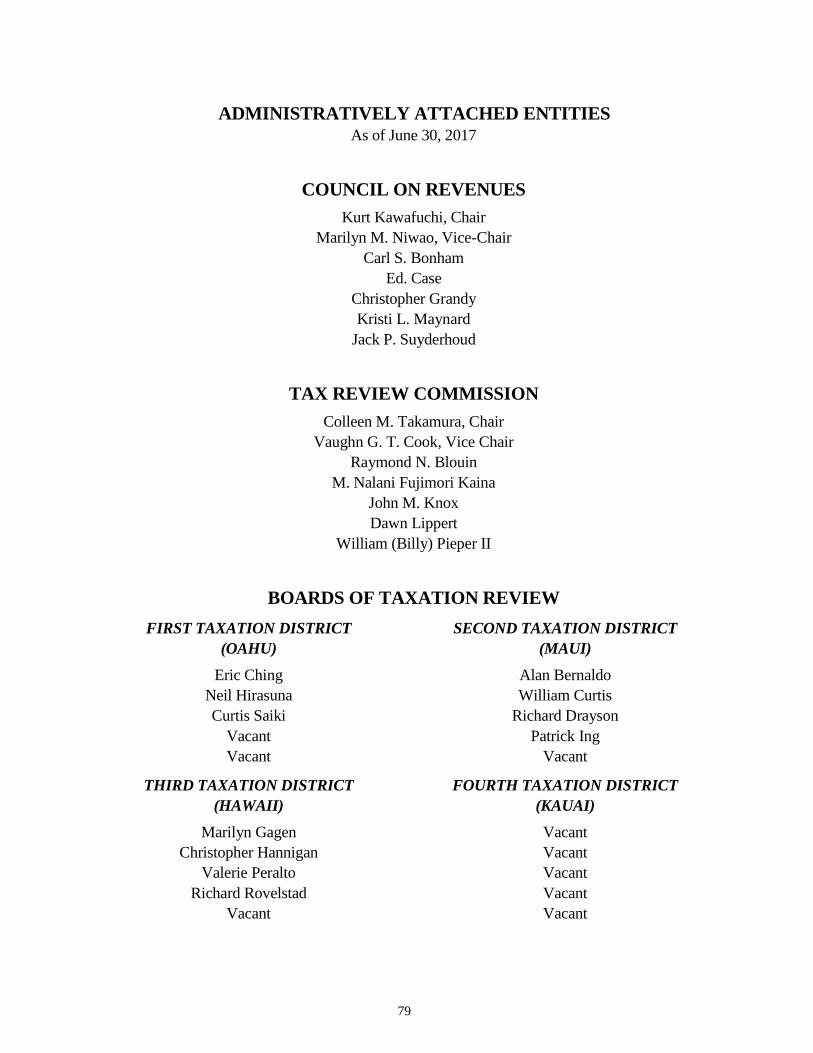
79
ADMINISTRATIVELY ATTACHED ENTITIES As of June 30, 2017
COUNCIL ON REVENUES
Kurt Kawafuchi, Chair
Marilyn M. Niwao, Vice-Chair
Carl S. Bonham
Ed. Case
Christopher Grandy
Kristi L. Maynard
Jack P. Suyderhoud
TAX REVIEW COMMISSION
Colleen M. Takamura, Chair
Vaughn G. T. Cook, Vice Chair
Raymond N. Blouin
M. Nalani Fujimori Kaina
John M. Knox
Dawn Lippert
William (Billy) Pieper II
BOARDS OF TAXATION REVIEW
FIRST TAXATION DISTRICT
(OAHU)
Eric Ching
Neil Hirasuna
Curtis Saiki
Vacant
Vacant
THIRD TAXATION DISTRICT
(HAWAII)
Marilyn Gagen
Christopher Hannigan
Valerie Peralto
Richard Rovelstad
Vacant
SECOND TAXATION DISTRICT
(MAUI)
Alan Bernaldo
William Curtis
Richard Drayson
Patrick Ing
Vacant
FOURTH TAXATION DISTRICT
(KAUAI)
Vacant
Vacant
Vacant
Vacant
Vacant
Hawaii Individual
Income Tax
Statistics Tax Year 2015
DEPARTMENT OF TAXATION
STATE OF HAWAII
STATE OF HAWAII David Y. Ige, Governor
DEPARTMENT OF TAXATION Maria E. Zielinski, Director
Damien A. Elefante, Deputy Director TAX RESEARCH & PLANNING OFFICE Seth Colby, Tax Research & Planning Officer Shi Fu, Research Statistician
Hawaii Individual Income Tax Statistics
Tax Year 2015
DEPARTMENT OF TAXATION
STATE OF HAWAII
December 2017
Prepared by Tax Research and Planning Office
WEB SITE: tax.hawaii.gov
TABLE OF CONTENTS
Page
INTRODUCTION……………………………………………………………………………………… 1
HAWAII'S INDIVIDUAL INCOME TAX LAW AND THE INTERNAL REVENUE CODE…….. 1
STATE INDIVIDUAL INCOME TAX LEGISLATION…………………………………………….. 2
DATA SOURCE AND METHODOLOGY………………………………………………………….. 3
NUMBER OF TAX RETURNS FILED BY TYPE OF RETURN AND BY FILING STATUS… 4
HIGHLIGHTS OF STATISTICS FROM RESIDENT TAX RETURNS………………………….. 11
Resident Income and Adjustments…………………………………………………….. 11
State Resident Deductions and Personal Exemptions…………………………….. 16
State Resident Taxable Income and Tax Liability…………………………………… 18
HIGHLIGHTS OF STATISTICS FROM STATE NONRESIDENT TAX RETURNS…………… 21
State Nonresident Personal Exemptions and Deductions ………………………… 24
State Nonresident Taxable Income and Tax Liability............................................. 24
STATISTICS FROM STATE TAX RETURNS OF RESIDENTS AGED 65 OR OLDER…….. 25
STATISTICS FROM STATE TAX RETURNS OF DISABLED RESIDENTS…………………. 26
STATISTICS FROM STATE TAX RETURNS OF DEPENDENT RESIDENTS………………. 27
STATISTICS ON NET LONG-TERM CAPITAL GAINS…………………………………………. 28
TABLE OF CONTENTS (Continued)
Appendix Statistical Tables
TABLE A-1. Selected Data from State Resident Tax Returns by Hawaii AGI Class…
30
TABLE A-2. Selected Data from All State Tax Returns by Filing Status and Hawaii
AGI Class………………………………………………………………….………
31
TABLE A-3. Selected Data from State Nonresident Tax Returns by Hawaii AGI Class
33
TABLE A-4. Types of State Deductions by Hawaii AGI Class…………………………….
34
TABLE A-5. Number of Dependents, Number of Exemptions, Tax Withheld,
Payments of Declaration, Amounts Due, and Refunds and Carried
Forward Credits, by Hawaii AGI Class……………………………………….
37
TABLE A-6. Average State Tax Liabilities and Effective Tax Rates for Resident
Returns, Before and After Tax Credits, by Hawaii AGI Class……………
TABLE A-7. Hawaii AGI, State Taxable Income, Tax Liability, and Deductions Claimed
by Residents, by Tax District………………………………………………............….….….….
39
40
TABLE A-8. Sources of Income on All Returns by Hawaii AGI Class- 2015……… …. .…
41
1
Introduction
This study examines statistics from Hawaii income tax returns filed by Hawaii resident and nonresident taxpayers for tax year 2015. Nonresident taxpayers include part-year residents and nonresidents who have Hawaii individual income tax liabilities. The Department of Taxation (Department) has prepared annual studies on individual income tax statistics since 1958, but work on the studies was discontinued after 2008, owing to cutbacks in personnel in the wake of the Great Recession. The study for tax year 2012 was the first one published since the study for tax year 2005 was published in February of 2008.
Every individual doing business in the State must file an individual income tax return, whether or not the individual derives taxable income from the business. Additionally, every individual receiving gross income above a certain threshold amount must file a tax return. Generally, the threshold for resident taxpayers is the sum of the standard deduction and the personal exemption. For individuals claimed as a dependent on the tax return of another taxpayer (dependent taxpayers), the threshold amount is the standard deduction amount. For nonresident taxpayers, the threshold is prorated according to the portion of the taxpayer's total income that is included in Hawaii adjusted gross income (AGI). Taxpayers with income below the threshold can file a tax return to claim tax credits.
This study presents data taken from Hawaii and Federal individual income tax returns filed by all Hawaii resident and nonresident taxpayers for tax year 2015. In 2015, residents could file Form N-11 or Form-N-13 to pay Hawaii individual income tax. The shorter and simpler Form N-13 is available for resident taxpayers with taxable income below $100,000 who do not itemize deductions or claim adjustments to income. Form N-11 may be used by an individual taxpayer who is a resident and who files a federal income tax return. Form N-11 uses federal AGI as the starting point for calculating Hawaii taxable income. Nonresidents and part-year residents use Form N-15 to pay Hawaii income tax liabilities.
Hawaii's Individual Income Tax Law and the Internal Revenue Code
Hawaii generally follows federal definitions for taxable income of individuals, and the State Legislature annually passes legislation to conform Hawaii's income tax law to selected changes to the Internal Revenue Code (IRC). However, there are a number of differences between the income tax laws of Hawaii and the IRC. Unlike the IRC, Hawaii's definition of taxable income does not include social security benefits, distributions from employer-provided pensions, contributions made to a Hawaii individual housing account and in 2015, the first $6,198 of Hawaii National Guard duty, or military reserve pay. The IRC also exempts interest on U.S. savings bonds from income whereas, Hawaii does not.
Hawaii includes in taxable income cost-of-living allowances paid to federal civilian employees in Hawaii, State or County employee contributions to the Hawaii state government contributory plan or to the hybrid plan of the Employees Retirement System, and interest on state and local government bonds issued by jurisdictions outside of Hawaii, whereas the IRC does not. Hawaii generally does not conform to tax credits in the IRC and offers a number of its own tax credits that are not available in the IRC.
2
Hawaii uses different standard deductions or personal exemptions amounts than the IRC. Hawaii's regular personal exemption was $1,144 in 2015, whereas the federal personal exemption was $4,000. Hawaii also allows an extra personal exemption for taxpayers who are at least 65 years of age and an exemption of $7,000 for a person who is blind, deaf, or totally disabled.
The federal standard deduction in 2015 was $12,600 for married couples filing a joint tax return, $6,300 for single individuals and married couples filing separate tax returns and $9,300 for a head of household, with an additional standard deduction of $1,250 for the aged or blind ($1,550 if the taxpayer is single and not a surviving spouse). Hawaii's standard deductions for 2015 were $4,400 for joint returns, $2,200 if the taxpayer was single or a married individual filing separately, and $3,212 for a head of household.
The federal exemption and standard deduction amounts are adjusted for inflation each year, whereas Hawaii's standard deduction and exemption amounts are not automatically adjusted for inflation.
State Individual Income Tax Legislation
Hawaii's Legislature enacted several measures related to individual income taxes that were effective for tax year 2015, of which the following are the most prominent:
Act 60, Session Laws of Hawaii (SLH) 2009 Created new top tax brackets for ordinary income of 9%, 10%, and 11% for taxable years 2009 through 2015, after which the top rate is scheduled to return to 8.25%. Act 97, SLH 2011 Repealed the state tax deduction and capped itemized deductions for certain high income taxpayers for taxable years 2011 through 2015. The caps are set to expire December 31, 2015. The Act also delayed (until 2013) and made permanent a 10% increase in the standard deduction and personal exemption. Act 256, SLH 2013 Amended section 3 of Act 97, SLH 2011, by carving out charitable contributions from the hard cap amounts. Thus, the total itemized deductions that may be claimed by taxpayers who meet or exceed the income thresholds is limited to the lesser of the overall limitations set by the IRC in tax year 2009, or the hard cap set by Act 97 plus allowable charitable contributions. Act 256 was effective for taxable years beginning after December 31, 2012. Act 52, SLH 2015 Conformed Hawaii income tax law to the IRC as of December 31, 2014, and made various technical amendments. This act amends Hawaii income tax law under Chapter 235, Hawaii Revised Statutes (HRS), to conform to certain provisions of the Internal Revenue Code, as amended as of December 31, 2014.
3
Data Source and Methodology
Data for this report were collected from the State Department's Integrated Tax Information Management System (ITIMS), which provides data in electronic form. Data from the ITIMS Tax Processing System (ITPS) were retrieved for State income tax returns filed for tax year 2015 and processed by March 31, 2017. Supplemental data extracted from the federal Individual Master File and Individual Return Transaction File (IMF/IRTF) were supplied by the Internal Revenue Service (IRS). A total of 717,066 State tax returns were extracted for the study. The data taken from the tax returns are items as reported by individuals, before any subsequent audits, but after automatic adjustments made when processing the returns. The data items on the tax returns were checked for accuracy by examining the largest entries for each item and checking them against images of the tax returns, and by making sure that figures for total income, deductions, exemptions, and taxable income were consistent with each other.
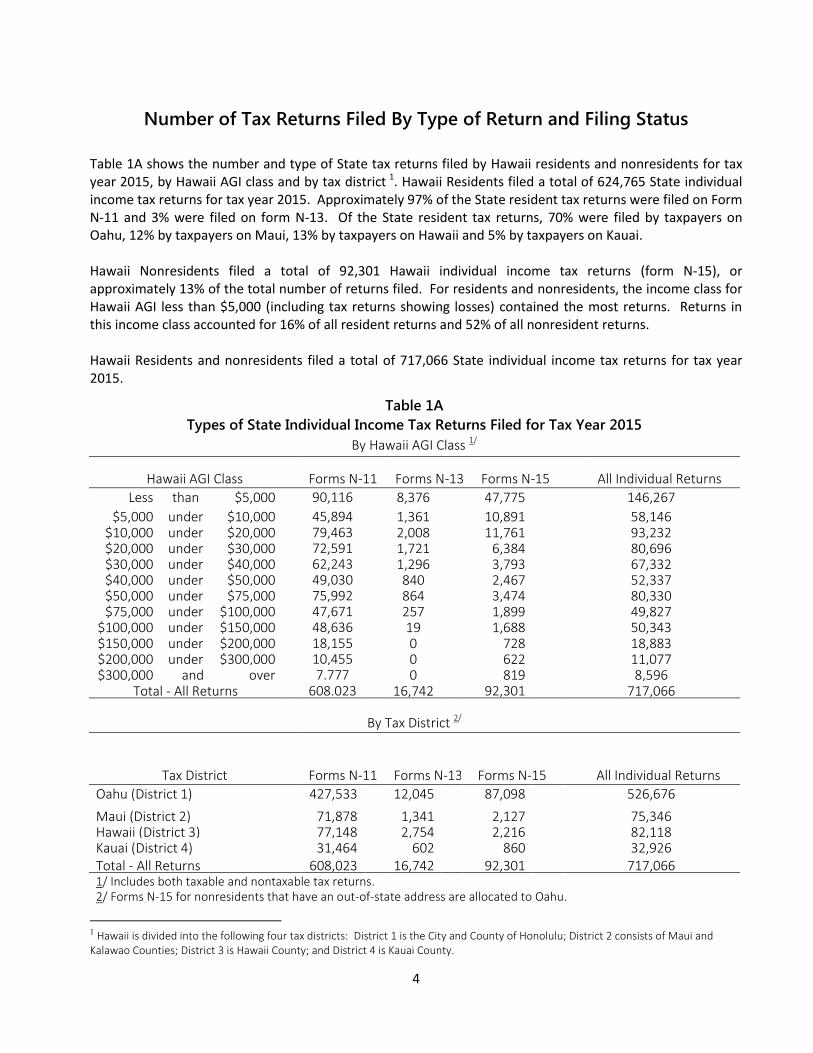
4
Number of Tax Returns Filed By Type of Return and Filing Status
Table 1A shows the number and type of State tax returns filed by Hawaii residents and nonresidents for tax year 2015, by Hawaii AGI class and by tax district 1. Hawaii Residents filed a total of 624,765 State individual income tax returns for tax year 2015. Approximately 97% of the State resident tax returns were filed on Form N-11 and 3% were filed on form N-13. Of the State resident tax returns, 70% were filed by taxpayers on Oahu, 12% by taxpayers on Maui, 13% by taxpayers on Hawaii and 5% by taxpayers on Kauai. Hawaii Nonresidents filed a total of 92,301 Hawaii individual income tax returns (form N-15), or approximately 13% of the total number of returns filed. For residents and nonresidents, the income class for Hawaii AGI less than $5,000 (including tax returns showing losses) contained the most returns. Returns in this income class accounted for 16% of all resident returns and 52% of all nonresident returns. Hawaii Residents and nonresidents filed a total of 717,066 State individual income tax returns for tax year 2015.
Table 1A
Types of State Individual Income Tax Returns Filed for Tax Year 2015
By Hawaii AGI Class 1/
Hawaii AGI Class Forms N-11 Forms N-13 Forms N-15 All Individual Returns
Less than $5,000 90,116
90,116
8,376
47,775
146,267
127,787* $5,000 under $10,000
45,894
45,894 1,361
10,891
58,146
48,775* $10,000 under $20,000
79,463
79,463 2,008
11,761
93,232
87,453* $20,000 under $30,000
72,591
72,591 1,721
6,384
80,696
79,599* $30,000 under $40,000
62,243
62,243 1,296
3,793
67,332
67,083* $40,000 under $50,000
49,030
49,030 840
2,467
52,337
52,236* $50,000 under $75,000
75,992
75,992 864
3,474
80,330
80,271* $75,000 under $100,000
47,671
47,671 257
1,899
49,827
49,806* $100,000 under $150,000
48,636
48,636 19
1,688
50,343
50,331* $150,000 under $200,000
18,155
18,155 0
728
18,883
18,874* $200,000 under $300,000
10,455
10,455 0
622
11,077
11,069* $300,000 and over 7.777
7,777
0 819 8,596
8,584* Total - All Returns 608.023
608,023 16,742
92,301
92,301 717,066
681,868*
By Tax District 2/
Tax District Forms N-11 Forms N-13 Forms N-15 All Individual Returns
Oahu (District 1) 427,533 12,045 87,098 526,676
499,222* Maui (District 2) 71,878
1,341
2,127
75,346
71,945* Hawaii (District 3) 77,148
2,754
2,216
82,118
79,254* Kauai (District 4) 31,464
602
860
32,926
31,447* Total - All Returns 608,023
16,742
92,301
717,066
681,868*
1/ Includes both taxable and nontaxable tax returns. 2/ Forms N-15 for nonresidents that have an out-of-state address are allocated to Oahu.
1 Hawaii is divided into the following four tax districts: District 1 is the City and County of Honolulu; District 2 consists of Maui and Kalawao Counties; District 3 is Hawaii County; and District 4 is Kauai County.
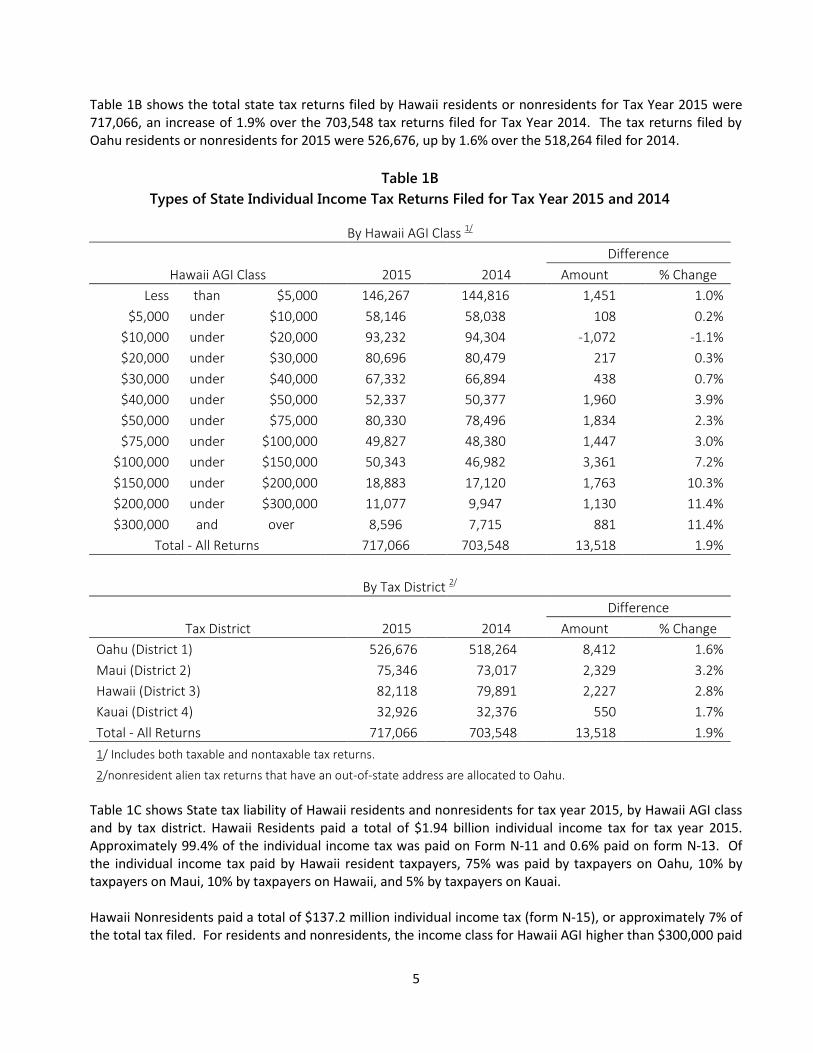
5
Table 1B shows the total state tax returns filed by Hawaii residents or nonresidents for Tax Year 2015 were 717,066, an increase of 1.9% over the 703,548 tax returns filed for Tax Year 2014. The tax returns filed by Oahu residents or nonresidents for 2015 were 526,676, up by 1.6% over the 518,264 filed for 2014.
Table 1B
Types of State Individual Income Tax Returns Filed for Tax Year 2015 and 2014
By Hawaii AGI Class 1/
Hawaii AGI Class 2015 2014
Difference
Amount
% Change
Less than $5,000 146,267
144,816
1,451 1.0%
$5,000 under $10,000
58,146
58,038
108
0.2%
$10,000 under $20,000
93,232
94,304
-1,072
-1.1%
$20,000 under $30,000
80,696
80,479
217
0.3%
$30,000 under $40,000
67,332
66,894
438
0.7%
$40,000 under $50,000
52,337
50,377
1,960
3.9%
$50,000 under $75,000
80,330
78,496
1,834
2.3%
$75,000 under $100,000
49,827
48,380
1,447
3.0%
$100,000 under $150,000
50,343
46,982
3,361
7.2%
$150,000 under $200,000
18,883
17,120
1,763
10.3%
$200,000 under $300,000
11,077
9,947
1,130
11.4%
$300,000 and over
8,596
7,715
881
11.4%
Total - All Returns 717,066
703,548 13,518 1.9%
By Tax District 2/
Tax District 2015 2014
Difference
Amount
% Change
Oahu (District 1) 526,676 518,264 8,412 1.6%
Maui (District 2) 75,346
73,017
2,329
3.2%
Hawaii (District 3) 82,118
79,891
2,227
2.8%
Kauai (District 4) 32,926
32,376
550
1.7%
Total - All Returns 717,066
703,548
13,518 1.9%
1/ Includes both taxable and nontaxable tax returns.
2/nonresident alien tax returns that have an out-of-state address are allocated to Oahu.
Table 1C shows State tax liability of Hawaii residents and nonresidents for tax year 2015, by Hawaii AGI class and by tax district. Hawaii Residents paid a total of $1.94 billion individual income tax for tax year 2015. Approximately 99.4% of the individual income tax was paid on Form N-11 and 0.6% paid on form N-13. Of the individual income tax paid by Hawaii resident taxpayers, 75% was paid by taxpayers on Oahu, 10% by taxpayers on Maui, 10% by taxpayers on Hawaii, and 5% by taxpayers on Kauai. Hawaii Nonresidents paid a total of $137.2 million individual income tax (form N-15), or approximately 7% of the total tax filed. For residents and nonresidents, the income class for Hawaii AGI higher than $300,000 paid
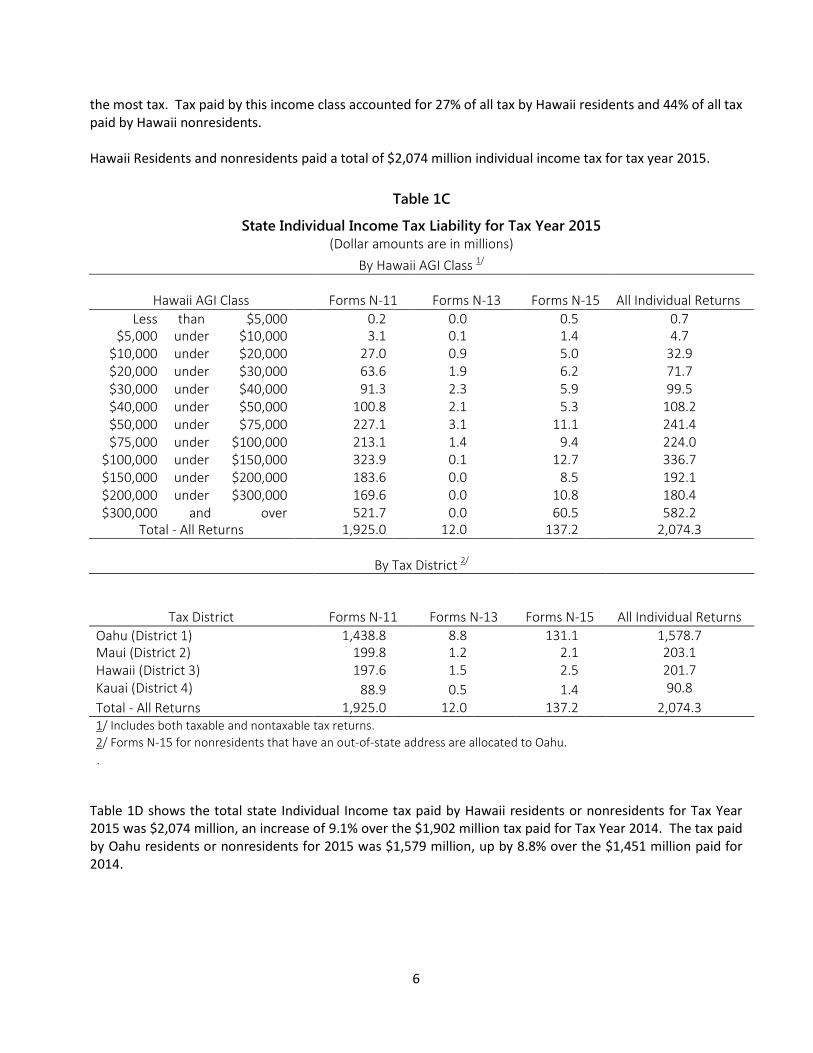
6
the most tax. Tax paid by this income class accounted for 27% of all tax by Hawaii residents and 44% of all tax paid by Hawaii nonresidents. Hawaii Residents and nonresidents paid a total of $2,074 million individual income tax for tax year 2015.
Table 1C
State Individual Income Tax Liability for Tax Year 2015
(Dollar amounts are in millions)
By Hawaii AGI Class 1/
Hawaii AGI Class Forms N-11 Forms N-13 Forms N-15 All Individual Returns
Less than $5,000 0.2
0.0
0.5
0.7 0.5* $5,000 under $10,000
3.1
0.1
1.4
4.7
3.4* $10,000 under $20,000
27.0
0.9
5.0
32.9 30.1* $20,000 under $30,000
63.6
1.9
6.2
71.7
70.4* $30,000 under $40,000
91.3
2.3
5.9
99.5 99.0* $40,000 under $50,000
100.8
2.1
5.3
108.2
107.9* $50,000 under $75,000
227.1
3.1
11.1
241.4 241.2* $75,000 under $100,000
213.1
1.4
9.4
224.0
223.8* $100,000 under $150,000
323.9
0.1
12.7
336.7 336.6* $150,000 under $200,000
183.6
0.0
8.5
192.1
192.0* $200,000 under $300,000
169.6
0.0
10.8
180.4 180.2* $300,000 and over
521.7
0.0
60.5
582.2
Total - All Returns 1,925.0 12.0 137.2 2,074.3 2,066.8*
By Tax District 2/
Tax District Forms N-11 Forms N-13 Forms N-15 All Individual Returns
Oahu (District 1) 1,438.8 8.8 131.1 1,578.7 1,572.6* Maui (District 2) 199.8
1.2
2.1
203.1
202.5* Hawaii (District 3) 197.6
1.5
2.5
201.7 201.2* Kauai (District 4) 88.9
0.5
1.4
90.8 90.6* Total - All Returns 1,925.0
12.0
137.2
2,074.3
2,066.8* 1/ Includes both taxable and nontaxable tax returns.
2/ Forms N-15 for nonresidents that have an out-of-state address are allocated to Oahu.
.
Table 1D shows the total state Individual Income tax paid by Hawaii residents or nonresidents for Tax Year 2015 was $2,074 million, an increase of 9.1% over the $1,902 million tax paid for Tax Year 2014. The tax paid by Oahu residents or nonresidents for 2015 was $1,579 million, up by 8.8% over the $1,451 million paid for 2014.
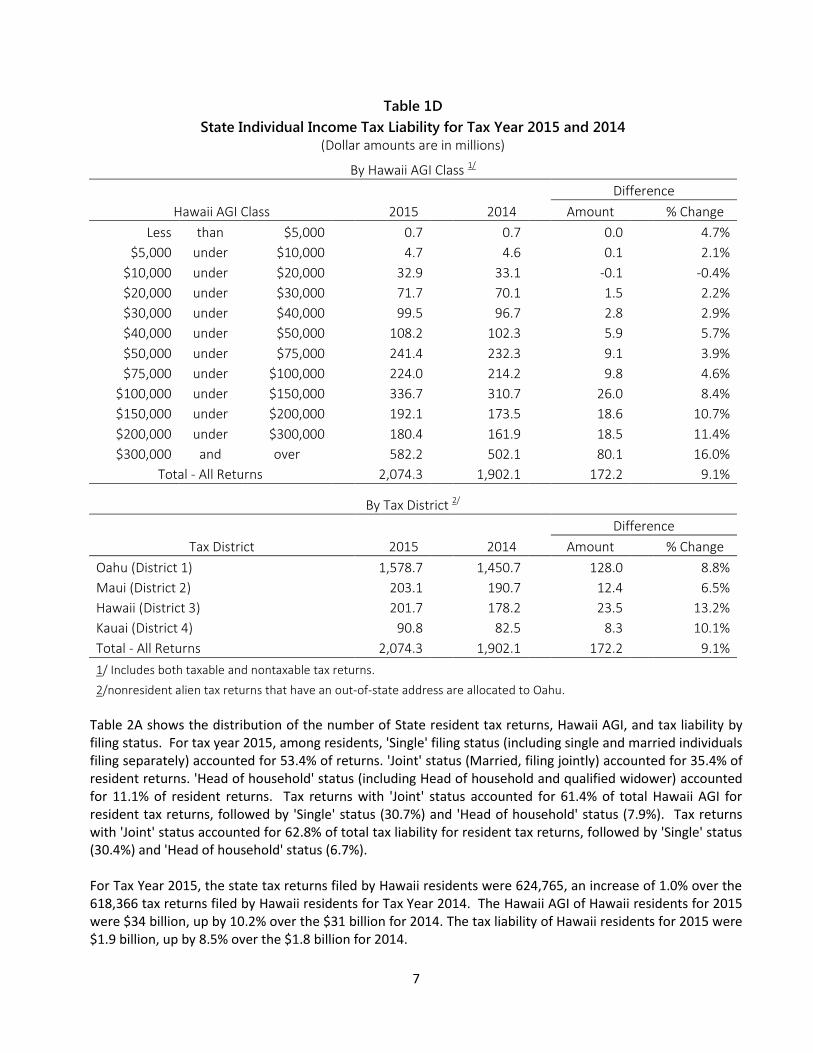
7
Table 1D
State Individual Income Tax Liability for Tax Year 2015 and 2014
(Dollar amounts are in millions)
By Hawaii AGI Class 1/
Hawaii AGI Class 2015 2014
Difference
Amount
% Change
Less than $5,000 0.7
0.7
0.0 4.7%
$5,000 under $10,000
4.7
4.6
0.1
2.1%
$10,000 under $20,000
32.9
33.1
-0.1
-0.4%
$20,000 under $30,000
71.7
70.1
1.5
2.2%
$30,000 under $40,000
99.5
96.7
2.8
2.9%
$40,000 under $50,000
108.2
102.3
5.9
5.7%
$50,000 under $75,000
241.4
232.3
9.1
3.9%
$75,000 under $100,000
224.0
214.2
9.8
4.6%
$100,000 under $150,000
336.7
310.7
26.0
8.4%
$150,000 under $200,000
192.1
173.5
18.6
10.7%
$200,000 under $300,000
180.4
161.9
18.5
11.4%
$300,000 and over
582.2
502.1
80.1
16.0%
Total - All Returns 2,074.3 1,902.1 172.2 9.1%
By Tax District 2/
Tax District 2015 2014
Difference
Amount
% Change
Oahu (District 1) 1,578.7 1,450.7 128.0 8.8%
Maui (District 2) 203.1
190.7
12.4
6.5%
Hawaii (District 3) 201.7
178.2
23.5
13.2%
Kauai (District 4) 90.8
82.5
8.3
10.1%
Total - All Returns 2,074.3
1,902.1
172.2 9.1%
1/ Includes both taxable and nontaxable tax returns.
2/nonresident alien tax returns that have an out-of-state address are allocated to Oahu.
Table 2A shows the distribution of the number of State resident tax returns, Hawaii AGI, and tax liability by filing status. For tax year 2015, among residents, 'Single' filing status (including single and married individuals filing separately) accounted for 53.4% of returns. 'Joint' status (Married, filing jointly) accounted for 35.4% of resident returns. 'Head of household' status (including Head of household and qualified widower) accounted for 11.1% of resident returns. Tax returns with 'Joint' status accounted for 61.4% of total Hawaii AGI for resident tax returns, followed by 'Single' status (30.7%) and 'Head of household' status (7.9%). Tax returns with 'Joint' status accounted for 62.8% of total tax liability for resident tax returns, followed by 'Single' status (30.4%) and 'Head of household' status (6.7%). For Tax Year 2015, the state tax returns filed by Hawaii residents were 624,765, an increase of 1.0% over the 618,366 tax returns filed by Hawaii residents for Tax Year 2014. The Hawaii AGI of Hawaii residents for 2015 were $34 billion, up by 10.2% over the $31 billion for 2014. The tax liability of Hawaii residents for 2015 were $1.9 billion, up by 8.5% over the $1.8 billion for 2014.
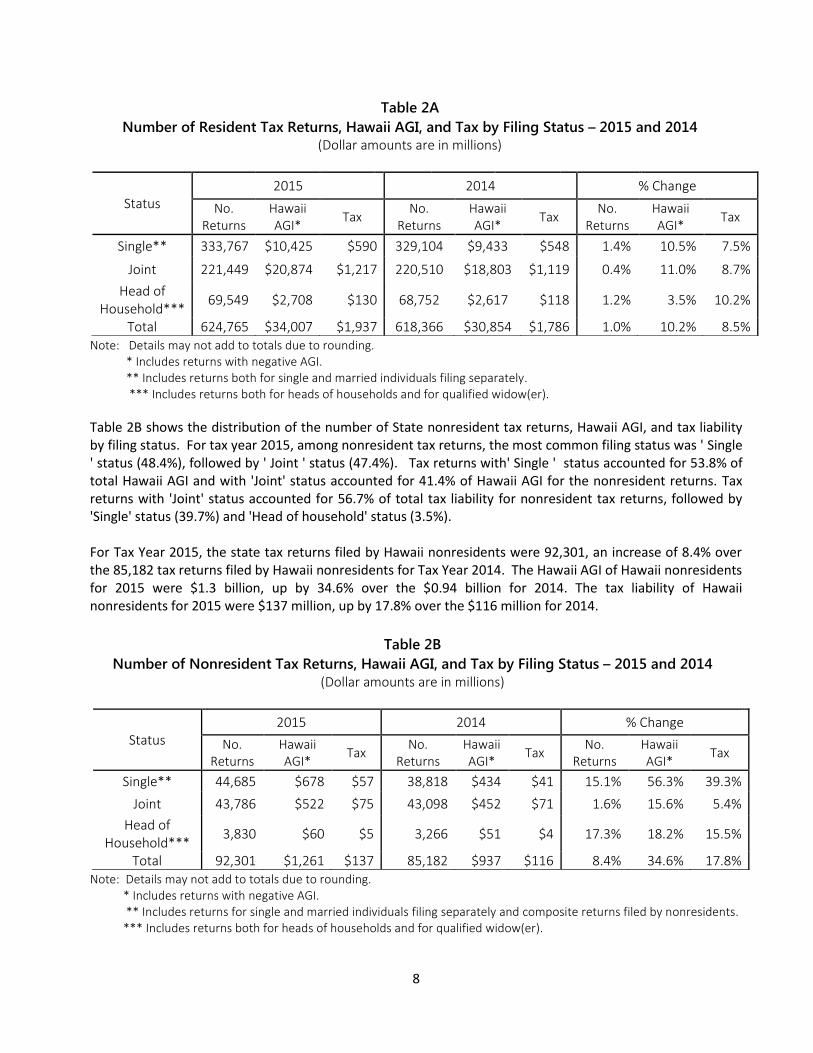
8
Note: Details may not add to totals due to rounding. * Includes returns with negative AGI. ** Includes returns both for single and married individuals filing separately. *** Includes returns both for heads of households and for qualified widow(er).
Table 2B shows the distribution of the number of State nonresident tax returns, Hawaii AGI, and tax liability by filing status. For tax year 2015, among nonresident tax returns, the most common filing status was ' Single ' status (48.4%), followed by ' Joint ' status (47.4%). Tax returns with' Single ' status accounted for 53.8% of total Hawaii AGI and with 'Joint' status accounted for 41.4% of Hawaii AGI for the nonresident returns. Tax returns with 'Joint' status accounted for 56.7% of total tax liability for nonresident tax returns, followed by 'Single' status (39.7%) and 'Head of household' status (3.5%). For Tax Year 2015, the state tax returns filed by Hawaii nonresidents were 92,301, an increase of 8.4% over the 85,182 tax returns filed by Hawaii nonresidents for Tax Year 2014. The Hawaii AGI of Hawaii nonresidents for 2015 were $1.3 billion, up by 34.6% over the $0.94 billion for 2014. The tax liability of Hawaii nonresidents for 2015 were $137 million, up by 17.8% over the $116 million for 2014.
Note: Details may not add to totals due to rounding. * Includes returns with negative AGI.
** Includes returns for single and married individuals filing separately and composite returns filed by nonresidents. *** Includes returns both for heads of households and for qualified widow(er).
Table 2A
Number of Resident Tax Returns, Hawaii AGI, and Tax by Filing Status – 2015 and 2014
(Dollar amounts are in millions)
Status 2015 2014 % Change
No. Returns
Hawaii AGI*
Tax No.
Returns Hawaii AGI*
Tax No.
Returns Hawaii AGI*
Tax
Single** 333,767 $10,425 $590 329,104 $9,433 $548 1.4% 10.5% 7.5%
Joint 221,449 $20,874 $1,217 220,510 $18,803 $1,119 0.4% 11.0% 8.7%
Head of Household***
69,549 $2,708 $130 68,752 $2,617 $118 1.2% 3.5% 10.2%
Total 624,765 $34,007 $1,937 618,366 $30,854 $1,786 1.0% 10.2% 8.5%
Table 2B
Number of Nonresident Tax Returns, Hawaii AGI, and Tax by Filing Status – 2015 and 2014
(Dollar amounts are in millions)
Status 2015 2014 % Change
No. Returns
Hawaii AGI*
Tax No.
Returns Hawaii AGI*
Tax No.
Returns Hawaii AGI*
Tax
Single** 44,685 $678 $57 38,818 $434 $41 15.1% 56.3% 39.3%
Joint 43,786 $522 $75 43,098 $452 $71 1.6% 15.6% 5.4%
Head of Household***
3,830 $60 $5 3,266 $51 $4 17.3% 18.2% 15.5%
Total 92,301 $1,261 $137 85,182 $937 $116 8.4% 34.6% 17.8%
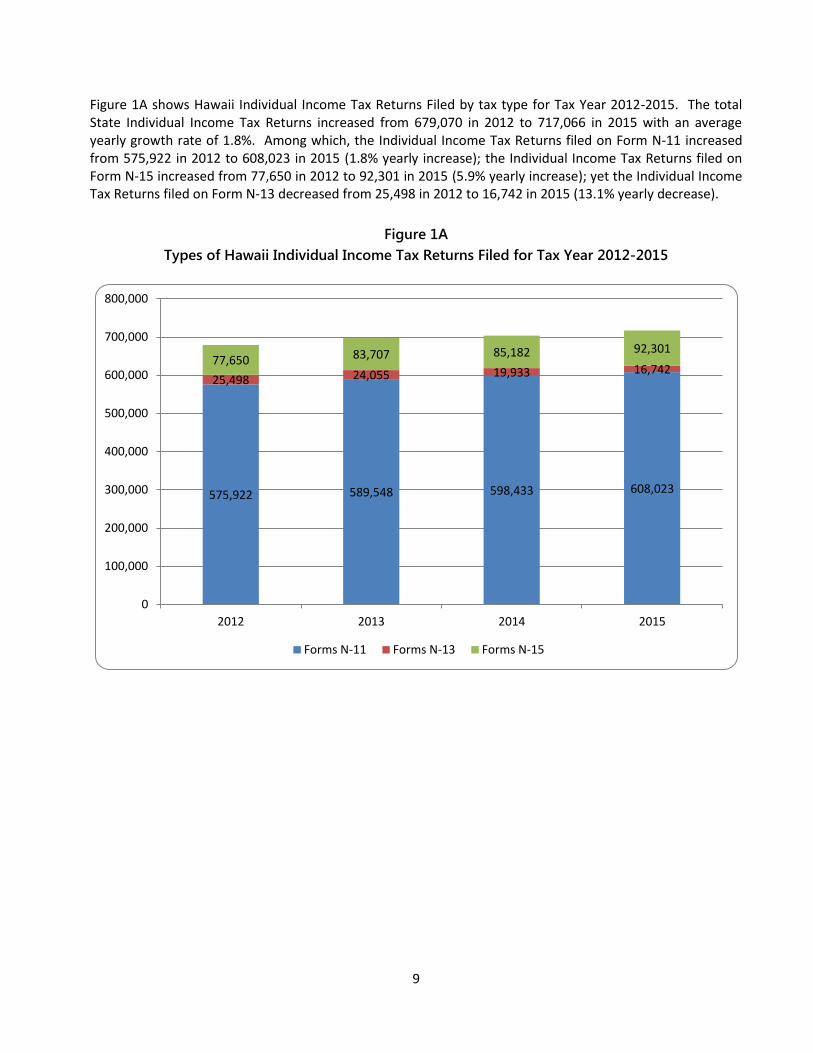
9
Figure 1A shows Hawaii Individual Income Tax Returns Filed by tax type for Tax Year 2012-2015. The total State Individual Income Tax Returns increased from 679,070 in 2012 to 717,066 in 2015 with an average yearly growth rate of 1.8%. Among which, the Individual Income Tax Returns filed on Form N-11 increased from 575,922 in 2012 to 608,023 in 2015 (1.8% yearly increase); the Individual Income Tax Returns filed on Form N-15 increased from 77,650 in 2012 to 92,301 in 2015 (5.9% yearly increase); yet the Individual Income Tax Returns filed on Form N-13 decreased from 25,498 in 2012 to 16,742 in 2015 (13.1% yearly decrease).
Figure 1A
Types of Hawaii Individual Income Tax Returns Filed for Tax Year 2012-2015
575,922 589,548 598,433 608,023
25,498 24,055 19,933 16,742 77,650 83,707 85,182 92,301
0
100,000
200,000
300,000
400,000
500,000
600,000
700,000
800,000
2012 2013 2014 2015
Forms N-11 Forms N-13 Forms N-15
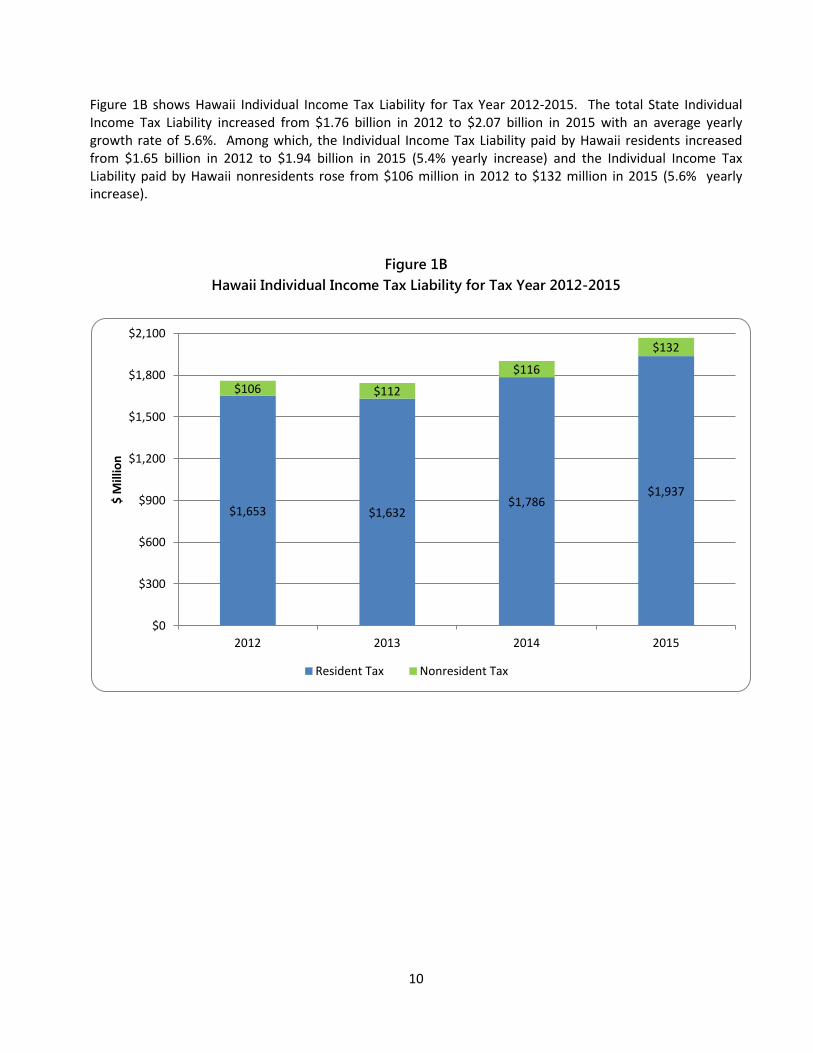
10
Figure 1B shows Hawaii Individual Income Tax Liability for Tax Year 2012-2015. The total State Individual Income Tax Liability increased from $1.76 billion in 2012 to $2.07 billion in 2015 with an average yearly growth rate of 5.6%. Among which, the Individual Income Tax Liability paid by Hawaii residents increased from $1.65 billion in 2012 to $1.94 billion in 2015 (5.4% yearly increase) and the Individual Income Tax Liability paid by Hawaii nonresidents rose from $106 million in 2012 to $132 million in 2015 (5.6% yearly increase).
Figure 1B
Hawaii Individual Income Tax Liability for Tax Year 2012-2015
$1,653 $1,632 $1,786
$1,937
$106 $112
$116
$132
$0
$300
$600
$900
$1,200
$1,500
$1,800
$2,100
2012 2013 2014 2015
$ M
illio
n
Resident Tax Nonresident Tax
11
Highlights of Statistics from State Resident Tax Returns
Resident Income and Adjustments
Selected data from State resident tax returns are shown in Appendix Tables A-1 and A-2. Chart 1 on the next page shows the major components of State resident tax returns for tax year 2015. Federal AGI is the starting point for calculating Hawaii taxable income on Form N-11. The calculation of Hawaii AGI begins with Federal AGI. Income that is not taxed by Hawaii is subtracted from this figure and income taxed by Hawaii but not by the federal government is added to the figure. The largest income items subtracted from Federal AGI are social security benefits and certain employer-provided pensions. The largest income items added to Federal AGI are cost-of-living allowances for civilian Federal employees, contributions to the State employees' retirement system, and interest on federal bonds. Federal AGI is not reported on Form N-13. For tax year 2015, Hawaii Residents with taxable income reported total Hawaii AGI of $34.5 billion, total deductions of $5.2 billion, total exemptions of $1.2 billion, total taxable income of $ 28.1 billion, total tax liability before credits of $1.9 billion, and total tax liability after credits of $1.8 billion.
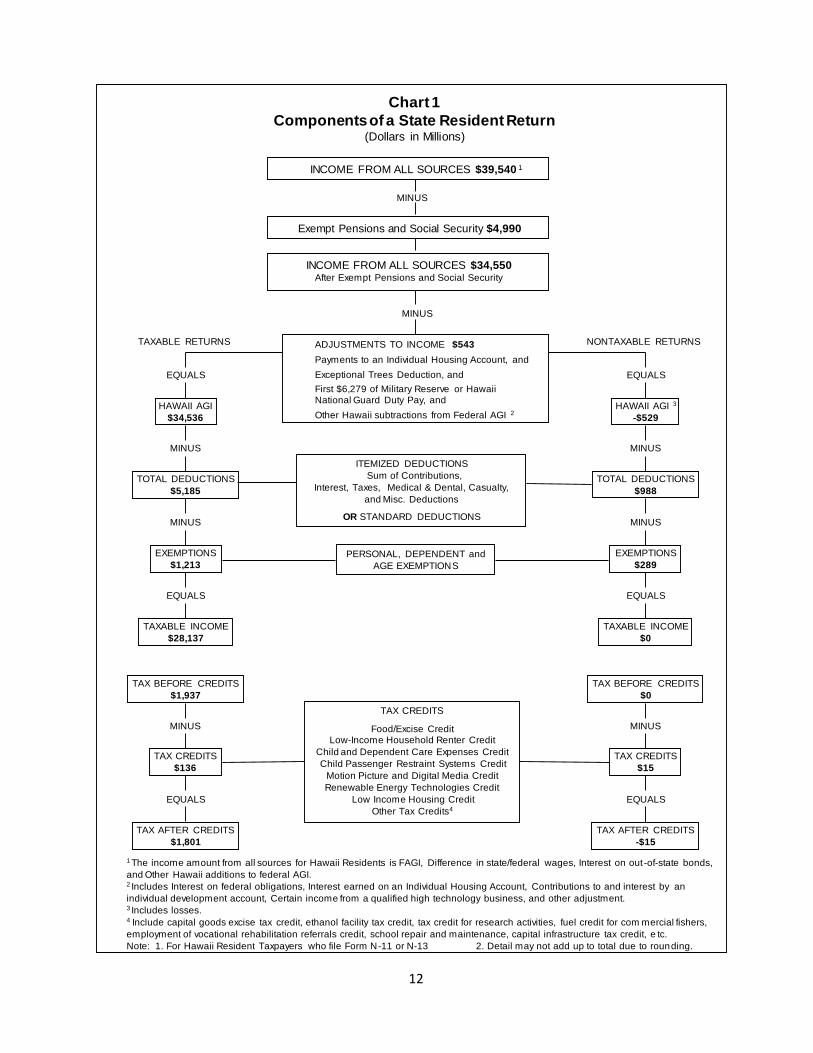
12
Chart 1
Components of a State Resident Return(Dollars in Millions)
INCOME FROM ALL SOURCES $34,550After Exempt Pensions and Social Security
MINUS
ADJUSTMENTS TO INCOME $543
Payments to an Individual Housing Account, and
Exceptional Trees Deduction, and
First $6,279 of Military Reserve or Hawaii National Guard Duty Pay, and
Other Hawaii subtractions from Federal AGI 2
EQUALS
HAWAII AGI
$34,536
MINUS
TOTAL DEDUCTIONS
$5,185
MINUS
EXEMPTIONS
$1,213
EQUALS
TAXABLE INCOME
$28,137
TAX BEFORE CREDITS
$1,937
MINUS
TAX CREDITS
$136
EQUALS
TAX AFTER CREDITS
$1,801
EQUALS
HAWAII AGI 3
-$529
MINUS
TOTAL DEDUCTIONS
$988
MINUS
EXEMPTIONS
$289
EQUALS
TAXABLE INCOME
$0
TAX BEFORE CREDITS
$0
MINUS
TAX CREDITS
$15
EQUALS
TAX AFTER CREDITS
-$15
TAXABLE RETURNS NONTAXABLE RETURNS
ITEMIZED DEDUCTIONS
Sum of Contributions,
Interest, Taxes, Medical & Dental, Casualty,
and Misc. Deductions
OR STANDARD DEDUCTIONS
PERSONAL, DEPENDENT and
AGE EXEMPTIONS
TAX CREDITS
Food/Excise CreditLow-Income Household Renter Credit
Child and Dependent Care Expenses Credit
Child Passenger Restraint Systems Credit
Motion Picture and Digital Media Credit
Renewable Energy Technologies Credit
Low Income Housing Credit
Other Tax Credits4
1 The income amount from all sources for Hawaii Residents is FAGI, Difference in state/federal wages, Interest on out -of-state bonds,
and Other Hawaii additions to federal AGI. 2 Includes Interest on federal obligations, Interest earned on an Individual Housing Account, Contributions to and interest by an
individual development account, Certain income from a qualified high technology business, and other adjustment. 3 Includes losses.4 Include capital goods excise tax credit, ethanol facility tax credit, tax credit for research activities, fuel credit for com mercial fishers,
employment of vocational rehabilitation referrals credit, school repair and maintenance, capital infrastructure tax credit, e tc.
Note: 1. For Hawaii Resident Taxpayers who file Form N-11 or N-13 2. Detail may not add up to total due to rounding.
INCOME FROM ALL SOURCES $39,540 1
Exempt Pensions and Social Security $4,990
MINUS
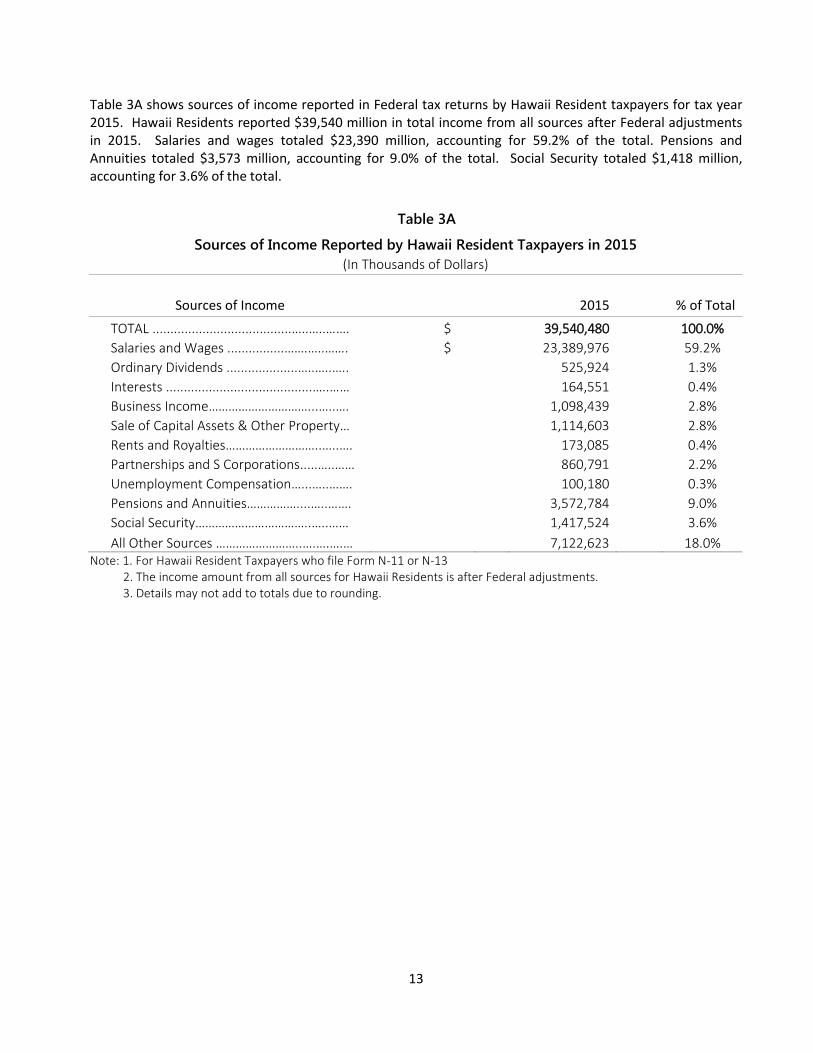
13
Table 3A shows sources of income reported in Federal tax returns by Hawaii Resident taxpayers for tax year 2015. Hawaii Residents reported $39,540 million in total income from all sources after Federal adjustments in 2015. Salaries and wages totaled $23,390 million, accounting for 59.2% of the total. Pensions and Annuities totaled $3,573 million, accounting for 9.0% of the total. Social Security totaled $1,418 million, accounting for 3.6% of the total.
Table 3A
Sources of Income Reported by Hawaii Resident Taxpayers in 2015
(In Thousands of Dollars)
Sources of Income 2015 % of Total
TOTAL .......................................…..…..……. $ 39,540,480
100.0%
Salaries and Wages ................…….…..……. $ 23,389,976
59.2%
Ordinary Dividends ....................…..…..…..
525,924
1.3%
Interests .........................................…..……
164,551
0.4%
Business Income…………………………...…..….
1,098,439
2.8%
Sale of Capital Assets & Other Property…
1,114,603
2.8%
Rents and Royalties………………………..…..….
173,085
0.4%
Partnerships and S Corporations.....…..……
860,791
2.2%
Unemployment Compensation…...…..…….
100,180
0.3%
Pensions and Annuities……………....…..…….
3,572,784
9.0%
Social Security……………………………..…..……
1,417,524
3.6%
All Other Sources ……………………..….….….…
7,122,623
18.0% Note: 1. For Hawaii Resident Taxpayers who file Form N-11 or N-13 2. The income amount from all sources for Hawaii Residents is after Federal adjustments. 3. Details may not add to totals due to rounding.
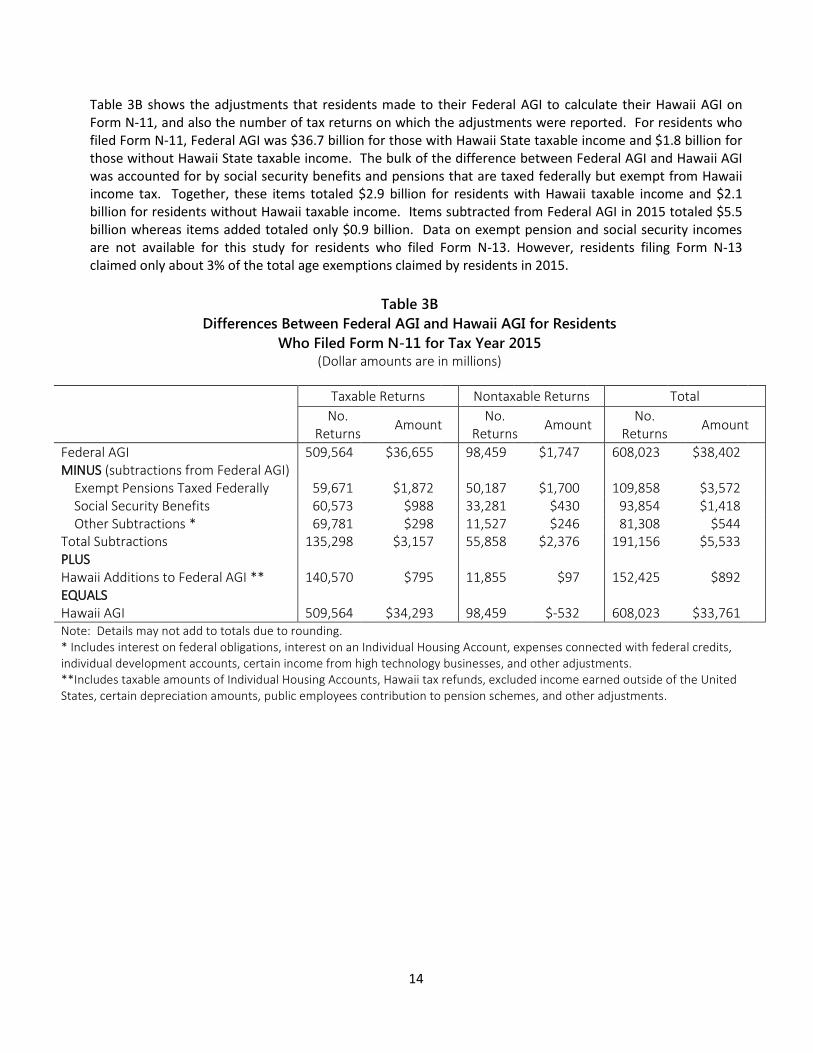
14
Table 3B shows the adjustments that residents made to their Federal AGI to calculate their Hawaii AGI on Form N-11, and also the number of tax returns on which the adjustments were reported. For residents who filed Form N-11, Federal AGI was $36.7 billion for those with Hawaii State taxable income and $1.8 billion for those without Hawaii State taxable income. The bulk of the difference between Federal AGI and Hawaii AGI was accounted for by social security benefits and pensions that are taxed federally but exempt from Hawaii income tax. Together, these items totaled $2.9 billion for residents with Hawaii taxable income and $2.1 billion for residents without Hawaii taxable income. Items subtracted from Federal AGI in 2015 totaled $5.5 billion whereas items added totaled only $0.9 billion. Data on exempt pension and social security incomes are not available for this study for residents who filed Form N-13. However, residents filing Form N-13 claimed only about 3% of the total age exemptions claimed by residents in 2015.
Table 3B
Differences Between Federal AGI and Hawaii AGI for Residents
Who Filed Form N-11 for Tax Year 2015
(Dollar amounts are in millions)
Taxable Returns Nontaxable Returns Total
No. Returns
Amount No.
Returns Amount
No. Returns
Amount
Federal AGI 509,564
$36,655 98,459
$1,747 608,023
$38,402 MINUS (subtractions from Federal AGI)
Exempt Pensions Taxed Federally 59,671
$1,872 50,187
$1,700 109,858
$3,572 Social Security Benefits 60,573
$988 33,281
$430 93,854
$1,418
Other Subtractions * 69,781
$298 11,527
$246 81,308
$544 Total Subtractions 135,298
$3,157 55,858
$2,376 191,156
$5,533
PLUS
Hawaii Additions to Federal AGI ** 140,570
$795 11,855
$97 152,425
$892
EQUALS
Hawaii AGI 509,564 $34,293 98,459 $-532 608,023 $33,761 Note: Details may not add to totals due to rounding. * Includes interest on federal obligations, interest on an Individual Housing Account, expenses connected with federal credits, individual development accounts, certain income from high technology businesses, and other adjustments. **Includes taxable amounts of Individual Housing Accounts, Hawaii tax refunds, excluded income earned outside of the United States, certain depreciation amounts, public employees contribution to pension schemes, and other adjustments.
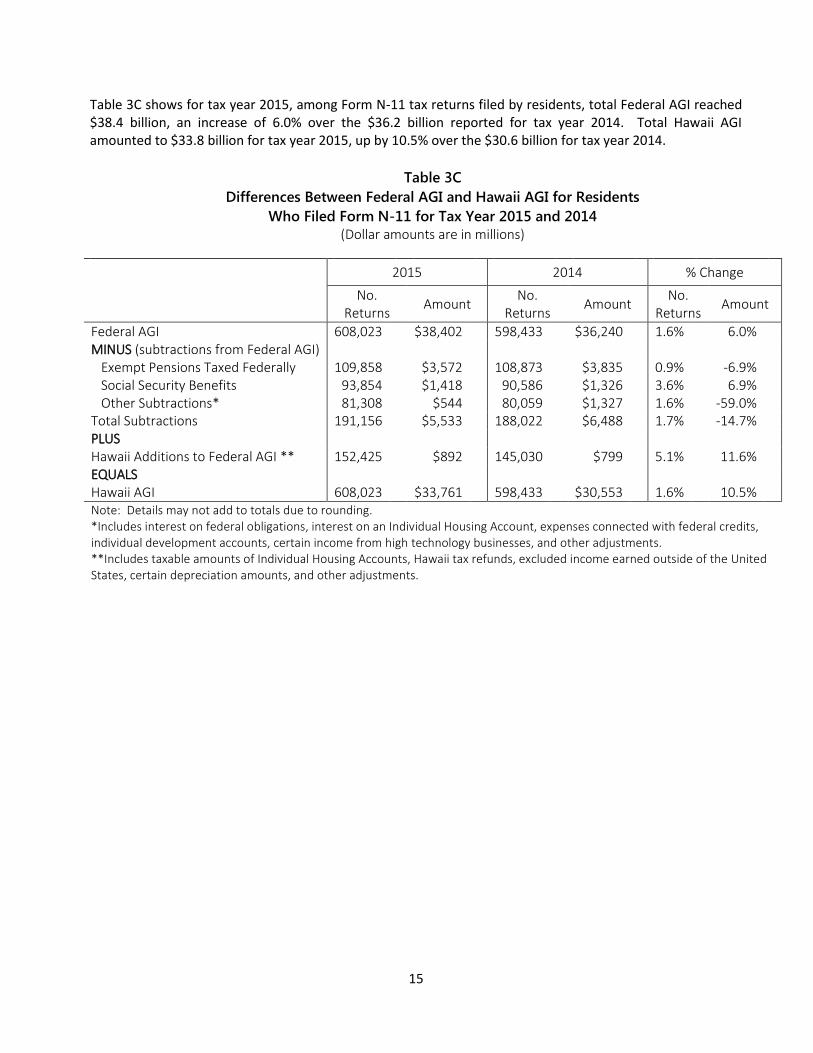
15
Table 3C shows for tax year 2015, among Form N-11 tax returns filed by residents, total Federal AGI reached $38.4 billion, an increase of 6.0% over the $36.2 billion reported for tax year 2014. Total Hawaii AGI amounted to $33.8 billion for tax year 2015, up by 10.5% over the $30.6 billion for tax year 2014.
Table 3C
Differences Between Federal AGI and Hawaii AGI for Residents
Who Filed Form N-11 for Tax Year 2015 and 2014
(Dollar amounts are in millions)
2015 2014 % Change
No. Returns
Amount No.
Returns Amount
No. Returns
Amount
Federal AGI 608,023
$38,402 598,433
$36,240 1.6%
6.0% MINUS (subtractions from Federal AGI)
Exempt Pensions Taxed Federally 109,858
$3,572 108,873
$3,835 0.9%
-6.9% Social Security Benefits 93,854
$1,418 90,586
$1,326 3.6%
6.9%
Other Subtractions* 81,308
$544 80,059
$1,327 1.6%
-59.0% Total Subtractions 191,156
$5,533 188,022
$6,488 1.7%
-14.7%
PLUS
Hawaii Additions to Federal AGI ** 152,425
$892 145,030
$799 5.1%
11.6%
EQUALS
Hawaii AGI 608,023 $33,761 598,433 $30,553 1.6% 10.5% Note: Details may not add to totals due to rounding. *Includes interest on federal obligations, interest on an Individual Housing Account, expenses connected with federal credits, individual development accounts, certain income from high technology businesses, and other adjustments. **Includes taxable amounts of Individual Housing Accounts, Hawaii tax refunds, excluded income earned outside of the United States, certain depreciation amounts, and other adjustments.
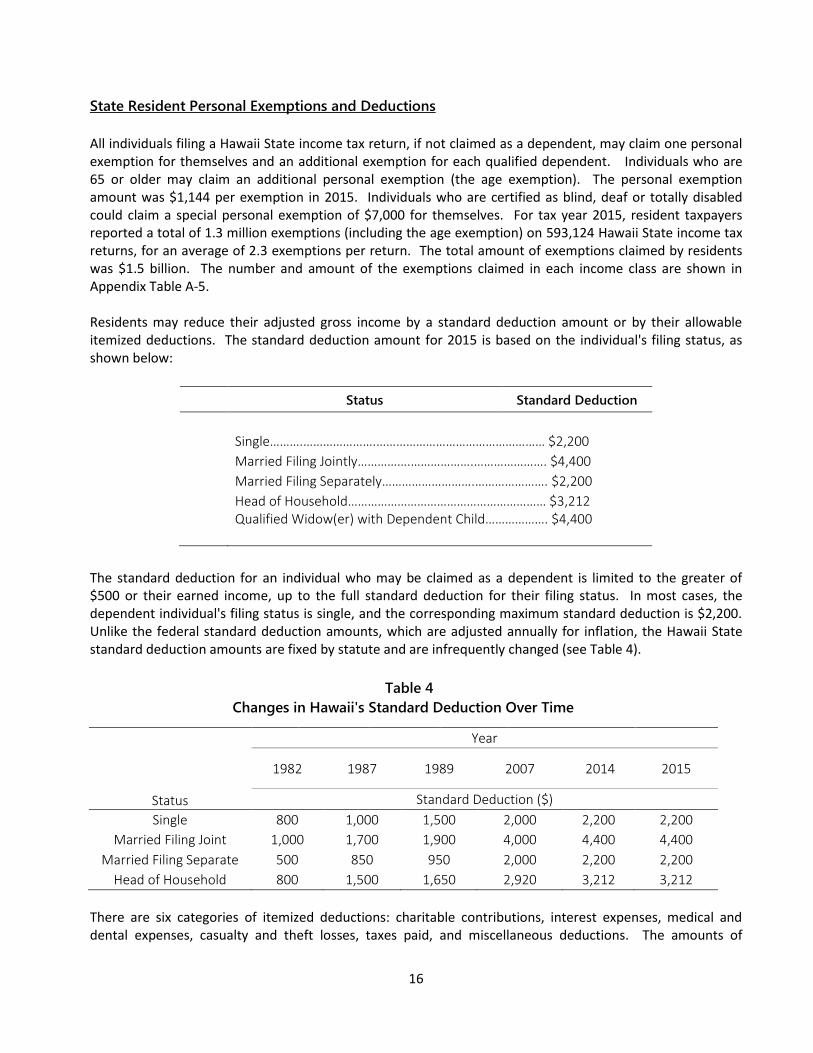
16
State Resident Personal Exemptions and Deductions All individuals filing a Hawaii State income tax return, if not claimed as a dependent, may claim one personal exemption for themselves and an additional exemption for each qualified dependent. Individuals who are 65 or older may claim an additional personal exemption (the age exemption). The personal exemption amount was $1,144 per exemption in 2015. Individuals who are certified as blind, deaf or totally disabled could claim a special personal exemption of $7,000 for themselves. For tax year 2015, resident taxpayers reported a total of 1.3 million exemptions (including the age exemption) on 593,124 Hawaii State income tax returns, for an average of 2.3 exemptions per return. The total amount of exemptions claimed by residents was $1.5 billion. The number and amount of the exemptions claimed in each income class are shown in Appendix Table A-5. Residents may reduce their adjusted gross income by a standard deduction amount or by their allowable itemized deductions. The standard deduction amount for 2015 is based on the individual's filing status, as shown below:
Status Standard Deduction
Single……….………………….…………………………………………… $2,200 Married Filing Jointly…………….……………….…………………. $4,400 Married Filing Separately……………………….…………………. $2,200 Head of Household…………………………………………………… $3,212 Qualified Widow(er) with Dependent Child………………. $4,400
The standard deduction for an individual who may be claimed as a dependent is limited to the greater of $500 or their earned income, up to the full standard deduction for their filing status. In most cases, the dependent individual's filing status is single, and the corresponding maximum standard deduction is $2,200. Unlike the federal standard deduction amounts, which are adjusted annually for inflation, the Hawaii State standard deduction amounts are fixed by statute and are infrequently changed (see Table 4).
Table 4
Changes in Hawaii's Standard Deduction Over Time
Status
Year
1982 1987 1989 2007 2014 2015
Standard Deduction ($)
Single 800 1,000 1,500 2,000 2,200 2,200
Married Filing Joint 1,000 1,700 1,900 4,000 4,400 4,400
Married Filing Separate 500 850 950 2,000 2,200 2,200
Head of Household 800 1,500 1,650 2,920 3,212 3,212
There are six categories of itemized deductions: charitable contributions, interest expenses, medical and dental expenses, casualty and theft losses, taxes paid, and miscellaneous deductions. The amounts of
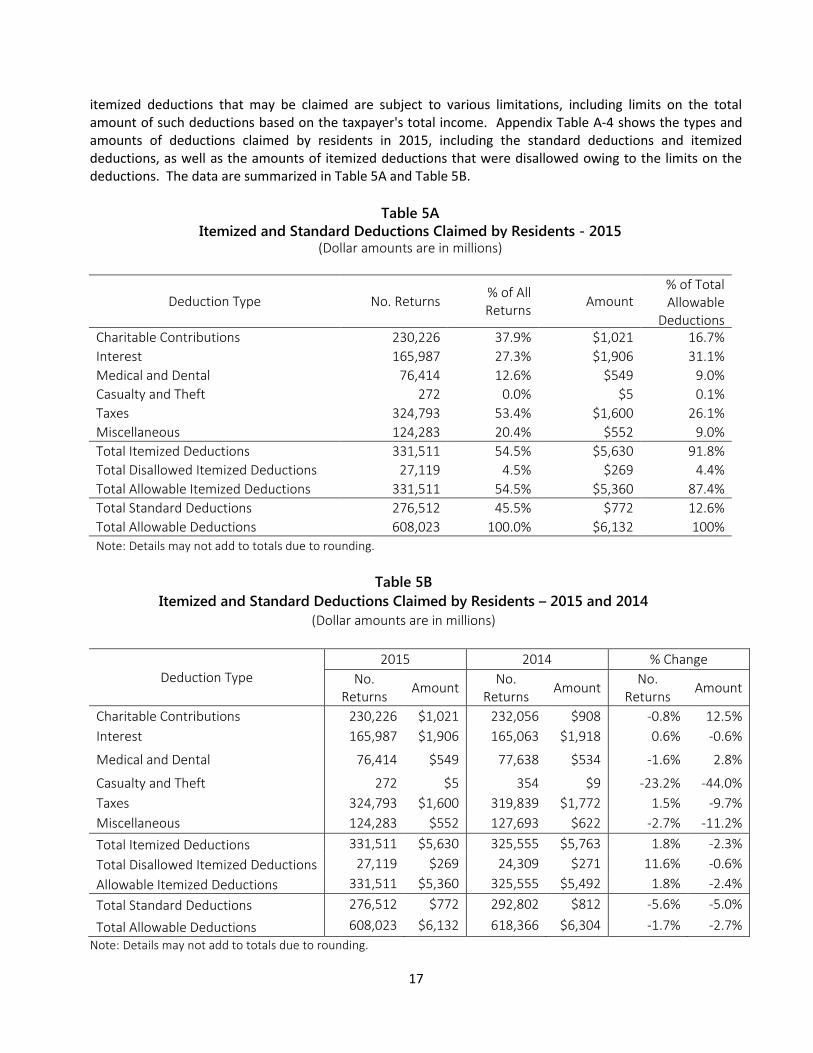
17
itemized deductions that may be claimed are subject to various limitations, including limits on the total amount of such deductions based on the taxpayer's total income. Appendix Table A-4 shows the types and amounts of deductions claimed by residents in 2015, including the standard deductions and itemized deductions, as well as the amounts of itemized deductions that were disallowed owing to the limits on the deductions. The data are summarized in Table 5A and Table 5B.
Table 5A
Itemized and Standard Deductions Claimed by Residents - 2015 (Dollar amounts are in millions)
Deduction Type No. Returns % of All Returns
Amount % of Total Allowable
Deductions Charitable Contributions 230,226 37.9% $1,021 16.7%
Interest 165,987 27.3% $1,906 31.1%
Medical and Dental 76,414 12.6% $549 9.0%
Casualty and Theft 272 0.0% $5 0.1%
Taxes 324,793 53.4% $1,600 26.1%
Miscellaneous 124,283 20.4% $552 9.0%
Total Itemized Deductions 331,511 54.5% $5,630 91.8%
Total Disallowed Itemized Deductions 27,119 4.5% $269 4.4%
Total Allowable Itemized Deductions 331,511 54.5% $5,360 87.4%
Total Standard Deductions 276,512 45.5% $772 12.6%
Total Allowable Deductions 608,023 100.0% $6,132 100%
Note: Details may not add to totals due to rounding.
Table 5B
Itemized and Standard Deductions Claimed by Residents – 2015 and 2014
(Dollar amounts are in millions)
Deduction Type 2015 2014 % Change
No. Returns
Amount No.
Returns Amount
No. Returns
Amount
Charitable Contributions 230,226 $1,021 232,056 $908 -0.8% 12.5%
Interest 165,987 $1,906 165,063 $1,918 0.6% -0.6%
Medical and Dental 76,414 $549 77,638 $534 -1.6% 2.8%
Casualty and Theft 272 $5 354 $9 -23.2% -44.0%
Taxes 324,793 $1,600 319,839 $1,772 1.5% -9.7%
Miscellaneous 124,283 $552 127,693 $622 -2.7% -11.2%
Total Itemized Deductions 331,511 $5,630 325,555 $5,763 1.8% -2.3%
Total Disallowed Itemized Deductions 27,119 $269 24,309 $271 11.6% -0.6%
Allowable Itemized Deductions 331,511 $5,360 325,555 $5,492 1.8% -2.4%
Total Standard Deductions 276,512 $772 292,802 $812 -5.6% -5.0%
Total Allowable Deductions 608,023 $6,132 618,366 $6,304 -1.7% -2.7%
Note: Details may not add to totals due to rounding.
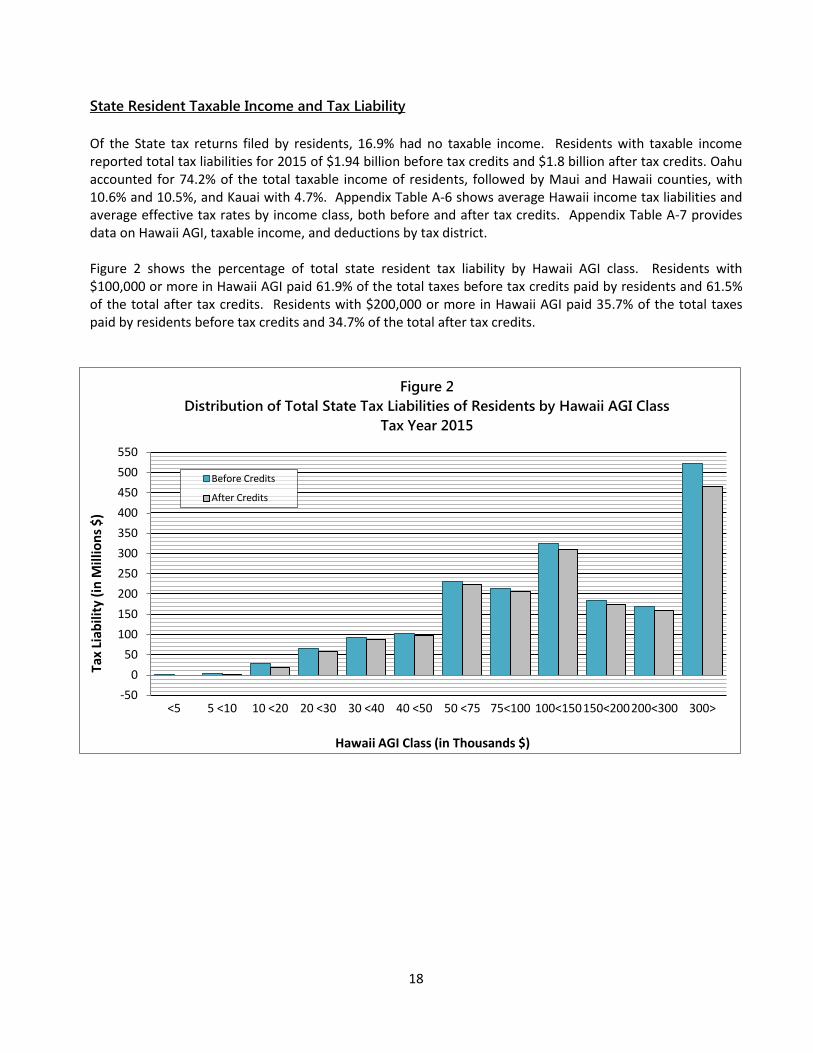
18
State Resident Taxable Income and Tax Liability
Of the State tax returns filed by residents, 16.9% had no taxable income. Residents with taxable income reported total tax liabilities for 2015 of $1.94 billion before tax credits and $1.8 billion after tax credits. Oahu accounted for 74.2% of the total taxable income of residents, followed by Maui and Hawaii counties, with 10.6% and 10.5%, and Kauai with 4.7%. Appendix Table A-6 shows average Hawaii income tax liabilities and average effective tax rates by income class, both before and after tax credits. Appendix Table A-7 provides data on Hawaii AGI, taxable income, and deductions by tax district. Figure 2 shows the percentage of total state resident tax liability by Hawaii AGI class. Residents with $100,000 or more in Hawaii AGI paid 61.9% of the total taxes before tax credits paid by residents and 61.5% of the total after tax credits. Residents with $200,000 or more in Hawaii AGI paid 35.7% of the total taxes paid by residents before tax credits and 34.7% of the total after tax credits.
-50
0
50
100
150
200
250
300
350
400
450
500
550
<5 5 <10 10 <20 20 <30 30 <40 40 <50 50 <75 75<100 100<150 150<200 200<300 300>
Tax
Liab
ility
(in
Mill
ion
s $
)
Hawaii AGI Class (in Thousands $)
Figure 2
Distribution of Total State Tax Liabilities of Residents by Hawaii AGI Class
Tax Year 2015
Before Credits
After Credits
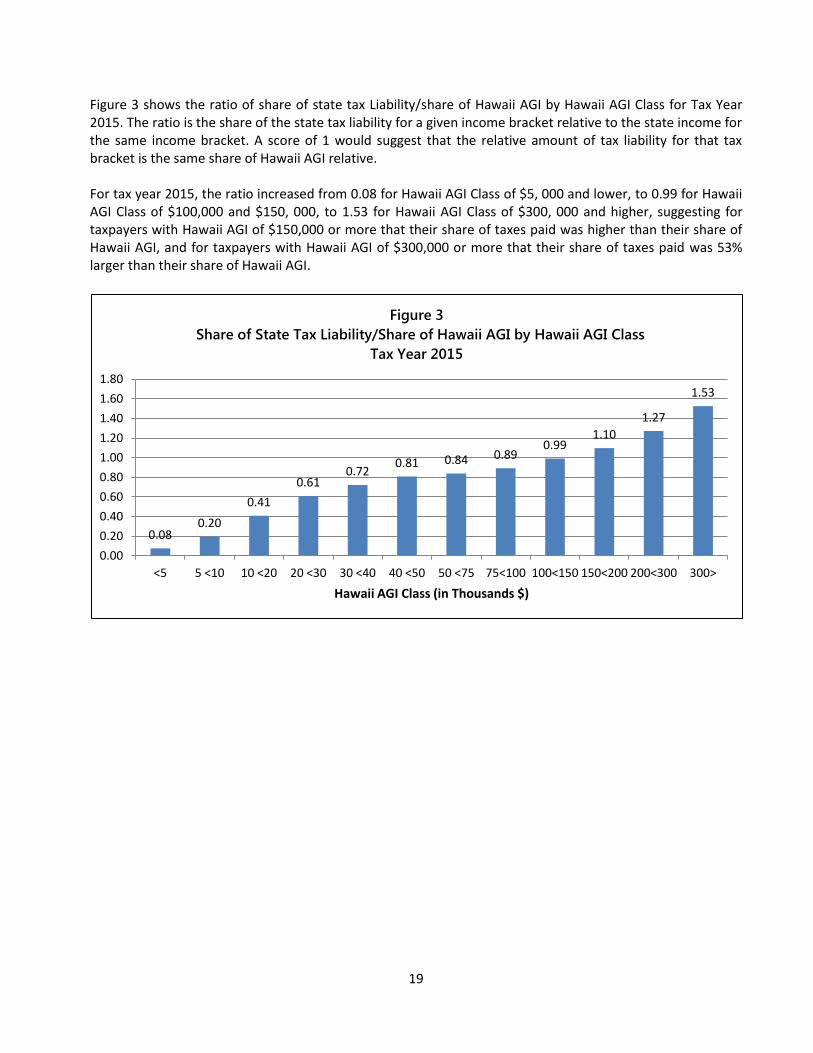
19
Figure 3 shows the ratio of share of state tax Liability/share of Hawaii AGI by Hawaii AGI Class for Tax Year 2015. The ratio is the share of the state tax liability for a given income bracket relative to the state income for the same income bracket. A score of 1 would suggest that the relative amount of tax liability for that tax bracket is the same share of Hawaii AGI relative. For tax year 2015, the ratio increased from 0.08 for Hawaii AGI Class of $5, 000 and lower, to 0.99 for Hawaii AGI Class of $100,000 and $150, 000, to 1.53 for Hawaii AGI Class of $300, 000 and higher, suggesting for taxpayers with Hawaii AGI of $150,000 or more that their share of taxes paid was higher than their share of Hawaii AGI, and for taxpayers with Hawaii AGI of $300,000 or more that their share of taxes paid was 53% larger than their share of Hawaii AGI.
0.08 0.20
0.41
0.61 0.72
0.81 0.84 0.89 0.99
1.10
1.27
1.53
0.00
0.20
0.40
0.60
0.80
1.00
1.20
1.40
1.60
1.80
<5 5 <10 10 <20 20 <30 30 <40 40 <50 50 <75 75<100 100<150 150<200 200<300 300>
Hawaii AGI Class (in Thousands $)
Figure 3
Share of State Tax Liability/Share of Hawaii AGI by Hawaii AGI Class
Tax Year 2015
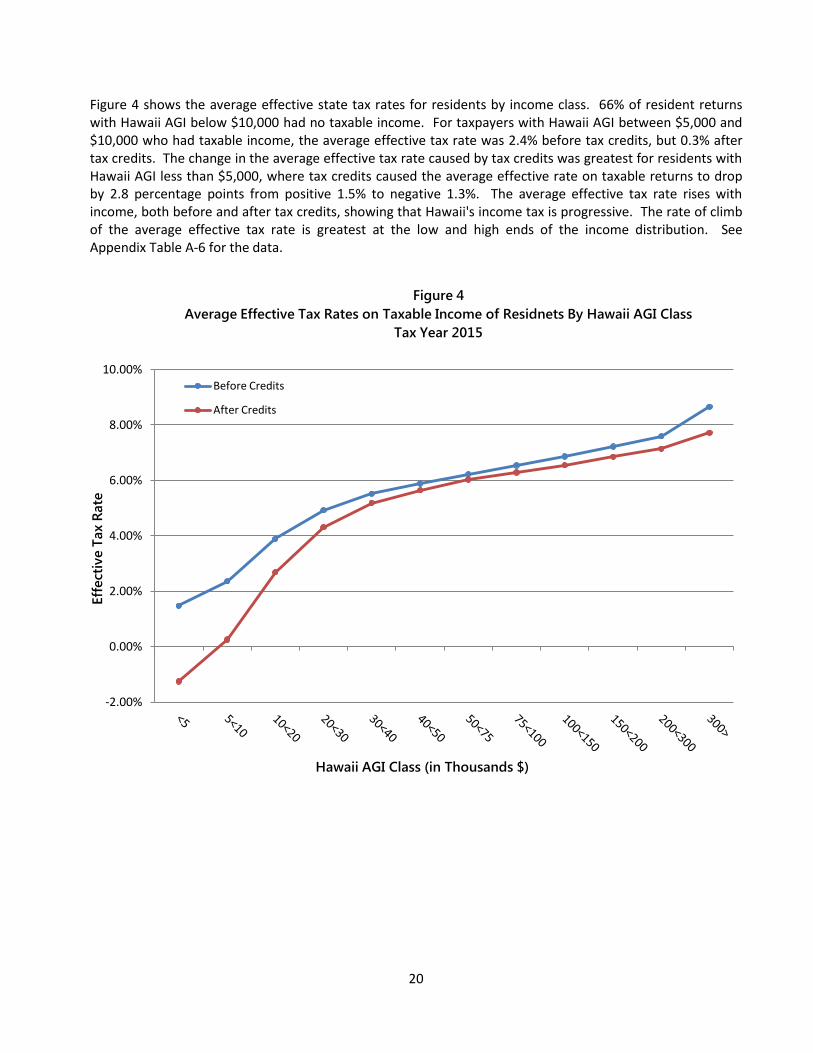
20
Figure 4 shows the average effective state tax rates for residents by income class. 66% of resident returns with Hawaii AGI below $10,000 had no taxable income. For taxpayers with Hawaii AGI between $5,000 and $10,000 who had taxable income, the average effective tax rate was 2.4% before tax credits, but 0.3% after tax credits. The change in the average effective tax rate caused by tax credits was greatest for residents with Hawaii AGI less than $5,000, where tax credits caused the average effective rate on taxable returns to drop by 2.8 percentage points from positive 1.5% to negative 1.3%. The average effective tax rate rises with income, both before and after tax credits, showing that Hawaii's income tax is progressive. The rate of climb of the average effective tax rate is greatest at the low and high ends of the income distribution. See Appendix Table A-6 for the data.
-2.00%
0.00%
2.00%
4.00%
6.00%
8.00%
10.00%
Eff
ect
ive T
ax R
ate
Hawaii AGI Class (in Thousands $)
Figure 4
Average Effective Tax Rates on Taxable Income of Residnets By Hawaii AGI Class
Tax Year 2015
Before Credits
After Credits
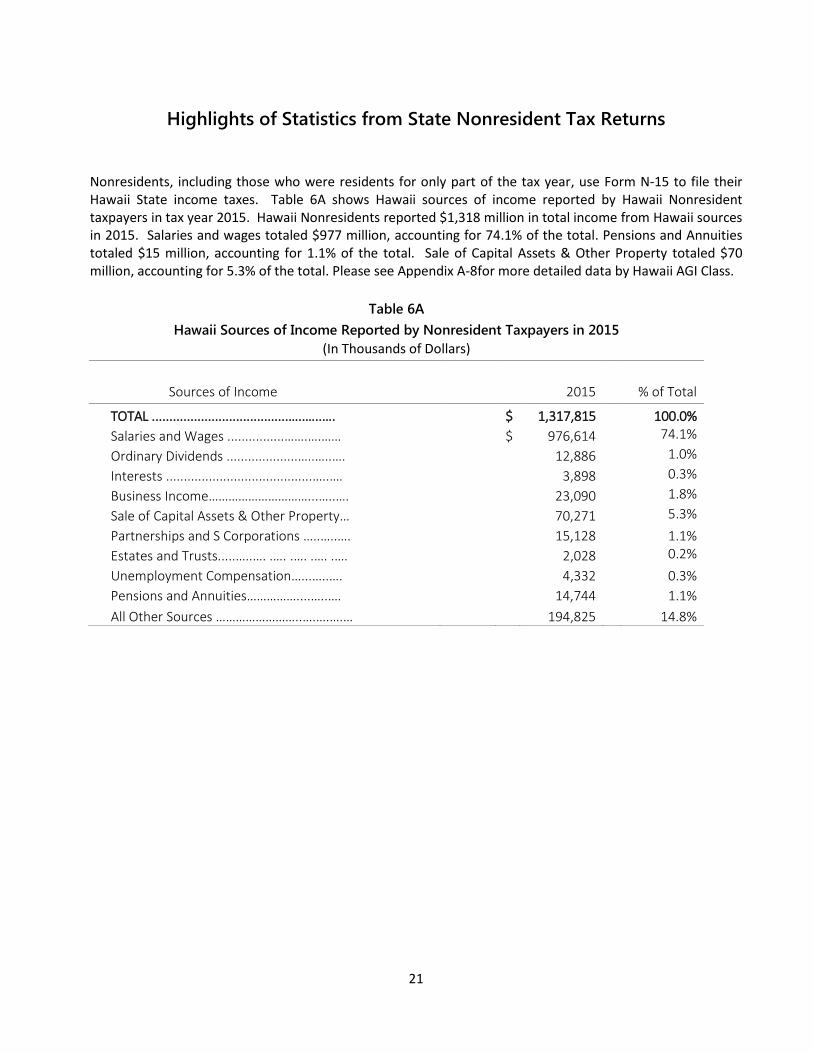
21
Highlights of Statistics from State Nonresident Tax Returns
Nonresidents, including those who were residents for only part of the tax year, use Form N-15 to file their Hawaii State income taxes. Table 6A shows Hawaii sources of income reported by Hawaii Nonresident taxpayers in tax year 2015. Hawaii Nonresidents reported $1,318 million in total income from Hawaii sources in 2015. Salaries and wages totaled $977 million, accounting for 74.1% of the total. Pensions and Annuities totaled $15 million, accounting for 1.1% of the total. Sale of Capital Assets & Other Property totaled $70 million, accounting for 5.3% of the total. Please see Appendix A-8for more detailed data by Hawaii AGI Class.
Table 6A
Hawaii Sources of Income Reported by Nonresident Taxpayers in 2015
(In Thousands of Dollars)
Sources of Income 2015 % of Total
TOTAL .......................................…..…..…. $ 1,317,815
100.0%
Salaries and Wages ................…….….…… $ 976,614
74.1%
Ordinary Dividends ....................…..…..….
12,886
1.0%
Interests .........................................…..….
3,898
0.3%
Business Income…………………………...…..….
23,090
1.8%
Sale of Capital Assets & Other Property…
70,271
5.3%
Partnerships and S Corporations …..…..….
15,128 1.1%
Estates and Trusts.....…..…. .…. .…. .…. .….
2,028
0.2%
Unemployment Compensation…...…..….
4,332 0.3%
Pensions and Annuities……………....…..….
14,744 1.1%
All Other Sources ……………………..….….….… 194,825 14.8%
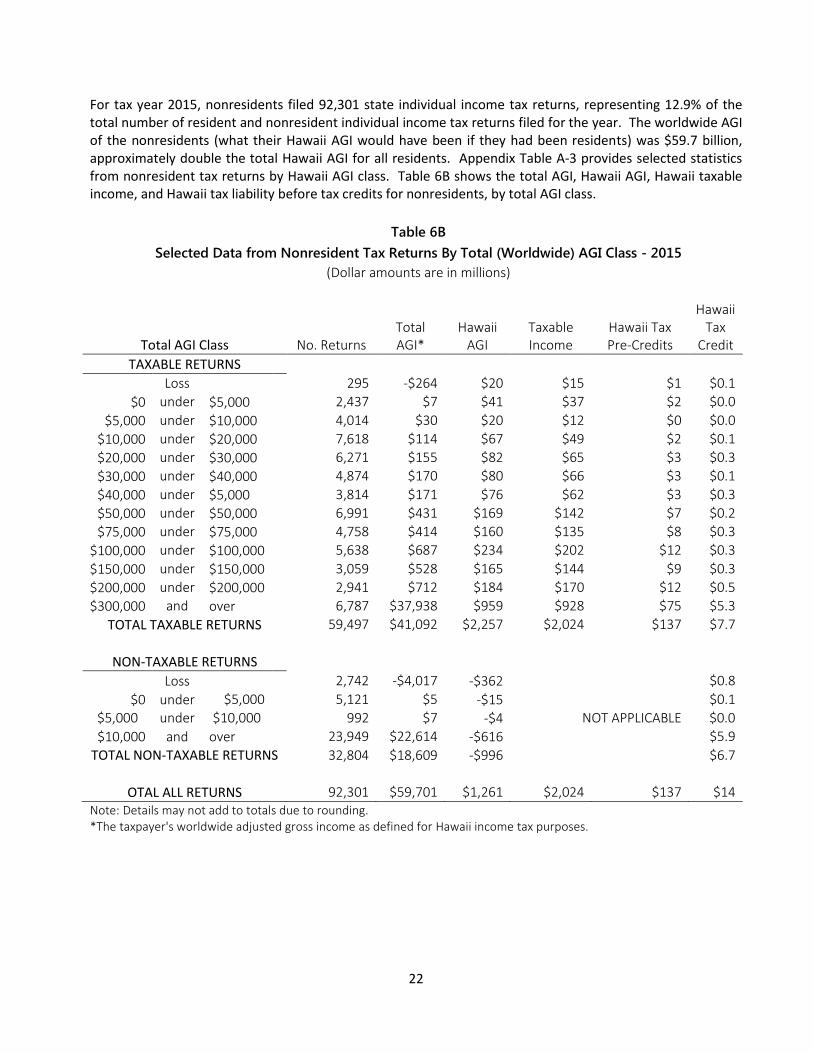
22
For tax year 2015, nonresidents filed 92,301 state individual income tax returns, representing 12.9% of the total number of resident and nonresident individual income tax returns filed for the year. The worldwide AGI of the nonresidents (what their Hawaii AGI would have been if they had been residents) was $59.7 billion, approximately double the total Hawaii AGI for all residents. Appendix Table A-3 provides selected statistics from nonresident tax returns by Hawaii AGI class. Table 6B shows the total AGI, Hawaii AGI, Hawaii taxable income, and Hawaii tax liability before tax credits for nonresidents, by total AGI class.
Table 6B
Selected Data from Nonresident Tax Returns By Total (Worldwide) AGI Class - 2015
(Dollar amounts are in millions)
Total AGI Class No. Returns Total AGI*
Hawaii AGI
Taxable Income
Hawaii Tax Pre-Credits
Hawaii Tax
Credit
TAXABLE RETURNS
Loss
295 -$264 $20 $15 $1 $0.1
$0 under $5,000
2,437 $7 $41 $37 $2 $0.0
$5,000 under $10,000
4,014 $30 $20 $12 $0 $0.0
$10,000 under $20,000
7,618 $114 $67 $49 $2 $0.1
$20,000 under $30,000
6,271 $155 $82 $65 $3 $0.3
$30,000 under $40,000
4,874 $170 $80 $66 $3 $0.1
$40,000 under $5,000
3,814 $171 $76 $62 $3 $0.3
$50,000 under $50,000
6,991 $431 $169 $142 $7 $0.2
$75,000 under $75,000
4,758 $414 $160 $135 $8 $0.3
$100,000 under $100,000
5,638 $687 $234 $202 $12 $0.3
$150,000 under $150,000
3,059 $528 $165 $144 $9 $0.3
$200,000 under $200,000
2,941 $712 $184 $170 $12 $0.5
$300,000 and over
6,787 $37,938 $959 $928 $75 $5.3
TOTAL TAXABLE RETURNS 59,497 $41,092 $2,257 $2,024 $137 $7.7
NON-TAXABLE RETURNS
Loss
2,742 -$4,017 -$362
$0.8
$0 under $5,000
5,121 $5 -$15
$0.1
$5,000 under $10,000
992 $7 -$4 NOT APPLICABLE $0.0
$10,000 and over
23,949 $22,614 -$616
$5.9
TOTAL NON-TAXABLE RETURNS 32,804 $18,609 -$996
$6.7
OTAL ALL RETURNS 92,301 $59,701 $1,261 $2,024 $137 $14 Note: Details may not add to totals due to rounding. *The taxpayer's worldwide adjusted gross income as defined for Hawaii income tax purposes.
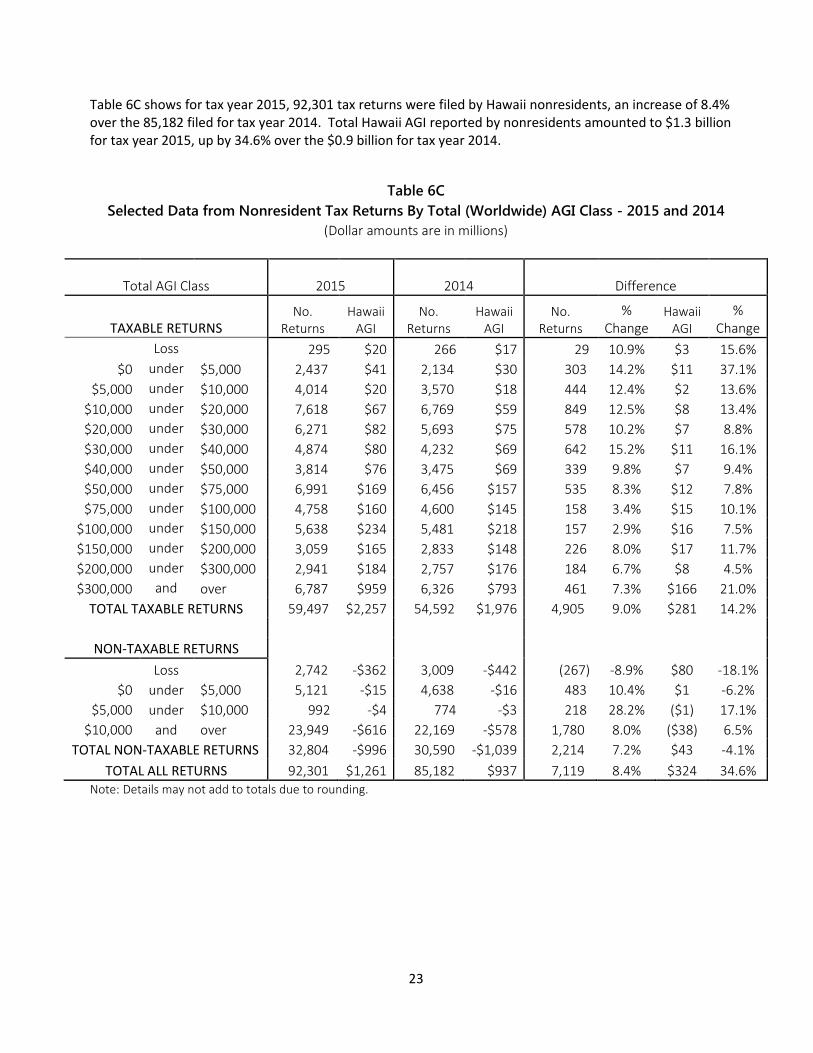
23
Table 6C shows for tax year 2015, 92,301 tax returns were filed by Hawaii nonresidents, an increase of 8.4% over the 85,182 filed for tax year 2014. Total Hawaii AGI reported by nonresidents amounted to $1.3 billion for tax year 2015, up by 34.6% over the $0.9 billion for tax year 2014.
Note: Details may not add to totals due to rounding.
Table 6C
Selected Data from Nonresident Tax Returns By Total (Worldwide) AGI Class - 2015 and 2014
(Dollar amounts are in millions)
Total AGI Class 2015 2014 Difference
TAXABLE RETURNS No.
Returns Hawaii
AGI No.
Returns Hawaii
AGI No.
Returns
% Change
Hawaii AGI
% Change
Loss 295 $20 266 $17 29 10.9% $3 15.6%
$0 under $5,000 2,437 $41 2,134 $30 303 14.2% $11 37.1%
$5,000 under $10,000 4,014 $20 3,570 $18 444 12.4% $2 13.6%
$10,000 under $20,000 7,618 $67 6,769 $59 849 12.5% $8 13.4%
$20,000 under $30,000 6,271 $82 5,693 $75 578 10.2% $7 8.8%
$30,000 under $40,000 4,874 $80 4,232 $69 642 15.2% $11 16.1%
$40,000 under $50,000 3,814 $76 3,475 $69 339 9.8% $7 9.4%
$50,000 under $75,000 6,991 $169 6,456 $157 535 8.3% $12 7.8%
$75,000 under $100,000 4,758 $160 4,600 $145 158 3.4% $15 10.1%
$100,000 under $150,000 5,638 $234 5,481 $218 157 2.9% $16 7.5%
$150,000 under $200,000 3,059 $165 2,833 $148 226 8.0% $17 11.7%
$200,000 under $300,000 2,941 $184 2,757 $176 184 6.7% $8 4.5%
$300,000 and over 6,787 $959 6,326 $793 461 7.3% $166 21.0%
TOTAL TAXABLE RETURNS 59,497 $2,257 54,592 $1,976 4,905 9.0% $281 14.2%
NON-TAXABLE RETURNS
Loss 2,742 -$362 3,009 -$442 (267) -8.9% $80 -18.1%
$0 under $5,000 5,121 -$15 4,638 -$16 483 10.4% $1 -6.2%
$5,000 under $10,000 992 -$4 774 -$3 218 28.2% ($1) 17.1%
$10,000 and over 23,949 -$616 22,169 -$578 1,780 8.0% ($38) 6.5%
TOTAL NON-TAXABLE RETURNS 32,804 -$996 30,590 -$1,039 2,214 7.2% $43 -4.1%
TOTAL ALL RETURNS 92,301 $1,261 85,182 $937 7,119 8.4% $324 34.6%
24
State Nonresident Deductions and Personal Exemptions
Nonresidents must prorate the standard deduction and personal exemption amounts to determine their Hawaii taxable income. The prorated amounts are determined using the ratio of Hawaii AGI to worldwide AGI. Hawaii AGI, less the prorated exemption amount, and less either the Hawaii itemized deductions or the prorated standard deduction, equals Hawaii taxable income. In 2015, 61,077 nonresident tax returns had the standard deduction and 31,224 nonresident tax returns had allowable itemized deductions. The nonresidents claimed prorated itemized deductions of $1,140 million, but their allowable itemized deductions were only $415 million. Their prorated standard deductions totaled $77 million and their prorated exemptions totaled $53 million.
State Nonresident Taxable income and Tax Liability
As shown in Table 6B, income and Hawaii tax liability of the nonresidents is heavily skewed towards the high end of the income distribution. Nonresidents with taxable returns reported $2.02 billion in taxable income in 2015 on total Hawaii AGI of $2.26 billion. Their total Hawaii tax liability before tax credits was $137 million, of which $75 million (54%) was owed by nonresidents with worldwide AGI of $300,000 or more. Though not shown in Table 6B, nonresidents had total Hawaii tax liability after tax credits of $123 million, including negative amounts of tax owed by nonresidents with nontaxable returns. The average tax liability before tax credits per nonresident return with taxable income was $2,306 and the average net tax liability after tax credits was $2,064.
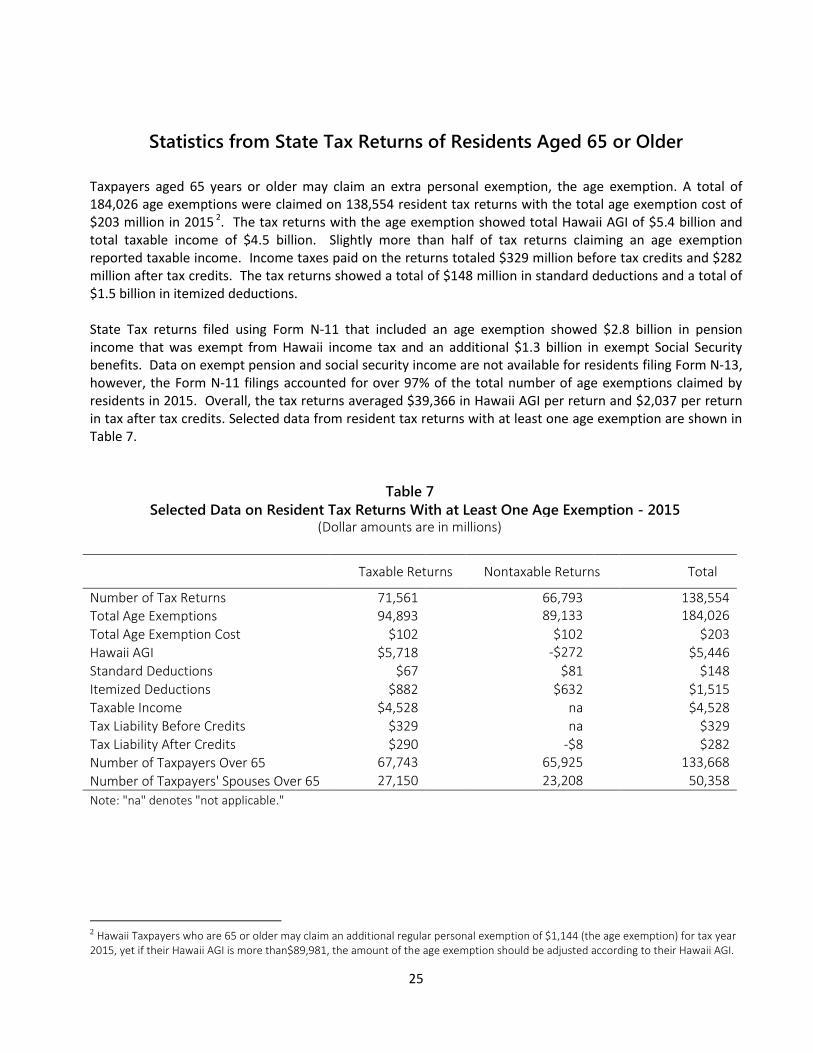
25
Statistics from State Tax Returns of Residents Aged 65 or Older
Taxpayers aged 65 years or older may claim an extra personal exemption, the age exemption. A total of 184,026 age exemptions were claimed on 138,554 resident tax returns with the total age exemption cost of $203 million in 2015 2. The tax returns with the age exemption showed total Hawaii AGI of $5.4 billion and total taxable income of $4.5 billion. Slightly more than half of tax returns claiming an age exemption reported taxable income. Income taxes paid on the returns totaled $329 million before tax credits and $282 million after tax credits. The tax returns showed a total of $148 million in standard deductions and a total of $1.5 billion in itemized deductions. State Tax returns filed using Form N-11 that included an age exemption showed $2.8 billion in pension income that was exempt from Hawaii income tax and an additional $1.3 billion in exempt Social Security benefits. Data on exempt pension and social security income are not available for residents filing Form N-13, however, the Form N-11 filings accounted for over 97% of the total number of age exemptions claimed by residents in 2015. Overall, the tax returns averaged $39,366 in Hawaii AGI per return and $2,037 per return in tax after tax credits. Selected data from resident tax returns with at least one age exemption are shown in Table 7.
Table 7 Selected Data on Resident Tax Returns With at Least One Age Exemption - 2015
(Dollar amounts are in millions)
Taxable Returns Nontaxable Returns Total
Number of Tax Returns 71,561
66,793 66,793
138,554 138,354 Total Age Exemptions 94,893
89,133
66,793 184,026 138,354 Total Age Exemption Cost $102
$102
$203
Hawaii AGI $5,718
-$272 -$272
$5,446 Standard Deductions $67
$81
$148
Itemized Deductions $882
$632
$1,515 Taxable Income $4,528
na
$4,528
Tax Liability Before Credits $329
na
$329 Tax Liability After Credits $290
-$8
$282
Number of Taxpayers Over 65 67,743 67,743
65,925 65,92320825
133,668 133,668 Number of Taxpayers' Spouses Over 65 27,150
27,150 23,208
23,208 50,358
50,358
Note: "na" denotes "not applicable."
2 Hawaii Taxpayers who are 65 or older may claim an additional regular personal exemption of $1,144 (the age exemption) for tax year 2015, yet if their Hawaii AGI is more than$89,981, the amount of the age exemption should be adjusted according to their Hawaii AGI.
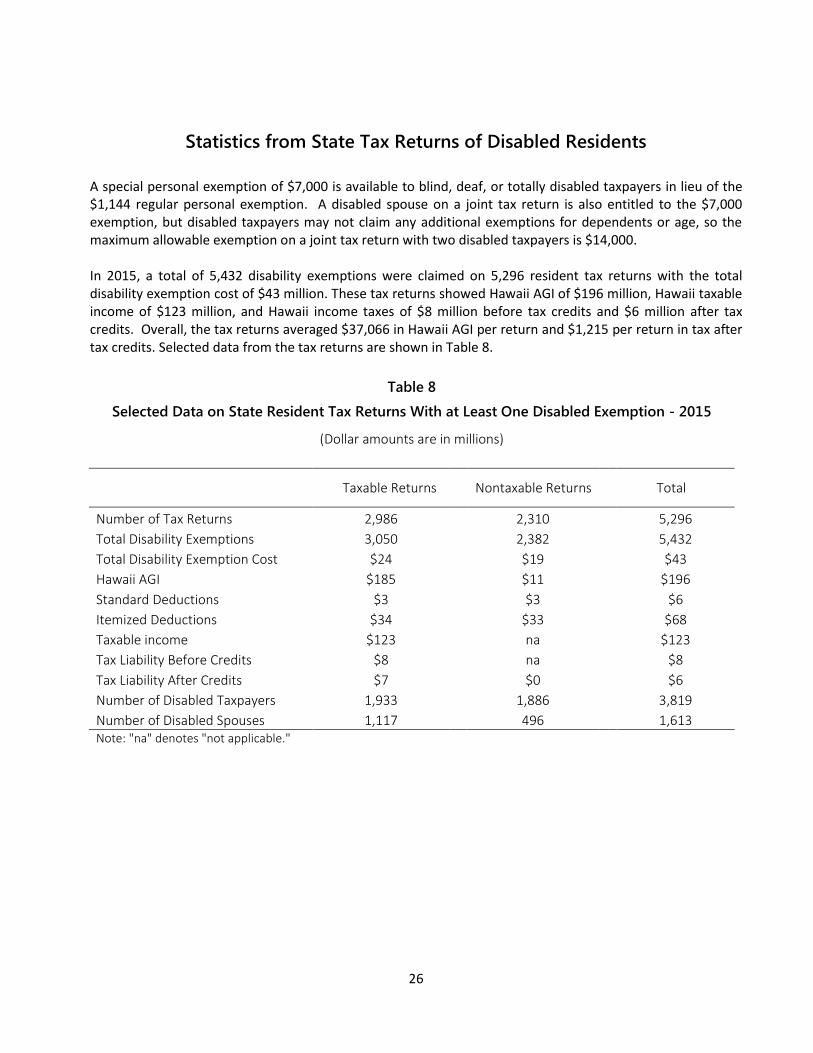
26
Statistics from State Tax Returns of Disabled Residents
A special personal exemption of $7,000 is available to blind, deaf, or totally disabled taxpayers in lieu of the $1,144 regular personal exemption. A disabled spouse on a joint tax return is also entitled to the $7,000 exemption, but disabled taxpayers may not claim any additional exemptions for dependents or age, so the maximum allowable exemption on a joint tax return with two disabled taxpayers is $14,000. In 2015, a total of 5,432 disability exemptions were claimed on 5,296 resident tax returns with the total disability exemption cost of $43 million. These tax returns showed Hawaii AGI of $196 million, Hawaii taxable income of $123 million, and Hawaii income taxes of $8 million before tax credits and $6 million after tax credits. Overall, the tax returns averaged $37,066 in Hawaii AGI per return and $1,215 per return in tax after tax credits. Selected data from the tax returns are shown in Table 8.
Table 8
Selected Data on State Resident Tax Returns With at Least One Disabled Exemption - 2015
(Dollar amounts are in millions)
Taxable Returns Nontaxable Returns Total
Number of Tax Returns 2,986
2,310
5,296
Total Disability Exemptions 3,050
2,382
5,432
Total Disability Exemption Cost $24
$19
$43
Hawaii AGI $185
$11
$196
Standard Deductions $3
$3
$6
Itemized Deductions $34
$33
$68
Taxable income $123
na
$123
Tax Liability Before Credits $8
na
$8
Tax Liability After Credits $7
$0
$6
Number of Disabled Taxpayers 1,933
1,886
3,819
Number of Disabled Spouses 1,117
496
1,613 Note: "na" denotes "not applicable."
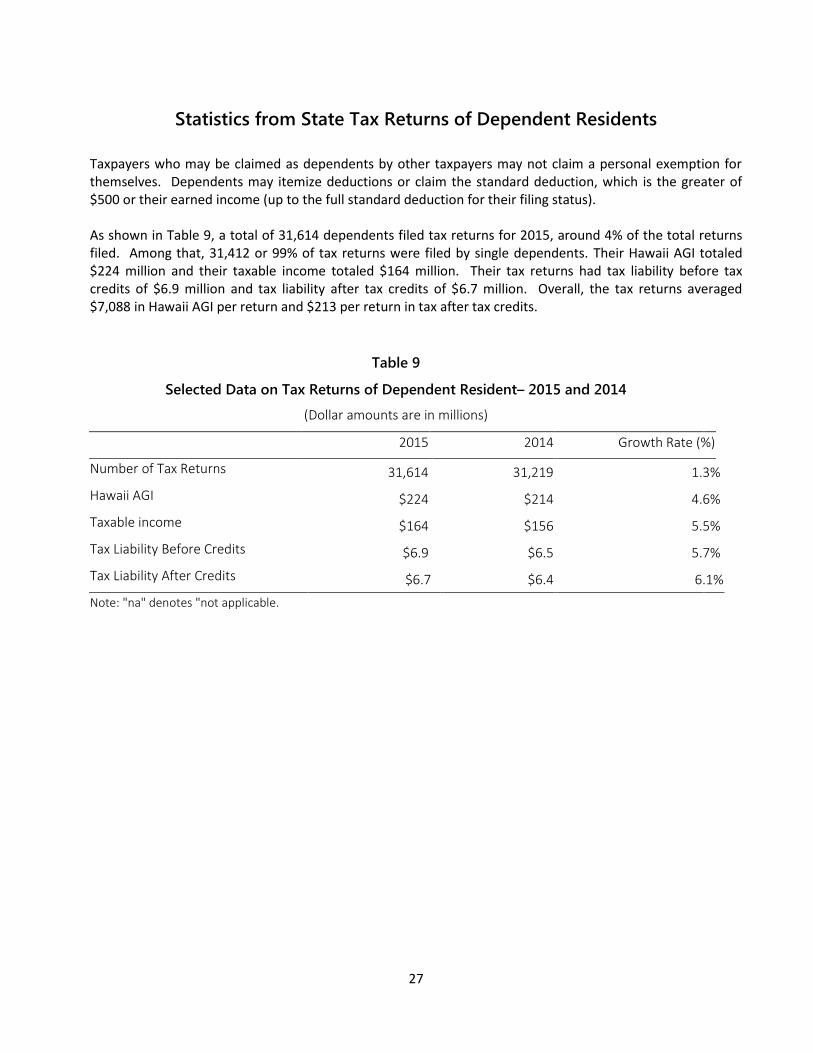
27
Statistics from State Tax Returns of Dependent Residents
Taxpayers who may be claimed as dependents by other taxpayers may not claim a personal exemption for themselves. Dependents may itemize deductions or claim the standard deduction, which is the greater of $500 or their earned income (up to the full standard deduction for their filing status). As shown in Table 9, a total of 31,614 dependents filed tax returns for 2015, around 4% of the total returns filed. Among that, 31,412 or 99% of tax returns were filed by single dependents. Their Hawaii AGI totaled $224 million and their taxable income totaled $164 million. Their tax returns had tax liability before tax credits of $6.9 million and tax liability after tax credits of $6.7 million. Overall, the tax returns averaged $7,088 in Hawaii AGI per return and $213 per return in tax after tax credits.
Table 9
Selected Data on Tax Returns of Dependent Resident– 2015 and 2014
(Dollar amounts are in millions)
2015 2014 Growth Rate (%)
Number of Tax Returns 31,614 31,219
1.3%
Hawaii AGI $224
$214
4.6%
Taxable income $164
$156
5.5%
Tax Liability Before Credits $6.9
$6.5
5.7%
Tax Liability After Credits $6.7 $6.4 6.1%
Note: "na" denotes "not applicable.
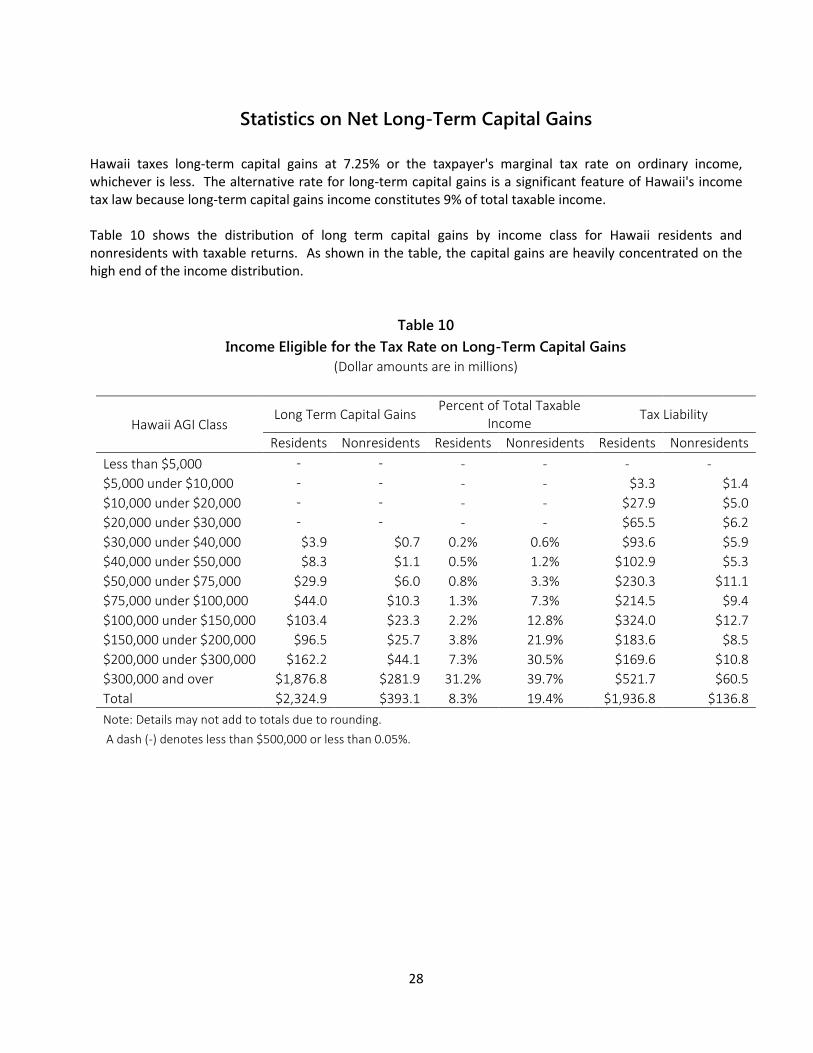
28
Statistics on Net Long-Term Capital Gains
Hawaii taxes long-term capital gains at 7.25% or the taxpayer's marginal tax rate on ordinary income, whichever is less. The alternative rate for long-term capital gains is a significant feature of Hawaii's income tax law because long-term capital gains income constitutes 9% of total taxable income. Table 10 shows the distribution of long term capital gains by income class for Hawaii residents and nonresidents with taxable returns. As shown in the table, the capital gains are heavily concentrated on the high end of the income distribution.
Table 10
Income Eligible for the Tax Rate on Long-Term Capital Gains
(Dollar amounts are in millions)
Hawaii AGI Class Long Term Capital Gains
Percent of Total Taxable Income
Tax Liability
Residents Nonresidents Residents Nonresidents Residents Nonresidents
Less than $5,000 - - - - - -
$5,000 under $10,000 - - - - $3.3 $1.4
$10,000 under $20,000 - - - - $27.9 $5.0
$20,000 under $30,000 - - - - $65.5 $6.2
$30,000 under $40,000 $3.9 $0.7 0.2% 0.6% $93.6 $5.9
$40,000 under $50,000 $8.3 $1.1 0.5% 1.2% $102.9 $5.3
$50,000 under $75,000 $29.9 $6.0 0.8% 3.3% $230.3 $11.1
$75,000 under $100,000 $44.0 $10.3 1.3% 7.3% $214.5 $9.4
$100,000 under $150,000 $103.4 $23.3 2.2% 12.8% $324.0 $12.7
$150,000 under $200,000 $96.5 $25.7 3.8% 21.9% $183.6 $8.5
$200,000 under $300,000 $162.2 $44.1 7.3% 30.5% $169.6 $10.8
$300,000 and over $1,876.8 $281.9 31.2% 39.7% $521.7 $60.5
Total $2,324.9 $393.1 8.3% 19.4% $1,936.8 $136.8
Note: Details may not add to totals due to rounding.
A dash (-) denotes less than $500,000 or less than 0.05%.
29
APPENDIX
STATISTICAL
TABLES
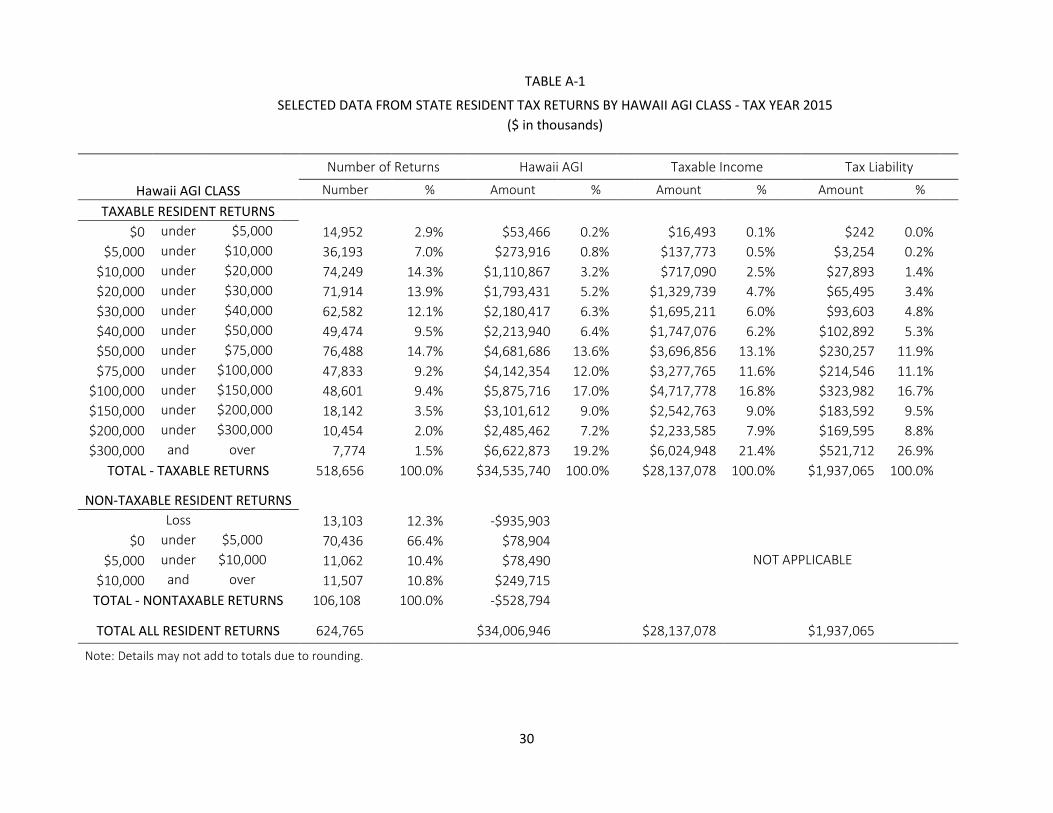
30
TABLE A-1
SELECTED DATA FROM STATE RESIDENT TAX RETURNS BY HAWAII AGI CLASS - TAX YEAR 2015
($ in thousands)
Number of Returns Hawaii AGI Taxable Income Tax Liability
Hawaii AGI CLASS Number % Amount % Amount % Amount %
TAXABLE RESIDENT RETURNS
$0 under $5,000
14,952
2.9%
$53,466 0.2%
$16,493 0.1%
$242 0.0% $5,000 under $10,000
36,193
7.0%
$273,916 0.8%
$137,773 0.5%
$3,254 0.2%
$10,000 under $20,000
74,249
14.3%
$1,110,867 3.2%
$717,090 2.5%
$27,893 1.4% $20,000 under $30,000
71,914
13.9%
$1,793,431 5.2%
$1,329,739 4.7%
$65,495 3.4%
$30,000 under $40,000
62,582
12.1%
$2,180,417 6.3%
$1,695,211 6.0%
$93,603 4.8% $40,000 under $50,000
49,474
9.5%
$2,213,940 6.4%
$1,747,076 6.2%
$102,892 5.3%
$50,000 under $75,000
76,488
14.7%
$4,681,686 13.6%
$3,696,856 13.1%
$230,257 11.9% $75,000 under $100,000
47,833
9.2%
$4,142,354 12.0%
$3,277,765 11.6%
$214,546 11.1%
$100,000 under $150,000
48,601
9.4%
$5,875,716 17.0%
$4,717,778 16.8%
$323,982 16.7% $150,000 under $200,000
18,142
3.5%
$3,101,612 9.0%
$2,542,763 9.0%
$183,592 9.5%
$200,000 under $300,000
10,454
2.0%
$2,485,462 7.2%
$2,233,585 7.9%
$169,595 8.8% $300,000 and over
7,774
1.5%
$6,622,873 19.2%
$6,024,948 21.4%
$521,712 26.9%
TOTAL - TAXABLE RETURNS 518,656
100.0%
$34,535,740 100.0%
$28,137,078 100.0%
$1,937,065 100.0%
NON-TAXABLE RESIDENT RETURNS
Loss
13,103
12.3%
-$935,903
$0 under $5,000
70,436
66.4%
$78,904
$5,000 under $10,000
11,062
10.4%
$78,490
NOT APPLICABLE
$10,000 and over
11,507
10.8%
$249,715
TOTAL - NONTAXABLE RETURNS 106,108
100.0%
-$528,794
TOTAL ALL RESIDENT RETURNS 624,765 $34,006,946 $28,137,078 $1,937,065
Note: Details may not add to totals due to rounding.
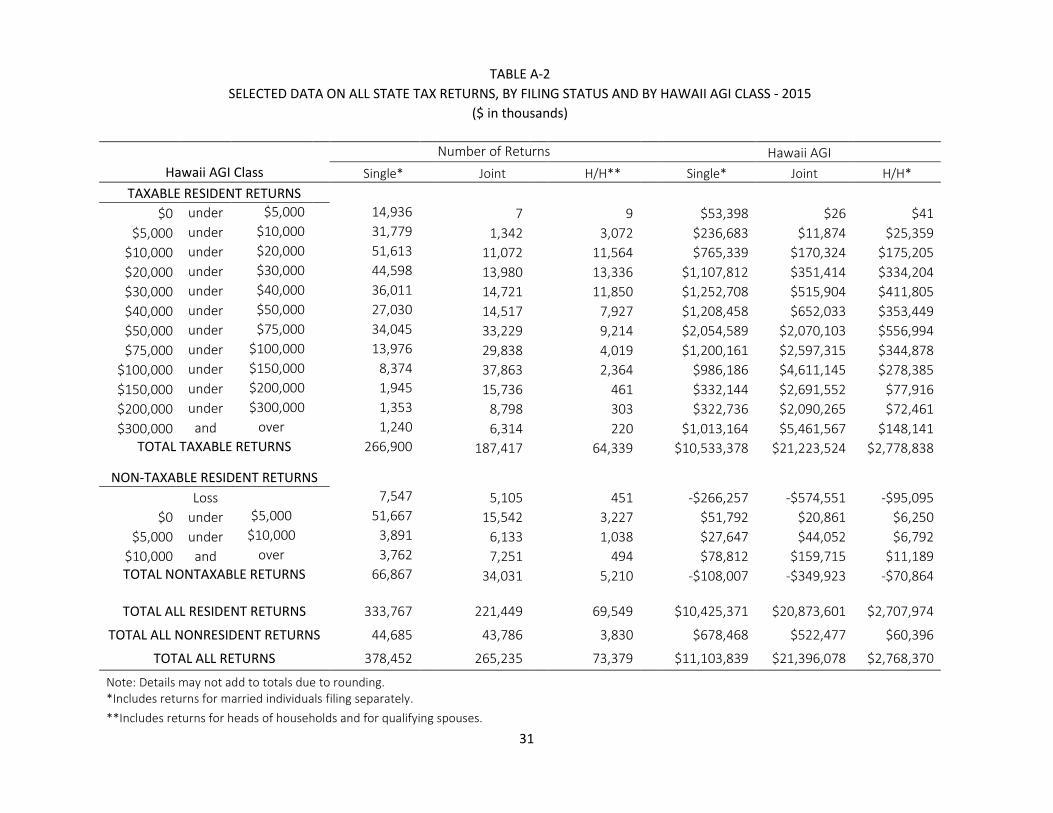
31
TABLE A-2
SELECTED DATA ON ALL STATE TAX RETURNS, BY FILING STATUS AND BY HAWAII AGI CLASS - 2015
($ in thousands)
Number of Returns Hawaii AGI
Hawaii AGI Class Single* Joint H/H** Single* Joint H/H*
TAXABLE RESIDENT RETURNS
$0 under $5,000 14,936 7
9
$53,398 $26 $41
$5,000 under $10,000 31,779 1,342
3,072
$236,683 $11,874 $25,359
$10,000 under $20,000 51,613 11,072
11,564
$765,339 $170,324 $175,205
$20,000 under $30,000 44,598 13,980
13,336
$1,107,812 $351,414 $334,204
$30,000 under $40,000 36,011 14,721
11,850
$1,252,708 $515,904 $411,805
$40,000 under $50,000 27,030 14,517
7,927
$1,208,458 $652,033 $353,449
$50,000 under $75,000 34,045 33,229
9,214
$2,054,589 $2,070,103 $556,994
$75,000 under $100,000 13,976 29,838
4,019
$1,200,161 $2,597,315 $344,878
$100,000 under $150,000 8,374 37,863
2,364
$986,186 $4,611,145 $278,385
$150,000 under $200,000 1,945 15,736
461
$332,144 $2,691,552 $77,916
$200,000 under $300,000 1,353 8,798
303
$322,736 $2,090,265 $72,461
$300,000 and over 1,240 6,314
220
$1,013,164 $5,461,567 $148,141 TOTAL TAXABLE RETURNS 266,900 187,417
64,339
$10,533,378 $21,223,524 $2,778,838
NON-TAXABLE RESIDENT RETURNS
Loss 7,547 5,105
451
-$266,257 -$574,551 -$95,095
$0 under $5,000 51,667 15,542
3,227
$51,792 $20,861 $6,250
$5,000 under $10,000 3,891 6,133
1,038
$27,647 $44,052 $6,792
$10,000 and over 3,762 7,251
494
$78,812 $159,715 $11,189 TOTAL NONTAXABLE RETURNS 66,867 34,031
5,210
-$108,007 -$349,923 -$70,864
TOTAL ALL RESIDENT RETURNS 333,767
221,449
69,549
$10,425,371 $20,873,601 $2,707,974
TOTAL ALL NONRESIDENT RETURNS 44,685
43,786
3,830
$678,468 $522,477 $60,396
TOTAL ALL RETURNS 378,452 265,235 73,379 $11,103,839 $21,396,078 $2,768,370
Note: Details may not add to totals due to rounding.
*Includes returns for married individuals filing separately.
**Includes returns for heads of households and for qualifying spouses.
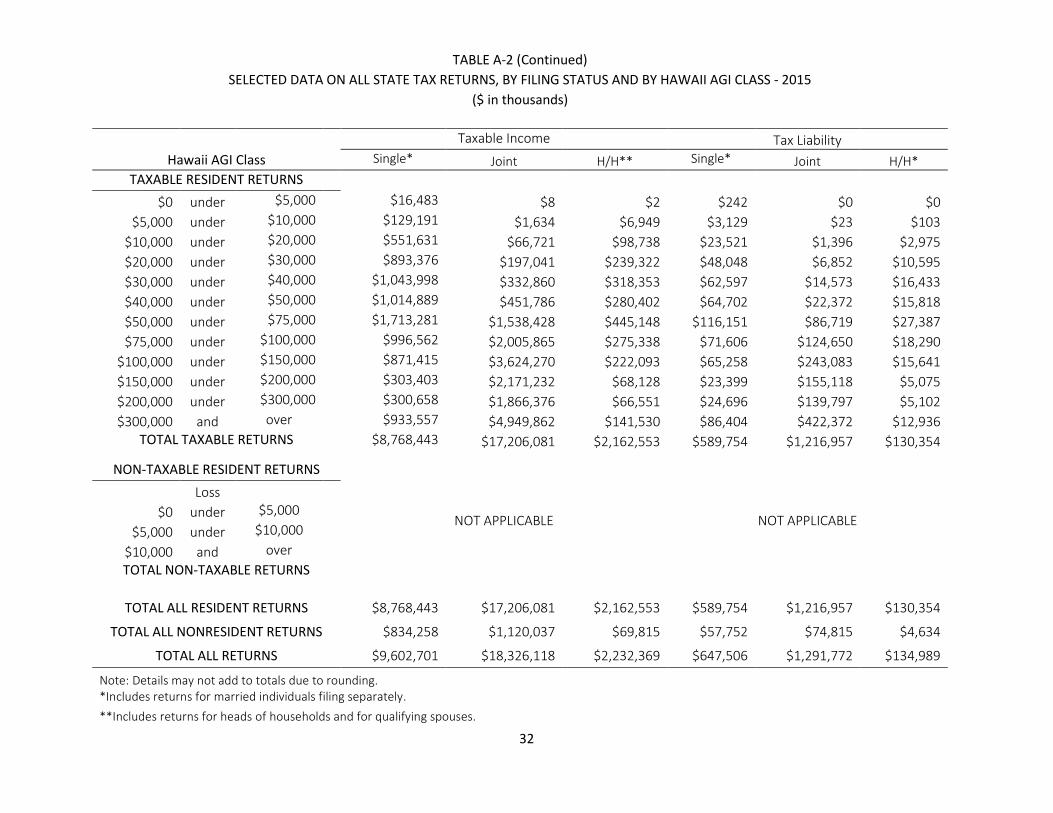
32
TABLE A-2 (Continued)
SELECTED DATA ON ALL STATE TAX RETURNS, BY FILING STATUS AND BY HAWAII AGI CLASS - 2015
($ in thousands)
Taxable Income Tax Liability
Hawaii AGI Class Single* Joint H/H** Single* Joint H/H*
TAXABLE RESIDENT RETURNS
$0 under $5,000 $16,483 $8 $2 $242 $0 $0
$5,000 under $10,000 $129,191 $1,634 $6,949 $3,129 $23 $103
$10,000 under $20,000 $551,631 $66,721 $98,738 $23,521 $1,396 $2,975
$20,000 under $30,000 $893,376 $197,041 $239,322 $48,048 $6,852 $10,595
$30,000 under $40,000 $1,043,998 $332,860 $318,353 $62,597 $14,573 $16,433
$40,000 under $50,000 $1,014,889 $451,786 $280,402 $64,702 $22,372 $15,818
$50,000 under $75,000 $1,713,281 $1,538,428 $445,148 $116,151 $86,719 $27,387
$75,000 under $100,000 $996,562 $2,005,865 $275,338 $71,606 $124,650 $18,290
$100,000 under $150,000 $871,415 $3,624,270 $222,093 $65,258 $243,083 $15,641
$150,000 under $200,000 $303,403 $2,171,232 $68,128 $23,399 $155,118 $5,075
$200,000 under $300,000 $300,658 $1,866,376 $66,551 $24,696 $139,797 $5,102
$300,000 and over $933,557 $4,949,862 $141,530 $86,404 $422,372 $12,936 TOTAL TAXABLE RETURNS $8,768,443 $17,206,081 $2,162,553 $589,754 $1,216,957 $130,354
NON-TAXABLE RESIDENT RETURNS
NOT APPLICABLE NOT APPLICABLE
Loss
$0 under $5,000
$5,000 under $10,000
$10,000 and over
TOTAL NON-TAXABLE RETURNS
TOTAL ALL RESIDENT RETURNS $8,768,443 $17,206,081 $2,162,553 $589,754 $1,216,957 $130,354
TOTAL ALL NONRESIDENT RETURNS $834,258 $1,120,037 $69,815 $57,752 $74,815 $4,634
TOTAL ALL RETURNS $9,602,701 $18,326,118 $2,232,369 $647,506 $1,291,772 $134,989
Note: Details may not add to totals due to rounding.
*Includes returns for married individuals filing separately.
**Includes returns for heads of households and for qualifying spouses.
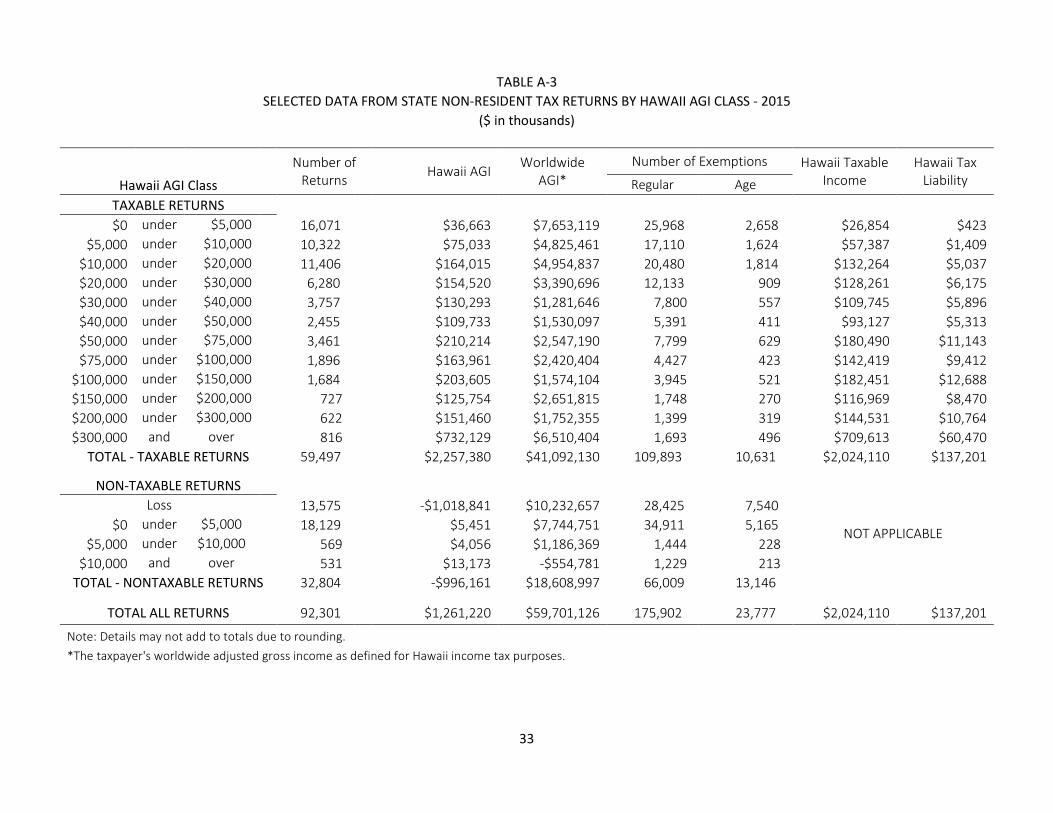
33
TABLE A-3
SELECTED DATA FROM STATE NON-RESIDENT TAX RETURNS BY HAWAII AGI CLASS - 2015
($ in thousands)
Number of
Returns Hawaii AGI
Worldwide AGI*
Number of Exemptions Hawaii Taxable Income
Hawaii Tax Liability Hawaii AGI Class Regular Age
TAXABLE RETURNS $0 under $5,000
16,071
$36,663 $7,653,119 25,968 2,658 $26,854 $423
$5,000 under $10,000
10,322
$75,033 $4,825,461 17,110 1,624 $57,387 $1,409
$10,000 under $20,000
11,406
$164,015 $4,954,837 20,480 1,814 $132,264 $5,037
$20,000 under $30,000
6,280
$154,520 $3,390,696 12,133 909 $128,261 $6,175
$30,000 under $40,000
3,757
$130,293 $1,281,646 7,800 557 $109,745 $5,896
$40,000 under $50,000
2,455
$109,733 $1,530,097 5,391 411 $93,127 $5,313
$50,000 under $75,000
3,461
$210,214 $2,547,190 7,799 629 $180,490 $11,143
$75,000 under $100,000
1,896
$163,961 $2,420,404 4,427 423 $142,419 $9,412
$100,000 under $150,000
1,684
$203,605 $1,574,104 3,945 521 $182,451 $12,688
$150,000 under $200,000
727
$125,754 $2,651,815 1,748 270 $116,969 $8,470
$200,000 under $300,000
622
$151,460 $1,752,355 1,399 319 $144,531 $10,764
$300,000 and over
816
$732,129 $6,510,404 1,693 496 $709,613 $60,470
TOTAL - TAXABLE RETURNS 59,497
$2,257,380 $41,092,130 109,893 10,631 $2,024,110 $137,201
NON-TAXABLE RETURNS
NOT APPLICABLE
Loss
13,575
-$1,018,841 $10,232,657 28,425 7,540
$0 under $5,000
18,129
$5,451 $7,744,751 34,911 5,165
$5,000 under $10,000
569
$4,056 $1,186,369 1,444 228
$10,000 and over
531
$13,173 -$554,781 1,229 213
TOTAL - NONTAXABLE RETURNS 32,804
-$996,161 $18,608,997 66,009 13,146
TOTAL ALL RETURNS 92,301 $1,261,220 $59,701,126 175,902 23,777 $2,024,110 $137,201
Note: Details may not add to totals due to rounding.
*The taxpayer's worldwide adjusted gross income as defined for Hawaii income tax purposes.
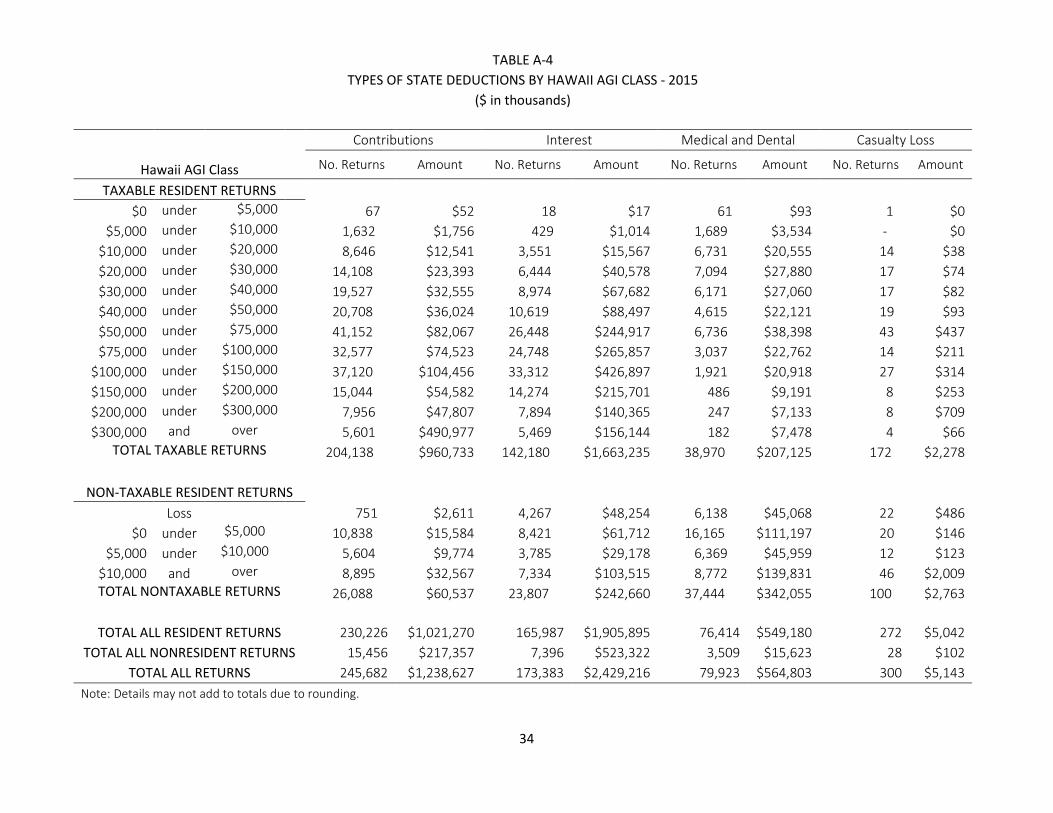
34
TABLE A-4
TYPES OF STATE DEDUCTIONS BY HAWAII AGI CLASS - 2015
($ in thousands)
Hawaii AGI Class
Contributions Interest Medical and Dental Casualty Loss
No. Returns Amount No. Returns Amount No. Returns Amount No. Returns Amount
TAXABLE RESIDENT RETURNS $0 under $5,000 67 $52 18 $17 61 $93 1 $0
$5,000 under $10,000 1,632 $1,756 429 $1,014 1,689 $3,534 - $0
$10,000 under $20,000 8,646 $12,541 3,551 $15,567 6,731 $20,555 14 $38
$20,000 under $30,000 14,108 $23,393 6,444 $40,578 7,094 $27,880 17 $74
$30,000 under $40,000 19,527 $32,555 8,974 $67,682 6,171 $27,060 17 $82
$40,000 under $50,000 20,708 $36,024 10,619 $88,497 4,615 $22,121 19 $93
$50,000 under $75,000 41,152 $82,067 26,448 $244,917 6,736 $38,398 43 $437
$75,000 under $100,000 32,577 $74,523 24,748 $265,857 3,037 $22,762 14 $211
$100,000 under $150,000 37,120 $104,456 33,312 $426,897 1,921 $20,918 27 $314
$150,000 under $200,000 15,044 $54,582 14,274 $215,701 486 $9,191 8 $253
$200,000 under $300,000 7,956 $47,807 7,894 $140,365 247 $7,133 8 $709
$300,000 and over 5,601 $490,977 5,469 $156,144 182 $7,478 4 $66 TOTAL TAXABLE RETURNS 204,138 $960,733 142,180 $1,663,235 38,970 $207,125 172 $2,278
NON-TAXABLE RESIDENT RETURNS
Loss 751 $2,611 4,267 $48,254 6,138 $45,068 22 $486
$0 under $5,000 10,838 $15,584 8,421 $61,712 16,165 $111,197 20 $146
$5,000 under $10,000 5,604 $9,774 3,785 $29,178 6,369 $45,959 12 $123
$10,000 and over 8,895 $32,567 7,334 $103,515 8,772 $139,831 46 $2,009 TOTAL NONTAXABLE RETURNS 26,088 $60,537 23,807 $242,660 37,444 $342,055 100 $2,763
TOTAL ALL RESIDENT RETURNS 230,226 $1,021,270 165,987 $1,905,895 76,414 $549,180 272 $5,042
TOTAL ALL NONRESIDENT RETURNS 15,456 $217,357 7,396 $523,322 3,509 $15,623 28 $102
TOTAL ALL RETURNS 245,682 $1,238,627 173,383 $2,429,216 79,923 $564,803 300 $5,143
Note: Details may not add to totals due to rounding.
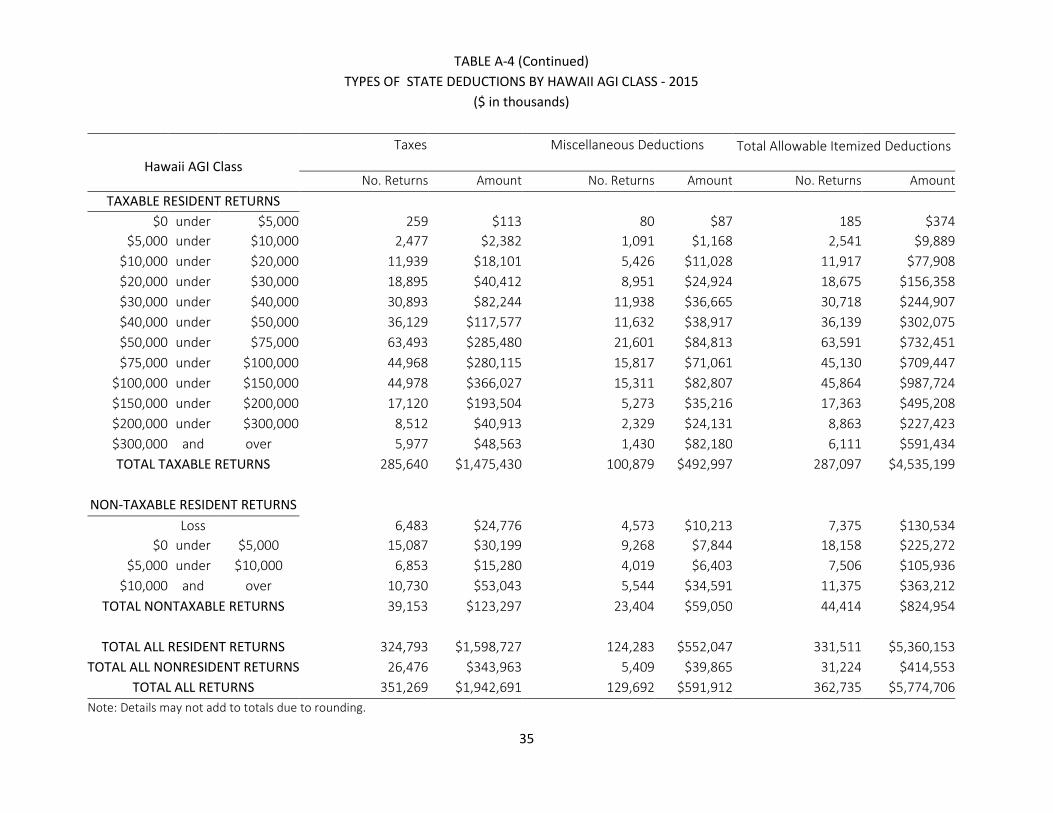
35
TABLE A-4 (Continued)
TYPES OF STATE DEDUCTIONS BY HAWAII AGI CLASS - 2015
($ in thousands)
Hawaii AGI Class
Taxes Miscellaneous Deductions Total Allowable Itemized Deductions
No. Returns Amount No. Returns Amount No. Returns Amount
TAXABLE RESIDENT RETURNS
$0 under $5,000 259 $113 80 $87 185 $374
$5,000 under $10,000 2,477 $2,382 1,091 $1,168 2,541 $9,889
$10,000 under $20,000 11,939 $18,101 5,426 $11,028 11,917 $77,908
$20,000 under $30,000 18,895 $40,412 8,951 $24,924 18,675 $156,358
$30,000 under $40,000 30,893 $82,244 11,938 $36,665 30,718 $244,907
$40,000 under $50,000 36,129 $117,577 11,632 $38,917 36,139 $302,075
$50,000 under $75,000 63,493 $285,480 21,601 $84,813 63,591 $732,451
$75,000 under $100,000 44,968 $280,115 15,817 $71,061 45,130 $709,447
$100,000 under $150,000 44,978 $366,027 15,311 $82,807 45,864 $987,724
$150,000 under $200,000 17,120 $193,504 5,273 $35,216 17,363 $495,208
$200,000 under $300,000 8,512 $40,913 2,329 $24,131 8,863 $227,423
$300,000 and over 5,977 $48,563 1,430 $82,180 6,111 $591,434
TOTAL TAXABLE RETURNS 285,640 $1,475,430 100,879 $492,997 287,097 $4,535,199
NON-TAXABLE RESIDENT RETURNS
Loss 6,483 $24,776 4,573 $10,213 7,375 $130,534
$0 under $5,000 15,087 $30,199 9,268 $7,844 18,158 $225,272
$5,000 under $10,000 6,853 $15,280 4,019 $6,403 7,506 $105,936
$10,000 and over 10,730 $53,043 5,544 $34,591 11,375 $363,212
TOTAL NONTAXABLE RETURNS 39,153 $123,297 23,404 $59,050 44,414 $824,954
TOTAL ALL RESIDENT RETURNS 324,793 $1,598,727 124,283 $552,047 331,511 $5,360,153
TOTAL ALL NONRESIDENT RETURNS 26,476 $343,963 5,409 $39,865 31,224 $414,553
TOTAL ALL RETURNS 351,269 $1,942,691 129,692 $591,912 362,735 $5,774,706
Note: Details may not add to totals due to rounding.
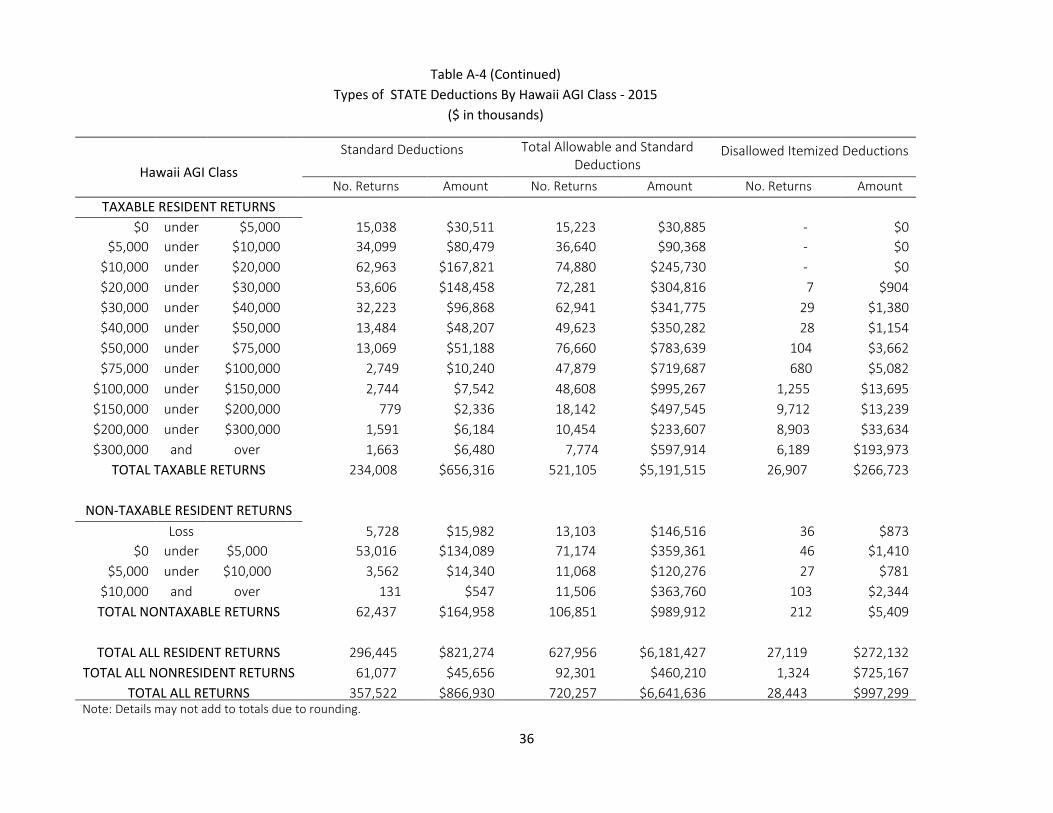
36
Table A-4 (Continued)
Types of STATE Deductions By Hawaii AGI Class - 2015
($ in thousands)
Hawaii AGI Class
Standard Deductions Total Allowable and Standard Deductions
Disallowed Itemized Deductions
No. Returns Amount No. Returns Amount No. Returns Amount
TAXABLE RESIDENT RETURNS
$0 under $5,000 15,038 $30,511 15,223 $30,885 - $0
$5,000 under $10,000 34,099 $80,479 36,640 $90,368 - $0
$10,000 under $20,000 62,963 $167,821 74,880 $245,730 - $0
$20,000 under $30,000 53,606 $148,458 72,281 $304,816 7 $904
$30,000 under $40,000 32,223 $96,868 62,941 $341,775 29 $1,380
$40,000 under $50,000 13,484 $48,207 49,623 $350,282 28 $1,154
$50,000 under $75,000 13,069 $51,188 76,660 $783,639 104 $3,662
$75,000 under $100,000 2,749 $10,240 47,879 $719,687 680 $5,082
$100,000 under $150,000 2,744 $7,542 48,608 $995,267 1,255 $13,695
$150,000 under $200,000 779 $2,336 18,142 $497,545 9,712 $13,239
$200,000 under $300,000 1,591 $6,184 10,454 $233,607 8,903 $33,634
$300,000 and over 1,663 $6,480 7,774 $597,914 6,189 $193,973
TOTAL TAXABLE RETURNS 234,008 $656,316 521,105 $5,191,515 26,907 $266,723
NON-TAXABLE RESIDENT RETURNS
Loss 5,728 $15,982 13,103 $146,516 36 $873
$0 under $5,000 53,016 $134,089 71,174 $359,361 46 $1,410
$5,000 under $10,000 3,562 $14,340 11,068 $120,276 27 $781
$10,000 and over 131 $547 11,506 $363,760 103 $2,344
TOTAL NONTAXABLE RETURNS 62,437 $164,958 106,851 $989,912 212 $5,409
TOTAL ALL RESIDENT RETURNS 296,445 $821,274 627,956 $6,181,427 27,119 $272,132
TOTAL ALL NONRESIDENT RETURNS 61,077 $45,656 92,301 $460,210 1,324 $725,167
TOTAL ALL RETURNS 357,522 $866,930 720,257 $6,641,636 28,443 $997,299
Note: Details may not add to totals due to rounding.
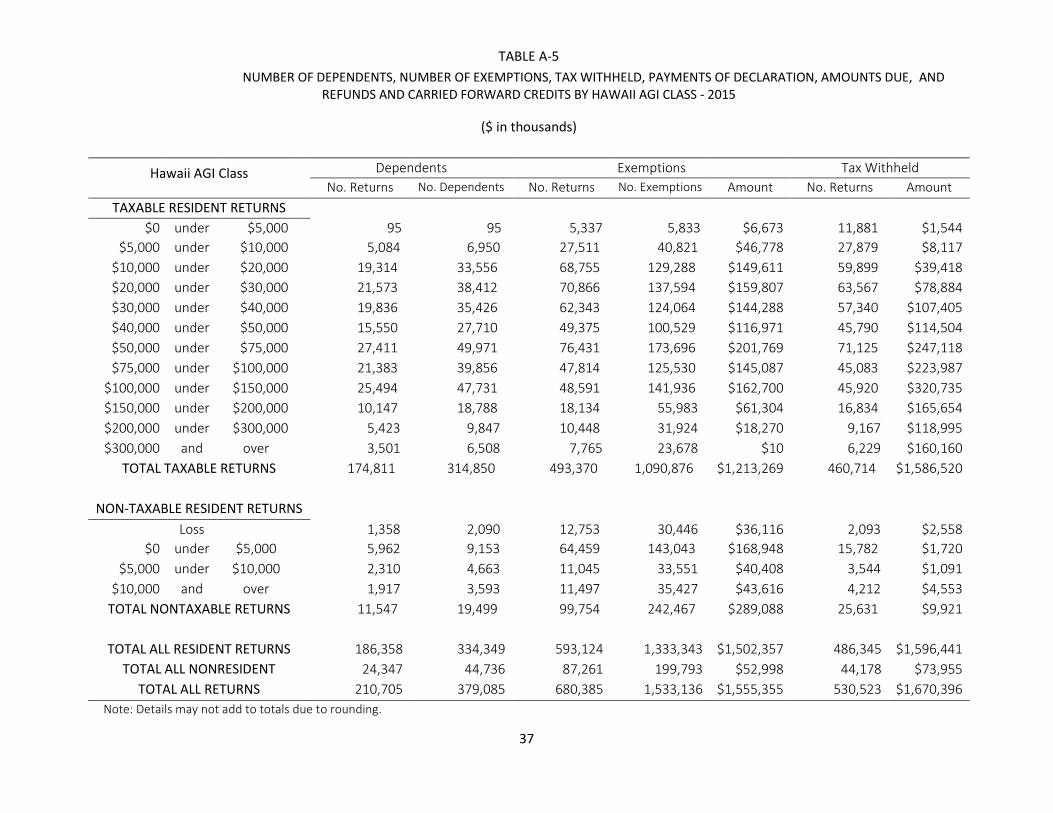
37
TABLE A-5
NUMBER OF DEPENDENTS, NUMBER OF EXEMPTIONS, TAX WITHHELD, PAYMENTS OF DECLARATION, AMOUNTS DUE, AND REFUNDS AND CARRIED FORWARD CREDITS BY HAWAII AGI CLASS - 2015
($ in thousands)
Hawaii AGI Class Dependents Exemptions Tax Withheld
No. Returns No. Dependents No. Returns No. Exemptions Amount No. Returns Amount
TAXABLE RESIDENT RETURNS
$0 under $5,000 95 95 5,337 5,833 $6,673 11,881 $1,544
$5,000 under $10,000 5,084 6,950 27,511 40,821 $46,778 27,879 $8,117
$10,000 under $20,000 19,314 33,556 68,755 129,288 $149,611 59,899 $39,418
$20,000 under $30,000 21,573 38,412 70,866 137,594 $159,807 63,567 $78,884
$30,000 under $40,000 19,836 35,426 62,343 124,064 $144,288 57,340 $107,405
$40,000 under $50,000 15,550 27,710 49,375 100,529 $116,971 45,790 $114,504
$50,000 under $75,000 27,411 49,971 76,431 173,696 $201,769 71,125 $247,118
$75,000 under $100,000 21,383 39,856 47,814 125,530 $145,087 45,083 $223,987
$100,000 under $150,000 25,494 47,731 48,591 141,936 $162,700 45,920 $320,735
$150,000 under $200,000 10,147 18,788 18,134 55,983 $61,304 16,834 $165,654
$200,000 under $300,000 5,423 9,847 10,448 31,924 $18,270 9,167 $118,995
$300,000 and over 3,501 6,508 7,765 23,678 $10 6,229 $160,160
TOTAL TAXABLE RETURNS 174,811 314,850 493,370 1,090,876 $1,213,269 460,714 $1,586,520
NON-TAXABLE RESIDENT RETURNS
Loss 1,358 2,090 12,753 30,446 $36,116 2,093 $2,558
$0 under $5,000 5,962 9,153 64,459 143,043 $168,948 15,782 $1,720
$5,000 under $10,000 2,310 4,663 11,045 33,551 $40,408 3,544 $1,091
$10,000 and over 1,917 3,593 11,497 35,427 $43,616 4,212 $4,553
TOTAL NONTAXABLE RETURNS 11,547 19,499 99,754 242,467 $289,088 25,631 $9,921
TOTAL ALL RESIDENT RETURNS 186,358 334,349 593,124 1,333,343 $1,502,357 486,345 $1,596,441
TOTAL ALL NONRESIDENT
RETURNS
24,347 44,736 87,261 199,793 $52,998 44,178 $73,955
TOTAL ALL RETURNS 210,705 379,085 680,385 1,533,136 $1,555,355 530,523 $1,670,396
Note: Details may not add to totals due to rounding.
TABLE A-5
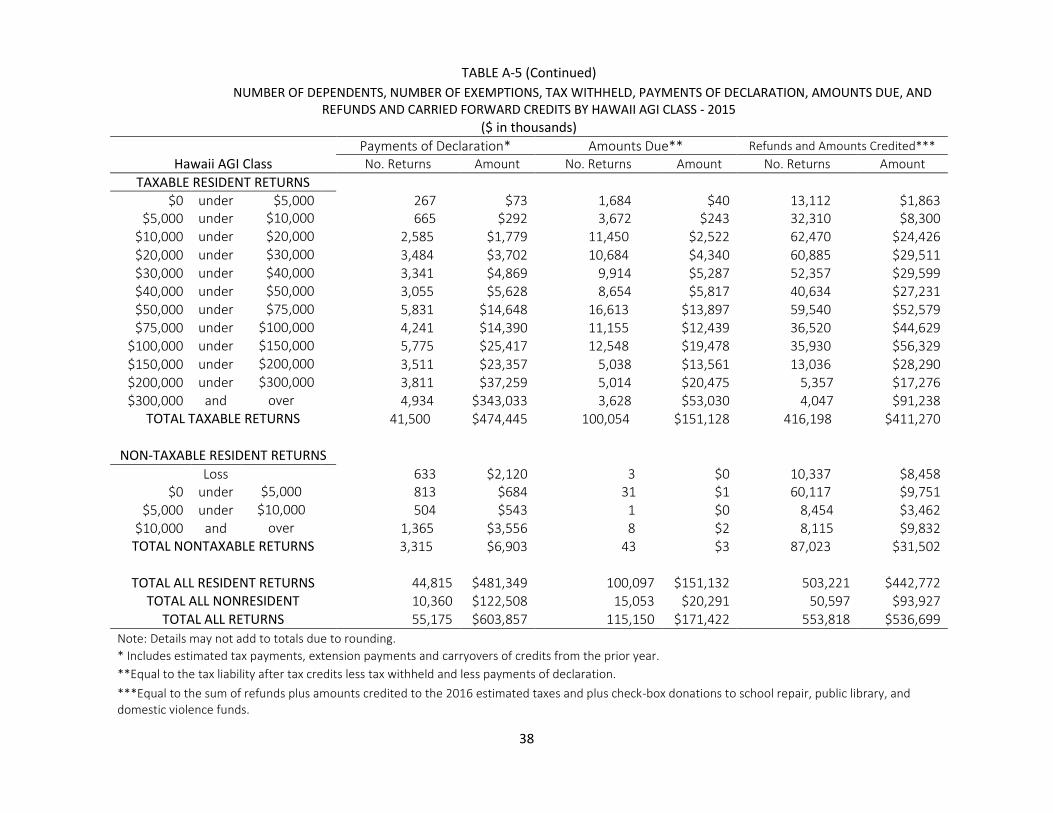
38
TABLE A-5 (Continued)
NUMBER OF DEPENDENTS, NUMBER OF EXEMPTIONS, TAX WITHHELD, PAYMENTS OF DECLARATION, AMOUNTS DUE, AND
REFUNDS AND CARRIED FORWARD CREDITS BY HAWAII AGI CLASS - 2015
($ in thousands)
Hawaii AGI Class Payments of Declaration* Amounts Due** Refunds and Amounts Credited***
No. Returns Amount No. Returns Amount No. Returns Amount
TAXABLE RESIDENT RETURNS
$0 under $5,000 267 $73 1,684 $40 13,112 $1,863
$5,000 under $10,000 665 $292 3,672 $243 32,310 $8,300
$10,000 under $20,000 2,585 $1,779 11,450 $2,522 62,470 $24,426
$20,000 under $30,000 3,484 $3,702 10,684 $4,340 60,885 $29,511
$30,000 under $40,000 3,341 $4,869 9,914 $5,287 52,357 $29,599
$40,000 under $50,000 3,055 $5,628 8,654 $5,817 40,634 $27,231
$50,000 under $75,000 5,831 $14,648 16,613 $13,897 59,540 $52,579
$75,000 under $100,000 4,241 $14,390 11,155 $12,439 36,520 $44,629
$100,000 under $150,000 5,775 $25,417 12,548 $19,478 35,930 $56,329
$150,000 under $200,000 3,511 $23,357 5,038 $13,561 13,036 $28,290
$200,000 under $300,000 3,811 $37,259 5,014 $20,475 5,357 $17,276
$300,000 and over 4,934 $343,033 3,628 $53,030 4,047 $91,238
TOTAL TAXABLE RETURNS 41,500 $474,445 100,054 $151,128 416,198 $411,270
NON-TAXABLE RESIDENT RETURNS
Loss 633 $2,120 3 $0 10,337 $8,458
$0 under $5,000 813 $684 31 $1 60,117 $9,751
$5,000 under $10,000 504 $543 1 $0 8,454 $3,462
$10,000 and over 1,365 $3,556 8 $2 8,115 $9,832
TOTAL NONTAXABLE RETURNS 3,315 $6,903 43 $3 87,023 $31,502
TOTAL ALL RESIDENT RETURNS 44,815 $481,349 100,097 $151,132 503,221 $442,772
TOTAL ALL NONRESIDENT
RETURNS 10,360 $122,508 15,053 $20,291 50,597 $93,927
TOTAL ALL RETURNS 55,175 $603,857 115,150 $171,422 553,818 $536,699
Note: Details may not add to totals due to rounding.
* Includes estimated tax payments, extension payments and carryovers of credits from the prior year.
**Equal to the tax liability after tax credits less tax withheld and less payments of declaration.
***Equal to the sum of refunds plus amounts credited to the 2016 estimated taxes and plus check-box donations to school repair, public library, and domestic violence funds.
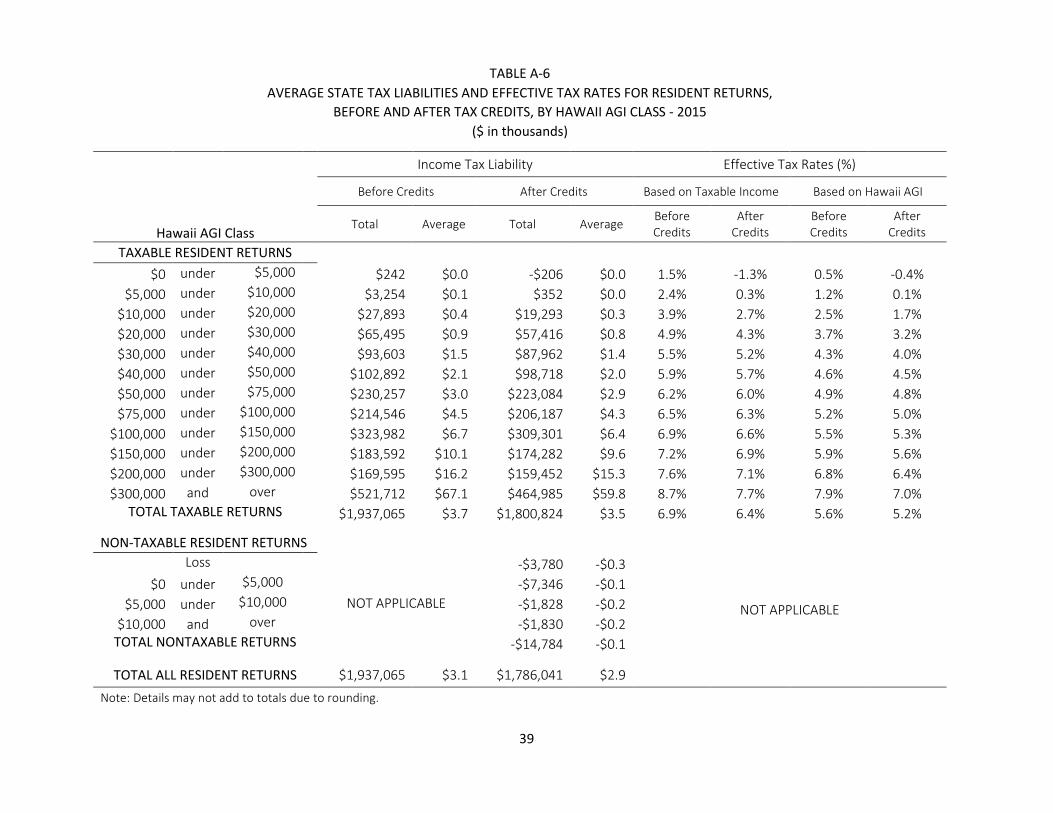
39
TABLE A-6
AVERAGE STATE TAX LIABILITIES AND EFFECTIVE TAX RATES FOR RESIDENT RETURNS,
BEFORE AND AFTER TAX CREDITS, BY HAWAII AGI CLASS - 2015
($ in thousands)
Hawaii AGI Class
Income Tax Liability Effective Tax Rates (%)
Before Credits After Credits Based on Taxable Income Based on Hawaii AGI
Total Average Total Average Before Credits
After Credits
Before Credits
After Credits
TAXABLE RESIDENT RETURNS
$0 under $5,000 $242 $0.0 -$206 $0.0 1.5% -1.3% 0.5% -0.4%
$5,000 under $10,000 $3,254 $0.1 $352 $0.0 2.4% 0.3% 1.2% 0.1%
$10,000 under $20,000 $27,893 $0.4 $19,293 $0.3 3.9% 2.7% 2.5% 1.7%
$20,000 under $30,000 $65,495 $0.9 $57,416 $0.8 4.9% 4.3% 3.7% 3.2%
$30,000 under $40,000 $93,603 $1.5 $87,962 $1.4 5.5% 5.2% 4.3% 4.0%
$40,000 under $50,000 $102,892 $2.1 $98,718 $2.0 5.9% 5.7% 4.6% 4.5%
$50,000 under $75,000 $230,257 $3.0 $223,084 $2.9 6.2% 6.0% 4.9% 4.8%
$75,000 under $100,000 $214,546 $4.5 $206,187 $4.3 6.5% 6.3% 5.2% 5.0%
$100,000 under $150,000 $323,982 $6.7 $309,301 $6.4 6.9% 6.6% 5.5% 5.3%
$150,000 under $200,000 $183,592 $10.1 $174,282 $9.6 7.2% 6.9% 5.9% 5.6%
$200,000 under $300,000 $169,595 $16.2 $159,452 $15.3 7.6% 7.1% 6.8% 6.4%
$300,000 and over $521,712 $67.1 $464,985 $59.8 8.7% 7.7% 7.9% 7.0% TOTAL TAXABLE RETURNS $1,937,065 $3.7 $1,800,824 $3.5 6.9% 6.4% 5.6% 5.2%
NON-TAXABLE RESIDENT RETURNS
NOT APPLICABLE
Loss
NOT APPLICABLE
-$3,780 -$0.3
$0 under $5,000 -$7,346 -$0.1
$5,000 under $10,000 -$1,828 -$0.2
$10,000 and over -$1,830 -$0.2 TOTAL NONTAXABLE RETURNS -$14,784 -$0.1
TOTAL ALL RESIDENT RETURNS $1,937,065 $3.1 $1,786,041 $2.9
Note: Details may not add to totals due to rounding.
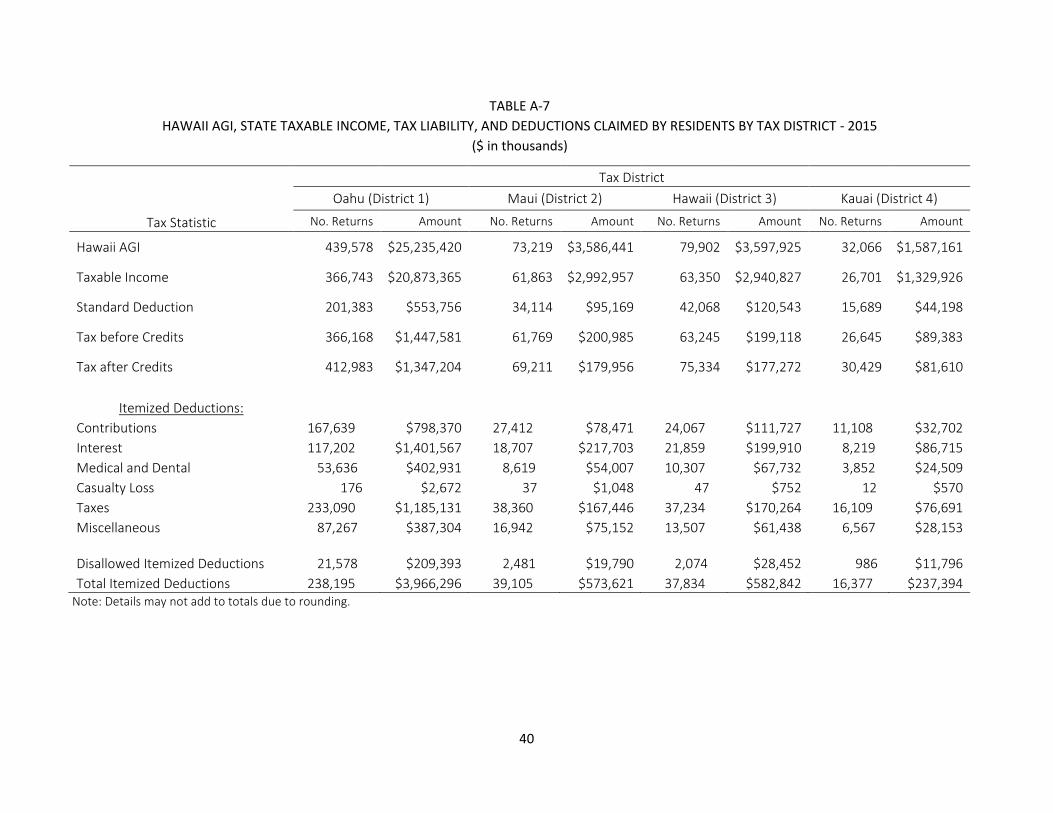
40
TABLE A-7
HAWAII AGI, STATE TAXABLE INCOME, TAX LIABILITY, AND DEDUCTIONS CLAIMED BY RESIDENTS BY TAX DISTRICT - 2015
($ in thousands)
Tax Statistic
Tax District
Oahu (District 1) Maui (District 2) Hawaii (District 3) Kauai (District 4)
No. Returns Amount No. Returns Amount No. Returns Amount No. Returns Amount
Hawaii AGI 439,578 $25,235,420 73,219 $3,586,441 79,902 $3,597,925 32,066 $1,587,161
Taxable Income 366,743 $20,873,365 61,863 $2,992,957 63,350 $2,940,827 26,701 $1,329,926
Standard Deduction 201,383 $553,756 34,114 $95,169 42,068 $120,543 15,689 $44,198
Tax before Credits 366,168 $1,447,581 61,769 $200,985 63,245 $199,118 26,645 $89,383
Tax after Credits 412,983 $1,347,204 69,211 $179,956 75,334 $177,272 30,429 $81,610
Itemized Deductions: Contributions 167,639 $798,370 27,412 $78,471 24,067 $111,727 11,108 $32,702
Interest 117,202 $1,401,567 18,707 $217,703 21,859 $199,910 8,219 $86,715
Medical and Dental 53,636 $402,931 8,619 $54,007 10,307 $67,732 3,852 $24,509
Casualty Loss 176 $2,672 37 $1,048 47 $752 12 $570
Taxes 233,090 $1,185,131 38,360 $167,446 37,234 $170,264 16,109 $76,691
Miscellaneous 87,267 $387,304 16,942 $75,152 13,507 $61,438 6,567 $28,153
Disallowed Itemized Deductions 21,578 $209,393 2,481 $19,790 2,074 $28,452 986 $11,796
Total Itemized Deductions 238,195 $3,966,296 39,105 $573,621 37,834 $582,842 16,377 $237,394 Note: Details may not add to totals due to rounding.
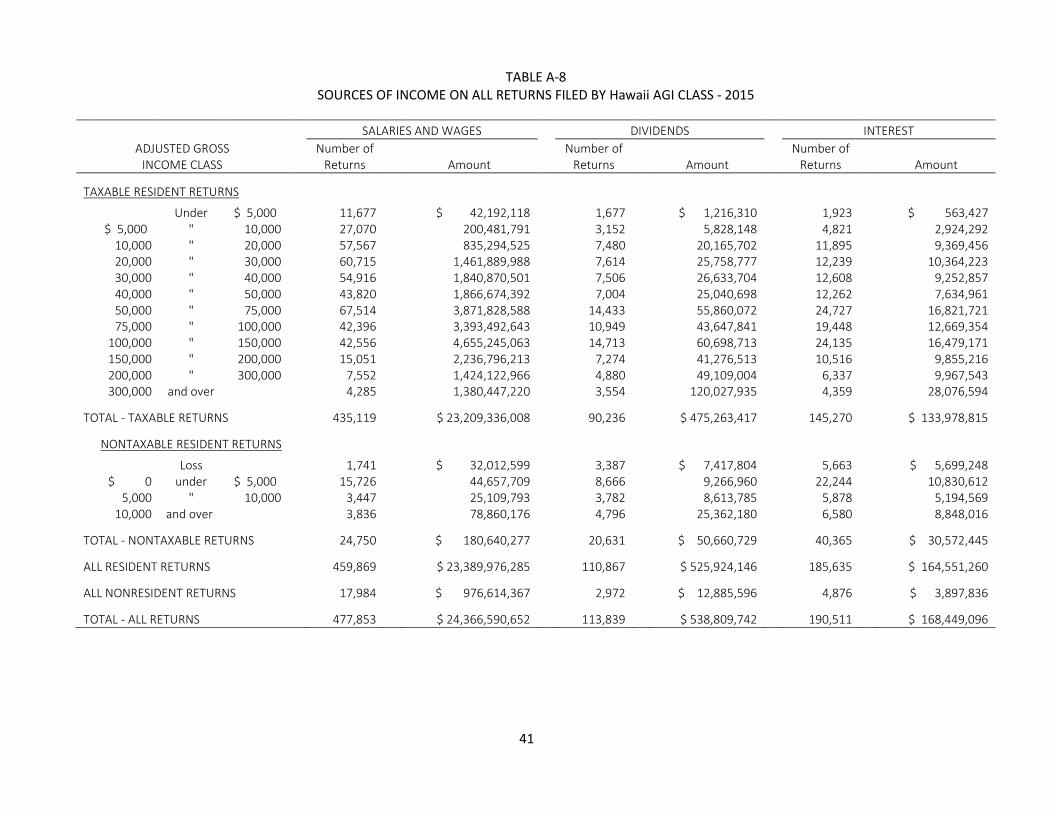
41
TABLE A-8 SOURCES OF INCOME ON ALL RETURNS FILED BY Hawaii AGI CLASS - 2015
SALARIES AND WAGES DIVIDENDS INTEREST
ADJUSTED GROSS
Number of
Number of
Number of INCOME CLASS Returns Amount Returns Amount Returns Amount
TAXABLE RESIDENT RETURNS
Under $ 5,000
11,677
$ 42,192,118
1,677
$ 1,216,310
1,923
$ 563,427
$ 5,000 " 10,000
27,070
200,481,791
3,152
5,828,148
4,821
2,924,292
10,000 " 20,000
57,567
835,294,525
7,480
20,165,702
11,895
9,369,456
20,000 " 30,000
60,715
1,461,889,988
7,614
25,758,777
12,239
10,364,223
30,000 " 40,000
54,916
1,840,870,501
7,506
26,633,704
12,608
9,252,857
40,000 " 50,000
43,820
1,866,674,392
7,004
25,040,698
12,262
7,634,961
50,000 " 75,000
67,514
3,871,828,588
14,433
55,860,072
24,727
16,821,721
75,000 " 100,000
42,396
3,393,492,643
10,949
43,647,841
19,448
12,669,354
100,000 " 150,000
42,556
4,655,245,063
14,713
60,698,713
24,135
16,479,171
150,000 " 200,000
15,051
2,236,796,213
7,274
41,276,513
10,516
9,855,216
200,000 " 300,000
7,552
1,424,122,966
4,880
49,109,004
6,337
9,967,543
300,000 and over
4,285
1,380,447,220
3,554
120,027,935
4,359
28,076,594
TOTAL - TAXABLE RETURNS
435,119
$ 23,209,336,008
90,236
$ 475,263,417
145,270
$ 133,978,815
NONTAXABLE RESIDENT RETURNS
Loss
1,741
$ 32,012,599
3,387
$ 7,417,804
5,663
$ 5,699,248
$ 0 under $ 5,000
15,726
44,657,709
8,666
9,266,960
22,244
10,830,612
5,000 " 10,000
3,447
25,109,793
3,782
8,613,785
5,878
5,194,569
10,000 and over
3,836
78,860,176
4,796
25,362,180
6,580
8,848,016
TOTAL - NONTAXABLE RETURNS 24,750
$ 180,640,277
20,631
$ 50,660,729
40,365
$ 30,572,445
ALL RESIDENT RETURNS
459,869
$ 23,389,976,285
110,867
$ 525,924,146
185,635
$ 164,551,260
ALL NONRESIDENT RETURNS 17,984
$ 976,614,367
2,972
$ 12,885,596
4,876
$ 3,897,836
TOTAL - ALL RETURNS 477,853
$ 24,366,590,652
113,839
$ 538,809,742
190,511
$ 168,449,096
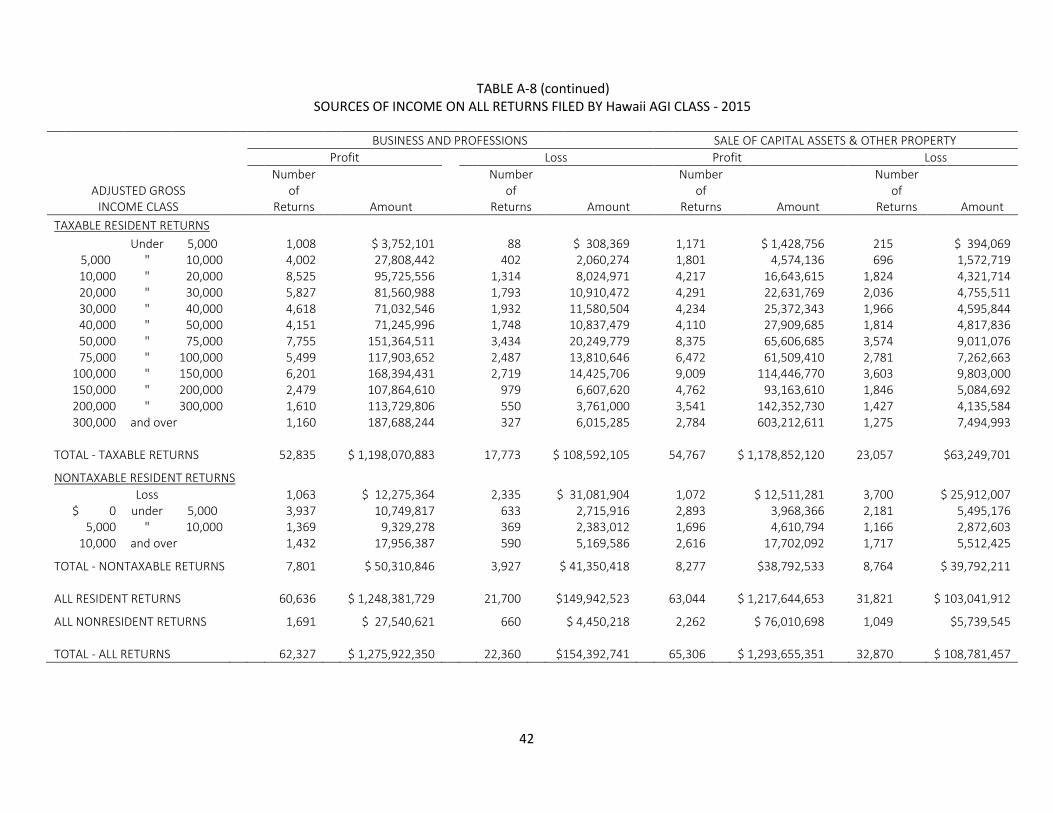
42
TABLE A-8 (continued) SOURCES OF INCOME ON ALL RETURNS FILED BY Hawaii AGI CLASS - 2015
BUSINESS AND PROFESSIONS SALE OF CAPITAL ASSETS & OTHER PROPERTY
Profit
Loss Profit Loss
ADJUSTED GROSS
Number of
Number of
Number of
Number of
INCOME CLASS Returns Amount Returns Amount Returns Amount Returns Amount
TAXABLE RESIDENT RETURNS
Under 5,000
1,008
$ 3,752,101
88
$ 308,369
1,171
$ 1,428,756
215
$ 394,069
5,000 " 10,000
4,002
27,808,442
402
2,060,274
1,801
4,574,136
696
1,572,719
10,000 " 20,000
8,525
95,725,556
1,314
8,024,971
4,217
16,643,615
1,824
4,321,714
20,000 " 30,000
5,827
81,560,988
1,793
10,910,472
4,291
22,631,769
2,036
4,755,511
30,000 " 40,000
4,618
71,032,546
1,932
11,580,504
4,234
25,372,343
1,966
4,595,844
40,000 " 50,000
4,151
71,245,996
1,748
10,837,479
4,110
27,909,685
1,814
4,817,836
50,000 " 75,000
7,755
151,364,511
3,434
20,249,779
8,375
65,606,685
3,574
9,011,076
75,000 " 100,000
5,499
117,903,652
2,487
13,810,646
6,472
61,509,410
2,781
7,262,663
100,000 " 150,000
6,201
168,394,431
2,719
14,425,706
9,009
114,446,770
3,603
9,803,000
150,000 " 200,000
2,479
107,864,610
979
6,607,620
4,762
93,163,610
1,846
5,084,692
200,000 " 300,000
1,610
113,729,806
550
3,761,000
3,541
142,352,730
1,427
4,135,584
300,000 and over
1,160
187,688,244
327
6,015,285
2,784
603,212,611
1,275
7,494,993
TOTAL - TAXABLE RETURNS
52,835
$ 1,198,070,883
17,773
$ 108,592,105
54,767
$ 1,178,852,120
23,057
$63,249,701
NONTAXABLE RESIDENT RETURNS
Loss
1,063
$ 12,275,364
2,335
$ 31,081,904
1,072
$ 12,511,281
3,700
$ 25,912,007
$ 0 under 5,000
3,937
10,749,817
633
2,715,916
2,893
3,968,366
2,181
5,495,176
5,000 " 10,000
1,369
9,329,278
369
2,383,012
1,696
4,610,794
1,166
2,872,603
10,000 and over
1,432
17,956,387
590
5,169,586
2,616
17,702,092
1,717
5,512,425
TOTAL - NONTAXABLE RETURNS 7,801
$ 50,310,846
3,927
$ 41,350,418
8,277
$38,792,533
8,764
$ 39,792,211
ALL RESIDENT RETURNS
60,636
$ 1,248,381,729
21,700
$149,942,523
63,044
$ 1,217,644,653
31,821
$ 103,041,912
ALL NONRESIDENT RETURNS
1,691
$ 27,540,621
660
$ 4,450,218
2,262
$ 76,010,698
1,049
$5,739,545
TOTAL - ALL RETURNS 62,327
$ 1,275,922,350 22,360 $154,392,741 65,306
$ 1,293,655,351 32,870
$ 108,781,457
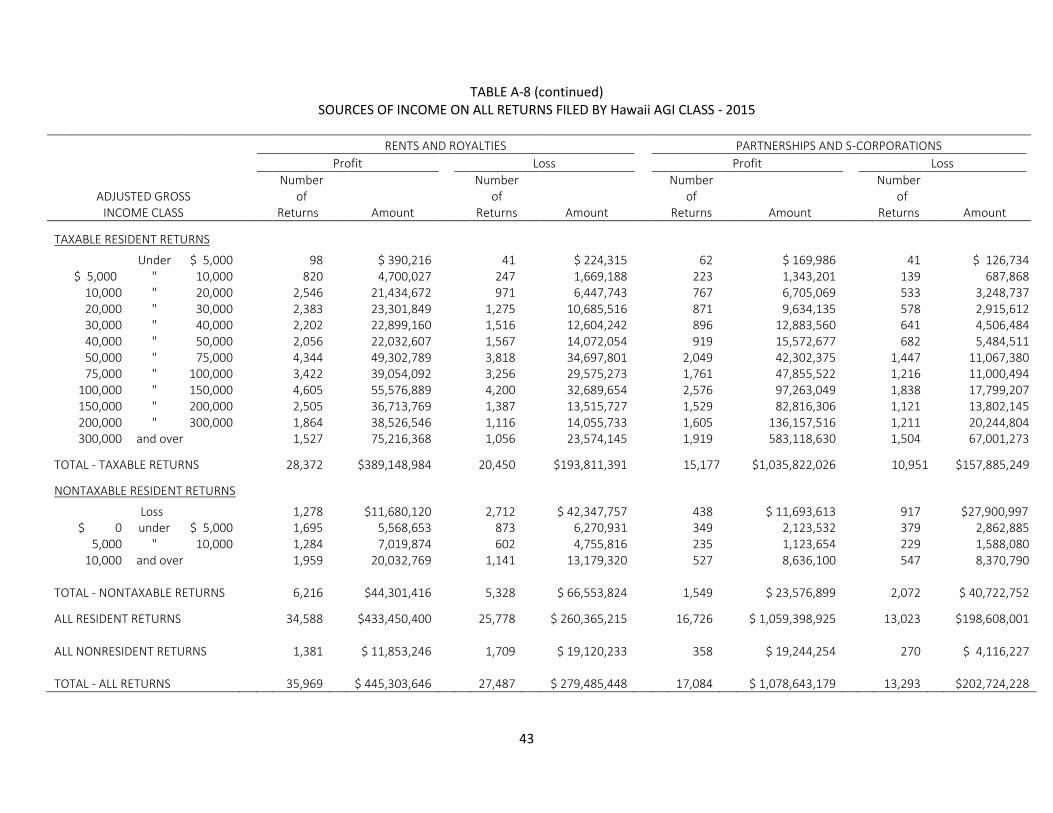
43
TABLE A-8 (continued) SOURCES OF INCOME ON ALL RETURNS FILED BY Hawaii AGI CLASS - 2015
RENTS AND ROYALTIES
PARTNERSHIPS AND S-CORPORATIONS
Profit
Loss
Profit
Loss
ADJUSTED GROSS
Number of
Number of
Number of
Number of
INCOME CLASS Returns Amount Returns Amount Returns Amount Returns Amount
TAXABLE RESIDENT RETURNS
Under $ 5,000
98
$ 390,216
41
$ 224,315
62
$ 169,986
41
$ 126,734
$ 5,000 " 10,000
820
4,700,027
247
1,669,188
223
1,343,201
139
687,868
10,000 " 20,000
2,546
21,434,672
971
6,447,743
767
6,705,069
533
3,248,737
20,000 " 30,000
2,383
23,301,849
1,275
10,685,516
871
9,634,135
578
2,915,612
30,000 " 40,000
2,202
22,899,160
1,516
12,604,242
896
12,883,560
641
4,506,484
40,000 " 50,000
2,056
22,032,607
1,567
14,072,054
919
15,572,677
682
5,484,511
50,000 " 75,000
4,344
49,302,789
3,818
34,697,801
2,049
42,302,375
1,447
11,067,380
75,000 " 100,000
3,422
39,054,092
3,256
29,575,273
1,761
47,855,522
1,216
11,000,494
100,000 " 150,000
4,605
55,576,889
4,200
32,689,654
2,576
97,263,049
1,838
17,799,207
150,000 " 200,000
2,505
36,713,769
1,387
13,515,727
1,529
82,816,306
1,121
13,802,145
200,000 " 300,000
1,864
38,526,546
1,116
14,055,733
1,605
136,157,516
1,211
20,244,804
300,000 and over
1,527
75,216,368
1,056
23,574,145
1,919
583,118,630
1,504
67,001,273
TOTAL - TAXABLE RETURNS
28,372
$389,148,984
20,450
$193,811,391
15,177
$1,035,822,026
10,951 $157,885,249
NONTAXABLE RESIDENT RETURNS
Loss
1,278
$11,680,120
2,712
$ 42,347,757
438
$ 11,693,613
917
$27,900,997
$ 0 under $ 5,000
1,695
5,568,653
873
6,270,931
349
2,123,532
379
2,862,885
5,000 " 10,000
1,284
7,019,874
602
4,755,816
235
1,123,654
229
1,588,080
10,000 and over
1,959
20,032,769
1,141
13,179,320
527
8,636,100
547
8,370,790
TOTAL - NONTAXABLE RETURNS
6,216
$44,301,416
5,328
$ 66,553,824
1,549
$ 23,576,899
2,072
$ 40,722,752
ALL RESIDENT RETURNS
34,588
$433,450,400
25,778
$ 260,365,215
16,726
$ 1,059,398,925
13,023
$198,608,001
ALL NONRESIDENT RETURNS
1,381
$ 11,853,246
1,709
$ 19,120,233
358
$ 19,244,254
270
$ 4,116,227
TOTAL - ALL RETURNS 35,969
$ 445,303,646 27,487 $ 279,485,448 17,084 $ 1,078,643,179 13,293 $202,724,228
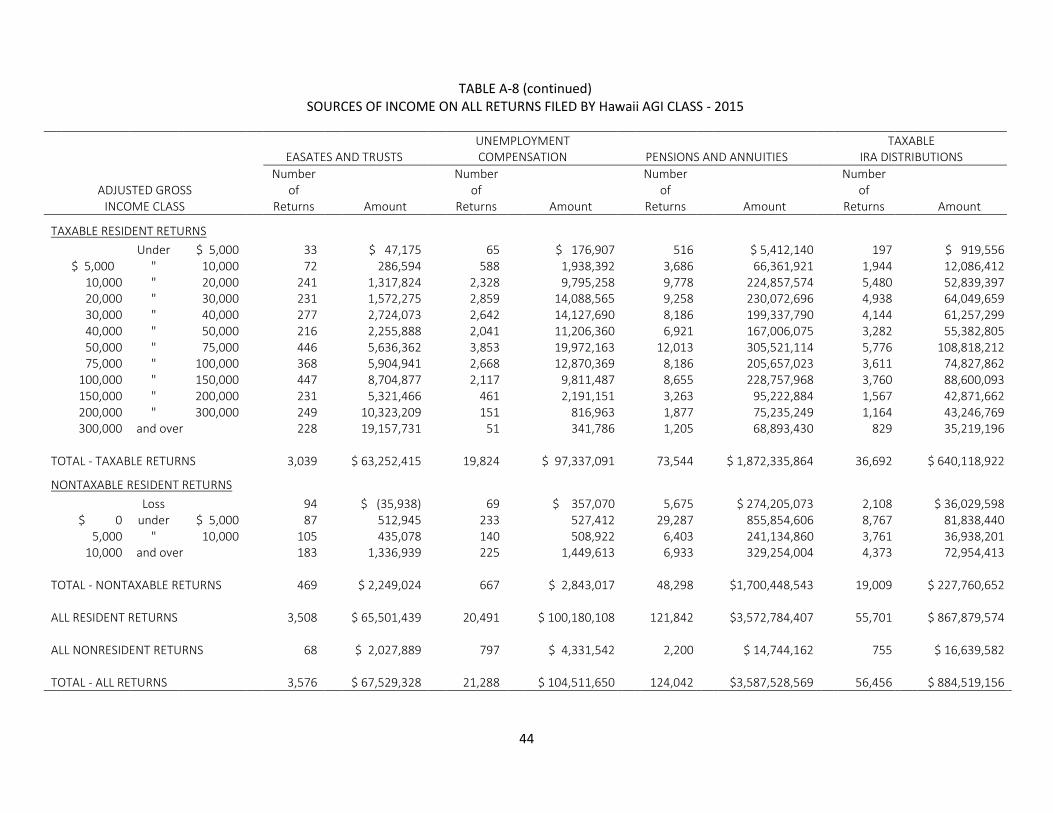
44
TABLE A-8 (continued) SOURCES OF INCOME ON ALL RETURNS FILED BY Hawaii AGI CLASS - 2015
UNEMPLOYMENT TAXABLE
EASATES AND TRUSTS COMPENSATION PENSIONS AND ANNUITIES IRA DISTRIBUTIONS
ADJUSTED GROSS
Number of
Number of
Number of
Number of
INCOME CLASS Returns Amount Returns Amount Returns Amount Returns Amount
TAXABLE RESIDENT RETURNS
Under $ 5,000
33
$ 47,175
65
$ 176,907
516
$ 5,412,140
197
$ 919,556
$ 5,000 " 10,000
72
286,594
588
1,938,392
3,686
66,361,921
1,944
12,086,412
10,000 " 20,000
241
1,317,824
2,328
9,795,258
9,778
224,857,574
5,480
52,839,397
20,000 " 30,000
231
1,572,275
2,859
14,088,565
9,258
230,072,696
4,938
64,049,659
30,000 " 40,000
277
2,724,073
2,642
14,127,690
8,186
199,337,790
4,144
61,257,299
40,000 " 50,000
216
2,255,888
2,041
11,206,360
6,921
167,006,075
3,282
55,382,805
50,000 " 75,000
446
5,636,362
3,853
19,972,163
12,013
305,521,114
5,776
108,818,212
75,000 " 100,000
368
5,904,941
2,668
12,870,369
8,186
205,657,023
3,611
74,827,862
100,000 " 150,000
447
8,704,877
2,117
9,811,487
8,655
228,757,968
3,760
88,600,093
150,000 " 200,000
231
5,321,466
461
2,191,151
3,263
95,222,884
1,567
42,871,662
200,000 " 300,000
249
10,323,209
151
816,963
1,877
75,235,249
1,164
43,246,769
300,000 and over
228
19,157,731
51
341,786
1,205
68,893,430
829
35,219,196
TOTAL - TAXABLE RETURNS 3,039
$ 63,252,415
19,824
$ 97,337,091
73,544
$ 1,872,335,864
36,692
$ 640,118,922
NONTAXABLE RESIDENT RETURNS
Loss
94
$ (35,938)
69
$ 357,070
5,675
$ 274,205,073
2,108
$ 36,029,598
$ 0 under $ 5,000
87
512,945
233
527,412
29,287
855,854,606
8,767
81,838,440
5,000 " 10,000
105
435,078
140
508,922
6,403
241,134,860
3,761
36,938,201
10,000 and over
183
1,336,939
225
1,449,613
6,933
329,254,004
4,373
72,954,413
TOTAL - NONTAXABLE RETURNS 469
$ 2,249,024
667
$ 2,843,017
48,298
$1,700,448,543
19,009
$ 227,760,652
ALL RESIDENT RETURNS
3,508
$ 65,501,439
20,491
$ 100,180,108
121,842
$3,572,784,407
55,701
$ 867,879,574
ALL NONRESIDENT RETURNS 68
$ 2,027,889
797
$ 4,331,542
2,200
$ 14,744,162
755
$ 16,639,582
TOTAL - ALL RETURNS 3,576
$ 67,529,328 21,288 $ 104,511,650 124,042
$3,587,528,569 56,456 $ 884,519,156
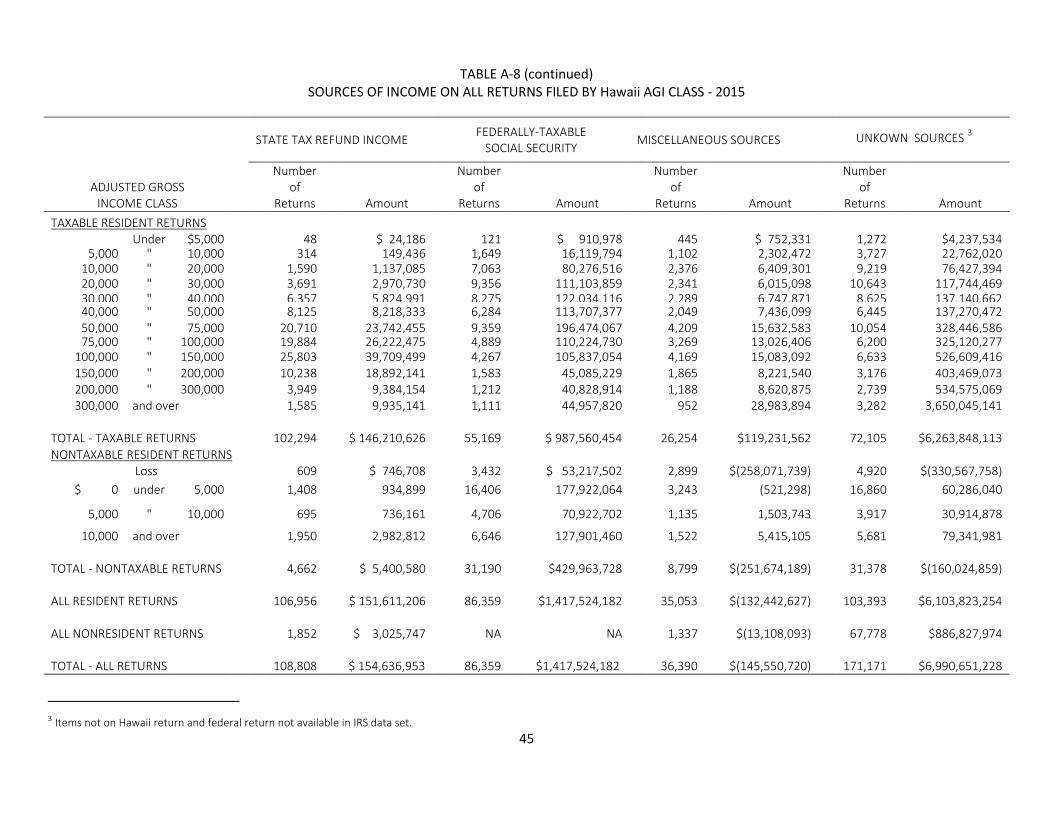
45
TABLE A-8 (continued)
SOURCES OF INCOME ON ALL RETURNS FILED BY Hawaii AGI CLASS - 2015
STATE TAX REFUND INCOME FEDERALLY-TAXABLE
SOCIAL SECURITY MISCELLANEOUS SOURCES UNKOWN SOURCES
3
ADJUSTED GROSS
Number of
Number of
Number of
Number of
INCOME CLASS Returns Amount Returns Amount Returns Amount Returns Amount
TAXABLE RESIDENT RETURNS
Under $5,000
$ 5,000 48
$ 24,186
121
$ 910,978
$ 910,978 445
$ 752,331
1,272
$4,237,534
5,000
5$ 5,000 " 10,000
314
149,436
1,649
16,119,794
1,102
2,302,472
3,727
22,762,020
10,000 " 20,000
1,590
1,137,085
7,063
80,276,516
2,376
6,409,301
9,219
76,427,394
20,000 " 30,000
3,691
2,970,730
9,356
111,103,859
2,341
6,015,098
10,643
117,744,469
30,000 " 40,000
6,357
5,824,991
8,275
122,034,116
2,289
6,747,871
8,625
137,140,662
40,000 " 50,000
8,125
8,218,333
6,284
113,707,377
2,049
7,436,099
6,445
137,270,472
50,000 " 75,000
20,710
23,742,455
9,359
196,474,067
4,209
15,632,583
10,054
328,446,586
75,000 " 100,000
19,884
26,222,475
4,889
110,224,730
3,269
13,026,406
6,200
325,120,277
100,000 " 150,000
25,803
39,709,499
4,267
105,837,054
4,169
15,083,092
6,633
526,609,416
150,000 " 200,000
10,238
18,892,141
1,583
45,085,229
1,865
8,221,540
3,176
403,469,073
200,000 " 300,000
3,949
9,384,154
1,212
40,828,914
1,188
8,620,875
2,739
534,575,069
300,000 and over
1,585
9,935,141
1,111
44,957,820
952
28,983,894
3,282
3,650,045,141
TOTAL - TAXABLE RETURNS
102,294
$ 146,210,626
55,169
$ 987,560,454
26,254
$119,231,562
72,105
$6,263,848,113
NONTAXABLE RESIDENT RETURNS
Loss
609
$ 746,708
3,432
$ 53,217,502
2,899
$(258,071,739)
4,920
$(330,567,758)
$ 0 under 5,000
1,408
934,899
16,406
177,922,064
3,243
(521,298)
16,860
60,286,040
5,000 " 10,000
695
736,161
4,706
70,922,702
1,135
1,503,743
3,917
30,914,878
10,000 and over
1,950
2,982,812
6,646
127,901,460
1,522
5,415,105
5,681
79,341,981
TOTAL - NONTAXABLE RETURNS 4,662
$ 5,400,580
31,190
$429,963,728
8,799
$(251,674,189)
31,378
$(160,024,859)
ALL RESIDENT RETURNS
106,956
$ 151,611,206
86,359
$1,417,524,182
35,053
$(132,442,627)
103,393
$6,103,823,254
ALL NONRESIDENT RETURNS
1,852
$ 3,025,747
NA
NA
1,337
$(13,108,093)
67,778
$886,827,974
TOTAL - ALL RETURNS 108,808 $ 154,636,953 86,359 $1,417,524,182 36,390
$(145,550,720) 171,171
$6,990,651,228
3 Items not on Hawaii return and federal return not available in IRS data set.
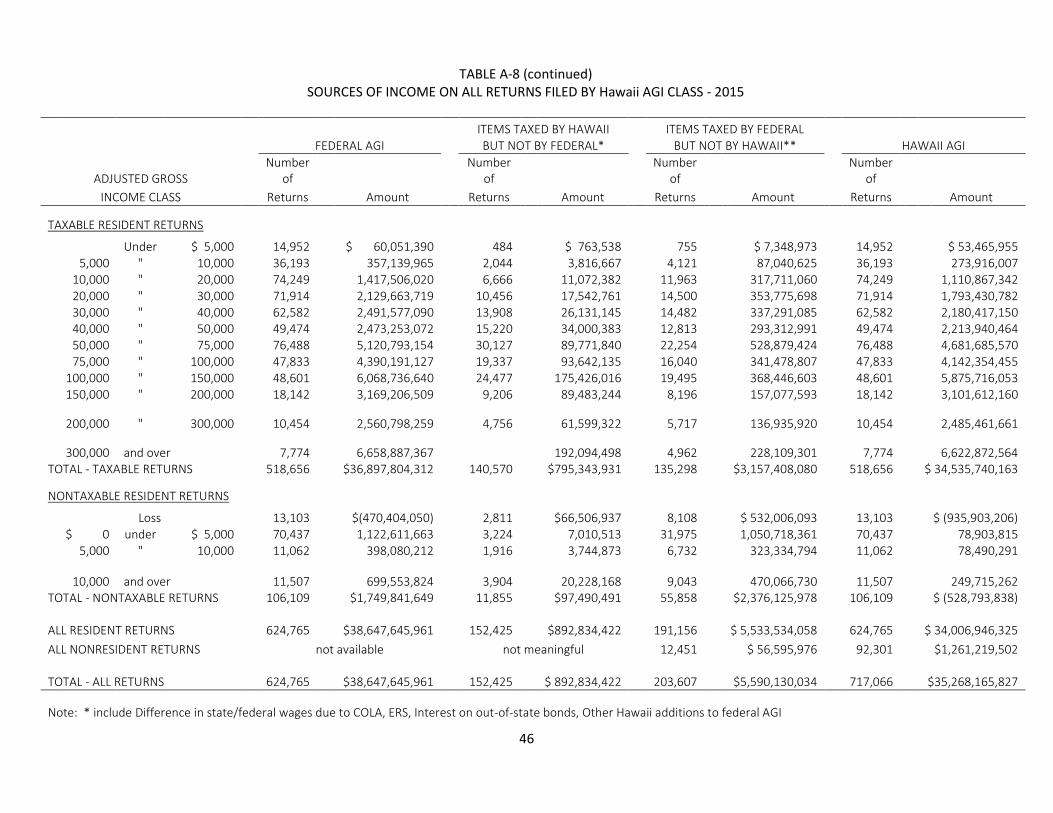
46
TABLE A-8 (continued)
SOURCES OF INCOME ON ALL RETURNS FILED BY Hawaii AGI CLASS - 2015
ITEMS TAXED BY HAWAII ITEMS TAXED BY FEDERAL FEDERAL AGI BUT NOT BY FEDERAL* BUT NOT BY HAWAII** HAWAII AGI
ADJUSTED GROSS Number
of Number
of Number
of Number
of
INCOME CLASS Returns Amount Returns Amount Returns Amount Returns Amount
TAXABLE RESIDENT RETURNS
Under $ 5,000 14,952 $ 60,051,390 484 $ 763,538 755 $ 7,348,973 14,952 $ 53,465,955 5,000 " 10,000 36,193 357,139,965 2,044 3,816,667 4,121 87,040,625 36,193 273,916,007 10,000 " 20,000 74,249 1,417,506,020 6,666 11,072,382 11,963 317,711,060 74,249 1,110,867,342 20,000 " 30,000 71,914 2,129,663,719 10,456 17,542,761 14,500 353,775,698 71,914 1,793,430,782 30,000 " 40,000 62,582 2,491,577,090 13,908 26,131,145 14,482 337,291,085 62,582 2,180,417,150 40,000 " 50,000 49,474 2,473,253,072 15,220 34,000,383 12,813 293,312,991 49,474 2,213,940,464 50,000 " 75,000 76,488 5,120,793,154 30,127 89,771,840 22,254 528,879,424 76,488 4,681,685,570 75,000 " 100,000 47,833 4,390,191,127 19,337 93,642,135 16,040 341,478,807 47,833 4,142,354,455 100,000 " 150,000 48,601 6,068,736,640 24,477 175,426,016 19,495 368,446,603 48,601 5,875,716,053 150,000 " 200,000 18,142 3,169,206,509 9,206 89,483,244 8,196 157,077,593 18,142 3,101,612,160
200,000 " 300,000 10,454
2,560,798,259
4,756 61,599,322 5,717 136,935,920 10,454 2,485,461,661
300,000 and over 7,774 6,658,887,367
192,094,498 4,962 228,109,301 7,774 6,622,872,564 TOTAL - TAXABLE RETURNS 518,656 $36,897,804,312 140,570 $795,343,931 135,298 $3,157,408,080 518,656 $ 34,535,740,163
NONTAXABLE RESIDENT RETURNS
Loss 13,103 $(470,404,050) 2,811 $66,506,937 8,108 $ 532,006,093 13,103 $ (935,903,206) $ 0 under $ 5,000 70,437 1,122,611,663 3,224 7,010,513 31,975 1,050,718,361 70,437 78,903,815 5,000 " 10,000 11,062 398,080,212 1,916 3,744,873 6,732 323,334,794 11,062 78,490,291
10,000 and over 11,507 699,553,824
3,904 20,228,168 9,043 470,066,730 11,507 249,715,262 TOTAL - NONTAXABLE RETURNS 106,109 $1,749,841,649 11,855 $97,490,491 55,858 $2,376,125,978 106,109 $ (528,793,838)
ALL RESIDENT RETURNS 624,765
$38,647,645,961 152,425 $892,834,422 191,156
$ 5,533,534,058 624,765 $ 34,006,946,325
ALL NONRESIDENT RETURNS not available not meaningful 12,451 $ 56,595,976 92,301 $1,261,219,502
TOTAL - ALL RETURNS 624,765
$38,647,645,961 152,425
$ 892,834,422 203,607 $5,590,130,034 717,066
$35,268,165,827
Note: * include Difference in state/federal wages due to COLA, ERS, Interest on out-of-state bonds, Other Hawaii additions to federal AGI
47
**include Pensions, Social Security, Payments to an Individual Housing Account, and Exceptional Trees Deduction, and First $6,279 of Military Reserve or Hawaii National Guard Duty Pay, and Other Hawaii subtractions from Federal AGI. Details may not add to totals due to rounding.
Hawaii Business
Income Tax
Statistics Tax Year 2015
DEPARTMENT OF TAXATION
STATE OF HAWAII
STATE OF HAWAII David Y. Ige, Governor
DEPARTMENT OF TAXATION Maria E. Zielinski, Director
Damien A. Elefante, Deputy Director Tax Research & Planning Seth Colby, Tax Research & Planning Officer Dongliang Wu, Research Statistician
Hawaii Business Income Tax Statistics
Tax Year 2015
DEPARTMENT OF TAXATION
STATE OF HAWAII
December 2017
Prepared by Tax Research and Planning Office
WEB SITE: tax.hawaii.gov
TABLE OF CONTENTS
Page
INTRODUCTION………………………………………………………………………………………
1
SECTION 1: OVERVIEW OF BUSINESS RETURNS ………………………………………….. 2
Summary ……………………………………………………………………………………….. 2
Business Returns …………………………………………………………………………….. 2
Data Source and Methodology ……………………………………………………………... 3
Industrial Classification ……………………………………………………………………… 4
Statistical Overview ………………………………………………………………………….. 5
Taxation Districts ………………………………………………………………………….. 5
Business Receipts ………………………………………………………………………… 5
Net Income …………………………………………………………………………………. 6
Wages and W-2 Forms ……………………………………………………………………. 8
Table
1-1 Distribution of Businesses, Business Receipts, and Net Profits or Loss ........... 11
1-2 Distribution of Businesses by Type of Return among Major Industry Groups .. 12
1-3 Distribution of Businesses by Industry and District …………………………. 13
1-4 Distribution of Businesses, Business Receipts, Net Income, and Wages Paid
by Major Industry …………………………………………………………………….. 14
1-5 Distribution of Businesses, Business Receipts, Net Income, and Wages Paid
by Major Industry and Selected Detailed Industry Categories ………………….. 15
1-6 Distribution of Businesses, Business Receipts, Net Income, and Wages Paid
by Size of Hawaii Business Receipts ……………………………………………… 24
1-7 Distribution of Businesses, Net Income, Business Receipts, and Wages Paid
by Size of Net Profit …………………………………………………………………. 25
1-8 Distribution of Businesses by Major Industry and by Size of Hawaii Business
Receipts ………………………………………………………………………………. 26
1-9 Distribution of Businesses by Major Industry and by Size of Net Profit ……...... 27
1-10 Distribution of Businesses, Business Receipts, Net Income, and Wages Paid
by Taxation District ………………………………………………………………….. 28
SECTION 2: C CORPORATIONS ………………………….…………………………………….. 29
Table
2-1 Distribution of C Corporation Returns by Taxation District and by Industry …... 33
2-2 Distribution of C Corporation Returns by Taxation District and Size of Hawaii
Business Receipts …………………………………………………………………… 34
2-3 Number of Businesses and Hawaii Gross Receipts by Major Industry...……… 35
2-4 Number of Businesses and Net Income by Size of Net Profit and Corporation
Return Type ………………………………………………………………………….. 36
2-5 Number of Businesses, Hawaii Business Receipts, Net Profit, Net Loss, and
Tax Liability for C Corporations by Industry and Size of Business Receipts ..... 37
2-6 Additional Sources of Income for Non-Apportioned C Corporations by
Industry ...……………………………………………………………………………... 38
2-7 Wages Paid and Number of W-2 Forms by Industry ……………………………. 39
2-8 Selected Expenses of Non-Apportioned C Corporations by Major Industry ..… 40
SECTION 3: FINANCIAL CORPORATIONS ..…………….…………………………………….. 43
Table
3-1 Number of Businesses, Hawaii Business Receipts, Net Profit, Net Loss, and
Tax Liability for Financial Corporations by Size of Business Receipts ……....... 47
3-2 Total Deductions, Wages Paid, and W-2 Count for Financial Corporations by
Size of Business Receipts ………………………………………………………….. 48
SECTION 4: PROPRIETORSHIPS ..…………….……………………………………………….. 49
Table
4-1 Number of Proprietorships by Taxation District and by Major Industry ……….. 53
4-2 Number of Proprietorships by Taxation District and by Size of Business
Receipts ………………………………………………………………………………. 54
4-3 Business Receipts, Other Income, Net Profit, and Net Loss by Size of
Business Receipts and by Industry ………………………………………………... 55
4-4 Selected Business Deductions by Size of Business Receipts and by Industry . 56
4-5 Proprietorship Net Income Compared to Other Income Sources on
Proprietors’ Personal Tax Returns by Size of Hawaii Adjusted Gross Income .. 57
4-6 Proprietorship Net Income Compared to Other Income Sources on
Proprietors’ Personal Tax Returns by Industry …………………………………… 58

4-7 Selected Data for Rentals Reported on Schedule E, by Gross Receipts,
Aggregated by Return ………………………………………………....................... 59
4-8 Proprietorship Net Income as a Percent of Adjusted Gross Income by Major
Industry ………………………………………………............................................. 60
4-9 Net Profit or Loss from Partnerships and S Corporations on Schedule E by
Size of Hawaii Adjusted Gross Income …………………………………………… 61
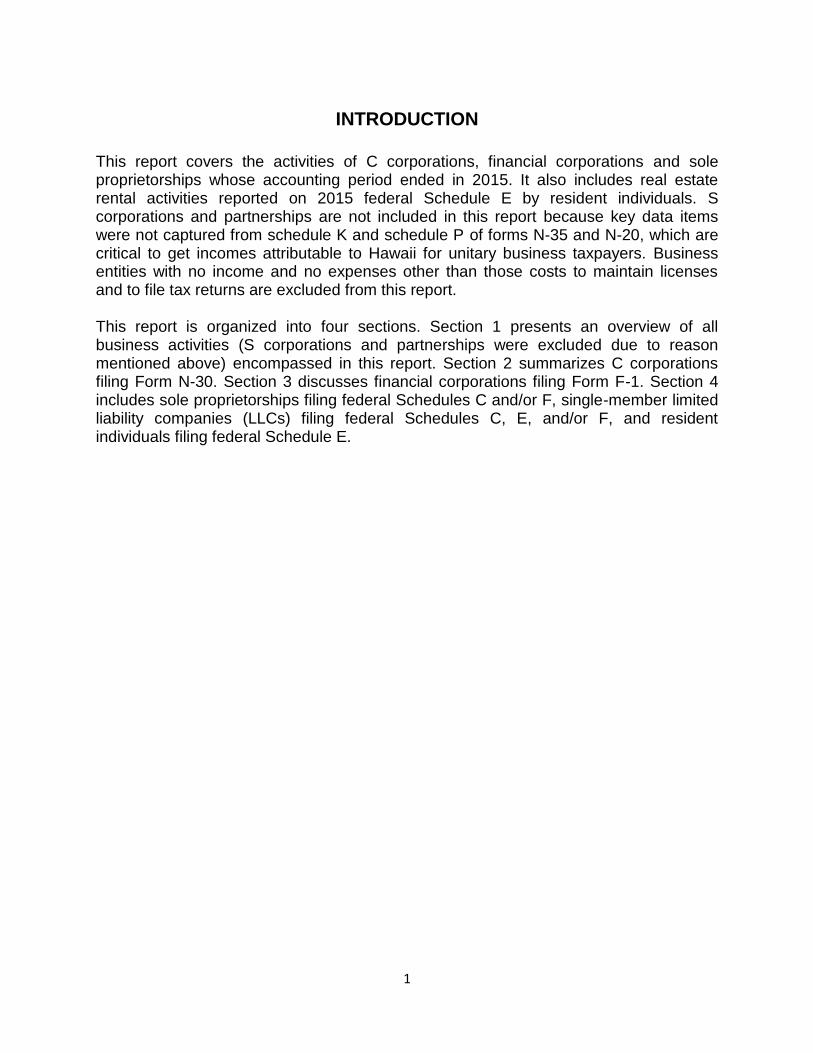
1
INTRODUCTION
This report covers the activities of C corporations, financial corporations and sole proprietorships whose accounting period ended in 2015. It also includes real estate rental activities reported on 2015 federal Schedule E by resident individuals. S corporations and partnerships are not included in this report because key data items were not captured from schedule K and schedule P of forms N-35 and N-20, which are critical to get incomes attributable to Hawaii for unitary business taxpayers. Business entities with no income and no expenses other than those costs to maintain licenses and to file tax returns are excluded from this report. This report is organized into four sections. Section 1 presents an overview of all business activities (S corporations and partnerships were excluded due to reason mentioned above) encompassed in this report. Section 2 summarizes C corporations filing Form N-30. Section 3 discusses financial corporations filing Form F-1. Section 4 includes sole proprietorships filing federal Schedules C and/or F, single-member limited liability companies (LLCs) filing federal Schedules C, E, and/or F, and resident individuals filing federal Schedule E.
2
SECTION 1
OVERVIEW OF BUSINESS RETURNS
SUMMARY
A total of 155,593 income tax returns were filed by C corporations, financial corporations and sole proprietorships whose accounting periods ended in 2015. Their aggregate Hawaii business receipts totaled $79.6 billion. A total of 105,379 businesses, or 56.0% of all businesses, reported net profits of $4.6 billion. The remaining businesses recorded net losses of $1.9 billion (Table 1-1).
The most common business entities were sole proprietors (Schedules C, F and E), representing 91.6% of all three types of business filings for the period. However, sole proprietors accounted for only 7.3% of the total business receipts. The largest portion of cumulative receipts was attributable to C corporations, contributing 89.6% of the total. With higher capitalization, C corporations generated larger average business receipts although they made up only 8.3% of all business entities. Business with $1 million or more in business receipts accounted for 90.9% of the total business receipts even though they made up only 2.3% of all business entities (Table 1-1).
BUSINESS RETURNS
The most common forms of business are the sole proprietorship, partnership, C corporation, and S corporation. A sole proprietorship is an unincorporated business that is owned by one individual. It is the simplest form of business organization. Proprietorship's liabilities are the proprietor's personal liabilities. Proprietors report their business activities on Schedule C and/or Schedule F (for farming activities) and attach the schedules to their federal individual income tax returns. A limited liability company (LLC) is a relatively new business structure allowed by state statute. Owners of an LLC are called members. Members of LLCs have limited personal liability for the debts and actions of the LLCs. A single-member LLC is automatically treated as if it were a sole proprietorship, unless an election is made to be treated as a corporation. Single-member LLCs report their incomes and expenses on Schedules C, E, and/or F and attach the schedules to their federal individual income tax returns.
3
If a sole proprietor owns more than one business, he or she has to complete a separate schedule for each business. In the case of multiple schedules filed, each schedule is considered a separate entity in this report. A partnership is an entity in which two or more partners join to form a business venture. Each partner expects to share in the profits and losses of the business. Partnerships file Form N-20 to report their activities, but they do not directly pay income tax. Instead, they "pass through" any profits, losses, and credits to their partners. Partners include their share of income, loss, and credit on their individual tax returns. Unfortunately, the partnership statistics could not be extracted and was excluded in this report due to reasons mentioned in the introduction. In forming a corporation, prospective shareholders exchange money and/or property for the corporation's capital stock. C corporations with gross income from property owned, trade or business conducted, or any other source in Hawaii file Form N-30 and are subject to the corporate income tax. In addition, every corporation that is incorporated under the laws of Hawaii must file Form N-30 if it has gross income from any source outside of Hawaii. Financial corporations are exempt from the income tax but are subject to the franchise tax. They report their activities on Form F-1. An eligible domestic corporation that elects to become an S corporation can avoid the corporate income tax. However, the S corporation is liable for the tax on certain capital gains and passive income. To be treated as an S corporation, the corporation has to meet the following requirements: 1) the corporation has no more than 100 shareholders; 2) the corporation has only one class of stock; 3) all of the shareholders are U.S. residents, either citizens or resident aliens; 4) all of the shareholders are individuals (i.e., no corporations or other entities own the stock except for certain trusts, or estates); and 5) the corporation operates on a calendar year financial basis. S corporations file Form N-35. The S corporation's shareholders include their share of income, loss, deduction, and credit on their individual tax returns. Unfortunately, the S corporation statistics could not be extracted and was excluded in this report due to reasons mentioned in the introduction. Individuals who received rental income from real estate and were not in the real estate business file and attach Schedule E to their federal individual income tax returns. In this report, rental activity reported on Schedule E is treated as a business entity and included in the proprietorship count.
DATA SOURCE AND METHODOLOGY
The primary data sources for C corporations, S corporations and partnerships were the Hawaii Department of Taxation's computerized Integrated Tax Information Management System (ITIMS). The Internal Revenue Service's Business Return Transaction File (BRTF) was the secondary source, and it provided additional data items not captured by
4
the state systems. Certain data items that are not available from electronic sources were collected manually from paper returns. Since federal Schedules C, F and E are not required on Hawaii tax returns, the Internal Revenue Service's Individual Return Transaction File (IRTF) was the primary data source for sole proprietorships. Supplemental data items not captured by IRTF were extracted from ITIMS. For financial corporations, all data items were recorded manually from Form F-1 because this data is not available in electronic format. Wage information was obtained from a combination of various sources: Tax System Modernization (TSM) program (Form HW-3, Employer’s Annual Return & Reconciliation of Hawaii Income Tax Withheld from Wages; Form HW-14, Periodic Withholding Tax Returns ), BRTF, and IRTF. The count of W-2 forms was retrieved from form HW-3. Due to missing or wrong federal employer identification number (FEIN) on schedule C and F, the count of W-2 forms could not be obtained for proprietorships. In this report, "business receipts" refers to primary payments received for goods and services provided by the trade or business. It does not include passive income such as interest, rent and capital gains, except where passive income is the major business activity of an entity. Business receipts and all other income less business expenses, including the cost of goods sold and returns and allowances result in either net profits or net losses. For proprietors, any profit or loss from their business activities is included as ordinary income on their individual tax returns. A business entity that filed allocation and apportionment of income is classified as an “apportioned” entity in this report. Its out-of–state sales and compensation paid are excluded from gross business receipts and wages. Apportioned Hawaii sales and compensation paid are reported as business receipts and wages paid respectively. Business entities not apportioning income are classified as “non-apportioned” entities.
INDUSTRIAL CLASSIFICATION Each return was assigned an industry code that described its principal business activity. The industry code was provided on the business income tax return by the taxpayer. Where the industry code was not valid or left blank, the code assigned was based on the taxpayer's description of its business activity as reported on the tax return. An entity with multiple business activities was assigned an industry code that most closely reflected its principal activity. For proprietors filing multiple Schedules C and F, each schedule was assigned a separate code because each proprietorship activity was treated as a single entity. The 2012 edition of the North American Industry Classification System (NAICS) was used as a guideline in the assignment of codes.
5
It should be noted that assigning only one industry code to an entity can impose some limitations on data interpretation. An entity that is classified in a specific industrial category may operate several other business activities more properly included in other categories. For example, an entity that manufactures petroleum products may have wholesale (sales to retail stores) and retail (sales to final consumers) activities. Also, the activities reported for a given industrial category may not be inclusive of all comparable business operations. For instance, the category "liquor stores" would not include the liquor sales by department stores and grocery stores. In general, the activity that generated the largest portion of business receipts for an entity determined its assignment to an industrial category.
STATISTICAL OVERVIEW TAXATION DISTRICTS The State of Hawaii is geographically divided into four taxation districts: the First Taxation District includes the island of Oahu; the Second Taxation District, the islands of Maui, Molokai and Lanai; the Third Taxation District, the island of Hawaii; and the Fourth Taxation District, the islands of Kauai and Niihau. Each business entity normally files its tax return in the district where it is located. Entities conducting business in more than one district may consolidate their data and file only in one district, generally the First, the most populous district in the state. Table 1-3 shows the distribution of businesses by district. As expected, business filings were concentrated in the First District and paralleled the population distribution in each district. Business returns were distributed as follows: 65.1% in the First District, 13.8% in the Second District, 15.2% in the Third District, and 5.9% in the Fourth District. A similar distribution pattern was seen in most industry groups. All industries were concentrated in the First District, except the agriculture and fishing industry. More than half of the agriculture and fishing entities were in the Third District, which has more than 60% of the state's agricultural area. As seen in Table 1-10, businesses that filed in the First District accounted for 92.8% of business receipts, 94.0% of wages paid. This is due in part to a concentration of the state's largest businesses in the First District. Another reason is that some businesses combined their activities from different districts and filed on a consolidated basis in the First District.
BUSINESS RECEIPTS
Hawaii business receipts amounted to $79.6 billion in 2015. Table 1-1 and 1-6 indicates that only 4,400 business entities, or 2.3% of all business entities, had Hawaii business receipts of at least $1 million. However, these business entities accounted for 90.9% of business receipts, 59.9% of net profits, 89.6% of wages paid.
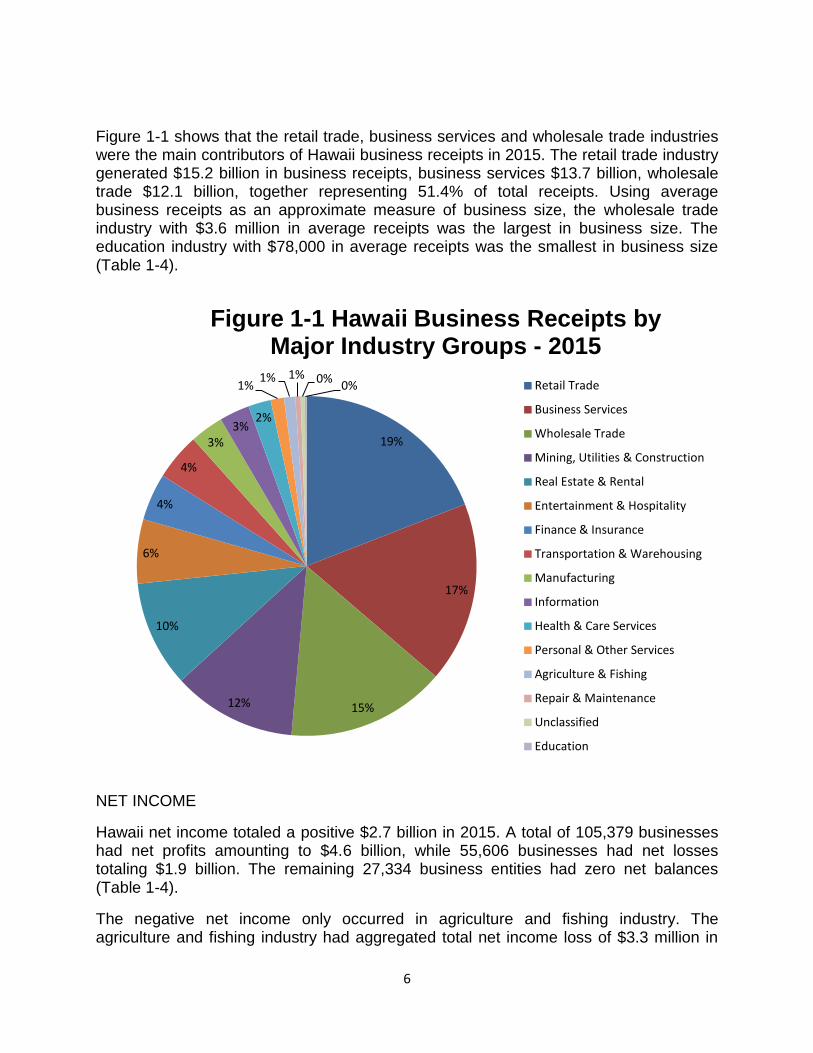
6
Figure 1-1 shows that the retail trade, business services and wholesale trade industries were the main contributors of Hawaii business receipts in 2015. The retail trade industry generated $15.2 billion in business receipts, business services $13.7 billion, wholesale trade $12.1 billion, together representing 51.4% of total receipts. Using average business receipts as an approximate measure of business size, the wholesale trade industry with $3.6 million in average receipts was the largest in business size. The education industry with $78,000 in average receipts was the smallest in business size (Table 1-4).
NET INCOME
Hawaii net income totaled a positive $2.7 billion in 2015. A total of 105,379 businesses had net profits amounting to $4.6 billion, while 55,606 businesses had net losses totaling $1.9 billion. The remaining 27,334 business entities had zero net balances (Table 1-4).
The negative net income only occurred in agriculture and fishing industry. The agriculture and fishing industry had aggregated total net income loss of $3.3 million in
19%
17%
15% 12%
10%
6%
4%
4%
3% 3%
2%
1% 1% 1% 0%
0%
Figure 1-1 Hawaii Business Receipts by Major Industry Groups - 2015
Retail Trade
Business Services
Wholesale Trade
Mining, Utilities & Construction
Real Estate & Rental
Entertainment & Hospitality
Finance & Insurance
Transportation & Warehousing
Manufacturing
Information
Health & Care Services
Personal & Other Services
Agriculture & Fishing
Repair & Maintenance
Unclassified
Education
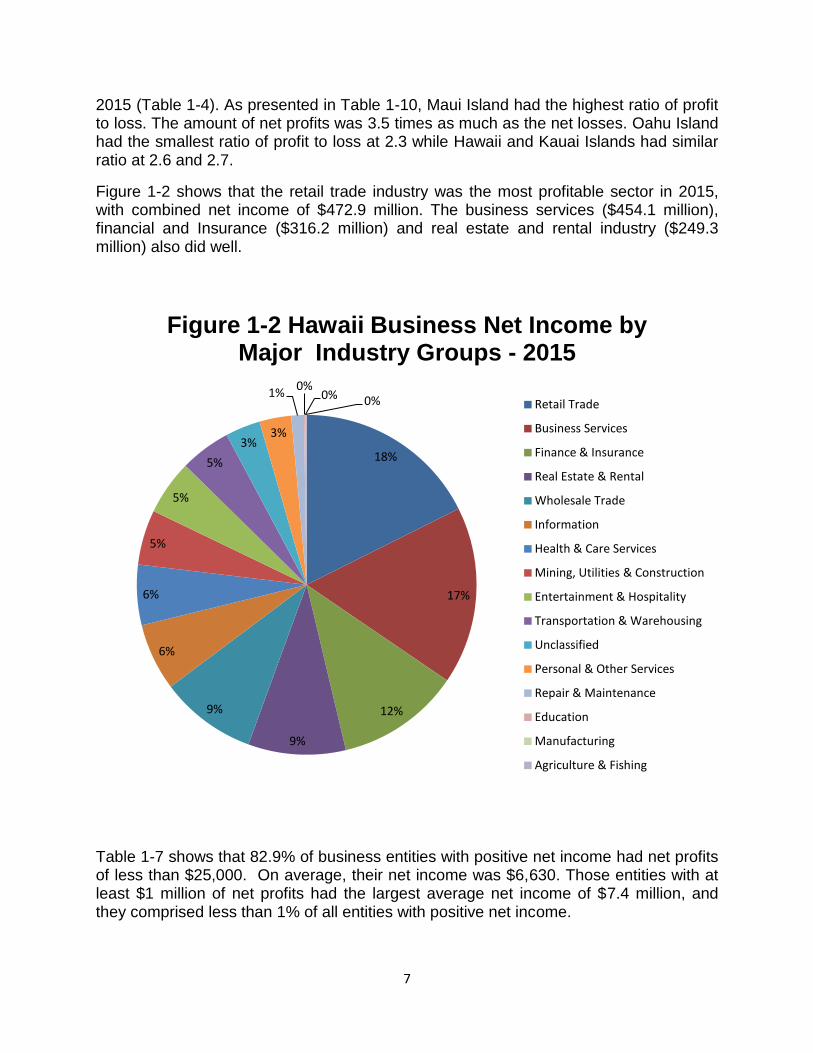
7
2015 (Table 1-4). As presented in Table 1-10, Maui Island had the highest ratio of profit to loss. The amount of net profits was 3.5 times as much as the net losses. Oahu Island had the smallest ratio of profit to loss at 2.3 while Hawaii and Kauai Islands had similar ratio at 2.6 and 2.7.
Figure 1-2 shows that the retail trade industry was the most profitable sector in 2015, with combined net income of $472.9 million. The business services ($454.1 million), financial and Insurance ($316.2 million) and real estate and rental industry ($249.3 million) also did well.
Table 1-7 shows that 82.9% of business entities with positive net income had net profits of less than $25,000. On average, their net income was $6,630. Those entities with at least $1 million of net profits had the largest average net income of $7.4 million, and they comprised less than 1% of all entities with positive net income.
18%
17%
12%
9%
9%
6%
6%
5%
5%
5%
3% 3%
1% 0%
0% 0%
Figure 1-2 Hawaii Business Net Income by Major Industry Groups - 2015
Retail Trade
Business Services
Finance & Insurance
Real Estate & Rental
Wholesale Trade
Information
Health & Care Services
Mining, Utilities & Construction
Entertainment & Hospitality
Transportation & Warehousing
Unclassified
Personal & Other Services
Repair & Maintenance
Education
Manufacturing
Agriculture & Fishing
8
WAGES and W-2 FORMS
Hawaii businesses reported $10.4 billion in wages paid. The three industries that paid out the most in wages were business services ($2.6 billion), retail trade ($1.4 billion) and entertainment and hospitality ($1.2 billion) (Table 1-4).
Due to technical difficulty mentioned in Data Source and Methodology, the count of W-2 forms could not be obtained for proprietorship. Therefore, overview of W-2 forms is not presented here. See section 2 and 3 for W-2 form statistics of C corporations and financial corporations. It should be noted that since businesses issue a W-2 form to every employee, regardless of length of service or turnover rate, the W-2 count only approximates the actual job or position count.
9
Section 1
Overview of Business Returns
Statistical Tables
Dollar amounts and percentages are rounded and may not add up to totals.
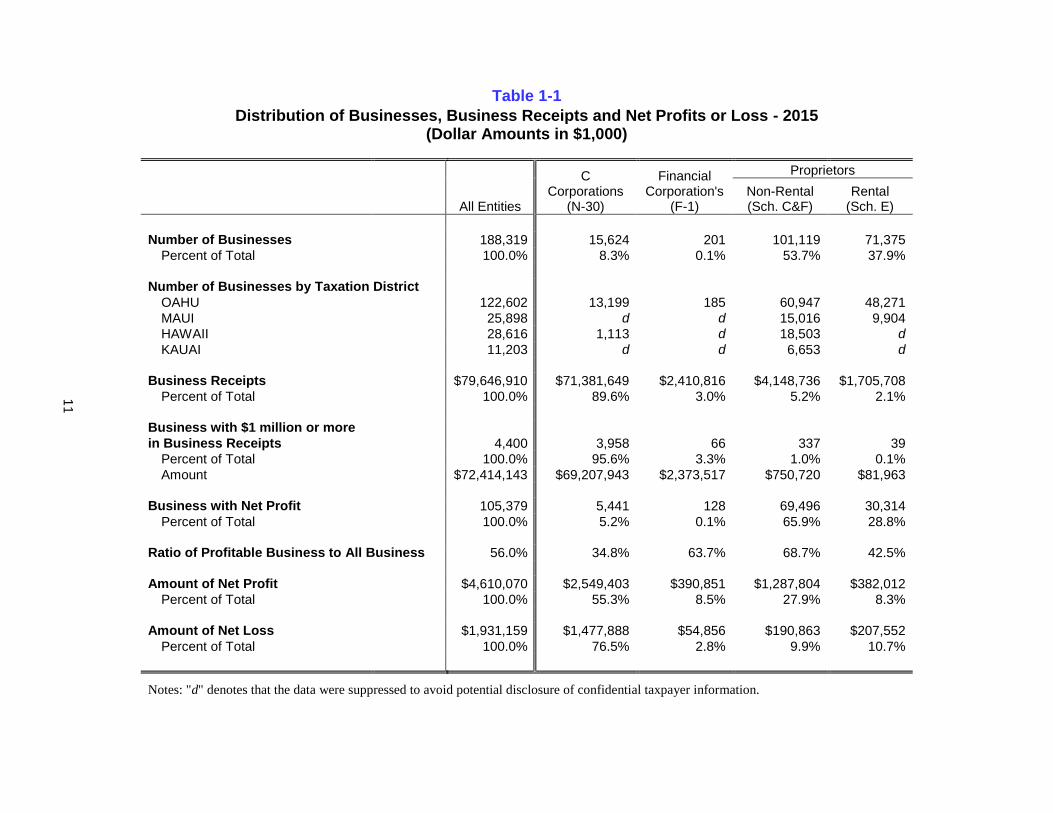
11
Table 1-1
Distribution of Businesses, Business Receipts and Net Profits or Loss - 2015 (Dollar Amounts in $1,000)
All Entities
C Corporations
(N-30)
Financial Corporation's
(F-1)
Proprietors
Non-Rental (Sch. C&F)
Rental (Sch. E)
Number of Businesses 188,319 15,624 201 101,119 71,375
Percent of Total 100.0% 8.3% 0.1% 53.7% 37.9%
Number of Businesses by Taxation District OAHU
122,602 13,199 185 60,947 48,271
MAUI
25,898 d d 15,016 9,904
HAWAII
28,616 1,113 d 18,503 d
KAUAI
11,203 d d 6,653 d
Business Receipts $79,646,910 $71,381,649 $2,410,816 $4,148,736 $1,705,708
Percent of Total 100.0% 89.6% 3.0% 5.2% 2.1%
Business with $1 million or more in Business Receipts 4,400 3,958 66 337 39
Percent of Total
100.0% 95.6% 3.3% 1.0% 0.1%
Amount
$72,414,143 $69,207,943 $2,373,517 $750,720 $81,963
Business with Net Profit 105,379 5,441 128 69,496 30,314
Percent of Total 100.0% 5.2% 0.1% 65.9% 28.8%
Ratio of Profitable Business to All Business 56.0% 34.8% 63.7% 68.7% 42.5%
Amount of Net Profit $4,610,070 $2,549,403 $390,851 $1,287,804 $382,012
Percent of Total 100.0% 55.3% 8.5% 27.9% 8.3%
Amount of Net Loss $1,931,159 $1,477,888 $54,856 $190,863 $207,552
Percent of Total 100.0% 76.5% 2.8% 9.9% 10.7%
Notes: "d" denotes that the data were suppressed to avoid potential disclosure of confidential taxpayer information.
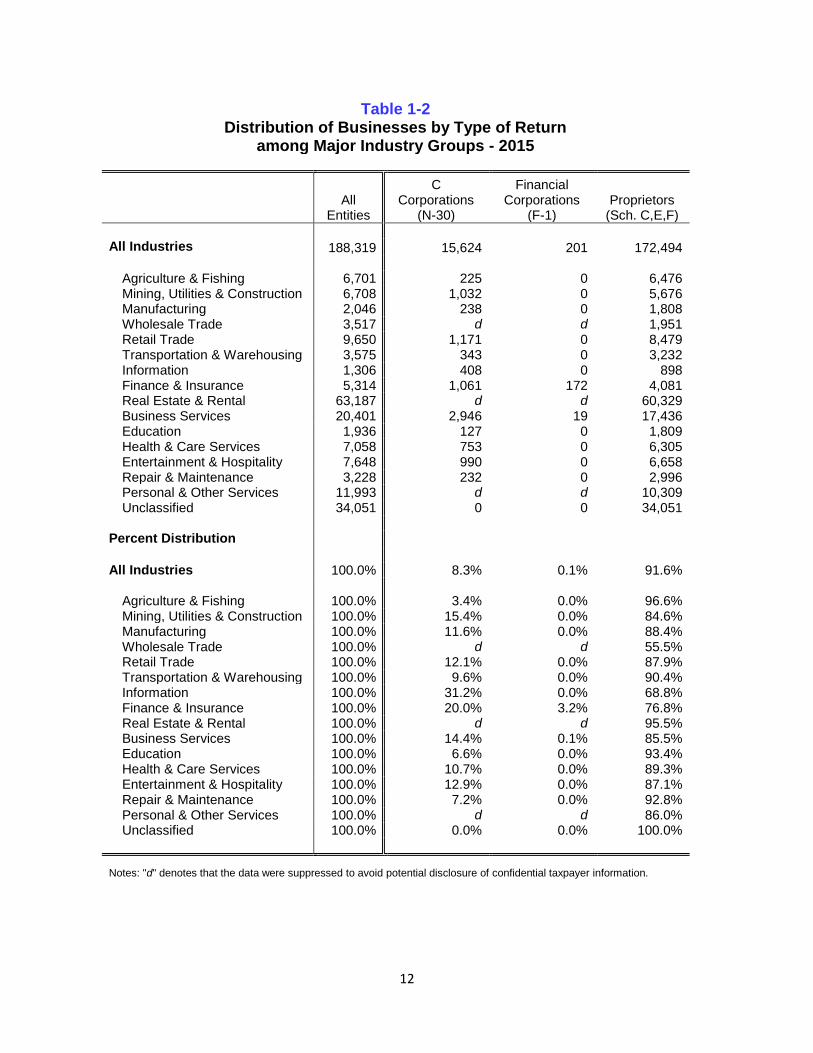
12
Table 1-2 Distribution of Businesses by Type of Return
among Major Industry Groups - 2015
All Entities
C Corporations
(N-30)
Financial Corporations
(F-1) Proprietors
(Sch. C,E,F)
All Industries 188,319 15,624 201 172,494
Agriculture & Fishing 6,701 225 0 6,476 Mining, Utilities & Construction 6,708 1,032 0 5,676 Manufacturing 2,046 238 0 1,808 Wholesale Trade 3,517 d d 1,951 Retail Trade 9,650 1,171 0 8,479 Transportation & Warehousing 3,575 343 0 3,232 Information 1,306 408 0 898 Finance & Insurance 5,314 1,061 172 4,081 Real Estate & Rental 63,187 d d 60,329 Business Services 20,401 2,946 19 17,436 Education 1,936 127 0 1,809 Health & Care Services 7,058 753 0 6,305 Entertainment & Hospitality 7,648 990 0 6,658 Repair & Maintenance 3,228 232 0 2,996 Personal & Other Services 11,993 d d 10,309 Unclassified 34,051 0 0 34,051
Percent Distribution All Industries 100.0% 8.3% 0.1% 91.6%
Agriculture & Fishing 100.0% 3.4% 0.0% 96.6%
Mining, Utilities & Construction 100.0% 15.4% 0.0% 84.6% Manufacturing 100.0% 11.6% 0.0% 88.4% Wholesale Trade 100.0% d d 55.5% Retail Trade 100.0% 12.1% 0.0% 87.9% Transportation & Warehousing 100.0% 9.6% 0.0% 90.4% Information 100.0% 31.2% 0.0% 68.8% Finance & Insurance 100.0% 20.0% 3.2% 76.8% Real Estate & Rental 100.0% d d 95.5% Business Services 100.0% 14.4% 0.1% 85.5% Education 100.0% 6.6% 0.0% 93.4% Health & Care Services 100.0% 10.7% 0.0% 89.3% Entertainment & Hospitality 100.0% 12.9% 0.0% 87.1% Repair & Maintenance 100.0% 7.2% 0.0% 92.8% Personal & Other Services 100.0% d d 86.0% Unclassified 100.0% 0.0% 0.0% 100.0%
Notes: "d" denotes that the data were suppressed to avoid potential disclosure of confidential taxpayer information.
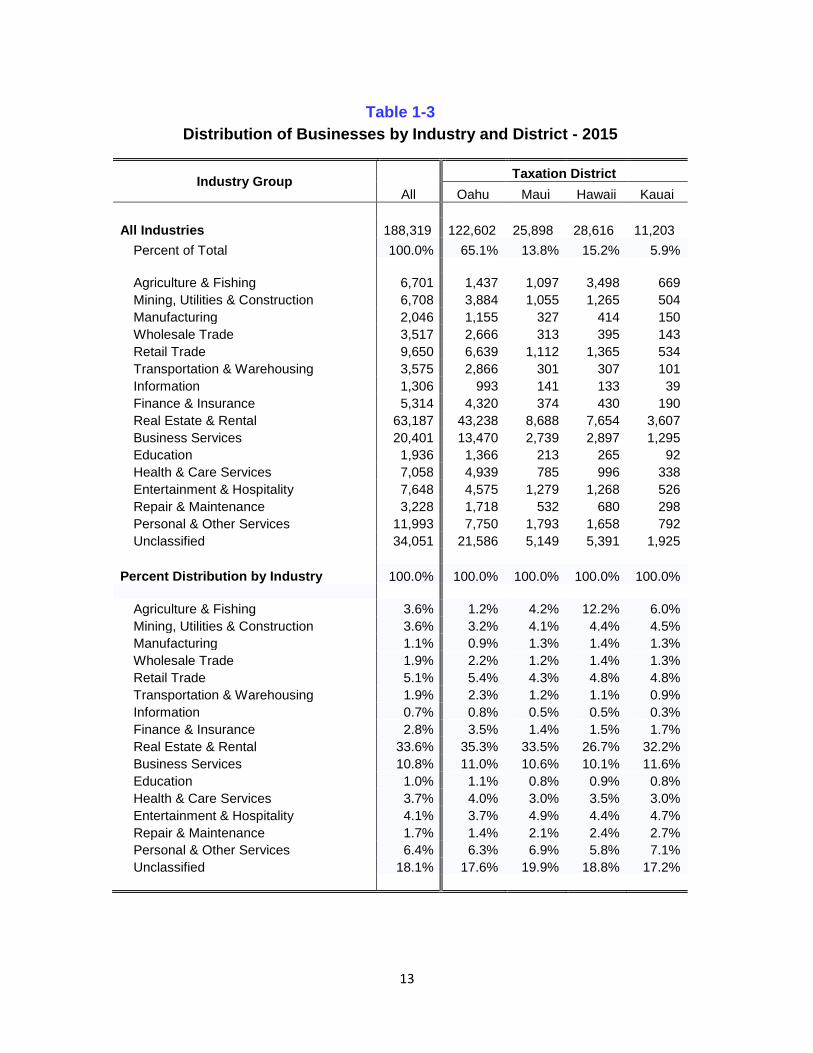
13
Table 1-3
Distribution of Businesses by Industry and District - 2015
Industry Group All
Taxation District
Oahu Maui Hawaii Kauai
All Industries 188,319 122,602 25,898 28,616 11,203
Percent of Total 100.0% 65.1% 13.8% 15.2% 5.9%
Agriculture & Fishing 6,701 1,437 1,097 3,498 669
Mining, Utilities & Construction 6,708 3,884 1,055 1,265 504
Manufacturing 2,046 1,155 327 414 150
Wholesale Trade 3,517 2,666 313 395 143
Retail Trade 9,650 6,639 1,112 1,365 534
Transportation & Warehousing 3,575 2,866 301 307 101
Information 1,306 993 141 133 39
Finance & Insurance 5,314 4,320 374 430 190
Real Estate & Rental 63,187 43,238 8,688 7,654 3,607
Business Services 20,401 13,470 2,739 2,897 1,295
Education 1,936 1,366 213 265 92
Health & Care Services 7,058 4,939 785 996 338
Entertainment & Hospitality 7,648 4,575 1,279 1,268 526
Repair & Maintenance 3,228 1,718 532 680 298
Personal & Other Services 11,993 7,750 1,793 1,658 792
Unclassified 34,051 21,586 5,149 5,391 1,925
Percent Distribution by Industry 100.0% 100.0% 100.0% 100.0% 100.0%
Agriculture & Fishing 3.6% 1.2% 4.2% 12.2% 6.0%
Mining, Utilities & Construction 3.6% 3.2% 4.1% 4.4% 4.5%
Manufacturing 1.1% 0.9% 1.3% 1.4% 1.3%
Wholesale Trade 1.9% 2.2% 1.2% 1.4% 1.3%
Retail Trade 5.1% 5.4% 4.3% 4.8% 4.8%
Transportation & Warehousing 1.9% 2.3% 1.2% 1.1% 0.9%
Information 0.7% 0.8% 0.5% 0.5% 0.3%
Finance & Insurance 2.8% 3.5% 1.4% 1.5% 1.7%
Real Estate & Rental 33.6% 35.3% 33.5% 26.7% 32.2%
Business Services 10.8% 11.0% 10.6% 10.1% 11.6%
Education 1.0% 1.1% 0.8% 0.9% 0.8%
Health & Care Services 3.7% 4.0% 3.0% 3.5% 3.0%
Entertainment & Hospitality 4.1% 3.7% 4.9% 4.4% 4.7%
Repair & Maintenance 1.7% 1.4% 2.1% 2.4% 2.7%
Personal & Other Services 6.4% 6.3% 6.9% 5.8% 7.1%
Unclassified 18.1% 17.6% 19.9% 18.8% 17.2%
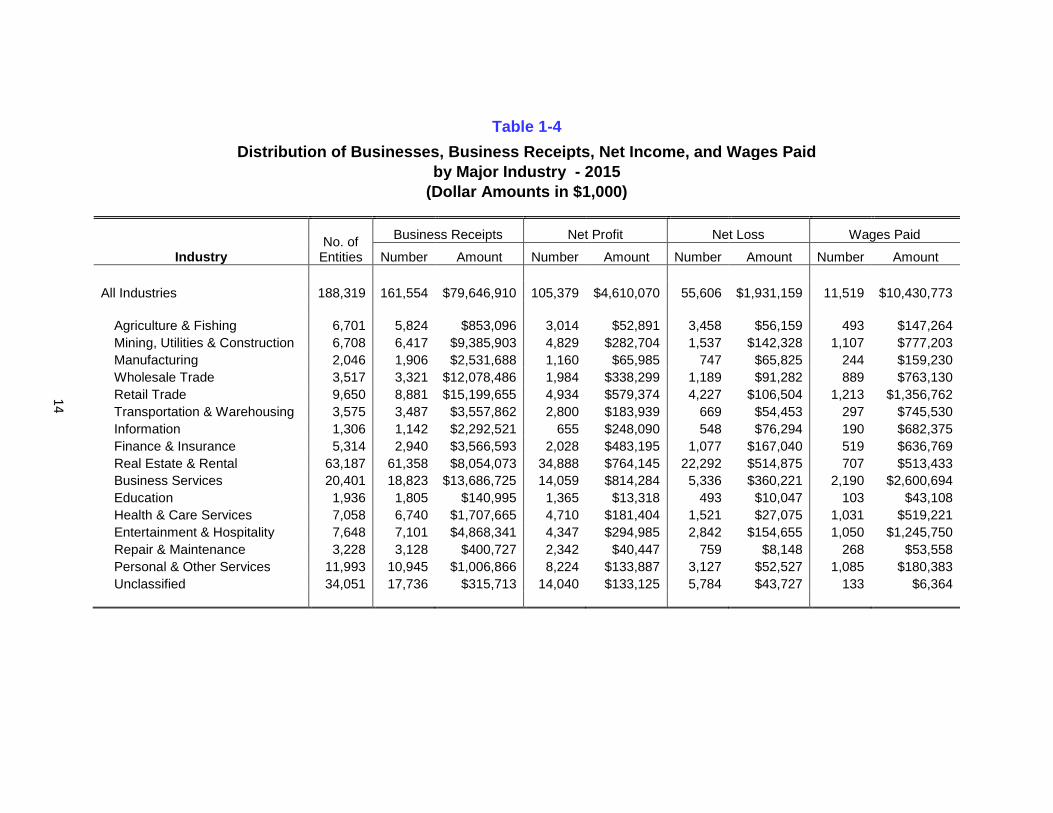
14
Table 1-4
Distribution of Businesses, Business Receipts, Net Income, and Wages Paid
by Major Industry - 2015
(Dollar Amounts in $1,000)
Industry No. of
Entities
Business Receipts Net Profit Net Loss Wages Paid
Number Amount Number Amount Number Amount Number Amount
All Industries 188,319 161,554 $79,646,910 105,379 $4,610,070 55,606 $1,931,159 11,519 $10,430,773
Agriculture & Fishing 6,701 5,824 $853,096 3,014 $52,891 3,458 $56,159 493 $147,264
Mining, Utilities & Construction 6,708 6,417 $9,385,903 4,829 $282,704 1,537 $142,328 1,107 $777,203
Manufacturing 2,046 1,906 $2,531,688 1,160 $65,985 747 $65,825 244 $159,230
Wholesale Trade 3,517 3,321 $12,078,486 1,984 $338,299 1,189 $91,282 889 $763,130
Retail Trade 9,650 8,881 $15,199,655 4,934 $579,374 4,227 $106,504 1,213 $1,356,762
Transportation & Warehousing 3,575 3,487 $3,557,862 2,800 $183,939 669 $54,453 297 $745,530
Information 1,306 1,142 $2,292,521 655 $248,090 548 $76,294 190 $682,375
Finance & Insurance 5,314 2,940 $3,566,593 2,028 $483,195 1,077 $167,040 519 $636,769
Real Estate & Rental 63,187 61,358 $8,054,073 34,888 $764,145 22,292 $514,875 707 $513,433
Business Services 20,401 18,823 $13,686,725 14,059 $814,284 5,336 $360,221 2,190 $2,600,694
Education 1,936 1,805 $140,995 1,365 $13,318 493 $10,047 103 $43,108
Health & Care Services 7,058 6,740 $1,707,665 4,710 $181,404 1,521 $27,075 1,031 $519,221
Entertainment & Hospitality 7,648 7,101 $4,868,341 4,347 $294,985 2,842 $154,655 1,050 $1,245,750
Repair & Maintenance 3,228 3,128 $400,727 2,342 $40,447 759 $8,148 268 $53,558
Personal & Other Services 11,993 10,945 $1,006,866 8,224 $133,887 3,127 $52,527 1,085 $180,383
Unclassified 34,051 17,736 $315,713 14,040 $133,125 5,784 $43,727 133 $6,364
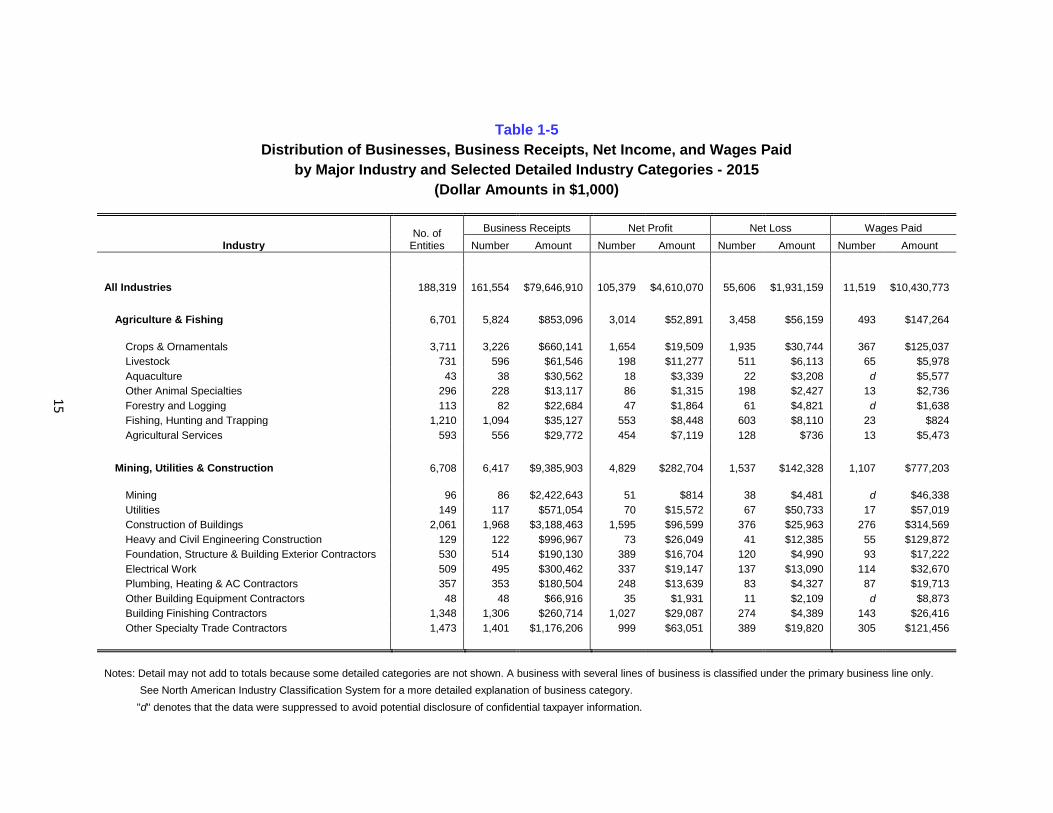
15
Table 1-5
Distribution of Businesses, Business Receipts, Net Income, and Wages Paid
by Major Industry and Selected Detailed Industry Categories - 2015
(Dollar Amounts in $1,000)
Industry No. of
Entities
Business Receipts Net Profit Net Loss Wages Paid
Number Amount Number Amount Number Amount Number Amount
All Industries 188,319 161,554 $79,646,910 105,379 $4,610,070 55,606 $1,931,159 11,519 $10,430,773
Agriculture & Fishing 6,701 5,824 $853,096 3,014 $52,891 3,458 $56,159 493 $147,264
Crops & Ornamentals 3,711 3,226 $660,141 1,654 $19,509 1,935 $30,744 367 $125,037
Livestock 731 596 $61,546 198 $11,277 511 $6,113 65 $5,978
Aquaculture 43 38 $30,562 18 $3,339 22 $3,208 d $5,577
Other Animal Specialties 296 228 $13,117 86 $1,315 198 $2,427 13 $2,736
Forestry and Logging 113 82 $22,684 47 $1,864 61 $4,821 d $1,638
Fishing, Hunting and Trapping 1,210 1,094 $35,127 553 $8,448 603 $8,110 23 $824
Agricultural Services 593 556 $29,772 454 $7,119 128 $736 13 $5,473
Mining, Utilities & Construction 6,708 6,417 $9,385,903 4,829 $282,704 1,537 $142,328 1,107 $777,203
Mining 96 86 $2,422,643 51 $814 38 $4,481 d $46,338
Utilities 149 117 $571,054 70 $15,572 67 $50,733 17 $57,019
Construction of Buildings 2,061 1,968 $3,188,463 1,595 $96,599 376 $25,963 276 $314,569
Heavy and Civil Engineering Construction 129 122 $996,967 73 $26,049 41 $12,385 55 $129,872
Foundation, Structure & Building Exterior Contractors 530 514 $190,130 389 $16,704 120 $4,990 93 $17,222
Electrical Work 509 495 $300,462 337 $19,147 137 $13,090 114 $32,670
Plumbing, Heating & AC Contractors 357 353 $180,504 248 $13,639 83 $4,327 87 $19,713
Other Building Equipment Contractors 48 48 $66,916 35 $1,931 11 $2,109 d $8,873
Building Finishing Contractors 1,348 1,306 $260,714 1,027 $29,087 274 $4,389 143 $26,416
Other Specialty Trade Contractors 1,473 1,401 $1,176,206 999 $63,051 389 $19,820 305 $121,456
Notes: Detail may not add to totals because some detailed categories are not shown. A business with several lines of business is classified under the primary business line only.
See North American Industry Classification System for a more detailed explanation of business category.
"d" denotes that the data were suppressed to avoid potential disclosure of confidential taxpayer information.
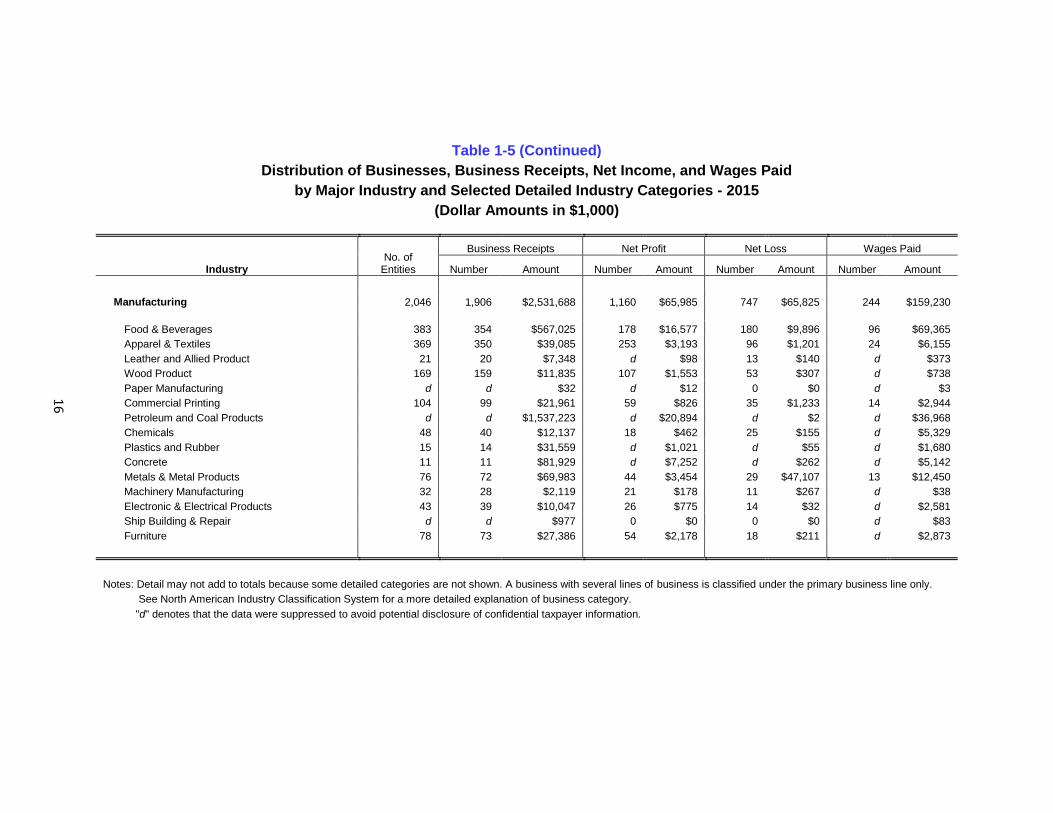
16
Table 1-5 (Continued)
Distribution of Businesses, Business Receipts, Net Income, and Wages Paid
by Major Industry and Selected Detailed Industry Categories - 2015
(Dollar Amounts in $1,000)
Industry No. of
Entities
Business Receipts Net Profit Net Loss Wages Paid
Number Amount Number Amount Number Amount Number Amount
Manufacturing 2,046 1,906 $2,531,688 1,160 $65,985 747 $65,825 244 $159,230
Food & Beverages 383 354 $567,025 178 $16,577 180 $9,896 96 $69,365
Apparel & Textiles 369 350 $39,085 253 $3,193 96 $1,201 24 $6,155
Leather and Allied Product 21 20 $7,348 d $98 13 $140 d $373
Wood Product 169 159 $11,835 107 $1,553 53 $307 d $738
Paper Manufacturing d d $32 d $12 0 $0 d $3
Commercial Printing 104 99 $21,961 59 $826 35 $1,233 14 $2,944
Petroleum and Coal Products d d $1,537,223 d $20,894 d $2 d $36,968
Chemicals 48 40 $12,137 18 $462 25 $155 d $5,329
Plastics and Rubber 15 14 $31,559 d $1,021 d $55 d $1,680
Concrete 11 11 $81,929 d $7,252 d $262 d $5,142
Metals & Metal Products 76 72 $69,983 44 $3,454 29 $47,107 13 $12,450
Machinery Manufacturing 32 28 $2,119 21 $178 11 $267 d $38
Electronic & Electrical Products 43 39 $10,047 26 $775 14 $32 d $2,581
Ship Building & Repair d d $977 0 $0 0 $0 d $83
Furniture 78 73 $27,386 54 $2,178 18 $211 d $2,873
Notes: Detail may not add to totals because some detailed categories are not shown. A business with several lines of business is classified under the primary business line only.
See North American Industry Classification System for a more detailed explanation of business category.
"d" denotes that the data were suppressed to avoid potential disclosure of confidential taxpayer information.
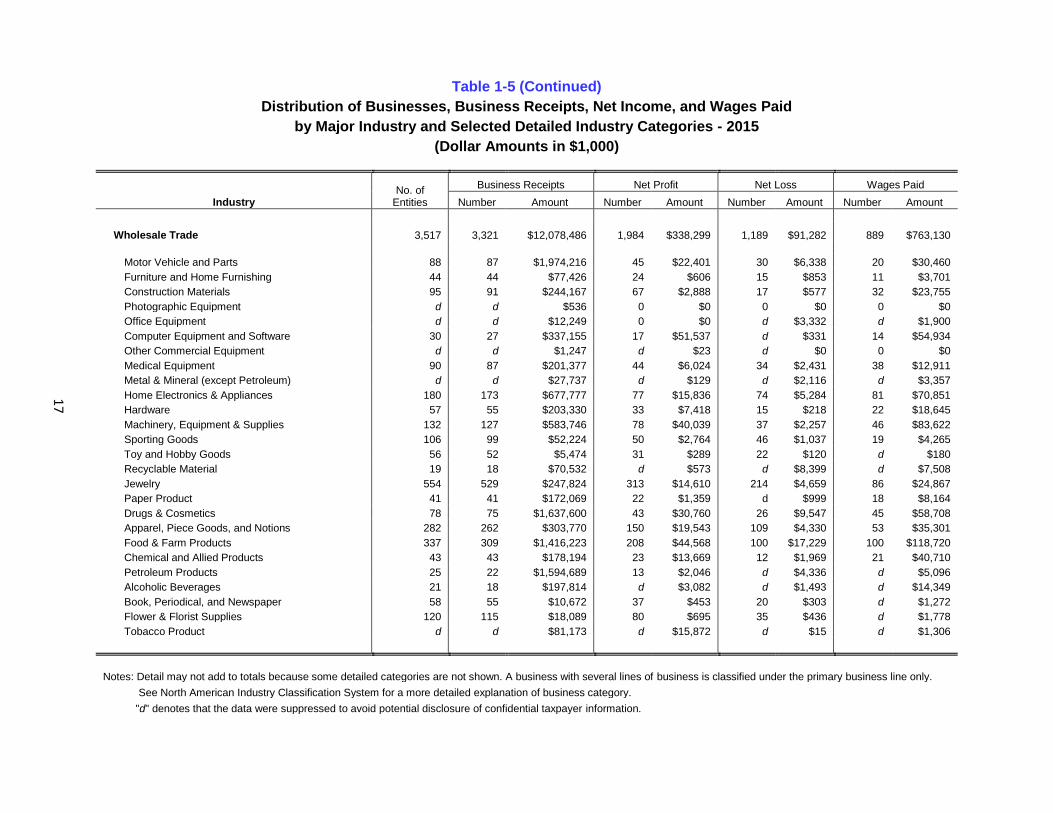
17
Table 1-5 (Continued)
Distribution of Businesses, Business Receipts, Net Income, and Wages Paid
by Major Industry and Selected Detailed Industry Categories - 2015
(Dollar Amounts in $1,000)
Industry No. of
Entities
Business Receipts Net Profit Net Loss Wages Paid
Number Amount Number Amount Number Amount Number Amount
Wholesale Trade 3,517 3,321 $12,078,486 1,984 $338,299 1,189 $91,282 889 $763,130
Motor Vehicle and Parts 88 87 $1,974,216 45 $22,401 30 $6,338 20 $30,460
Furniture and Home Furnishing 44 44 $77,426 24 $606 15 $853 11 $3,701
Construction Materials 95 91 $244,167 67 $2,888 17 $577 32 $23,755
Photographic Equipment d d $536 0 $0 0 $0 0 $0
Office Equipment d d $12,249 0 $0 d $3,332 d $1,900
Computer Equipment and Software 30 27 $337,155 17 $51,537 d $331 14 $54,934
Other Commercial Equipment d d $1,247 d $23 d $0 0 $0
Medical Equipment 90 87 $201,377 44 $6,024 34 $2,431 38 $12,911
Metal & Mineral (except Petroleum) d d $27,737 d $129 d $2,116 d $3,357
Home Electronics & Appliances 180 173 $677,777 77 $15,836 74 $5,284 81 $70,851
Hardware 57 55 $203,330 33 $7,418 15 $218 22 $18,645
Machinery, Equipment & Supplies 132 127 $583,746 78 $40,039 37 $2,257 46 $83,622
Sporting Goods 106 99 $52,224 50 $2,764 46 $1,037 19 $4,265
Toy and Hobby Goods 56 52 $5,474 31 $289 22 $120 d $180
Recyclable Material 19 18 $70,532 d $573 d $8,399 d $7,508
Jewelry 554 529 $247,824 313 $14,610 214 $4,659 86 $24,867
Paper Product 41 41 $172,069 22 $1,359 d $999 18 $8,164
Drugs & Cosmetics 78 75 $1,637,600 43 $30,760 26 $9,547 45 $58,708
Apparel, Piece Goods, and Notions 282 262 $303,770 150 $19,543 109 $4,330 53 $35,301
Food & Farm Products 337 309 $1,416,223 208 $44,568 100 $17,229 100 $118,720
Chemical and Allied Products 43 43 $178,194 23 $13,669 12 $1,969 21 $40,710
Petroleum Products 25 22 $1,594,689 13 $2,046 d $4,336 d $5,096
Alcoholic Beverages 21 18 $197,814 d $3,082 d $1,493 d $14,349
Book, Periodical, and Newspaper 58 55 $10,672 37 $453 20 $303 d $1,272
Flower & Florist Supplies 120 115 $18,089 80 $695 35 $436 d $1,778
Tobacco Product d d $81,173 d $15,872 d $15 d $1,306
Notes: Detail may not add to totals because some detailed categories are not shown. A business with several lines of business is classified under the primary business line only.
See North American Industry Classification System for a more detailed explanation of business category.
"d" denotes that the data were suppressed to avoid potential disclosure of confidential taxpayer information.
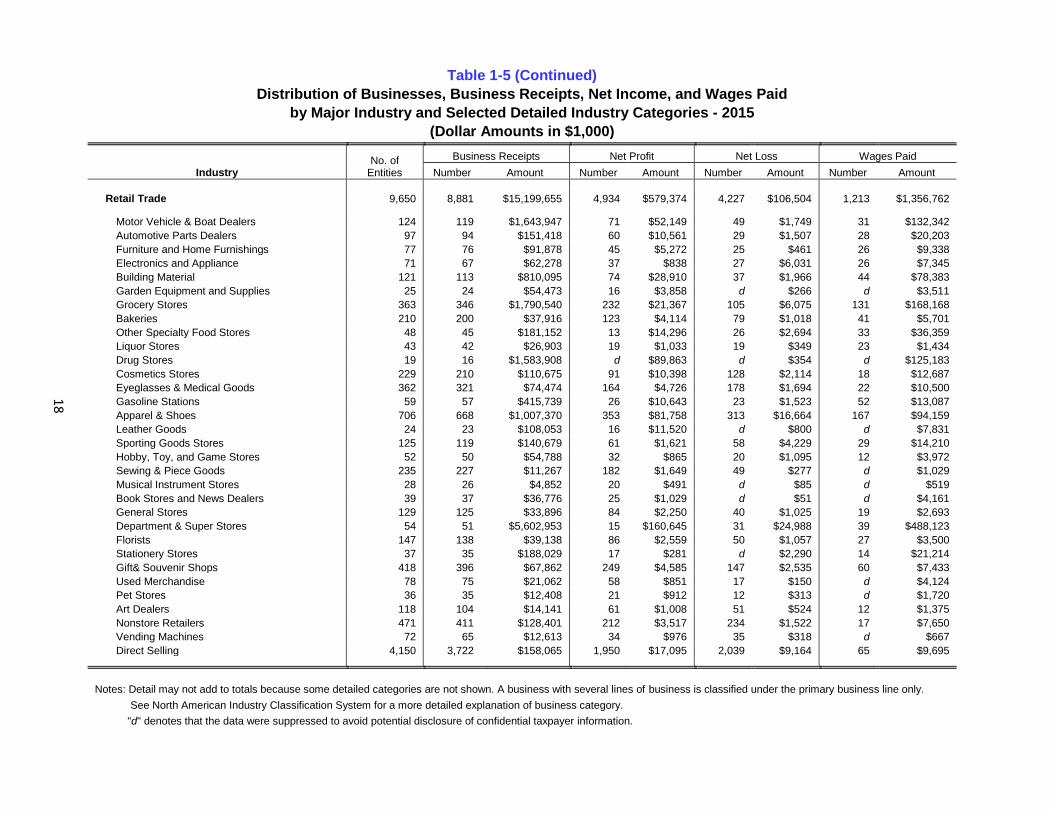
18
Table 1-5 (Continued)
Distribution of Businesses, Business Receipts, Net Income, and Wages Paid
by Major Industry and Selected Detailed Industry Categories - 2015
(Dollar Amounts in $1,000)
Industry No. of
Entities
Business Receipts Net Profit Net Loss Wages Paid
Number Amount Number Amount Number Amount Number Amount
Retail Trade 9,650 8,881 $15,199,655 4,934 $579,374 4,227 $106,504 1,213 $1,356,762
Motor Vehicle & Boat Dealers 124 119 $1,643,947 71 $52,149 49 $1,749 31 $132,342
Automotive Parts Dealers 97 94 $151,418 60 $10,561 29 $1,507 28 $20,203
Furniture and Home Furnishings 77 76 $91,878 45 $5,272 25 $461 26 $9,338
Electronics and Appliance 71 67 $62,278 37 $838 27 $6,031 26 $7,345
Building Material 121 113 $810,095 74 $28,910 37 $1,966 44 $78,383
Garden Equipment and Supplies 25 24 $54,473 16 $3,858 d $266 d $3,511
Grocery Stores 363 346 $1,790,540 232 $21,367 105 $6,075 131 $168,168
Bakeries 210 200 $37,916 123 $4,114 79 $1,018 41 $5,701
Other Specialty Food Stores 48 45 $181,152 13 $14,296 26 $2,694 33 $36,359
Liquor Stores 43 42 $26,903 19 $1,033 19 $349 23 $1,434
Drug Stores 19 16 $1,583,908 d $89,863 d $354 d $125,183
Cosmetics Stores 229 210 $110,675 91 $10,398 128 $2,114 18 $12,687
Eyeglasses & Medical Goods 362 321 $74,474 164 $4,726 178 $1,694 22 $10,500
Gasoline Stations 59 57 $415,739 26 $10,643 23 $1,523 52 $13,087
Apparel & Shoes 706 668 $1,007,370 353 $81,758 313 $16,664 167 $94,159
Leather Goods 24 23 $108,053 16 $11,520 d $800 d $7,831
Sporting Goods Stores 125 119 $140,679 61 $1,621 58 $4,229 29 $14,210
Hobby, Toy, and Game Stores 52 50 $54,788 32 $865 20 $1,095 12 $3,972
Sewing & Piece Goods 235 227 $11,267 182 $1,649 49 $277 d $1,029
Musical Instrument Stores 28 26 $4,852 20 $491 d $85 d $519
Book Stores and News Dealers 39 37 $36,776 25 $1,029 d $51 d $4,161
General Stores 129 125 $33,896 84 $2,250 40 $1,025 19 $2,693
Department & Super Stores 54 51 $5,602,953 15 $160,645 31 $24,988 39 $488,123
Florists 147 138 $39,138 86 $2,559 50 $1,057 27 $3,500
Stationery Stores 37 35 $188,029 17 $281 d $2,290 14 $21,214
Gift& Souvenir Shops 418 396 $67,862 249 $4,585 147 $2,535 60 $7,433
Used Merchandise 78 75 $21,062 58 $851 17 $150 d $4,124
Pet Stores 36 35 $12,408 21 $912 12 $313 d $1,720
Art Dealers 118 104 $14,141 61 $1,008 51 $524 12 $1,375
Nonstore Retailers 471 411 $128,401 212 $3,517 234 $1,522 17 $7,650
Vending Machines 72 65 $12,613 34 $976 35 $318 d $667
Direct Selling 4,150 3,722 $158,065 1,950 $17,095 2,039 $9,164 65 $9,695
Notes: Detail may not add to totals because some detailed categories are not shown. A business with several lines of business is classified under the primary business line only.
See North American Industry Classification System for a more detailed explanation of business category.
"d" denotes that the data were suppressed to avoid potential disclosure of confidential taxpayer information.
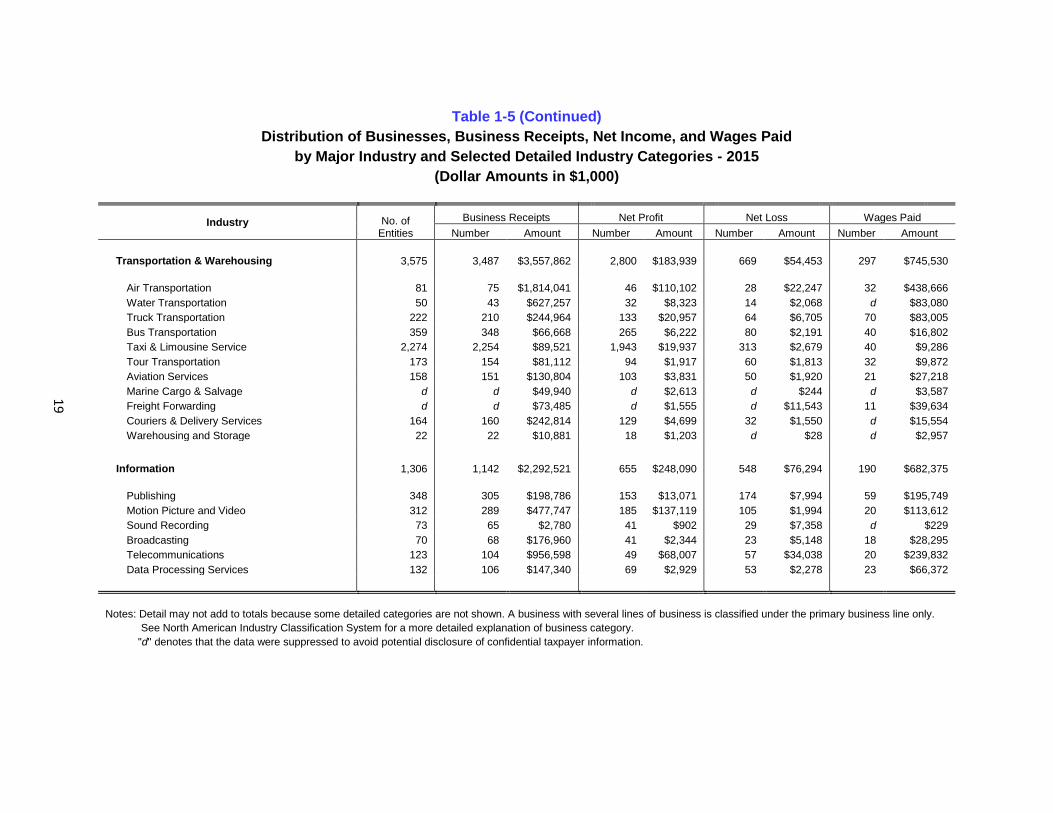
19
Table 1-5 (Continued)
Distribution of Businesses, Business Receipts, Net Income, and Wages Paid
by Major Industry and Selected Detailed Industry Categories - 2015
(Dollar Amounts in $1,000)
Industry No. of Entities
Business Receipts Net Profit Net Loss Wages Paid
Number Amount Number Amount Number Amount Number Amount
Transportation & Warehousing 3,575 3,487 $3,557,862 2,800 $183,939 669 $54,453 297 $745,530
Air Transportation 81 75 $1,814,041 46 $110,102 28 $22,247 32 $438,666
Water Transportation 50 43 $627,257 32 $8,323 14 $2,068 d $83,080
Truck Transportation 222 210 $244,964 133 $20,957 64 $6,705 70 $83,005
Bus Transportation 359 348 $66,668 265 $6,222 80 $2,191 40 $16,802
Taxi & Limousine Service 2,274 2,254 $89,521 1,943 $19,937 313 $2,679 40 $9,286
Tour Transportation 173 154 $81,112 94 $1,917 60 $1,813 32 $9,872
Aviation Services 158 151 $130,804 103 $3,831 50 $1,920 21 $27,218
Marine Cargo & Salvage d d $49,940 d $2,613 d $244 d $3,587
Freight Forwarding d d $73,485 d $1,555 d $11,543 11 $39,634
Couriers & Delivery Services 164 160 $242,814 129 $4,699 32 $1,550 d $15,554
Warehousing and Storage 22 22 $10,881 18 $1,203 d $28 d $2,957
Information 1,306 1,142 $2,292,521 655 $248,090 548 $76,294 190 $682,375
Publishing 348 305 $198,786 153 $13,071 174 $7,994 59 $195,749
Motion Picture and Video 312 289 $477,747 185 $137,119 105 $1,994 20 $113,612
Sound Recording 73 65 $2,780 41 $902 29 $7,358 d $229
Broadcasting 70 68 $176,960 41 $2,344 23 $5,148 18 $28,295
Telecommunications 123 104 $956,598 49 $68,007 57 $34,038 20 $239,832
Data Processing Services 132 106 $147,340 69 $2,929 53 $2,278 23 $66,372
Notes: Detail may not add to totals because some detailed categories are not shown. A business with several lines of business is classified under the primary business line only.
See North American Industry Classification System for a more detailed explanation of business category.
"d" denotes that the data were suppressed to avoid potential disclosure of confidential taxpayer information.
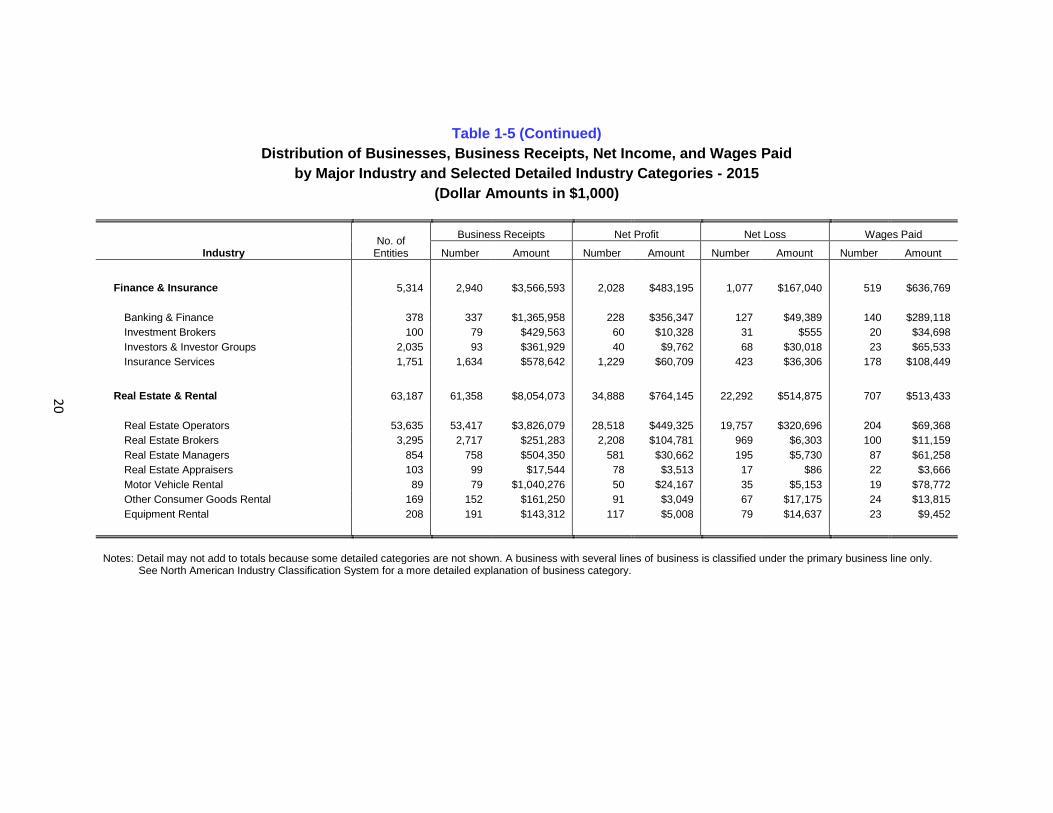
20
Table 1-5 (Continued)
Distribution of Businesses, Business Receipts, Net Income, and Wages Paid
by Major Industry and Selected Detailed Industry Categories - 2015
(Dollar Amounts in $1,000)
Industry No. of
Entities
Business Receipts Net Profit Net Loss Wages Paid
Number Amount Number Amount Number Amount Number Amount
Finance & Insurance 5,314 2,940 $3,566,593 2,028 $483,195 1,077 $167,040 519 $636,769
Banking & Finance 378 337 $1,365,958 228 $356,347 127 $49,389 140 $289,118
Investment Brokers 100 79 $429,563 60 $10,328 31 $555 20 $34,698
Investors & Investor Groups 2,035 93 $361,929 40 $9,762 68 $30,018 23 $65,533
Insurance Services 1,751 1,634 $578,642 1,229 $60,709 423 $36,306 178 $108,449
Real Estate & Rental 63,187 61,358 $8,054,073 34,888 $764,145 22,292 $514,875 707 $513,433
Real Estate Operators 53,635 53,417 $3,826,079 28,518 $449,325 19,757 $320,696 204 $69,368
Real Estate Brokers 3,295 2,717 $251,283 2,208 $104,781 969 $6,303 100 $11,159
Real Estate Managers 854 758 $504,350 581 $30,662 195 $5,730 87 $61,258
Real Estate Appraisers 103 99 $17,544 78 $3,513 17 $86 22 $3,666
Motor Vehicle Rental 89 79 $1,040,276 50 $24,167 35 $5,153 19 $78,772
Other Consumer Goods Rental 169 152 $161,250 91 $3,049 67 $17,175 24 $13,815
Equipment Rental 208 191 $143,312 117 $5,008 79 $14,637 23 $9,452
Notes: Detail may not add to totals because some detailed categories are not shown. A business with several lines of business is classified under the primary business line only. See North American Industry Classification System for a more detailed explanation of business category.
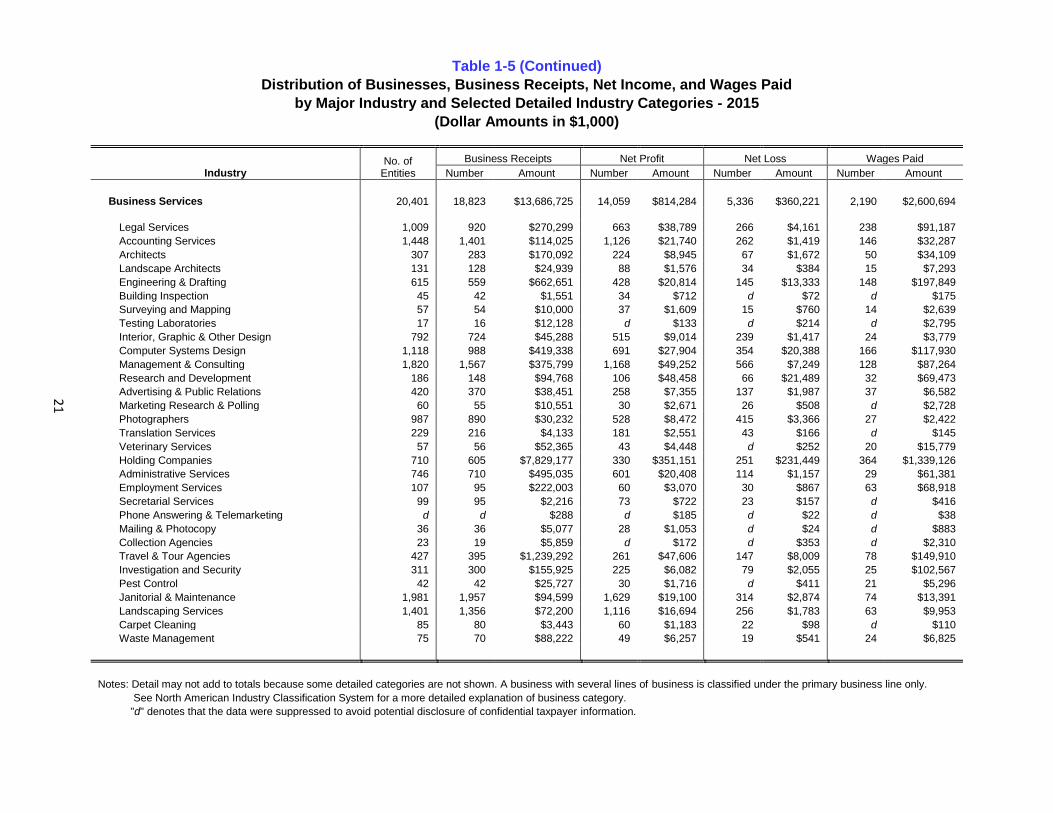
21
Table 1-5 (Continued)
Distribution of Businesses, Business Receipts, Net Income, and Wages Paid
by Major Industry and Selected Detailed Industry Categories - 2015
(Dollar Amounts in $1,000)
Industry No. of
Entities
Business Receipts Net Profit Net Loss Wages Paid
Number Amount Number Amount Number Amount Number Amount
Business Services 20,401 18,823 $13,686,725 14,059 $814,284 5,336 $360,221 2,190 $2,600,694
Legal Services 1,009 920 $270,299 663 $38,789 266 $4,161 238 $91,187
Accounting Services 1,448 1,401 $114,025 1,126 $21,740 262 $1,419 146 $32,287
Architects 307 283 $170,092 224 $8,945 67 $1,672 50 $34,109
Landscape Architects 131 128 $24,939 88 $1,576 34 $384 15 $7,293
Engineering & Drafting 615 559 $662,651 428 $20,814 145 $13,333 148 $197,849
Building Inspection 45 42 $1,551 34 $712 d $72 d $175
Surveying and Mapping 57 54 $10,000 37 $1,609 15 $760 14 $2,639
Testing Laboratories 17 16 $12,128 d $133 d $214 d $2,795
Interior, Graphic & Other Design 792 724 $45,288 515 $9,014 239 $1,417 24 $3,779
Computer Systems Design 1,118 988 $419,338 691 $27,904 354 $20,388 166 $117,930
Management & Consulting 1,820 1,567 $375,799 1,168 $49,252 566 $7,249 128 $87,264
Research and Development 186 148 $94,768 106 $48,458 66 $21,489 32 $69,473
Advertising & Public Relations 420 370 $38,451 258 $7,355 137 $1,987 37 $6,582
Marketing Research & Polling 60 55 $10,551 30 $2,671 26 $508 d $2,728
Photographers 987 890 $30,232 528 $8,472 415 $3,366 27 $2,422
Translation Services 229 216 $4,133 181 $2,551 43 $166 d $145
Veterinary Services 57 56 $52,365 43 $4,448 d $252 20 $15,779
Holding Companies 710 605 $7,829,177 330 $351,151 251 $231,449 364 $1,339,126
Administrative Services 746 710 $495,035 601 $20,408 114 $1,157 29 $61,381
Employment Services 107 95 $222,003 60 $3,070 30 $867 63 $68,918
Secretarial Services 99 95 $2,216 73 $722 23 $157 d $416
Phone Answering & Telemarketing d d $288 d $185 d $22 d $38
Mailing & Photocopy 36 36 $5,077 28 $1,053 d $24 d $883
Collection Agencies 23 19 $5,859 d $172 d $353 d $2,310
Travel & Tour Agencies 427 395 $1,239,292 261 $47,606 147 $8,009 78 $149,910
Investigation and Security 311 300 $155,925 225 $6,082 79 $2,055 25 $102,567
Pest Control 42 42 $25,727 30 $1,716 d $411 21 $5,296
Janitorial & Maintenance 1,981 1,957 $94,599 1,629 $19,100 314 $2,874 74 $13,391
Landscaping Services 1,401 1,356 $72,200 1,116 $16,694 256 $1,783 63 $9,953
Carpet Cleaning 85 80 $3,443 60 $1,183 22 $98 d $110
Waste Management 75 70 $88,222 49 $6,257 19 $541 24 $6,825
Notes: Detail may not add to totals because some detailed categories are not shown. A business with several lines of business is classified under the primary business line only.
See North American Industry Classification System for a more detailed explanation of business category.
"d" denotes that the data were suppressed to avoid potential disclosure of confidential taxpayer information.
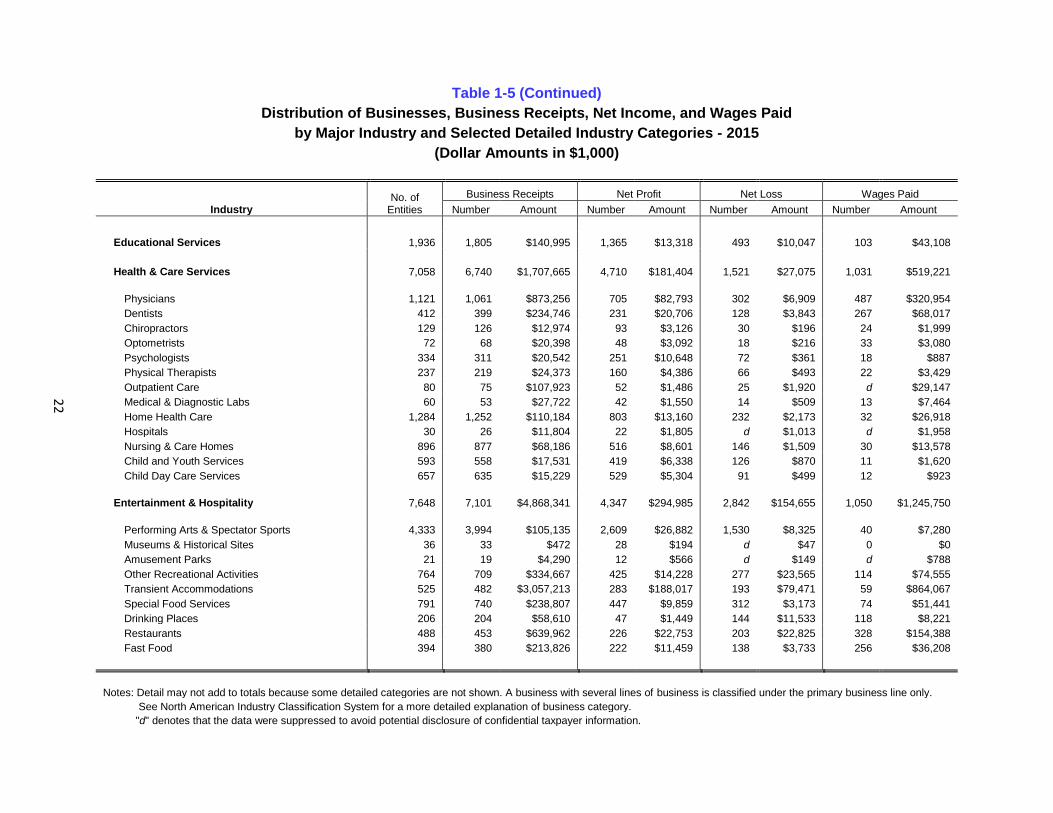
22
Table 1-5 (Continued)
Distribution of Businesses, Business Receipts, Net Income, and Wages Paid
by Major Industry and Selected Detailed Industry Categories - 2015
(Dollar Amounts in $1,000)
Industry No. of
Entities
Business Receipts Net Profit Net Loss Wages Paid
Number Amount Number Amount Number Amount Number Amount
Educational Services 1,936 1,805 $140,995 1,365 $13,318 493 $10,047 103 $43,108
Health & Care Services 7,058 6,740 $1,707,665 4,710 $181,404 1,521 $27,075 1,031 $519,221
Physicians 1,121 1,061 $873,256 705 $82,793 302 $6,909 487 $320,954
Dentists 412 399 $234,746 231 $20,706 128 $3,843 267 $68,017
Chiropractors 129 126 $12,974 93 $3,126 30 $196 24 $1,999
Optometrists 72 68 $20,398 48 $3,092 18 $216 33 $3,080
Psychologists 334 311 $20,542 251 $10,648 72 $361 18 $887
Physical Therapists 237 219 $24,373 160 $4,386 66 $493 22 $3,429
Outpatient Care 80 75 $107,923 52 $1,486 25 $1,920 d $29,147
Medical & Diagnostic Labs 60 53 $27,722 42 $1,550 14 $509 13 $7,464
Home Health Care 1,284 1,252 $110,184 803 $13,160 232 $2,173 32 $26,918
Hospitals 30 26 $11,804 22 $1,805 d $1,013 d $1,958
Nursing & Care Homes 896 877 $68,186 516 $8,601 146 $1,509 30 $13,578
Child and Youth Services 593 558 $17,531 419 $6,338 126 $870 11 $1,620
Child Day Care Services 657 635 $15,229 529 $5,304 91 $499 12 $923
Entertainment & Hospitality 7,648 7,101 $4,868,341 4,347 $294,985 2,842 $154,655 1,050 $1,245,750
Performing Arts & Spectator Sports 4,333 3,994 $105,135 2,609 $26,882 1,530 $8,325 40 $7,280
Museums & Historical Sites 36 33 $472 28 $194 d $47 0 $0
Amusement Parks 21 19 $4,290 12 $566 d $149 d $788
Other Recreational Activities 764 709 $334,667 425 $14,228 277 $23,565 114 $74,555
Transient Accommodations 525 482 $3,057,213 283 $188,017 193 $79,471 59 $864,067
Special Food Services 791 740 $238,807 447 $9,859 312 $3,173 74 $51,441
Drinking Places 206 204 $58,610 47 $1,449 144 $11,533 118 $8,221
Restaurants 488 453 $639,962 226 $22,753 203 $22,825 328 $154,388
Fast Food 394 380 $213,826 222 $11,459 138 $3,733 256 $36,208
Notes: Detail may not add to totals because some detailed categories are not shown. A business with several lines of business is classified under the primary business line only.
See North American Industry Classification System for a more detailed explanation of business category.
"d" denotes that the data were suppressed to avoid potential disclosure of confidential taxpayer information.
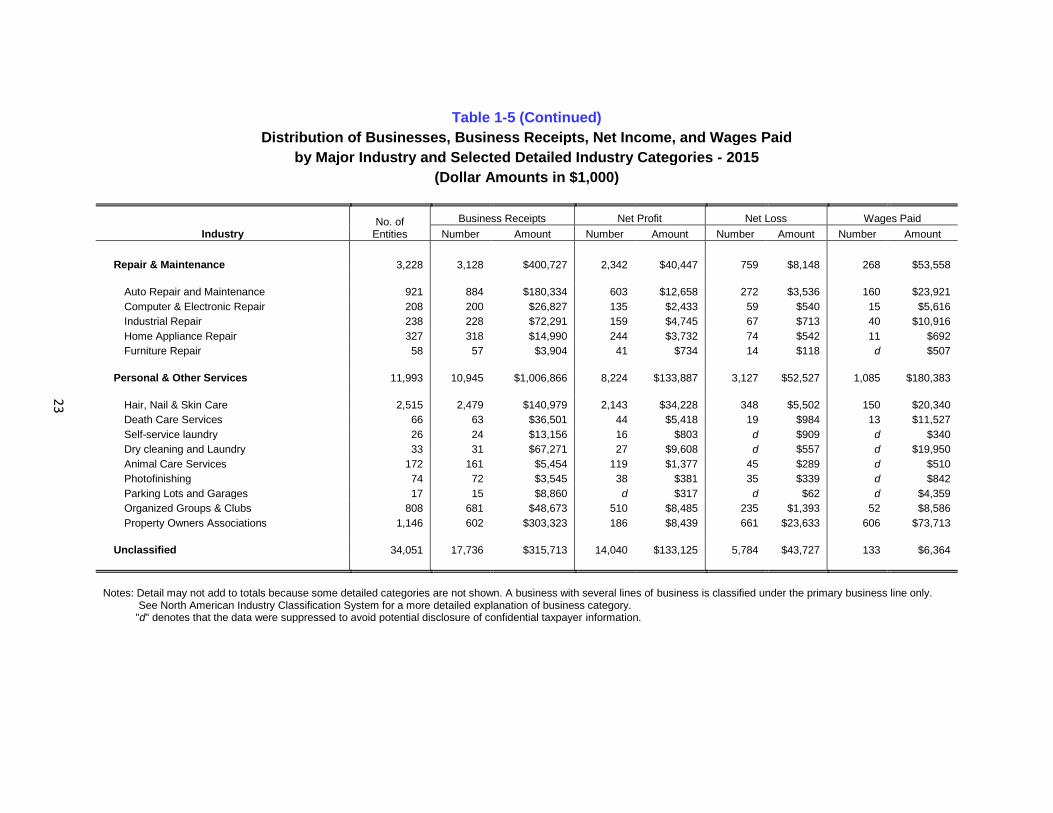
23
Table 1-5 (Continued)
Distribution of Businesses, Business Receipts, Net Income, and Wages Paid
by Major Industry and Selected Detailed Industry Categories - 2015
(Dollar Amounts in $1,000)
Industry No. of
Entities
Business Receipts Net Profit Net Loss Wages Paid
Number Amount Number Amount Number Amount Number Amount
Repair & Maintenance 3,228 3,128 $400,727 2,342 $40,447 759 $8,148 268 $53,558
Auto Repair and Maintenance 921 884 $180,334 603 $12,658 272 $3,536 160 $23,921
Computer & Electronic Repair 208 200 $26,827 135 $2,433 59 $540 15 $5,616
Industrial Repair 238 228 $72,291 159 $4,745 67 $713 40 $10,916
Home Appliance Repair 327 318 $14,990 244 $3,732 74 $542 11 $692
Furniture Repair 58 57 $3,904 41 $734 14 $118 d $507
Personal & Other Services 11,993 10,945 $1,006,866 8,224 $133,887 3,127 $52,527 1,085 $180,383
Hair, Nail & Skin Care 2,515 2,479 $140,979 2,143 $34,228 348 $5,502 150 $20,340
Death Care Services 66 63 $36,501 44 $5,418 19 $984 13 $11,527
Self-service laundry 26 24 $13,156 16 $803 d $909 d $340
Dry cleaning and Laundry 33 31 $67,271 27 $9,608 d $557 d $19,950
Animal Care Services 172 161 $5,454 119 $1,377 45 $289 d $510
Photofinishing 74 72 $3,545 38 $381 35 $339 d $842
Parking Lots and Garages 17 15 $8,860 d $317 d $62 d $4,359
Organized Groups & Clubs 808 681 $48,673 510 $8,485 235 $1,393 52 $8,586
Property Owners Associations 1,146 602 $303,323 186 $8,439 661 $23,633 606 $73,713
Unclassified 34,051 17,736 $315,713 14,040 $133,125 5,784 $43,727 133 $6,364
Notes: Detail may not add to totals because some detailed categories are not shown. A business with several lines of business is classified under the primary business line only. See North American Industry Classification System for a more detailed explanation of business category.
"d" denotes that the data were suppressed to avoid potential disclosure of confidential taxpayer information.
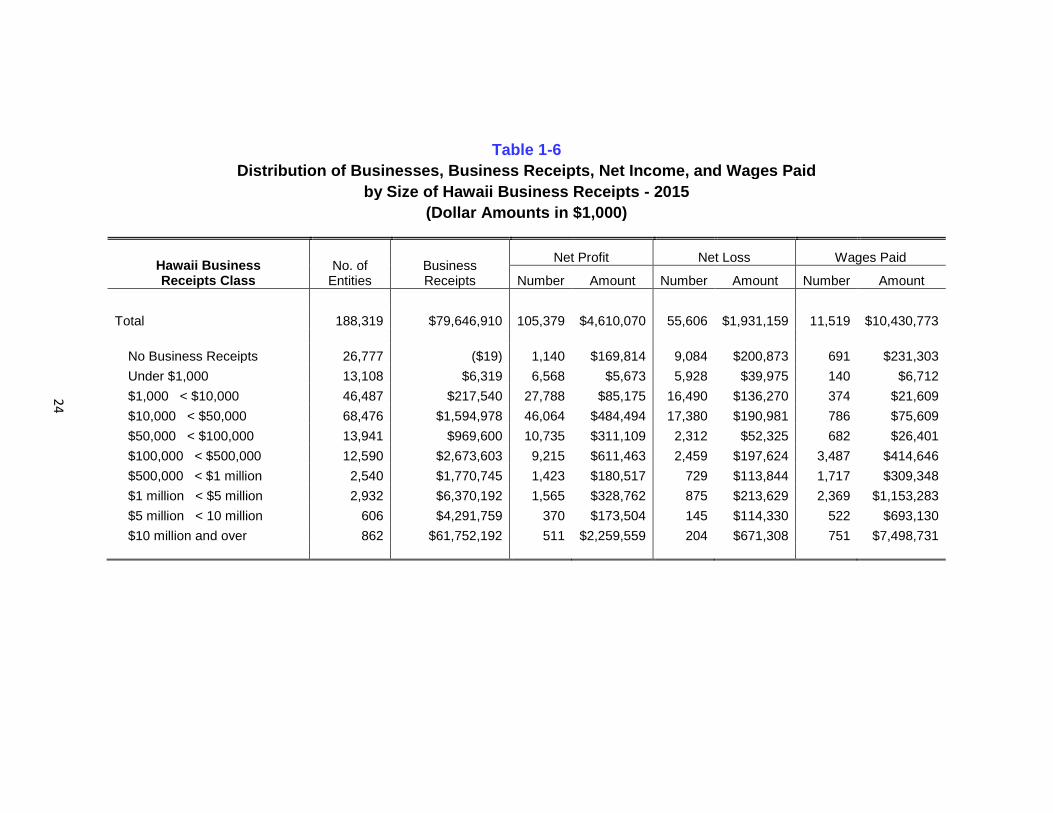
24
Table 1-6
Distribution of Businesses, Business Receipts, Net Income, and Wages Paid
by Size of Hawaii Business Receipts - 2015
(Dollar Amounts in $1,000)
Hawaii Business Receipts Class
No. of Entities
Business Receipts
Net Profit Net Loss Wages Paid
Number Amount Number Amount Number Amount
Total 188,319 $79,646,910 105,379 $4,610,070 55,606 $1,931,159 11,519 $10,430,773
No Business Receipts 26,777 ($19) 1,140 $169,814 9,084 $200,873 691 $231,303
Under $1,000 13,108 $6,319 6,568 $5,673 5,928 $39,975 140 $6,712
$1,000 < $10,000 46,487 $217,540 27,788 $85,175 16,490 $136,270 374 $21,609
$10,000 < $50,000 68,476 $1,594,978 46,064 $484,494 17,380 $190,981 786 $75,609
$50,000 < $100,000 13,941 $969,600 10,735 $311,109 2,312 $52,325 682 $26,401
$100,000 < $500,000 12,590 $2,673,603 9,215 $611,463 2,459 $197,624 3,487 $414,646
$500,000 < $1 million 2,540 $1,770,745 1,423 $180,517 729 $113,844 1,717 $309,348
$1 million < $5 million 2,932 $6,370,192 1,565 $328,762 875 $213,629 2,369 $1,153,283
$5 million < 10 million 606 $4,291,759 370 $173,504 145 $114,330 522 $693,130
$10 million and over 862 $61,752,192 511 $2,259,559 204 $671,308 751 $7,498,731
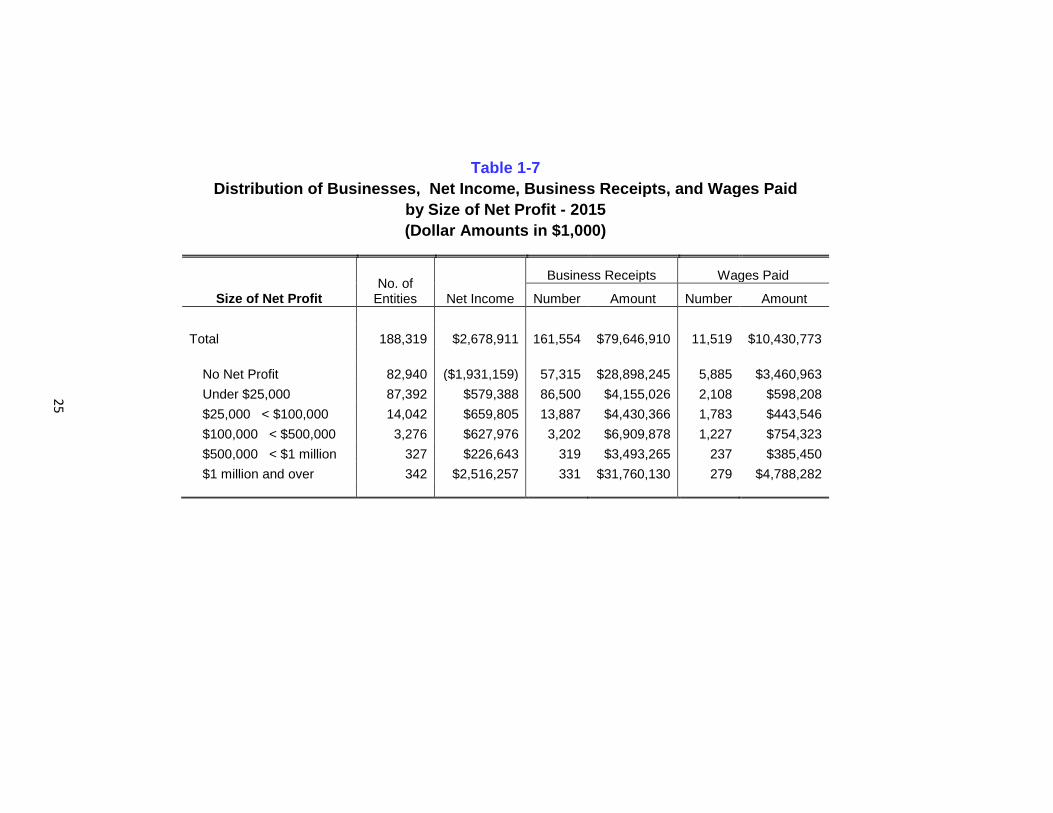
25
Table 1-7
Distribution of Businesses, Net Income, Business Receipts, and Wages Paid
by Size of Net Profit - 2015
(Dollar Amounts in $1,000)
Size of Net Profit No. of
Entities Net Income
Business Receipts Wages Paid
Number Amount Number Amount
Total 188,319 $2,678,911 161,554 $79,646,910 11,519 $10,430,773
No Net Profit 82,940 ($1,931,159) 57,315 $28,898,245 5,885 $3,460,963
Under $25,000 87,392 $579,388 86,500 $4,155,026 2,108 $598,208
$25,000 < $100,000 14,042 $659,805 13,887 $4,430,366 1,783 $443,546
$100,000 < $500,000 3,276 $627,976 3,202 $6,909,878 1,227 $754,323
$500,000 < $1 million 327 $226,643 319 $3,493,265 237 $385,450
$1 million and over 342 $2,516,257 331 $31,760,130 279 $4,788,282
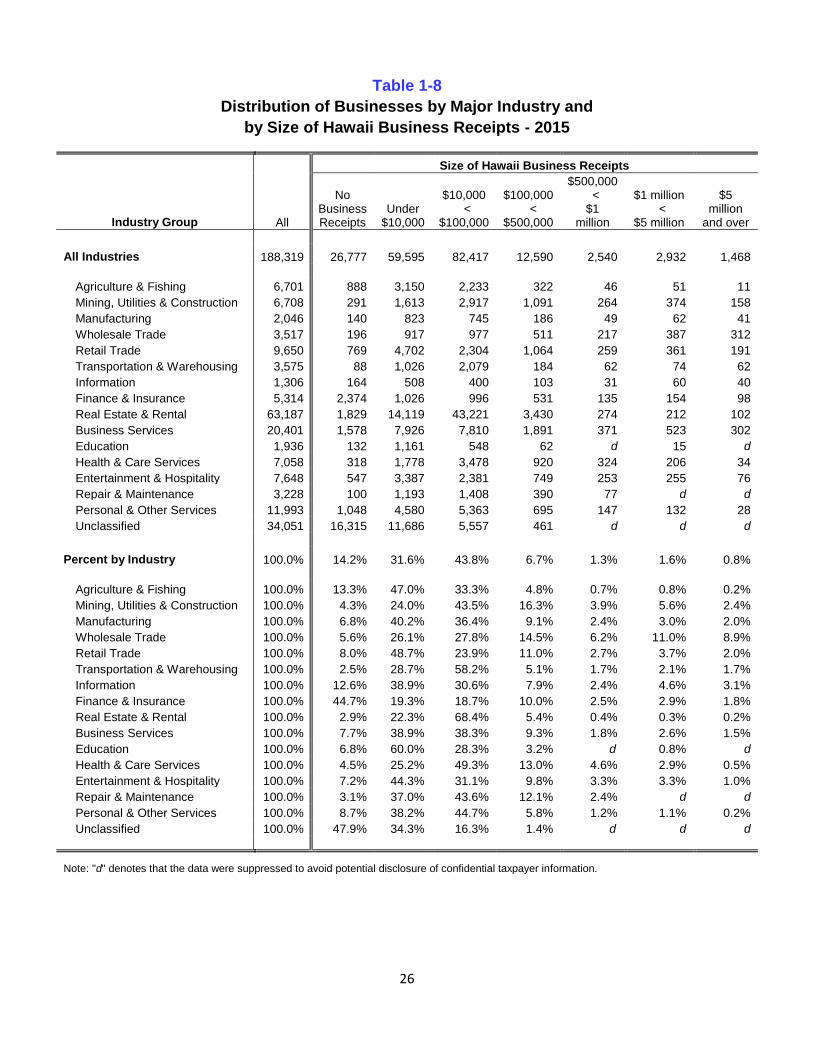
26
Table 1-8
Distribution of Businesses by Major Industry and
by Size of Hawaii Business Receipts - 2015
Industry Group All
Size of Hawaii Business Receipts
No Business Receipts
Under $10,000
$10,000 <
$100,000
$100,000 <
$500,000
$500,000 < $1
million
$1 million
< $5 million
$5 million
and over
All Industries 188,319 26,777 59,595 82,417 12,590 2,540 2,932 1,468
Agriculture & Fishing 6,701 888 3,150 2,233 322 46 51 11
Mining, Utilities & Construction 6,708 291 1,613 2,917 1,091 264 374 158
Manufacturing 2,046 140 823 745 186 49 62 41
Wholesale Trade 3,517 196 917 977 511 217 387 312
Retail Trade 9,650 769 4,702 2,304 1,064 259 361 191
Transportation & Warehousing 3,575 88 1,026 2,079 184 62 74 62
Information 1,306 164 508 400 103 31 60 40
Finance & Insurance 5,314 2,374 1,026 996 531 135 154 98
Real Estate & Rental 63,187 1,829 14,119 43,221 3,430 274 212 102
Business Services 20,401 1,578 7,926 7,810 1,891 371 523 302
Education 1,936 132 1,161 548 62 d 15 d
Health & Care Services 7,058 318 1,778 3,478 920 324 206 34
Entertainment & Hospitality 7,648 547 3,387 2,381 749 253 255 76
Repair & Maintenance 3,228 100 1,193 1,408 390 77 d d
Personal & Other Services 11,993 1,048 4,580 5,363 695 147 132 28
Unclassified 34,051 16,315 11,686 5,557 461 d d d
Percent by Industry 100.0% 14.2% 31.6% 43.8% 6.7% 1.3% 1.6% 0.8%
Agriculture & Fishing 100.0% 13.3% 47.0% 33.3% 4.8% 0.7% 0.8% 0.2%
Mining, Utilities & Construction 100.0% 4.3% 24.0% 43.5% 16.3% 3.9% 5.6% 2.4%
Manufacturing 100.0% 6.8% 40.2% 36.4% 9.1% 2.4% 3.0% 2.0%
Wholesale Trade 100.0% 5.6% 26.1% 27.8% 14.5% 6.2% 11.0% 8.9%
Retail Trade 100.0% 8.0% 48.7% 23.9% 11.0% 2.7% 3.7% 2.0%
Transportation & Warehousing 100.0% 2.5% 28.7% 58.2% 5.1% 1.7% 2.1% 1.7%
Information 100.0% 12.6% 38.9% 30.6% 7.9% 2.4% 4.6% 3.1%
Finance & Insurance 100.0% 44.7% 19.3% 18.7% 10.0% 2.5% 2.9% 1.8%
Real Estate & Rental 100.0% 2.9% 22.3% 68.4% 5.4% 0.4% 0.3% 0.2%
Business Services 100.0% 7.7% 38.9% 38.3% 9.3% 1.8% 2.6% 1.5%
Education 100.0% 6.8% 60.0% 28.3% 3.2% d 0.8% d
Health & Care Services 100.0% 4.5% 25.2% 49.3% 13.0% 4.6% 2.9% 0.5%
Entertainment & Hospitality 100.0% 7.2% 44.3% 31.1% 9.8% 3.3% 3.3% 1.0%
Repair & Maintenance 100.0% 3.1% 37.0% 43.6% 12.1% 2.4% d d
Personal & Other Services 100.0% 8.7% 38.2% 44.7% 5.8% 1.2% 1.1% 0.2%
Unclassified 100.0% 47.9% 34.3% 16.3% 1.4% d d d
Note: "d" denotes that the data were suppressed to avoid potential disclosure of confidential taxpayer information.
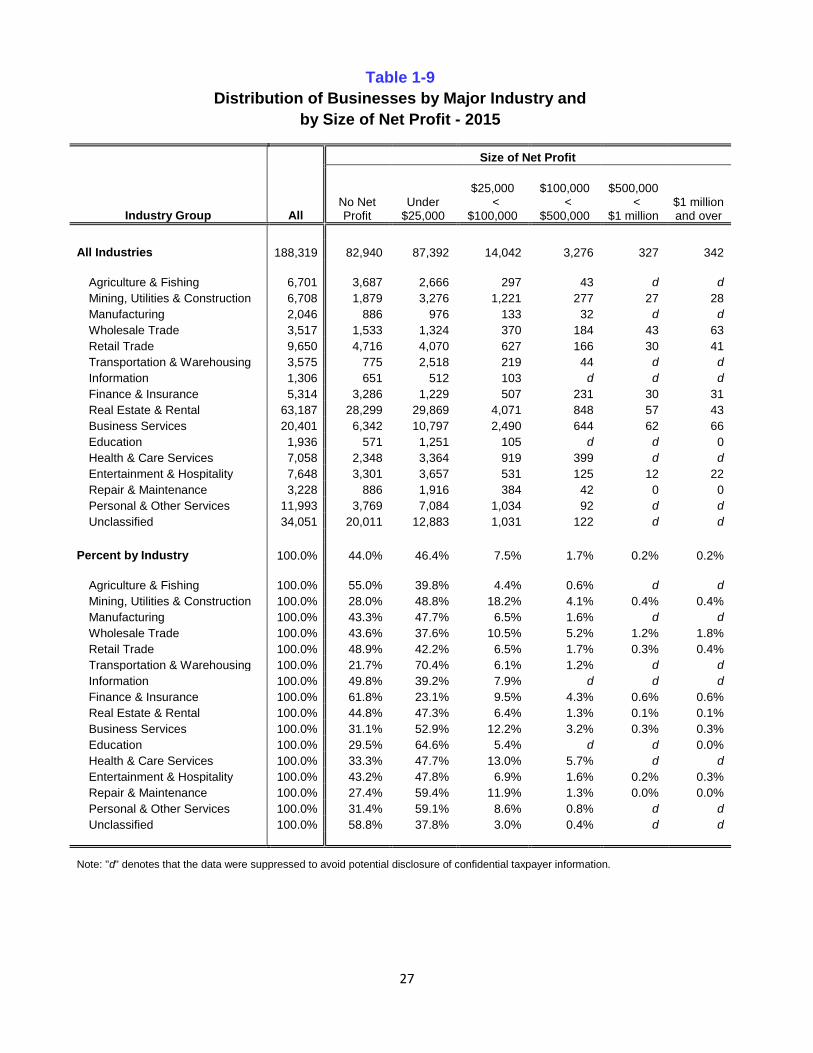
27
Table 1-9
Distribution of Businesses by Major Industry and
by Size of Net Profit - 2015
Industry Group All
Size of Net Profit
No Net Profit
Under $25,000
$25,000 <
$100,000
$100,000 <
$500,000
$500,000 <
$1 million $1 million and over
All Industries 188,319 82,940 87,392 14,042 3,276 327 342
Agriculture & Fishing 6,701 3,687 2,666 297 43 d d
Mining, Utilities & Construction 6,708 1,879 3,276 1,221 277 27 28
Manufacturing 2,046 886 976 133 32 d d
Wholesale Trade 3,517 1,533 1,324 370 184 43 63
Retail Trade 9,650 4,716 4,070 627 166 30 41
Transportation & Warehousing 3,575 775 2,518 219 44 d d
Information 1,306 651 512 103 d d d
Finance & Insurance 5,314 3,286 1,229 507 231 30 31
Real Estate & Rental 63,187 28,299 29,869 4,071 848 57 43
Business Services 20,401 6,342 10,797 2,490 644 62 66
Education 1,936 571 1,251 105 d d 0
Health & Care Services 7,058 2,348 3,364 919 399 d d
Entertainment & Hospitality 7,648 3,301 3,657 531 125 12 22
Repair & Maintenance 3,228 886 1,916 384 42 0 0
Personal & Other Services 11,993 3,769 7,084 1,034 92 d d
Unclassified 34,051 20,011 12,883 1,031 122 d d
Percent by Industry 100.0% 44.0% 46.4% 7.5% 1.7% 0.2% 0.2%
Agriculture & Fishing 100.0% 55.0% 39.8% 4.4% 0.6% d d
Mining, Utilities & Construction 100.0% 28.0% 48.8% 18.2% 4.1% 0.4% 0.4%
Manufacturing 100.0% 43.3% 47.7% 6.5% 1.6% d d
Wholesale Trade 100.0% 43.6% 37.6% 10.5% 5.2% 1.2% 1.8%
Retail Trade 100.0% 48.9% 42.2% 6.5% 1.7% 0.3% 0.4%
Transportation & Warehousing 100.0% 21.7% 70.4% 6.1% 1.2% d d
Information 100.0% 49.8% 39.2% 7.9% d d d
Finance & Insurance 100.0% 61.8% 23.1% 9.5% 4.3% 0.6% 0.6%
Real Estate & Rental 100.0% 44.8% 47.3% 6.4% 1.3% 0.1% 0.1%
Business Services 100.0% 31.1% 52.9% 12.2% 3.2% 0.3% 0.3%
Education 100.0% 29.5% 64.6% 5.4% d d 0.0%
Health & Care Services 100.0% 33.3% 47.7% 13.0% 5.7% d d
Entertainment & Hospitality 100.0% 43.2% 47.8% 6.9% 1.6% 0.2% 0.3%
Repair & Maintenance 100.0% 27.4% 59.4% 11.9% 1.3% 0.0% 0.0%
Personal & Other Services 100.0% 31.4% 59.1% 8.6% 0.8% d d
Unclassified 100.0% 58.8% 37.8% 3.0% 0.4% d d
Note: "d" denotes that the data were suppressed to avoid potential disclosure of confidential taxpayer information.
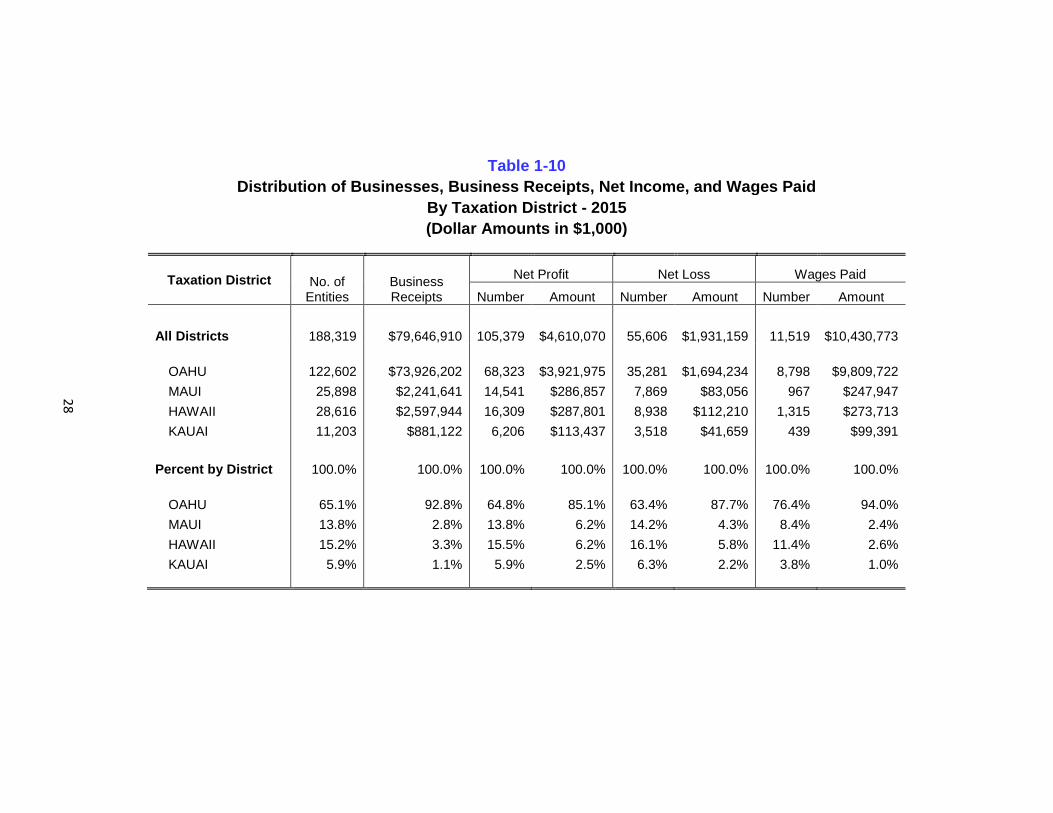
28
Table 1-10
Distribution of Businesses, Business Receipts, Net Income, and Wages Paid
By Taxation District - 2015
(Dollar Amounts in $1,000)
Taxation District No. of Entities
Business Receipts
Net Profit Net Loss Wages Paid
Number Amount Number Amount Number Amount
All Districts 188,319 $79,646,910 105,379 $4,610,070 55,606 $1,931,159 11,519 $10,430,773
OAHU 122,602 $73,926,202 68,323 $3,921,975 35,281 $1,694,234 8,798 $9,809,722
MAUI 25,898 $2,241,641 14,541 $286,857 7,869 $83,056 967 $247,947
HAWAII 28,616 $2,597,944 16,309 $287,801 8,938 $112,210 1,315 $273,713
KAUAI 11,203 $881,122 6,206 $113,437 3,518 $41,659 439 $99,391
Percent by District 100.0% 100.0% 100.0% 100.0% 100.0% 100.0% 100.0% 100.0%
OAHU 65.1% 92.8% 64.8% 85.1% 63.4% 87.7% 76.4% 94.0%
MAUI 13.8% 2.8% 13.8% 6.2% 14.2% 4.3% 8.4% 2.4%
HAWAII 15.2% 3.3% 15.5% 6.2% 16.1% 5.8% 11.4% 2.6%
KAUAI 5.9% 1.1% 5.9% 2.5% 6.3% 2.2% 3.8% 1.0%
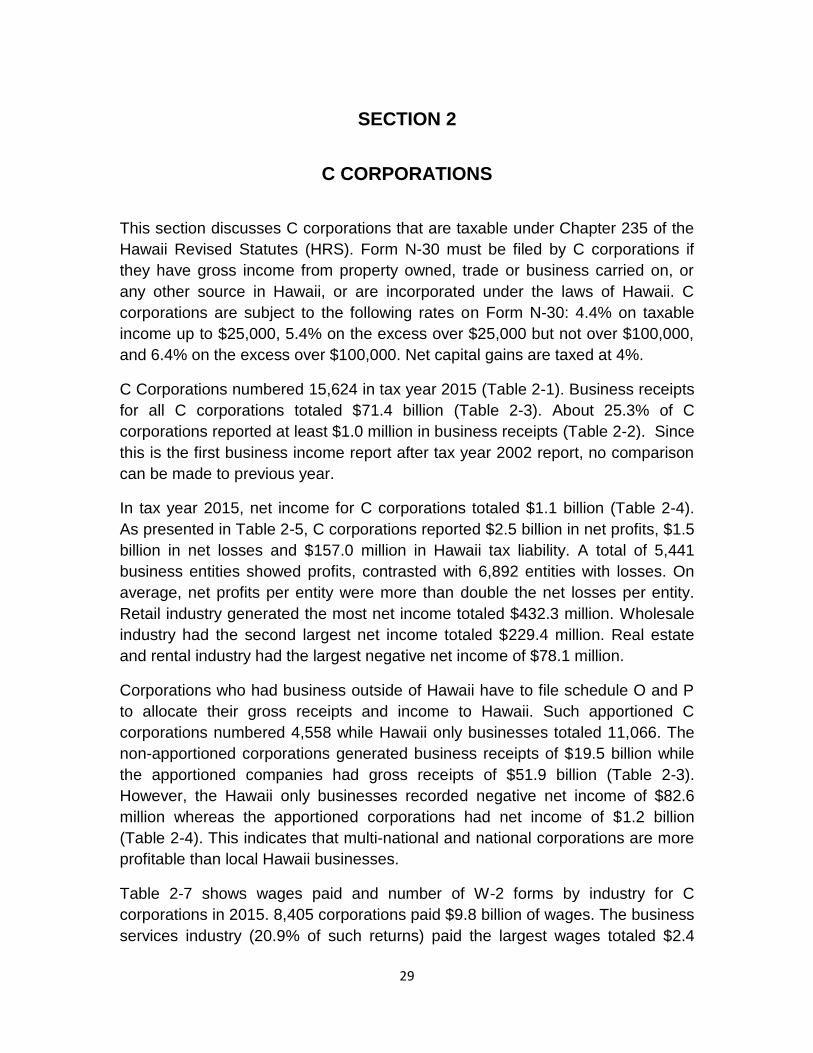
29
SECTION 2
C CORPORATIONS
This section discusses C corporations that are taxable under Chapter 235 of the
Hawaii Revised Statutes (HRS). Form N-30 must be filed by C corporations if
they have gross income from property owned, trade or business carried on, or
any other source in Hawaii, or are incorporated under the laws of Hawaii. C
corporations are subject to the following rates on Form N-30: 4.4% on taxable
income up to $25,000, 5.4% on the excess over $25,000 but not over $100,000,
and 6.4% on the excess over $100,000. Net capital gains are taxed at 4%.
C Corporations numbered 15,624 in tax year 2015 (Table 2-1). Business receipts
for all C corporations totaled $71.4 billion (Table 2-3). About 25.3% of C
corporations reported at least $1.0 million in business receipts (Table 2-2). Since
this is the first business income report after tax year 2002 report, no comparison
can be made to previous year.
In tax year 2015, net income for C corporations totaled $1.1 billion (Table 2-4).
As presented in Table 2-5, C corporations reported $2.5 billion in net profits, $1.5
billion in net losses and $157.0 million in Hawaii tax liability. A total of 5,441
business entities showed profits, contrasted with 6,892 entities with losses. On
average, net profits per entity were more than double the net losses per entity.
Retail industry generated the most net income totaled $432.3 million. Wholesale
industry had the second largest net income totaled $229.4 million. Real estate
and rental industry had the largest negative net income of $78.1 million.
Corporations who had business outside of Hawaii have to file schedule O and P
to allocate their gross receipts and income to Hawaii. Such apportioned C
corporations numbered 4,558 while Hawaii only businesses totaled 11,066. The
non-apportioned corporations generated business receipts of $19.5 billion while
the apportioned companies had gross receipts of $51.9 billion (Table 2-3).
However, the Hawaii only businesses recorded negative net income of $82.6
million whereas the apportioned corporations had net income of $1.2 billion
(Table 2-4). This indicates that multi-national and national corporations are more
profitable than local Hawaii businesses.
Table 2-7 shows wages paid and number of W-2 forms by industry for C
corporations in 2015. 8,405 corporations paid $9.8 billion of wages. The business
services industry (20.9% of such returns) paid the largest wages totaled $2.4

30
billion or 24.5% of total wages paid by C corporations in 2015. The retail industry
filed the largest number of W-2 forms at 40,934 followed by entertainment and
hospitality at 26,398. This is in line with Hawaii's major form of business, the
tourism.

31
Section 2
C Corporations
Statistical Tables
Dollar amounts and percentages are rounded and may not add up to totals.
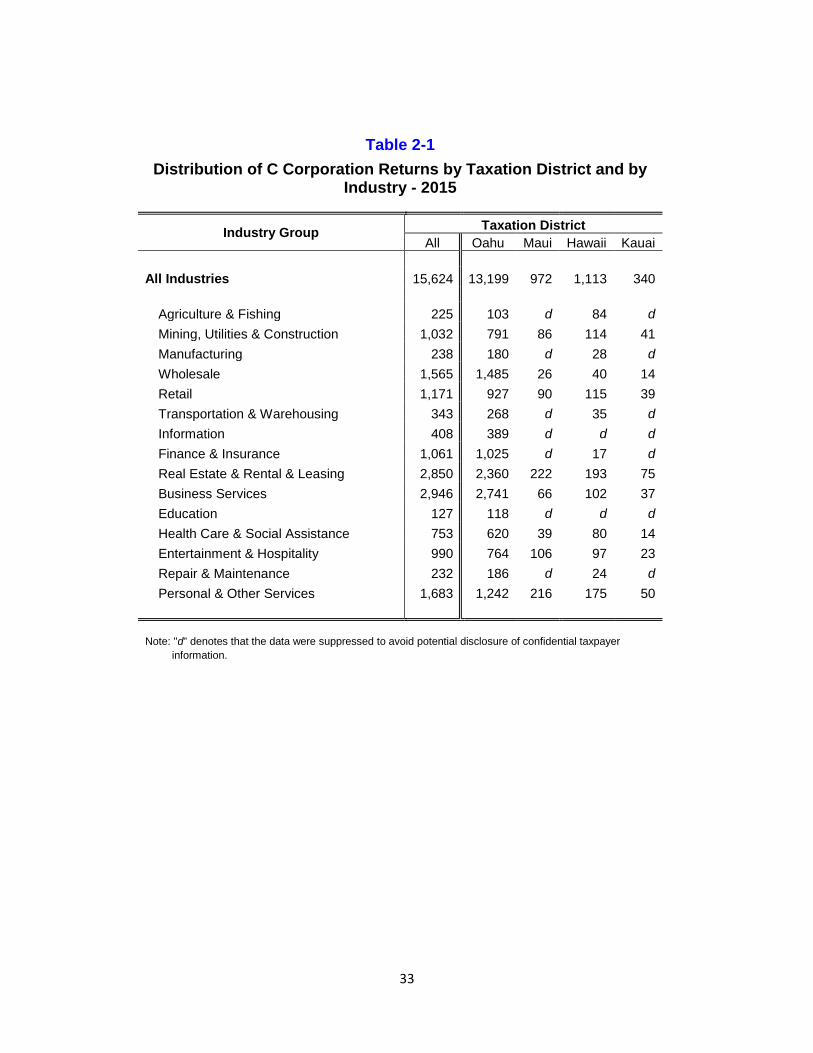
33
Table 2-1
Distribution of C Corporation Returns by Taxation District and by Industry - 2015
Industry Group Taxation District
All Oahu Maui Hawaii Kauai
All Industries 15,624 13,199 972 1,113 340
Agriculture & Fishing 225 103 d 84 d
Mining, Utilities & Construction 1,032 791 86 114 41
Manufacturing 238 180 d 28 d
Wholesale 1,565 1,485 26 40 14
Retail 1,171 927 90 115 39
Transportation & Warehousing 343 268 d 35 d
Information 408 389 d d d
Finance & Insurance 1,061 1,025 d 17 d
Real Estate & Rental & Leasing 2,850 2,360 222 193 75
Business Services 2,946 2,741 66 102 37
Education 127 118 d d d
Health Care & Social Assistance 753 620 39 80 14
Entertainment & Hospitality 990 764 106 97 23
Repair & Maintenance 232 186 d 24 d
Personal & Other Services 1,683 1,242 216 175 50
Note: "d" denotes that the data were suppressed to avoid potential disclosure of confidential taxpayer
information.
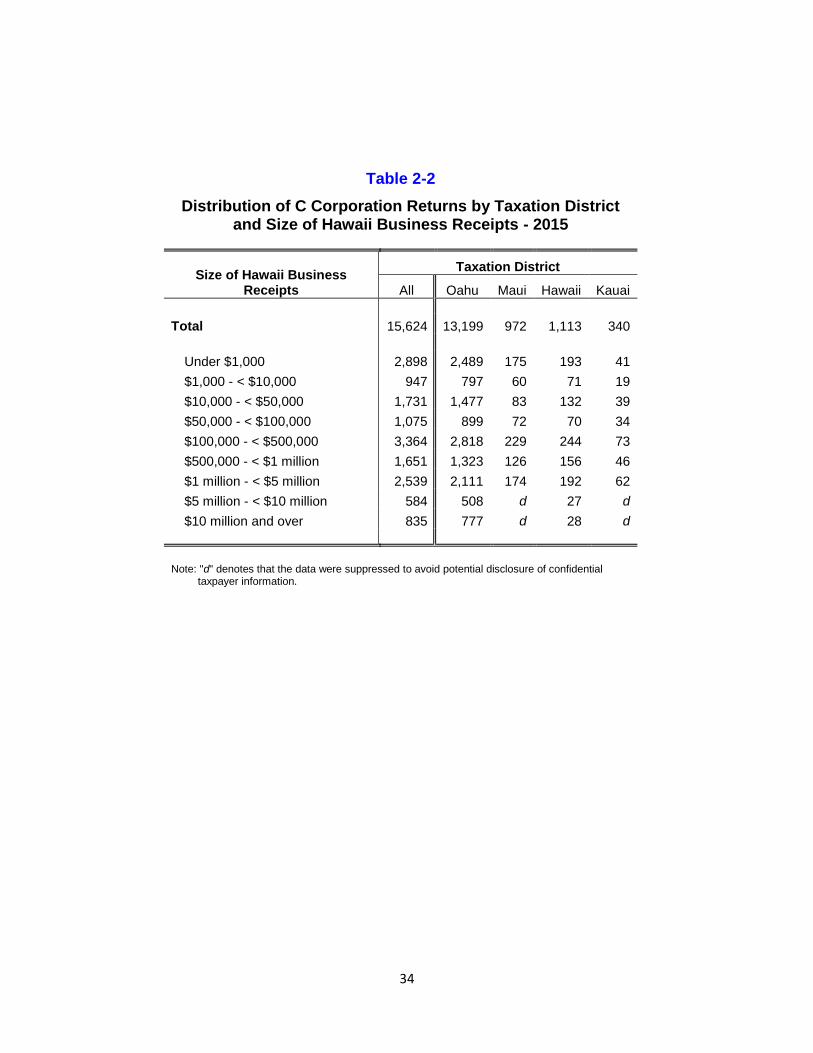
34
Table 2-2
Distribution of C Corporation Returns by Taxation District and Size of Hawaii Business Receipts - 2015
Size of Hawaii Business Receipts
Taxation District
All Oahu Maui Hawaii Kauai
Total 15,624 13,199 972 1,113 340
Under $1,000 2,898 2,489 175 193 41
$1,000 - < $10,000 947 797 60 71 19
$10,000 - < $50,000 1,731 1,477 83 132 39
$50,000 - < $100,000 1,075 899 72 70 34
$100,000 - < $500,000 3,364 2,818 229 244 73
$500,000 - < $1 million 1,651 1,323 126 156 46
$1 million - < $5 million 2,539 2,111 174 192 62
$5 million - < $10 million 584 508 d 27 d
$10 million and over 835 777 d 28 d
Note: "d" denotes that the data were suppressed to avoid potential disclosure of confidential taxpayer information.
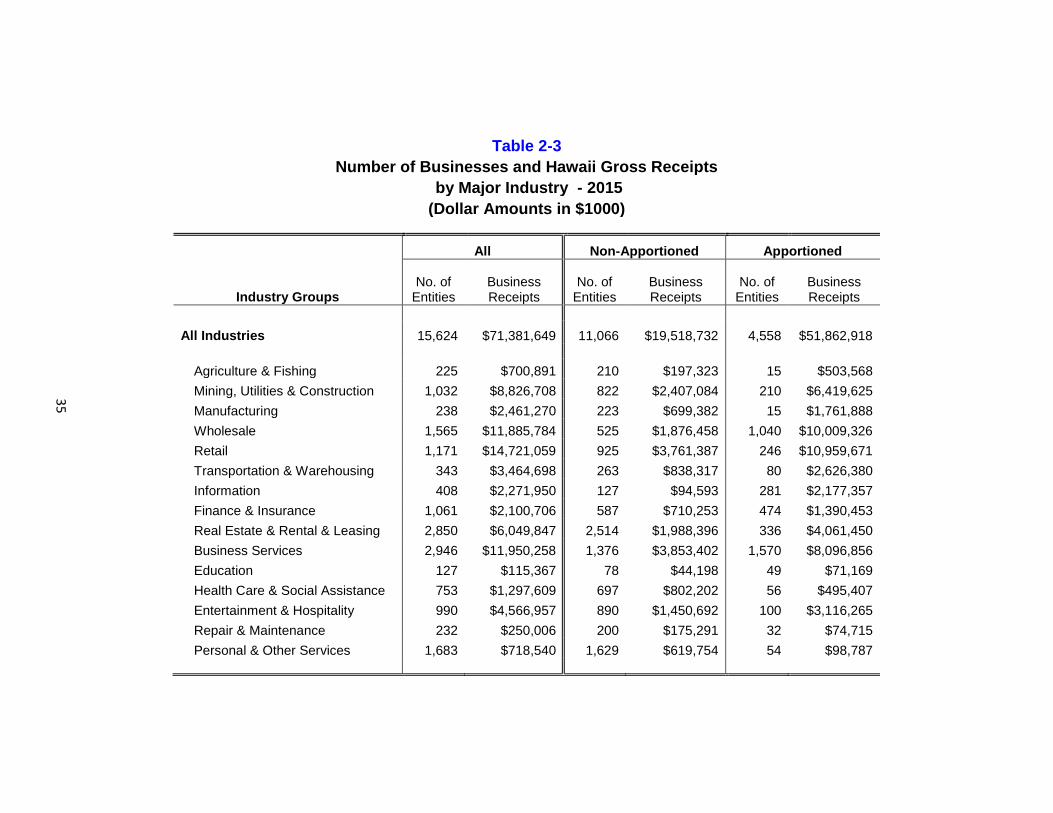
35
Table 2-3
Number of Businesses and Hawaii Gross Receipts
by Major Industry - 2015
(Dollar Amounts in $1000)
Industry Groups
All Non-Apportioned Apportioned
No. of Entities
Business Receipts
No. of Entities
Business Receipts
No. of Entities
Business Receipts
All Industries 15,624 $71,381,649 11,066 $19,518,732 4,558 $51,862,918
Agriculture & Fishing 225 $700,891 210 $197,323 15 $503,568
Mining, Utilities & Construction 1,032 $8,826,708 822 $2,407,084 210 $6,419,625
Manufacturing 238 $2,461,270 223 $699,382 15 $1,761,888
Wholesale 1,565 $11,885,784 525 $1,876,458 1,040 $10,009,326
Retail 1,171 $14,721,059 925 $3,761,387 246 $10,959,671
Transportation & Warehousing 343 $3,464,698 263 $838,317 80 $2,626,380
Information 408 $2,271,950 127 $94,593 281 $2,177,357
Finance & Insurance 1,061 $2,100,706 587 $710,253 474 $1,390,453
Real Estate & Rental & Leasing 2,850 $6,049,847 2,514 $1,988,396 336 $4,061,450
Business Services 2,946 $11,950,258 1,376 $3,853,402 1,570 $8,096,856
Education 127 $115,367 78 $44,198 49 $71,169
Health Care & Social Assistance 753 $1,297,609 697 $802,202 56 $495,407
Entertainment & Hospitality 990 $4,566,957 890 $1,450,692 100 $3,116,265
Repair & Maintenance 232 $250,006 200 $175,291 32 $74,715
Personal & Other Services 1,683 $718,540 1,629 $619,754 54 $98,787
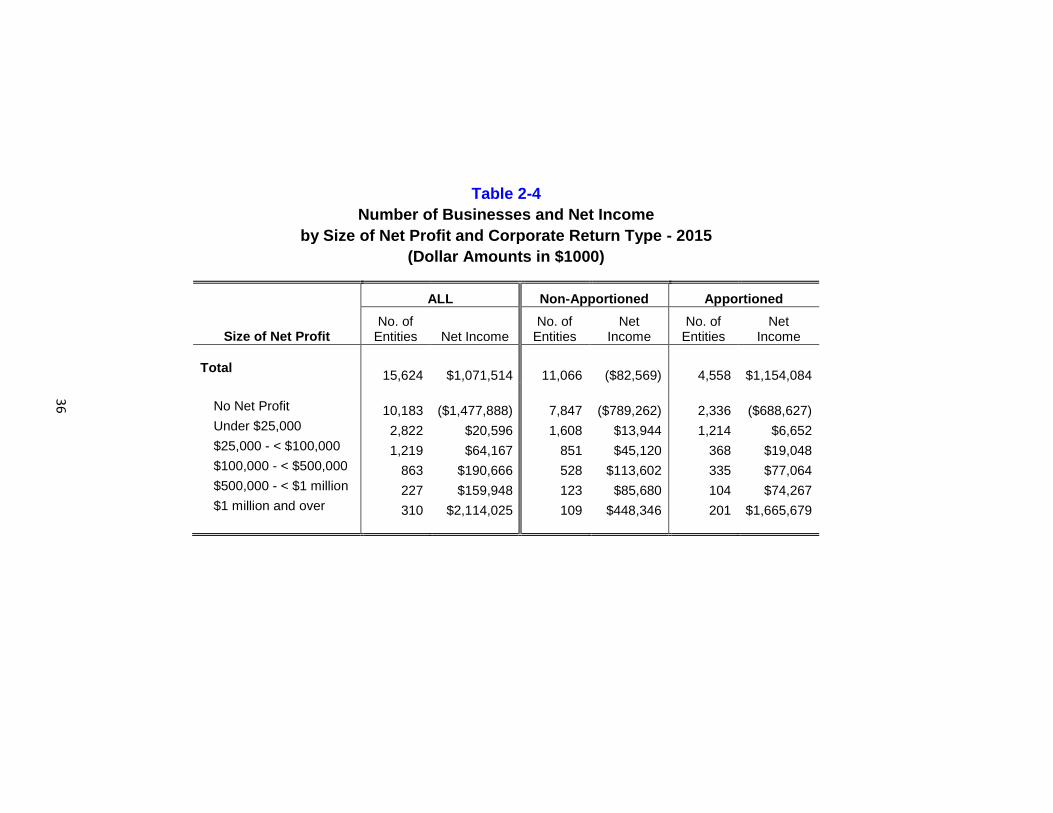
36
Table 2-4
Number of Businesses and Net Income
by Size of Net Profit and Corporate Return Type - 2015
(Dollar Amounts in $1000)
Size of Net Profit
ALL Non-Apportioned Apportioned
No. of Entities Net Income
No. of Entities
Net Income
No. of Entities
Net Income
Total 15,624 $1,071,514 11,066 ($82,569) 4,558 $1,154,084
No Net Profit 10,183 ($1,477,888) 7,847 ($789,262) 2,336 ($688,627)
Under $25,000 2,822 $20,596 1,608 $13,944 1,214 $6,652 $25,000 - < $100,000 1,219 $64,167 851 $45,120 368 $19,048 $100,000 - < $500,000 863 $190,666 528 $113,602 335 $77,064 $500,000 - < $1 million 227 $159,948 123 $85,680 104 $74,267 $1 million and over 310 $2,114,025 109 $448,346 201 $1,665,679
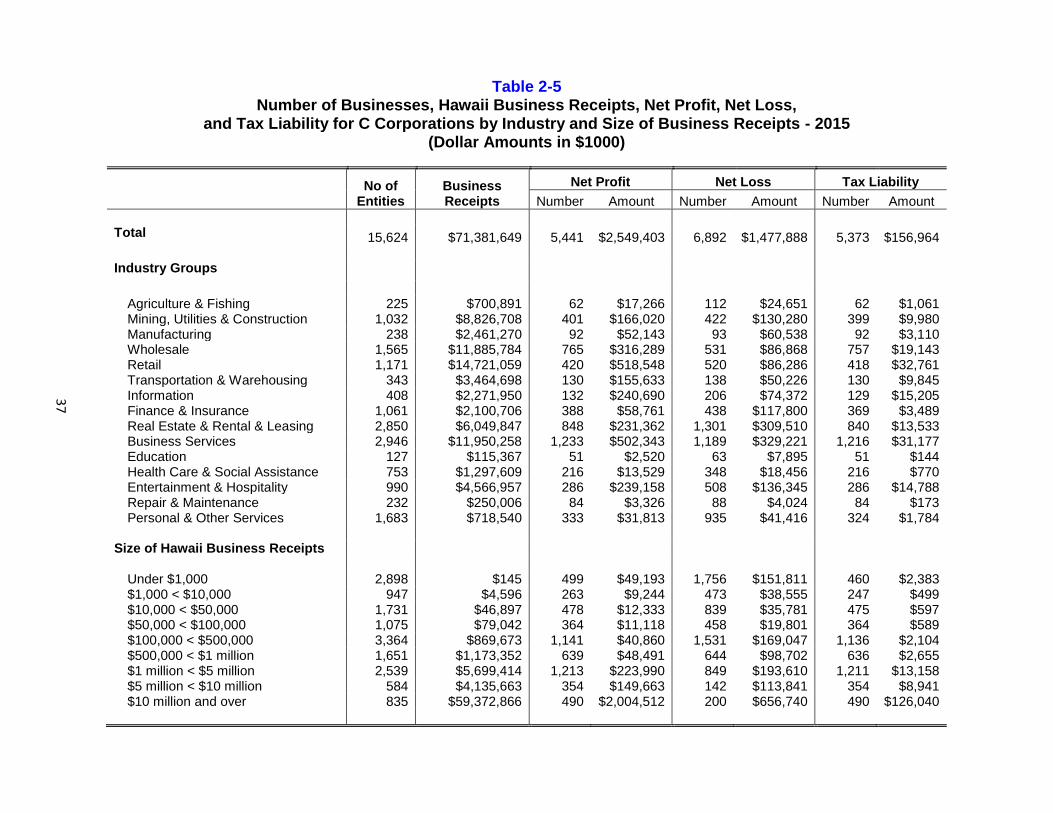
37
Table 2-5
Number of Businesses, Hawaii Business Receipts, Net Profit, Net Loss, and Tax Liability for C Corporations by Industry and Size of Business Receipts - 2015
(Dollar Amounts in $1000)
No of Entities
Business Receipts
Net Profit Net Loss Tax Liability
Number Amount Number Amount Number Amount
Total 15,624 $71,381,649 5,441 $2,549,403 6,892 $1,477,888 5,373 $156,964
Industry Groups Agriculture & Fishing 225 $700,891 62 $17,266 112 $24,651 62 $1,061
Mining, Utilities & Construction 1,032 $8,826,708 401 $166,020 422 $130,280 399 $9,980 Manufacturing 238 $2,461,270 92 $52,143 93 $60,538 92 $3,110 Wholesale 1,565 $11,885,784 765 $316,289 531 $86,868 757 $19,143 Retail 1,171 $14,721,059 420 $518,548 520 $86,286 418 $32,761 Transportation & Warehousing 343 $3,464,698 130 $155,633 138 $50,226 130 $9,845 Information 408 $2,271,950 132 $240,690 206 $74,372 129 $15,205 Finance & Insurance 1,061 $2,100,706 388 $58,761 438 $117,800 369 $3,489 Real Estate & Rental & Leasing 2,850 $6,049,847 848 $231,362 1,301 $309,510 840 $13,533 Business Services 2,946 $11,950,258 1,233 $502,343 1,189 $329,221 1,216 $31,177 Education 127 $115,367 51 $2,520 63 $7,895 51 $144 Health Care & Social Assistance 753 $1,297,609 216 $13,529 348 $18,456 216 $770 Entertainment & Hospitality 990 $4,566,957 286 $239,158 508 $136,345 286 $14,788 Repair & Maintenance 232 $250,006 84 $3,326 88 $4,024 84 $173 Personal & Other Services 1,683 $718,540 333 $31,813 935 $41,416 324 $1,784
Size of Hawaii Business Receipts
Under $1,000 2,898 $145 499 $49,193 1,756 $151,811 460 $2,383
$1,000 < $10,000 947 $4,596 263 $9,244 473 $38,555 247 $499 $10,000 < $50,000 1,731 $46,897 478 $12,333 839 $35,781 475 $597 $50,000 < $100,000 1,075 $79,042 364 $11,118 458 $19,801 364 $589 $100,000 < $500,000 3,364 $869,673 1,141 $40,860 1,531 $169,047 1,136 $2,104 $500,000 < $1 million 1,651 $1,173,352 639 $48,491 644 $98,702 636 $2,655 $1 million < $5 million 2,539 $5,699,414 1,213 $223,990 849 $193,610 1,211 $13,158 $5 million < $10 million 584 $4,135,663 354 $149,663 142 $113,841 354 $8,941 $10 million and over 835 $59,372,866 490 $2,004,512 200 $656,740 490 $126,040
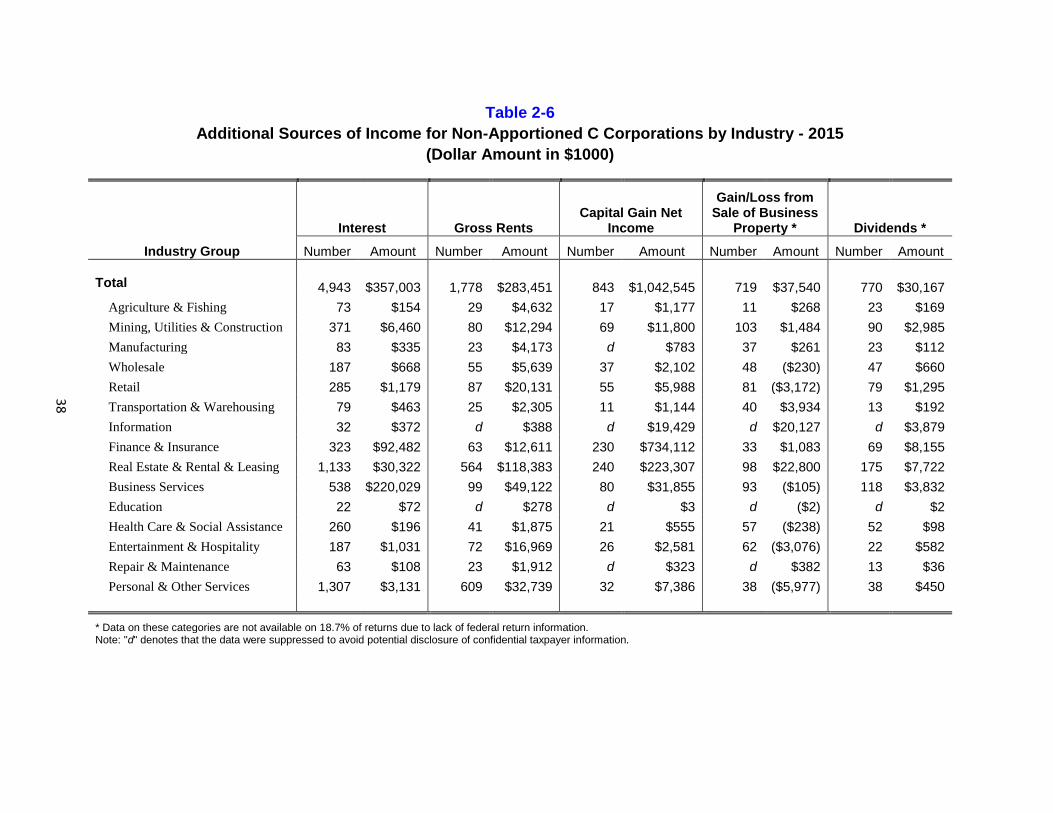
38
Table 2-6
Additional Sources of Income for Non-Apportioned C Corporations by Industry - 2015
(Dollar Amount in $1000)
Industry Group
Interest Gross Rents Capital Gain Net
Income
Gain/Loss from Sale of Business
Property * Dividends *
Number Amount Number Amount Number Amount Number Amount Number Amount
Total 4,943 $357,003 1,778 $283,451 843 $1,042,545 719 $37,540 770 $30,167
Agriculture & Fishing 73 $154 29 $4,632 17 $1,177 11 $268 23 $169
Mining, Utilities & Construction 371 $6,460 80 $12,294 69 $11,800 103 $1,484 90 $2,985
Manufacturing 83 $335 23 $4,173 d $783 37 $261 23 $112
Wholesale 187 $668 55 $5,639 37 $2,102 48 ($230) 47 $660
Retail 285 $1,179 87 $20,131 55 $5,988 81 ($3,172) 79 $1,295
Transportation & Warehousing 79 $463 25 $2,305 11 $1,144 40 $3,934 13 $192
Information 32 $372 d $388 d $19,429 d $20,127 d $3,879
Finance & Insurance 323 $92,482 63 $12,611 230 $734,112 33 $1,083 69 $8,155
Real Estate & Rental & Leasing 1,133 $30,322 564 $118,383 240 $223,307 98 $22,800 175 $7,722
Business Services 538 $220,029 99 $49,122 80 $31,855 93 ($105) 118 $3,832
Education 22 $72 d $278 d $3 d ($2) d $2
Health Care & Social Assistance 260 $196 41 $1,875 21 $555 57 ($238) 52 $98
Entertainment & Hospitality 187 $1,031 72 $16,969 26 $2,581 62 ($3,076) 22 $582
Repair & Maintenance 63 $108 23 $1,912 d $323 d $382 13 $36
Personal & Other Services 1,307 $3,131 609 $32,739 32 $7,386 38 ($5,977) 38 $450
* Data on these categories are not available on 18.7% of returns due to lack of federal return information. Note: "d" denotes that the data were suppressed to avoid potential disclosure of confidential taxpayer information.
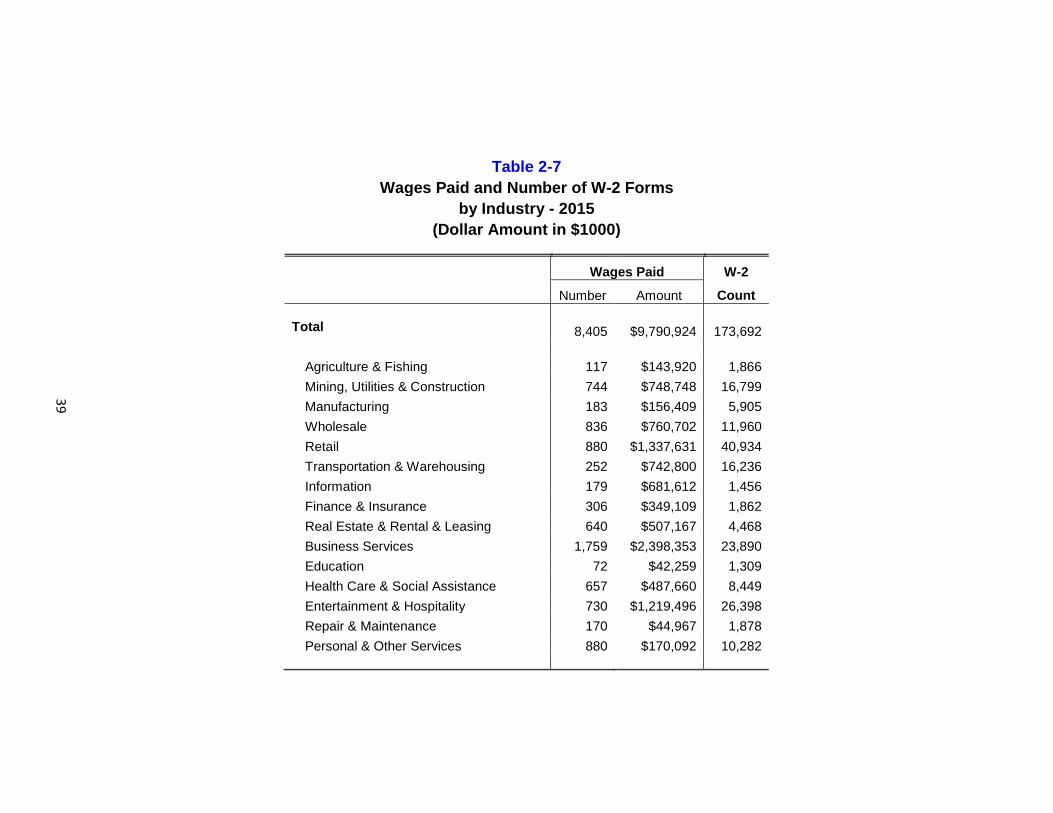
39
Table 2-7
Wages Paid and Number of W-2 Forms
by Industry - 2015
(Dollar Amount in $1000)
Wages Paid W-2
Number Amount Count
Total 8,405 $9,790,924 173,692
Agriculture & Fishing 117 $143,920 1,866
Mining, Utilities & Construction 744 $748,748 16,799
Manufacturing 183 $156,409 5,905
Wholesale 836 $760,702 11,960
Retail 880 $1,337,631 40,934
Transportation & Warehousing 252 $742,800 16,236
Information 179 $681,612 1,456
Finance & Insurance 306 $349,109 1,862
Real Estate & Rental & Leasing 640 $507,167 4,468
Business Services 1,759 $2,398,353 23,890
Education 72 $42,259 1,309
Health Care & Social Assistance 657 $487,660 8,449
Entertainment & Hospitality 730 $1,219,496 26,398
Repair & Maintenance 170 $44,967 1,878
Personal & Other Services 880 $170,092 10,282
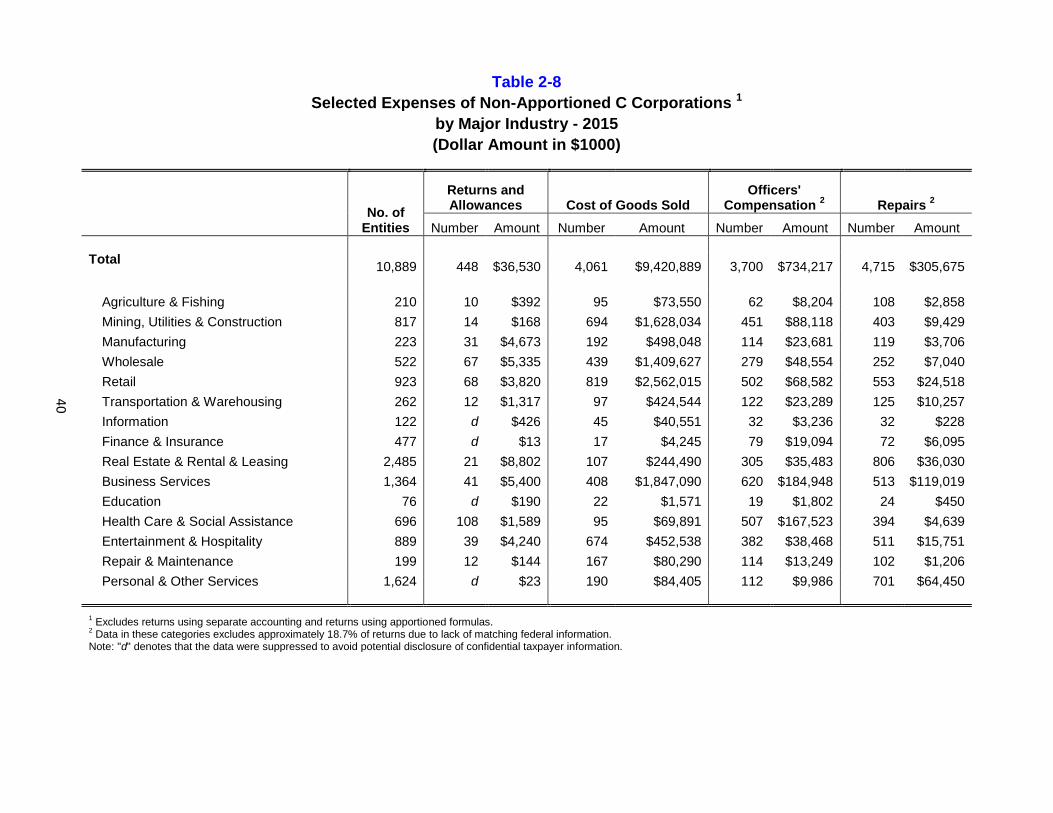
40
Table 2-8
Selected Expenses of Non-Apportioned C Corporations 1
by Major Industry - 2015
(Dollar Amount in $1000)
No. of
Entities
Returns and Allowances Cost of Goods Sold
Officers' Compensation
2 Repairs
2
Number Amount Number Amount Number Amount Number Amount
Total 10,889 448 $36,530 4,061 $9,420,889 3,700 $734,217 4,715 $305,675
Agriculture & Fishing 210 10 $392 95 $73,550 62 $8,204 108 $2,858
Mining, Utilities & Construction 817 14 $168 694 $1,628,034 451 $88,118 403 $9,429
Manufacturing 223 31 $4,673 192 $498,048 114 $23,681 119 $3,706
Wholesale 522 67 $5,335 439 $1,409,627 279 $48,554 252 $7,040
Retail 923 68 $3,820 819 $2,562,015 502 $68,582 553 $24,518
Transportation & Warehousing 262 12 $1,317 97 $424,544 122 $23,289 125 $10,257
Information 122 d $426 45 $40,551 32 $3,236 32 $228
Finance & Insurance 477 d $13 17 $4,245 79 $19,094 72 $6,095
Real Estate & Rental & Leasing 2,485 21 $8,802 107 $244,490 305 $35,483 806 $36,030
Business Services 1,364 41 $5,400 408 $1,847,090 620 $184,948 513 $119,019
Education 76 d $190 22 $1,571 19 $1,802 24 $450
Health Care & Social Assistance 696 108 $1,589 95 $69,891 507 $167,523 394 $4,639
Entertainment & Hospitality 889 39 $4,240 674 $452,538 382 $38,468 511 $15,751
Repair & Maintenance 199 12 $144 167 $80,290 114 $13,249 102 $1,206
Personal & Other Services 1,624 d $23 190 $84,405 112 $9,986 701 $64,450
1 Excludes returns using separate accounting and returns using apportioned formulas.
2 Data in these categories excludes approximately 18.7% of returns due to lack of matching federal information.
Note: "d" denotes that the data were suppressed to avoid potential disclosure of confidential taxpayer information.
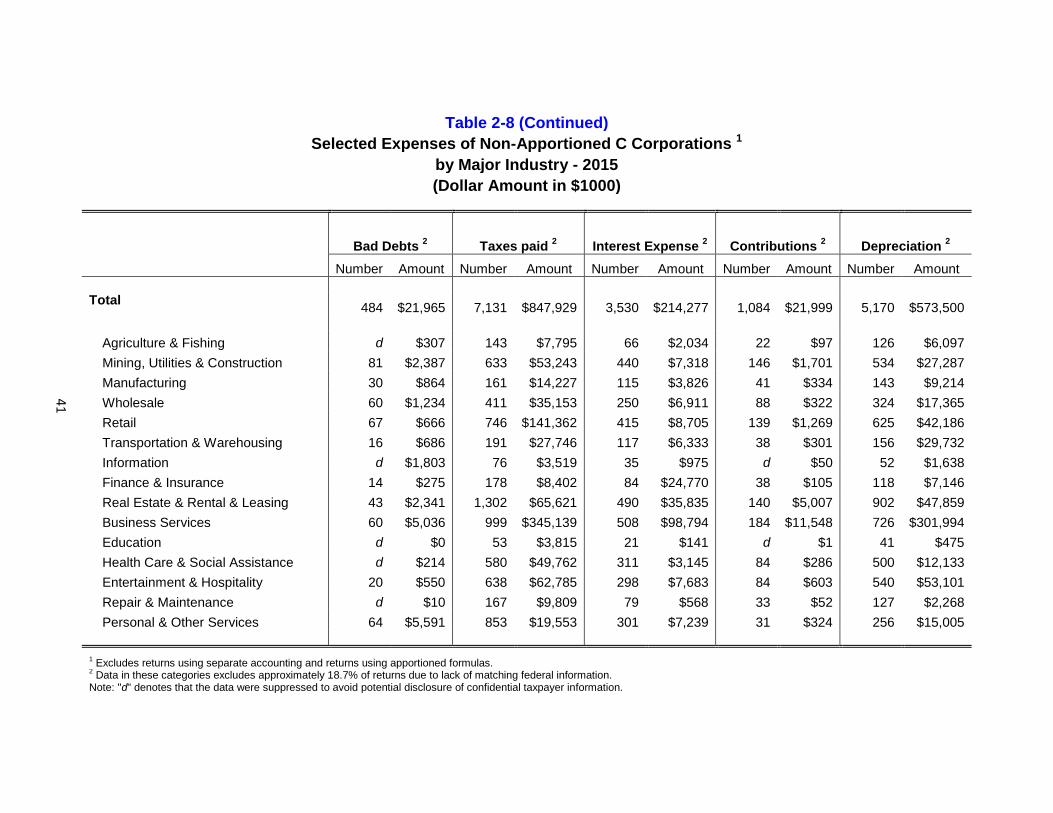
41
Table 2-8 (Continued)
Selected Expenses of Non-Apportioned C Corporations 1
by Major Industry - 2015
(Dollar Amount in $1000)
Bad Debts 2 Taxes paid
2 Interest Expense
2 Contributions
2 Depreciation
2
Number Amount Number Amount Number Amount Number Amount Number Amount
Total 484 $21,965 7,131 $847,929 3,530 $214,277 1,084 $21,999 5,170 $573,500
Agriculture & Fishing d $307 143 $7,795 66 $2,034 22 $97 126 $6,097
Mining, Utilities & Construction 81 $2,387 633 $53,243 440 $7,318 146 $1,701 534 $27,287
Manufacturing 30 $864 161 $14,227 115 $3,826 41 $334 143 $9,214
Wholesale 60 $1,234 411 $35,153 250 $6,911 88 $322 324 $17,365
Retail 67 $666 746 $141,362 415 $8,705 139 $1,269 625 $42,186
Transportation & Warehousing 16 $686 191 $27,746 117 $6,333 38 $301 156 $29,732
Information d $1,803 76 $3,519 35 $975 d $50 52 $1,638
Finance & Insurance 14 $275 178 $8,402 84 $24,770 38 $105 118 $7,146
Real Estate & Rental & Leasing 43 $2,341 1,302 $65,621 490 $35,835 140 $5,007 902 $47,859
Business Services 60 $5,036 999 $345,139 508 $98,794 184 $11,548 726 $301,994
Education d $0 53 $3,815 21 $141 d $1 41 $475
Health Care & Social Assistance d $214 580 $49,762 311 $3,145 84 $286 500 $12,133
Entertainment & Hospitality 20 $550 638 $62,785 298 $7,683 84 $603 540 $53,101
Repair & Maintenance d $10 167 $9,809 79 $568 33 $52 127 $2,268
Personal & Other Services 64 $5,591 853 $19,553 301 $7,239 31 $324 256 $15,005
1 Excludes returns using separate accounting and returns using apportioned formulas.
2 Data in these categories excludes approximately 18.7% of returns due to lack of matching federal information.
Note: "d" denotes that the data were suppressed to avoid potential disclosure of confidential taxpayer information.
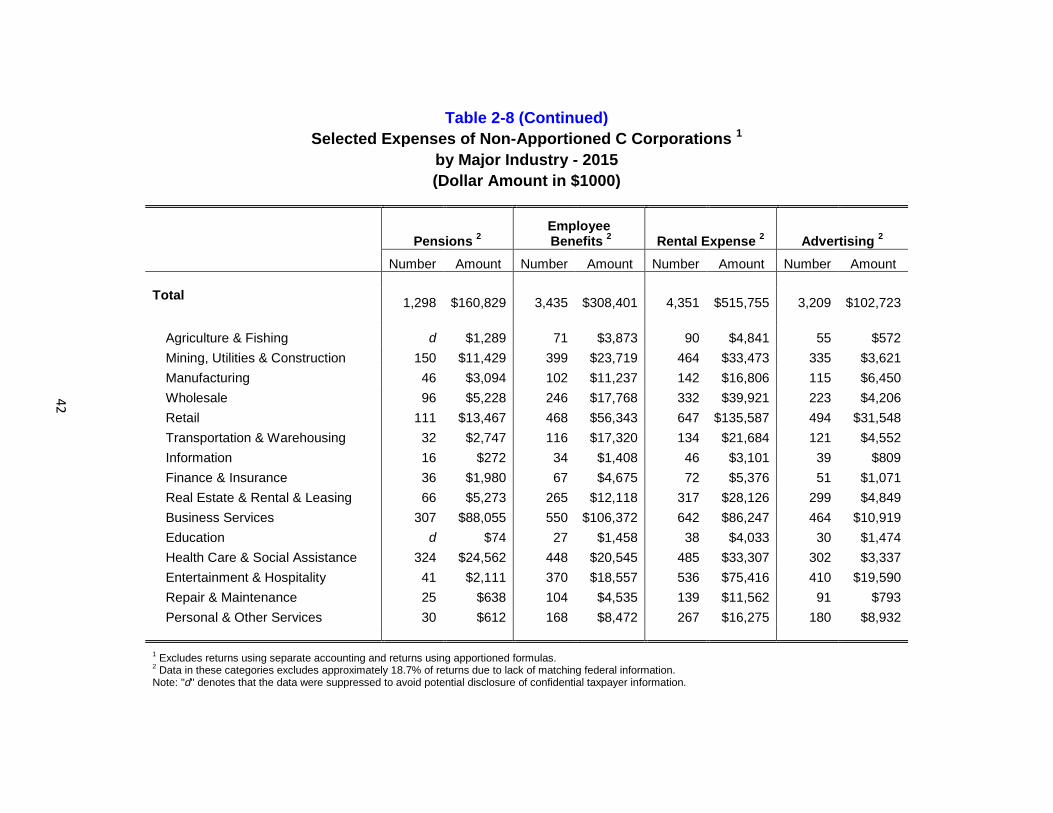
42
Table 2-8 (Continued)
Selected Expenses of Non-Apportioned C Corporations 1
by Major Industry - 2015
(Dollar Amount in $1000)
Pensions 2
Employee Benefits
2 Rental Expense
2 Advertising
2
Number Amount Number Amount Number Amount Number Amount
Total 1,298 $160,829 3,435 $308,401 4,351 $515,755 3,209 $102,723
Agriculture & Fishing d $1,289 71 $3,873 90 $4,841 55 $572
Mining, Utilities & Construction 150 $11,429 399 $23,719 464 $33,473 335 $3,621
Manufacturing 46 $3,094 102 $11,237 142 $16,806 115 $6,450
Wholesale 96 $5,228 246 $17,768 332 $39,921 223 $4,206
Retail 111 $13,467 468 $56,343 647 $135,587 494 $31,548
Transportation & Warehousing 32 $2,747 116 $17,320 134 $21,684 121 $4,552
Information 16 $272 34 $1,408 46 $3,101 39 $809
Finance & Insurance 36 $1,980 67 $4,675 72 $5,376 51 $1,071
Real Estate & Rental & Leasing 66 $5,273 265 $12,118 317 $28,126 299 $4,849
Business Services 307 $88,055 550 $106,372 642 $86,247 464 $10,919
Education d $74 27 $1,458 38 $4,033 30 $1,474
Health Care & Social Assistance 324 $24,562 448 $20,545 485 $33,307 302 $3,337
Entertainment & Hospitality 41 $2,111 370 $18,557 536 $75,416 410 $19,590
Repair & Maintenance 25 $638 104 $4,535 139 $11,562 91 $793
Personal & Other Services 30 $612 168 $8,472 267 $16,275 180 $8,932
1 Excludes returns using separate accounting and returns using apportioned formulas.
2 Data in these categories excludes approximately 18.7% of returns due to lack of matching federal information.
Note: "d" denotes that the data were suppressed to avoid potential disclosure of confidential taxpayer information.
43
SECTION 3
FINANCIAL CORPORATIONS
Banks and other financial institutions taxable under Chapter 241 of the Hawaii Revised
Statutes must file Form F-1. In lieu of an income tax, these corporations pay a franchise
tax, based on their prior year Hawaii adjusted income.
For tax year 2015, 201 financial corporations filed Form F-1, reporting business receipts
of $2.4 billion and net income of $336.0 million. Profits of $390.9 million were realized
by 128 entities, while 55 corporations incurred losses totaling $54.9 million. A franchise
tax liability of $29.6 million resulted from the profitable organizations. Corporations with
$5 million or more business receipts accounted for 95.2% of the total business receipts
and 75.2% of the net income, even though they only consist 15.9% of all entities (Table
3-1). Of the 201 financial corporations, 185 filed their returns in Oahu district.
Table 3-2 shows total deduction, wages paid and W-2 count for financial corporations
by size of business receipts. Overall, 111 corporations paid $444.3 million in wages.
Corporations with $5 million or more business receipts paid 74.2% of total wages.

45
Section 3
Financial Corporations
Statistical Tables
Dollar amounts and percentages are rounded and may not add up to totals.
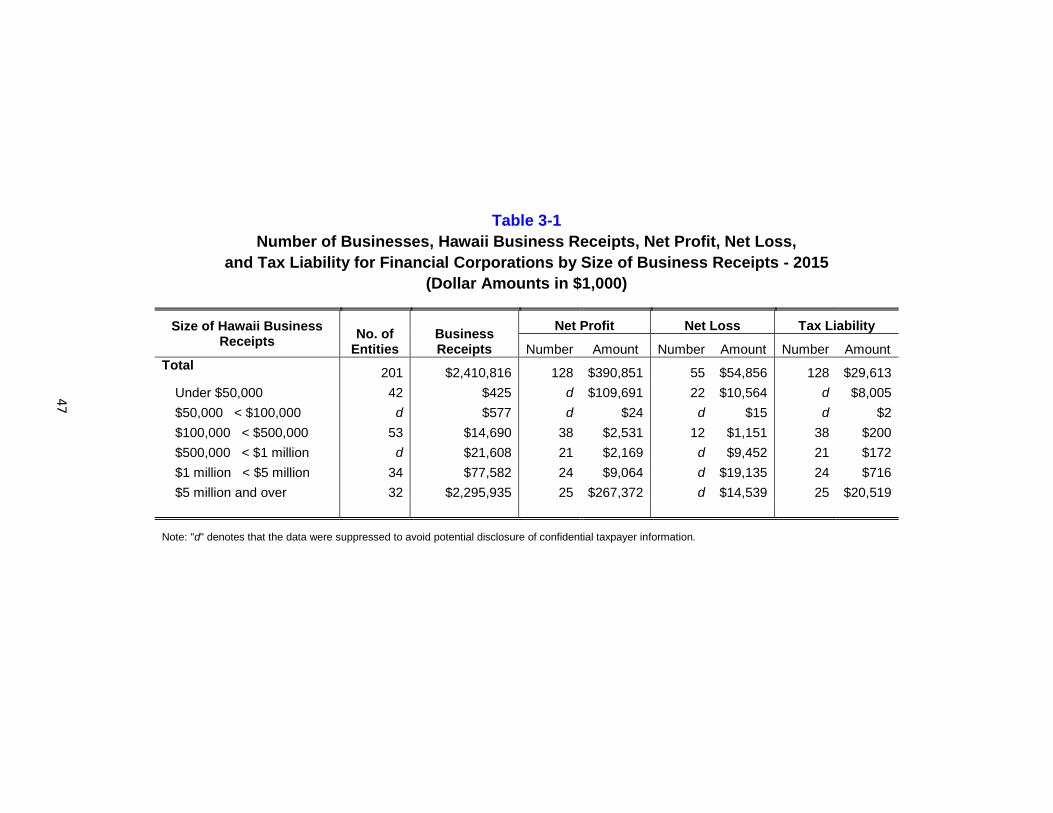
47
Table 3-1
Number of Businesses, Hawaii Business Receipts, Net Profit, Net Loss,
and Tax Liability for Financial Corporations by Size of Business Receipts - 2015
(Dollar Amounts in $1,000)
Size of Hawaii Business Receipts
No. of Entities
Business Receipts
Net Profit Net Loss Tax Liability
Number Amount Number Amount Number Amount
Total 201 $2,410,816 128 $390,851 55 $54,856 128 $29,613
Under $50,000 42 $425 d $109,691 22 $10,564 d $8,005
$50,000 < $100,000 d $577 d $24 d $15 d $2
$100,000 < $500,000 53 $14,690 38 $2,531 12 $1,151 38 $200
$500,000 < $1 million d $21,608 21 $2,169 d $9,452 21 $172
$1 million < $5 million 34 $77,582 24 $9,064 d $19,135 24 $716
$5 million and over 32 $2,295,935 25 $267,372 d $14,539 25 $20,519
Note: "d" denotes that the data were suppressed to avoid potential disclosure of confidential taxpayer information.
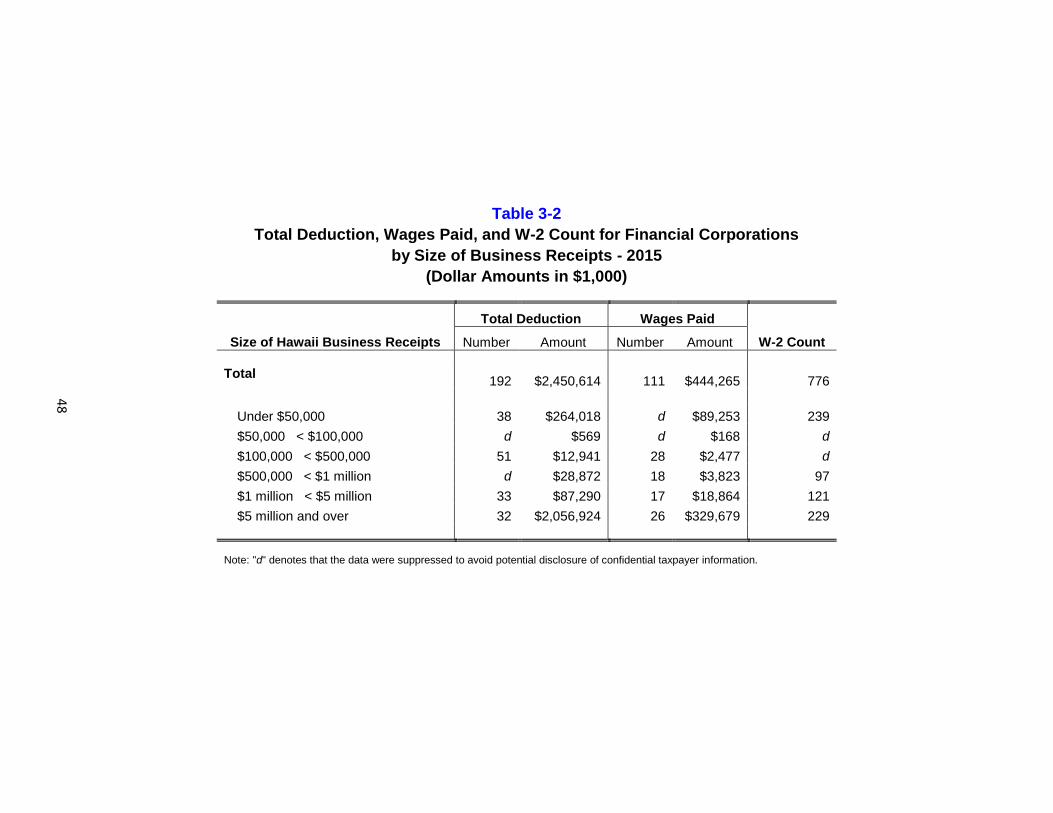
48
Table 3-2
Total Deduction, Wages Paid, and W-2 Count for Financial Corporations
by Size of Business Receipts - 2015
(Dollar Amounts in $1,000)
Size of Hawaii Business Receipts
Total Deduction Wages Paid
W-2 Count Number Amount Number Amount
Total 192 $2,450,614 111 $444,265 776
Under $50,000 38 $264,018 d $89,253 239
$50,000 < $100,000 d $569 d $168 d
$100,000 < $500,000 51 $12,941 28 $2,477 d
$500,000 < $1 million d $28,872 18 $3,823 97
$1 million < $5 million 33 $87,290 17 $18,864 121
$5 million and over 32 $2,056,924 26 $329,679 229
Note: "d" denotes that the data were suppressed to avoid potential disclosure of confidential taxpayer information.
49
SECTION 4
PROPRIETORSHIPS
Sole proprietors are required to file Schedule C and/or Schedule F with their
federal individual income tax returns. Schedule F is used to record farm activities,
while Schedule C is used for all other businesses. Since single-member limited
liability companies (LLCs) are classified as if they were a sole proprietorship,
they have to file Schedules C, E and/or F with their individual income tax returns.
Their schedules are included in the proprietorship count. Proprietors operating
several businesses will often file multiple schedules. For this report, each
schedule is treated as a separate entity.
Although not technically recognized as proprietors, some individuals receive
rental income from real estate holdings. Federal Schedule E, Part 1, is used to
report any revenue or loss derived from such activities. For the purpose of this
study, any real estate rental recorded on Schedule E is considered a
proprietorship entry, and included herein.
Sole proprietorships accounted for 91.6% of all Hawaii business entities reported
here (excluding S corporations and partnerships) in 2015. Of the 172,494
registered proprietorships, 101,119 included Schedules C and F with their federal
returns, while 71,375 attached Schedule E. Business receipts from proprietors
totaled $5.9 billion, which comprised 2.2% of all business revenues (excluding S
corporations and partnerships) in the state (Table 1-1). Approximately 58.4% of
proprietors had revenues under $25,000, and 14.1%, or 24,282, recorded zero
receipts (Table 4-2).
Table 4-1 reveals the dominance of the real estate and rental industry among
proprietorships, with 35.0% of all such returns engaged in these activities. This
pattern held in all districts, ranging from 27.1% on the island of Hawaii to 37.4%
on Oahu. Business services represented the next highest category of filings at
10.1%, followed by personal and other services with 6.0%.
Not surprisingly, real estate and rental proprietors contributed 34.2%, or $2.0
billion, of total business receipts. The business services accounted for
approximately 11.1% of revenues. The construction & utilities and wholesale
groups ranked highest in terms of revenues per entity at $98,519 and $98,769
separately. The construction & utilities was responsible for 9.6% of total business
receipts while wholesale accounted for 3.3% (Table 4-3).
50
Statewide net income for sole proprietors reached $1.3 billion, with 57.9% of all
entities reporting profits of $1.7 billion, and 28.2% recording losses of $398.4
million. The largest source of net income was the real estate and rental industry,
adding $328.2 million, or 25.8% of aggregated net income, followed by the
business services sector at $251.7 million, or 19.8% (Table 4-3).
The difference between business receipts and net income consists of expenses and deductions. Among the proprietorship population, over $4.6 billion in expenses was claimed, 20.9% of which was $966.2 million in cost of goods sold. The retail industry accounted for $256.8 million of this figure, with the cost of goods sold representing 58.0% of its total expenses of $442.4 million. As a sector, the real estate and rental industry recorded the greatest amount of overall expenses, $1.7 billion, or 36.3% of the aggregated total deduction. Mortgage interest made up 17.2%, or the largest portion, of these expenses. In Table 4-5, individual tax returns are examined to compare the contribution of
proprietorship revenue to other income sources. On average, 12.1% of individual
taxpayers' adjusted gross income (AGI) can be attributed to proprietorship
activities. Only for the AGI class between $5,000 and $25,000 does
proprietorship income represent a major (44.4%) source of funds.
Table 4-6 extends the comparison to industry sectors. As a percentage of AGI,
proprietorship contributions range from 1.2% in the agriculture and fishing group
to 33.3% in construction and utilities. In general, proprietorship income is not a
primary contributor of AGI.
From Table 4-8, it appears that for 48.0% of all sole proprietors, business
earnings represented less than 1% of total adjusted gross income (AGI). Only
21.7% reported proprietorship income of at least 50% of AGI. By industry,
business revenues comprised at least half of AGI for 43.7% of transportation and
warehousing providers and 42.0% of construction and utility operators, compared
to only 15.4% of education proprietors.
Table 4-7 shows selected data for rental income reported on schedule E. Total of
71,375 returns reported $1.6 billion in gross rents received. Returns with
business receipts between $10,000 and $250,000 accounted for 83.6% of total
gross rents.
Individual taxpayers also report their total pass-through income from partnerships
and S corporations on schedule E of their federal returns. Total of 22,466 returns
reported $863.0 million net income from partnerships and/or S corporations. Tax
returns with $200,000 and over Hawaii AGI accounted for 73.4% of such net
income, or $633.4 million (Table 4-9).
51
Section 4
Proprietorships
Statistical Tables
Dollar amounts and percentages are rounded and may not add up to totals.
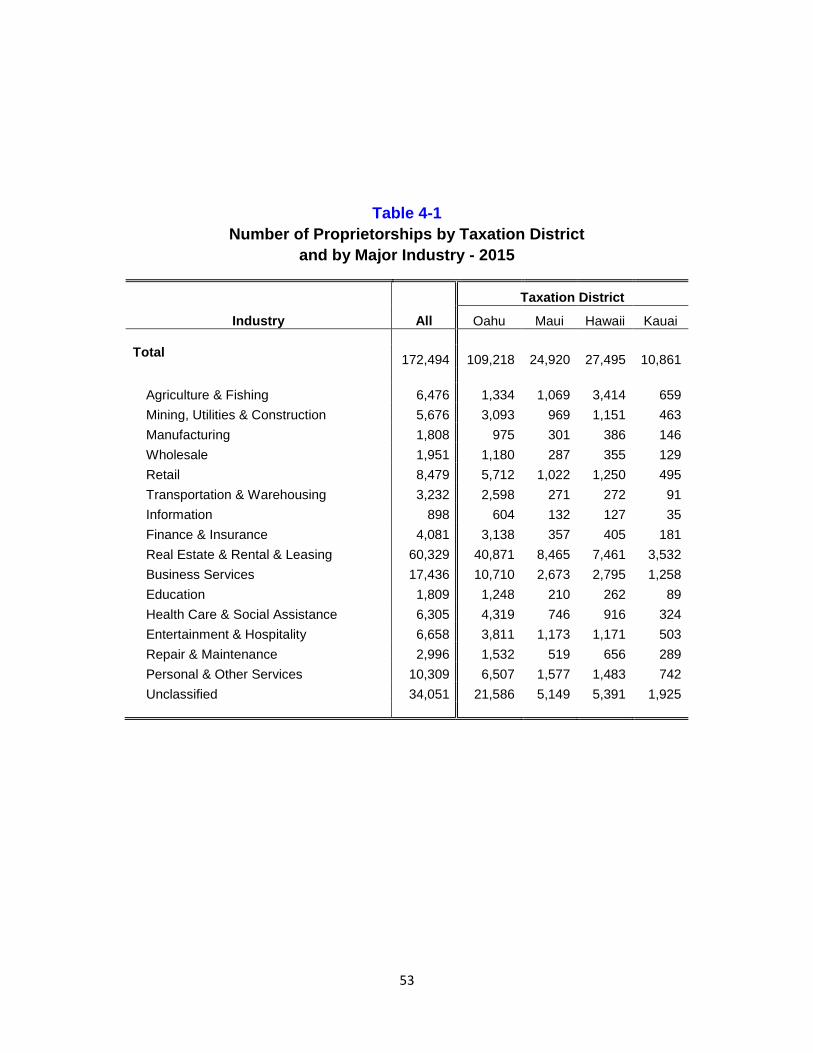
53
Table 4-1
Number of Proprietorships by Taxation District
and by Major Industry - 2015
Industry All
Taxation District
Oahu Maui Hawaii Kauai
Total 172,494 109,218 24,920 27,495 10,861
Agriculture & Fishing 6,476 1,334 1,069 3,414 659
Mining, Utilities & Construction 5,676 3,093 969 1,151 463
Manufacturing 1,808 975 301 386 146
Wholesale 1,951 1,180 287 355 129
Retail 8,479 5,712 1,022 1,250 495
Transportation & Warehousing 3,232 2,598 271 272 91
Information 898 604 132 127 35
Finance & Insurance 4,081 3,138 357 405 181
Real Estate & Rental & Leasing 60,329 40,871 8,465 7,461 3,532
Business Services 17,436 10,710 2,673 2,795 1,258
Education 1,809 1,248 210 262 89
Health Care & Social Assistance 6,305 4,319 746 916 324
Entertainment & Hospitality 6,658 3,811 1,173 1,171 503
Repair & Maintenance 2,996 1,532 519 656 289
Personal & Other Services 10,309 6,507 1,577 1,483 742
Unclassified 34,051 21,586 5,149 5,391 1,925
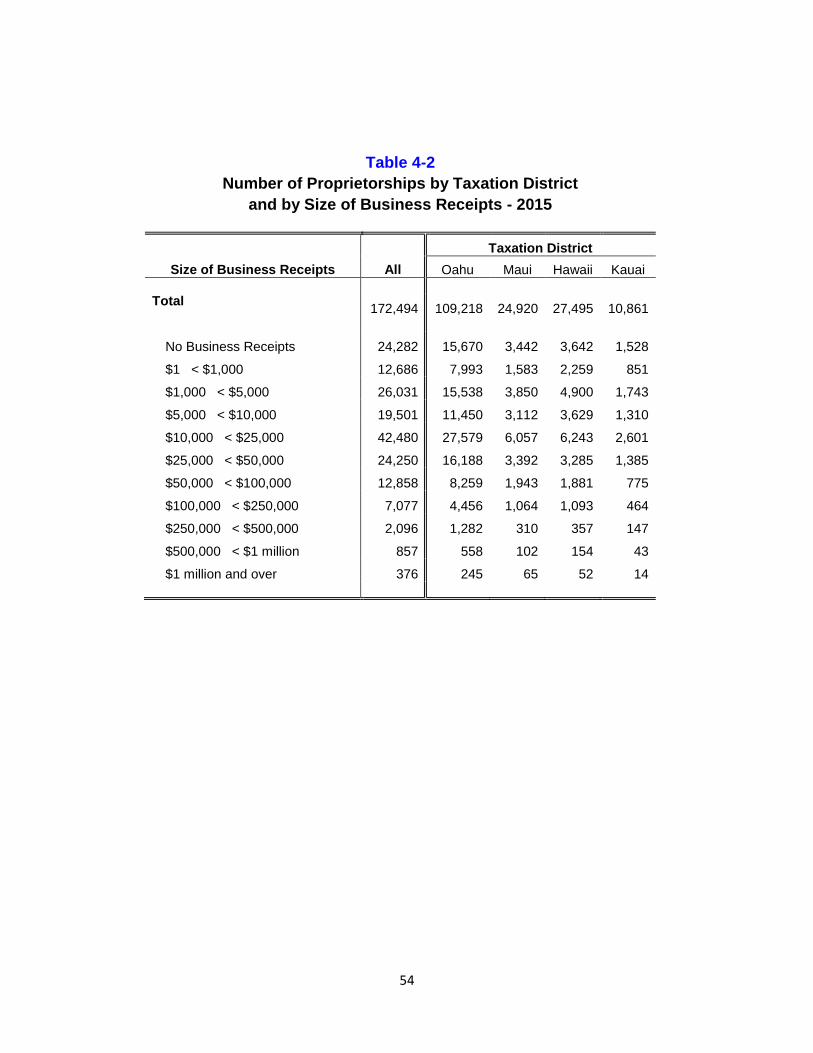
54
Table 4-2
Number of Proprietorships by Taxation District
and by Size of Business Receipts - 2015
Size of Business Receipts All
Taxation District
Oahu Maui Hawaii Kauai
Total 172,494 109,218 24,920 27,495 10,861
No Business Receipts 24,282 15,670 3,442 3,642 1,528
$1 < $1,000 12,686 7,993 1,583 2,259 851
$1,000 < $5,000 26,031 15,538 3,850 4,900 1,743
$5,000 < $10,000 19,501 11,450 3,112 3,629 1,310
$10,000 < $25,000 42,480 27,579 6,057 6,243 2,601
$25,000 < $50,000 24,250 16,188 3,392 3,285 1,385
$50,000 < $100,000 12,858 8,259 1,943 1,881 775
$100,000 < $250,000 7,077 4,456 1,064 1,093 464
$250,000 < $500,000 2,096 1,282 310 357 147
$500,000 < $1 million 857 558 102 154 43
$1 million and over 376 245 65 52 14
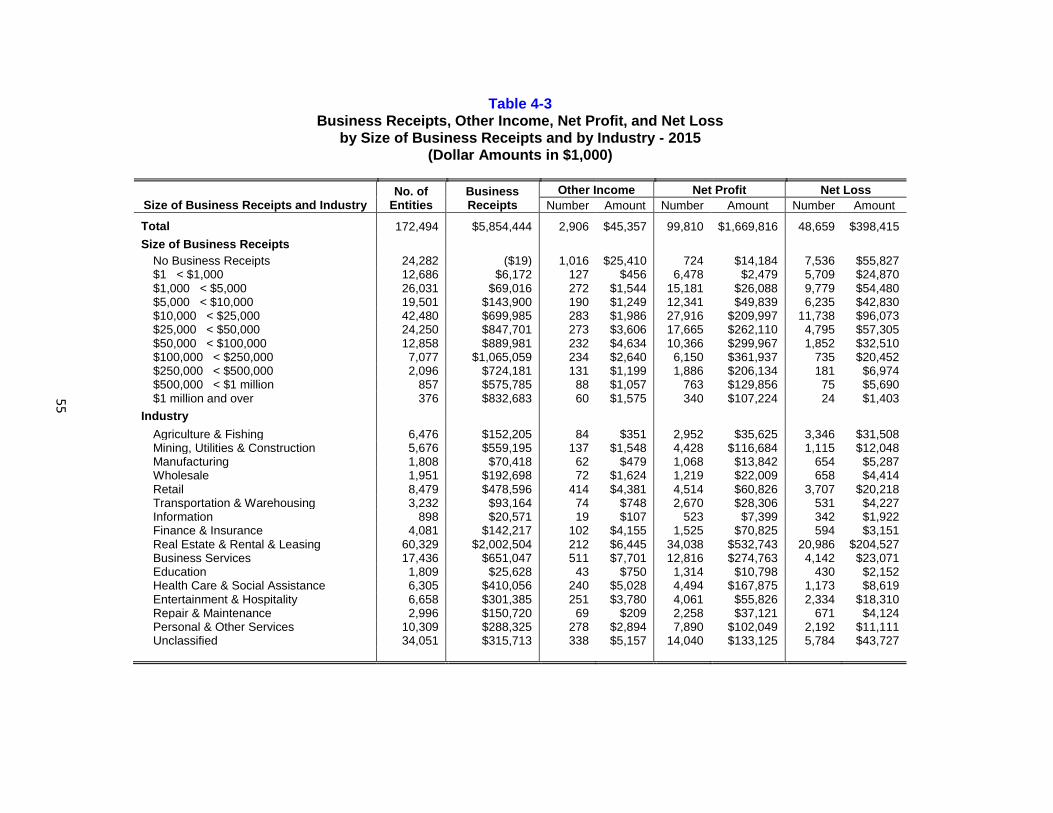
55
Table 4-3 Business Receipts, Other Income, Net Profit, and Net Loss
by Size of Business Receipts and by Industry - 2015 (Dollar Amounts in $1,000)
Size of Business Receipts and Industry No. of
Entities Business Receipts
Other Income Net Profit Net Loss
Number Amount Number Amount Number Amount
Total 172,494 $5,854,444 2,906 $45,357 99,810 $1,669,816 48,659 $398,415
Size of Business Receipts
No Business Receipts 24,282 ($19) 1,016 $25,410 724 $14,184 7,536 $55,827 $1 < $1,000 12,686 $6,172 127 $456 6,478 $2,479 5,709 $24,870 $1,000 < $5,000 26,031 $69,016 272 $1,544 15,181 $26,088 9,779 $54,480 $5,000 < $10,000 19,501 $143,900 190 $1,249 12,341 $49,839 6,235 $42,830 $10,000 < $25,000 42,480 $699,985 283 $1,986 27,916 $209,997 11,738 $96,073 $25,000 < $50,000 24,250 $847,701 273 $3,606 17,665 $262,110 4,795 $57,305 $50,000 < $100,000 12,858 $889,981 232 $4,634 10,366 $299,967 1,852 $32,510 $100,000 < $250,000 7,077 $1,065,059 234 $2,640 6,150 $361,937 735 $20,452 $250,000 < $500,000 2,096 $724,181 131 $1,199 1,886 $206,134 181 $6,974 $500,000 < $1 million 857 $575,785 88 $1,057 763 $129,856 75 $5,690 $1 million and over 376 $832,683 60 $1,575 340 $107,224 24 $1,403
Industry
Agriculture & Fishing 6,476 $152,205 84 $351 2,952 $35,625 3,346 $31,508 Mining, Utilities & Construction 5,676 $559,195 137 $1,548 4,428 $116,684 1,115 $12,048 Manufacturing 1,808 $70,418 62 $479 1,068 $13,842 654 $5,287 Wholesale 1,951 $192,698 72 $1,624 1,219 $22,009 658 $4,414 Retail 8,479 $478,596 414 $4,381 4,514 $60,826 3,707 $20,218 Transportation & Warehousing 3,232 $93,164 74 $748 2,670 $28,306 531 $4,227 Information 898 $20,571 19 $107 523 $7,399 342 $1,922 Finance & Insurance 4,081 $142,217 102 $4,155 1,525 $70,825 594 $3,151 Real Estate & Rental & Leasing 60,329 $2,002,504 212 $6,445 34,038 $532,743 20,986 $204,527 Business Services 17,436 $651,047 511 $7,701 12,816 $274,763 4,142 $23,071 Education 1,809 $25,628 43 $750 1,314 $10,798 430 $2,152 Health Care & Social Assistance 6,305 $410,056 240 $5,028 4,494 $167,875 1,173 $8,619 Entertainment & Hospitality 6,658 $301,385 251 $3,780 4,061 $55,826 2,334 $18,310 Repair & Maintenance 2,996 $150,720 69 $209 2,258 $37,121 671 $4,124 Personal & Other Services 10,309 $288,325 278 $2,894 7,890 $102,049 2,192 $11,111 Unclassified 34,051 $315,713 338 $5,157 14,040 $133,125 5,784 $43,727
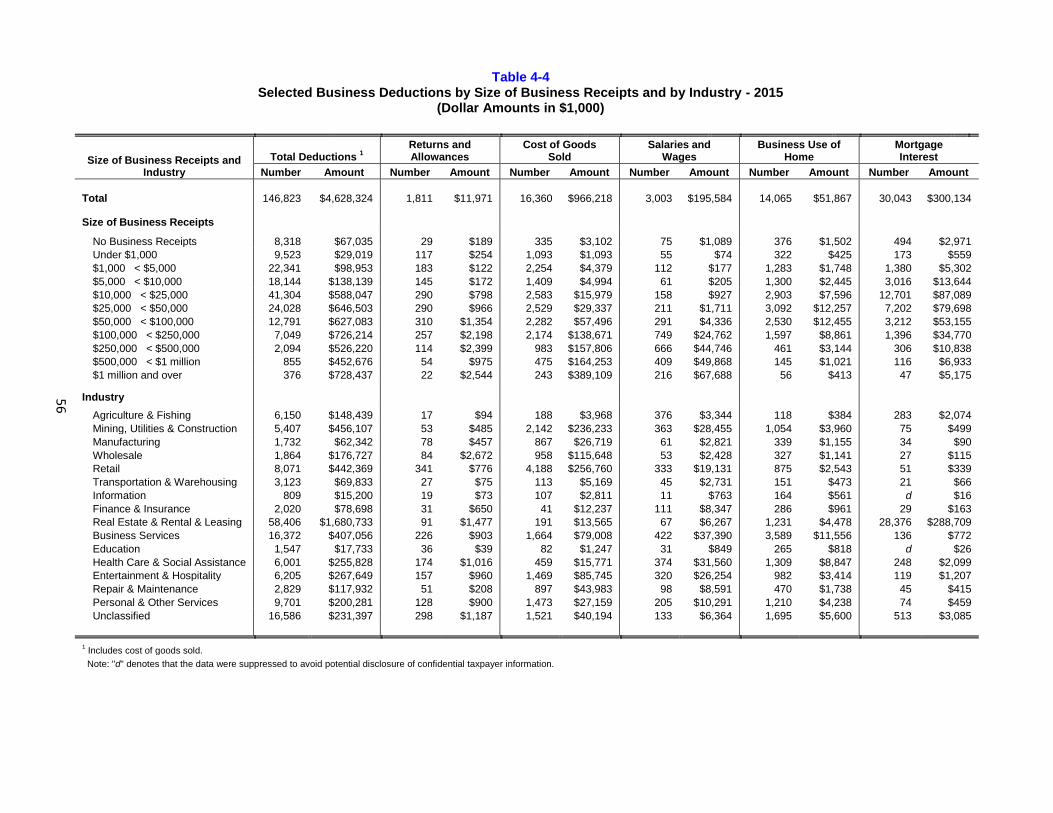
56
Table 4-4 Selected Business Deductions by Size of Business Receipts and by Industry - 2015
(Dollar Amounts in $1,000)
Size of Business Receipts and Industry
Total Deductions 1
Returns and Allowances
Cost of Goods Sold
Salaries and Wages
Business Use of Home
Mortgage Interest
Number Amount Number Amount Number Amount Number Amount Number Amount Number Amount
Total 146,823 $4,628,324 1,811 $11,971 16,360 $966,218 3,003 $195,584 14,065 $51,867 30,043 $300,134
Size of Business Receipts
No Business Receipts 8,318 $67,035 29 $189 335 $3,102 75 $1,089 376 $1,502 494 $2,971
Under $1,000 9,523 $29,019 117 $254 1,093 $1,093 55 $74 322 $425 173 $559
$1,000 < $5,000 22,341 $98,953 183 $122 2,254 $4,379 112 $177 1,283 $1,748 1,380 $5,302
$5,000 < $10,000 18,144 $138,139 145 $172 1,409 $4,994 61 $205 1,300 $2,445 3,016 $13,644
$10,000 < $25,000 41,304 $588,047 290 $798 2,583 $15,979 158 $927 2,903 $7,596 12,701 $87,089
$25,000 < $50,000 24,028 $646,503 290 $966 2,529 $29,337 211 $1,711 3,092 $12,257 7,202 $79,698
$50,000 < $100,000 12,791 $627,083 310 $1,354 2,282 $57,496 291 $4,336 2,530 $12,455 3,212 $53,155
$100,000 < $250,000 7,049 $726,214 257 $2,198 2,174 $138,671 749 $24,762 1,597 $8,861 1,396 $34,770
$250,000 < $500,000 2,094 $526,220 114 $2,399 983 $157,806 666 $44,746 461 $3,144 306 $10,838
$500,000 < $1 million 855 $452,676 54 $975 475 $164,253 409 $49,868 145 $1,021 116 $6,933
$1 million and over 376 $728,437 22 $2,544 243 $389,109 216 $67,688 56 $413 47 $5,175
Industry
Agriculture & Fishing 6,150 $148,439 17 $94 188 $3,968 376 $3,344 118 $384 283 $2,074
Mining, Utilities & Construction 5,407 $456,107 53 $485 2,142 $236,233 363 $28,455 1,054 $3,960 75 $499
Manufacturing 1,732 $62,342 78 $457 867 $26,719 61 $2,821 339 $1,155 34 $90
Wholesale 1,864 $176,727 84 $2,672 958 $115,648 53 $2,428 327 $1,141 27 $115
Retail 8,071 $442,369 341 $776 4,188 $256,760 333 $19,131 875 $2,543 51 $339
Transportation & Warehousing 3,123 $69,833 27 $75 113 $5,169 45 $2,731 151 $473 21 $66
Information 809 $15,200 19 $73 107 $2,811 11 $763 164 $561 d $16
Finance & Insurance 2,020 $78,698 31 $650 41 $12,237 111 $8,347 286 $961 29 $163
Real Estate & Rental & Leasing 58,406 $1,680,733 91 $1,477 191 $13,565 67 $6,267 1,231 $4,478 28,376 $288,709
Business Services 16,372 $407,056 226 $903 1,664 $79,008 422 $37,390 3,589 $11,556 136 $772
Education 1,547 $17,733 36 $39 82 $1,247 31 $849 265 $818 d $26
Health Care & Social Assistance 6,001 $255,828 174 $1,016 459 $15,771 374 $31,560 1,309 $8,847 248 $2,099
Entertainment & Hospitality 6,205 $267,649 157 $960 1,469 $85,745 320 $26,254 982 $3,414 119 $1,207
Repair & Maintenance 2,829 $117,932 51 $208 897 $43,983 98 $8,591 470 $1,738 45 $415
Personal & Other Services 9,701 $200,281 128 $900 1,473 $27,159 205 $10,291 1,210 $4,238 74 $459
Unclassified 16,586 $231,397 298 $1,187 1,521 $40,194 133 $6,364 1,695 $5,600 513 $3,085
1 Includes cost of goods sold.
Note: "d" denotes that the data were suppressed to avoid potential disclosure of confidential taxpayer information.
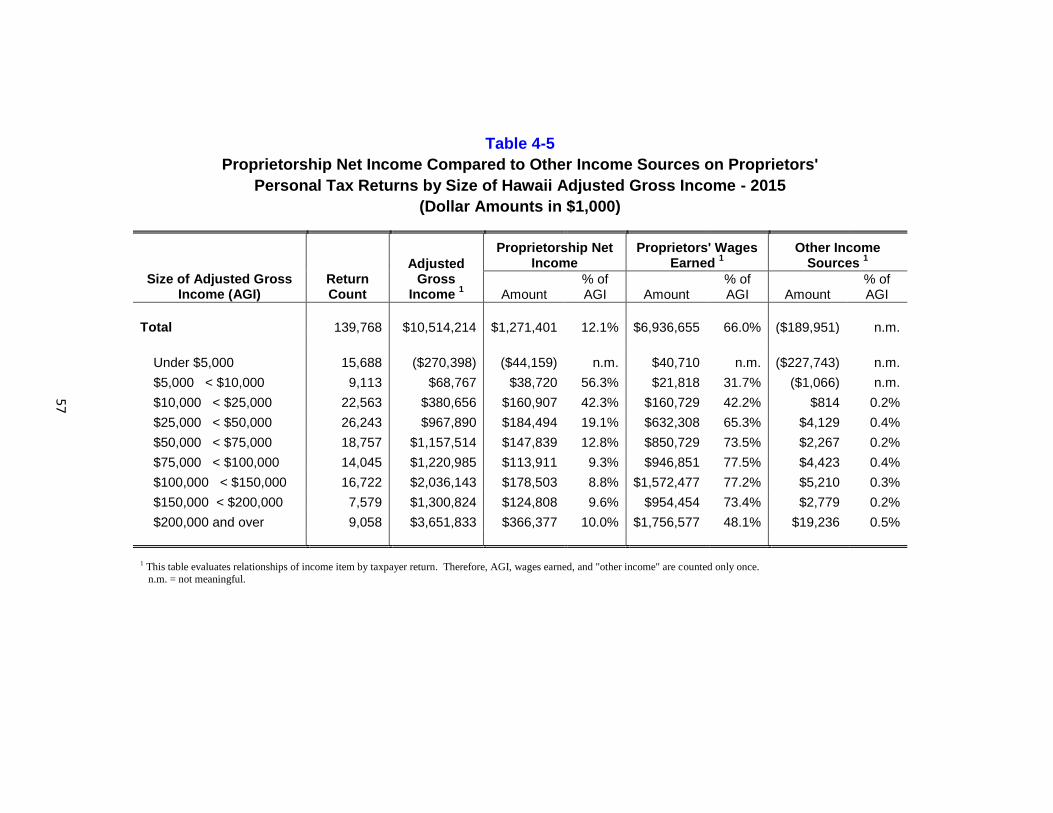
57
Table 4-5
Proprietorship Net Income Compared to Other Income Sources on Proprietors'
Personal Tax Returns by Size of Hawaii Adjusted Gross Income - 2015
(Dollar Amounts in $1,000)
Size of Adjusted Gross Income (AGI)
Return Count
Adjusted Gross
Income 1
Proprietorship Net Income
Proprietors' Wages Earned
1
Other Income Sources
1
Amount % of AGI Amount
% of AGI Amount
% of AGI
Total 139,768 $10,514,214 $1,271,401 12.1% $6,936,655 66.0% ($189,951) n.m.
Under $5,000 15,688 ($270,398) ($44,159) n.m. $40,710 n.m. ($227,743) n.m.
$5,000 < $10,000 9,113 $68,767 $38,720 56.3% $21,818 31.7% ($1,066) n.m.
$10,000 < $25,000 22,563 $380,656 $160,907 42.3% $160,729 42.2% $814 0.2%
$25,000 < $50,000 26,243 $967,890 $184,494 19.1% $632,308 65.3% $4,129 0.4%
$50,000 < $75,000 18,757 $1,157,514 $147,839 12.8% $850,729 73.5% $2,267 0.2%
$75,000 < $100,000 14,045 $1,220,985 $113,911 9.3% $946,851 77.5% $4,423 0.4%
$100,000 < $150,000 16,722 $2,036,143 $178,503 8.8% $1,572,477 77.2% $5,210 0.3%
$150,000 < $200,000 7,579 $1,300,824 $124,808 9.6% $954,454 73.4% $2,779 0.2%
$200,000 and over 9,058 $3,651,833 $366,377 10.0% $1,756,577 48.1% $19,236 0.5%
1 This table evaluates relationships of income item by taxpayer return. Therefore, AGI, wages earned, and "other income" are counted only once.
n.m. = not meaningful.
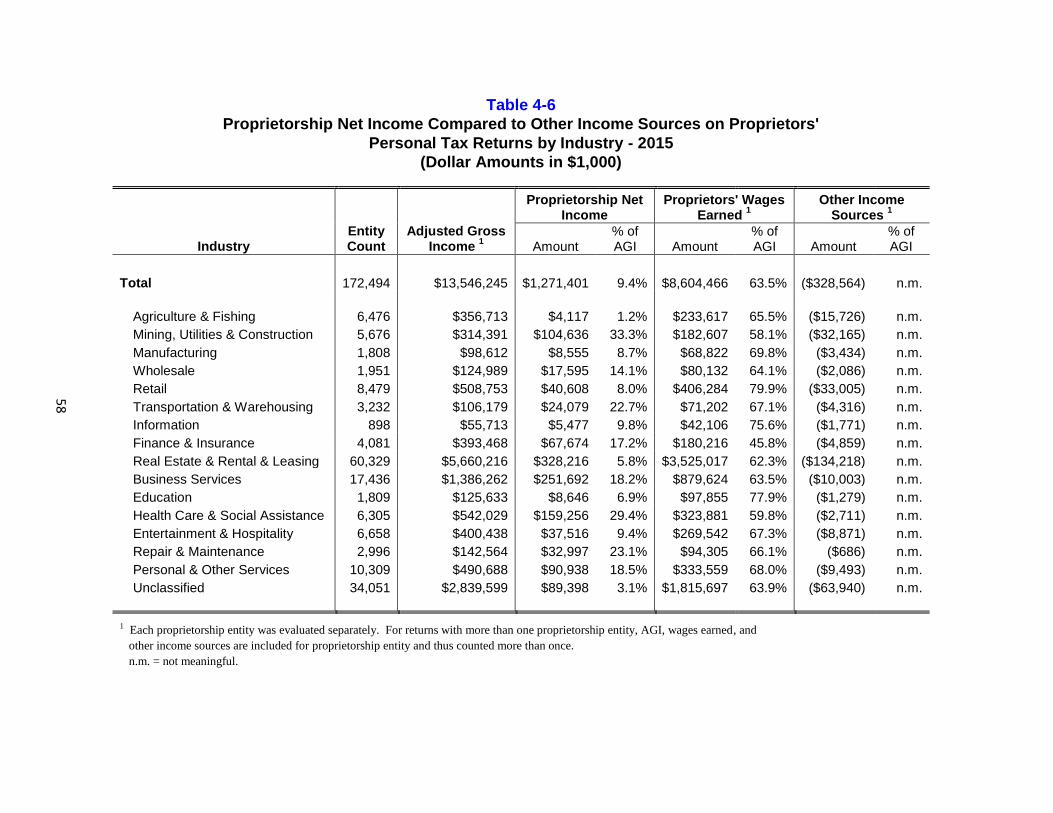
58
Table 4-6
Proprietorship Net Income Compared to Other Income Sources on Proprietors'
Personal Tax Returns by Industry - 2015
(Dollar Amounts in $1,000)
Industry Entity Count
Adjusted Gross Income
1
Proprietorship Net Income
Proprietors' Wages Earned
1
Other Income Sources
1
Amount % of AGI Amount
% of AGI Amount
% of AGI
Total 172,494 $13,546,245 $1,271,401 9.4% $8,604,466 63.5% ($328,564) n.m.
Agriculture & Fishing 6,476 $356,713 $4,117 1.2% $233,617 65.5% ($15,726) n.m.
Mining, Utilities & Construction 5,676 $314,391 $104,636 33.3% $182,607 58.1% ($32,165) n.m.
Manufacturing 1,808 $98,612 $8,555 8.7% $68,822 69.8% ($3,434) n.m.
Wholesale 1,951 $124,989 $17,595 14.1% $80,132 64.1% ($2,086) n.m.
Retail 8,479 $508,753 $40,608 8.0% $406,284 79.9% ($33,005) n.m.
Transportation & Warehousing 3,232 $106,179 $24,079 22.7% $71,202 67.1% ($4,316) n.m.
Information 898 $55,713 $5,477 9.8% $42,106 75.6% ($1,771) n.m.
Finance & Insurance 4,081 $393,468 $67,674 17.2% $180,216 45.8% ($4,859) n.m.
Real Estate & Rental & Leasing 60,329 $5,660,216 $328,216 5.8% $3,525,017 62.3% ($134,218) n.m.
Business Services 17,436 $1,386,262 $251,692 18.2% $879,624 63.5% ($10,003) n.m.
Education 1,809 $125,633 $8,646 6.9% $97,855 77.9% ($1,279) n.m.
Health Care & Social Assistance 6,305 $542,029 $159,256 29.4% $323,881 59.8% ($2,711) n.m.
Entertainment & Hospitality 6,658 $400,438 $37,516 9.4% $269,542 67.3% ($8,871) n.m.
Repair & Maintenance 2,996 $142,564 $32,997 23.1% $94,305 66.1% ($686) n.m.
Personal & Other Services 10,309 $490,688 $90,938 18.5% $333,559 68.0% ($9,493) n.m.
Unclassified 34,051 $2,839,599 $89,398 3.1% $1,815,697 63.9% ($63,940) n.m.
1 Each proprietorship entity was evaluated separately. For returns with more than one proprietorship entity, AGI, wages earned, and
other income sources are included for proprietorship entity and thus counted more than once.
n.m. = not meaningful.
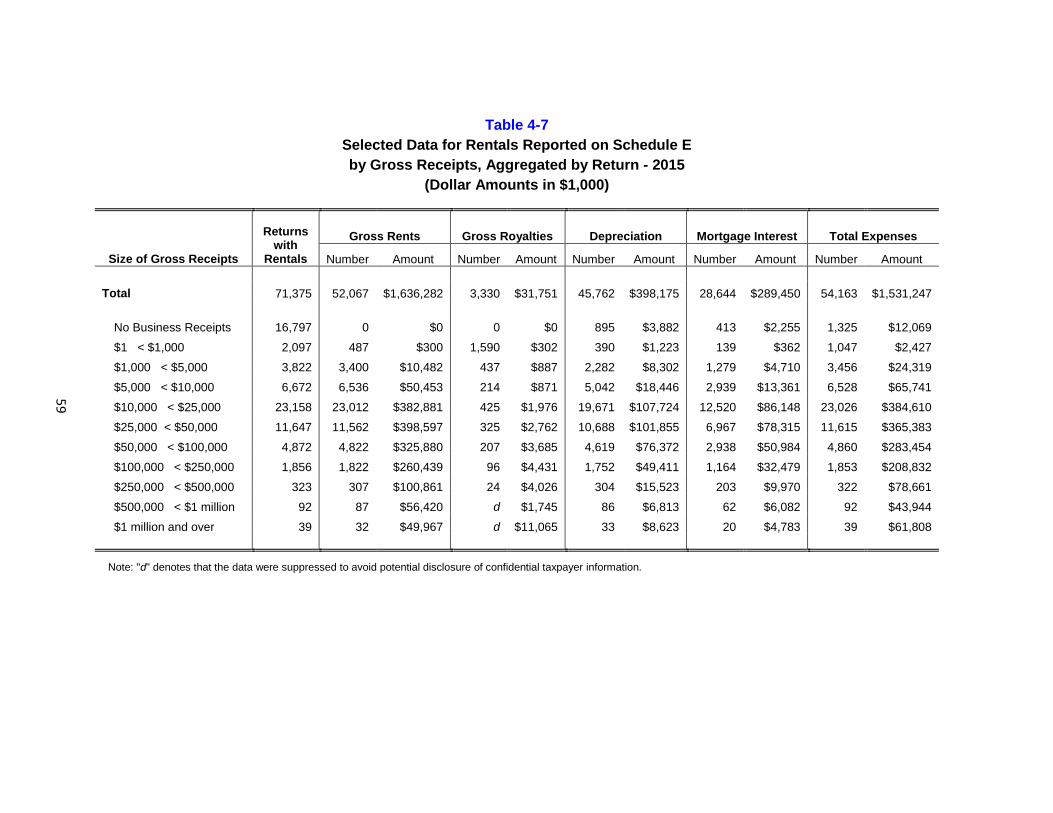
59
Table 4-7
Selected Data for Rentals Reported on Schedule E
by Gross Receipts, Aggregated by Return - 2015
(Dollar Amounts in $1,000)
Size of Gross Receipts
Returns with
Rentals
Gross Rents Gross Royalties Depreciation Mortgage Interest Total Expenses
Number Amount Number Amount Number Amount Number Amount Number Amount
Total 71,375 52,067 $1,636,282 3,330 $31,751 45,762 $398,175 28,644 $289,450 54,163 $1,531,247
No Business Receipts 16,797 0 $0 0 $0 895 $3,882 413 $2,255 1,325 $12,069
$1 < $1,000 2,097 487 $300 1,590 $302 390 $1,223 139 $362 1,047 $2,427
$1,000 < $5,000 3,822 3,400 $10,482 437 $887 2,282 $8,302 1,279 $4,710 3,456 $24,319
$5,000 < $10,000 6,672 6,536 $50,453 214 $871 5,042 $18,446 2,939 $13,361 6,528 $65,741
$10,000 < $25,000 23,158 23,012 $382,881 425 $1,976 19,671 $107,724 12,520 $86,148 23,026 $384,610
$25,000 < $50,000 11,647 11,562 $398,597 325 $2,762 10,688 $101,855 6,967 $78,315 11,615 $365,383
$50,000 < $100,000 4,872 4,822 $325,880 207 $3,685 4,619 $76,372 2,938 $50,984 4,860 $283,454
$100,000 < $250,000 1,856 1,822 $260,439 96 $4,431 1,752 $49,411 1,164 $32,479 1,853 $208,832
$250,000 < $500,000 323 307 $100,861 24 $4,026 304 $15,523 203 $9,970 322 $78,661
$500,000 < $1 million 92 87 $56,420 d $1,745 86 $6,813 62 $6,082 92 $43,944
$1 million and over 39 32 $49,967 d $11,065 33 $8,623 20 $4,783 39 $61,808
Note: "d" denotes that the data were suppressed to avoid potential disclosure of confidential taxpayer information.
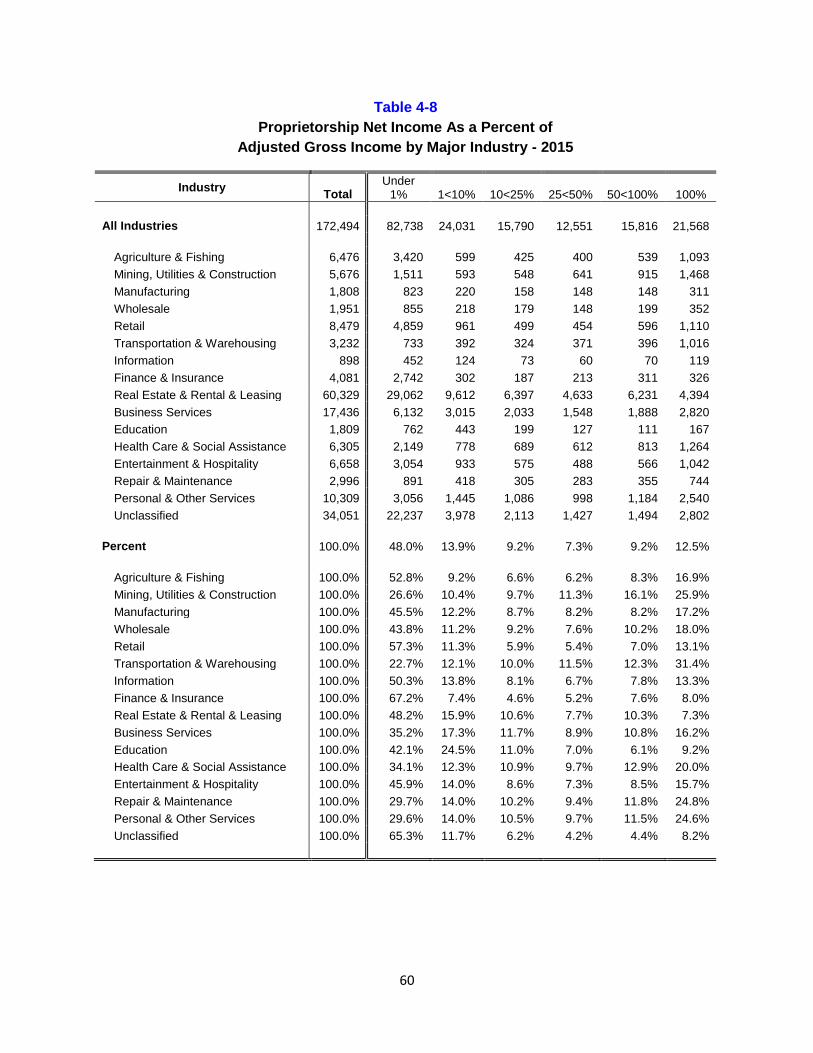
60
Table 4-8
Proprietorship Net Income As a Percent of
Adjusted Gross Income by Major Industry - 2015
Industry Total
Under 1% 1<10% 10<25% 25<50% 50<100% 100%
All Industries 172,494 82,738 24,031 15,790 12,551 15,816 21,568
Agriculture & Fishing 6,476 3,420 599 425 400 539 1,093
Mining, Utilities & Construction 5,676 1,511 593 548 641 915 1,468
Manufacturing 1,808 823 220 158 148 148 311
Wholesale 1,951 855 218 179 148 199 352
Retail 8,479 4,859 961 499 454 596 1,110
Transportation & Warehousing 3,232 733 392 324 371 396 1,016
Information 898 452 124 73 60 70 119
Finance & Insurance 4,081 2,742 302 187 213 311 326
Real Estate & Rental & Leasing 60,329 29,062 9,612 6,397 4,633 6,231 4,394
Business Services 17,436 6,132 3,015 2,033 1,548 1,888 2,820
Education 1,809 762 443 199 127 111 167
Health Care & Social Assistance 6,305 2,149 778 689 612 813 1,264
Entertainment & Hospitality 6,658 3,054 933 575 488 566 1,042
Repair & Maintenance 2,996 891 418 305 283 355 744
Personal & Other Services 10,309 3,056 1,445 1,086 998 1,184 2,540
Unclassified 34,051 22,237 3,978 2,113 1,427 1,494 2,802
Percent 100.0% 48.0% 13.9% 9.2% 7.3% 9.2% 12.5%
Agriculture & Fishing 100.0% 52.8% 9.2% 6.6% 6.2% 8.3% 16.9%
Mining, Utilities & Construction 100.0% 26.6% 10.4% 9.7% 11.3% 16.1% 25.9%
Manufacturing 100.0% 45.5% 12.2% 8.7% 8.2% 8.2% 17.2%
Wholesale 100.0% 43.8% 11.2% 9.2% 7.6% 10.2% 18.0%
Retail 100.0% 57.3% 11.3% 5.9% 5.4% 7.0% 13.1%
Transportation & Warehousing 100.0% 22.7% 12.1% 10.0% 11.5% 12.3% 31.4%
Information 100.0% 50.3% 13.8% 8.1% 6.7% 7.8% 13.3%
Finance & Insurance 100.0% 67.2% 7.4% 4.6% 5.2% 7.6% 8.0%
Real Estate & Rental & Leasing 100.0% 48.2% 15.9% 10.6% 7.7% 10.3% 7.3%
Business Services 100.0% 35.2% 17.3% 11.7% 8.9% 10.8% 16.2%
Education 100.0% 42.1% 24.5% 11.0% 7.0% 6.1% 9.2%
Health Care & Social Assistance 100.0% 34.1% 12.3% 10.9% 9.7% 12.9% 20.0%
Entertainment & Hospitality 100.0% 45.9% 14.0% 8.6% 7.3% 8.5% 15.7%
Repair & Maintenance 100.0% 29.7% 14.0% 10.2% 9.4% 11.8% 24.8%
Personal & Other Services 100.0% 29.6% 14.0% 10.5% 9.7% 11.5% 24.6%
Unclassified 100.0% 65.3% 11.7% 6.2% 4.2% 4.4% 8.2%
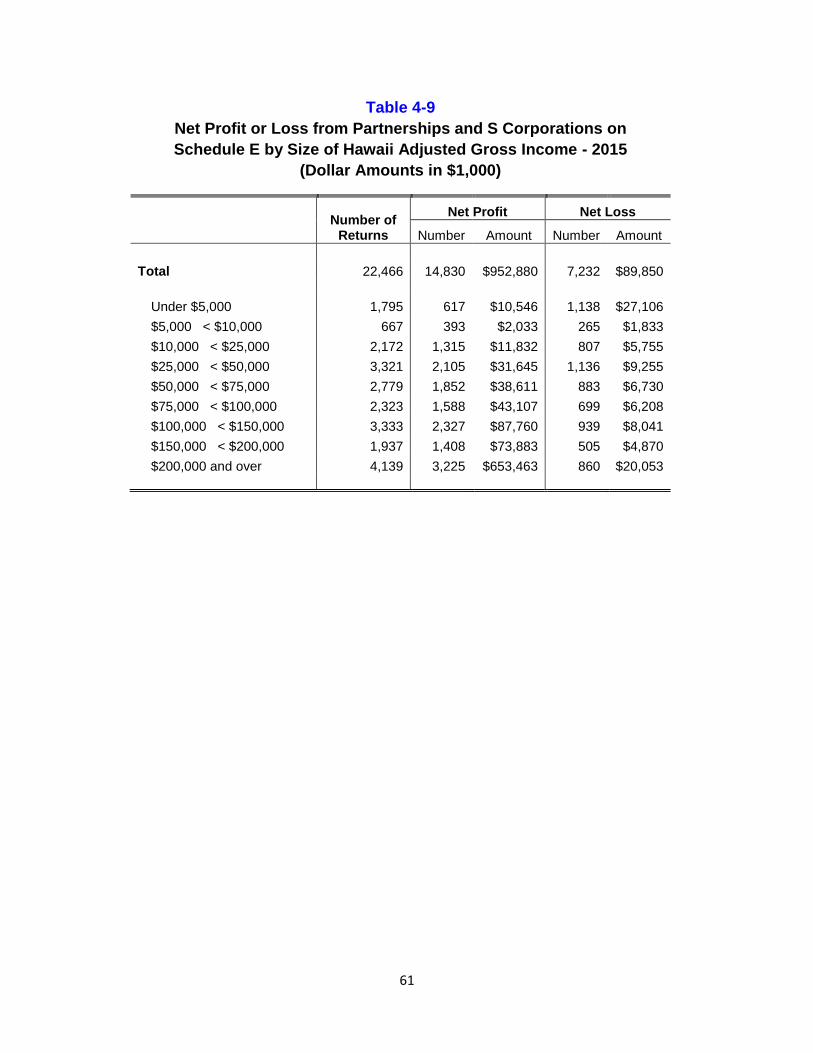
61
Table 4-9
Net Profit or Loss from Partnerships and S Corporations on
Schedule E by Size of Hawaii Adjusted Gross Income - 2015
(Dollar Amounts in $1,000)
Number of Returns
Net Profit Net Loss
Number Amount Number Amount
Total 22,466 14,830 $952,880 7,232 $89,850
Under $5,000 1,795 617 $10,546 1,138 $27,106
$5,000 < $10,000 667 393 $2,033 265 $1,833
$10,000 < $25,000 2,172 1,315 $11,832 807 $5,755
$25,000 < $50,000 3,321 2,105 $31,645 1,136 $9,255
$50,000 < $75,000 2,779 1,852 $38,611 883 $6,730
$75,000 < $100,000 2,323 1,588 $43,107 699 $6,208
$100,000 < $150,000 3,333 2,327 $87,760 939 $8,041
$150,000 < $200,000 1,937 1,408 $73,883 505 $4,870
$200,000 and over 4,139 3,225 $653,463 860 $20,053
Tax Credits Claimed by Hawaii Taxpayers
Tax Year 2015
Department of Taxation
State of Hawaii
STATE OF HAWAII
David Y. Ige, Governor
DEPARTMENT OF TAXATION
Maria E. Zielinski, Director
Damien A. Elefante, Deputy Director
TAX RESEARCH & PLANNING
Seth Colby, Tax Research & Planning Officer
Dongliang Wu, Research Statistician
Tax Credits Claimed by Hawaii Taxpayers
Tax Year 2015
Department of Taxation State of Hawaii
December 2017
Prepared by Tax Research and Planning Office
Web Site: tax.hawaii.gov
TABLE OF CONTENTS
TAX CREDITS CLAIMED BY HAWAII TAXPAYERS – TAX YEAR 2015
Page
INTRODUCTION ...................................................................................................................... 1
DATA SOURCE AND METHODOLOGY .................................................................................. 3
OVERVIEW AND SUMMARY OF RESULTS ........................................................................... 5
DESCRIPTIONS AND ANALYSES OF THE TAX CREDITS ...................................................11
Active Tax Credits
Tax Credits to Promote Social Welfare
Refundable Food/Excise Tax Credit .............................................................................12
Tax Credit for Low-Income Household Renters ............................................................13
Tax Credit for Child and Dependent Care Expenses ....................................................13
Tax Credit for Child Passenger Restraint Systems .......................................................14
Tax Credit for Employment of Vocational Rehabilitation Referrals ................................14
Low-Income Housing Tax Credit...................................................................................15
Tax Credit for School Repair and Maintenance ............................................................15
Lifeline Telephone Service Tax Credit ..........................................................................15
Tax Credits to Encourage Certain Industries or Economic Activities
Fuel Tax Credit for Commercial Fishers .......................................................................16
Motion Picture, Digital Media and Film Production Income Tax Credit ..........................16
Renewable Energy Technologies Income Tax Credit ...................................................16
Enterprise Zone Tax Credit ...........................................................................................19
Ethanol Facility Tax Credit ............................................................................................19
Important Agricultural Land Tax Credit .........................................................................19
Tax Credit for Research Activities .................................................................................20
Capital Infrastructure Tax Credit ...................................................................................20
Tax Credits to Avoid Double Taxation or Pyramiding of Hawaii Taxes
Capital Goods Excise Tax Credit ..................................................................................20
Income Tax Paid to Another State or Foreign Country ..................................................21
Expired Tax Credits
Tax Credits to Promote Social Welfare
Individual Development Account Contribution Tax Credit .............................................21
Tax Credits to Encourage Certain Industries or Activities
High Technology Business Investment Tax Credit ........................................................21
Energy Conservation Tax Credit ...................................................................................22
Hotel Construction and Remodeling Tax Credit ............................................................23
Technology Infrastructure Renovation Tax Credit .........................................................23
Residential Construction and Remodeling Tax Credit ...................................................23
APPENDIX A – STATISTICAL TABLES
Page
TABLE
A-1 Dollar Amounts of Tax Credits Claimed by Type of Credit and
Type of Taxpayer ............................................................................................... 27
A-2 Number of Returns Claiming Tax Credits by Type of Credit and
Type of Taxpayer ............................................................................................... 28
A-3 Dollar Amounts of Tax Credits Claimed by Individuals by Tax District .............. 29
A-4 Number of Individual Income Tax Returns with Claims for Tax Credits
by Type of Credit and Tax District ..................................................................... 30
A-5 Dollar Amounts of Tax Credits Claimed by Individuals by Type
of Credit and Income Class ............................................................................... 31
A-6 Number of Individual Income Tax Returns with Claims for Tax
Credits by Type of Credit and Income Class ..................................................... 32
APPENDIX B – TAX CREDIT HISTORY
TABLE
B-1 Number and Type of Credits Available by Tax Years (1965-2015).................... 35
B-2 Outline of Tax Credit History by Year of Enactment .......................................... 37
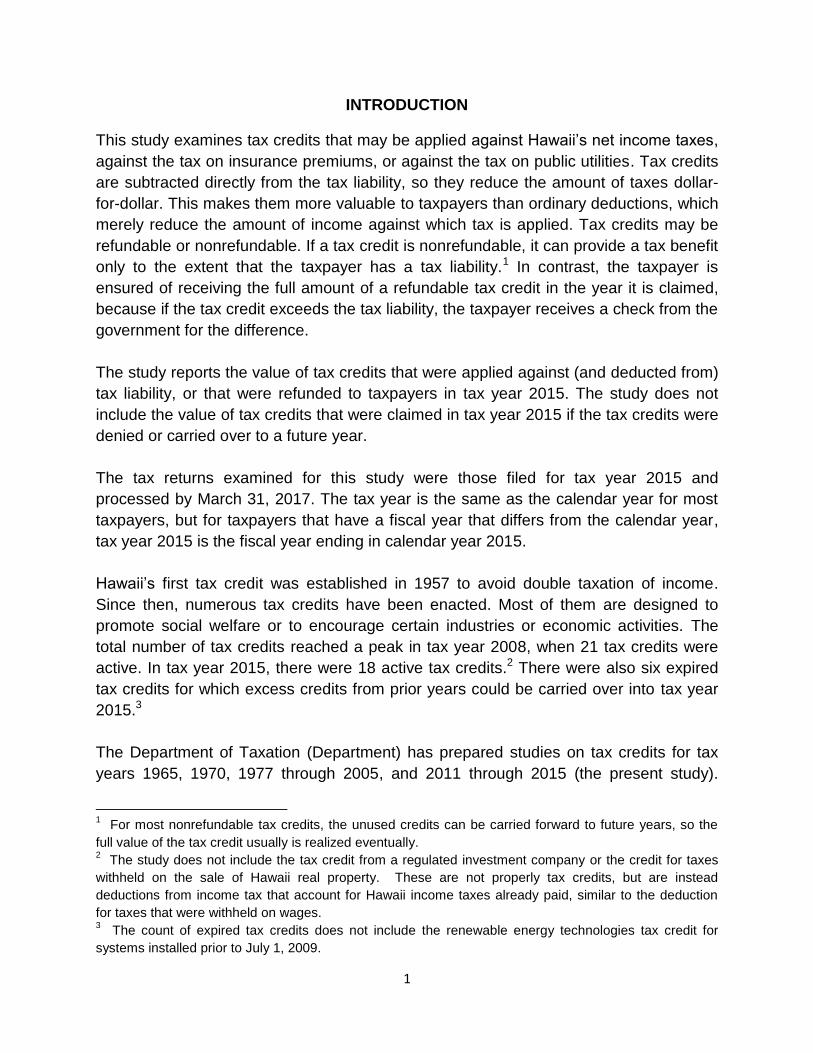
1
INTRODUCTION
This study examines tax credits that may be applied against Hawaii’s net income taxes,
against the tax on insurance premiums, or against the tax on public utilities. Tax credits
are subtracted directly from the tax liability, so they reduce the amount of taxes dollar-
for-dollar. This makes them more valuable to taxpayers than ordinary deductions, which
merely reduce the amount of income against which tax is applied. Tax credits may be
refundable or nonrefundable. If a tax credit is nonrefundable, it can provide a tax benefit
only to the extent that the taxpayer has a tax liability.1 In contrast, the taxpayer is
ensured of receiving the full amount of a refundable tax credit in the year it is claimed,
because if the tax credit exceeds the tax liability, the taxpayer receives a check from the
government for the difference.
The study reports the value of tax credits that were applied against (and deducted from)
tax liability, or that were refunded to taxpayers in tax year 2015. The study does not
include the value of tax credits that were claimed in tax year 2015 if the tax credits were
denied or carried over to a future year.
The tax returns examined for this study were those filed for tax year 2015 and
processed by March 31, 2017. The tax year is the same as the calendar year for most
taxpayers, but for taxpayers that have a fiscal year that differs from the calendar year,
tax year 2015 is the fiscal year ending in calendar year 2015.
Hawaii’s first tax credit was established in 1957 to avoid double taxation of income.
Since then, numerous tax credits have been enacted. Most of them are designed to
promote social welfare or to encourage certain industries or economic activities. The
total number of tax credits reached a peak in tax year 2008, when 21 tax credits were
active. In tax year 2015, there were 18 active tax credits.2 There were also six expired
tax credits for which excess credits from prior years could be carried over into tax year
2015.3
The Department of Taxation (Department) has prepared studies on tax credits for tax
years 1965, 1970, 1977 through 2005, and 2011 through 2015 (the present study).
1 For most nonrefundable tax credits, the unused credits can be carried forward to future years, so the
full value of the tax credit usually is realized eventually. 2 The study does not include the tax credit from a regulated investment company or the credit for taxes
withheld on the sale of Hawaii real property. These are not properly tax credits, but are instead
deductions from income tax that account for Hawaii income taxes already paid, similar to the deduction
for taxes that were withheld on wages. 3 The count of expired tax credits does not include the renewable energy technologies tax credit for
systems installed prior to July 1, 2009.
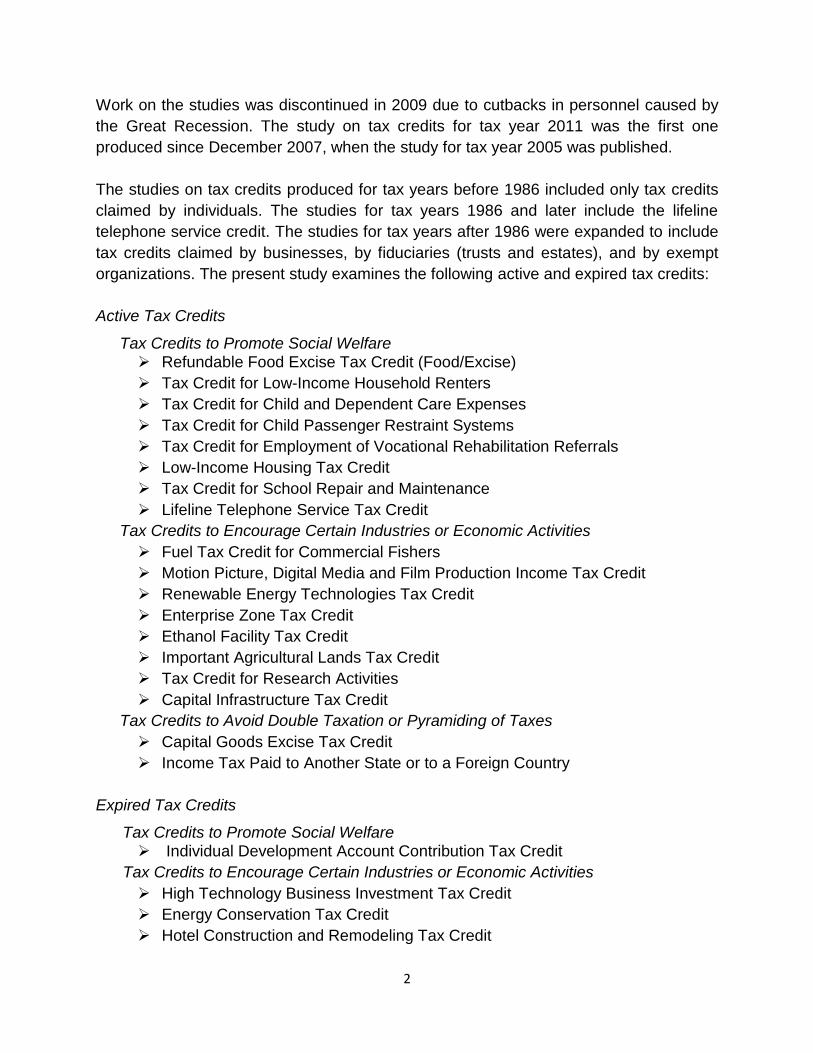
2
Work on the studies was discontinued in 2009 due to cutbacks in personnel caused by
the Great Recession. The study on tax credits for tax year 2011 was the first one
produced since December 2007, when the study for tax year 2005 was published.
The studies on tax credits produced for tax years before 1986 included only tax credits
claimed by individuals. The studies for tax years 1986 and later include the lifeline
telephone service credit. The studies for tax years after 1986 were expanded to include
tax credits claimed by businesses, by fiduciaries (trusts and estates), and by exempt
organizations. The present study examines the following active and expired tax credits:
Active Tax Credits
Tax Credits to Promote Social Welfare Refundable Food Excise Tax Credit (Food/Excise)
Tax Credit for Low-Income Household Renters
Tax Credit for Child and Dependent Care Expenses
Tax Credit for Child Passenger Restraint Systems
Tax Credit for Employment of Vocational Rehabilitation Referrals
Low-Income Housing Tax Credit
Tax Credit for School Repair and Maintenance
Lifeline Telephone Service Tax Credit
Tax Credits to Encourage Certain Industries or Economic Activities
Fuel Tax Credit for Commercial Fishers
Motion Picture, Digital Media and Film Production Income Tax Credit
Renewable Energy Technologies Tax Credit
Enterprise Zone Tax Credit
Ethanol Facility Tax Credit
Important Agricultural Lands Tax Credit
Tax Credit for Research Activities
Capital Infrastructure Tax Credit
Tax Credits to Avoid Double Taxation or Pyramiding of Taxes
Capital Goods Excise Tax Credit
Income Tax Paid to Another State or to a Foreign Country
Expired Tax Credits
Tax Credits to Promote Social Welfare Individual Development Account Contribution Tax Credit
Tax Credits to Encourage Certain Industries or Economic Activities
High Technology Business Investment Tax Credit
Energy Conservation Tax Credit
Hotel Construction and Remodeling Tax Credit
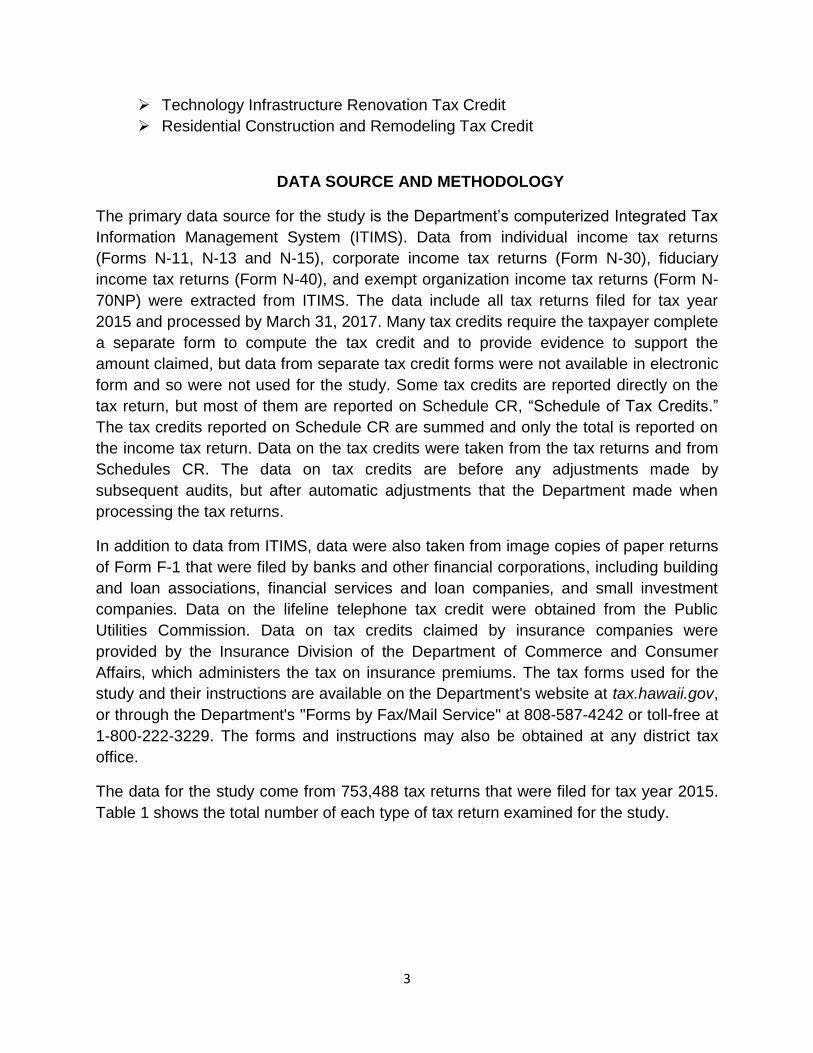
3
Technology Infrastructure Renovation Tax Credit
Residential Construction and Remodeling Tax Credit
DATA SOURCE AND METHODOLOGY
The primary data source for the study is the Department’s computerized Integrated Tax
Information Management System (ITIMS). Data from individual income tax returns
(Forms N-11, N-13 and N-15), corporate income tax returns (Form N-30), fiduciary
income tax returns (Form N-40), and exempt organization income tax returns (Form N-
70NP) were extracted from ITIMS. The data include all tax returns filed for tax year
2015 and processed by March 31, 2017. Many tax credits require the taxpayer complete
a separate form to compute the tax credit and to provide evidence to support the
amount claimed, but data from separate tax credit forms were not available in electronic
form and so were not used for the study. Some tax credits are reported directly on the
tax return, but most of them are reported on Schedule CR, “Schedule of Tax Credits.”
The tax credits reported on Schedule CR are summed and only the total is reported on
the income tax return. Data on the tax credits were taken from the tax returns and from
Schedules CR. The data on tax credits are before any adjustments made by
subsequent audits, but after automatic adjustments that the Department made when
processing the tax returns.
In addition to data from ITIMS, data were also taken from image copies of paper returns
of Form F-1 that were filed by banks and other financial corporations, including building
and loan associations, financial services and loan companies, and small investment
companies. Data on the lifeline telephone tax credit were obtained from the Public
Utilities Commission. Data on tax credits claimed by insurance companies were
provided by the Insurance Division of the Department of Commerce and Consumer
Affairs, which administers the tax on insurance premiums. The tax forms used for the
study and their instructions are available on the Department's website at tax.hawaii.gov,
or through the Department's "Forms by Fax/Mail Service" at 808-587-4242 or toll-free at
1-800-222-3229. The forms and instructions may also be obtained at any district tax
office.
The data for the study come from 753,488 tax returns that were filed for tax year 2015.
Table 1 shows the total number of each type of tax return examined for the study.
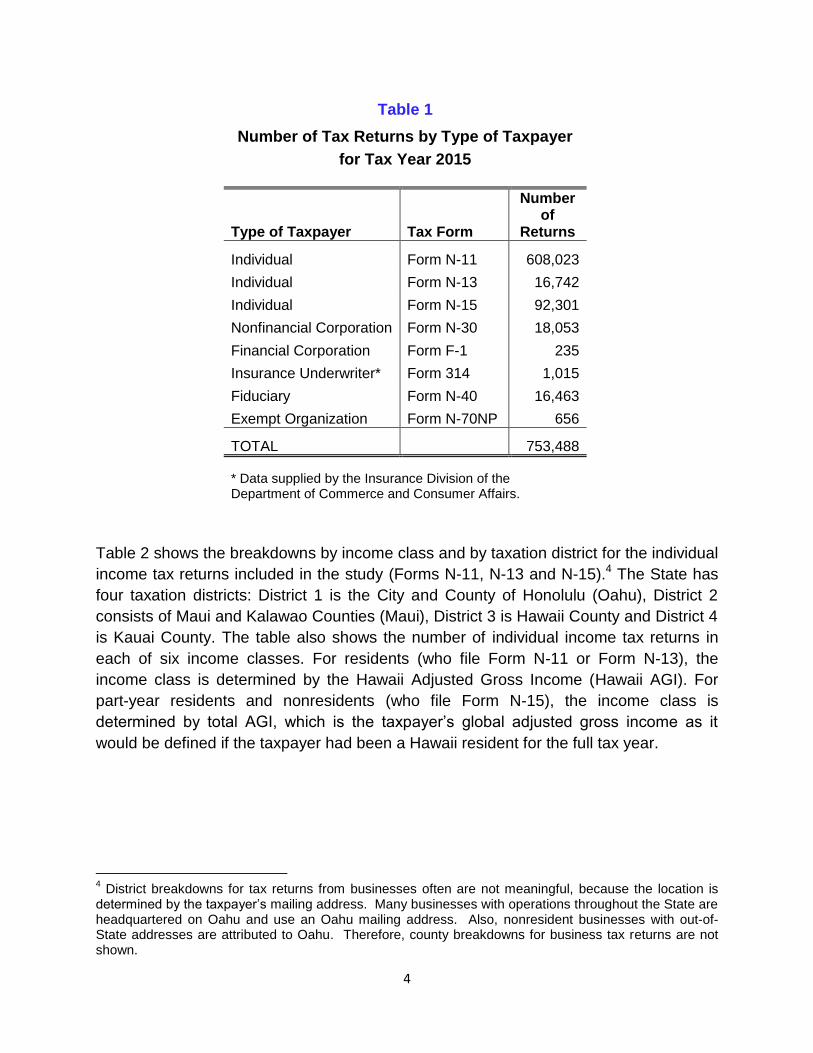
4
Table 1
Number of Tax Returns by Type of Taxpayer
for Tax Year 2015
Type of Taxpayer Tax Form
Number of
Returns
Individual Form N-11 608,023
Individual Form N-13 16,742
Individual Form N-15 92,301
Nonfinancial Corporation Form N-30 18,053
Financial Corporation Form F-1 235
Insurance Underwriter* Form 314 1,015
Fiduciary Form N-40 16,463
Exempt Organization Form N-70NP 656
TOTAL 753,488
* Data supplied by the Insurance Division of the Department of Commerce and Consumer Affairs.
Table 2 shows the breakdowns by income class and by taxation district for the individual
income tax returns included in the study (Forms N-11, N-13 and N-15).4 The State has
four taxation districts: District 1 is the City and County of Honolulu (Oahu), District 2
consists of Maui and Kalawao Counties (Maui), District 3 is Hawaii County and District 4
is Kauai County. The table also shows the number of individual income tax returns in
each of six income classes. For residents (who file Form N-11 or Form N-13), the
income class is determined by the Hawaii Adjusted Gross Income (Hawaii AGI). For
part-year residents and nonresidents (who file Form N-15), the income class is
determined by total AGI, which is the taxpayer’s global adjusted gross income as it
would be defined if the taxpayer had been a Hawaii resident for the full tax year.
4 District breakdowns for tax returns from businesses often are not meaningful, because the location is
determined by the taxpayer’s mailing address. Many businesses with operations throughout the State are headquartered on Oahu and use an Oahu mailing address. Also, nonresident businesses with out-of-State addresses are attributed to Oahu. Therefore, county breakdowns for business tax returns are not shown.
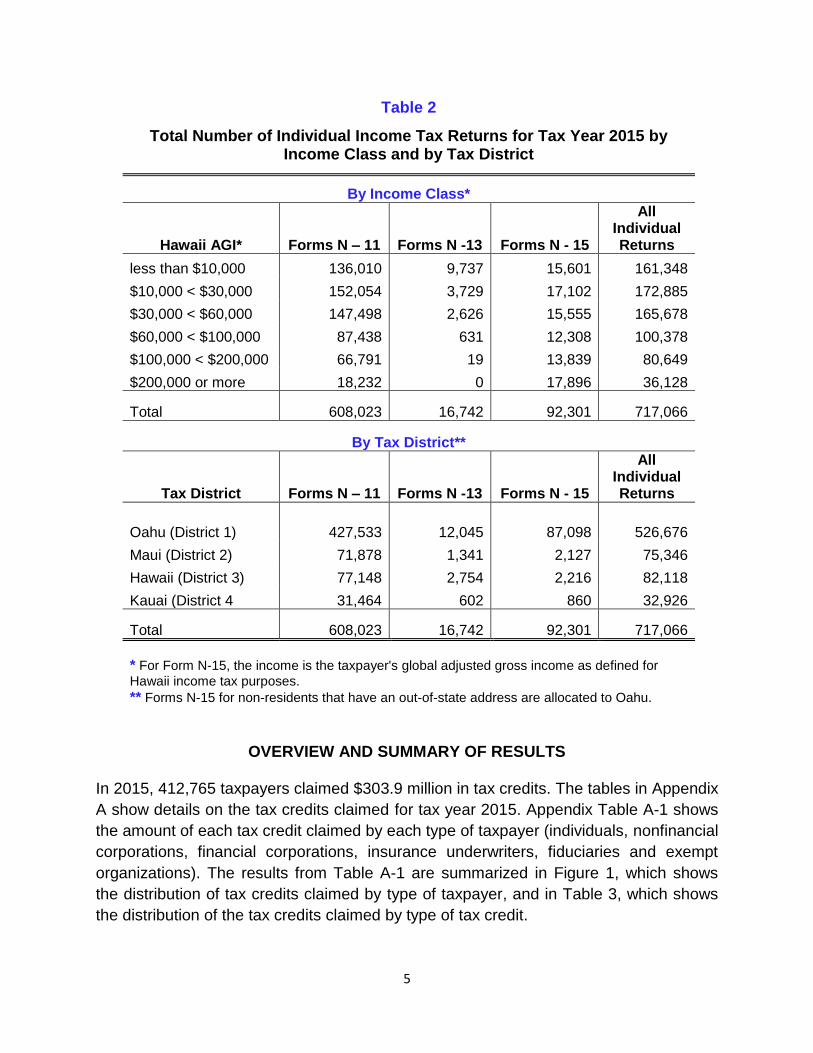
5
Table 2
Total Number of Individual Income Tax Returns for Tax Year 2015 by Income Class and by Tax District
By Income Class*
Hawaii AGI* Forms N – 11 Forms N -13 Forms N - 15
All Individual Returns
less than $10,000 136,010 9,737 15,601 161,348
$10,000 < $30,000 152,054 3,729 17,102 172,885
$30,000 < $60,000 147,498 2,626 15,555 165,678
$60,000 < $100,000 87,438 631 12,308 100,378
$100,000 < $200,000 66,791 19 13,839 80,649
$200,000 or more 18,232 0 17,896 36,128
Total 608,023 16,742 92,301 717,066
By Tax District**
Tax District Forms N – 11 Forms N -13 Forms N - 15
All Individual Returns
Oahu (District 1) 427,533 12,045 87,098 526,676
Maui (District 2) 71,878 1,341 2,127 75,346
Hawaii (District 3) 77,148 2,754 2,216 82,118
Kauai (District 4 31,464 602 860 32,926
Total 608,023 16,742 92,301 717,066
* For Form N-15, the income is the taxpayer's global adjusted gross income as defined for
Hawaii income tax purposes.
** Forms N-15 for non-residents that have an out-of-state address are allocated to Oahu.
OVERVIEW AND SUMMARY OF RESULTS In 2015, 412,765 taxpayers claimed $303.9 million in tax credits. The tables in Appendix
A show details on the tax credits claimed for tax year 2015. Appendix Table A-1 shows
the amount of each tax credit claimed by each type of taxpayer (individuals, nonfinancial
corporations, financial corporations, insurance underwriters, fiduciaries and exempt
organizations). The results from Table A-1 are summarized in Figure 1, which shows
the distribution of tax credits claimed by type of taxpayer, and in Table 3, which shows
the distribution of the tax credits claimed by type of tax credit.
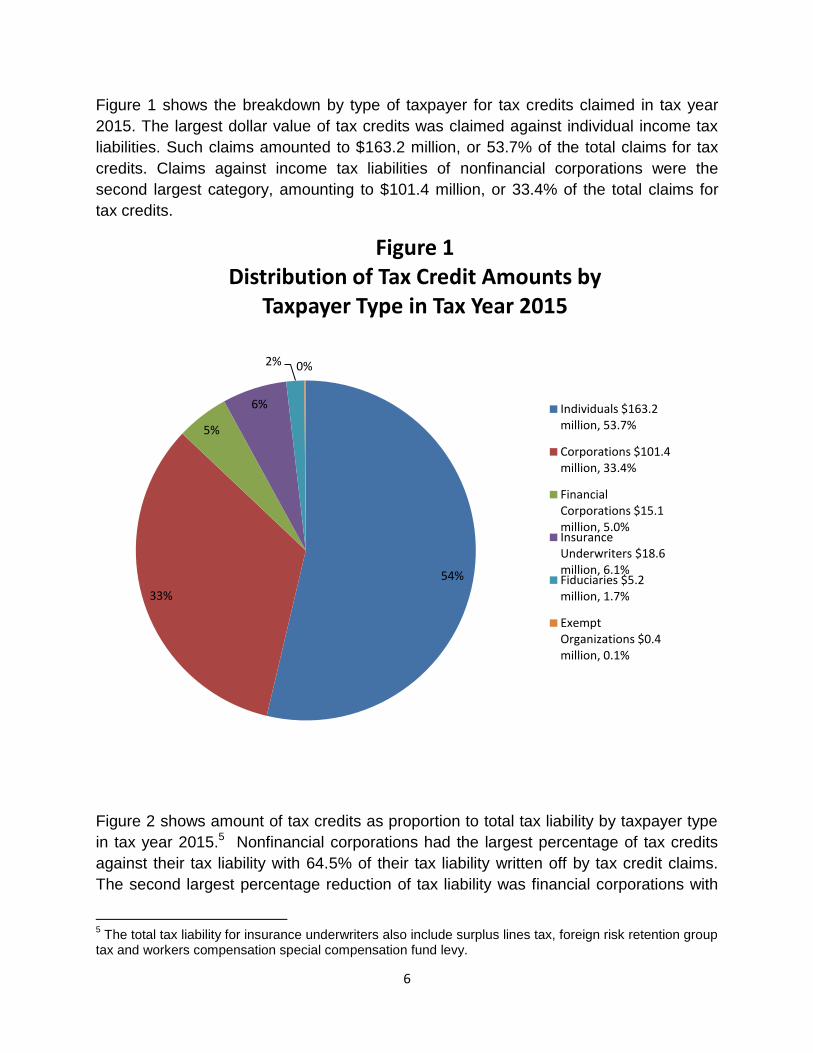
6
Figure 1 shows the breakdown by type of taxpayer for tax credits claimed in tax year
2015. The largest dollar value of tax credits was claimed against individual income tax
liabilities. Such claims amounted to $163.2 million, or 53.7% of the total claims for tax
credits. Claims against income tax liabilities of nonfinancial corporations were the
second largest category, amounting to $101.4 million, or 33.4% of the total claims for
tax credits.
Figure 2 shows amount of tax credits as proportion to total tax liability by taxpayer type
in tax year 2015.5 Nonfinancial corporations had the largest percentage of tax credits
against their tax liability with 64.5% of their tax liability written off by tax credit claims.
The second largest percentage reduction of tax liability was financial corporations with
5 The total tax liability for insurance underwriters also include surplus lines tax, foreign risk retention group
tax and workers compensation special compensation fund levy.
54%
33%
5%
6%
2% 0%
Figure 1 Distribution of Tax Credit Amounts by
Taxpayer Type in Tax Year 2015
Individuals $163.2 million, 53.7%
Corporations $101.4 million, 33.4%
Financial Corporations $15.1 million, 5.0% Insurance Underwriters $18.6 million, 6.1% Fiduciaries $5.2 million, 1.7%
Exempt Organizations $0.4 million, 0.1%
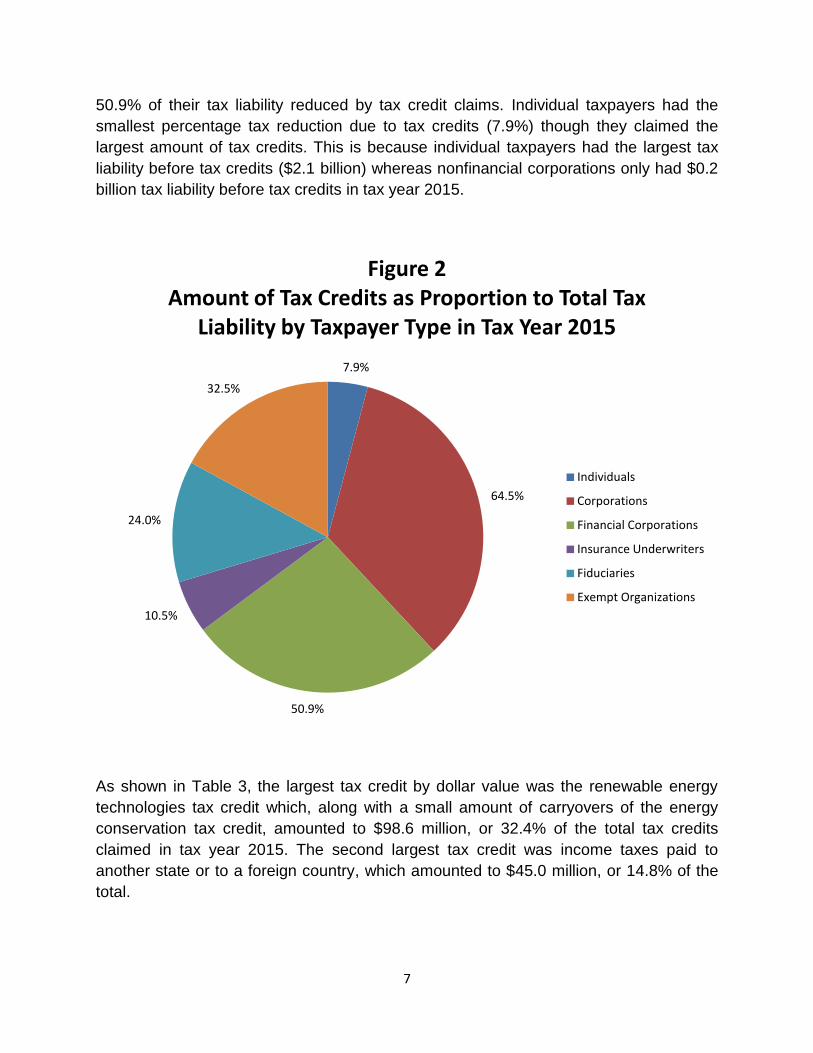
7
50.9% of their tax liability reduced by tax credit claims. Individual taxpayers had the
smallest percentage tax reduction due to tax credits (7.9%) though they claimed the
largest amount of tax credits. This is because individual taxpayers had the largest tax
liability before tax credits ($2.1 billion) whereas nonfinancial corporations only had $0.2
billion tax liability before tax credits in tax year 2015.
As shown in Table 3, the largest tax credit by dollar value was the renewable energy
technologies tax credit which, along with a small amount of carryovers of the energy
conservation tax credit, amounted to $98.6 million, or 32.4% of the total tax credits
claimed in tax year 2015. The second largest tax credit was income taxes paid to
another state or to a foreign country, which amounted to $45.0 million, or 14.8% of the
total.
7.9%
64.5%
50.9%
10.5%
24.0%
32.5%
Figure 2 Amount of Tax Credits as Proportion to Total Tax
Liability by Taxpayer Type in Tax Year 2015
Individuals
Corporations
Financial Corporations
Insurance Underwriters
Fiduciaries
Exempt Organizations
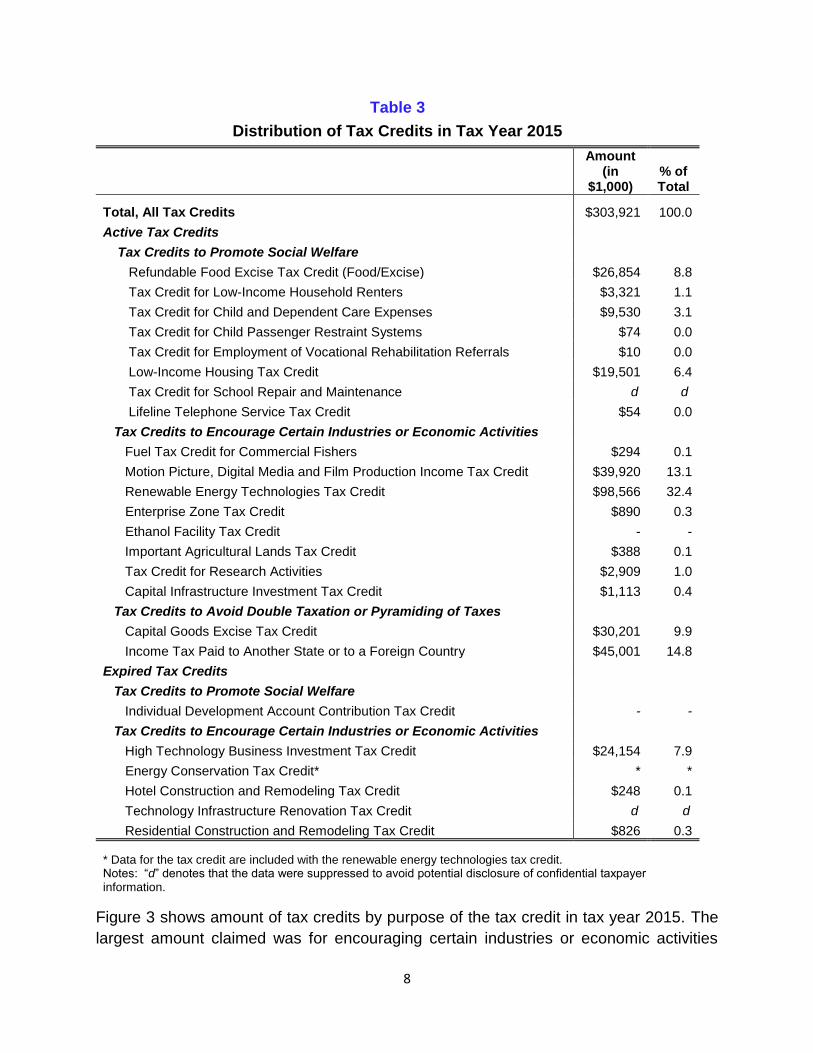
8
Table 3
Distribution of Tax Credits in Tax Year 2015
Amount (in
$1,000) % of Total
Total, All Tax Credits $303,921 100.0
Active Tax Credits
Tax Credits to Promote Social Welfare
Refundable Food Excise Tax Credit (Food/Excise) $26,854 8.8
Tax Credit for Low-Income Household Renters $3,321 1.1
Tax Credit for Child and Dependent Care Expenses $9,530 3.1
Tax Credit for Child Passenger Restraint Systems $74 0.0
Tax Credit for Employment of Vocational Rehabilitation Referrals $10 0.0
Low-Income Housing Tax Credit $19,501 6.4
Tax Credit for School Repair and Maintenance d d
Lifeline Telephone Service Tax Credit $54 0.0
Tax Credits to Encourage Certain Industries or Economic Activities Fuel Tax Credit for Commercial Fishers $294 0.1
Motion Picture, Digital Media and Film Production Income Tax Credit $39,920 13.1
Renewable Energy Technologies Tax Credit $98,566 32.4
Enterprise Zone Tax Credit $890 0.3
Ethanol Facility Tax Credit - -
Important Agricultural Lands Tax Credit $388 0.1
Tax Credit for Research Activities $2,909 1.0
Capital Infrastructure Investment Tax Credit $1,113 0.4
Tax Credits to Avoid Double Taxation or Pyramiding of Taxes Capital Goods Excise Tax Credit $30,201 9.9
Income Tax Paid to Another State or to a Foreign Country $45,001 14.8
Expired Tax Credits Tax Credits to Promote Social Welfare Individual Development Account Contribution Tax Credit - -
Tax Credits to Encourage Certain Industries or Economic Activities High Technology Business Investment Tax Credit $24,154 7.9
Energy Conservation Tax Credit* * *
Hotel Construction and Remodeling Tax Credit $248 0.1
Technology Infrastructure Renovation Tax Credit d d
Residential Construction and Remodeling Tax Credit $826 0.3
* Data for the tax credit are included with the renewable energy technologies tax credit. Notes: “d” denotes that the data were suppressed to avoid potential disclosure of confidential taxpayer information.
Figure 3 shows amount of tax credits by purpose of the tax credit in tax year 2015. The
largest amount claimed was for encouraging certain industries or economic activities
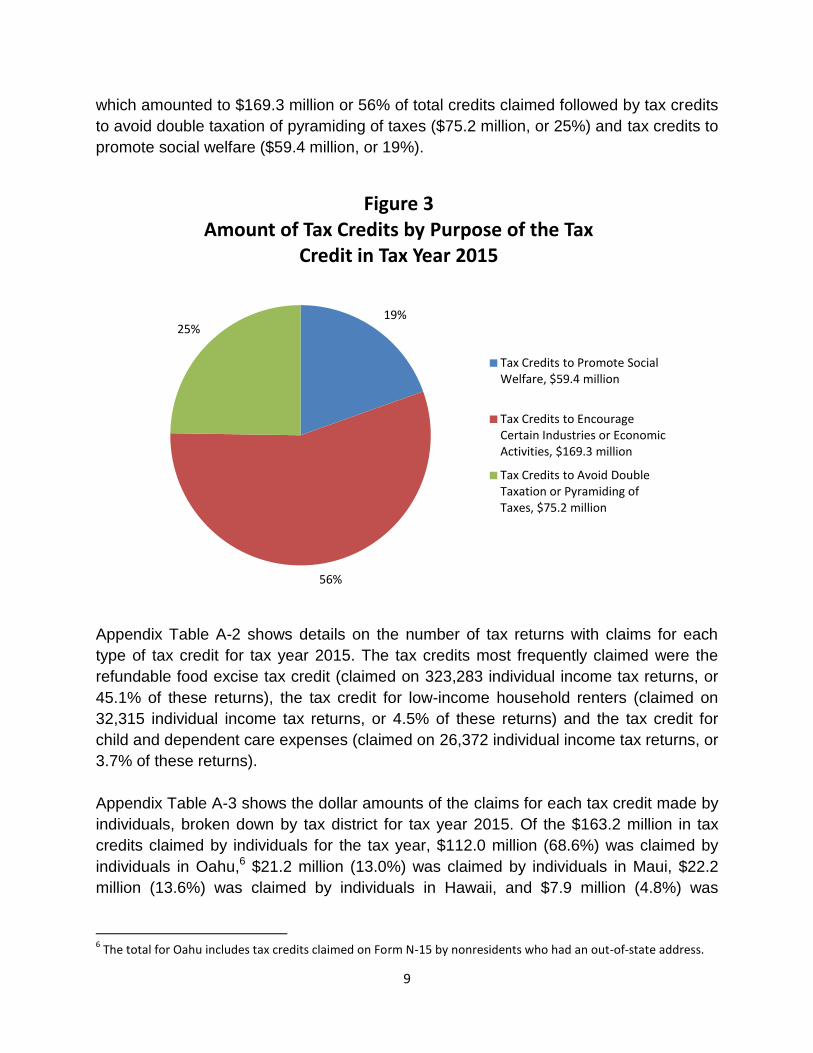
9
which amounted to $169.3 million or 56% of total credits claimed followed by tax credits
to avoid double taxation of pyramiding of taxes ($75.2 million, or 25%) and tax credits to
promote social welfare ($59.4 million, or 19%).
Appendix Table A-2 shows details on the number of tax returns with claims for each
type of tax credit for tax year 2015. The tax credits most frequently claimed were the
refundable food excise tax credit (claimed on 323,283 individual income tax returns, or
45.1% of these returns), the tax credit for low-income household renters (claimed on
32,315 individual income tax returns, or 4.5% of these returns) and the tax credit for
child and dependent care expenses (claimed on 26,372 individual income tax returns, or
3.7% of these returns).
Appendix Table A-3 shows the dollar amounts of the claims for each tax credit made by
individuals, broken down by tax district for tax year 2015. Of the $163.2 million in tax
credits claimed by individuals for the tax year, $112.0 million (68.6%) was claimed by
individuals in Oahu,6 $21.2 million (13.0%) was claimed by individuals in Maui, $22.2
million (13.6%) was claimed by individuals in Hawaii, and $7.9 million (4.8%) was
6 The total for Oahu includes tax credits claimed on Form N-15 by nonresidents who had an out-of-state address.
19%
56%
25%
Figure 3 Amount of Tax Credits by Purpose of the Tax
Credit in Tax Year 2015
Tax Credits to Promote Social Welfare, $59.4 million
Tax Credits to Encourage Certain Industries or Economic Activities, $169.3 million
Tax Credits to Avoid Double Taxation or Pyramiding of Taxes, $75.2 million
10
claimed by individuals in Kauai. Appendix Table A-4 shows the number of individual
income tax returns with claims for each tax credit by tax district.
Appendix Tables A-5 and A-6 show the dollar amounts and number of claims made by
individuals for each tax credit for tax year 2015, broken down by income class as
determined by Hawaii AGI.7 Individual returns with Hawaii AGI less than $10,000
claimed a total of $17.1 million in tax credits for the tax year, which was more than
double their aggregate tax liability before tax credits of $7.0 million. The largest tax
credits claimed by the income group were the refundable food/excise tax credit ($10.0
million) and the renewable energy technologies tax credit ($4.9 million). Taxpayers with
Hawaii AGI of $200,000 or more accounted for the largest dollar value of tax credits
($76.0 million) and also for the largest aggregate tax liability before tax credits. The
largest tax credits claimed by this group were the tax credit for taxes paid to another
state or to a foreign country ($35.1 million), the renewable energy technologies tax
credit ($24.2 million), and the high technology business investment tax credit ($9.6
million).
Figure 4 shows amount of tax credit claimed relative to the total tax liability by income
class in tax year 2015. As mentioned above, amount of tax credits claimed by Individual
returns with Hawaii AGI less than $10,000 was more than double their aggregate tax
liability before tax credits (243.1% of their tax liability). Taxpayers with Hawaii AGI of
$10,000 to $29,999 claimed largest percentage (19.1%) of tax credit against their tax
liability among income groups with amount of tax credits less than their tax liability.
Appendix B provides a history of Hawaii’s tax credits. The chart in Appendix Table B-1
shows the tax credits in existence in each year since 1965. Appendix Table B-2
provides an outline showing the historic development of the tax credits and the year in
which each tax credit was enacted.
7 The Hawaii AGI of part-year residents and nonresidents who filed Form N-15 is measured as their total AGI, which
includes income not subject to Hawaii income tax, but which is the global income of the taxpayer measured in the same way that global income of residents is measured.
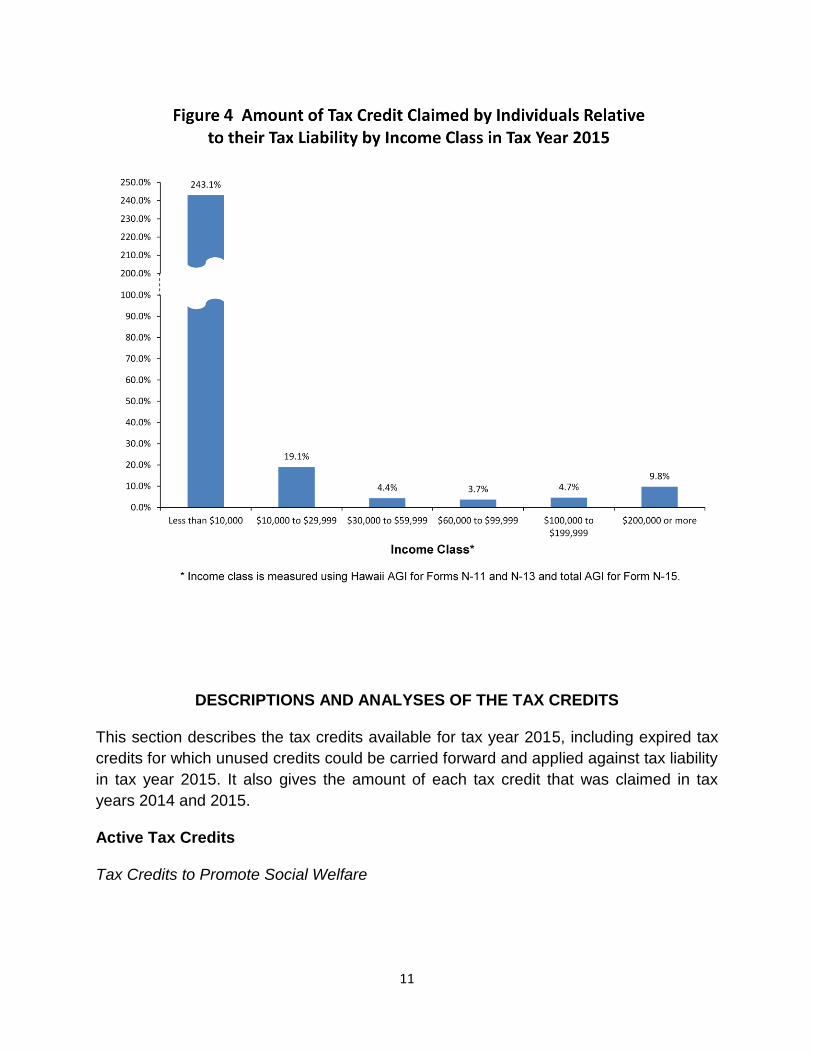
11
DESCRIPTIONS AND ANALYSES OF THE TAX CREDITS
This section describes the tax credits available for tax year 2015, including expired tax
credits for which unused credits could be carried forward and applied against tax liability
in tax year 2015. It also gives the amount of each tax credit that was claimed in tax
years 2014 and 2015.
Active Tax Credits
Tax Credits to Promote Social Welfare
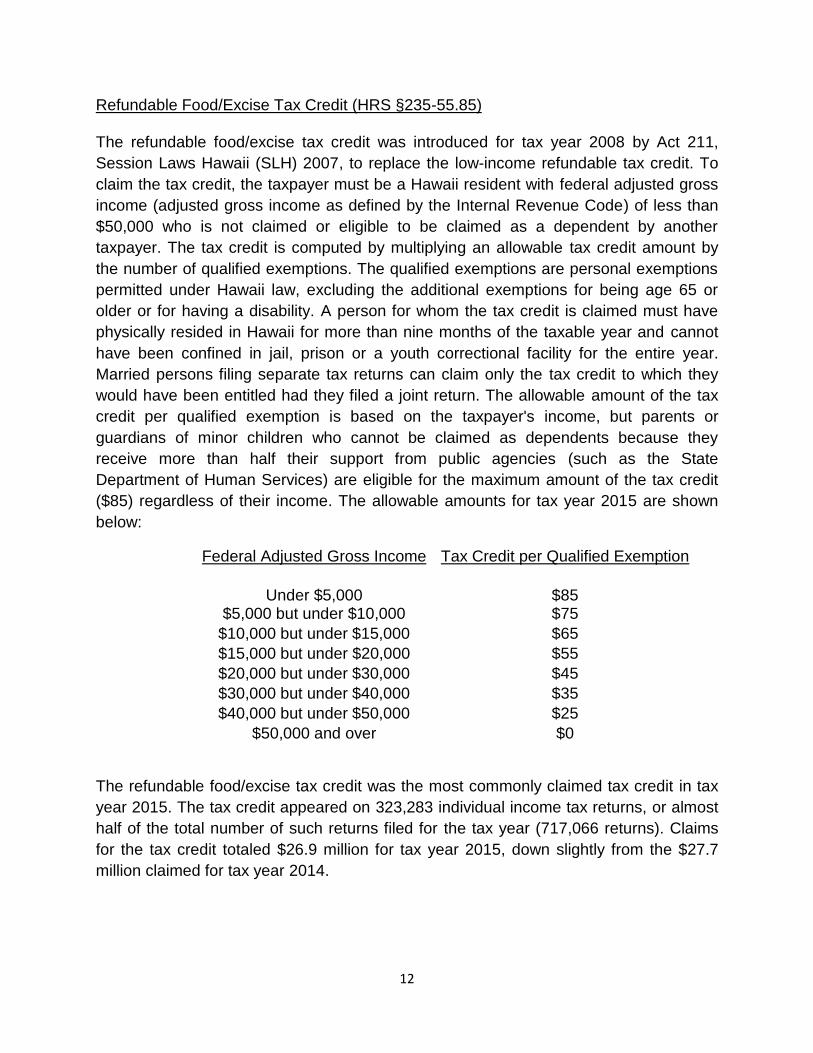
12
Refundable Food/Excise Tax Credit (HRS §235-55.85)
The refundable food/excise tax credit was introduced for tax year 2008 by Act 211,
Session Laws Hawaii (SLH) 2007, to replace the low-income refundable tax credit. To
claim the tax credit, the taxpayer must be a Hawaii resident with federal adjusted gross
income (adjusted gross income as defined by the Internal Revenue Code) of less than
$50,000 who is not claimed or eligible to be claimed as a dependent by another
taxpayer. The tax credit is computed by multiplying an allowable tax credit amount by
the number of qualified exemptions. The qualified exemptions are personal exemptions
permitted under Hawaii law, excluding the additional exemptions for being age 65 or
older or for having a disability. A person for whom the tax credit is claimed must have
physically resided in Hawaii for more than nine months of the taxable year and cannot
have been confined in jail, prison or a youth correctional facility for the entire year.
Married persons filing separate tax returns can claim only the tax credit to which they
would have been entitled had they filed a joint return. The allowable amount of the tax
credit per qualified exemption is based on the taxpayer's income, but parents or
guardians of minor children who cannot be claimed as dependents because they
receive more than half their support from public agencies (such as the State
Department of Human Services) are eligible for the maximum amount of the tax credit
($85) regardless of their income. The allowable amounts for tax year 2015 are shown
below:
Federal Adjusted Gross Income Tax Credit per Qualified Exemption
Under $5,000 $85 $5,000 but under $10,000 $75
$10,000 but under $15,000 $65
$15,000 but under $20,000 $55
$20,000 but under $30,000 $45
$30,000 but under $40,000 $35
$40,000 but under $50,000 $25
$50,000 and over
$0
The refundable food/excise tax credit was the most commonly claimed tax credit in tax
year 2015. The tax credit appeared on 323,283 individual income tax returns, or almost
half of the total number of such returns filed for the tax year (717,066 returns). Claims
for the tax credit totaled $26.9 million for tax year 2015, down slightly from the $27.7
million claimed for tax year 2014.
13
Tax Credit for Low-Income Household Renters (HRS §235-55.7)
Taxpayers who rented residential real property during the taxable year may qualify for
the refundable tax credit for low-income household renters. To claim the tax credit, the
taxpayer must be a Hawaii resident with Hawaii AGI of less than $30,000 who is not
claimed or eligible to be claimed as a dependent by another taxpayer. Also, the
taxpayer must have paid more than $1,000 in annual rent for real property in Hawaii that
was the taxpayer's residence (or the residence of the taxpayer's immediate family) and
that was not wholly or partially exempt from the real property tax. Married persons filing
separate tax returns must combine their Hawaii AGI to determine their eligibility for the
tax credit. If a rental unit is shared with another person, the individual's portion of the
rent is used to determine eligibility.
The tax credit is computed by multiplying $50 by the number of personal exemptions
permitted under Hawaii law, including the additional exemption for being age 65 or
older. A person for whom the tax credit is claimed must have physically resided in
Hawaii for more than nine months of the taxable year.
The $30,000 income limitation has not been changed since 1989, when it was raised
from $20,000. The amount of the tax credit per exemption was raised from $20 to $50 in
1981, but has remained unchanged since then, despite substantial rises in the cost of
housing.
The renter's tax credit was claimed on 32,315 individual income tax returns for tax year
2015. It was the second most commonly claimed tax credit. The amount claimed for tax
year 2015 totaled $3.3 million, down slightly from $3.6 million claimed for tax year 2014.
Tax Credit for Child and Dependent Care Expenses (HRS §235-55.6)
A resident taxpayer who is gainfully employed and who pays for the care of a child
under 13 years of age or for a spouse or dependent incapable of self care qualifies for
the child and dependent care tax credit. The tax credit can be taken for care expenses
up to $2,400 for one qualified individual and up to $4,800 for two or more qualified
individuals. Allowable expenses may not exceed the taxpayer’s earned income. For joint
tax returns, the amount may not exceed the income of the spouse with the lower earned
income.
The tax credit is refundable and the amount ranges from 15% to 25% of qualified care
expenses, with the rate declining as Hawaii AGI increases. The tax credit schedule for
tax year 2015 is shown below.
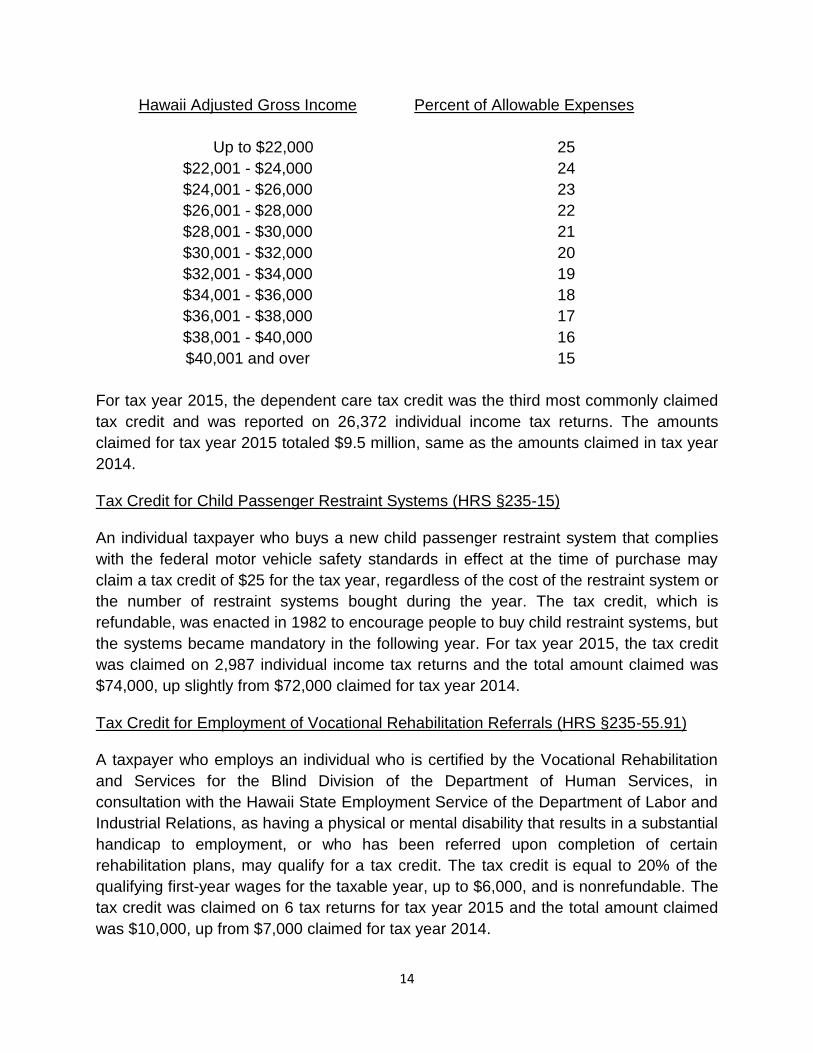
14
Hawaii Adjusted Gross Income Percent of Allowable Expenses
Up to $22,000 25
$22,001 - $24,000 24
$24,001 - $26,000 23
$26,001 - $28,000 22
$28,001 - $30,000 21
$30,001 - $32,000 20
$32,001 - $34,000 19
$34,001 - $36,000 18
$36,001 - $38,000 17
$38,001 - $40,000 16
$40,001 and over 15
For tax year 2015, the dependent care tax credit was the third most commonly claimed
tax credit and was reported on 26,372 individual income tax returns. The amounts
claimed for tax year 2015 totaled $9.5 million, same as the amounts claimed in tax year
2014.
Tax Credit for Child Passenger Restraint Systems (HRS §235-15)
An individual taxpayer who buys a new child passenger restraint system that complies
with the federal motor vehicle safety standards in effect at the time of purchase may
claim a tax credit of $25 for the tax year, regardless of the cost of the restraint system or
the number of restraint systems bought during the year. The tax credit, which is
refundable, was enacted in 1982 to encourage people to buy child restraint systems, but
the systems became mandatory in the following year. For tax year 2015, the tax credit
was claimed on 2,987 individual income tax returns and the total amount claimed was
$74,000, up slightly from $72,000 claimed for tax year 2014.
Tax Credit for Employment of Vocational Rehabilitation Referrals (HRS §235-55.91)
A taxpayer who employs an individual who is certified by the Vocational Rehabilitation
and Services for the Blind Division of the Department of Human Services, in
consultation with the Hawaii State Employment Service of the Department of Labor and
Industrial Relations, as having a physical or mental disability that results in a substantial
handicap to employment, or who has been referred upon completion of certain
rehabilitation plans, may qualify for a tax credit. The tax credit is equal to 20% of the
qualifying first-year wages for the taxable year, up to $6,000, and is nonrefundable. The
tax credit was claimed on 6 tax returns for tax year 2015 and the total amount claimed
was $10,000, up from $7,000 claimed for tax year 2014.
15
Low-Income Housing Tax Credit (HRS §235-110.8 and §241-4.7, §431:7-208)
Owners of residential buildings who provide low-income housing may claim the low-
income housing tax credit. The tax credit is equal to a percentage of the "applicable
percentage" of qualified basis, where the applicable percentage is calculated as
provided under section 42 of the Internal Revenue Code. The percentage is 30% for
buildings placed in service prior to July 1, 2005, and 50% for buildings placed in service
after June 30, 2005. Act 158, SLH 2011 allows the taxpayer to elect to receive a low-
income housing loan in lieu of the tax credit after July 1, 2011. The tax credit was
claimed on 30 tax returns for tax year 2015 and the total amount claimed was $19.5
million, up from claims of $18.2 million for tax year 2014.
Tax Credit for School Repair and Maintenance (HRS §235-110.2)
Act 309, SLH 2001, allows licensed contractors to claim a 10% nonrefundable tax
credit, up to $4,000, on the fair-market value of repair and maintenance services
provided at no cost to public schools. Data on the tax credit for tax year 2015 were
suppressed to prevent potential disclosure of confidential taxpayer information.
Lifeline Telephone Service Tax Credit (HRS §239-6.5)
Lifeline telephone service is available to elderly and disabled residential telephone
subscribers who have an annual income less than $10,000. The Public Utilities
Commission determines and certifies the lifeline service costs. The telephone public
utility may claim a nonrefundable tax credit equal to the sum of foregone revenues and
the administrative costs of providing the telephone service to the eligible individuals.
The tax credit was claimed on behalf of 2,085 subscribers as of the end of calendar
year 2015 and the amount claimed by the public utility for tax year 2015 was $54,000,
down from $58,000 claimed for tax year 2014.
16
Tax Credits to Encourage Certain Industries or Economic Activities
Fuel Tax Credit for Commercial Fishers (HRS §235-110.6)
The principal operator of a commercial fishing vessel may claim a refundable tax credit
for certain fuel taxes paid during the taxable year. The amount of the tax credit is equal
to the fuel taxes imposed under section 243-4(a), HRS. The tax credit was claimed on
166 tax returns for tax year 2015 and the total amount claimed was $295,000, up
slightly from $293,000 claimed for tax year 2014.
Motion Picture, Digital Media, and Film Production Income Tax Credit (HRS §235-17)
For taxable years beginning after December 31, 2012, taxpayers could claim a
refundable tax credit equal to 20% of qualified production costs incurred in the City and
County of Honolulu before January 1, 2019 and 25% for qualified production costs
incurred in the Kauai, Maui, or Hawaii County before January 1, 2019. The total tax
credits allowed for a single qualified production was capped at $15 million. The tax
credit was claimed on 34 tax returns for tax year 2015 and the total amount claimed was
$39.9 million, up from $34.4 million claimed for tax year 2014. The tax credit was the
third biggest in terms of the amount claimed in tax year 2015.
Renewable Energy Technologies Tax Credit (HRS §235-12.5 and §241-4.6)
Taxpayers who installed a renewable energy technology system (solar thermal energy
system, wind powered energy system, or photovoltaic energy system) and placed it in
service after June 30, 2003, may claim the renewable energy technologies tax credit.
The tax credit applies to the actual cost of the system, including the cost of accessories
and installation, but not to the cost of consumer incentive premiums that are unrelated
to the operation of the system.
For systems installed and placed in service after July 1, 2006, the tax credit was 35% of
the cost for solar thermal systems and photovoltaic systems, and 20% of the cost for
wind powered systems. For single-family residential properties, the amount of the tax
credit was capped at $2,250 for solar thermal systems, $5,000 for photovoltaic systems,
and $1,500 for wind powered systems. For commercial properties, the tax credit was
capped at $500,000 for wind powered systems and for photovoltaic systems, and at
$250,000 for solar thermal systems. For multifamily residential properties, the tax credit
per residential unit was capped at $350 for solar thermal systems and photovoltaic
systems, and at $200 for wind powered systems. Act 154, SLH 2009 made the tax
credit refundable for certain low income taxpayers and gave other taxpayers the option
to claim the tax credit as refundable by accepting a 30% reduction in the amount of the
17
tax credit. The Act was effective for systems installed and placed in service on or after
July 1, 2009.
According to the new Administrative Rules that came into effect during tax year 2013, to
gain tax credit for a system classified under "other solar energy system" such as a
photovoltaic system, each system was required to have a total output capacity of at
least 5 kilowatts for single-family residential properties, or 0.360 kilowatts per unit per
system for multi-family residential properties, or 1,000 kilowatts for commercial
properties unless an exception applies, such as only one credit being claimed or only
one system does not meet the requirement.
Table 4 shows the number of returns and the amount of the tax credit claimed for the
renewable energy tax credit, and also for carryovers of the energy conservation tax
credit that expired June 30, 2003. The first part of the table shows carryovers of tax
credits for the renewable energy systems that were installed and placed in service prior
to July 1, 2009, along with carryovers of the energy conservation tax credit and
carryovers of the renewable energy tax credit for which the date of installation could not
be determined. Carryovers of these tax credits were reported on 664 tax returns for tax
year 2015 and the amounts claimed totaled $1.6 million, down from $1.9 million claimed
for tax year 2014.
The second and third parts of Table 4 show the renewable energy tax credit for systems
that were installed on or after July 1, 2009, by type of system, by type of taxpayer, and
by whether the claim was for a refundable or nonrefundable tax credit. Because unused
tax credits can be carried over, and extensions of existing systems made in later years
are also eligible for the tax credit, the number of returns claiming the credit in a year
may be larger than the number of new systems installed that year. The tax credit for
systems installed and placed in service on or after July 1, 2009 was claimed on 13,954
returns for tax year 2015 and the amounts claimed totaled $96.9 million, down from
$110.2 million claimed for tax year 2014.
Claims for all systems, including carryovers of the energy conservation tax credit,
totaled $98.6 million for tax year 2015, down from the $112.1 million claimed for these
tax credits in tax year 2014.
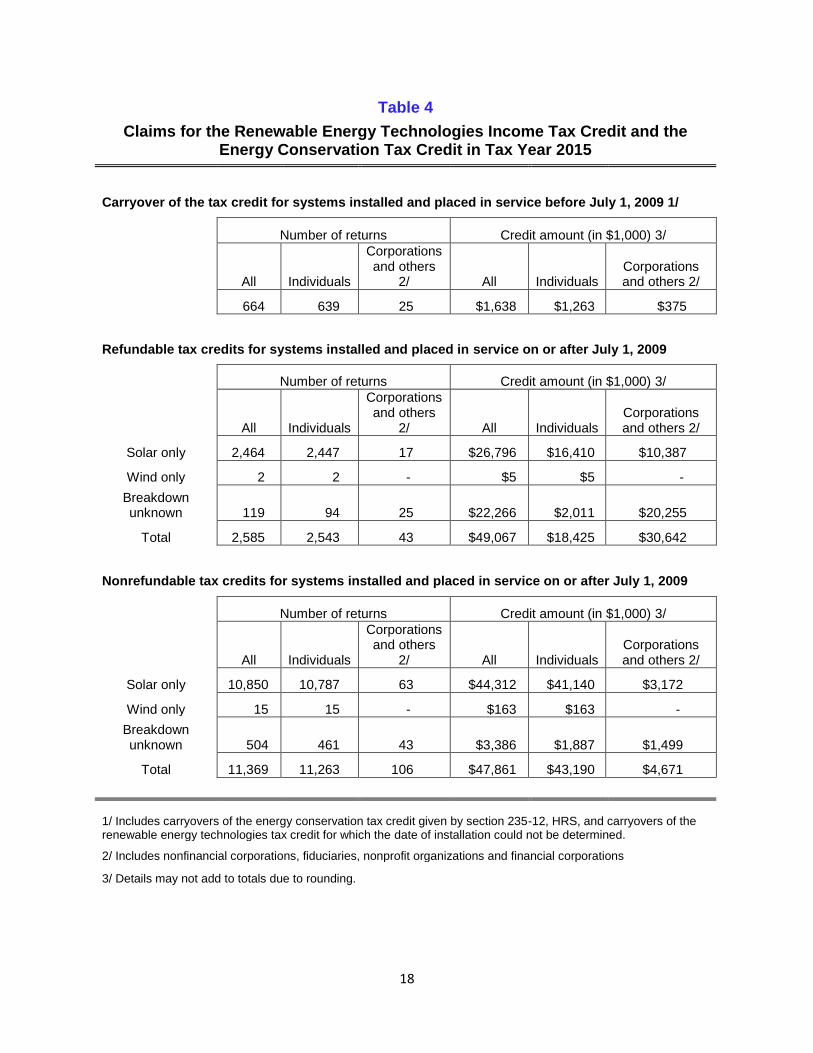
18
Table 4
Claims for the Renewable Energy Technologies Income Tax Credit and the Energy Conservation Tax Credit in Tax Year 2015
Carryover of the tax credit for systems installed and placed in service before July 1, 2009 1/
Number of returns Credit amount (in $1,000) 3/
All Individuals
Corporations and others
2/ All Individuals Corporations and others 2/
664 639 25 $1,638 $1,263 $375
Refundable tax credits for systems installed and placed in service on or after July 1, 2009
Number of returns Credit amount (in $1,000) 3/
All Individuals
Corporations and others
2/ All Individuals Corporations and others 2/
Solar only 2,464 2,447 17 $26,796 $16,410 $10,387
Wind only 2 2 - $5 $5 -
Breakdown unknown 119 94 25 $22,266 $2,011 $20,255
Total 2,585 2,543 43 $49,067 $18,425 $30,642
Nonrefundable tax credits for systems installed and placed in service on or after July 1, 2009
Number of returns Credit amount (in $1,000) 3/
All Individuals
Corporations and others
2/ All Individuals Corporations and others 2/
Solar only 10,850 10,787 63 $44,312 $41,140 $3,172
Wind only 15 15 - $163 $163 -
Breakdown unknown 504 461 43 $3,386 $1,887 $1,499
Total 11,369 11,263 106 $47,861 $43,190 $4,671
1/ Includes carryovers of the energy conservation tax credit given by section 235-12, HRS, and carryovers of the renewable energy technologies tax credit for which the date of installation could not be determined.
2/ Includes nonfinancial corporations, fiduciaries, nonprofit organizations and financial corporations
3/ Details may not add to totals due to rounding.
19
Enterprise Zone Tax Credit (HRS §209E-10, §209E-11)
A qualified business located in a designated enterprise zone may claim a tax credit
equal to a percentage of its net income tax liability and of the unemployment insurance
premiums it paid for employees located in the enterprise zone. In the first year, the tax
credit is 80% of the qualified amounts. The percentage decreases by 10 points each
year, until it reaches 20% in the seventh year, after which the business is no longer
eligible for the tax credit. The tax credit is nonrefundable and any unused tax credit may
not be carried forward. The tax credit was claimed on 78 tax returns for tax year 2015
and the amounts claimed totaled $890,000, down slightly from $1.0 million claimed for
tax year 2014.
Ethanol Facility Tax Credit (HRS §235-110.3)
The ethanol facility tax credit is meant to encourage construction of large-capacity
ethanol production facilities. The amount of the tax credit is equal to 30% of the ethanol
production facility's nameplate capacity if that capacity is greater than 500,000 but less
than 15 million gallons. The nameplate capacity is the annual production capacity of a
facility, measured in gallons, based on an operating year of 350 days. The tax credit is
refundable and is limited to 100% of the investments made by the taxpayer in the
ethanol production facility. The facility must also meet certain production requirements,
and must be in production on or before January 1, 2017. Taxpayers who claim the tax
credit are prohibited from claiming or receiving any other tax credit for the same taxable
year. The total amount of ethanol facility tax credits is capped at $12 million per year.
The tax credit was effective for taxable years beginning after December 31, 2003. No
claims for the tax credit were made for tax year 2015 and 2014.
Important Agricultural Land Tax Credit (HRS §235-110.93)
The important agricultural land tax credit is awarded for qualified agricultural costs
incurred after July 1, 2008. In the first year, the tax credit per taxpayer is the lesser of
25% of the qualified agricultural costs or $625,000. In the second year, the tax credit is
the lesser of 15% of the qualified costs or $250,000, and in the third year the tax credit
is the lesser of 10% of the qualified costs or $125,000. More than 50% of the land used
by the agricultural business must be deemed “important agricultural land.” Tax credits
must be certified by the Department of Agriculture and the aggregate amount of credits
claimed cannot exceed $7.5 million in any tax year. The number of returns claimed this
credit was suppressed to prevent potential disclosure of confidential taxpayer
information for tax year 2015 and the total amount claimed was $388,000. The tax credit
was not available for tax year 2014, because the Department of Agriculture had not
certified any claims for the tax credit.
20
Tax Credit for Research Activities (HRS §235-110.91)
The tax credit for research activities was reinstated by Act 270, SLH 2013. The tax
credit is refundable and is equal to 20% of increases in qualified research expenses
incurred in Hawaii. Eligible research expenses are the same as those in sections 41 of
the Internal Revenue Code (IRC), as that section was enacted on December 31, 2011,
and in section 280C(c), IRC, provided that the expenses must be incurred in Hawaii. To
qualify for the tax credit, the taxpayer must also claim a federal tax credit for the same
expenditures. The tax credit is available for tax years beginning after December 31,
2012, but expires after December 31, 2019.
The tax credit was claimed on 57 tax returns for tax year 2015 and the amounts claimed
totaled $2.9 million, same as the amounts claimed for tax year 2014.
Capital Infrastructure Tax Credit (HRS §235-17.5, §241-4.4)
Act 200, SLH 2014, established the capital infrastructure tax credit for tenants who were
relocated due to the Kapalama container terminal modernization project. The tax credit
is equal to 50% of the capital infrastructure costs incurred by the qualified infrastructure
tenant during the taxable year, up to a maximum of $1,250,000. The tax credit is
available for taxable years beginning after December 31, 2013, but not for taxable years
beginning after December 31, 2019. The tax credit was claimed on 71 tax returns for tax
year 2015 and the amounts claimed totaled $1.1 million, up slightly from $989,000
claimed for tax year 2014.
Tax Credits to Avoid Double Taxation or Pyramiding of Hawaii Taxes
Capital Goods Excise Tax Credit (HRS §235-110.7, §241-4.5)
Businesses may claim the capital goods excise tax credit for the purchase of eligible
depreciable tangible personal property used in a trade or business in Hawaii. The tax
credit is refundable and is equal to 4% of the qualifying cost of the eligible property,
which excludes costs deducted under Internal Revenue Code Section 179. The tax
credit serves to reduce pyramiding of the General Excise Tax (GET) by rebating the
GET on business-to-business purchases that consist of eligible capital equipment. The
cost of such capital equipment ultimately must be recaptured in the price of goods or
services it is used to help produce, so without the rebate, the price of the produced
goods or services would include the tax on the capital equipment.
The tax credit was claimed on 4,158 tax returns for tax year 2015 and the amounts
claimed totaled $30.2 million, up from $28.3 million claimed for tax year 2014.
21
Income Tax Paid to Another State or Foreign Country (HRS §235-55)
A Hawaii resident individual or other person may claim a credit for income taxes paid to
another state or to a foreign country if the income was earned in the other state or
country and is not exempt from Hawaii or federal income tax, and if certain other
requirements are met. The tax credit was claimed on 8,106 tax returns for tax year 2015
and the amounts claimed totaled $45.0 million, up from $38.4 million claimed for tax
year 2014.
Expired Tax Credits
Tax Credits to Promote Social Welfare
Individual Development Account Contribution Tax Credit (HRS §235-5.6)
The individual development account (IDA) program was intended to encourage people
with low income to save towards specific long-term goals, including obtaining a
postsecondary education, buying a first home, and starting a small business. Program
participants enrolled with a fiduciary organization, which provided matching funds for
their deposits. A nonrefundable tax credit was allowed for persons donating money to
the fiduciary organization for use as matching funds. The tax credit was equal to 50% of
the amount donated. Donations qualifying for the tax credit could not be claimed as a
deduction for charitable contributions. The tax credit was effective for taxable years
2000 to 2004 with an aggregate limit of $1 million. No claims for the tax credit were
made for tax year 2015.
Tax Credits to Encourage Certain Industries or Economic Activities
High Technology Business Investment Tax Credit (HRS §235-110.9, §241-4.8, §431:7-
209)
Taxpayers were allowed to claim the high technology business investment tax credit for
tax years beginning after December 31, 1998. As originally enacted, the tax credit was
nonrefundable and equal to 10% of investments made on or after July 1, 1999 in a
qualified high technology business, up to a maximum credit amount of $500,000. Act
221, SLH 2001, expanded the tax credit to 100% of the qualified investment, up to a
maximum of $2 million per investment. The tax credit was claimed over five years as
follows:
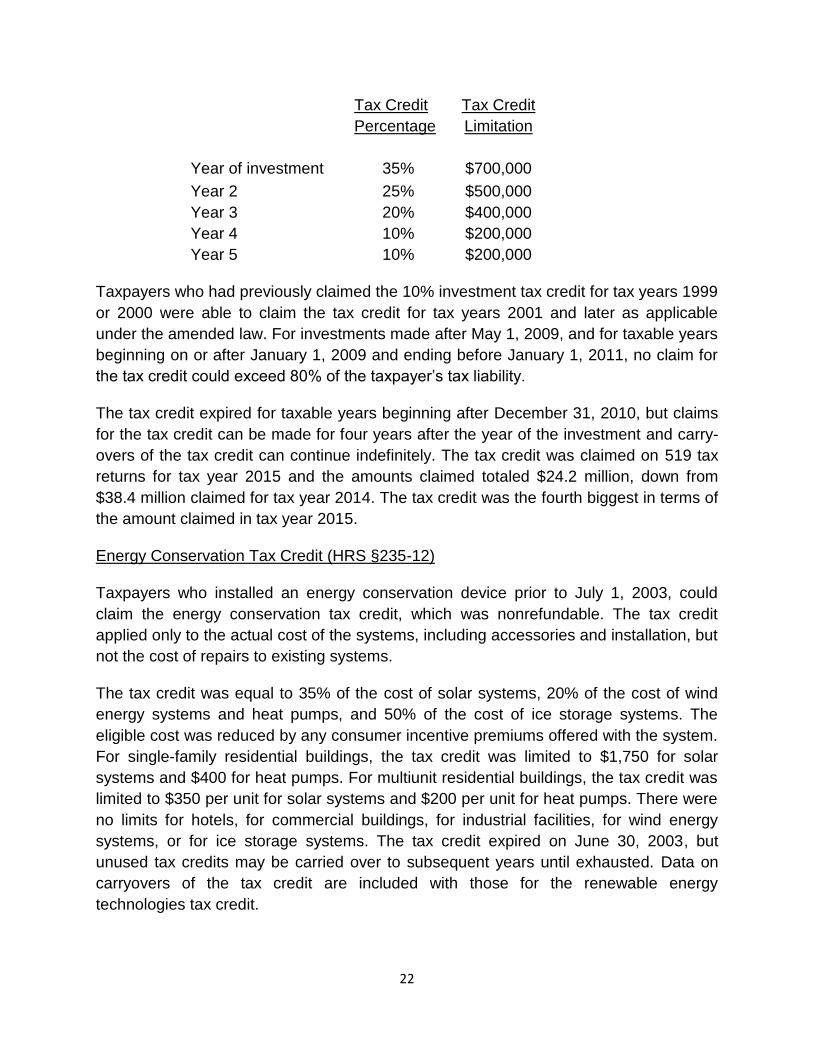
22
Tax Credit
Percentage
Tax Credit
Limitation
Year of investment 35% $700,000
Year 2 25% $500,000
Year 3 20% $400,000
Year 4 10% $200,000
Year 5 10% $200,000
Taxpayers who had previously claimed the 10% investment tax credit for tax years 1999
or 2000 were able to claim the tax credit for tax years 2001 and later as applicable
under the amended law. For investments made after May 1, 2009, and for taxable years
beginning on or after January 1, 2009 and ending before January 1, 2011, no claim for
the tax credit could exceed 80% of the taxpayer’s tax liability.
The tax credit expired for taxable years beginning after December 31, 2010, but claims
for the tax credit can be made for four years after the year of the investment and carry-
overs of the tax credit can continue indefinitely. The tax credit was claimed on 519 tax
returns for tax year 2015 and the amounts claimed totaled $24.2 million, down from
$38.4 million claimed for tax year 2014. The tax credit was the fourth biggest in terms of
the amount claimed in tax year 2015.
Energy Conservation Tax Credit (HRS §235-12)
Taxpayers who installed an energy conservation device prior to July 1, 2003, could
claim the energy conservation tax credit, which was nonrefundable. The tax credit
applied only to the actual cost of the systems, including accessories and installation, but
not the cost of repairs to existing systems.
The tax credit was equal to 35% of the cost of solar systems, 20% of the cost of wind
energy systems and heat pumps, and 50% of the cost of ice storage systems. The
eligible cost was reduced by any consumer incentive premiums offered with the system.
For single-family residential buildings, the tax credit was limited to $1,750 for solar
systems and $400 for heat pumps. For multiunit residential buildings, the tax credit was
limited to $350 per unit for solar systems and $200 per unit for heat pumps. There were
no limits for hotels, for commercial buildings, for industrial facilities, for wind energy
systems, or for ice storage systems. The tax credit expired on June 30, 2003, but
unused tax credits may be carried over to subsequent years until exhausted. Data on
carryovers of the tax credit are included with those for the renewable energy
technologies tax credit.
23
Hotel Construction and Remodeling Tax Credit (HRS §235-110.4, repealed)
The hotel construction and remodeling tax credit was repealed by Act 9, SLH 2007, but
unused credits from claims made prior to the expiration date may be carried forward
and applied against tax. Although the tax credit was not repealed until 2007, it was not
available for costs incurred in taxable years beginning after December 31, 2005. The
tax credit was claimed on 5 tax returns for tax year 2015 and the amount claimed
totaled $248,000, down more than 90% from $3.3 million claimed for tax year 2014.
Technology Infrastructure Renovation Tax Credit (HRS §235-110.51)
The technology infrastructure renovation tax credit was nonrefundable and was equal to
4% of costs incurred after December 31, 2000 for planning, designing, installing,
constructing, or purchasing equipment to provide a commercial building with technology
infrastructure. The tax credit is not available for taxable years beginning after December
31, 2010, but amounts claimed for the tax credit prior to its expiration can be carried
forward and applied against tax liability in later years until exhausted. For costs incurred
after May 1, 2009, and for taxable years beginning on or after January 1, 2009 and
ending before January 1, 2011, no claim for the tax credit could exceed 80% of the
taxpayer’s tax liability. Data on the tax credit for tax year 2015 were suppressed to
prevent potential disclosure of confidential taxpayer information.
Residential Construction and Remodeling Tax Credit (HRS §235-110.45)
Act 10, SLH 2001, Third Special Session, provided a nonrefundable tax credit equal to
4% of home construction or renovation costs incurred after December 31, 2000, up to a
maximum of $250,000. The tax credit expired on June 30, 2003, but any unused tax
credit may be carried over to subsequent years until exhausted. Carryovers of the tax
credit were claimed on 35 tax returns for tax year 2015 and the amounts claimed totaled
$826,000, up from $195,000 claimed for tax year 2014.
25
APPENDIX A
STATISTICAL TABLES
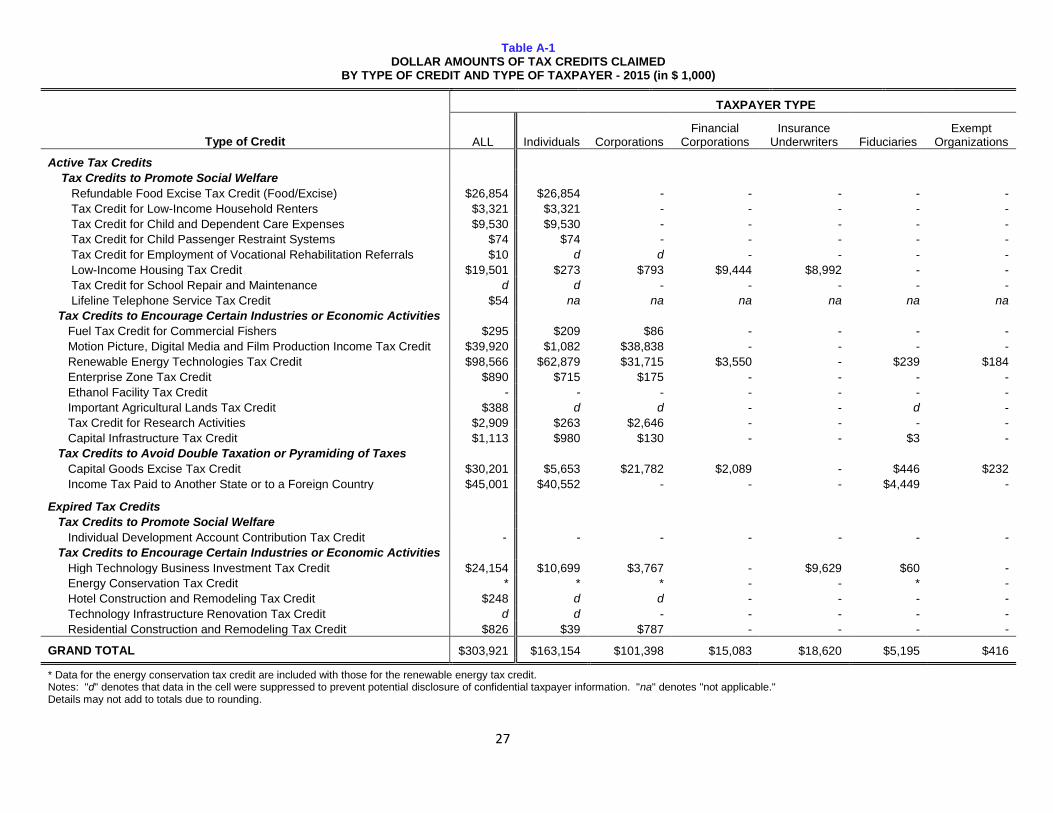
27
Table A-1 DOLLAR AMOUNTS OF TAX CREDITS CLAIMED
BY TYPE OF CREDIT AND TYPE OF TAXPAYER - 2015 (in $ 1,000)
TAXPAYER TYPE
Type of Credit ALL Individuals Corporations Financial
Corporations Insurance
Underwriters Fiduciaries Exempt
Organizations
Active Tax Credits Tax Credits to Promote Social Welfare
Refundable Food Excise Tax Credit (Food/Excise) $26,854 $26,854 - - - - -
Tax Credit for Low-Income Household Renters $3,321 $3,321 - - - - -
Tax Credit for Child and Dependent Care Expenses $9,530 $9,530 - - - - -
Tax Credit for Child Passenger Restraint Systems $74 $74 - - - - -
Tax Credit for Employment of Vocational Rehabilitation Referrals $10 d d - - - -
Low-Income Housing Tax Credit $19,501 $273 $793 $9,444 $8,992 - -
Tax Credit for School Repair and Maintenance d d - - - - -
Lifeline Telephone Service Tax Credit $54 na na na na na na
Tax Credits to Encourage Certain Industries or Economic Activities Fuel Tax Credit for Commercial Fishers $295 $209 $86 - - - -
Motion Picture, Digital Media and Film Production Income Tax Credit $39,920 $1,082 $38,838 - - - -
Renewable Energy Technologies Tax Credit $98,566 $62,879 $31,715 $3,550 - $239 $184
Enterprise Zone Tax Credit $890 $715 $175 - - - -
Ethanol Facility Tax Credit - - - - - - -
Important Agricultural Lands Tax Credit $388 d d - - d -
Tax Credit for Research Activities $2,909 $263 $2,646 - - - -
Capital Infrastructure Tax Credit $1,113 $980 $130 - - $3 -
Tax Credits to Avoid Double Taxation or Pyramiding of Taxes Capital Goods Excise Tax Credit $30,201 $5,653 $21,782 $2,089 - $446 $232
Income Tax Paid to Another State or to a Foreign Country $45,001 $40,552 - - - $4,449 -
Expired Tax Credits Tax Credits to Promote Social Welfare Individual Development Account Contribution Tax Credit - - - - - - -
Tax Credits to Encourage Certain Industries or Economic Activities High Technology Business Investment Tax Credit $24,154 $10,699 $3,767 - $9,629 $60 -
Energy Conservation Tax Credit * * * - - * -
Hotel Construction and Remodeling Tax Credit $248 d d - - - -
Technology Infrastructure Renovation Tax Credit d d - - - - -
Residential Construction and Remodeling Tax Credit $826 $39 $787 - - - -
GRAND TOTAL $303,921 $163,154 $101,398 $15,083 $18,620 $5,195 $416
* Data for the energy conservation tax credit are included with those for the renewable energy tax credit. Notes: "d" denotes that data in the cell were suppressed to prevent potential disclosure of confidential taxpayer information. "na" denotes "not applicable." Details may not add to totals due to rounding.
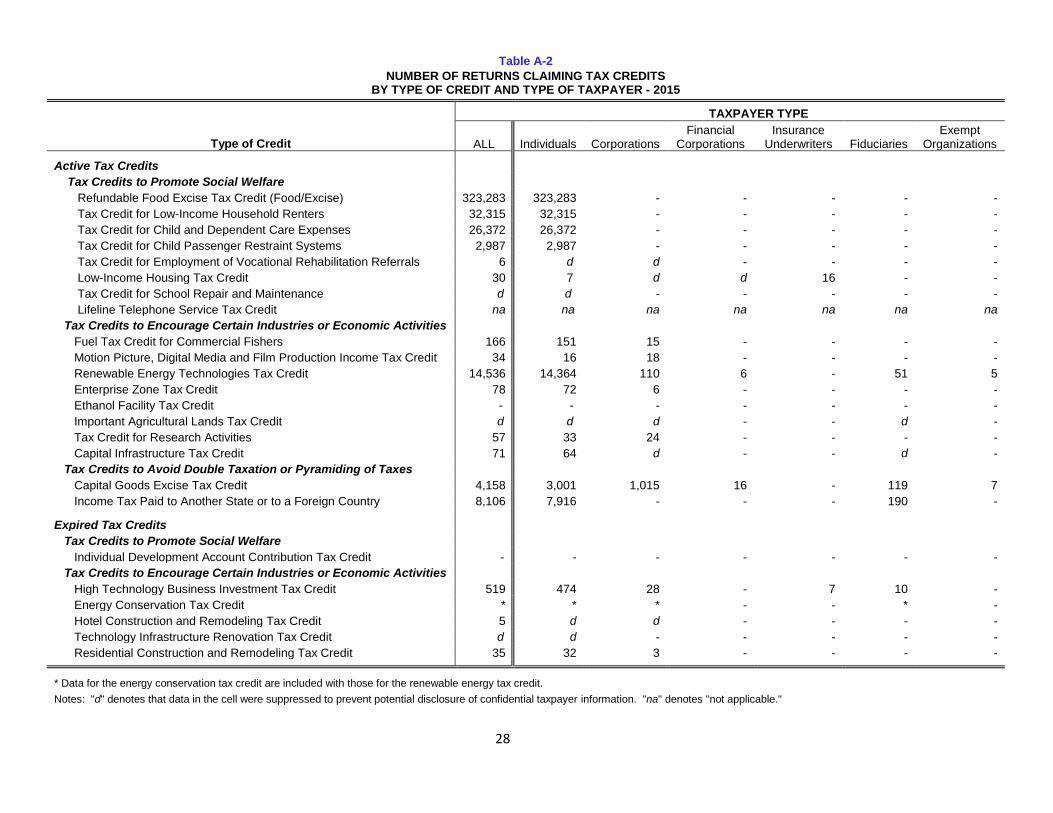
28
Table A-2
NUMBER OF RETURNS CLAIMING TAX CREDITS BY TYPE OF CREDIT AND TYPE OF TAXPAYER - 2015
TAXPAYER TYPE
Type of Credit ALL Individuals Corporations Financial
Corporations Insurance
Underwriters Fiduciaries Exempt
Organizations
Active Tax Credits Tax Credits to Promote Social Welfare Refundable Food Excise Tax Credit (Food/Excise) 323,283 323,283 - - - - -
Tax Credit for Low-Income Household Renters 32,315 32,315 - - - - -
Tax Credit for Child and Dependent Care Expenses 26,372 26,372 - - - - -
Tax Credit for Child Passenger Restraint Systems 2,987 2,987 - - - - -
Tax Credit for Employment of Vocational Rehabilitation Referrals 6 d d - - - -
Low-Income Housing Tax Credit 30 7 d d 16 - -
Tax Credit for School Repair and Maintenance d d - - - - -
Lifeline Telephone Service Tax Credit na na na na na na na
Tax Credits to Encourage Certain Industries or Economic Activities Fuel Tax Credit for Commercial Fishers 166 151 15 - - - -
Motion Picture, Digital Media and Film Production Income Tax Credit 34 16 18 - - - -
Renewable Energy Technologies Tax Credit 14,536 14,364 110 6 - 51 5
Enterprise Zone Tax Credit 78 72 6 - - - -
Ethanol Facility Tax Credit - - - - - - -
Important Agricultural Lands Tax Credit d d d - - d -
Tax Credit for Research Activities 57 33 24 - - - -
Capital Infrastructure Tax Credit 71 64 d - - d -
Tax Credits to Avoid Double Taxation or Pyramiding of Taxes Capital Goods Excise Tax Credit 4,158 3,001 1,015 16 - 119 7
Income Tax Paid to Another State or to a Foreign Country 8,106 7,916 - - - 190 -
Expired Tax Credits Tax Credits to Promote Social Welfare Individual Development Account Contribution Tax Credit - - - - - - -
Tax Credits to Encourage Certain Industries or Economic Activities High Technology Business Investment Tax Credit 519 474 28 - 7 10 -
Energy Conservation Tax Credit * * * - - * -
Hotel Construction and Remodeling Tax Credit 5 d d - - - -
Technology Infrastructure Renovation Tax Credit d d - - - - -
Residential Construction and Remodeling Tax Credit 35 32 3 - - - -
* Data for the energy conservation tax credit are included with those for the renewable energy tax credit.
Notes: "d" denotes that data in the cell were suppressed to prevent potential disclosure of confidential taxpayer information. "na" denotes "not applicable."
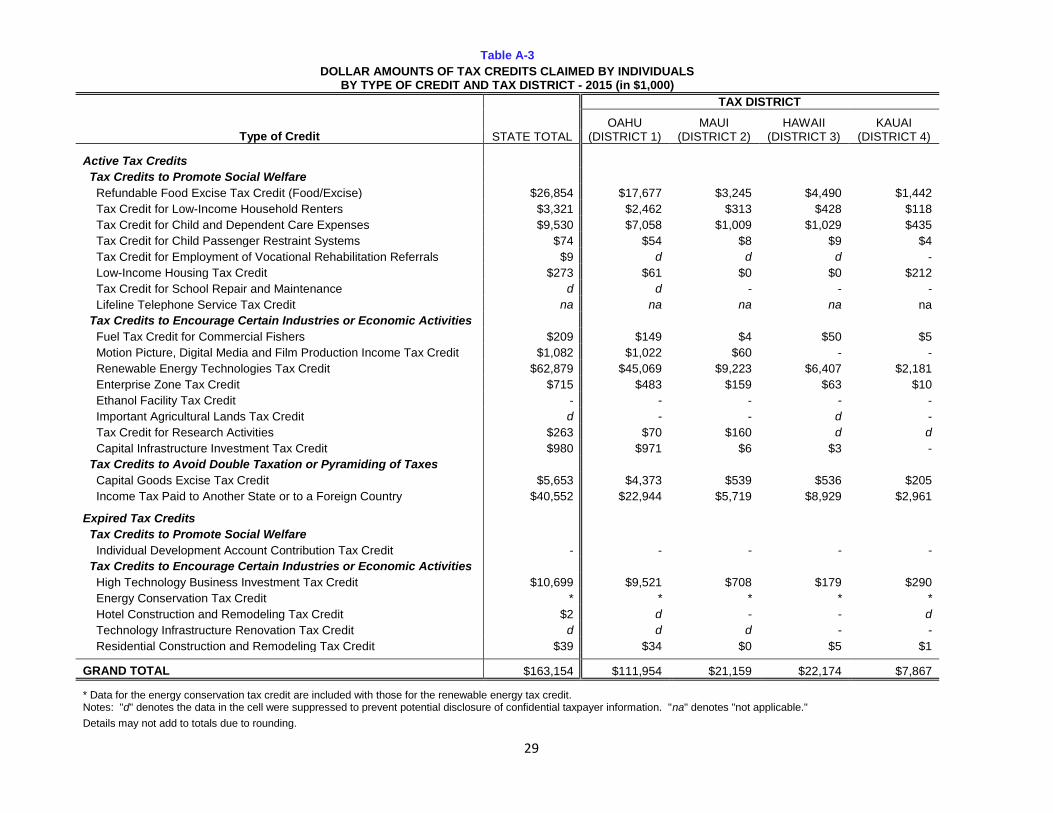
29
Table A-3
DOLLAR AMOUNTS OF TAX CREDITS CLAIMED BY INDIVIDUALS BY TYPE OF CREDIT AND TAX DISTRICT - 2015 (in $1,000)
TAX DISTRICT
OAHU MAUI HAWAII KAUAI Type of Credit STATE TOTAL (DISTRICT 1) (DISTRICT 2) (DISTRICT 3) (DISTRICT 4)
Active Tax Credits
Tax Credits to Promote Social Welfare Refundable Food Excise Tax Credit (Food/Excise) $26,854 $17,677 $3,245 $4,490 $1,442
Tax Credit for Low-Income Household Renters $3,321 $2,462 $313 $428 $118
Tax Credit for Child and Dependent Care Expenses $9,530 $7,058 $1,009 $1,029 $435
Tax Credit for Child Passenger Restraint Systems $74 $54 $8 $9 $4
Tax Credit for Employment of Vocational Rehabilitation Referrals $9 d d d -
Low-Income Housing Tax Credit $273 $61 $0 $0 $212
Tax Credit for School Repair and Maintenance d d - - -
Lifeline Telephone Service Tax Credit na na na na na
Tax Credits to Encourage Certain Industries or Economic Activities Fuel Tax Credit for Commercial Fishers $209 $149 $4 $50 $5
Motion Picture, Digital Media and Film Production Income Tax Credit $1,082 $1,022 $60 - -
Renewable Energy Technologies Tax Credit $62,879 $45,069 $9,223 $6,407 $2,181
Enterprise Zone Tax Credit $715 $483 $159 $63 $10
Ethanol Facility Tax Credit - - - - -
Important Agricultural Lands Tax Credit d - - d -
Tax Credit for Research Activities $263 $70 $160 d d
Capital Infrastructure Investment Tax Credit $980 $971 $6 $3 -
Tax Credits to Avoid Double Taxation or Pyramiding of Taxes Capital Goods Excise Tax Credit $5,653 $4,373 $539 $536 $205
Income Tax Paid to Another State or to a Foreign Country $40,552 $22,944 $5,719 $8,929 $2,961
Expired Tax Credits Tax Credits to Promote Social Welfare Individual Development Account Contribution Tax Credit - - - - -
Tax Credits to Encourage Certain Industries or Economic Activities High Technology Business Investment Tax Credit $10,699 $9,521 $708 $179 $290
Energy Conservation Tax Credit * * * * *
Hotel Construction and Remodeling Tax Credit $2 d - - d
Technology Infrastructure Renovation Tax Credit d d d - -
Residential Construction and Remodeling Tax Credit $39 $34 $0 $5 $1
GRAND TOTAL $163,154 $111,954 $21,159 $22,174 $7,867
* Data for the energy conservation tax credit are included with those for the renewable energy tax credit.
Notes: "d" denotes the data in the cell were suppressed to prevent potential disclosure of confidential taxpayer information. "na" denotes "not applicable."
Details may not add to totals due to rounding.
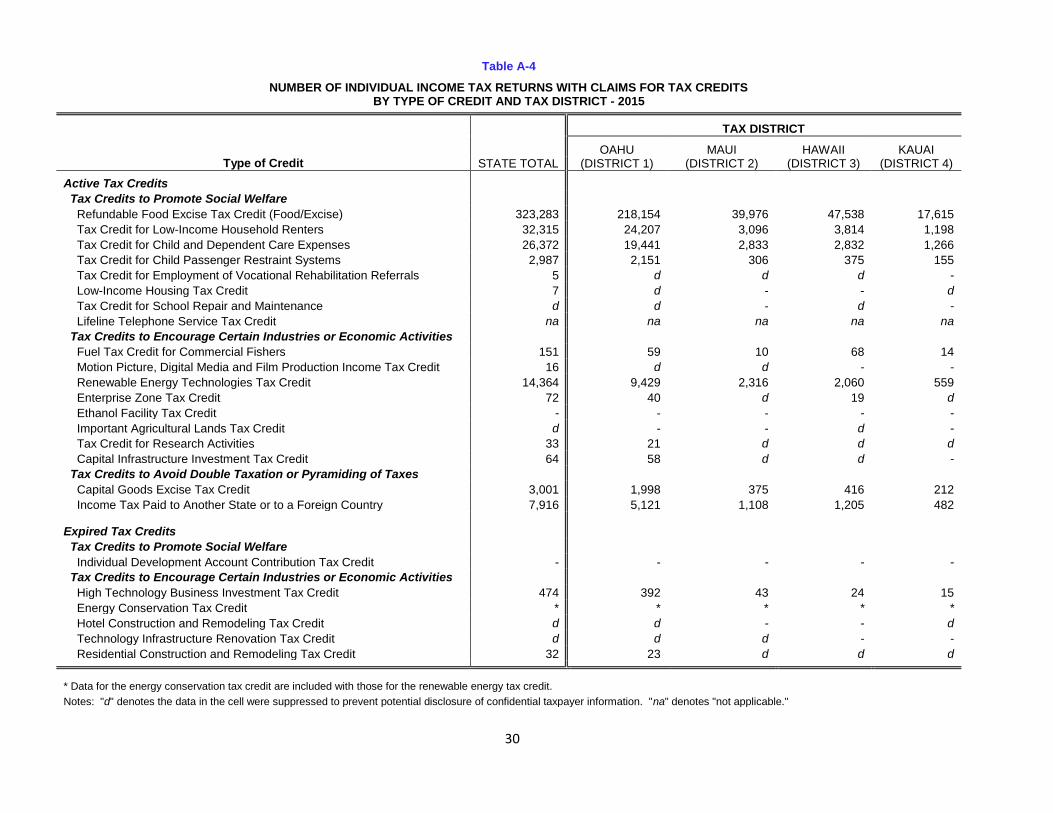
30
Table A-4
NUMBER OF INDIVIDUAL INCOME TAX RETURNS WITH CLAIMS FOR TAX CREDITS BY TYPE OF CREDIT AND TAX DISTRICT - 2015
TAX DISTRICT
OAHU MAUI HAWAII KAUAI Type of Credit STATE TOTAL (DISTRICT 1) (DISTRICT 2) (DISTRICT 3) (DISTRICT 4)
Active Tax Credits
Tax Credits to Promote Social Welfare Refundable Food Excise Tax Credit (Food/Excise) 323,283 218,154 39,976 47,538 17,615
Tax Credit for Low-Income Household Renters 32,315 24,207 3,096 3,814 1,198
Tax Credit for Child and Dependent Care Expenses 26,372 19,441 2,833 2,832 1,266
Tax Credit for Child Passenger Restraint Systems 2,987 2,151 306 375 155
Tax Credit for Employment of Vocational Rehabilitation Referrals 5 d d d -
Low-Income Housing Tax Credit 7 d - - d
Tax Credit for School Repair and Maintenance d d - d -
Lifeline Telephone Service Tax Credit na na na na na
Tax Credits to Encourage Certain Industries or Economic Activities Fuel Tax Credit for Commercial Fishers 151 59 10 68 14
Motion Picture, Digital Media and Film Production Income Tax Credit 16 d d - -
Renewable Energy Technologies Tax Credit 14,364 9,429 2,316 2,060 559
Enterprise Zone Tax Credit 72 40 d 19 d
Ethanol Facility Tax Credit - - - - -
Important Agricultural Lands Tax Credit d - - d -
Tax Credit for Research Activities 33 21 d d d
Capital Infrastructure Investment Tax Credit 64 58 d d -
Tax Credits to Avoid Double Taxation or Pyramiding of Taxes Capital Goods Excise Tax Credit 3,001 1,998 375 416 212
Income Tax Paid to Another State or to a Foreign Country 7,916 5,121 1,108 1,205 482
Expired Tax Credits Tax Credits to Promote Social Welfare Individual Development Account Contribution Tax Credit - - - - -
Tax Credits to Encourage Certain Industries or Economic Activities High Technology Business Investment Tax Credit 474 392 43 24 15
Energy Conservation Tax Credit * * * * *
Hotel Construction and Remodeling Tax Credit d d - - d
Technology Infrastructure Renovation Tax Credit d d d - -
Residential Construction and Remodeling Tax Credit 32 23 d d d
* Data for the energy conservation tax credit are included with those for the renewable energy tax credit. Notes: "d" denotes the data in the cell were suppressed to prevent potential disclosure of confidential taxpayer information. "na" denotes "not applicable."
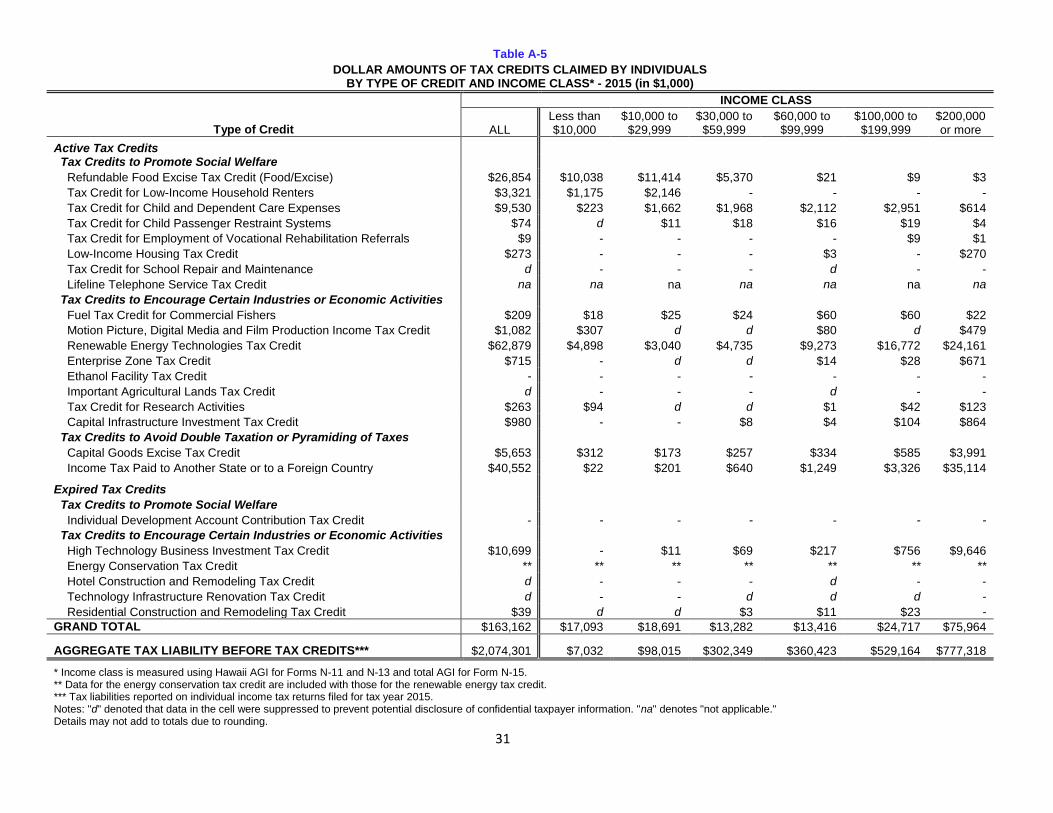
31
Table A-5
DOLLAR AMOUNTS OF TAX CREDITS CLAIMED BY INDIVIDUALS BY TYPE OF CREDIT AND INCOME CLASS* - 2015 (in $1,000)
INCOME CLASS
Type of Credit ALL Less than $10,000
$10,000 to $29,999
$30,000 to $59,999
$60,000 to $99,999
$100,000 to $199,999
$200,000 or more
Active Tax Credits Tax Credits to Promote Social Welfare
Refundable Food Excise Tax Credit (Food/Excise) $26,854 $10,038 $11,414 $5,370 $21 $9 $3
Tax Credit for Low-Income Household Renters $3,321 $1,175 $2,146 - - - -
Tax Credit for Child and Dependent Care Expenses $9,530 $223 $1,662 $1,968 $2,112 $2,951 $614
Tax Credit for Child Passenger Restraint Systems $74 d $11 $18 $16 $19 $4
Tax Credit for Employment of Vocational Rehabilitation Referrals $9 - - - - $9 $1
Low-Income Housing Tax Credit $273 - - - $3 - $270
Tax Credit for School Repair and Maintenance d - - - d - -
Lifeline Telephone Service Tax Credit na na na na na na na
Tax Credits to Encourage Certain Industries or Economic Activities Fuel Tax Credit for Commercial Fishers $209 $18 $25 $24 $60 $60 $22
Motion Picture, Digital Media and Film Production Income Tax Credit $1,082 $307 d d $80 d $479
Renewable Energy Technologies Tax Credit $62,879 $4,898 $3,040 $4,735 $9,273 $16,772 $24,161
Enterprise Zone Tax Credit $715 - d d $14 $28 $671
Ethanol Facility Tax Credit - - - - - - -
Important Agricultural Lands Tax Credit d - - - d - -
Tax Credit for Research Activities $263 $94 d d $1 $42 $123
Capital Infrastructure Investment Tax Credit $980 - - $8 $4 $104 $864
Tax Credits to Avoid Double Taxation or Pyramiding of Taxes Capital Goods Excise Tax Credit $5,653 $312 $173 $257 $334 $585 $3,991
Income Tax Paid to Another State or to a Foreign Country $40,552 $22 $201 $640 $1,249 $3,326 $35,114
Expired Tax Credits Tax Credits to Promote Social Welfare Individual Development Account Contribution Tax Credit - - - - - - -
Tax Credits to Encourage Certain Industries or Economic Activities High Technology Business Investment Tax Credit $10,699 - $11 $69 $217 $756 $9,646
Energy Conservation Tax Credit ** ** ** ** ** ** **
Hotel Construction and Remodeling Tax Credit d - - - d - -
Technology Infrastructure Renovation Tax Credit d - - d d d -
Residential Construction and Remodeling Tax Credit $39 d d $3 $11 $23 -
GRAND TOTAL $163,162 $17,093 $18,691 $13,282 $13,416 $24,717 $75,964
AGGREGATE TAX LIABILITY BEFORE TAX CREDITS*** $2,074,301 $7,032 $98,015 $302,349 $360,423 $529,164 $777,318
* Income class is measured using Hawaii AGI for Forms N-11 and N-13 and total AGI for Form N-15.
** Data for the energy conservation tax credit are included with those for the renewable energy tax credit.
*** Tax liabilities reported on individual income tax returns filed for tax year 2015.
Notes: "d" denoted that data in the cell were suppressed to prevent potential disclosure of confidential taxpayer information. "na" denotes "not applicable."
Details may not add to totals due to rounding.
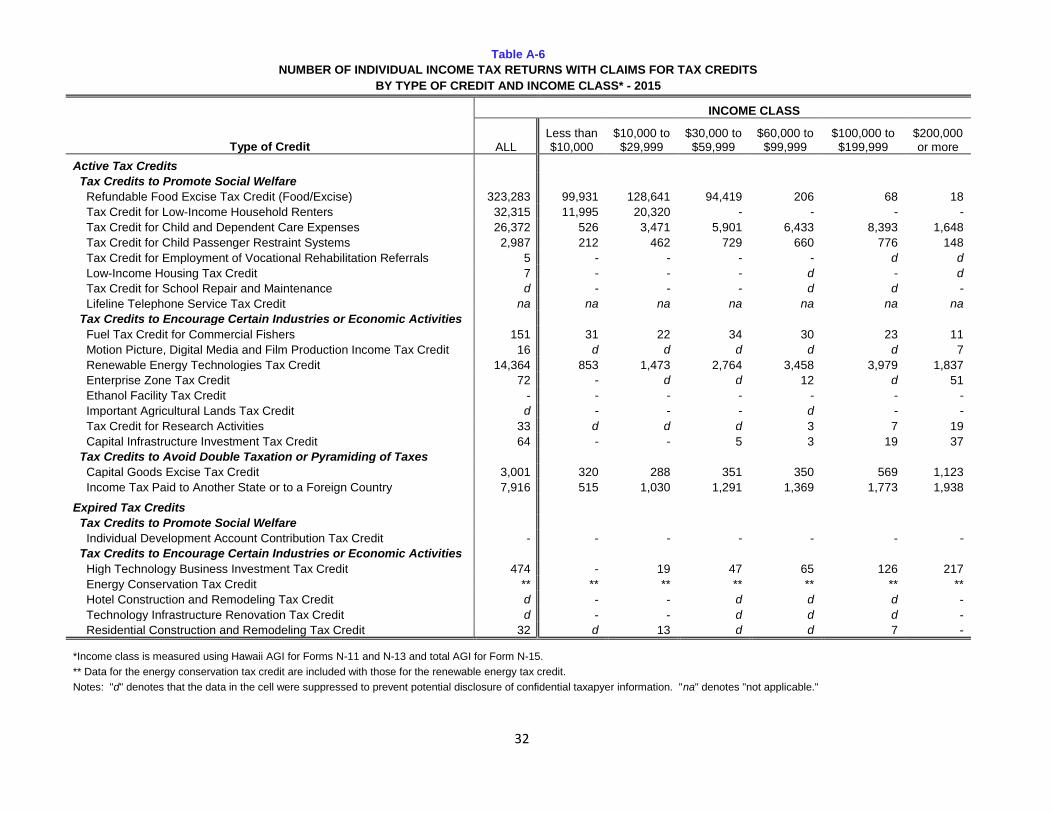
32
Table A-6
NUMBER OF INDIVIDUAL INCOME TAX RETURNS WITH CLAIMS FOR TAX CREDITS
BY TYPE OF CREDIT AND INCOME CLASS* - 2015
INCOME CLASS
Type of Credit ALL Less than $10,000
$10,000 to $29,999
$30,000 to $59,999
$60,000 to $99,999
$100,000 to $199,999
$200,000 or more
Active Tax Credits Tax Credits to Promote Social Welfare
Refundable Food Excise Tax Credit (Food/Excise) 323,283 99,931 128,641 94,419 206 68 18
Tax Credit for Low-Income Household Renters 32,315 11,995 20,320 - - - -
Tax Credit for Child and Dependent Care Expenses 26,372 526 3,471 5,901 6,433 8,393 1,648
Tax Credit for Child Passenger Restraint Systems 2,987 212 462 729 660 776 148
Tax Credit for Employment of Vocational Rehabilitation Referrals 5 - - - - d d
Low-Income Housing Tax Credit 7 - - - d - d
Tax Credit for School Repair and Maintenance d - - - d d -
Lifeline Telephone Service Tax Credit na na na na na na na
Tax Credits to Encourage Certain Industries or Economic Activities Fuel Tax Credit for Commercial Fishers 151 31 22 34 30 23 11
Motion Picture, Digital Media and Film Production Income Tax Credit 16 d d d d d 7
Renewable Energy Technologies Tax Credit 14,364 853 1,473 2,764 3,458 3,979 1,837
Enterprise Zone Tax Credit 72 - d d 12 d 51
Ethanol Facility Tax Credit - - - - - - -
Important Agricultural Lands Tax Credit d - - - d - -
Tax Credit for Research Activities 33 d d d 3 7 19
Capital Infrastructure Investment Tax Credit 64 - - 5 3 19 37
Tax Credits to Avoid Double Taxation or Pyramiding of Taxes Capital Goods Excise Tax Credit 3,001 320 288 351 350 569 1,123
Income Tax Paid to Another State or to a Foreign Country 7,916 515 1,030 1,291 1,369 1,773 1,938
Expired Tax Credits Tax Credits to Promote Social Welfare Individual Development Account Contribution Tax Credit - - - - - - -
Tax Credits to Encourage Certain Industries or Economic Activities High Technology Business Investment Tax Credit 474 - 19 47 65 126 217
Energy Conservation Tax Credit ** ** ** ** ** ** **
Hotel Construction and Remodeling Tax Credit d - - d d d -
Technology Infrastructure Renovation Tax Credit d - - d d d -
Residential Construction and Remodeling Tax Credit 32 d 13 d d 7 -
*Income class is measured using Hawaii AGI for Forms N-11 and N-13 and total AGI for Form N-15. ** Data for the energy conservation tax credit are included with those for the renewable energy tax credit.
Notes: "d" denotes that the data in the cell were suppressed to prevent potential disclosure of confidential taxapyer information. "na" denotes "not applicable."

33
APPENDIX B
TAX CREDIT HISTORY
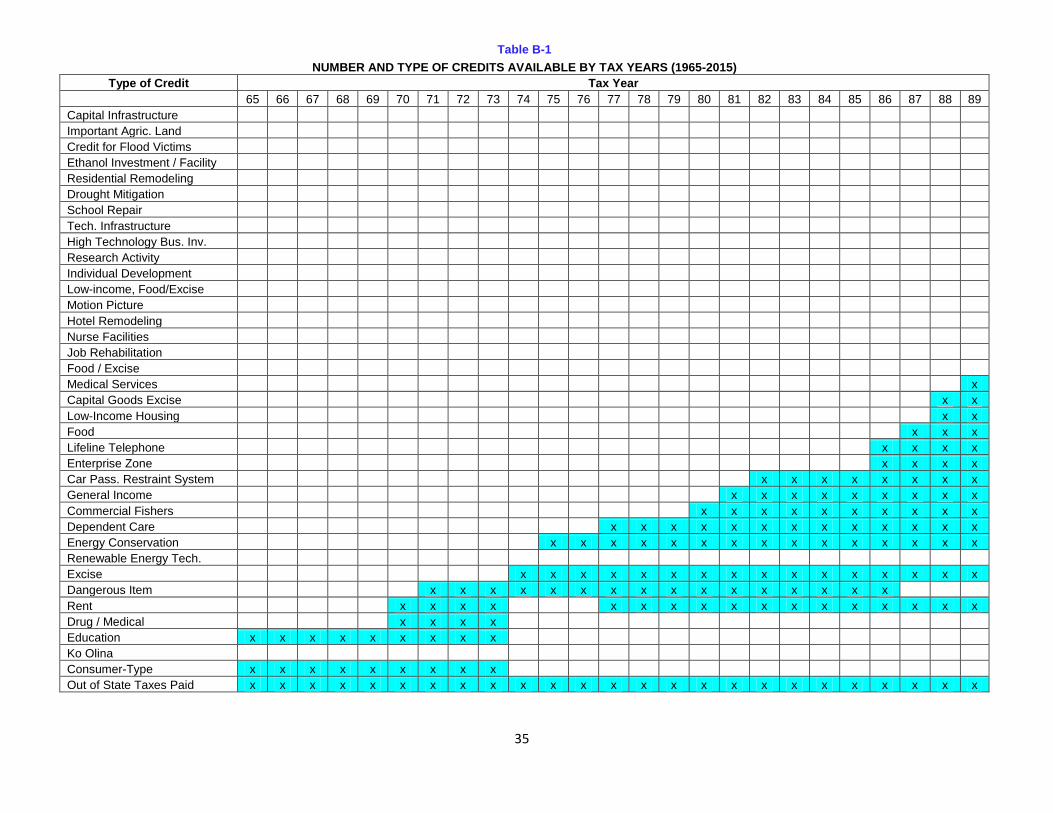
35
Table B-1
NUMBER AND TYPE OF CREDITS AVAILABLE BY TAX YEARS (1965-2015)
Type of Credit Tax Year
65 66 67 68 69 70 71 72 73 74 75 76 77 78 79 80 81 82 83 84 85 86 87 88 89
Capital Infrastructure
Important Agric. Land
Credit for Flood Victims
Ethanol Investment / Facility
Residential Remodeling
Drought Mitigation
School Repair
Tech. Infrastructure
High Technology Bus. Inv.
Research Activity
Individual Development
Low-income, Food/Excise
Motion Picture
Hotel Remodeling
Nurse Facilities
Job Rehabilitation
Food / Excise
Medical Services x
Capital Goods Excise x x
Low-Income Housing x x
Food x x x
Lifeline Telephone x x x x
Enterprise Zone x x x x
Car Pass. Restraint System x x x x x x x x
General Income x x x x x x x x x
Commercial Fishers x x x x x x x x x x
Dependent Care x x x x x x x x x x x x x
Energy Conservation x x x x x x x x x x x x x x x
Renewable Energy Tech.
Excise x x x x x x x x x x x x x x x x
Dangerous Item x x x x x x x x x x x x x x x x
Rent x x x x x x x x x x x x x x x x x
Drug / Medical x x x x
Education x x x x x x x x x
Ko Olina
Consumer-Type x x x x x x x x x
Out of State Taxes Paid x x x x x x x x x x x x x x x x x x x x x x x x x
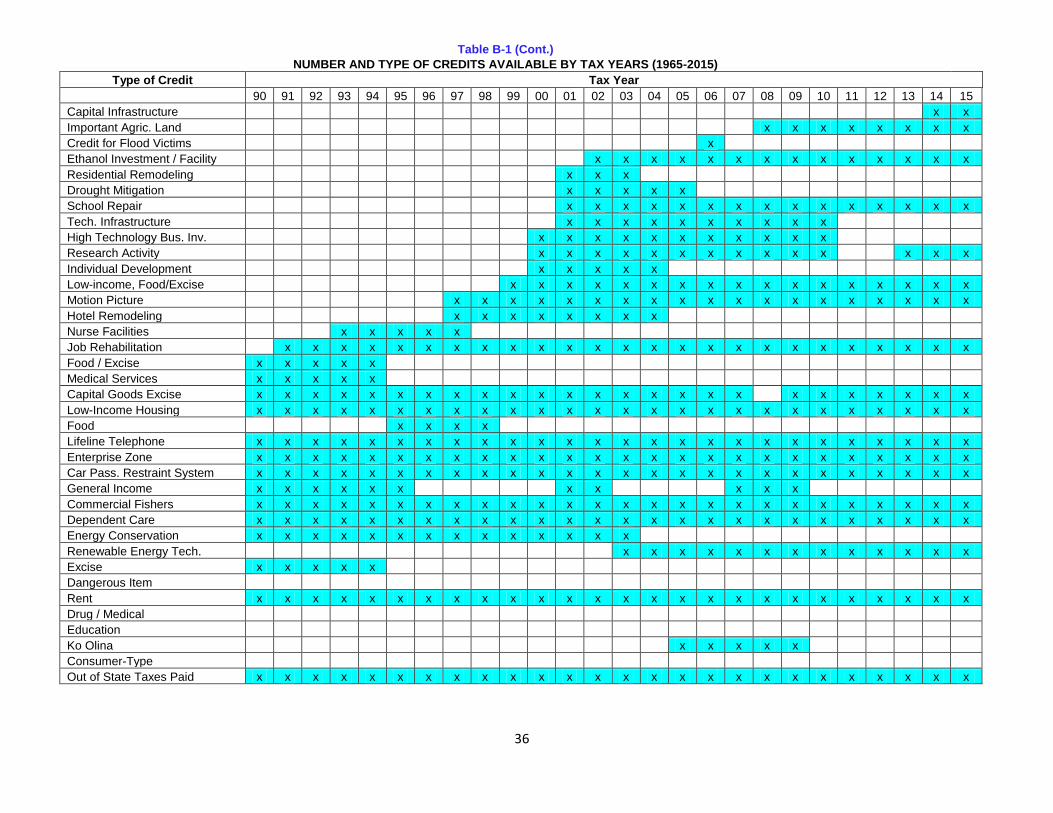
36
Table B-1 (Cont.)
NUMBER AND TYPE OF CREDITS AVAILABLE BY TAX YEARS (1965-2015)
Type of Credit Tax Year
90 91 92 93 94 95 96 97 98 99 00 01 02 03 04 05 06 07 08 09 10 11 12 13 14 15
Capital Infrastructure x x
Important Agric. Land x x x x x x x x
Credit for Flood Victims x
Ethanol Investment / Facility x x x x x x x x x x x x x x
Residential Remodeling x x x
Drought Mitigation x x x x x
School Repair x x x x x x x x x x x x x x x
Tech. Infrastructure x x x x x x x x x x
High Technology Bus. Inv. x x x x x x x x x x x
Research Activity x x x x x x x x x x x x x x
Individual Development x x x x x
Low-income, Food/Excise x x x x x x x x x x x x x x x x x
Motion Picture x x x x x x x x x x x x x x x x x x x
Hotel Remodeling x x x x x x x x
Nurse Facilities x x x x x
Job Rehabilitation x x x x x x x x x x x x x x x x x x x x x x x x x
Food / Excise x x x x x
Medical Services x x x x x
Capital Goods Excise x x x x x x x x x x x x x x x x x x x x x x x x x
Low-Income Housing x x x x x x x x x x x x x x x x x x x x x x x x x x
Food x x x x
Lifeline Telephone x x x x x x x x x x x x x x x x x x x x x x x x x x
Enterprise Zone x x x x x x x x x x x x x x x x x x x x x x x x x x
Car Pass. Restraint System x x x x x x x x x x x x x x x x x x x x x x x x x x
General Income x x x x x x x x x x x
Commercial Fishers x x x x x x x x x x x x x x x x x x x x x x x x x x
Dependent Care x x x x x x x x x x x x x x x x x x x x x x x x x x
Energy Conservation x x x x x x x x x x x x x x
Renewable Energy Tech. x x x x x x x x x x x x x
Excise x x x x x
Dangerous Item
Rent x x x x x x x x x x x x x x x x x x x x x x x x x x
Drug / Medical
Education
Ko Olina x x x x x
Consumer-Type
Out of State Taxes Paid x x x x x x x x x x x x x x x x x x x x x x x x x x
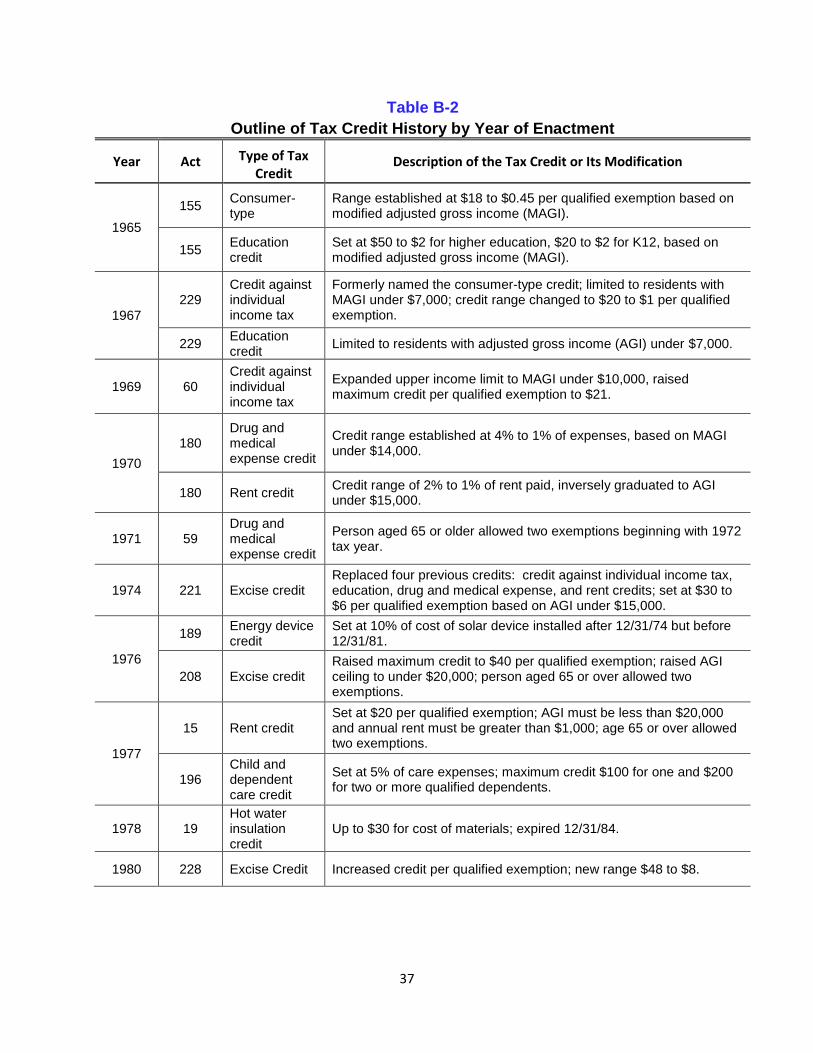
37
Table B-2
Outline of Tax Credit History by Year of Enactment
Year Act Type of Tax Credit
Description of the Tax Credit or Its Modification
1965
155 Consumer-type
Range established at $18 to $0.45 per qualified exemption based on modified adjusted gross income (MAGI).
155 Education credit
Set at $50 to $2 for higher education, $20 to $2 for K12, based on modified adjusted gross income (MAGI).
1967
229 Credit against individual income tax
Formerly named the consumer-type credit; limited to residents with MAGI under $7,000; credit range changed to $20 to $1 per qualified exemption.
229 Education credit
Limited to residents with adjusted gross income (AGI) under $7,000.
1969 60 Credit against individual income tax
Expanded upper income limit to MAGI under $10,000, raised maximum credit per qualified exemption to $21.
1970
180 Drug and medical expense credit
Credit range established at 4% to 1% of expenses, based on MAGI under $14,000.
180 Rent credit Credit range of 2% to 1% of rent paid, inversely graduated to AGI under $15,000.
1971 59 Drug and medical expense credit
Person aged 65 or older allowed two exemptions beginning with 1972 tax year.
1974 221 Excise credit Replaced four previous credits: credit against individual income tax, education, drug and medical expense, and rent credits; set at $30 to $6 per qualified exemption based on AGI under $15,000.
1976
189 Energy device credit
Set at 10% of cost of solar device installed after 12/31/74 but before 12/31/81.
208 Excise credit Raised maximum credit to $40 per qualified exemption; raised AGI ceiling to under $20,000; person aged 65 or over allowed two exemptions.
1977
15 Rent credit Set at $20 per qualified exemption; AGI must be less than $20,000 and annual rent must be greater than $1,000; age 65 or over allowed two exemptions.
196 Child and dependent care credit
Set at 5% of care expenses; maximum credit $100 for one and $200 for two or more qualified dependents.
1978 19 Hot water insulation credit
Up to $30 for cost of materials; expired 12/31/84.
1980 228 Excise Credit Increased credit per qualified exemption; new range $48 to $8.
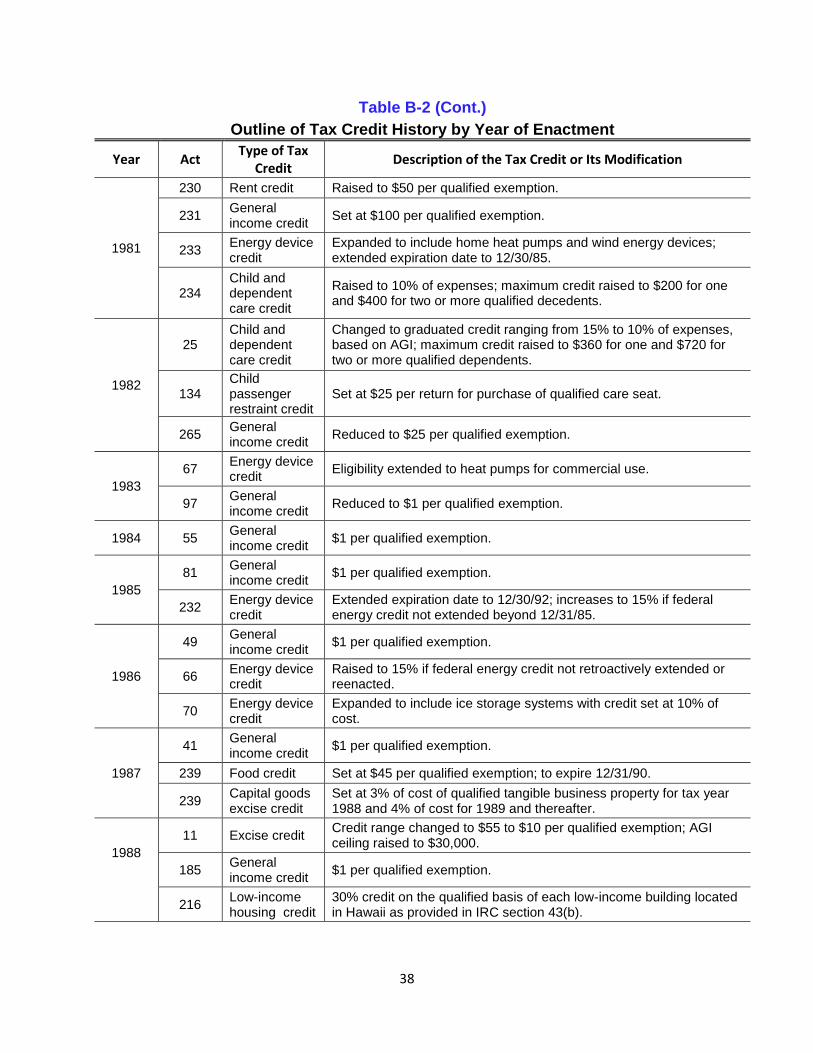
38
Table B-2 (Cont.)
Outline of Tax Credit History by Year of Enactment
Year Act Type of Tax
Credit Description of the Tax Credit or Its Modification
1981
230 Rent credit Raised to $50 per qualified exemption.
231 General income credit
Set at $100 per qualified exemption.
233 Energy device credit
Expanded to include home heat pumps and wind energy devices; extended expiration date to 12/30/85.
234 Child and dependent care credit
Raised to 10% of expenses; maximum credit raised to $200 for one and $400 for two or more qualified decedents.
1982
25 Child and dependent care credit
Changed to graduated credit ranging from 15% to 10% of expenses, based on AGI; maximum credit raised to $360 for one and $720 for two or more qualified dependents.
134 Child passenger restraint credit
Set at $25 per return for purchase of qualified care seat.
265 General income credit
Reduced to $25 per qualified exemption.
1983
67 Energy device credit
Eligibility extended to heat pumps for commercial use.
97 General income credit
Reduced to $1 per qualified exemption.
1984 55 General income credit
$1 per qualified exemption.
1985
81 General income credit
$1 per qualified exemption.
232 Energy device credit
Extended expiration date to 12/30/92; increases to 15% if federal energy credit not extended beyond 12/31/85.
1986
49 General income credit
$1 per qualified exemption.
66 Energy device credit
Raised to 15% if federal energy credit not retroactively extended or reenacted.
70 Energy device credit
Expanded to include ice storage systems with credit set at 10% of cost.
1987
41 General income credit
$1 per qualified exemption.
239 Food credit Set at $45 per qualified exemption; to expire 12/31/90.
239 Capital goods excise credit
Set at 3% of cost of qualified tangible business property for tax year 1988 and 4% of cost for 1989 and thereafter.
1988
11 Excise credit Credit range changed to $55 to $10 per qualified exemption; AGI ceiling raised to $30,000.
185 General income credit
$1 per qualified exemption.
216
Low-income housing credit
30% credit on the qualified basis of each low-income building located in Hawaii as provided in IRC section 43(b).
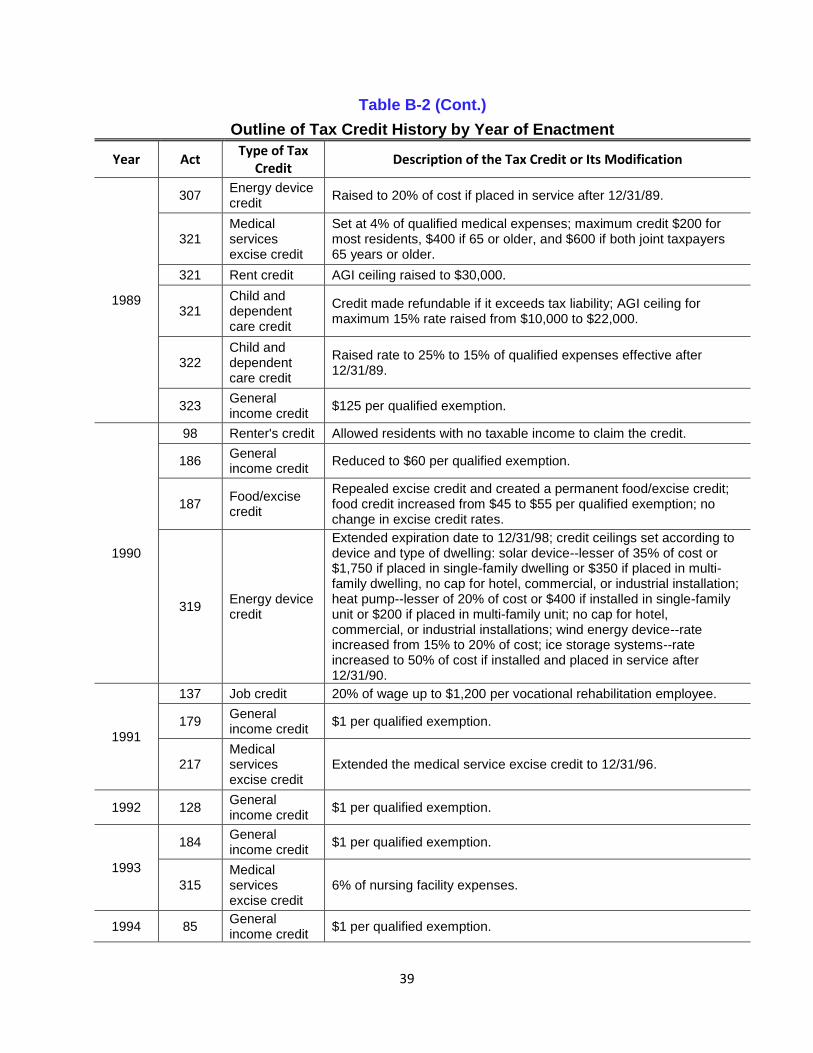
39
Table B-2 (Cont.)
Outline of Tax Credit History by Year of Enactment
Year Act Type of Tax
Credit Description of the Tax Credit or Its Modification
1989
307 Energy device credit
Raised to 20% of cost if placed in service after 12/31/89.
321 Medical services excise credit
Set at 4% of qualified medical expenses; maximum credit $200 for most residents, $400 if 65 or older, and $600 if both joint taxpayers 65 years or older.
321 Rent credit AGI ceiling raised to $30,000.
321 Child and dependent care credit
Credit made refundable if it exceeds tax liability; AGI ceiling for maximum 15% rate raised from $10,000 to $22,000.
322 Child and dependent care credit
Raised rate to 25% to 15% of qualified expenses effective after 12/31/89.
323 General income credit
$125 per qualified exemption.
1990
98 Renter's credit Allowed residents with no taxable income to claim the credit.
186 General income credit
Reduced to $60 per qualified exemption.
187 Food/excise credit
Repealed excise credit and created a permanent food/excise credit; food credit increased from $45 to $55 per qualified exemption; no change in excise credit rates.
319 Energy device credit
Extended expiration date to 12/31/98; credit ceilings set according to device and type of dwelling: solar device--lesser of 35% of cost or $1,750 if placed in single-family dwelling or $350 if placed in multi-family dwelling, no cap for hotel, commercial, or industrial installation; heat pump--lesser of 20% of cost or $400 if installed in single-family unit or $200 if placed in multi-family unit; no cap for hotel, commercial, or industrial installations; wind energy device--rate increased from 15% to 20% of cost; ice storage systems--rate increased to 50% of cost if installed and placed in service after 12/31/90.
1991
137 Job credit 20% of wage up to $1,200 per vocational rehabilitation employee.
179 General income credit
$1 per qualified exemption.
217 Medical services excise credit
Extended the medical service excise credit to 12/31/96.
1992 128 General income credit
$1 per qualified exemption.
1993
184 General income credit
$1 per qualified exemption.
315 Medical services excise credit
6% of nursing facility expenses.
1994 85 General income credit
$1 per qualified exemption.
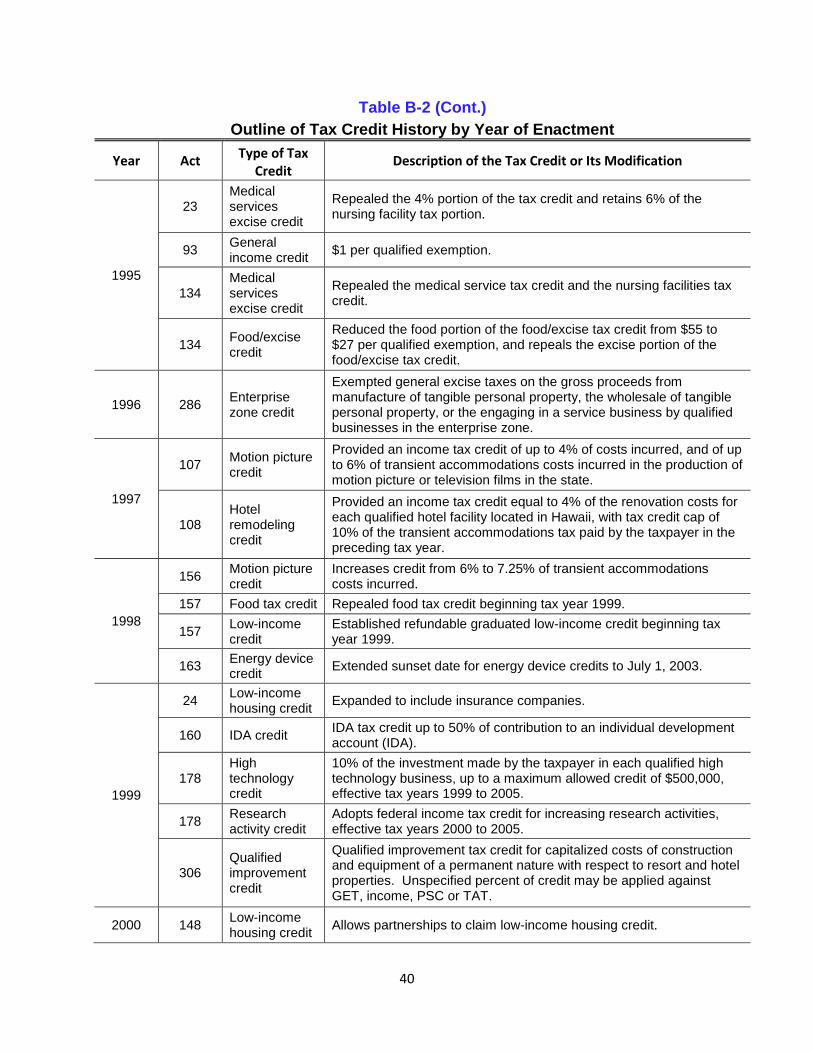
40
Table B-2 (Cont.)
Outline of Tax Credit History by Year of Enactment
Year Act Type of Tax
Credit Description of the Tax Credit or Its Modification
1995
23 Medical services excise credit
Repealed the 4% portion of the tax credit and retains 6% of the nursing facility tax portion.
93 General income credit
$1 per qualified exemption.
134 Medical services excise credit
Repealed the medical service tax credit and the nursing facilities tax credit.
134 Food/excise credit
Reduced the food portion of the food/excise tax credit from $55 to $27 per qualified exemption, and repeals the excise portion of the food/excise tax credit.
1996 286 Enterprise zone credit
Exempted general excise taxes on the gross proceeds from manufacture of tangible personal property, the wholesale of tangible personal property, or the engaging in a service business by qualified businesses in the enterprise zone.
1997
107 Motion picture credit
Provided an income tax credit of up to 4% of costs incurred, and of up to 6% of transient accommodations costs incurred in the production of motion picture or television films in the state.
108 Hotel remodeling credit
Provided an income tax credit equal to 4% of the renovation costs for each qualified hotel facility located in Hawaii, with tax credit cap of 10% of the transient accommodations tax paid by the taxpayer in the preceding tax year.
1998
156 Motion picture credit
Increases credit from 6% to 7.25% of transient accommodations costs incurred.
157 Food tax credit Repealed food tax credit beginning tax year 1999.
157 Low-income credit
Established refundable graduated low-income credit beginning tax year 1999.
163 Energy device credit
Extended sunset date for energy device credits to July 1, 2003.
1999
24 Low-income housing credit
Expanded to include insurance companies.
160 IDA credit IDA tax credit up to 50% of contribution to an individual development account (IDA).
178 High technology credit
10% of the investment made by the taxpayer in each qualified high technology business, up to a maximum allowed credit of $500,000, effective tax years 1999 to 2005.
178 Research activity credit
Adopts federal income tax credit for increasing research activities, effective tax years 2000 to 2005.
306 Qualified improvement credit
Qualified improvement tax credit for capitalized costs of construction and equipment of a permanent nature with respect to resort and hotel properties. Unspecified percent of credit may be applied against GET, income, PSC or TAT.
2000 148 Low-income housing credit
Allows partnerships to claim low-income housing credit.
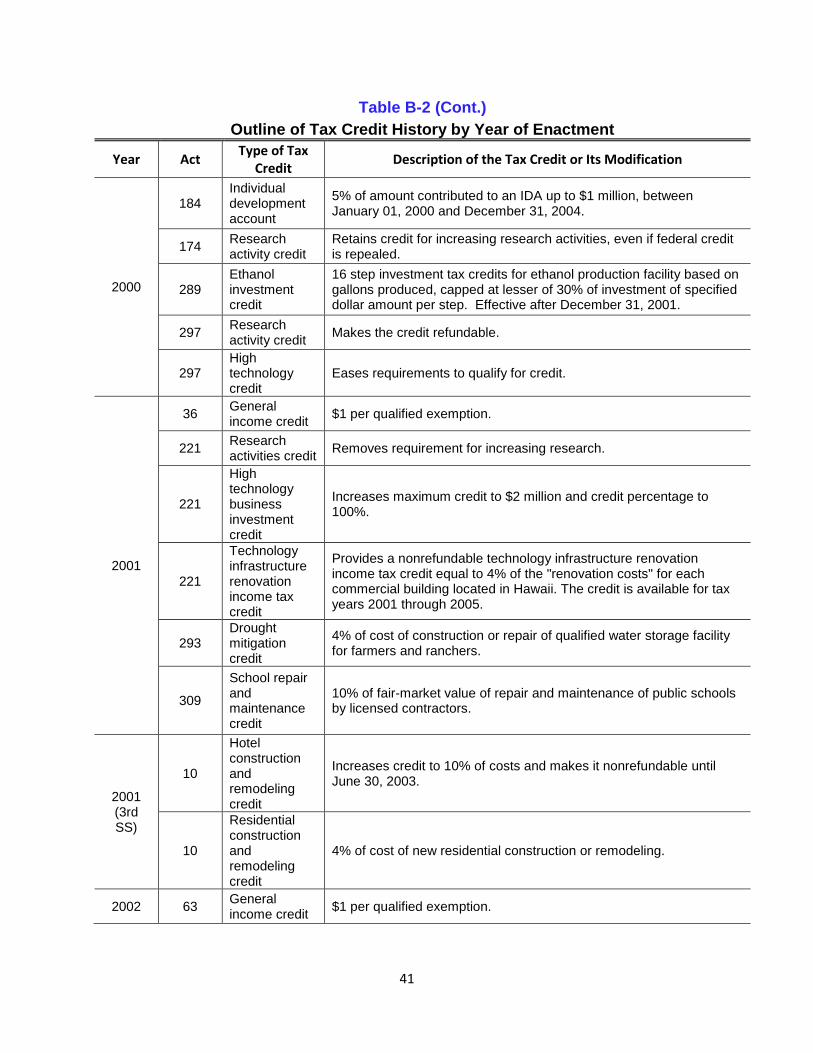
41
Table B-2 (Cont.)
Outline of Tax Credit History by Year of Enactment
Year Act Type of Tax
Credit Description of the Tax Credit or Its Modification
2000
184 Individual development account
5% of amount contributed to an IDA up to $1 million, between January 01, 2000 and December 31, 2004.
174 Research activity credit
Retains credit for increasing research activities, even if federal credit is repealed.
289 Ethanol investment credit
16 step investment tax credits for ethanol production facility based on gallons produced, capped at lesser of 30% of investment of specified dollar amount per step. Effective after December 31, 2001.
297 Research activity credit
Makes the credit refundable.
297 High technology credit
Eases requirements to qualify for credit.
2001
36 General income credit
$1 per qualified exemption.
221 Research activities credit
Removes requirement for increasing research.
221
High technology business investment credit
Increases maximum credit to $2 million and credit percentage to 100%.
221
Technology infrastructure renovation income tax credit
Provides a nonrefundable technology infrastructure renovation income tax credit equal to 4% of the "renovation costs" for each commercial building located in Hawaii. The credit is available for tax years 2001 through 2005.
293 Drought mitigation credit
4% of cost of construction or repair of qualified water storage facility for farmers and ranchers.
309
School repair and maintenance credit
10% of fair-market value of repair and maintenance of public schools by licensed contractors.
2001 (3rd SS)
10
Hotel construction and remodeling credit
Increases credit to 10% of costs and makes it nonrefundable until June 30, 2003.
10
Residential construction and remodeling credit
4% of cost of new residential construction or remodeling.
2002 63 General income credit
$1 per qualified exemption.
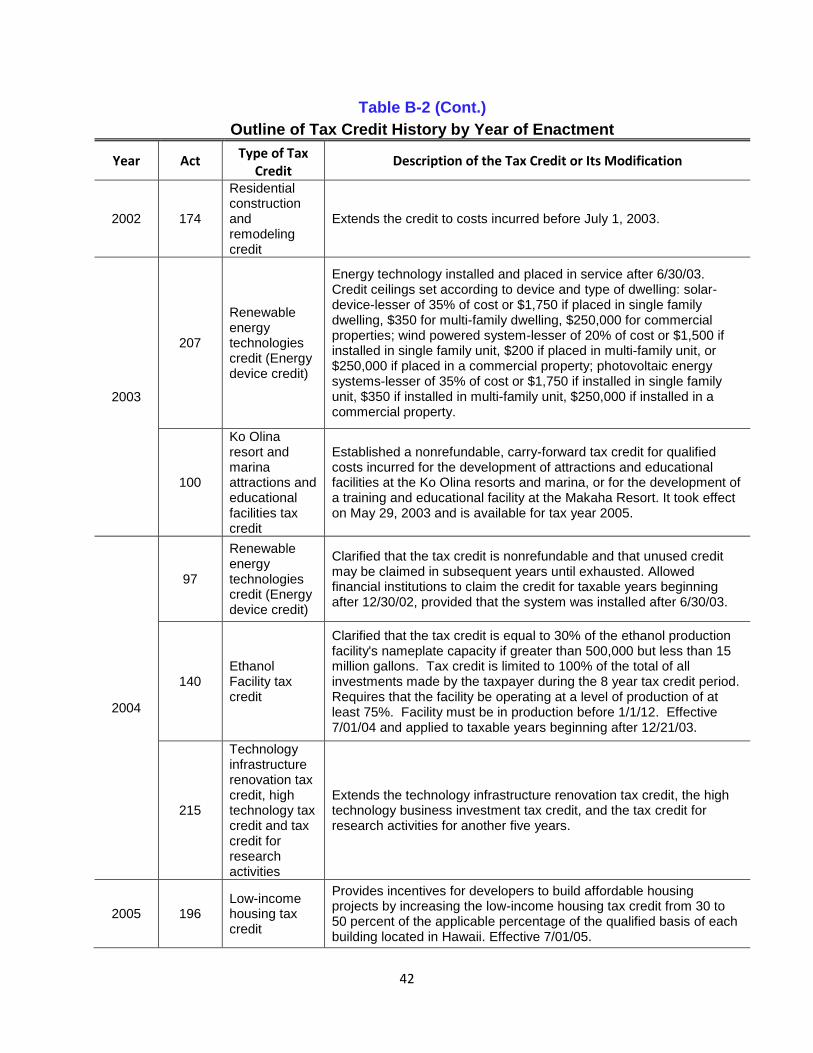
42
Table B-2 (Cont.)
Outline of Tax Credit History by Year of Enactment
Year Act Type of Tax
Credit Description of the Tax Credit or Its Modification
2002 174
Residential construction and remodeling credit
Extends the credit to costs incurred before July 1, 2003.
2003
207
Renewable energy technologies credit (Energy device credit)
Energy technology installed and placed in service after 6/30/03. Credit ceilings set according to device and type of dwelling: solar-device-lesser of 35% of cost or $1,750 if placed in single family dwelling, $350 for multi-family dwelling, $250,000 for commercial properties; wind powered system-lesser of 20% of cost or $1,500 if installed in single family unit, $200 if placed in multi-family unit, or $250,000 if placed in a commercial property; photovoltaic energy systems-lesser of 35% of cost or $1,750 if installed in single family unit, $350 if installed in multi-family unit, $250,000 if installed in a commercial property.
100
Ko Olina resort and marina attractions and educational facilities tax credit
Established a nonrefundable, carry-forward tax credit for qualified costs incurred for the development of attractions and educational facilities at the Ko Olina resorts and marina, or for the development of a training and educational facility at the Makaha Resort. It took effect on May 29, 2003 and is available for tax year 2005.
2004
97
Renewable energy technologies credit (Energy device credit)
Clarified that the tax credit is nonrefundable and that unused credit may be claimed in subsequent years until exhausted. Allowed financial institutions to claim the credit for taxable years beginning after 12/30/02, provided that the system was installed after 6/30/03.
140 Ethanol Facility tax credit
Clarified that the tax credit is equal to 30% of the ethanol production facility's nameplate capacity if greater than 500,000 but less than 15 million gallons. Tax credit is limited to 100% of the total of all investments made by the taxpayer during the 8 year tax credit period. Requires that the facility be operating at a level of production of at least 75%. Facility must be in production before 1/1/12. Effective 7/01/04 and applied to taxable years beginning after 12/21/03.
215
Technology infrastructure renovation tax credit, high technology tax credit and tax credit for research activities
Extends the technology infrastructure renovation tax credit, the high technology business investment tax credit, and the tax credit for research activities for another five years.
2005 196 Low-income housing tax credit
Provides incentives for developers to build affordable housing projects by increasing the low-income housing tax credit from 30 to 50 percent of the applicable percentage of the qualified basis of each building located in Hawaii. Effective 7/01/05.
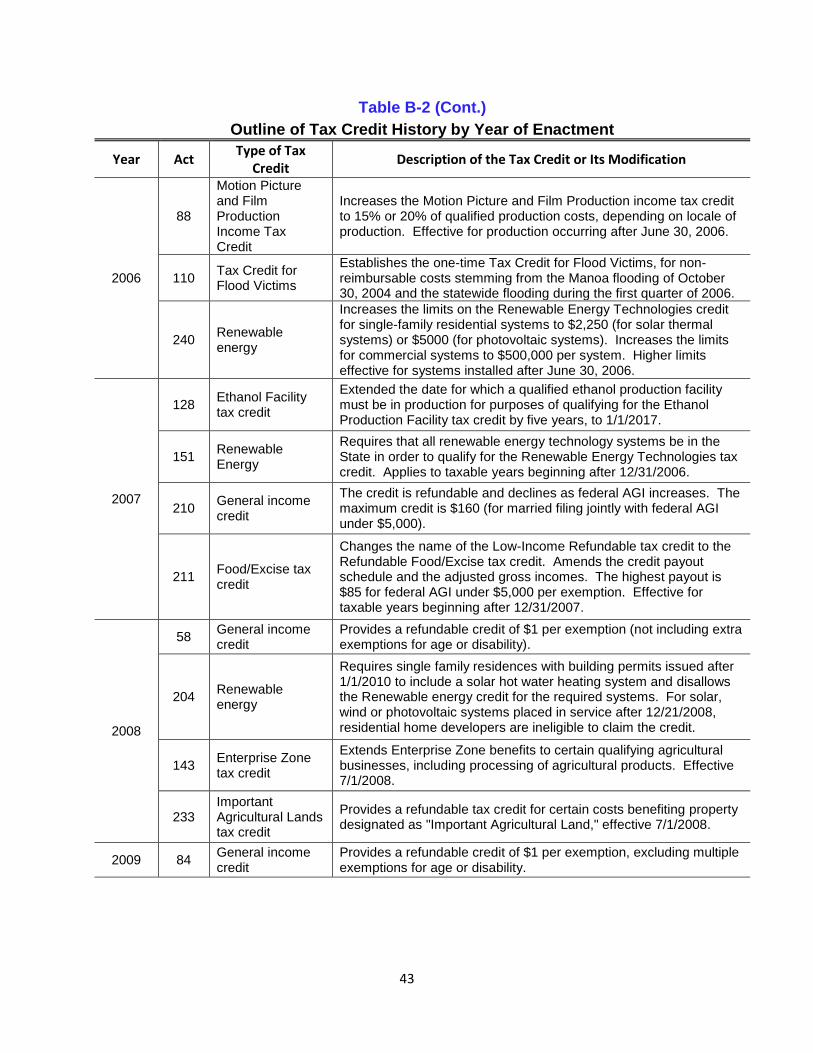
43
Table B-2 (Cont.)
Outline of Tax Credit History by Year of Enactment
Year Act Type of Tax
Credit Description of the Tax Credit or Its Modification
2006
88
Motion Picture and Film Production Income Tax Credit
Increases the Motion Picture and Film Production income tax credit to 15% or 20% of qualified production costs, depending on locale of production. Effective for production occurring after June 30, 2006.
110 Tax Credit for Flood Victims
Establishes the one-time Tax Credit for Flood Victims, for non-reimbursable costs stemming from the Manoa flooding of October 30, 2004 and the statewide flooding during the first quarter of 2006.
240 Renewable energy
Increases the limits on the Renewable Energy Technologies credit for single-family residential systems to $2,250 (for solar thermal systems) or $5000 (for photovoltaic systems). Increases the limits for commercial systems to $500,000 per system. Higher limits effective for systems installed after June 30, 2006.
2007
128 Ethanol Facility tax credit
Extended the date for which a qualified ethanol production facility must be in production for purposes of qualifying for the Ethanol Production Facility tax credit by five years, to 1/1/2017.
151 Renewable Energy
Requires that all renewable energy technology systems be in the State in order to qualify for the Renewable Energy Technologies tax credit. Applies to taxable years beginning after 12/31/2006.
210 General income credit
The credit is refundable and declines as federal AGI increases. The maximum credit is $160 (for married filing jointly with federal AGI under $5,000).
211 Food/Excise tax credit
Changes the name of the Low-Income Refundable tax credit to the Refundable Food/Excise tax credit. Amends the credit payout schedule and the adjusted gross incomes. The highest payout is $85 for federal AGI under $5,000 per exemption. Effective for taxable years beginning after 12/31/2007.
2008
58 General income credit
Provides a refundable credit of $1 per exemption (not including extra exemptions for age or disability).
204 Renewable energy
Requires single family residences with building permits issued after 1/1/2010 to include a solar hot water heating system and disallows the Renewable energy credit for the required systems. For solar, wind or photovoltaic systems placed in service after 12/21/2008, residential home developers are ineligible to claim the credit.
143 Enterprise Zone tax credit
Extends Enterprise Zone benefits to certain qualifying agricultural businesses, including processing of agricultural products. Effective 7/1/2008.
233 Important Agricultural Lands tax credit
Provides a refundable tax credit for certain costs benefiting property designated as "Important Agricultural Land," effective 7/1/2008.
2009 84 General income credit
Provides a refundable credit of $1 per exemption, excluding multiple exemptions for age or disability.
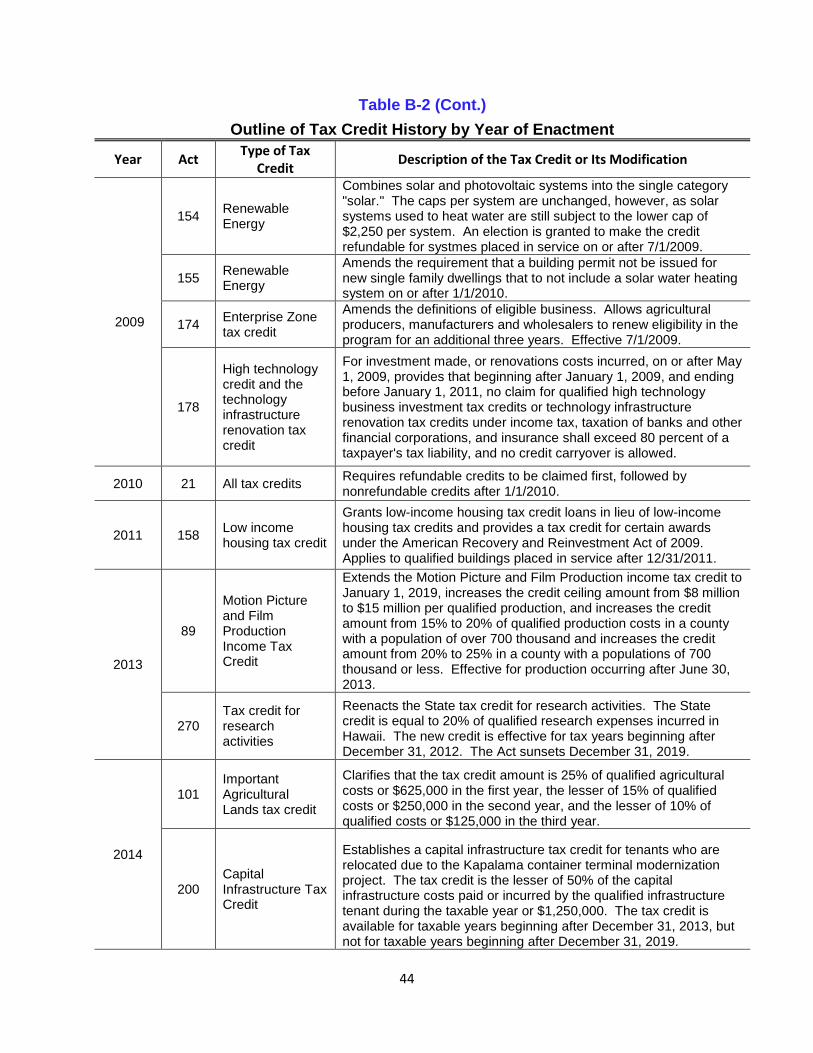
44
Table B-2 (Cont.)
Outline of Tax Credit History by Year of Enactment
Year Act Type of Tax
Credit Description of the Tax Credit or Its Modification
2009
154 Renewable Energy
Combines solar and photovoltaic systems into the single category "solar." The caps per system are unchanged, however, as solar systems used to heat water are still subject to the lower cap of $2,250 per system. An election is granted to make the credit refundable for systmes placed in service on or after 7/1/2009.
155 Renewable Energy
Amends the requirement that a building permit not be issued for new single family dwellings that to not include a solar water heating system on or after 1/1/2010.
174 Enterprise Zone tax credit
Amends the definitions of eligible business. Allows agricultural producers, manufacturers and wholesalers to renew eligibility in the program for an additional three years. Effective 7/1/2009.
178
High technology credit and the technology infrastructure renovation tax credit
For investment made, or renovations costs incurred, on or after May 1, 2009, provides that beginning after January 1, 2009, and ending before January 1, 2011, no claim for qualified high technology business investment tax credits or technology infrastructure renovation tax credits under income tax, taxation of banks and other financial corporations, and insurance shall exceed 80 percent of a taxpayer's tax liability, and no credit carryover is allowed.
2010 21 All tax credits Requires refundable credits to be claimed first, followed by nonrefundable credits after 1/1/2010.
2011 158 Low income housing tax credit
Grants low-income housing tax credit loans in lieu of low-income housing tax credits and provides a tax credit for certain awards under the American Recovery and Reinvestment Act of 2009. Applies to qualified buildings placed in service after 12/31/2011.
2013
89
Motion Picture and Film Production Income Tax Credit
Extends the Motion Picture and Film Production income tax credit to January 1, 2019, increases the credit ceiling amount from $8 million to $15 million per qualified production, and increases the credit amount from 15% to 20% of qualified production costs in a county with a population of over 700 thousand and increases the credit amount from 20% to 25% in a county with a populations of 700 thousand or less. Effective for production occurring after June 30, 2013.
270 Tax credit for research activities
Reenacts the State tax credit for research activities. The State credit is equal to 20% of qualified research expenses incurred in Hawaii. The new credit is effective for tax years beginning after December 31, 2012. The Act sunsets December 31, 2019.
2014
101 Important Agricultural Lands tax credit
Clarifies that the tax credit amount is 25% of qualified agricultural costs or $625,000 in the first year, the lesser of 15% of qualified costs or $250,000 in the second year, and the lesser of 10% of qualified costs or $125,000 in the third year.
200 Capital Infrastructure Tax Credit
Establishes a capital infrastructure tax credit for tenants who are relocated due to the Kapalama container terminal modernization project. The tax credit is the lesser of 50% of the capital infrastructure costs paid or incurred by the qualified infrastructure tenant during the taxable year or $1,250,000. The tax credit is available for taxable years beginning after December 31, 2013, but not for taxable years beginning after December 31, 2019.
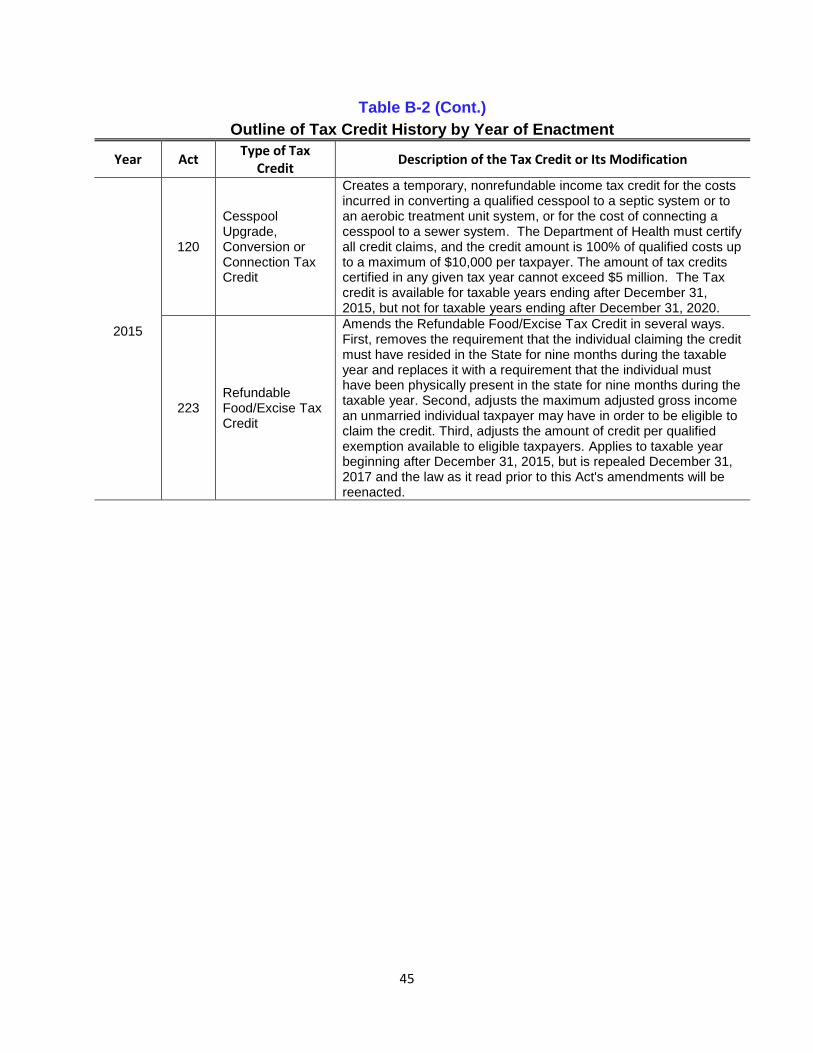
45
Table B-2 (Cont.)
Outline of Tax Credit History by Year of Enactment
Year Act Type of Tax
Credit Description of the Tax Credit or Its Modification
2015
120
Cesspool Upgrade, Conversion or Connection Tax Credit
Creates a temporary, nonrefundable income tax credit for the costs incurred in converting a qualified cesspool to a septic system or to an aerobic treatment unit system, or for the cost of connecting a cesspool to a sewer system. The Department of Health must certify all credit claims, and the credit amount is 100% of qualified costs up to a maximum of $10,000 per taxpayer. The amount of tax credits certified in any given tax year cannot exceed $5 million. The Tax credit is available for taxable years ending after December 31, 2015, but not for taxable years ending after December 31, 2020.
223 Refundable Food/Excise Tax Credit
Amends the Refundable Food/Excise Tax Credit in several ways. First, removes the requirement that the individual claiming the credit must have resided in the State for nine months during the taxable year and replaces it with a requirement that the individual must have been physically present in the state for nine months during the taxable year. Second, adjusts the maximum adjusted gross income an unmarried individual taxpayer may have in order to be eligible to claim the credit. Third, adjusts the amount of credit per qualified exemption available to eligible taxpayers. Applies to taxable year beginning after December 31, 2015, but is repealed December 31, 2017 and the law as it read prior to this Act's amendments will be reenacted.
Hawaii General
Excise & Use Tax
Exemptions Tax Year 2017
DEPARTMENT OF TAXATION
STATE OF HAWAII
STATE OF HAWAII
David Y. Ige, Governor
DEPARTMENT OF TAXATION Maria E. Zielinski, Director Damien A. Elefante, Deputy Director
TAX RESEARCH & PLANNING OFFICE Seth Colby, Tax Research & Planning Officer
Hawaii General
Excise & Use Tax
Exemptions Tax Year 2017
DEPARTMENT OF TAXATION
STATE OF HAWAII
DECEMBER 2017
WEB SITE: tax.hawaii.gov
Table of Contents
Page
INTRODUCTION………………………………………………………………………………………………………….. 1
DATA SOURCE…………………………………………………………………………………………………………...... 2
GENERAL EXCISE & USE TAX EXEMPTIONS …………………………………………………………………. 3
TAX EXPENDITURES…………………………………………………………………………………………………… 6
TAX EXPENDITURES AT WHOLESALE RATE (0.5%)………………………………………….. 8
TAX EXPENDITURE S AT RETAIL RATE (4.0%)………………………………………………….. 9
OPPORTUNITIES TO EXPORT TAX……………………………………………………………………. 10
OTHER EXEMPTIONS……………………………………………………………………………………….. 11
ANNEX…………………………………………………………………………………………………………………………. 13
TABLE A-1: EXEMPTIONS BY GET RATE…………………………………………………………… 12
TABLE A-2: EXEMPTIONS BY BUSINNESS ACTIVITY………………………………………….. 14
TABLE A-3: GET EXEMPTIONS CLAIMED (ALL FILERS)……………………………………… 15
TABLE A-4: DIFF OF EXEMPTIONS OF ALL FILERS AND ELECTRONIC FILERS……….. 16
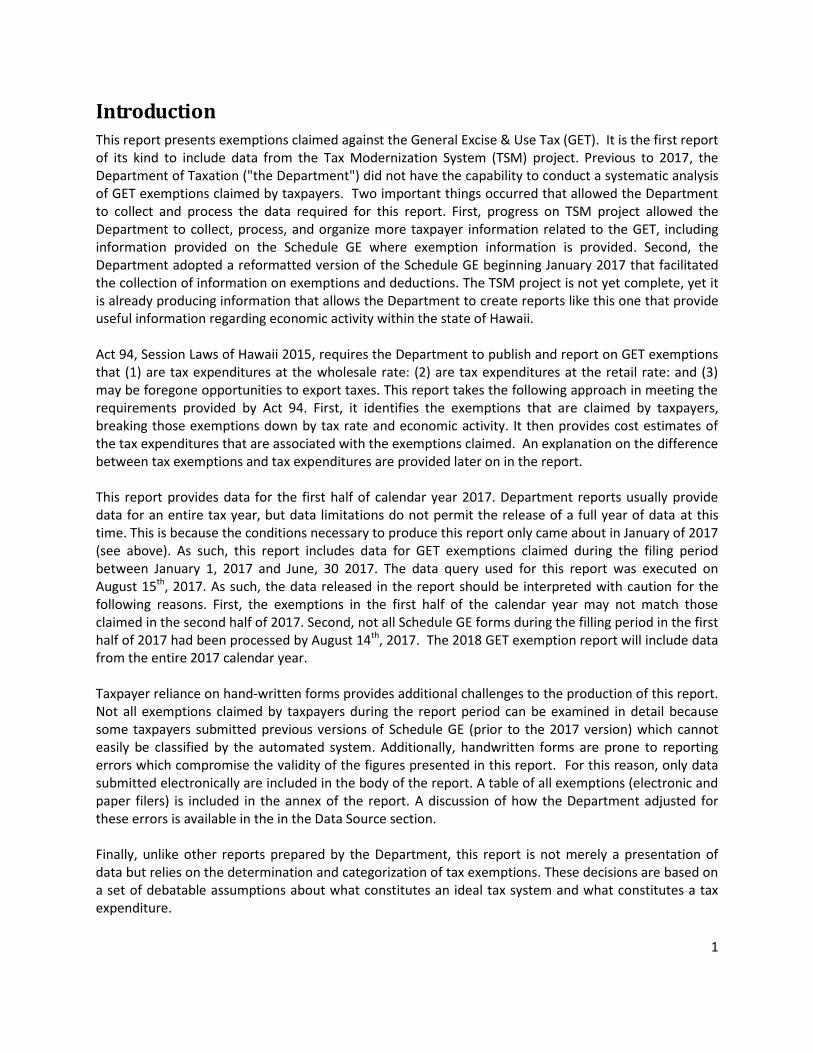
1
Introduction This report presents exemptions claimed against the General Excise & Use Tax (GET). It is the first report of its kind to include data from the Tax Modernization System (TSM) project. Previous to 2017, the Department of Taxation ("the Department") did not have the capability to conduct a systematic analysis of GET exemptions claimed by taxpayers. Two important things occurred that allowed the Department to collect and process the data required for this report. First, progress on TSM project allowed the Department to collect, process, and organize more taxpayer information related to the GET, including information provided on the Schedule GE where exemption information is provided. Second, the Department adopted a reformatted version of the Schedule GE beginning January 2017 that facilitated the collection of information on exemptions and deductions. The TSM project is not yet complete, yet it is already producing information that allows the Department to create reports like this one that provide useful information regarding economic activity within the state of Hawaii. Act 94, Session Laws of Hawaii 2015, requires the Department to publish and report on GET exemptions that (1) are tax expenditures at the wholesale rate: (2) are tax expenditures at the retail rate: and (3) may be foregone opportunities to export taxes. This report takes the following approach in meeting the requirements provided by Act 94. First, it identifies the exemptions that are claimed by taxpayers, breaking those exemptions down by tax rate and economic activity. It then provides cost estimates of the tax expenditures that are associated with the exemptions claimed. An explanation on the difference between tax exemptions and tax expenditures are provided later on in the report. This report provides data for the first half of calendar year 2017. Department reports usually provide data for an entire tax year, but data limitations do not permit the release of a full year of data at this time. This is because the conditions necessary to produce this report only came about in January of 2017 (see above). As such, this report includes data for GET exemptions claimed during the filing period between January 1, 2017 and June, 30 2017. The data query used for this report was executed on August 15th, 2017. As such, the data released in the report should be interpreted with caution for the following reasons. First, the exemptions in the first half of the calendar year may not match those claimed in the second half of 2017. Second, not all Schedule GE forms during the filling period in the first half of 2017 had been processed by August 14th, 2017. The 2018 GET exemption report will include data from the entire 2017 calendar year. Taxpayer reliance on hand-written forms provides additional challenges to the production of this report. Not all exemptions claimed by taxpayers during the report period can be examined in detail because some taxpayers submitted previous versions of Schedule GE (prior to the 2017 version) which cannot easily be classified by the automated system. Additionally, handwritten forms are prone to reporting errors which compromise the validity of the figures presented in this report. For this reason, only data submitted electronically are included in the body of the report. A table of all exemptions (electronic and paper filers) is included in the annex of the report. A discussion of how the Department adjusted for these errors is available in the in the Data Source section. Finally, unlike other reports prepared by the Department, this report is not merely a presentation of data but relies on the determination and categorization of tax exemptions. These decisions are based on a set of debatable assumptions about what constitutes an ideal tax system and what constitutes a tax expenditure.
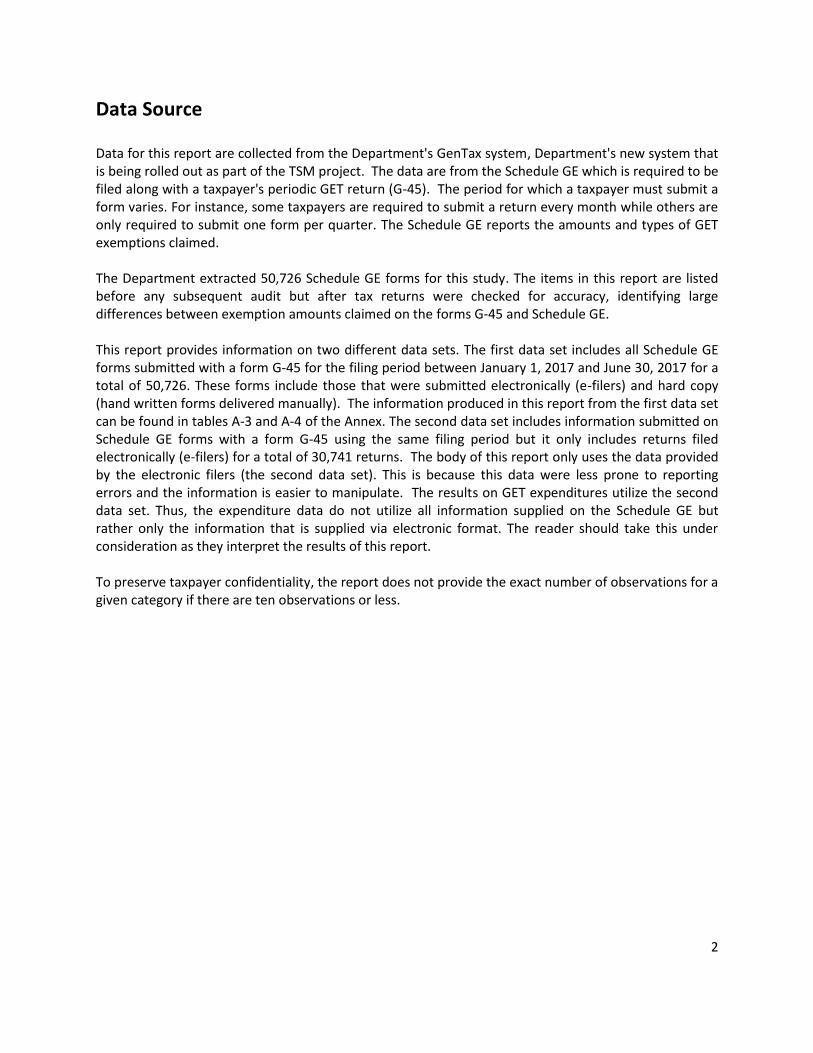
2
Data Source Data for this report are collected from the Department's GenTax system, Department's new system that is being rolled out as part of the TSM project. The data are from the Schedule GE which is required to be filed along with a taxpayer's periodic GET return (G-45). The period for which a taxpayer must submit a form varies. For instance, some taxpayers are required to submit a return every month while others are only required to submit one form per quarter. The Schedule GE reports the amounts and types of GET exemptions claimed. The Department extracted 50,726 Schedule GE forms for this study. The items in this report are listed before any subsequent audit but after tax returns were checked for accuracy, identifying large differences between exemption amounts claimed on the forms G-45 and Schedule GE. This report provides information on two different data sets. The first data set includes all Schedule GE forms submitted with a form G-45 for the filing period between January 1, 2017 and June 30, 2017 for a total of 50,726. These forms include those that were submitted electronically (e-filers) and hard copy (hand written forms delivered manually). The information produced in this report from the first data set can be found in tables A-3 and A-4 of the Annex. The second data set includes information submitted on Schedule GE forms with a form G-45 using the same filing period but it only includes returns filed electronically (e-filers) for a total of 30,741 returns. The body of this report only uses the data provided by the electronic filers (the second data set). This is because this data were less prone to reporting errors and the information is easier to manipulate. The results on GET expenditures utilize the second data set. Thus, the expenditure data do not utilize all information supplied on the Schedule GE but rather only the information that is supplied via electronic format. The reader should take this under consideration as they interpret the results of this report. To preserve taxpayer confidentiality, the report does not provide the exact number of observations for a given category if there are ten observations or less.
3
GET Exemptions
Hawaii taxpayers filing electronically claimed 36,643 exemptions for an amount of $12 billion (see Table 1). The largest exemptions in terms of dollar amount for this data set were Foreign Trade Zone Sales, Non-profit Organizations, Subcontract Deduction, Out of Sate Sales and Drugs and Prosthetic Devices. The most commonly claimed exemptions were Out of State Sales, Taxes Passed On, Subcontract Deduction, Sales to Federal Government and Credit Unions, and Wholesale Transactions. A list of all exemptions claimed by paper and electronically is available in Table A-3 of the annex. Table A-4 of the annex shows some of the differences between the data set for all filers and the data set with only electronic filers. The data set using only electronic filers has 37% fewer GET exemptions claimed but is only 10% less in terms of total dollar amount. Since data set of electronic filers does not include hand-written forms, this implies that hand-written forms comprised 37% of all filers and claimed $1.4 billion worth of exemptions or 10% of total exemptions.
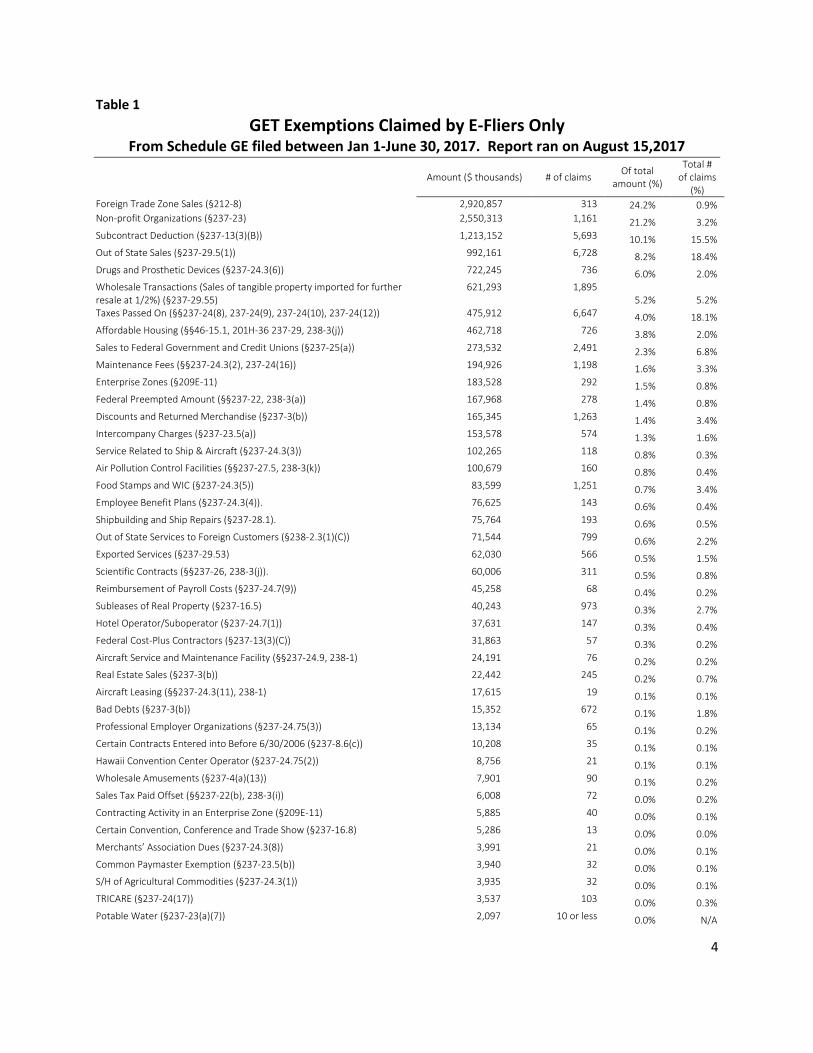
4
Table 1
GET Exemptions Claimed by E-Fliers Only From Schedule GE filed between Jan 1-June 30, 2017. Report ran on August 15,2017
Amount ($ thousands) # of claims
Of total amount (%)
Total # of claims
(%)
Foreign Trade Zone Sales (§212-8) 2,920,857 313 24.2% 0.9% Non-profit Organizations (§237-23) 2,550,313 1,161 21.2% 3.2% Subcontract Deduction (§237-13(3)(B)) 1,213,152 5,693 10.1% 15.5% Out of State Sales (§237-29.5(1)) 992,161 6,728 8.2% 18.4% Drugs and Prosthetic Devices (§237-24.3(6)) 722,245 736 6.0% 2.0% Wholesale Transactions (Sales of tangible property imported for further resale at 1/2%) (§237-29.55)
621,293 1,895 5.2% 5.2%
Taxes Passed On (§§237-24(8), 237-24(9), 237-24(10), 237-24(12)) 475,912 6,647 4.0% 18.1% Affordable Housing (§§46-15.1, 201H-36 237-29, 238-3(j)) 462,718 726 3.8% 2.0% Sales to Federal Government and Credit Unions (§237-25(a)) 273,532 2,491 2.3% 6.8% Maintenance Fees (§§237-24.3(2), 237-24(16)) 194,926 1,198 1.6% 3.3% Enterprise Zones (§209E-11) 183,528 292 1.5% 0.8% Federal Preempted Amount (§§237-22, 238-3(a)) 167,968 278 1.4% 0.8% Discounts and Returned Merchandise (§237-3(b)) 165,345 1,263 1.4% 3.4% Intercompany Charges (§237-23.5(a)) 153,578 574 1.3% 1.6% Service Related to Ship & Aircraft (§237-24.3(3)) 102,265 118 0.8% 0.3% Air Pollution Control Facilities (§§237-27.5, 238-3(k)) 100,679 160 0.8% 0.4% Food Stamps and WIC (§237-24.3(5)) 83,599 1,251 0.7% 3.4% Employee Benefit Plans (§237-24.3(4)). 76,625 143 0.6% 0.4% Shipbuilding and Ship Repairs (§237-28.1). 75,764 193 0.6% 0.5% Out of State Services to Foreign Customers (§238-2.3(1)(C)) 71,544 799 0.6% 2.2% Exported Services (§237-29.53) 62,030 566 0.5% 1.5% Scientific Contracts (§§237-26, 238-3(j)). 60,006 311 0.5% 0.8% Reimbursement of Payroll Costs (§237-24.7(9)) 45,258 68 0.4% 0.2% Subleases of Real Property (§237-16.5) 40,243 973 0.3% 2.7% Hotel Operator/Suboperator (§237-24.7(1)) 37,631 147 0.3% 0.4% Federal Cost-Plus Contractors (§237-13(3)(C)) 31,863 57 0.3% 0.2% Aircraft Service and Maintenance Facility (§§237-24.9, 238-1) 24,191 76 0.2% 0.2% Real Estate Sales (§237-3(b)) 22,442 245 0.2% 0.7% Aircraft Leasing (§§237-24.3(11), 238-1) 17,615 19 0.1% 0.1% Bad Debts (§237-3(b)) 15,352 672 0.1% 1.8% Professional Employer Organizations (§237-24.75(3)) 13,134 65 0.1% 0.2% Certain Contracts Entered into Before 6/30/2006 (§237-8.6(c)) 10,208 35 0.1% 0.1% Hawaii Convention Center Operator (§237-24.75(2)) 8,756 21 0.1% 0.1% Wholesale Amusements (§237-4(a)(13)) 7,901 90 0.1% 0.2% Sales Tax Paid Offset (§§237-22(b), 238-3(i)) 6,008 72 0.0% 0.2% Contracting Activity in an Enterprise Zone (§209E-11) 5,885 40 0.0% 0.1% Certain Convention, Conference and Trade Show (§237-16.8) 5,286 13 0.0% 0.0% Merchants’ Association Dues (§237-24.3(8)) 3,991 21 0.0% 0.1% Common Paymaster Exemption (§237-23.5(b)) 3,940 32 0.0% 0.1% S/H of Agricultural Commodities (§237-24.3(1)) 3,935 32 0.0% 0.1% TRICARE (§237-24(17)) 3,537 103 0.0% 0.3% Potable Water (§237-23(a)(7)) 2,097 10 or less 0.0% N/A
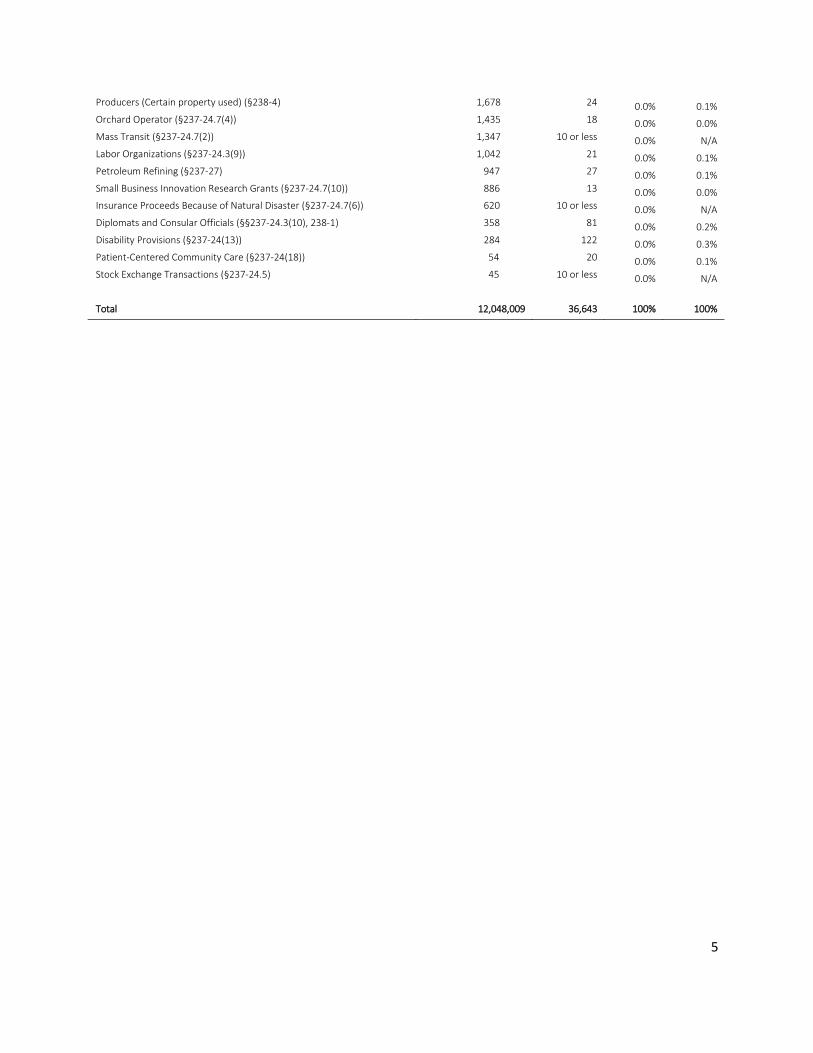
5
Producers (Certain property used) (§238-4) 1,678 24 0.0% 0.1% Orchard Operator (§237-24.7(4)) 1,435 18 0.0% 0.0% Mass Transit (§237-24.7(2)) 1,347 10 or less 0.0% N/A Labor Organizations (§237-24.3(9)) 1,042 21 0.0% 0.1% Petroleum Refining (§237-27) 947 27 0.0% 0.1% Small Business Innovation Research Grants (§237-24.7(10)) 886 13 0.0% 0.0% Insurance Proceeds Because of Natural Disaster (§237-24.7(6)) 620 10 or less 0.0% N/A Diplomats and Consular Officials (§§237-24.3(10), 238-1) 358 81 0.0% 0.2% Disability Provisions (§237-24(13)) 284 122 0.0% 0.3% Patient-Centered Community Care (§237-24(18)) 54 20 0.0% 0.1% Stock Exchange Transactions (§237-24.5) 45 10 or less 0.0% N/A
Total 12,048,009 36,643 100% 100%
6
Tax Expenditures The prior section of the report focused on total GET exemptions. A tax expenditure is not the same as a tax exemption. For purposes of this report, tax expenditures are revenues losses attributable to provisions in the State tax laws which allow a special exclusion, exemption, or deduction from the gross receipts tax. These exemptions (or tax breaks) that are deviations from a uniform tax on consumption of residents. Tax expenditures are the implied revenue cost of the deviation from a uniform application of the excise and use tax. These exceptions may be viewed as alternatives to other policy instruments, such as spending or regulatory programs. This report presents GET exemptions that are tax expenditures at the wholesale rate (0.5%) and the retail rate (4.0%), and also presents tax exemptions that are not tax expenditures but may represent opportunities to export the tax burden. The methodology used in this paper for estimating tax expenditures came from the methodology put forth by Rousslang (2013).1 It is important to understand that the decision to label exemptions as tax expenditures at the wholesale or retail rate or not as tax expenditures at all is based on economic parameters and assumptions and is subject to debate. Thus, if the Department's assumptions change, then the distribution of exemptions among the categories may change. In presenting data on tax exemptions, it is crucial that a clear distinction be made between tax expenditures and revenue estimates. The data presented in this report should not be relied on as an estimate of the amount of revenue that may be realized by repealing an exemption. The reason is that the data presented in this report provide only the amounts of each exemption claimed. Substitution and behavioral factors must be accounted for to properly estimate the revenue effect of repealing an exemption Substitution means that if a certain exemption is repealed, a portion of the taxpayers that had been claiming the repealed exemption may be entitled to claim a different exemption for the same activity. As an example, take the enterprise zone exemption. It is possible that taxpayers engaged in business in enterprise zones are exporting the goods and services they sell. Thus, if the enterprise zone exemption were repealed, the taxpayer may instead claim the exported goods and services exemption. This would limit the revenue impact to some amount smaller than the amount claimed under the enterprise zone exemption. Behavioral factors are the responses of taxpayers affected by the repeal of an exemption. If an exemption is repealed, some taxpayers may cease engaging in formerly exempted activity. In this case the repeal would not yield the full amount of the tax expenditure, because the gross income previously exempted would no longer be generated. Additionally, tax expenditures are valued at the tax rate they should be taxed at to achieve the assumed ideal tax system. These assumptions may not agree with the actual tax rates that would apply if an exemption were repealed. For example, each exemption categorized as tax expenditure at the
1 Rousslang, Donald (2013). "Tax Expenditures in Paradise." State Tax Notes. May 13, 2013, pages 549-558.

7
wholesale rate may not qualify for the 0.5% rate under the wholesale rules of section 237-4, Hawaii Revised Statutes The report finds that GET expenditures amounted to $166.2 million in the first half of calendar year 2017 for only e-filers. Another $69 million was forgone in exemptions that were meant to reduce tax pyramiding but may represent an opportunity to export the tax burden.
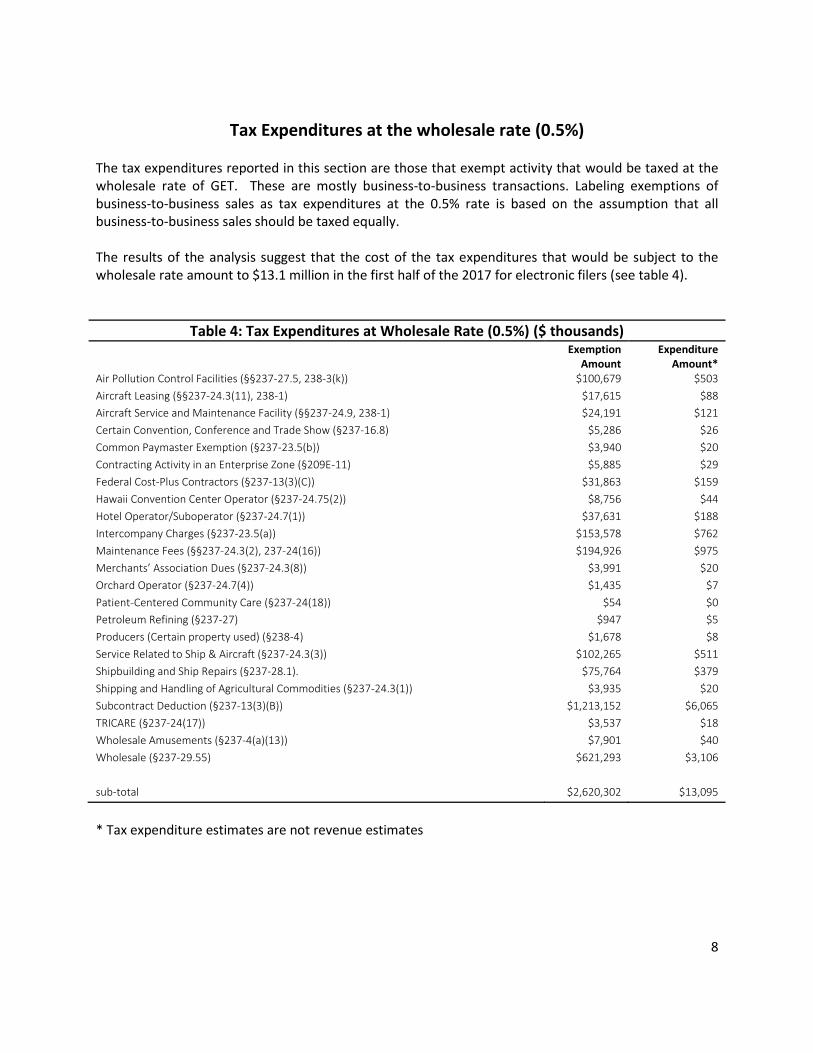
8
Tax Expenditures at the wholesale rate (0.5%)
The tax expenditures reported in this section are those that exempt activity that would be taxed at the wholesale rate of GET. These are mostly business-to-business transactions. Labeling exemptions of business-to-business sales as tax expenditures at the 0.5% rate is based on the assumption that all business-to-business sales should be taxed equally. The results of the analysis suggest that the cost of the tax expenditures that would be subject to the wholesale rate amount to $13.1 million in the first half of the 2017 for electronic filers (see table 4).
Table 4: Tax Expenditures at Wholesale Rate (0.5%) ($ thousands) Exemption
Amount Expenditure
Amount* Air Pollution Control Facilities (§§237-27.5, 238-3(k)) $100,679 $503
Aircraft Leasing (§§237-24.3(11), 238-1) $17,615 $88
Aircraft Service and Maintenance Facility (§§237-24.9, 238-1) $24,191 $121
Certain Convention, Conference and Trade Show (§237-16.8) $5,286 $26
Common Paymaster Exemption (§237-23.5(b)) $3,940 $20
Contracting Activity in an Enterprise Zone (§209E-11) $5,885 $29
Federal Cost-Plus Contractors (§237-13(3)(C)) $31,863 $159
Hawaii Convention Center Operator (§237-24.75(2)) $8,756 $44
Hotel Operator/Suboperator (§237-24.7(1)) $37,631 $188
Intercompany Charges (§237-23.5(a)) $153,578 $762
Maintenance Fees (§§237-24.3(2), 237-24(16)) $194,926 $975
Merchants’ Association Dues (§237-24.3(8)) $3,991 $20
Orchard Operator (§237-24.7(4)) $1,435 $7
Patient-Centered Community Care (§237-24(18)) $54 $0
Petroleum Refining (§237-27) $947 $5
Producers (Certain property used) (§238-4) $1,678 $8
Service Related to Ship & Aircraft (§237-24.3(3)) $102,265 $511
Shipbuilding and Ship Repairs (§237-28.1). $75,764 $379
Shipping and Handling of Agricultural Commodities (§237-24.3(1)) $3,935 $20
Subcontract Deduction (§237-13(3)(B)) $1,213,152 $6,065
TRICARE (§237-24(17)) $3,537 $18
Wholesale Amusements (§237-4(a)(13)) $7,901 $40
Wholesale (§237-29.55) $621,293 $3,106
sub-total $2,620,302 $13,095
* Tax expenditure estimates are not revenue estimates
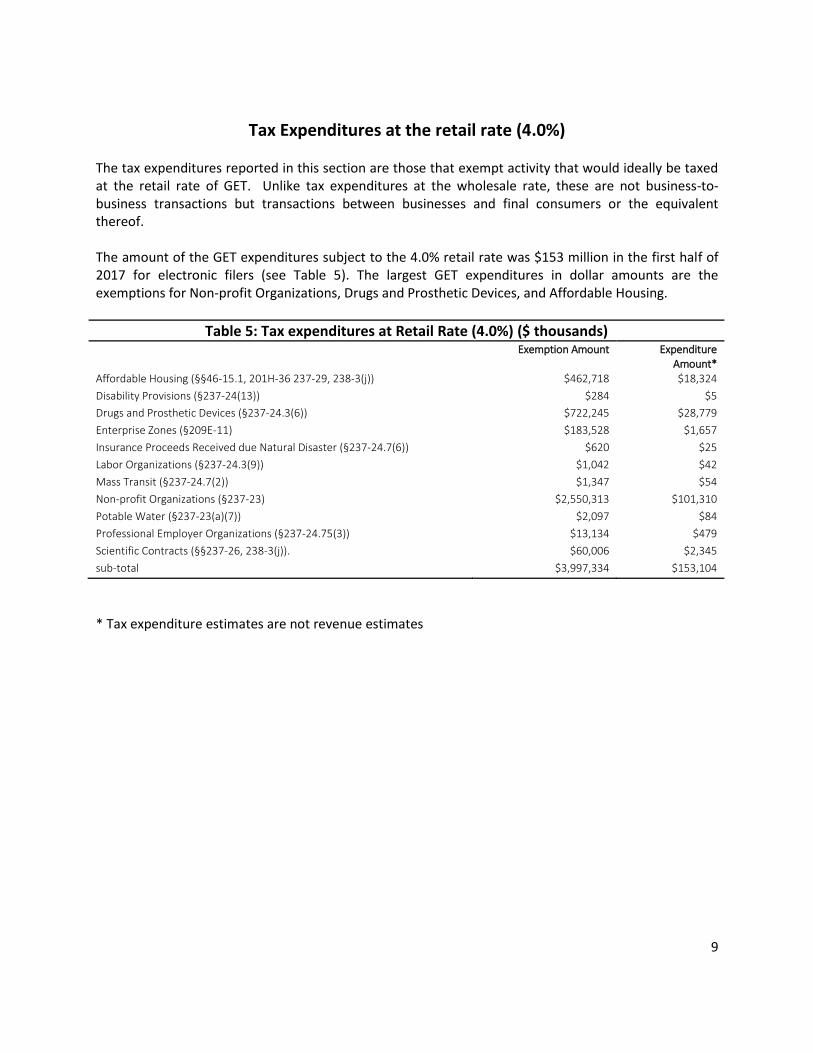
9
Tax Expenditures at the retail rate (4.0%)
The tax expenditures reported in this section are those that exempt activity that would ideally be taxed at the retail rate of GET. Unlike tax expenditures at the wholesale rate, these are not business-to-business transactions but transactions between businesses and final consumers or the equivalent thereof. The amount of the GET expenditures subject to the 4.0% retail rate was $153 million in the first half of 2017 for electronic filers (see Table 5). The largest GET expenditures in dollar amounts are the exemptions for Non-profit Organizations, Drugs and Prosthetic Devices, and Affordable Housing.
Table 5: Tax expenditures at Retail Rate (4.0%) ($ thousands) Exemption Amount Expenditure
Amount* Affordable Housing (§§46-15.1, 201H-36 237-29, 238-3(j)) $462,718 $18,324
Disability Provisions (§237-24(13)) $284 $5
Drugs and Prosthetic Devices (§237-24.3(6)) $722,245 $28,779
Enterprise Zones (§209E-11) $183,528 $1,657
Insurance Proceeds Received due Natural Disaster (§237-24.7(6)) $620 $25
Labor Organizations (§237-24.3(9)) $1,042 $42
Mass Transit (§237-24.7(2)) $1,347 $54
Non-profit Organizations (§237-23) $2,550,313 $101,310
Potable Water (§237-23(a)(7)) $2,097 $84
Professional Employer Organizations (§237-24.75(3)) $13,134 $479
Scientific Contracts (§§237-26, 238-3(j)). $60,006 $2,345
sub-total $3,997,334 $153,104
* Tax expenditure estimates are not revenue estimates
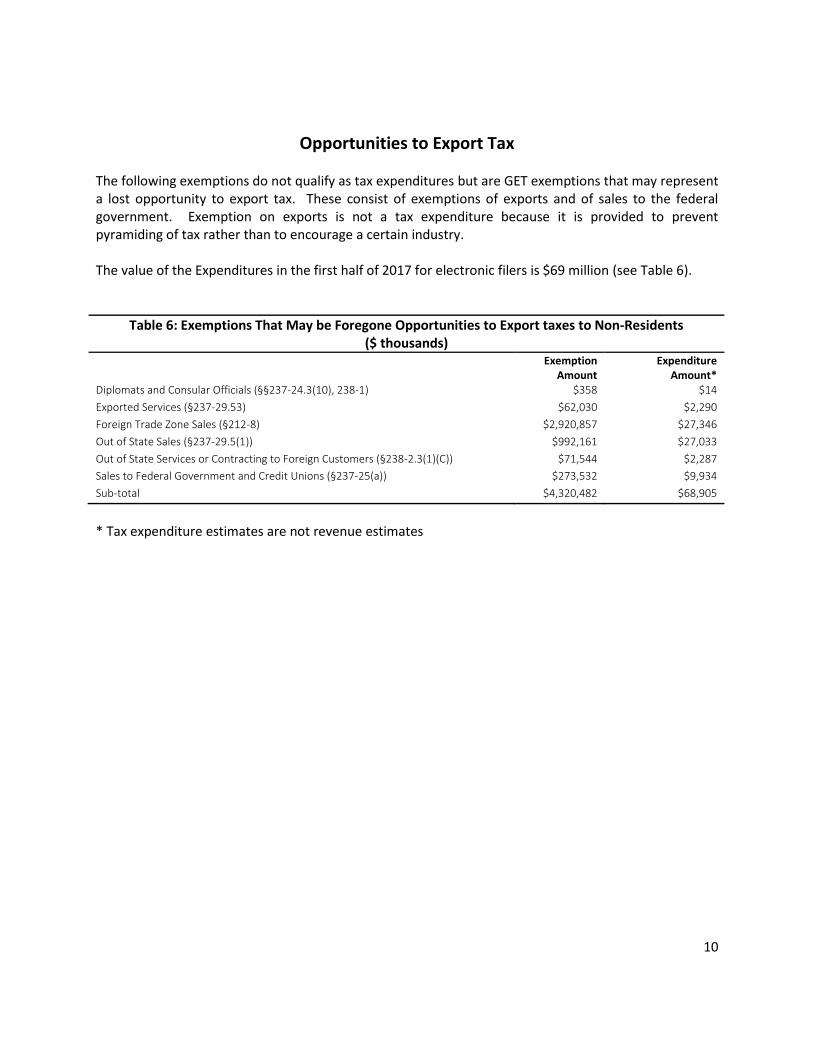
10
Opportunities to Export Tax The following exemptions do not qualify as tax expenditures but are GET exemptions that may represent a lost opportunity to export tax. These consist of exemptions of exports and of sales to the federal government. Exemption on exports is not a tax expenditure because it is provided to prevent pyramiding of tax rather than to encourage a certain industry. The value of the Expenditures in the first half of 2017 for electronic filers is $69 million (see Table 6).
Table 6: Exemptions That May be Foregone Opportunities to Export taxes to Non-Residents ($ thousands)
Exemption Amount
Expenditure Amount*
Diplomats and Consular Officials (§§237-24.3(10), 238-1) $358 $14
Exported Services (§237-29.53) $62,030 $2,290
Foreign Trade Zone Sales (§212-8) $2,920,857 $27,346
Out of State Sales (§237-29.5(1)) $992,161 $27,033
Out of State Services or Contracting to Foreign Customers (§238-2.3(1)(C)) $71,544 $2,287
Sales to Federal Government and Credit Unions (§237-25(a)) $273,532 $9,934
Sub-total $4,320,482 $68,905
* Tax expenditure estimates are not revenue estimates
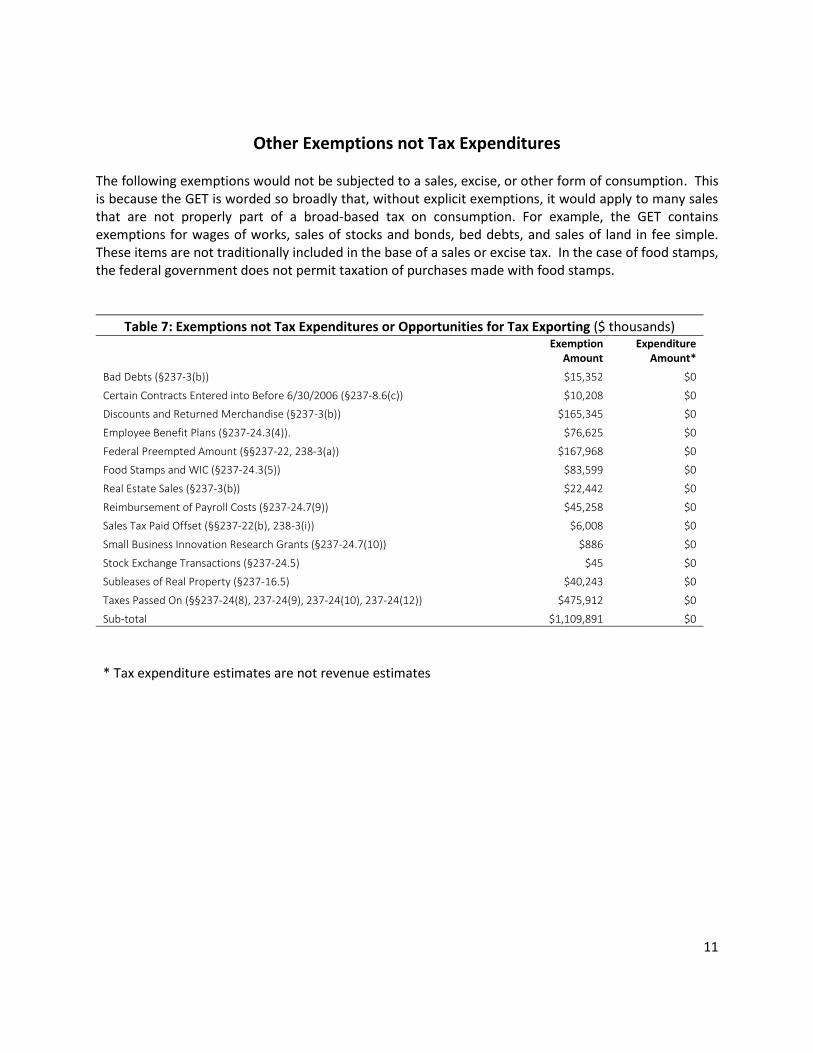
11
Other Exemptions not Tax Expenditures The following exemptions would not be subjected to a sales, excise, or other form of consumption. This is because the GET is worded so broadly that, without explicit exemptions, it would apply to many sales that are not properly part of a broad-based tax on consumption. For example, the GET contains exemptions for wages of works, sales of stocks and bonds, bed debts, and sales of land in fee simple. These items are not traditionally included in the base of a sales or excise tax. In the case of food stamps, the federal government does not permit taxation of purchases made with food stamps.
Table 7: Exemptions not Tax Expenditures or Opportunities for Tax Exporting ($ thousands)
Exemption Amount
Expenditure Amount*
Bad Debts (§237-3(b)) $15,352 $0
Certain Contracts Entered into Before 6/30/2006 (§237-8.6(c)) $10,208 $0
Discounts and Returned Merchandise (§237-3(b)) $165,345 $0
Employee Benefit Plans (§237-24.3(4)). $76,625 $0
Federal Preempted Amount (§§237-22, 238-3(a)) $167,968 $0
Food Stamps and WIC (§237-24.3(5)) $83,599 $0
Real Estate Sales (§237-3(b)) $22,442 $0
Reimbursement of Payroll Costs (§237-24.7(9)) $45,258 $0
Sales Tax Paid Offset (§§237-22(b), 238-3(i)) $6,008 $0
Small Business Innovation Research Grants (§237-24.7(10)) $886 $0
Stock Exchange Transactions (§237-24.5) $45 $0
Subleases of Real Property (§237-16.5) $40,243 $0
Taxes Passed On (§§237-24(8), 237-24(9), 237-24(10), 237-24(12)) $475,912 $0
Sub-total $1,109,891 $0
* Tax expenditure estimates are not revenue estimates
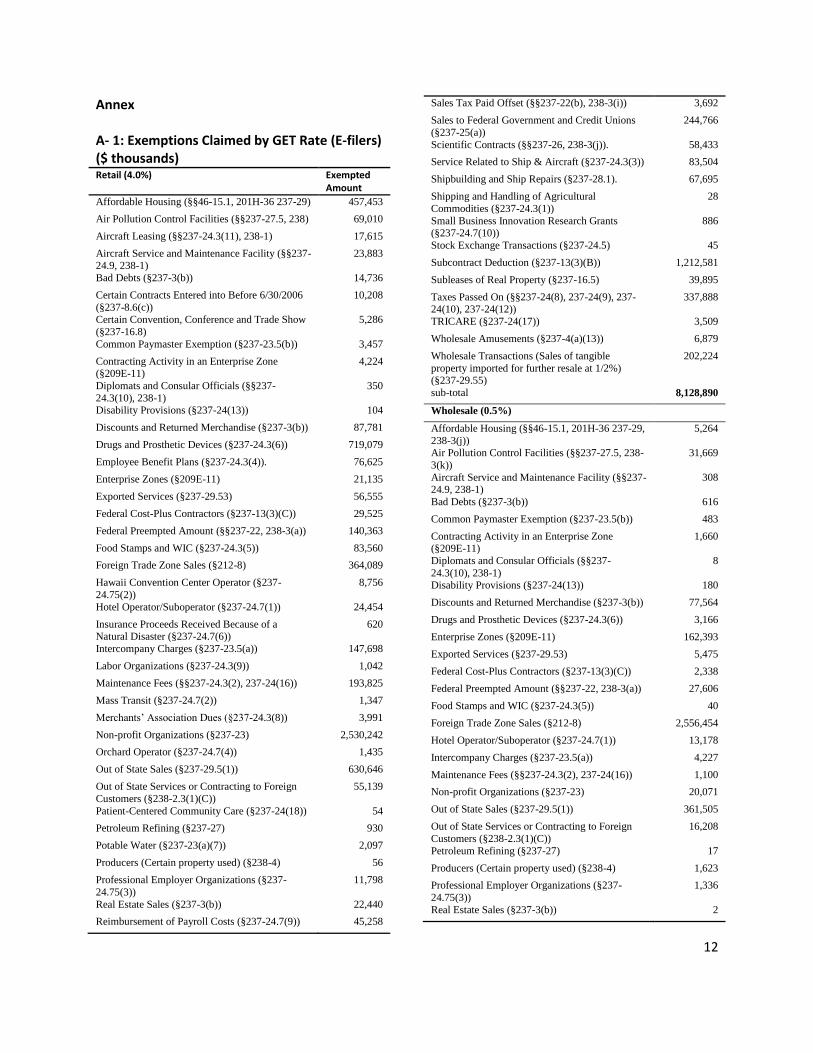
12
Annex A- 1: Exemptions Claimed by GET Rate (E-filers) ($ thousands) Retail (4.0%) Exempted
Amount
Affordable Housing (§§46-15.1, 201H-36 237-29) 457,453
Air Pollution Control Facilities (§§237-27.5, 238) 69,010
Aircraft Leasing (§§237-24.3(11), 238-1) 17,615
Aircraft Service and Maintenance Facility (§§237-24.9, 238-1)
23,883
Bad Debts (§237-3(b)) 14,736
Certain Contracts Entered into Before 6/30/2006
(§237-8.6(c))
10,208
Certain Convention, Conference and Trade Show
(§237-16.8)
5,286
Common Paymaster Exemption (§237-23.5(b)) 3,457
Contracting Activity in an Enterprise Zone (§209E-11)
4,224
Diplomats and Consular Officials (§§237-
24.3(10), 238-1)
350
Disability Provisions (§237-24(13)) 104
Discounts and Returned Merchandise (§237-3(b)) 87,781
Drugs and Prosthetic Devices (§237-24.3(6)) 719,079
Employee Benefit Plans (§237-24.3(4)). 76,625
Enterprise Zones (§209E-11) 21,135
Exported Services (§237-29.53) 56,555
Federal Cost-Plus Contractors (§237-13(3)(C)) 29,525
Federal Preempted Amount (§§237-22, 238-3(a)) 140,363
Food Stamps and WIC (§237-24.3(5)) 83,560
Foreign Trade Zone Sales (§212-8) 364,089
Hawaii Convention Center Operator (§237-
24.75(2))
8,756
Hotel Operator/Suboperator (§237-24.7(1)) 24,454
Insurance Proceeds Received Because of a Natural Disaster (§237-24.7(6))
620
Intercompany Charges (§237-23.5(a)) 147,698
Labor Organizations (§237-24.3(9)) 1,042
Maintenance Fees (§§237-24.3(2), 237-24(16)) 193,825
Mass Transit (§237-24.7(2)) 1,347
Merchants’ Association Dues (§237-24.3(8)) 3,991
Non-profit Organizations (§237-23) 2,530,242
Orchard Operator (§237-24.7(4)) 1,435
Out of State Sales (§237-29.5(1)) 630,646
Out of State Services or Contracting to Foreign
Customers (§238-2.3(1)(C))
55,139
Patient-Centered Community Care (§237-24(18)) 54
Petroleum Refining (§237-27) 930
Potable Water (§237-23(a)(7)) 2,097
Producers (Certain property used) (§238-4) 56
Professional Employer Organizations (§237-
24.75(3))
11,798
Real Estate Sales (§237-3(b)) 22,440
Reimbursement of Payroll Costs (§237-24.7(9)) 45,258
Sales Tax Paid Offset (§§237-22(b), 238-3(i)) 3,692
Sales to Federal Government and Credit Unions
(§237-25(a))
244,766
Scientific Contracts (§§237-26, 238-3(j)). 58,433
Service Related to Ship & Aircraft (§237-24.3(3)) 83,504
Shipbuilding and Ship Repairs (§237-28.1). 67,695
Shipping and Handling of Agricultural
Commodities (§237-24.3(1))
28
Small Business Innovation Research Grants (§237-24.7(10))
886
Stock Exchange Transactions (§237-24.5) 45
Subcontract Deduction (§237-13(3)(B)) 1,212,581
Subleases of Real Property (§237-16.5) 39,895
Taxes Passed On (§§237-24(8), 237-24(9), 237-24(10), 237-24(12))
337,888
TRICARE (§237-24(17)) 3,509
Wholesale Amusements (§237-4(a)(13)) 6,879
Wholesale Transactions (Sales of tangible
property imported for further resale at 1/2%) (§237-29.55)
202,224
sub-total 8,128,890
Wholesale (0.5%)
Affordable Housing (§§46-15.1, 201H-36 237-29,
238-3(j))
5,264
Air Pollution Control Facilities (§§237-27.5, 238-
3(k))
31,669
Aircraft Service and Maintenance Facility (§§237-24.9, 238-1)
308
Bad Debts (§237-3(b)) 616
Common Paymaster Exemption (§237-23.5(b)) 483
Contracting Activity in an Enterprise Zone (§209E-11)
1,660
Diplomats and Consular Officials (§§237-
24.3(10), 238-1)
8
Disability Provisions (§237-24(13)) 180
Discounts and Returned Merchandise (§237-3(b)) 77,564
Drugs and Prosthetic Devices (§237-24.3(6)) 3,166
Enterprise Zones (§209E-11) 162,393
Exported Services (§237-29.53) 5,475
Federal Cost-Plus Contractors (§237-13(3)(C)) 2,338
Federal Preempted Amount (§§237-22, 238-3(a)) 27,606
Food Stamps and WIC (§237-24.3(5)) 40
Foreign Trade Zone Sales (§212-8) 2,556,454
Hotel Operator/Suboperator (§237-24.7(1)) 13,178
Intercompany Charges (§237-23.5(a)) 4,227
Maintenance Fees (§§237-24.3(2), 237-24(16)) 1,100
Non-profit Organizations (§237-23) 20,071
Out of State Sales (§237-29.5(1)) 361,505
Out of State Services or Contracting to Foreign
Customers (§238-2.3(1)(C))
16,208
Petroleum Refining (§237-27) 17
Producers (Certain property used) (§238-4) 1,623
Professional Employer Organizations (§237-
24.75(3))
1,336
Real Estate Sales (§237-3(b)) 2
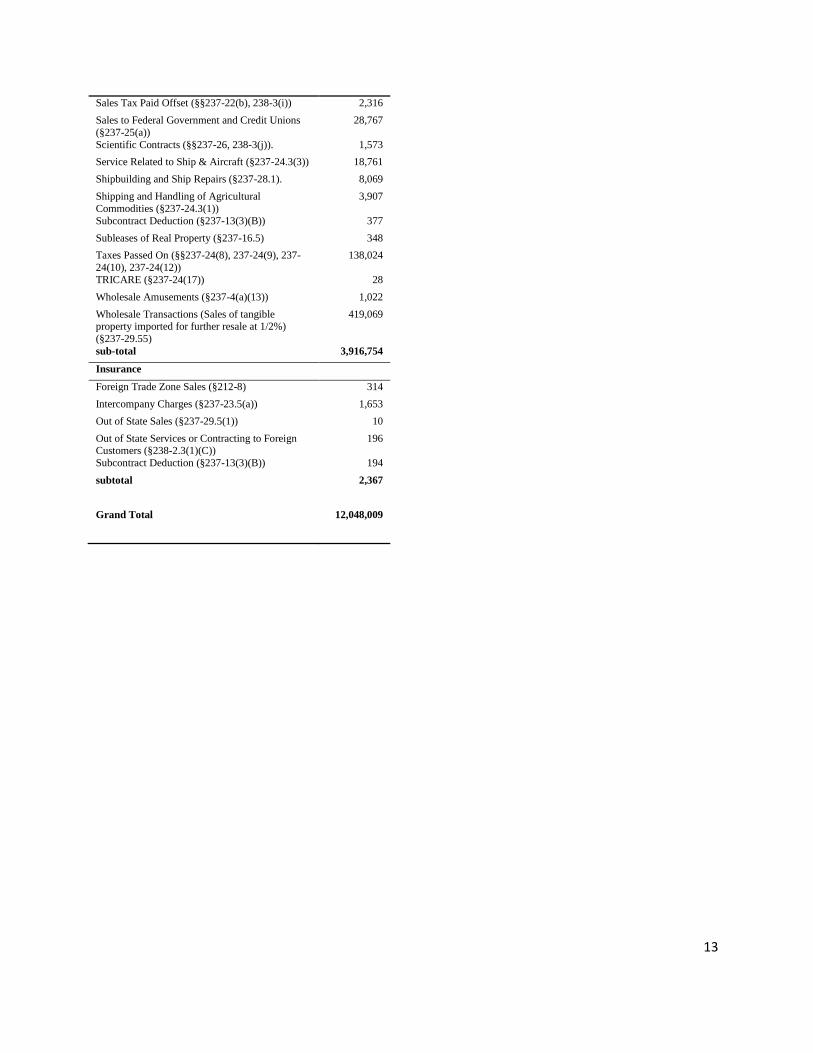
13
Sales Tax Paid Offset (§§237-22(b), 238-3(i)) 2,316
Sales to Federal Government and Credit Unions
(§237-25(a))
28,767
Scientific Contracts (§§237-26, 238-3(j)). 1,573
Service Related to Ship & Aircraft (§237-24.3(3)) 18,761
Shipbuilding and Ship Repairs (§237-28.1). 8,069
Shipping and Handling of Agricultural
Commodities (§237-24.3(1))
3,907
Subcontract Deduction (§237-13(3)(B)) 377
Subleases of Real Property (§237-16.5) 348
Taxes Passed On (§§237-24(8), 237-24(9), 237-
24(10), 237-24(12))
138,024
TRICARE (§237-24(17)) 28
Wholesale Amusements (§237-4(a)(13)) 1,022
Wholesale Transactions (Sales of tangible property imported for further resale at 1/2%)
(§237-29.55)
419,069
sub-total 3,916,754
Insurance
Foreign Trade Zone Sales (§212-8) 314
Intercompany Charges (§237-23.5(a)) 1,653
Out of State Sales (§237-29.5(1)) 10
Out of State Services or Contracting to Foreign Customers (§238-2.3(1)(C))
196
Subcontract Deduction (§237-13(3)(B)) 194
subtotal 2,367
Grand Total 12,048,009
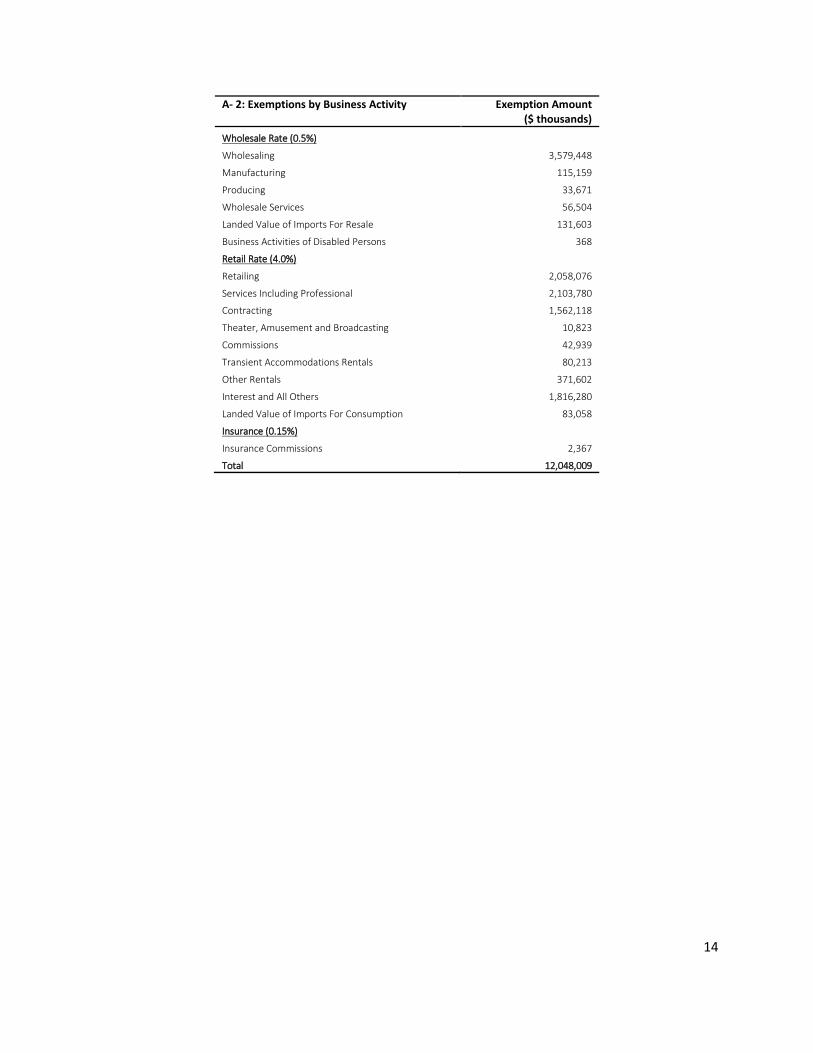
14
A- 2: Exemptions by Business Activity Exemption Amount ($ thousands)
Wholesale Rate (0.5%) Wholesaling 3,579,448
Manufacturing 115,159
Producing 33,671
Wholesale Services 56,504
Landed Value of Imports For Resale 131,603
Business Activities of Disabled Persons 368
Retail Rate (4.0%) Retailing 2,058,076
Services Including Professional 2,103,780
Contracting 1,562,118
Theater, Amusement and Broadcasting 10,823
Commissions 42,939
Transient Accommodations Rentals 80,213
Other Rentals 371,602
Interest and All Others 1,816,280
Landed Value of Imports For Consumption 83,058
Insurance (0.15%) Insurance Commissions 2,367
Total 12,048,009
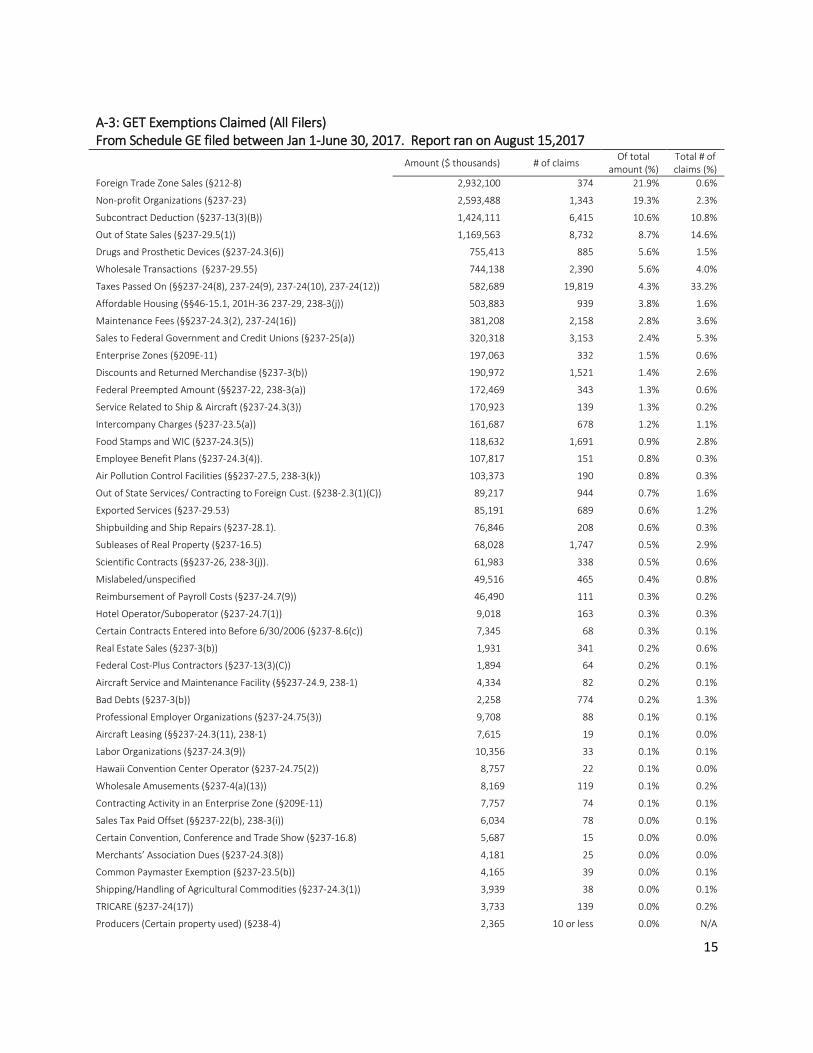
15
A-3: GET Exemptions Claimed (All Filers) From Schedule GE filed between Jan 1-June 30, 2017. Report ran on August 15,2017
Amount ($ thousands) # of claims Of total
amount (%) Total # of claims (%)
Foreign Trade Zone Sales (§212-8) 2,932,100 374 21.9% 0.6%
Non-profit Organizations (§237-23) 2,593,488 1,343 19.3% 2.3%
Subcontract Deduction (§237-13(3)(B)) 1,424,111 6,415 10.6% 10.8%
Out of State Sales (§237-29.5(1)) 1,169,563 8,732 8.7% 14.6%
Drugs and Prosthetic Devices (§237-24.3(6)) 755,413 885 5.6% 1.5%
Wholesale Transactions (§237-29.55) 744,138 2,390 5.6% 4.0%
Taxes Passed On (§§237-24(8), 237-24(9), 237-24(10), 237-24(12)) 582,689 19,819 4.3% 33.2%
Affordable Housing (§§46-15.1, 201H-36 237-29, 238-3(j)) 503,883 939 3.8% 1.6%
Maintenance Fees (§§237-24.3(2), 237-24(16)) 381,208 2,158 2.8% 3.6%
Sales to Federal Government and Credit Unions (§237-25(a)) 320,318 3,153 2.4% 5.3%
Enterprise Zones (§209E-11) 197,063 332 1.5% 0.6%
Discounts and Returned Merchandise (§237-3(b)) 190,972 1,521 1.4% 2.6%
Federal Preempted Amount (§§237-22, 238-3(a)) 172,469 343 1.3% 0.6%
Service Related to Ship & Aircraft (§237-24.3(3)) 170,923 139 1.3% 0.2%
Intercompany Charges (§237-23.5(a)) 161,687 678 1.2% 1.1%
Food Stamps and WIC (§237-24.3(5)) 118,632 1,691 0.9% 2.8%
Employee Benefit Plans (§237-24.3(4)). 107,817 151 0.8% 0.3%
Air Pollution Control Facilities (§§237-27.5, 238-3(k)) 103,373 190 0.8% 0.3%
Out of State Services/ Contracting to Foreign Cust. (§238-2.3(1)(C)) 89,217 944 0.7% 1.6%
Exported Services (§237-29.53) 85,191 689 0.6% 1.2%
Shipbuilding and Ship Repairs (§237-28.1). 76,846 208 0.6% 0.3%
Subleases of Real Property (§237-16.5) 68,028 1,747 0.5% 2.9%
Scientific Contracts (§§237-26, 238-3(j)). 61,983 338 0.5% 0.6%
Mislabeled/unspecified 49,516 465 0.4% 0.8%
Reimbursement of Payroll Costs (§237-24.7(9)) 46,490 111 0.3% 0.2%
Hotel Operator/Suboperator (§237-24.7(1)) 9,018 163 0.3% 0.3%
Certain Contracts Entered into Before 6/30/2006 (§237-8.6(c)) 7,345 68 0.3% 0.1%
Real Estate Sales (§237-3(b)) 1,931 341 0.2% 0.6%
Federal Cost-Plus Contractors (§237-13(3)(C)) 1,894 64 0.2% 0.1%
Aircraft Service and Maintenance Facility (§§237-24.9, 238-1) 4,334 82 0.2% 0.1%
Bad Debts (§237-3(b)) 2,258 774 0.2% 1.3%
Professional Employer Organizations (§237-24.75(3)) 9,708 88 0.1% 0.1%
Aircraft Leasing (§§237-24.3(11), 238-1) 7,615 19 0.1% 0.0%
Labor Organizations (§237-24.3(9)) 10,356 33 0.1% 0.1%
Hawaii Convention Center Operator (§237-24.75(2)) 8,757 22 0.1% 0.0%
Wholesale Amusements (§237-4(a)(13)) 8,169 119 0.1% 0.2%
Contracting Activity in an Enterprise Zone (§209E-11) 7,757 74 0.1% 0.1%
Sales Tax Paid Offset (§§237-22(b), 238-3(i)) 6,034 78 0.0% 0.1%
Certain Convention, Conference and Trade Show (§237-16.8) 5,687 15 0.0% 0.0%
Merchants’ Association Dues (§237-24.3(8)) 4,181 25 0.0% 0.0%
Common Paymaster Exemption (§237-23.5(b)) 4,165 39 0.0% 0.1%
Shipping/Handling of Agricultural Commodities (§237-24.3(1)) 3,939 38 0.0% 0.1%
TRICARE (§237-24(17)) 3,733 139 0.0% 0.2%
Producers (Certain property used) (§238-4) 2,365 10 or less 0.0% N/A
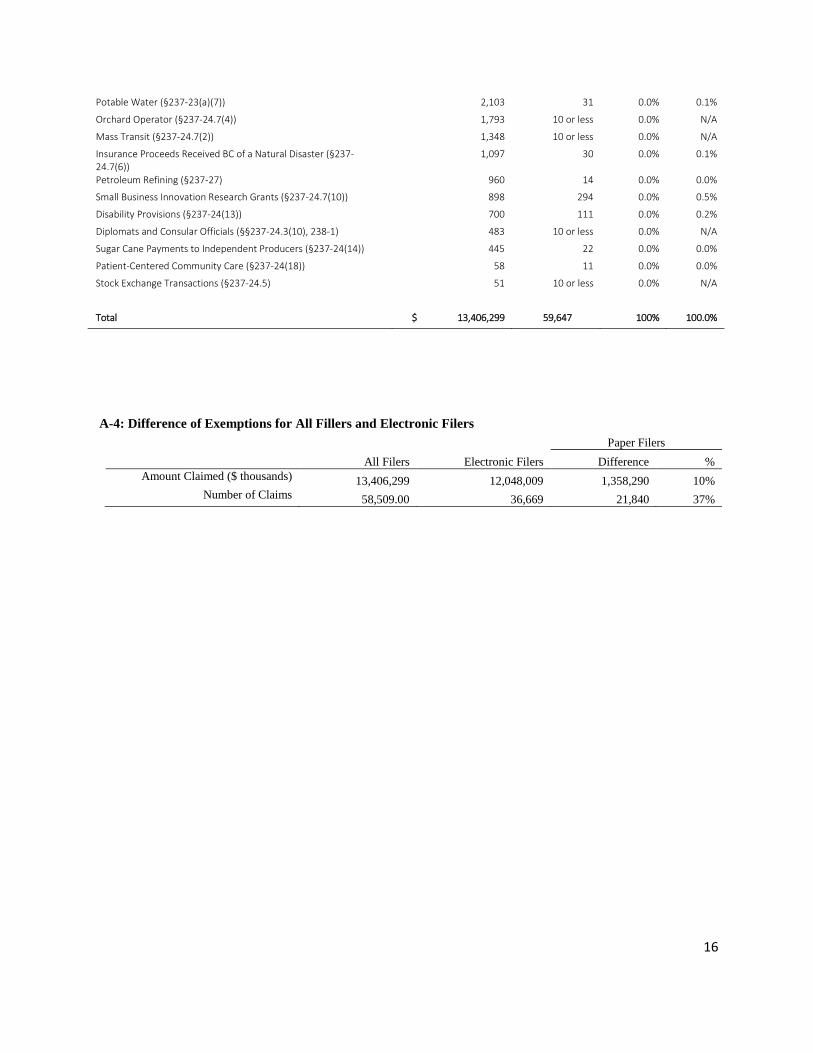
16
Potable Water (§237-23(a)(7)) 2,103 31 0.0% 0.1%
Orchard Operator (§237-24.7(4)) 1,793 10 or less 0.0% N/A
Mass Transit (§237-24.7(2)) 1,348 10 or less 0.0% N/A
Insurance Proceeds Received BC of a Natural Disaster (§237-24.7(6))
1,097 30 0.0% 0.1%
Petroleum Refining (§237-27) 960 14 0.0% 0.0%
Small Business Innovation Research Grants (§237-24.7(10)) 898 294 0.0% 0.5%
Disability Provisions (§237-24(13)) 700 111 0.0% 0.2%
Diplomats and Consular Officials (§§237-24.3(10), 238-1) 483 10 or less 0.0% N/A
Sugar Cane Payments to Independent Producers (§237-24(14)) 445 22 0.0% 0.0%
Patient-Centered Community Care (§237-24(18)) 58 11 0.0% 0.0%
Stock Exchange Transactions (§237-24.5) 51 10 or less 0.0% N/A
Total $ 13,406,299 59,647 100% 100.0%
A-4: Difference of Exemptions for All Fillers and Electronic Filers
Paper Filers
All Filers Electronic Filers Difference %
Amount Claimed ($ thousands) 13,406,299 12,048,009 1,358,290 10%
Number of Claims 58,509.00 36,669 21,840 37%
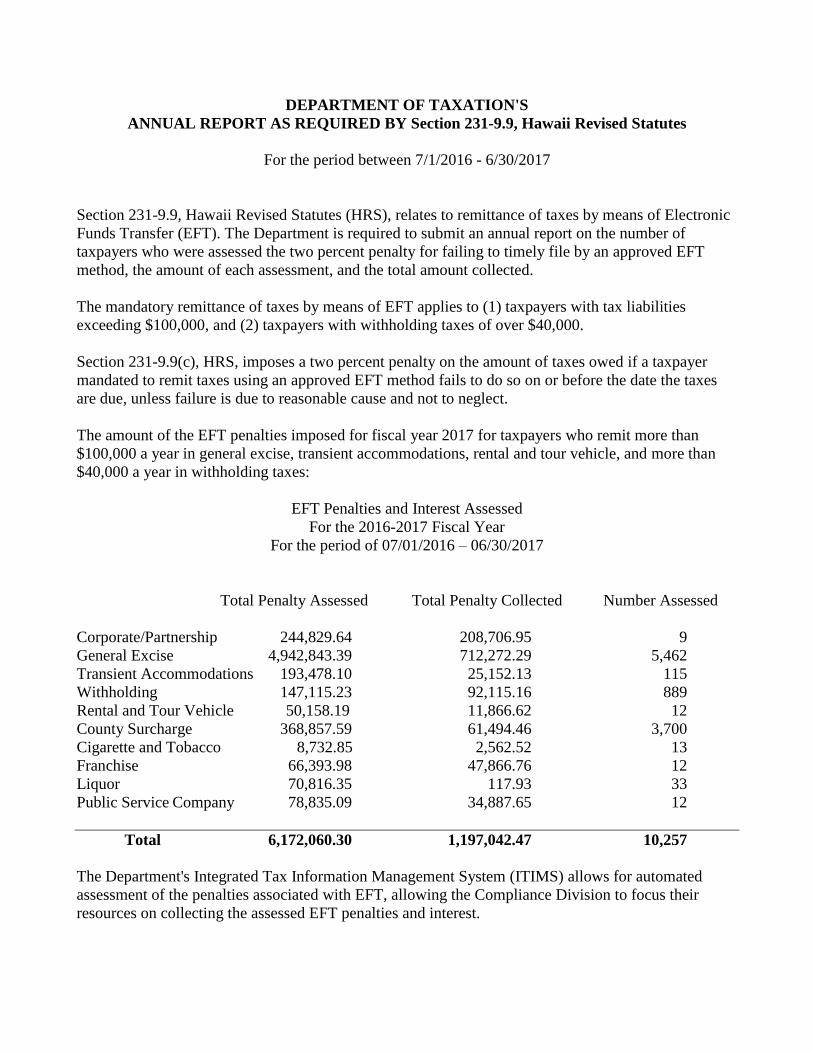
DEPARTMENT OF TAXATION'S
ANNUAL REPORT AS REQUIRED BY Section 231-9.9, Hawaii Revised Statutes
For the period between 7/1/2016 - 6/30/2017
Section 231-9.9, Hawaii Revised Statutes (HRS), relates to remittance of taxes by means of Electronic
Funds Transfer (EFT). The Department is required to submit an annual report on the number of
taxpayers who were assessed the two percent penalty for failing to timely file by an approved EFT
method, the amount of each assessment, and the total amount collected.
The mandatory remittance of taxes by means of EFT applies to (1) taxpayers with tax liabilities
exceeding $100,000, and (2) taxpayers with withholding taxes of over $40,000.
Section 231-9.9(c), HRS, imposes a two percent penalty on the amount of taxes owed if a taxpayer
mandated to remit taxes using an approved EFT method fails to do so on or before the date the taxes
are due, unless failure is due to reasonable cause and not to neglect.
The amount of the EFT penalties imposed for fiscal year 2017 for taxpayers who remit more than
$100,000 a year in general excise, transient accommodations, rental and tour vehicle, and more than
$40,000 a year in withholding taxes:
EFT Penalties and Interest Assessed
For the 2016-2017 Fiscal Year
For the period of 07/01/2016 – 06/30/2017
Total Penalty Assessed Total Penalty Collected Number Assessed
Corporate/Partnership 244,829.64 208,706.95 9
General Excise 4,942,843.39 712,272.29 5,462
Transient Accommodations 193,478.10 25,152.13 115
Withholding 147,115.23 92,115.16 889
Rental and Tour Vehicle 50,158.19 11,866.62 12
County Surcharge 368,857.59 61,494.46 3,700
Cigarette and Tobacco 8,732.85 2,562.52 13
Franchise 66,393.98 47,866.76 12
Liquor 70,816.35 117.93 33
Public Service Company 78,835.09 34,887.65 12
Total 6,172,060.30 1,197,042.47 10,257
The Department's Integrated Tax Information Management System (ITIMS) allows for automated
assessment of the penalties associated with EFT, allowing the Compliance Division to focus their
resources on collecting the assessed EFT penalties and interest.
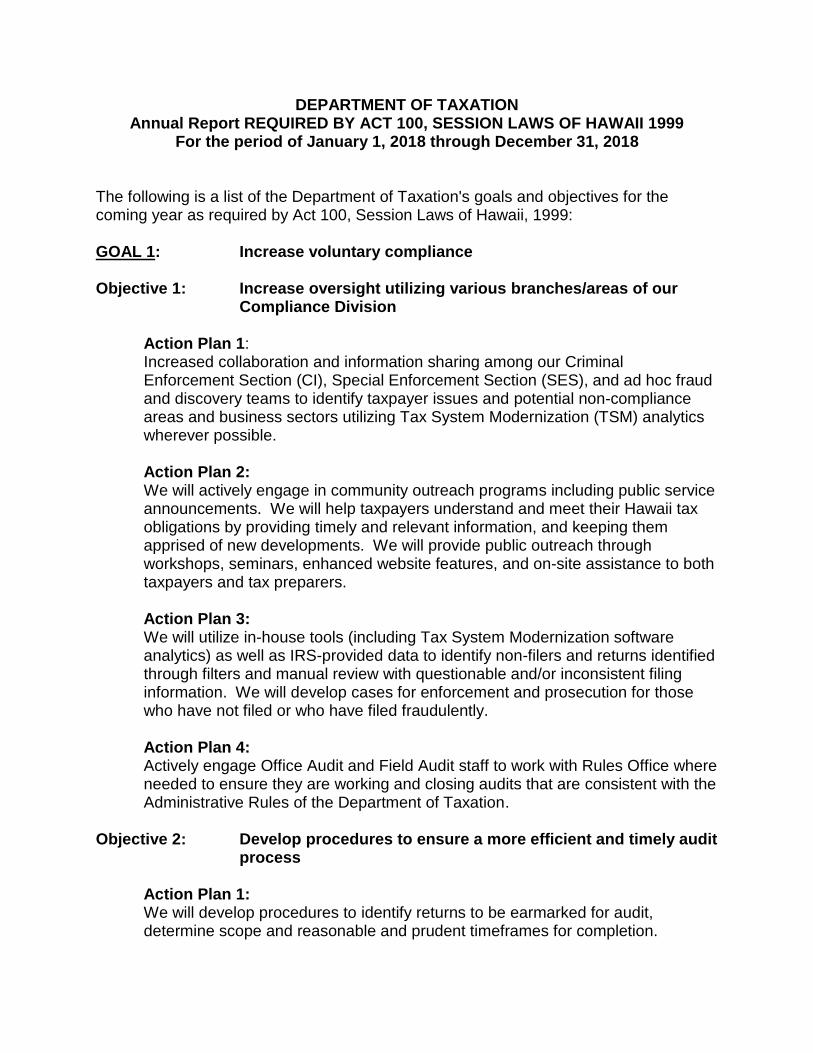
DEPARTMENT OF TAXATION Annual Report REQUIRED BY ACT 100, SESSION LAWS OF HAWAII 1999
For the period of January 1, 2018 through December 31, 2018 The following is a list of the Department of Taxation's goals and objectives for the coming year as required by Act 100, Session Laws of Hawaii, 1999: GOAL 1: Increase voluntary compliance Objective 1: Increase oversight utilizing various branches/areas of our
Compliance Division Action Plan 1:
Increased collaboration and information sharing among our Criminal Enforcement Section (CI), Special Enforcement Section (SES), and ad hoc fraud and discovery teams to identify taxpayer issues and potential non-compliance areas and business sectors utilizing Tax System Modernization (TSM) analytics wherever possible.
Action Plan 2: We will actively engage in community outreach programs including public service announcements. We will help taxpayers understand and meet their Hawaii tax obligations by providing timely and relevant information, and keeping them apprised of new developments. We will provide public outreach through workshops, seminars, enhanced website features, and on-site assistance to both taxpayers and tax preparers. Action Plan 3: We will utilize in-house tools (including Tax System Modernization software analytics) as well as IRS-provided data to identify non-filers and returns identified through filters and manual review with questionable and/or inconsistent filing information. We will develop cases for enforcement and prosecution for those who have not filed or who have filed fraudulently. Action Plan 4: Actively engage Office Audit and Field Audit staff to work with Rules Office where needed to ensure they are working and closing audits that are consistent with the Administrative Rules of the Department of Taxation.
Objective 2: Develop procedures to ensure a more efficient and timely audit
process Action Plan 1: We will develop procedures to identify returns to be earmarked for audit, determine scope and reasonable and prudent timeframes for completion.
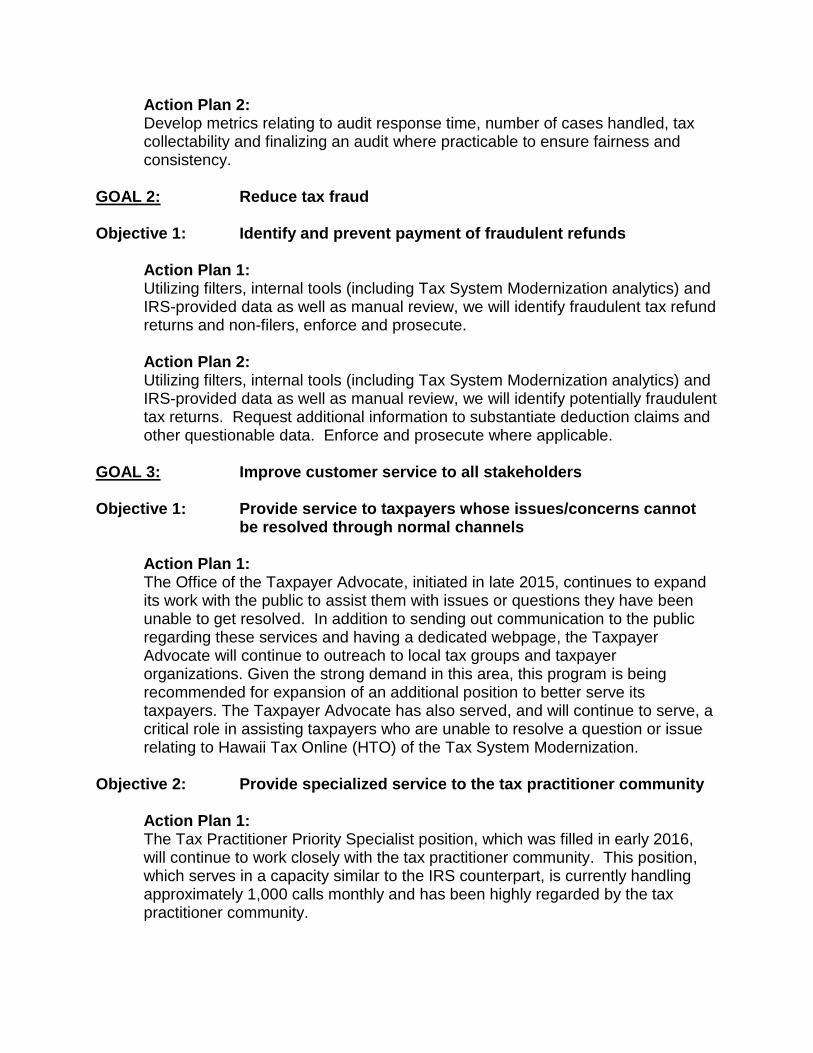
Action Plan 2: Develop metrics relating to audit response time, number of cases handled, tax collectability and finalizing an audit where practicable to ensure fairness and consistency.
GOAL 2: Reduce tax fraud Objective 1: Identify and prevent payment of fraudulent refunds
Action Plan 1: Utilizing filters, internal tools (including Tax System Modernization analytics) and IRS-provided data as well as manual review, we will identify fraudulent tax refund returns and non-filers, enforce and prosecute. Action Plan 2: Utilizing filters, internal tools (including Tax System Modernization analytics) and IRS-provided data as well as manual review, we will identify potentially fraudulent tax returns. Request additional information to substantiate deduction claims and other questionable data. Enforce and prosecute where applicable.
GOAL 3: Improve customer service to all stakeholders Objective 1: Provide service to taxpayers whose issues/concerns cannot be resolved through normal channels
Action Plan 1: The Office of the Taxpayer Advocate, initiated in late 2015, continues to expand its work with the public to assist them with issues or questions they have been unable to get resolved. In addition to sending out communication to the public regarding these services and having a dedicated webpage, the Taxpayer Advocate will continue to outreach to local tax groups and taxpayer organizations. Given the strong demand in this area, this program is being recommended for expansion of an additional position to better serve its taxpayers. The Taxpayer Advocate has also served, and will continue to serve, a critical role in assisting taxpayers who are unable to resolve a question or issue relating to Hawaii Tax Online (HTO) of the Tax System Modernization.
Objective 2: Provide specialized service to the tax practitioner community
Action Plan 1: The Tax Practitioner Priority Specialist position, which was filled in early 2016, will continue to work closely with the tax practitioner community. This position, which serves in a capacity similar to the IRS counterpart, is currently handling approximately 1,000 calls monthly and has been highly regarded by the tax practitioner community.
Action Plan 2: Increase dialogue and meeting with the tax practitioner community as well as professional organizations to better understand their needs and concerns. The Tax Practitioner Priority Specialist, who will continue to outreach to local tax groups and tax practitioner groups, has already been asked to speak and meet with many community groups. This position will also continue to be instrumental in assisting tax practitioners with registration and utilization of Hawaii Tax Online (HTO) as part of the Tax Modernization System. Action Plan 3: The Administrative Appeals Office, initiated in 2016, will continue to work with taxpayers and tax return preparers to have a quicker way to resolve tax disputes involving audit assessments. Serving as a separate and independent body within the Department of Taxation, it is responsible for administering the Administrative Appeals and Dispute Resolution (AADR) program which offers a way to settle audit disputes without litigation. Thus far the program has been well received as an alternate means of settling audit disputes. We will continue to review the success and volume of AADR cases over the next year.
GOAL 4: Improve technology and efficiencies through the successful
implementation of the Tax System Modernization (TSM) project Objective 1: We will complete Rollout 4 of the Tax System Modernization
(TSM) project during this period
Action Plan 1: With the successful implementation of Rollout 1 of TSM on December 28, 2015, Rollout 2 on August 15, 2016, and Rollout 3 on August 14, 2017, we will complete Rollout 4 in November 2018. Rollout 4 will include individual income taxes, fiduciary, partnership, estate and transfer taxes and cashiering. Action Plan 2: During 2018 we will continue to refine and reconfigure (as needed) Rollouts 2 and 3 tax types. Through weekly TSM status and stakeholder meetings, Compliance user meetings, Taxpayer Services user meetings, and input from the Taxpayer Advocate and Tax Practitioner Specialist, we will further perfect the Rollouts 2 and 3 tax type features and processes. Action Plan 3: Post August 2017, we have initiated Rollout 4 implementation which includes individual income tax, fiduciary, partnership, estate and transfer and the cashiering function. Rollout 4 is scheduled to be completed in November 2018.
Objective 2: We will re-engineer business processes
Action Plan 1:
As we work through each of the TSM rollouts, we will reduce manual business processes and reduce the use of paper thereby improving efficiency and productivity. Action Plan 2: We have created five Business Process Reengineering (BPR) Work Groups consisting of approximately ten employees for each Work Group. The Work Groups will address (1) Outside Communications, (2) Intranet, (3) E-filing, (4) Fun (i.e., morale building), and (5) Policies and Procedures. Each of the five Work Groups will be presenting their recommendations/issues to the five Work Groups and senior management. We will then be proceeding with execution of agreed-upon recommendations by priority in 2018. Action Plan 3: Through the implementation of Rollouts 1, 2 and 3 of TSM, we have provided for electronic registration, filing, and tax payments for these taxes. We will continue to implement these initiatives for Rollout 4 tax types. Action Plan 4: Through enhanced functionality of TSM, we will be able to capture more data for revenue impact determination relative to tax credits and exemptions, demographics and other useful research and planning purposes as Rollouts are completed and once sufficiently relevant data is available.
GOAL 5: Actively address tax receivable balances Objective 1: Collaborate with Attorney General's office to improve
collections
Action Plan 1: We will continue to utilize the Attorney General's (AG's) office in accordance with the MOA between the AG and the Department of Taxation to increase collections.
Objective 2: Utilize third party to improve collections
Action Plan 1: We will continue to utilize an outside collection agency which was selected in 2016 to focus on larger taxpayer accounts primarily on the mainland. Based upon their success rate we will explore the feasibility of expanding the number of accounts referred to them relating to mainland taxpayers that we have found difficult to locate.
GOAL 6: Foster and empower staff Objective 1: We will develop each employee to his/her full potential.
Action Plan 1: Department employees are our greatest assets. We will strive to develop each employee to his/her full potential. Employees will be encouraged to develop individual development plans to meet the responsibilities of their current position and to help them identify areas of growth that will help them qualify for target positions. Action Plan 2: We will reinforce the Department's values of respect, teamwork, communication, cooperation, trust, support, integrity, honesty, fairness, and responsibility. We will promote a culture and environment where our workforce continuously seeks to improve and realize their potential. Action Plan 3: We will provide training opportunities for our employees to enhance and expand their skills. We will design basic training and annual training for all specialty positions. Action Plan 4: We will improve communication with our employees through greater collaboration in meetings and strategic planning sessions. Action Plan 5: Rewrite position descriptions for positions already impacted by TSM resulting in greater complexity and increased technical requirements. This will improve retention of staff that we are currently at risk of losing to the higher paid private sector.