Report on Summer Internship at
Locomotion and Biorobotics Lab Cornell University
Design, Analysis, and Fabrication of Load cell
for Cornell Ranger
A part of the
Summer Undergraduate Research Internship Program (SURIP)
Submitted by:
Pulkit Kapur Junior Undergraduate,
Punjab Engineering College, Chandigarh.
Supervised by: Prof. Andy Ruina,
Biorobotics and Locomotion Lab, Dept. of Theoretical and Applied Mechanics,
Cornell University
2
Foreword
This report talks about my summer internship at Cornell University, at the Biorobotics
and Locomotion lab, in the Dept. of Theoretical and Applied Mechanics. This work is
titled “Design, analysis and fabrication of a load cell for Cornell Ranger”, and was done
under the guidance of Prof. Andy Ruina.
The aim of this report is two fold. It not only serves to inform the reader about the work
done during my internship at Cornell, but also serves as a guideline for people who shall
continue on the research project I worked on.
This report is divided into six chapters. Each chapter delves into the details about specific
aspect of the project such as fabrication, calibration etc. An appendix at the end describes
briefly, the short work done to eliminate the noise in the output of the gyroscopes on the
Cornell ranger.
This project was completed during one month of my stay in Cornell. This would not have
been possible without the constant support, encouragement and feedback from Prof.
Andy Ruina, Lab manager Jason Cortell, and every member of the lab. I thank everyone,
for their support, and advice and the bond of friendship I developed with every member
of the lab.

3
Contents
Chapters Page No.
Chapter 1: Introduction and Background 4
Chapter 2: Design of load cell 6
Chapter 3: Optical Sensor 15
Chapter 4: Fabrication 17
Chapter 5: Calibration 18
Chapter 6: Conclusion and Scope for future work 20
Appendix 21

4
Chapter 1: Introduction and Background
The Cornell Ranger is a four legged, knee-less statically stable biped. Weighing five kgs,
and using 40 Watts of energy, it is developed at the Biorobotics and Locomotion Lab,
Department of Theoretical and Applied Mechanics, Cornell University.
In contrast to Collins robot, which is very energy efficient, and uses only 11 Watts, the
Cornell Ranger uses 40 Watts, with a 80 watt hour battery pack. However, this is justified
as unlike Collins robot, the Cornell Ranger is designed for reliability. It is designed to run
in a repetitive reliable gait. It is steered by a hobby remote control which slightly, biases
the steering to one side or another by lifting one of the four feet slightly.
There are a number of design modifications which are needed to improve the reliability
and aim for the record of the longest walking robot, which the Cornell ranger strives for.
Some of them are:
• There is a lot of noise in the output of the gyroscopes which might be electrical or
mechanical noise. Reducing this noise might improve the gait.
• Possibility of adding hip springs, as a lot of energy is wasted in firstly
accelerating the robot, and then de-accelerating it. However, problems might be
caused by motions which are not at natural swing period of the leg.
• Design of arrangement to add ankle and hip encoders.
• Ankle Springs are needed to get uniform spring constant in all the legs.
The first task in the design modification stage was to get uniform spring constant in all
the legs, by adding ankle springs. In order to estimate the stiffness values for ankle
springs, we need to determine the tension in the string that operates the toggle
arrangement at the feet.
We conducted an experiment on the Cornell ranger, whereby we controlled the input
torque at the hip, and found out the angle turned by the right outer leg, for increasing and
then decreasing values of hip torque (max 2N-m). However since the values were very

5
close, we needed some other means to find out the force in the strings. In order to
measure the spring tension, a Load cell is needed.
The following section describes the design issues related to Load Cell for measuring the
string tension in the Cornell Ranger.

6
Chapter 2: Design of Load Cell
In order to measure the string tension, using a load cell, there are two alternatives. Either
to buy commercially available load cells or to design and fabricate a custom made load
cell. The following factors contributed to the choice of a custom made load cell:
• Commercial load cells are sensitive to a lot of noise which can lead to errors in
the measurement of the sensor.
• Commercially available load cells are very costly (around $500-$1000).
• Mounting and attachment problems with commercial available load cells.
• Commercial load cells require additionally good amplifiers.
During the design phase many alternative designs were reviewed among them were,
small proving ring, linear pulley arrangement, S shaped load cells etc. The load cell
consists of a flexing member such that only the tension component gets through and a
optical sensor to measure the deflection. This deflection will then be calibrated against
the tension in the string.
In contrast to a simple tension load cell that moves up several inches up and down and
bounces with the motion of the ranger, we choose a load cell that is fixed on the ranger’s
leg with its electrical connections, which might be more reliable.
The following points were kept in mind while designing the load cell:
• The material chosen should have low creep and hysteresis.
• Acc to St. Venant’s principle at the attachment point the details of how the load is
transferred must not affect the reading.
• Bolted connections will have contact non-linearities and frictional hysteresis, they
should either be avoided or at such points so that they do not affect the sensor
reading.
• There must be no contacting pieces in regions of deformation that affect the
sensor. Contact will almost inevitably lead to non-linear and hysteretic effects.

7
• The pulleys should be in plane of the Load Cell so that there is no out of plane
bending of the load cell.
The Design Procedure:
The design procedure for the fabrication of Load cell consisted of following steps:
• Pencil Sketches and cardboard models to come up with different feasible designs.
• CAD modeling of potentially useful designs in INVENTOR.
• Assigning proper material properties and making design changes to reduce the
mass.
• FEA analysis of CAD model to determine stresses and deflections.
• Generating the part drawings for fabrication.
During the FEA analysis, a bearing load of 100 N was applied on the top pulley, a pin
constraint was added on the left pulley and a frictionless constraint was added on a bump,
parallel to the bottom surface. The FEA analysis was done in ANSYS inbuilt in
AutoCAD Inventor. The deflection that we get from FEA analysis should be in the linear
range of optical interrupt sensor. The details about the sensor and its range will be
covered in the next chapter.

8
There were a number of designs suggested and following an iterative process to achieve
the desired deformation, size, weight etc. Some of them are mentioned below:
Three Pulleys, Triangular Design:
Fig.1: CAD model showing front view of load cell
Fig 2: CAD model showing isometric view of triangular load cell
The Load cell is a triangular piece of aluminum, hollow inside to hold the pulleys. The
optical interrupt sensor is mounted in a slot made for it. A probe is attached to the top
pulley which can move longitudinally inside the sensor.

9
Working of the Load Cell: Due to tension in the string, the load cell is stressed, causing it
to deform in the vertical direction. As the load cell deforms, the pulley and the probe
moves vertically down. This motion is noted by the optical sensor.
Since the load cell is made of single piece no bolted connections are needed.
FEA Analysis reveals that deformation required to cover the range of the optical sensor
can be achieved by a load cell made of polycarbonate but with low creep properties.
Reduced weight three pulley triangular design:
Since the motors have to work against lifting the weight of the ranger, it was imperative
that the mass of the load cell should be reduced as much as possible. Hence, some
changes were made in the previous design to remove a lot of chunk of metal. FEA
analysis was then done to see the stresses and deflections. It was found that the thin
region between the bottom two pulleys had high stresses and considerable deflection,
which was not desired. In order to assemble, two such thin plates can be bolted together.
Fig 3: CAD model of reduced weight triangular load cell

10
Fig. 4: FEA results showing stresses in the model
Rectangular three pulley design:
In order to facilitate mounting of the load cell on the ranger’s leg, a rectangular three
pulley design was included. Also, inorder to reduce the stresses a stress relief hole, and a
cut is added. This design handles stress better, gives the desired deflection, and is light in
weight.
The FEA analysis shows that, the maximum equivalent stress is higher near the stress
relief hole, however stress is low otherwise. The deflection is in the range of 1-2 mm.
Fig. 5: CAD model of rectangular load cell

11
Fig. 6: FEA results showing the deformation of load cell under
Fig. 7: FEA result showing Equivalent stress in rectangular load cell model
Modified rectangular load cell:
The rectangular load cell was modified because the bottom thin ligament, would be
considerably stressed and show some deflection. However, this is not seen in the FEA
results in ANSYS. Hence The bottom pulleys are housed in a firm aluminum member
which can be mounted rigidly to the leg. The weight of this model is 60 grams.

12
Fig. 8: CAD model of modified rectangular load cell
Proposed Rectangular Design:
Fig. 9: CAD drawing of Load Cell
13
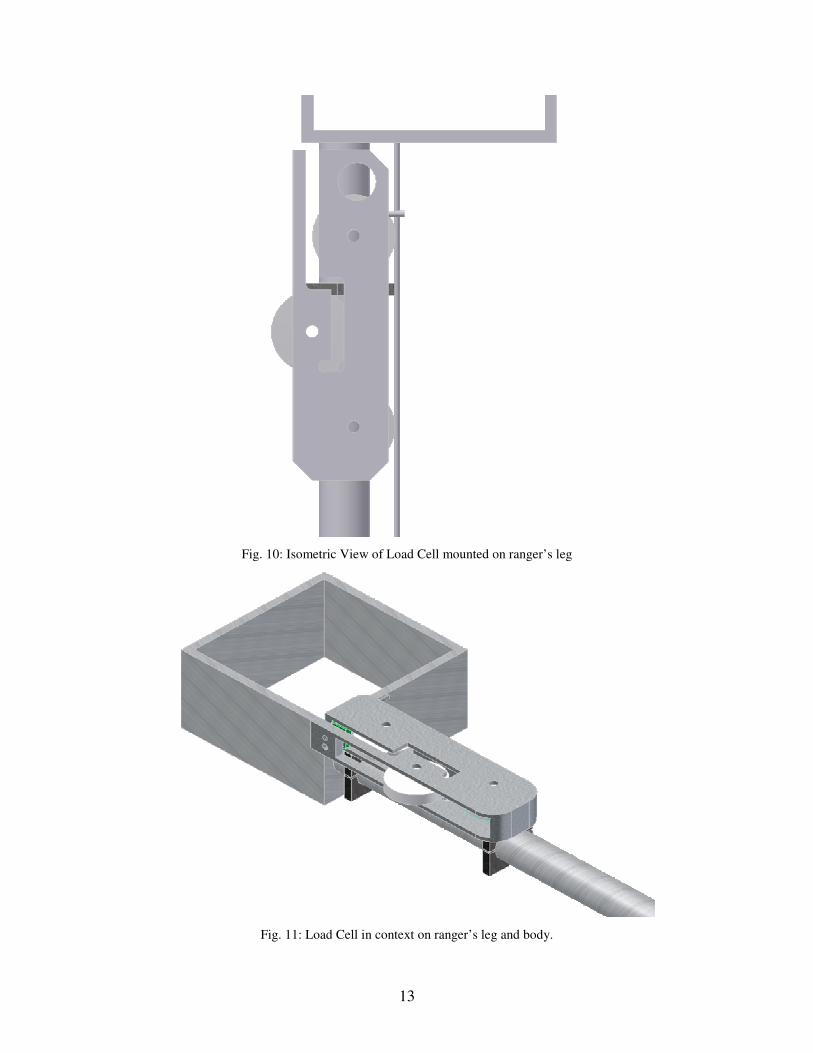
Fig. 10: Isometric View of Load Cell mounted on ranger’s leg
Fig. 11: Load Cell in context on ranger’s leg and body.

14
Fig. 12: Distribution of stresses on application of load
We observe that in the final design, the stresses are well distributed, and are not
dangerously high. There is a reasonable safety factor in this design. Also, the desired
deflection can easily be achieved by changing the length and profile of the cut.
Thus, we have arrived at a design which gives us the required deflection, and at the same
time remains fixed to the ranger’s legs, thus improving the reliability of the results.
Next, we shall discuss about the sensor used to measure the deflection and the sensor
mount to fix it on the load cell.

15
Chapter 3: Optical Sensor
An optical interrupt sensor was used, to measure the deflection of the load cell under the
load. The deflection must be calibrated in terms of change in output voltage across the
optical sensor. The reason to choose an optical interrupt sensor was because the ranger’s
P.C board has enough analog inputs, to directly connect the interrupt sensor.
For the initial Triangular and Rectangular Designs, we used the H21A1 optical interrupt
sensor. The H21A1, consist of a gallium arsenide infrared
emitting diode coupled with a silicon phototransistor in a
plastic housing. The packaging system is designed to
optimize the mechanical resolution, coupling efficiency,
ambient light rejection, cost and reliability. The gap in the
housing provides a means of interrupting the signal with an
opaque material, switching the output from an “ON” to an “OFF” state.
The working of the sensor is useful only in its linear range. In order to determine the
linear range of the sensor and to calibrate it, we conducted an experiment and plotted its
Displacement v/s output voltage graph.
Fig. 13: Calibration plot of Optical sensor H21A

16
The scatter shows the data from the sensor, which has been superimposed by a linear fit.
The error results show that, within the 0.2mm range, the sensor behaves very close to the
linear behavior. Thus, this is the region where, the sensor data should be recorded from.
For the Modified Rectangular design and for the Final Load cell designed, to choose a
more reliable and smaller optical interrupt sensor. The same exercise was repeated in
order to get the displacement v/s output voltage plot.
Fig. 14: Calibration plot of distance v/s output voltage
The blue line respresents the sensor data and the red line the superimposed linear fit on it.
Mechanisms for adjustment of the probe: There are two Screws used for
adjustment of the Probe. A coarse adjustment screw
and a fine adjustment screw( with spring). The
coarse adjustment screw is used to put the probe in
the center of its linear range. The second screw is
used to make finer adjustments. It has a compressed
spring element, and is fixed (glued) to the sensor
mounting plate.

17
Chapter 4: Fabrication of Load cell
After the design of the load cell was finalized and agreed by FEA results, it was required
to fabricate the load cell. The material of the load cell was chosen to be aluminum,
because of its excellent machineability and high tensile strength.
The fabrication of the load cell was carried out on a milling machine in the TAM
workshop.
Fig. 15: Fabricated model of Load cell
The weight of fabricated load cell was 37 gms. The Fig. 16 shows the sensor mount with
the adjusting screws in place.
Fig. 16: Top view of load cell showing the space for pulleys and bottom thick section

18
Chapter 5: Calibration of Load Cell
Once we know the linear range of the sensor, and have set the probe in this range using
the adjusting screws, in order to measure the tension in the cable’s we need to calibrate
the force in terms of the output voltage. We would like to see a linear relation between
the force and the output voltage.
In the experimental setup, a string was passed over the pulleys and a load was applied
vertically downwards. Different weights were loaded gradually and the output voltage
from the voltmeter was recorded. The following results were obtained:
Table1: Calibration of Load cell
Force (N) Voltage (V)
0 .78
3.6 .89
6 .94
8.6 .97
15.8 1.06
20.6 1.22
31.4 1.4
36.4 1.6
50 2
The data from Table 1 was used to plot the calibration curve for the load cell between
Force applied and the output voltage at the sensor. This curve is then superimposed with
a linear fit and the plot of residual error plotted to estimate how close is the fit.

19
Fig. 17: Calibration plot of Force v/s Output voltage of sensor with residual error from linear fit
It is observed that the curve is nearly linear as theire is very little residual error from the
linear fit. This is useful as it prevents tedious non-linearities and makes the load cell easy
to use.

20
Chapter 6:
Conclusion & Scope for future Work
This report describes the design, fabrication and calibration of a load cell. The load cell
was made in order to measure the force in the legs of the Cornell Ranger (string tension).
The string tension was essential to get uniform spring constant in all the legs and hence
improve its reliability. The main requirements for the load cell were:
• Simple Design to have reliable mechanics
• Ease of manufacturing
• Light weight
• Easy to remove and fix to the ranger’s leg
The things achieved during this internship are:
1. We estimated the regions where there was scope for improvement in term of reliability
for the ranger.
2. We tried to provide mechanical damping to reduce the noise in output of gyros.
3. We calibrated the optical Interrupt Sensor, and estimated its linear range.
4.. Designed and analyzed the load cell to get desired deflections and minimize stresses
and any out of plane bending.
5. Fabricated the load cell and subsequent mounting of sensor and adjusting mechanism.
6. Finally, Calibration of load cell and force v/s voltage being close to linear range.
After a month of intense hard work, the load cell was successfully fabricated and
calibrated. There is however, a lot of scope for future work, in following areas:
• Fabrication of two other load cells for other two legs.
• Estimating the force in the ranger’s leg upon mounting the loadcell and making
the ranger walk.
• Finally using the data for tension in the strings, making the spring constant in all
the legs uniform.
21
Appendix:
This section describes the small experiment done on the cornell ranger. It was observed
that there was a lot of noise in the output of the gyroscopes and accelerometers mounted
on the ranger’s pc board. This could be due to two reasons:
• Electrical noise from the P.C board
• Mechanical noise due to vibrations of the P.C board
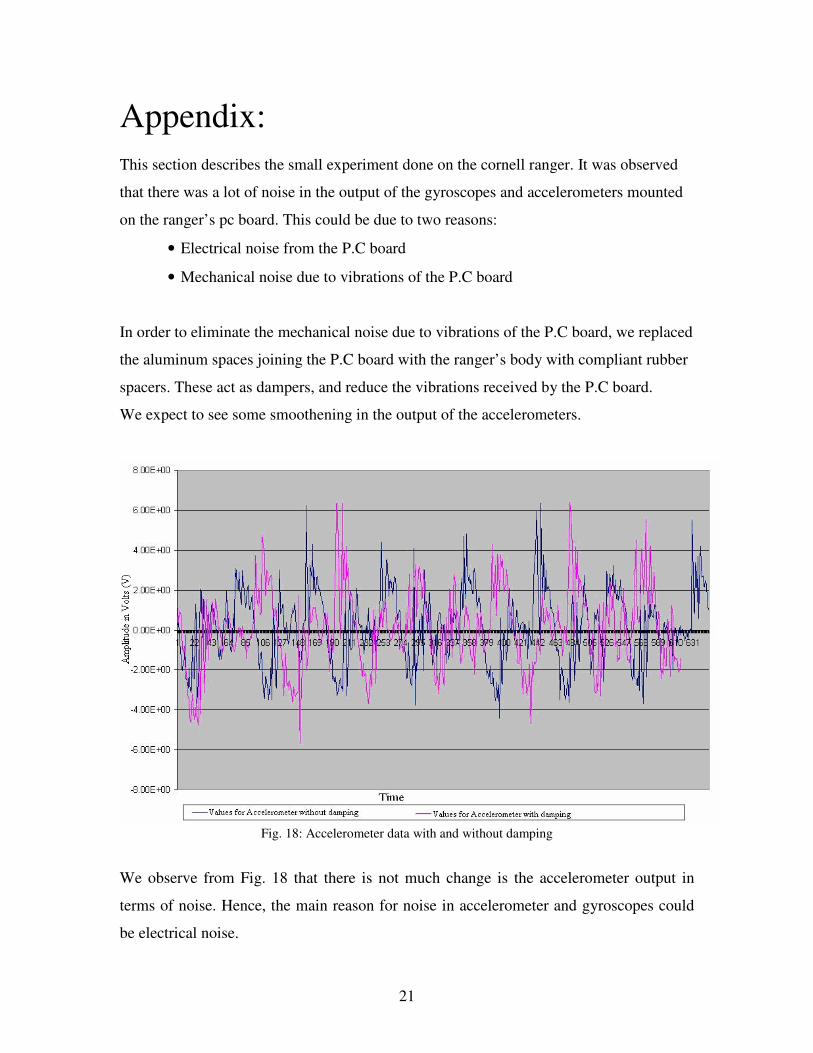
In order to eliminate the mechanical noise due to vibrations of the P.C board, we replaced
the aluminum spaces joining the P.C board with the ranger’s body with compliant rubber
spacers. These act as dampers, and reduce the vibrations received by the P.C board.
We expect to see some smoothening in the output of the accelerometers.
Fig. 18: Accelerometer data with and without damping
We observe from Fig. 18 that there is not much change is the accelerometer output in
terms of noise. Hence, the main reason for noise in accelerometer and gyroscopes could
be electrical noise.


![CMU Biorobotics Lab Deployment Reportbiorobotics.ri.cmu.edu/.../images/SnakeRobotZwentendorfReport.pdf · CMU Biorobotics Lab Deployment Report ... [Situational Awareness] ... The](https://static.cupdf.com/doc/110x72/5aafe4ff7f8b9a22118dc53c/cmu-biorobotics-lab-deployment-biorobotics-lab-deployment-report-situational.jpg)