Renewable Energy Sources in Gaza’s WASH
Sector for Public and Private WASH Facilities
This study was implemented by Oxfam, in close coordination with WASH Cluster members under the umbrella of the Solar System Task Force led by the Palestinian Water Authority
2019 July

2 | P a g e
ENGINEERING, MANAGEMENT AND INFRASTRUCTURE CONSULTANTS Said Bin Al-ass Street Neama Commercial Tower, 4th Floor Gaza City, Gaza Strip - Palestine E-mail: [email protected] Tel.: +972-8-2836155 Fax.: +972-8-2840580

3 | P a g e
Contents
Executive summary 9
Introduction 14
1.1 Background 14
1.2 Overall objective 15
1.3 Specific objectives 15
Methodology 17
2.1 Approach and methodology flowchart 17
2.2 The inception report 17
Data collection methodology 17
2.3 Mobilization, review and verification of existing data 18
2.4 Data collection and field survey 20
2.5 Data analysis methodology 21
2.6 Feasibility methodology 22
Final report 29
3.1 Introduction: solar energy technologies 29
3.2 Types of solar energy technologies 29
3.3 Comparison of solar energy technologies 31
Use of solar PV technologies in the Gaza Strip 33
4.1 PV systems for WASH facilities 34
4.2 Technologies selection of PV solar system for WASH facilities 36
4.3 Proposed PV systems for WASH facilities 39
4.4 Local market capacity and equipment available 41
4.5 Strategy, legal and regulatory environment 42
Baseline situation 44
5.1 Background 44
5.2 Data collection 45
5.3 Outcomes of the data collection and processing 45
Feasibility study 65
6.1 Financial feasibility 65
6.2 Social and environmental benefits 71
6.3 Technical feasibility 72
Conclusions and recommendations 84
References 86
Annexes 88

4 | P a g e
List of Figures
Figure 2.1 – Flow chart showing the applied methodology 18
Figure 5.1 – Administrative map of Gaza Strip governorates 44
Figure 5.2 – Distribution of wells in the Gaza Strip 47
Figure 5.3 – Distribution of public desalination plants in the Gaza Strip 51
Figure 5.4 – Distribution of private desalination plants in the Gaza Strip 54
Figure 5.5 – Distribution of water pump stations in the Gaza Strip 58
Figure 5.6 – Distribution of sewage pump stations in the Gaza Strip 61
Figure 5.7 – Distribution of sewage treatment plants in the Gaza Strip 64
Figure 6.1 – Facility data sheet 75
List of Tables
Table 1.1 – Number of WASH facilities under study in the Gaza Strip 9
Table 1.2 – Feasibility index (FI) for the WASH facilities under study 13
Table 1.3 – Classification of WASH facilities 13
Table 2.1 – List of interviews with relevant focal points 20
Table 2.2 – Matrix of WASH facility, criteria and the corresponding weighting factor 23
Table 2.3 – Water pump stations cost of production 24
Table 2.4 – Sewage pump stations cost of production 24
Table 2.5 – Private desalination plants cost of production 25
Table 2.6 – Public desalination plants cost of production 25
Table 2.7 – Water wells cost of production 25
Table 2.8 – Water pump stations (WPS) production capacity 26
Table 2.9 – Sewage pump stations (SPS) production capacity 26
Table 2.10 – Private desalination plants (PriDP) production capacity 26
Table 2.11 – Public desalination plants (PubDP) production capacity 27
Table 2.12 – Water well (WW) production capacity 27
Table 2.13 – WASH facilities classification according to FI 28
Table 4.1 – Average PSSH in OPT 33
Table 4.2 – PV systems installed in the Gaza Strip 34
Table 4.3 – Number and size of PV systems installed at institutions in the Gaza Strip 34
Table 4.4 – Summary of PV projects and their available details in the Gaza Strip 35
Table 4.5 – System components of off-grid system 36
Table 4.6 – System components of on-grid system 36
Table 4.7 – Components of the on-grid with backup system 37
Table 4.8 – Components of PV diesel hybrid system 37

5 | P a g e
Table 4.9 – Components of PV water pump system 38
Table 4.10 – The advantages and disadvantages of each PV system 38
Table 4.11 – Examples of proposed PV system for WASH facilities 40
Table 6.1 – Summary of installed, ongoing and planned PV systems for WASH facilities 65
Table 6.2 – Cost analysis of off-grid system 66
Table 6.3 – Cost analysis of on-grid system 66
Table 6.4 – Cost analysis of on-grid with backup system 67
Table 6.5 – Cost analysis of PV diesel hybrid system 67
Table 6.6 – Cost analysis of PV direct water pump 67
Table 6.7 – Cost of electricity generated from diesel generators 68
Table 6.8 – NPV and payback period for WASH facilities except sewage pump stations (grid
availability 25%) 69
Table 6.9 – NPV and payback period for WASH facilities except sewage pump stations (grid
availability 75%) 69
Table 6.10 – NPV and payback period for sewage pump stations (grid availability 25%) 70
Table 6.11 – NPV and payback period for sewage pump stations (grid availability 75%) 70
Table 6.12 – Summary of NPV and payback period (PbP) 71
Table 6.13 – Water pump station basic data 73
Table 6.14 – Summary of feasibility index for each facility 76
Table 6.15 – Feasible and moderately feasible critical sewage pump stations 77
Table 6.16 – Feasible and moderately feasible critical water pump stations 79
Table 6.17 – Feasible and moderately feasible critical wells 79
Table 6.18 – Feasible and moderately feasible critical public desalination plants 83

6 | P a g e
ACKNOWLEDGEMENTS
The list of dedicated and committed individuals and institutions responsible for the completion of this study is long, and they all deserve our deepest regards, thanks and gratitude. We thank you all for your generous support and feedback. Specifically, the following deserve the most gratitude:
United Nations Office for the Coordination of Humanitarian Affairs
Palestinian Water Authority
Coastal Municipalities Water Utility
Action Against Hunger
International Committee of the Red Cross
Palestinian Energy and Natural Resources Authority
Gaza Electrical Distribution Corporation Ltd
Municipalities of the Gaza Strip

7 | P a g e
GLOSSARY/ACRONYMS
AAH Action Against Hunger
AHP Analytical Hierarchy Process
ASES American Solar Energy Society
CMWU Coastal Municipalities Water Utility
CPV Concentrated Photovoltaic
CSTP Concentrated Solar Thermal Power
CTEG Concentrator Thermoelectric Generator
DSSC Dye-Sensitized Solar Cell
ECHO European Commission Humanitarian Aid
FI Feasibility Index
FSC Fuel Save Controller
GEDCO Gaza Electrical Distribution Corporation Ltd
GENI Global Energy Network Institute
GIS
GJ
GW
Geographic Information Systems
Gigajoule
Gigawatt
GVC
ICRC
Gruppo di Volontariato Civile (Italian NGO)
International Committee of the Red Cross
IEA The International Energy Agency
IRENA The International Renewable Energy Agency
KfW
KVA
German Development Bank
Kilovolt-Ampere
kW
kWh
Kilowatt
Kilowatt Hour
kWp Kilowatt Peak
MJ
MCM
Megajoule
Million Cubic Metres
MW
Mwh
NIS
Megawatt
Megawatt Hour
New Israeli Shekel

8 | P a g e
NPV Net Present Value
OCHA United Nations Office for the Coordination of Humanitarian Affairs
PbP
PENRA
Payback Period
Palestinian Energy and Natural Resources Authority
PHG
PriDP
PSSH
Palestinian Hydrology Group
Private desalination plants
Peak Sunshine Hour
PubDP
PV
Public desalination plants
Photovoltaic
PWA Palestinian Water Authority
REN Alliance The International Renewable Energy Alliance
SEIA Solar Energy Industries Association
SPS
STE
Sewage pump stations
Solar Thermoelectricity
SWH Solar Water Heaters
UNDP
WASH
United Nations Development Programme
Water, Sanitation and Hygiene
WHO World Health Organization
WPS Water pump stations
WW
WWTP
Water well
Wastewater Treatment Plant

9 | P a g e
Executive summary
This report presents the findings of the assignment entitled ‘Comprehensive Study of Renewable
Energy Sources in Gaza’s WASH Sector for Public and Private WASH Facilities’, funded by ECHO
2810–9812 (Linking Humanitarian Approaches with Sustainable Resilience in the Gaza Strip). The
study was implemented by Oxfam from October 2018 to April 2019, in close coordination with WASH
Cluster members under the umbrella of the Solar System Task Force led by the Palestinian Water
Authority, through Enfra consultants. The thematic objective of the study was to assess available
renewable solar energy technologies and then to prioritize the most efficient and feasible technology
that can be utilized for public and private WASH facilities in the Gaza Strip.
The Gaza Strip is a densely populated area with limited water and power resources. The groundwater
aquifer is the only available source, with a deficit of 145 million cubic metres (MCM) per year between
demand and supply. Consequently, the quality of the aquifer has deteriorated and water desalination
plants are being constructed in a variety of ways: small, medium and large-scale plants; using sea
water or brackish water as a source; and including public, private, household and community levels.
There are 266 water wells that operate on a daily basis to provide residents with domestic water.
There are 49 sewage pump stations and 6 wastewater treatment plants (see Table 1.1).
Table 1.1 – Number of WASH facilities under study in the Gaza Strip
Water wells
Water desalination plants
Water pump stations
Sewage pump stations
Wastewater treatment plants
266 Public Private1
42 49 6 52 21
Currently, the Gaza Strip depends on the public electricity grid and the only existing power station. In
addition to the electricity produced by the power station, there are two additional electricity sources
from Egypt and Israel. The existing power resources provide 25–75% of the daily demand, according
to the study findings. WASH facilities face a serious problem as diesel fuel for generators – usually
used during periods of electricity shortage – is expensive and not continuously available, due to
existing political and financial circumstances.
The field survey found that there are 6 WASH facilities which have already installed a photovoltaic
(PV) system: 5 of them not working yet; only 1 (Rafah wastewater treatment plant) is operating.
Solar energy plays a significant role in ensuring a sustainable energy future and reducing future
carbon emissions. There are two main types of solar energy technologies; namely, PV technology and
thermal technology. The recommended direct technology to produce heat from solar energy is solar
thermal technologies, while the optimum direct technology to generate electricity is through PV
technologies. Based on the literature review, the consultant found that solar PV technologies is the
optimum technology recommended for producing electricity; therefore this type of technology received
full consideration in this study.
1 Who are willing to work during an emergency, based on Gruppo di Volontariato Civile (GVC) study.

10 | P a g e
Since 2013, PV systems have increasingly been used in the Gaza Strip to help to address the
shortage of power at private and public levels, including for WASH facilities. There are more than 40
suppliers working in the solar technology sector and several official workshops specialized in the
repair and maintenance of PV systems. The available PV components are of high quality and comply
with local and international standards. All components and equipment are imported from well-known
manufacturers, including some brand names. The technical capacity of local suppliers is still limited
and capacity building is required for suppliers, engineers and contractors.
The daily average solar radiation intensity on a horizontal surface, peak sunshine hour (PSSH), is 5.31
kWh/m2. Total annual sunshine hours are about 1,088 hours (Ouda. M, 2083). Five types of PV
systems were considered: off-grid, on-grid, on-grid with backup, diesel hybrid and direct water
pumping. The advantages and disadvantages of each were considered and a comparison between
these five systems was made, leading to identification of the most suitable PV system for each of the
WASH facilities included in this study.
The consultant computed the capital and operational cost of PV systems for 20 years, assuming that
the capital cost is $1,200/Kilowatt Peak (kWp) and the maintenance cost is $60/year (5% of capital
cost) for 20 years (the lifetime of the system). Accordingly, the capital and operational cost is
$2,280/kWp. The PV power production is based on 5.3 kWh/kWp/day for 20 years. WASH facilities
could benefit from 30% of electricity production for sewage pump stations to 70% for all other facilities.
As a result, the cost of producing 1 kWh from a PV system is 0.3 NIS/kWh for all WASH facilities
except sewage pump stations, where the cost reaches 0.71 NIS/kWh.
The financial analysis carried out in this study showed that for WASH facilities except sewage pump
stations, the Net Present Value (NPV) of the PV system ranges from $2,209 to $4,582/kWp, with a
payback period from 3 to 5 years. The NPV for WASH facilities except sewage pump stations ranges
from $942 to minus $75/kWp, with a payback period from 7 to 14 years. It is clear that PV systems are
financially feasible for WASH facilities with high NPV and short payback periods; whereas for sewage
pump stations, which have low NPV and high payback periods, PV systems are not financially
feasible.
As the cost of producing 1 kWh from a PV system is 0.3 NIS/kWh, while the cost of producing the
electricity from fuel is 0.5 NIS/kWh, and based on the computed NPV, the installation of solar PV
systems proves to be money-saving and the capital cost of the installation can be paid back in less
than 5 years. Implementation of feasible projects will result in 9.75 megawatt hours (Mwh) of energy
savings annually. Feasible and moderately feasible projects will save 29.6 Mwh per year. The cost of
implementation of feasible and moderately feasible facilities is about $9m, while cost of
implementation of feasible facilities is about $4.7m.
There are 438 WASH facilities in the Gaza Strip, of which 417 facilities have standby power
generators to bridge the shortage of power from the public electricity grid. Most critical facilities that
receive fuel from the UN system and are technically feasible to be targeted with solar PV systems,
according to the study results. The highest priority facilities are illustrated in the following tables. The
sizes and cost estimates of the proposed PV systems are also shown.

11 | P a g e
Sewage pump stations (PS)
CMWU code
Facility name Municipality Proposed PV (kW)
Feasibility Capital cost
($)
RF.2.SP.02 Jumizit Al Sabiel PS Rafah 98 Feasible 88,200
RF.2.SP.04 Tal Al Sultan PS Rafah 61 Feasible 54,900
RF.2.SP.03 Al Juninah PS Rafah 59 Feasible 53,100
Total capital cost ($) 196,200
Water pump stations
CMWU code
Facility name Municipality Proposed PV (kW)
Feasibility Capital cost
($)
KH.1.WP.01
Al Sa'ada booster Khanyounis 169 Feasible 152,100
KH.1.WP.02
Ma'an booster Khanyounis 78 Feasible 70,200
BS.1.WP.01
Eastern booster station-regional
Bani Suhaila 26 Feasible 23,400
RF.1.WP.05
Rafah ground tank Rafah 143 Feasible 100,100
Total capital cost ($) 345,800
Water wells
CMWU code Facility name Municipality Proposed PV (kW)
Feasibility Capital cost
($)
GZ.1.PW.01 Al Shajaia 2 water
well Gaza 54 Feasible 105,300
GZ.1.PW.24 Al Shaekh Ejleen 5
water well Gaza 45 Feasible 44,100
MG.1.PW.02 Al Kauthar well
F264 Al Moghraqa 71 Feasible 63,900
QR.1.PW.02 Al Matahin Al Qarara 72 Feasible 64,800
WS.1.PW.01 Wadi Salqa Wadi Alsalqa 21 Feasible 18,900

12 | P a g e
Water wells
CMWU code Facility name Municipality Proposed PV (kW)
Feasibility Capital cost
($)
BL.1.PW.03 Al Mashrou water
well Bait lahia 90 Feasible 131,400
JB.1.PW.06 Al Zohor water
well Jabalia 23 Feasible 34,200
RF.1.PW.11 Al Shoukah well Al Shoukah 59 Feasible 53,100
RF.1.PW.31 Al Malizei well Al Shoukah 59 Feasible 53,100
RF.1.PW.03 Abu Hashem
water well P124 Rafah 118 Feasible 106,200
RF.1.PW.07 Al Eskan water
well P153 Rafah 66 Feasible 59,400
RF.1.PW.04 Canada P 144 Rafah 24 Feasible 21,600
Total capital cost ($) 756,000
The study indicated that increasing the production of water wells by installing a PV system would
minimize the shortage of water supplies, especially in summer months. This will improve public health
and meet the needs of residents. Meeting community needs will positively influence the relationship
between communities and municipalities, which in turn will improve municipalities’ revenues.
Increasing the operation hours of desalination plants will enable service providers to produce greater
quantities of desalinated water in order to satisfy the needs of the community at lower prices. Such
production will improve public health and sustain the service.
The study showed that the process of installing PV systems reduces the production of CO2 by 0.76kg
of CO2/kWh and minimizes the energy content by 10.9 megajoules (MJ)/kWp. This is due to the fact
that 100 litres of diesel produces 0.27 tonnes of CO2 (2.7kg CO2/L) with energy content of 3.84
gigajoules (GJ). Diesel generators consume 0.284 L/kWh and, consequently, produce 0.76kg of
CO2/kWh and energy content of 10.9 MJ/kWp.
In general, the study indicated that the PV system alternative is feasible. The most facilities that would
benefit most from PV systems have been classified based on specific criteria, as shown in Table 1.2.
Each criterion has been given a specific weight based on its significance. Accordingly, a Feasibility
Index (FI) has been identified for each WASH facility, with a maximum FI of 100.

13 | P a g e
Table 1.2 – Feasibility index (FI) for the WASH facilities under study
Facility
Land availability
(10 points)
Hours of facility
operation (points)
Operational hours of
generator (3 points)
Cost of production (3 points)
Production capacity
(5 points)
Water quality
(5 points)
Total points
Water wells √ √ √ √ √ √ 31
Desalination plants
√ √ √ √ √ 26
Water pump stations
√ √ √ √ √ 26
Wastewater pump stations
√ √ √ √ √ 26
The facilities were classified based on the FI; the facilities which obtained a FI score of more than 60
are considered as the most suitable for PV systems and deserve the highest priority for funding. The
second group is facilities with a FI ranging from 40–60; this group requires certain improvements to
enhance the benefits from solar technologies before the installation of a PV system is approved. The
last group has a FI value of less than 40; these facilities are considered infeasible for the installation of
PV systems. Table 1.3 presents the classification of WASH facilities based on the FI index and the
corresponding numbers.
Table 1.3 – Classification of WASH facilities
Facility
Total
Water wells 95 128 43 622
Public desalination plants
15 30 7 26
Private desalination plants2
10 7 4 62
Sewage pump stations
10 30 9 94
Water pump stations
8 19 15 96
Total 138 214 78 430
2 Who are willing to work during emergency based on GVC study.

14 | P a g e
1 Introduction
1.1 Background
The Gaza Strip is a densely populated area that relies on the aquifer as its main freshwater resource.
The yearly groundwater abstraction from the aquifer in the Gaza Strip reaches approximately 183
million cubic metres (MCM), while, according to the Palestinian Water Authority (PWA), the yearly
natural recharge does not exceed 55–60 MCM. As a result of this lack of equilibrium between
abstraction and natural recharge, groundwater quality in the Gaza Strip has dramatically deteriorated.
The groundwater level has declined during the last few years to about 10–15m below sea level. This
has led to the invasion of seawater in large parts of the inland aquifer as well as the upwards leakage
of the underlying saline brackish water. This has led to an increase in the salinity of the groundwater to
an unacceptable level, where more than 97% of pumped groundwater exceeds World Health
Organization (WHO) standards in terms of chloride concentration in drinking water. For sanitation, the
Gaza Strip has also been suffering from serious infrastructure challenges in wastewater
collection/disposal and treatment. The PWA estimates that yearly wastewater generation within the
Gaza Strip reaches approximately 40 MCM. This is partially treated in 6 wastewater treatment plants
before being dumped into the Mediterranean.
Currently, municipal wastewater collection/disposal coverage does not exceed 73% of the total
population of the Gaza Strip, while the remainder of the population rely on septic tanks and/or cesspits
for the disposal of their wastewater. The six wastewater treatment plants in the Gaza Strip are
overloaded as they receive greater quantities of wastewater than their design capacities allow.
Accordingly, these plants do not work efficiently and the effluent generated is usually of poor quality
that is not compliant with the WHO and/or Palestinian Authority (PA) standards. All figures quoted
were obtained during meetings conducted with PWA and the Coastal Municipalities Water Utility
(CMWU).
The context described above, especially for domestic water, made it necessary for policy makers in
the Gaza Strip (PWA) to adopt desalination as a solution for the supply of good-quality drinking water
for the population. The main service provider in the Gaza Strip, CMWU, has therefore established 52
public desalination plants for desalinating brackish water. There are about 70 private desalination
plant working in the Gaza Strip. According to a study carried out by the Italian NGO, GVC, these
include 21 private desalination plants which are willing to operate during emergencies.
Other public water and sanitation facilities operated by CMWU/municipalities include (i) 922 municipal
domestic water wells, (ii) 42 water pump stations, (iii) 92 sewage pump stations and 6 wastewater
treatment plants. According to CMWU, the public WASH facilities need approximately 36 megawatts
(MW) per day to operate.
Since 2006, the Gaza Strip has been suffering from a chronic electricity shortage, which negatively
affects all aspects of living conditions. This situation has severely affected the availability of essential
services, particularly health, water and sanitation services; in July 2018, the overall shortage in
electricity reached 80%.
As with other services, the functioning of WASH services is highly correlated to the electricity shortage

15 | P a g e
situation, which has suffered the following effects:
The daily per capita domestic water has decreased from 84 litres to 53 litres.
At the public desalination plants, capacity has been reduced to 20%.
More than 100,000 cubic metres of raw wastewater is dumped into the Mediterranean daily.
Flooding may occur in the locations of the wastewater pump stations (low points), especially
during rainy seasons. This is a critical public health issue.
In response to this situation, the PWA has developed its own strategy to solve the WASH crisis in the
Gaza Strip, as well as to maintain the needed electricity supplies for WASH facilities, by considering a
range of potential options for water supply. These include seawater desalination, transfer of water
from Israel, wastewater reuse for agricultural purposes, in addition to utilization of renewable energy
resources, including solar energy, for the operation of WASH facilities. According to PWA strategy, by
2022, the power demand of WASH facilities in the Gaza Strip will reach 92 MW.
At the humanitarian level, the WASH Cluster has adopted renewable energy, solar energy, for the
operation of WASH facilities. The WASH Cluster has provided recommendations to various
organizations to invest in solar energy resources to support humanitarian WASH projects, thereby
enhancing their sustainability and operation.
In general, the Gaza Strip suffers from a shortage of power sources as the public network provides
electricity just 25–75% of the time. Water facilities are negatively affected by this and most use diesel
generators to overcome the power shortage. However, there are two main problems in using
generators: the first is the high cost of diesel ($1.3/litre) and the second is the lack of continuous
availability of diesel due to the unstable political and financial circumstances.
Therefore, Oxfam contracted Enfra consultants to conduct a ‘Comprehensive Study of Renewable
Energy Sources in Gaza’s WASH Sector for Public and Private WASH Facilities’. The main aim of this
study is to map all water facilities which have the potential to use solar energy and provide a feasibility
study on utilizing such renewable energy.
1.2 Overall objective
This study is to assess the available renewable solar energy technologies and then to prioritize the
most efficient and feasible technology that can be utilized for public and private WASH facilities in the
Gaza Strip. The study aims to identify t he benefits of utilization of renewable solar energy for the
operation of public and private WASH facilities in the Gaza Strip in order to supply vulnerable
communities with essential water and sanitation services. Further, this study aligns with the aims of
PWA to use solar energy as an alternative renewable energy resource for the operation of WASH
facilities in the Gaza Strip.
1.3 Specific objectives
There are several specific objectives to be achieved by the study, as follows:
Review WASH facilities in the Gaza Strip (mainly municipal water wells, municipal water pump
stations, public desalination plants, private desalination plants, sewage pump stations and

16 | P a g e
wastewater treatment plants) to identify and review the existing level of solar energy usage.
Study the feasibility of using solar energy for the operation of WASH facilities in the Gaza
Strip, focusing on the new available technologies that can utilize solar energy with the highest
efficiency and most economically. The main question of the study is to what extent the usage
of solar energy for the operation of WASH facilities in the Gaza Strip is feasible.
Identify future solar energy projects and their prioritization for the operation of WASH facilities
in the Gaza Strip.
Transfer the knowledge, capacity building and technical guidance, in relation to assessing
WASH projects incorporating solar energy, to WASH stakeholders in the Gaza Strip.
Develop a standardized technical approach for the installation and operation/maintenance of
solar energy systems in WASH facilities in the Gaza Strip.

17 | P a g e
2 Methodology
2.1 Approach and methodology flowchart
The consultant was tasked with gathering, reviewing and verifying information related to the targeted
WASH facilities in the Gaza Strip. The WASH facilities included in this study comprise water pump
stations, public and private desalination plants, water wells, wastewater pump stations and wastewater
treatment plants. The consultant analysed and assessed the available quantitative and qualitative data
of the WASH facilities. Based on the results, the feasible, moderately feasible and non-feasible WASH
facilities for installing solar technology were identified. Figure 2.1 summarizes the stages of the
methodology, which are described in detail below.
2.2 The inception report
The consultant submitted an inception report as the first deliverable for the study, in October 2018.
The inception report set out a clear way forward for the execution of the assignment. This report was
prepared to clarify the overall strategies, methodology and action plans adopted for managing and
conducting the assignment within the designated timeframe as well as the expected level of quality.
Furthermore, the report included a detailed implementation plan for the assignment, with a plan for the
effective utilization of resources and responsibilities.
Data collection methodology
The data collection methodology comprised two stages. The first stage included reviewing and
verifying existing data on the WASH facilities, whereby a literature review was conducted on the
different types of solar technologies worldwide and locally, and their advantages and disadvantages.
The second stage included assessing the situation for installing solar energy systems in WASH
facilities in the Gaza Strip (mainly municipal water wells, wastewater pump stations and wastewater
treatment plants, public desalination plants, private desalination plants and water pump stations); this
was achieved by conducting field visits to the targeted facilities (see Annex 3.1). The following
sections briefly describe the data collection methodology.

18 | P a g e
Figure 2.1 – Flow chart showing the applied methodology
2.3 Mobilization, review and verification of existing data
A kick-off meeting was held between Oxfam and Enfra on Tuesday 16 October 2018. Matters
discussed included the methodology and work plan for the assignment, coordination, previous
documents and data collection, and preparing the checklist.
Desk review
Enfra obtained up-to-date information on the targeted WASH facilities. The consultant reviewed the
collected information from various local studies and reports.
The consultant also reviewed previous documents and literature on solar energy technologies to
prioritize the most efficient and feasible technology that can be utilized for public and private WASH
facilities in the Gaza Strip. This review process included the National Renewable Energy Strategy and
the aims of PWA to use solar energy as an alternative renewable energy resource for the operation of

19 | P a g e
WASH facilities in the Gaza Strip. The reports and articles reviewed are as follows:
Action Against Hunger (AAH) (2018). Technical Verification and Assessment of Public
Desalination Plants in Gaza Strip, Gaza, the Occupied Palestinian Territory (OPT).
AAH (2018). Technical Feasibility Study and Unit Design for Piloting a Hydropower Electric
System, Gaza, OPT.
Husam Baalousha (2006). ‘Desalination status in the Gaza Strip and its environmental
impact’, Desalination Journal 196, 1–12, Gaza, OPT.
ICRC (2017). Rapid Assessment on Solar Energy for Gaza House Hold, Ramallah, OPT.
Mogheir Y., Ahmad A. Foul, A.A. Abuhabib and A.W. Mohammad (2013). ‘Assessment of
large scale brackish water desalination plants in the Gaza Strip’, Desalination Journal 314,
96–100, Gaza, OPT.
Palestinian Environmental NGOs Network – Friends of the Earth Palestine (2016). Pre Master
Plan Solar Energy Production in Palestine, OPT.
Water Desalination Strategy in Gaza Strip: Challenges and Opportunities, PWA (2013). Gaza,
OPT.
Survey of Private and Public Brackish Desalination Plants in Gaza Strip, PWA, GIZ (2015),
Gaza, OPT.
Ouda M., (2003). Prospects of Renewable Energy in Gaza Strip, Energy Research and
Development Center, Islamic University of Gaza, OPT.
Yasin A., (2008). Optimal Operation Strategy and Economic Analysis of Rural Electrification of
Atouf Village by Electric Network, Diesel Generator and Photovoltaic System, Najah
University, Nablus, OPT.
Hala El-Khozenadar and Fady El-Batta (2018). ‘Solar Energy as an Alternative to
Conventional Energy in Gaza Strip: Questionnaire Based Study’, An - Najah Univ. J. Res. (N.
Sc.) Vol. 32(1), OPT.
EWASH (2014) ‘Seawater Desalination for Gaza: Implications and Challenges’, position
paper/Non-UN document.
PWA (2013). ‘Water Desalination Strategy in Gaza Strip: Challenges and Opportunities’, OPT.
GVC. Drinking Water Distribution Mapping During Crises in the Gaza Strip, June 2018
PWA (2012), Assessment of groundwater desalination Units in the Gaza Strip, General
Directorate of Water Resources and Planning, OPT. (Report in Arabic).
PWA (2015), Technical Report of the Quality Control Program for Desalination Stations, Case
Study of the Governorates of Gaza and North Gaza, General Directorate of Water Resources

20 | P a g e
and Planning, OPT. (Report in Arabic).
Interviews
Having performed the above activities, pre-structured interviews were carried out with focal points of
the relevant authorities and NGOs, working groups of the UN, private sector and other stakeholders
for direct data and related documents collection (secondary data) as well as coordination of field visits.
This included a list of the targeted WASH facilities and available data. Table 2.1 shows meetings
conducted with relevant stakeholders; and the detailed schedule of the conducted field visits is listed
in Annex 3.1.
Table 2.1 – List of interviews with relevant focal points
Institute
Palestinian Water Authority (Ramalah)
Palestinian Water Authority (Gaza)
Coastal Municipalities Water Utility (CMWU)
UNICEF (WASH Cluster Coordinator)
Municipality of Gaza
Gaza Electrical Distribution Corporation Ltd (GEDCO)
Palestinian Energy and Natural Resources Authority (PENRA)
Action Against Hunger (AAH)
United Nations Office for the Coordination of Humanitarian Affairs (OCHA)
International Committee of the Red Cross (ICRC)
UN Unit
Review the Palestinian policies and strategies
The consultant reviewed the Palestinian policies and strategies for renewable energy. This involved
obtaining a clear vision of strategies and authorized laws/regulations that encourage the use of
renewable energy, such as the Palestinian Renewable Energy Strategy which was issued by
Palestinian Energy and National Resources Authority (PENRA) and decree laws related to renewable
energy and energy efficiency.
2.4 Data collection and field survey
Throughout this stage, the usage of solar energy in the targeted WASH facilities of the Gaza strip
(mainly municipal water wells, wastewater pump stations and wastewater treatment plants, public
desalination plants, private desalination plants) was assessed. This was carried out by conducting
field visits to the targeted facilities using various data collection tools.

21 | P a g e
The targeted WASH facilities were as follows (See Annex 3.2 for details):
266 municipal domestic water wells
49 wastewater pump stations
8 wastewater treatment plants
52 public desalination plants
21 private desalination plants
42 water pump stations.
The consultant prepared a list of the targeted WASH facilities based on the desk review; the
consultant then discussed this with Oxfam and gained its approval of this list for further study and
analysis. The consultant designed a checklist for collecting the necessary data through the field
survey; this was approved by Oxfam (Annex 3.3 presents a checklist template for the WASH facilities).
The consultant team then conducted the field survey and obtained all necessary data from the
targeted WASH facilities.
2.5 Data analysis methodology
Data analysis was divided into two parts. The first part comprised analysing the solar technologies
data in order to identify the suitable solar technology for each WASH facility. Based on solar
technologies fundamentals and concepts, and more specifically the solar PV systems, the consultant
identified the suitable PV system for each WASH facility under study, based on the following
parameters:
Type of WASH facility
Operation period of the facility
Availability of land for PV panels installation
Availability of a diesel generator in the facility
Availability of a water storage tank in the facility.
The second part included developing a baseline mapping of the targeted WASH facilities. This
included a comprehensive list of WASH facilities with Geographic Information Systems (GIS) maps.
Analysis of the data was carried out based on the following:
Facility location
Available area
Water or wastewater production
Operation hours
Power consumption
Availability of diesel generators.

22 | P a g e
2.6 Feasibility methodology
The consultant studied the feasibility of using solar PV systems for WASH facilities in the Gaza Strip
based on the identified PV technologies for each WASH facility under study. A cost-benefit analysis
was carried out, taking into consideration all aspects related to market analysis, capital cost and the
operation and maintenance of the PV systems. This involved:
1. Identifying the current situation
2. Conducting meetings with stakeholders
3. Exploring current solar energy usage in WASH facilities in the Gaza Strip.
The consultant carried out data collection from all key parties that manage and operate water facilities
using solar energy. This step enabled the establishment of an effective feasibility study that describes
and assesses the cost of such technologies.
Financial feasibility
The consultant analysed existing information in literature and data regarding PV systems for WASH
facilities in the Gaza Strip. The aim was to determine the capital and maintenance costs of such
systems. Meetings with Gaza PV firms were also conducted to determine the current market prices.
Based on the collected data, the consultant proposed the capital cost of each system.
The maintenance cost is estimated as 5% of capital cost per operational year, considering the system
will work for 20 years before replacement.
To study the financial feasibility of PV systems, the consultant determined the Net Present Value
(NPV) and the payback period. To determine such values, the consultant estimated the cost of
electricity generated from diesel generators, based on the following:
Total operation hours of generators are estimated to be 35,000 hours before replacement.
A generator will work 7 hours daily for the whole year and will require 10% of its capital cost per year as maintenance cost.
The consultant calculated the estimated cost based on generators with a capacity of 40 Kilovolt-ampere (KVA) and 110 KVA, as these two types of generators are widely used in the Gaza Strip.
Based on the capital cost, maintenance cost and yearly revenues, the consultant estimated the NPV
and payback period.
The cost of generating kWh from a PV system was calculated based on the total cost of the system for
20 years and the revenues for the same period. The total electricity generated from PV systems is 5.3
kWh/kWp/day; 70% of this amount is used by WASH facilities (except wastewater pump stations,
which benefit from 30%, as sewage pump stations do not work continuously).

23 | P a g e
Technical feasibility
To determine the technical feasibility, several evaluation criteria were set for each facility depending
on type. Table 3.2 presents the criteria used for each facility.
The criteria have different weights according to the degree of importance; the weight of each criteria is
presented in Table 2.2 in terms of points. The consultant discussed and gained approval for the
criterion and the weighting system with Oxfam and all concerned stakeholders. An explanation of each
criterion is presented below.
Table 2.2 – Matrix of WASH facility, criteria and the corresponding weighting factor
Criteria Land
availability, C1
Operation hours of
facility, C2
Operation hours of
generator, C3
Cost of water production,
C4
Facility capacity,
C5
Water quality,
C6
Total Points
Weighting factor
10 5 3 Varies
between 0 to max 3
5 5
Water wells √ √ √ √ √ √ 31
Desalination plants
√ √ √ √ √ 26
Water pumps
√ √ √ √ √ 26
Wastewater pump stations
√ √ √ √ √ 26
Land availability: This criterion is considered as the most important; it therefore has the highest
weight (10 points). The major problem facing solar energy use is the need for suitable land for solar
panels. This criterion represents the availability of land suitable for implementing the solar PV project.
It also shows the capacity of the needed PV system (kWp) with respect to the capacity of the PV
system based on the available area. If the required design area for a PV system for full utilization is
DA and the available area is AA, then:
Hours of facility operation: Operation hours of WASH facilities vary based on the type and capacity
of the facility. More operation hours for the facility means that a PV system will be more beneficial.
During data collection, the consultant gathered information on the required hours of operation per day.
Operation hours per day are calculated as a percentage of 24 hours and multiplied by the weighting
factor of the operation hours of facility (5). If the required operation hours of the facility are (OH)F, then:

24 | P a g e
Operational hours of generator: Most WASH facilities have generators to partially bridge the
shortage of power. It is clear that when a diesel generator operates for more hours per day, installing a
PV system will be more beneficial. The consultant collected current generator hours per day and
calculated this as a percentage of 24 hours. The percentage of generator operation per day is
multiplied by the weighting factor of the operation hours of generator (3). For example, if the generator
operation hours are (OH)G, then
Cost of production: The consultant collected data regarding quantity of flow produced from the water
wells and desalination plants or pumped by the water pump stations and wastewater pump stations.
The cost of production is computed by dividing the operational daily cost of the facility by its daily
production of water in m3. Consequently, the consultant classified the cost of production into several
ranges using the equation below. If the daily cost is equal to or less than a specific value, the
weighting factor is considered 3; otherwise for a smaller daily cost the weighting factor is considered
less than 3, as shown in Tables 2.3–2.7.
Table 2.3 – Water pump stations cost of production
Ranges of cost of production ($/m3) Weighting factor
from to
0 3
> 0.01 = 0.04 2.4
> 0.04 = 0.06 1.8
> 0.060 = 0.08 1.2
> 0.100 = 0.180 0.6
More than 0.18 0
Table 2.4 – Sewage pump stations cost of production
Ranges of cost of production ($/m3) Weighting factor
from to
0 3
> 0.00 = 0.05 2.4
> 0.05 = 0.10 1.8
> 0.10 = 0.70 1.2
> 0.70 = 1.00 0.6
More than 1 0

25 | P a g e
Table 2.5 – Private desalination plants cost of production
Ranges of cost of production ($/m3) Weighting factor
from to
0 3
> 0 = 0.01 2.4
> 0.01 = 0.04 1.8
> 0.04 = 0.08 1.2
> 0.08 = 0.10 0.6
More than 0.1 0
Table 2.6 – Public desalination plants cost of production
Ranges of cost of production ($/m3) Weighting factor
from to
0 3
> 0 = 0.05 2.4
> 0.05 = 0.1 1.8
> 0.1 = 1 1.2
> 1 = 8 0.6
More than 8
Table 2.7 – Water wells cost of production
Ranges of cost of production ($/m3) Weighting factor
from to
0 3
> 0.01 = 0.09 2.4
> 0.09 = 0.13 1.8
> 0.130 = 0.18 1.2
> 0.180 = 0.260 0.6
More than 0.26
Facility capacity: The flow capacity of the facility is also an important factor as it represents the
number of residents that the facility serves. Therefore, the consultant considered the capacity of the
facility as an important criterion to measure the benefits of the facility.
The consultant classified the facility capacities into several ranges using the equation below. If the

26 | P a g e
daily flow rate equals or is less than a specific value (based on facility type), the weighting factor is
considered 3; otherwise a smaller weighting factor is given based on the flow rate, as shown in Tables
2.8–2.12.
Table 2.8 – Water pump stations (WPS) production capacity
WPS flow rate (m3/hr) Weighting factor
from to
100 or less 0
>100 = 200 0.6
>200 = 350 1.2
>350 = 500 1.8
>500 = 650 2.4
>650 3
Table 2.9 – Sewage pump stations (SPS) production capacity
SPS flow rate (m3/hr) Weighting factor
from to
95 or less 0
>95 = 200 0.6
>200 = 400 1.2
>400 = 800 1.8
>800 = 1,000 2.4
> 1,000 = 9,000 3
Table 2.10 – Private desalination plants (PriDP) production capacity
PriDP flow rate (m3/hr) Weighting factor
from to
100 or less 0
> 50 = 15 0.6
>150 = 300 1.2
>300 = 450 1.8
>450 = 600 2.4
> 600 = 800 3

27 | P a g e
Table 2.11 – Public desalination plants (PubDP) production capacity
PubDP flow rate (m3/hr) Weighting factor
from to
1 or less 0
>20 = 200 0.6
>200 = 400 1.2
>400 = 800 1.8
>800 = 1,000 2.4
>1,000 = 1,500 3
Table 2.12 – Water well (WW) production capacity
WW flow rate (m3/hr) Weighting factor
from to
33 or less 0
>30 = 70 0.6
>70 = 110 1.2
>110 = 150 1.8
>150 = 200 2.4
More than 200 3
Water quality: This parameter is valid only for water wells. The consultant recommends that any PV
system investment should be carried out at water wells of good quality rather than of those of bad
quality water. As the quality varies from well to another and from one governorate to another, the
consultant classified the degree of quality per governorate. The consultant considered two parameters
to measure the quality: chloride and nitrate. Then the water-quality weighting was calculated as the
average between the two parameters, as presented in Annex 3.4.
Feasibility index: Based on the weights of each criteria, the consultant estimated the feasibility index
(FI) per facility as follows:
Based on the FI, the consultant classified the WASH facilities into three categories, as shown in Table
2.13.

28 | P a g e
Table 2.13 – WASH facilities classification according to FI
FI Classification
FI>60 Feasible
40<FI<60 Moderately feasible
FI<40 Not feasible
29 | P a g e
3 Final report
Having performed all tasks of the study including data collection, review of all existing data, field
survey, analysis of data, mapping baseline and feasibility tasks, the consultant submitted the draft final
report to Oxfam for review. Upon receiving all comments from Oxfam, these comments were
incorporated into the final version of the report.
3.1 Introduction: solar energy technologies
This chapter introduces the various solar energy technologies used worldwide and the main
differences between them. The consultant reviewed the application of the solar technologies in the
Gaza Strip in terms of size of sector, especially for WASH facilities. The criteria for solar technologies
selection for WASH facilities were determined through identifying and comparing five PV solar
systems, considering their advantages and disadvantages. Based on this assessment, the consultant
identified the suitable PV system for each WASH facility, as indicated in Annex 4.1. Local market
capacity, national energy strategy, and the legal and regulatory environment of solar technologies are
also discussed in this chapter.
Solar energy technologies worldwide
Solar energy plays a significant role in ensuring a sustainable energy future and reducing future
carbon emissions. It can be used for heating, cooling, lighting, electrical power, transportation and
even environmental clean-up. It is estimated that the global average solar radiation, per square metre
per year, can produce the same amount of energy as a barrel of oil, 200kg of coal or 140m3 of natural
gas.
There are two main types of solar energy technologies, namely photovoltaic (PV) technology and
thermal technology; more details on these types are presented in the next section. According to the
International Renewable Energy Agency (IRENA), global installed capacity for solar-powered systems
has shown exponential growth, reaching 390 gigawatts (GW) at the end of 2017. About 385 GW is
produced from PV systems and 5 GW is obtained from thermal solar power (concentrated solar power
or CSP). This indicates that more than 98% of the produced solar energy comes from PV solar
systems (https://www.irena.org/solar). IRENA reports that the solar energy produced in the Middle
East area reached 2.35 GW by the end of 2017, which represents less than 1% of globally produced
solar energy. The International Energy Agency (IEA) (https://www.iea.org) stated that, at the end of
2018, globally installed solar PV systems produce a cumulative total of approximately 402 GW.
3.2 Types of solar energy technologies
There are several kinds of solar technologies currently available. These include solar thermoelectricity
(STE), dye-sensitized solar cell (DSSC), concentrated photovoltaic (CPV), PV solar panels and
concentrated solar power (CSP), (Global Energy Network Institute, GENI, http://www.geni.org (2019)).
The non-concentrated PV solar panels and CSP are the two most mature technologies. They have
been commercialized and are expected to experience increasing growth in the near future. PV
technologies directly convert light to electricity; whereas CSP (solar thermal technologies) uses heat

30 | P a g e
from the sun (thermal energy) to drive electric turbines, hot water and air heating
or conditioning .smstsys The following section presents more details regarding these two types of solar
energy technologies.
Solar thermal technologies
This involves harnessing solar energy for thermal energy (heat). Solar thermal technologies comprise
flat or parabolic collectors (low and medium temperatures and high temperature collectors)
concentrating sunlight, mainly using mirrors and lenses. Solar heating is the utilization of solar energy
to provide process heat, especially in crop drying, water heating, cooking, or space heating
and cooling. Solar thermal technologies can be divided into the following technologies:
Solar water heaters (SWH): Solar collectors are applicable worldwide and are even suitable in areas
with low solar radiation and short periods of sunshine. The technology for solar thermal water heaters
is present worldwide and significant deployments occur already in emerging economies and
developing countries. Technologies include glazed flat plate collectors, evacuated tube collectors, and
lower-temperature swimming-pool heaters made from plastic tubes.
Concentrated solar power (CSP) uses mirrors and tracking systems to focus sunlight from a large
area into a small focused beam. The concentrated heat is then used as a heat source for various
applications, such as conventional steam-based power plants, desalination of water, or for cooking. A
wide range of concentrating technologies exists; the most developed are the parabolic trough and the
solar power tower. Two less well developed technologies are dish concentrators and linear Fresnel
reflectors. Various techniques are used to track the sun and focus light. Very common in CSP is the
use of thermal energy storage, which can be used to provide heat at times when the sun is not
shining. Energy storage via CSP is cost effective, and almost all CSP systems are built with a storage
capacity of up to 15 hours. Solar cooking can be done at relatively small scale and low cost using a
wide range of technologies such as box cookers, solar bowls and the Scheffler reflector.
Photovoltaic (PV) technologies
PV technologies obtain electricity directly from sunlight via an electronic process that occurs naturally
in certain types of material called semiconductors. Electrons in these materials are freed by solar
energy and can be induced to travel through an electrical circuit, powering electrical devices or
sending electricity to the grid. PV modules contain no moving parts and generally last 30 years or
more with minimal maintenance. PV devices can be used to power anything from small electronics,
such as calculators and road signs, up to homes and large commercial businesses. PV electricity
output peaks at midday when the sun is at its highest point in the sky, and can offset the most
expensive electricity when daily demand is greatest. Homeowners can install a few dozen PV panels
to reduce or eliminate their monthly electricity bills, and utilities companies can build large ‘farms’ of
PV panels to provide pollution-free electricity to their customers. Traditionally, PV modules are made
using various forms of silicon, but many companies are also manufacturing modules that employ other
semiconductor materials, often referred to as thin-film PV. Each of the various PV technologies have
unique cost and performance characteristics that drive competition within the industry. Cost and
performance can be further affected by the PV application and specific configuration of a PV system.

31 | P a g e
3.3 Comparison of solar energy technologies
Solar thermoelectricity (STE) uses parabolic disc technology to capture thermal energy based on
the thermoelectric effect. Electricity is produced through a concentrator thermoelectric generator
(CTEG). STE produces energy by converting differences in temperatures in the two parts into volts
using a semiconductor. The efficiency of thermoelectric materials is still very low. Like most of the
other solar technologies with concentration requirements, this system is unable to collect diffuse
irradiation and must rely on direct radiation only. In order to have sufficient output to work efficiently,
high temperatures are needed (~200C0). In addition, thermoelectric material like Bismuth telluride is
toxic and expensive. Cooling systems are required to decrease the temperature of the cold side in
order to achieve total efficiency.
A dye-sensitized solar cell (DSSC) (invented in 1991) is based on a semiconductor formed between
a photo-sensitized anode and an electrolyte, a photo electrochemical system. Sunlight enters the cell
through the transparent cover, striking the dye on the titanium dioxide (TiO2) surface. This creates an
excited state of the dye, from which an electron is injected into the conduction band of the TiO2. From
there, it moves by diffusion (as a result of an electron concentration gradient) to the clear anode on
top. Consequently, a certain electronic process is developed to generate electricity. Current efficiency
is still relatively low compare with traditional semiconductor solar cells. Dyes will degrade when
exposed to ultraviolet radiation that limits the lifetime and stability of the cells. This would negatively
affect the cost and may lower the efficiency.
Concentrated photovoltaic (CPV) technology uses optics such as lenses to concentrate a large
amount of sunlight onto a small area of solar photovoltaic materials to generate electricity. CPV
systems are categorized according to the amount of solar concentration, measured using a specific
concentration ratio. Like most concentration systems, CPV is unable to collect diffuse irradiation. Even
a small cloud may drop the production to zero. Unlike concentrated solar power, the storage system
that can mitigate this problem is expensive, since it is much easier to store heat than electric energy.
This kind of instability will not be ideal when connected to the grid.
Concentrated solar power (CSP) systems use mirrors or lenses to concentrate a large area of
sunlight, or solar thermal energy, onto a small area. Electrical power is produced when the
concentrated light is converted to heat which drives a heat engine (usually a steam turbine) connected
to an electrical power generator. Unlike the PV solar cells, converting energy from sunlight to
electricity by CSP systems is based on the application of heat engine rather than PV effect which
directly transfers photon energy into electricity energy. In terms of electricity, CSP is indirect
technology which can be applied to generate electricity.
Photovoltaics (PV) is a method of generating electrical power by converting solar radiation into direct
current electricity using semiconductors that exhibit the PV effect. PV power generation employs solar
panels composed of a number of solar cells containing a PV material. Materials presently used for PV
include monocrystalline silicon, polycrystalline silicon, amorphous silicon, cadmium telluride and
copper indium gallium selenide/sulfide. PV solar panel is the most commonly used solar technology to
generate electricity energy. The basic idea of the PV effect depends on the fact that electrons will emit
from matter (metals and non-metallic solids, liquids or gases) as a result of their absorption of energy
from electromagnetic radiation of very short wavelength, such as visible or ultraviolet light. Electrons
emitted in this manner may be referred to as ‘photoelectrons’.

32 | P a g e
Despite the optimistic predictions of the PV industry, this technology has disadvantages that will need
more effort to overcome. Solar electricity is still more expensive than most other forms of small-scale
alternative energy production. It is not produced at night and is greatly reduced in cloudy conditions.
Therefore, a storage or complementary power system is required. Solar electricity production depends
on the limited power density of the location’s insolation.
PV technologies are the most commonly used solar energy collecting technologies around the world
and will continue to see rapid and steady growth. Each of the PV technologies has its own advantages
and drawbacks and it is not certain which one will dominate the market in the following decades;
however, it is certain is that PV technologies will help countries to develop a clean and renewable
future.
Based on the above discussion, most solar power systems fall into one of two major classes in
terms of producing electricity: direct and indirect solar power. Direct solar power refers to a system
that converts solar radiation directly to electricity using a PV cell. Indirect solar power refers to a
system that converts solar energy first to heat and after that to electrical energy, as in the case of
CSP. The problems with these technologies are inefficiency and a very high capital cost.
Based on research by several international agencies working in the field of solar energy (such as the
IEA, IRENA, Solar Energy Industries Association (SEIA), The International Renewable Energy
Alliance (REN Alliance) and the American Solar Energy Society (ASES), the recommended direct
technology to produce heat from solar energy is solar thermal technologies, while the optimum
direct technology to generate electricity is through PV technologies. Therefore, the consultant
recommends using solar PV technologies for producing electricity, and therefore PV
technologies received the consultant’s full consideration.
33 | P a g e
4 Use of solar PV technologies in the Gaza Strip
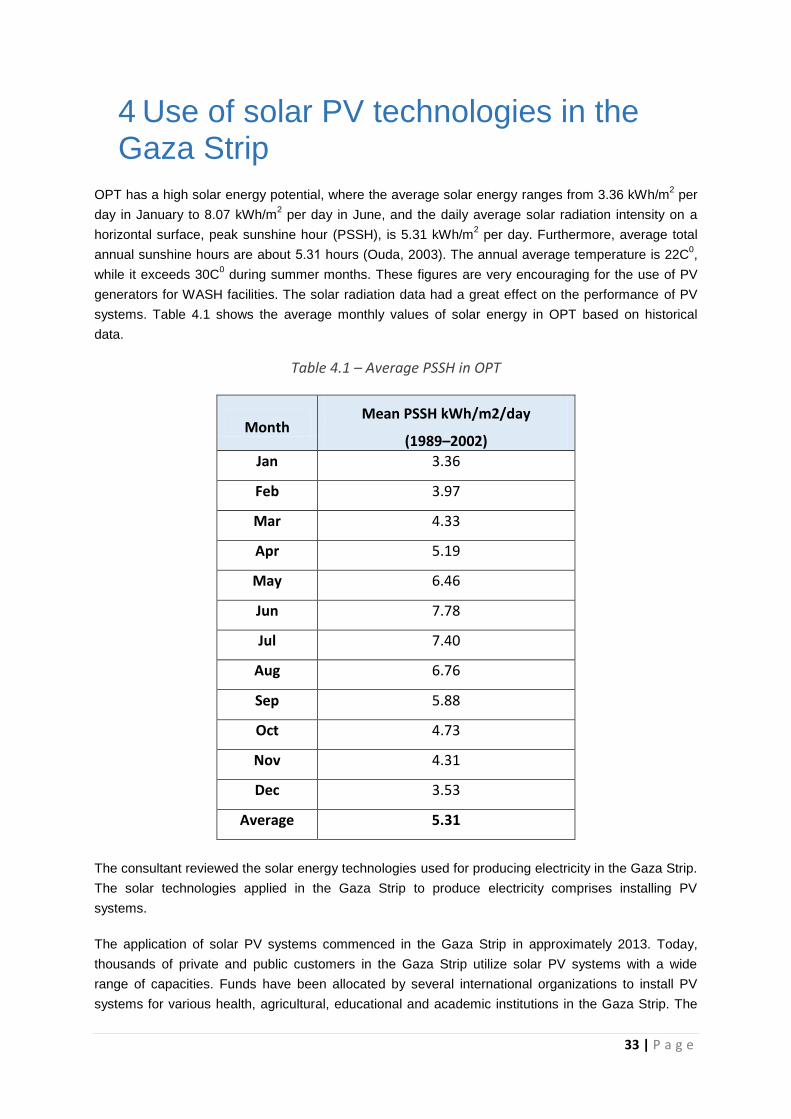
OPT has a high solar energy potential, where the average solar energy ranges from 3.36 kWh/m2 per
day in January to 8.07 kWh/m2 per day in June, and the daily average solar radiation intensity on a
horizontal surface, peak sunshine hour (PSSH), is 5.31 kWh/m2 per day. Furthermore, average total
annual sunshine hours are about 5..1 hours (Ouda, 2083). The annual average temperature is 22C0,
while it exceeds 30C0 during summer months. These figures are very encouraging for the use of PV
generators for WASH facilities. The solar radiation data had a great effect on the performance of PV
systems. Table 4.1 shows the average monthly values of solar energy in OPT based on historical
data.
Table 4.1 – Average PSSH in OPT
Month Mean PSSH kWh/m2/day
(1989–2002)
Jan 3.36
Feb 3.97
Mar 4.33
Apr 5.19
May 6.46
Jun 7.78
Jul 7.40
Aug 6.76
Sep 5.88
Oct 4.73
Nov 4.31
Dec 3.53
Average 5.31
The consultant reviewed the solar energy technologies used for producing electricity in the Gaza Strip.
The solar technologies applied in the Gaza Strip to produce electricity comprises installing PV
systems.
The application of solar PV systems commenced in the Gaza Strip in approximately 2013. Today,
thousands of private and public customers in the Gaza Strip utilize solar PV systems with a wide
range of capacities. Funds have been allocated by several international organizations to install PV
systems for various health, agricultural, educational and academic institutions in the Gaza Strip. The

34 | P a g e
consultant reviewed the size of the installed PV systems in the Gaza Strip from all available literature
and previous studies. From 2013 to 2017, there were about 330 projects installing PV systems for
public and private institutions, as shown in Table 4.2. Table 4.2 indicates that the total PV capacities of
these installations is about 5,611 kWp. The distribution of these 330 projects across various private
and public facilities is shown in Table 4.3.
Table 4.2 – PV systems installed in the Gaza Strip
Year 2013 2014 2015 2016 2017 Total
(cumulative)
Capacity kWp 20 87 131 2,842 2,531 5,611
No. of projects 1 5 60 76 188 330
Table 4.3 – Number and size of PV systems installed at institutions in the Gaza Strip
Type No. Range of capacity kWp
Schools 80 15–120
Universities 4 42–142
Health facilities 16 14–50
Private facilities 112 12–500
Municipalities facilities 3 13–40
Agriculture 113 40–50
Total 328
4.1 PV systems for WASH facilities
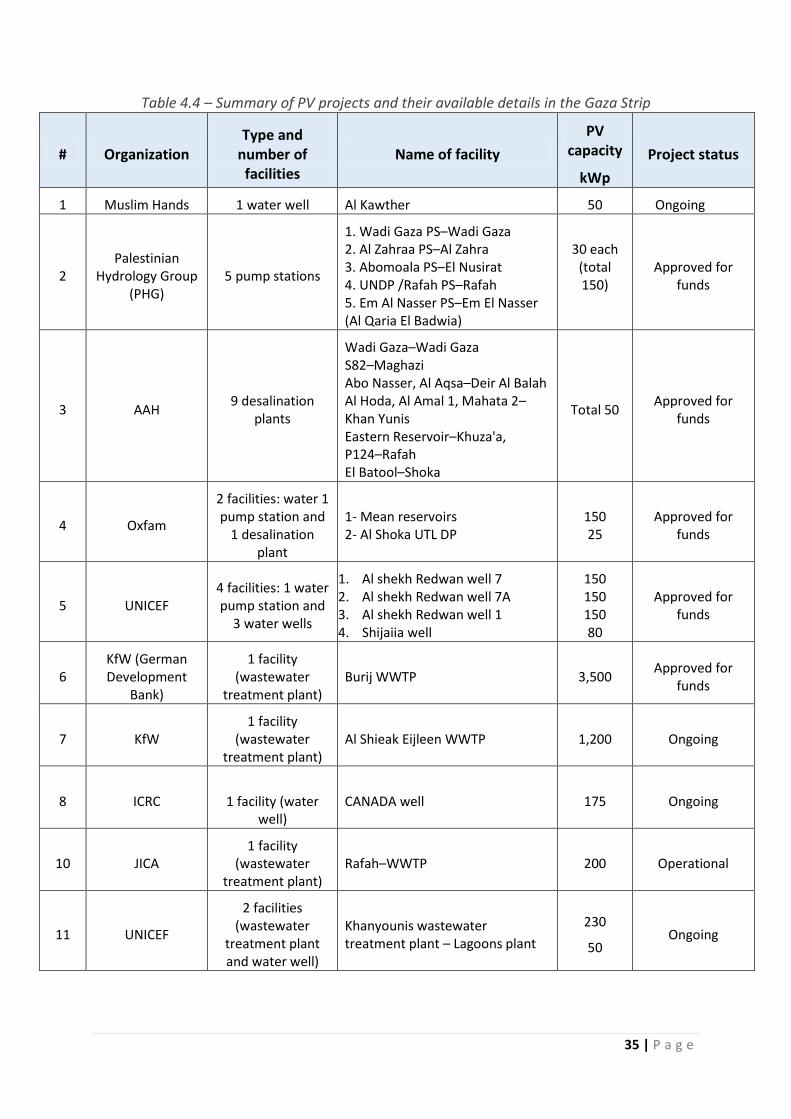
According to data obtained from institutions operating in the Gaza Strip, several funding and
implementing agencies have allocated funds for solar PV systems at various water and wastewater
facilities. Table 4.4 presents the funding/implementing agencies, type of facility and the capacity of the
installed PV systems.
35 | P a g e
Table 4.4 – Summary of PV projects and their available details in the Gaza Strip
# Organization Type and
number of facilities
Name of facility
PV capacity
kWp
Project status
1 Muslim Hands 1 water well Al Kawther 50 Ongoing
2 Palestinian
Hydrology Group (PHG)
5 pump stations
1. Wadi Gaza PS–Wadi Gaza 2. Al Zahraa PS–Al Zahra 3. Abomoala PS–El Nusirat 4. UNDP /Rafah PS–Rafah 5. Em Al Nasser PS–Em El Nasser (Al Qaria El Badwia)
30 each (total 150)
Approved for funds
3 AAH 9 desalination
plants
Wadi Gaza–Wadi Gaza S82–Maghazi Abo Nasser, Al Aqsa–Deir Al Balah Al Hoda, Al Amal 1, Mahata 2–Khan Yunis Eastern Reservoir–Khuza'a, P124–Rafah El Batool–Shoka
Total 50 Approved for
funds
4 Oxfam
2 facilities: water 1 pump station and
1 desalination plant
1- Mean reservoirs 2- Al Shoka UTL DP
150 25
Approved for funds
5 UNICEF 4 facilities: 1 water pump station and
3 water wells
1. Al shekh Redwan well 7 2. Al shekh Redwan well 7A 3. Al shekh Redwan well 1 4. Shijaiia well
150 150 150 80
Approved for funds
6 KfW (German Development
Bank)
1 facility (wastewater
treatment plant) Burij WWTP 3,500
Approved for funds
7 KfW 1 facility
(wastewater treatment plant)
Al Shieak Eijleen WWTP 1,200 Ongoing
8 ICRC
1 facility (water well)
CANADA well 175 Ongoing
10 JICA 1 facility
(wastewater treatment plant)
Rafah–WWTP 200 Operational
11 UNICEF
2 facilities (wastewater
treatment plant and water well)
Khanyounis wastewater treatment plant – Lagoons plant
230
50 Ongoing

36 | P a g e
4.2 Technologies selection of PV solar system for WASH facilities
PV power systems are generally classified according to their functional and operational requirements,
their component configurations, and how the equipment is connected to other power sources and
electrical loads. There are various types of PV solar systems; they comprise off-grid systems, grid-
connected systems, hybrid systems, PV diesel hybrid systems and PV water pumping. This section
presents more details about these five PV systems.
Off-grid PV system
This system allows the storing of PV solar power in batteries for use when the power grid goes down
or if the user is not on the grid. Table 4.5 shows the typical system components of the off-grid PV
system. This system ensures availability of electricity 24 hours a day due to the storage capacity of the
batteries.
Table 4.5 – System components of off-grid system
No. Components
1 PV panels with mounting
2 Charge controller
3 Battery inverter
4 Battery
5 Accessories such as DC & AC cable and DBs
On-grid system
An on-grid system is a system that only generates power when the utility power grid is available,
otherwise the system will not operate. Therefore, the system should have a source of electricity to
function. Once the system operates, it can feed surplus power back into the grid. Technically, this
system is suitable when the operational hours are less than five hours daily (the optimum solar hours
during the daytime). Table 4.6 shows the system components of the on-grid system.
Table 4.6: System components of on-grid system
No. Components
1 PV panels with mounting
2 On-grid inverter
3 Accessories such as DC & AC cable and DBs
On-grid with backup system (hybrid)
Hybrid PV systems can be considered as an on-grid system upgraded to include a battery backup: a
bank of deep-cycle batteries, which can be charged by both the utility grid and the solar panels. Thus,
in the event of an outage, the backup battery can be switched on to provide backup power to the

37 | P a g e
loads. Table 4.7 presents the components of the on-grid with backup system.
Table 4.7. Components of the on-grid with backup system
No. Components
1 PV panels with mounting
2 On-grid inverter
3 Battery inverter
4 Battery
5 Accessories such as DC & AC cable and DBs
PV diesel hybrid system
A typical PV diesel hybrid system consists of a PV system, public grid, diesel generator and a fuel
save controller (FSC) to ensure that the necessary amount of power is fed into the system (whether
from PV panels during the daytime or from the generator). The FSC is a key component of the PV
diesel hybrid system solution. It allows the use of cost-efficient solar energy to generate power in order
to lower fuel consumption from diesel generators. The FSC performs a comprehensive grid
management function which ensures maximum operational safety and minimal operational
expenditures and CO2 emissions. Table 4.8 shows the typical components of a PV diesel hybrid
system.
Table 4.8 – Components of PV diesel hybrid system
No. Components
1 PV panels with mounting
2 On-grid inverter
3 Accessories such as DC & AC cable and DBs
4 Fuel save controller
5 Synchronizing unit
PV water pump system
The PV system directly powers the water pump through a PV water pump inverter and operates only
when the sun is shining. This system is much less expensive and easier to install than the other
systems that depend on batteries or being on the grid.
The most common application of a PV water pump system is for pumping water for irrigation, livestock
and domestic use. For public water networks, it is strongly recommended that the system includes
water-storing tanks to benefit from the solar energy produced during periods of sunshine. This means
that the PV water pump system is not recommended for domestic water networks. Table 4.9 presents
the components of a PV water pump system.

38 | P a g e
Table 4.9 – Components of PV water pump system
No. Components
1 PV panels with mounting
2 Pump controller
3 Pump
4 Accessories such as DC & AC cable and DBs
Comparison of the five PV systems
A comparison of the five PV systems is shown in Table 4.10.
Table 4.10 – The advantages and disadvantages of each PV system
System type Advantages Disadvantages
Off-grid
It does not depend on public networks.
It works in remote areas where it is difficult to obtain alternative energy sources such as diesel generators.
Surplus power from the PV system will not be utilized.
Life span of the battery bank is limited due the cycles of charging and discharging, and thus requires replacement, which increases the cost.
On-grid It does not depend on
batteries. Less cost than other PV
systems. Surplus power from the PV
system will be utilized.
It depends on the availability of the public grid.
On-grid with backup (hybrid)
It operates with and without the public grid.
It works in remote areas. Surplus power from the PV
system will be utilized.
Life span of the batteries is limited due the cycles of charging and discharging, and they require replacement, which increases the cost.
PV diesel hybrid system
It operates with and without public grid.
Surplus power from the PV system will be utilized in the presence of the public grid.
It does not depend on batteries. However, batteries can be provided to reduce fuel consumption during the night.
The generator should be suitable for synchronization.
The system requires a main fuel save controller (FSC), which increases the cost.
PV water It operates without the public It needs water-storing tanks

39 | P a g e
System type Advantages Disadvantages
pumping grid. It works in remote areas. Less cost compared to other
PV systems.
and is therefore unsuitable for domestic water networks.
Works only during the presence of sunshine.
4.3 Proposed PV systems for WASH facilities
Based on the concepts of the on-grid, PV water pumping and PV diesel hybrid systems, the consultant
identified the optimum system for each WASH facility, based on the following considerations:
1. The aim of installing a PV system for WASH facilities is to improve the service rather than to save
power.
2. Grid availability in the Gaza Strip ranges from 25–75% of the day (6–18 hours per day).
3. Solar availability in the Gaza Strip is 5..1 hours daily, on average.
4. Most of the WASH facilities in the Gaza Strip have diesel generators.
Off-grid and on-grid with backup PV systems
These PV systems do not require grid electricity to operate; they are stand-alone systems. They
require enough land availability for installing the required PV panels based on the loads. The backup
batteries have high costs and a limited life span, which means they require periodic replacement. The
replacement period of batteries is short (replacement every five years). Therefore, the consultant’s
assessment of use of batteries for large-capacity PV systems is not encouraging. The consultant does
not recommend either off-grid or on-grid with backup PV systems for any of the WASH facilities.
On-grid PV systems
On-grid PV systems require continuous electricity supply from the grid as long as the system is
operating. As the grid availability ranges from 25% to 75% per day, the performance of the on-grid PV
system is only 1.5–4.5 hours per day. Therefore, installing the on-grid PV system will not increase the
operating hours of the facility beyond the outage of the grid. This PV system is more suitable when
power saving is the aim of the PV technology. Consequently, this kind of system is not recommended
for facilities which operate for more than 6 hours; the benefits would be very limited.
PV water pumps
The operation of the PV water pump system does not depend on any source of power, such as grid
electricity or generator. As sunshine is not steady during sunny periods, the amount of abstracted
water from the well will be variable; the pressure of the abstracted water may not be sufficient to
enable it to reach its final destinations. To overcome this problem, a storage tank is recommended. In
addition, and in order to utilize the full capacity of the system, there should be enough land available
for installing the necessary PV panels to generate the power necessary for the pump to operate at full
capacity during the 5 hours of solar availability daily. The system is recommended for water wells
where enough land is available and storage tanks are provided.

40 | P a g e
PV diesel hybrid system
This PV diesel hybrid system utilizes power from different sources, such as a generator and solar
panels, in addition to power from the public grid. Therefore, the system ensures a continuous supply of
electricity. It should be mentioned that the connected generator has to be an electronic one in order to
be able to synchronize with the PV system. As most WASH facilities require more than 6 operating
hours daily, the installation of this type of system is recommended.
Based on the above discussion, the consultant identified the suitable PV system for each WASH
facility, as indicated Annex 4.1. Examples of the proposed PV systems for 10 WASH facilities (as
mentioned in Annex 9.1) are presented in Table 4.11.
Table 4.11 – Examples of proposed PV system for WASH facilities
Facility code
Facility name
Facility type
Total electricity
consumption (kWh)
Total daily operation
(hr)
% of the available area for
PV system
Proposed system
MG.1.PS.01 Al
Moghraqa PS
Sewage pump station
88 8 55% PV diesel
hybrid
ON.2.SP.01
Um Al-Nasssrr pump station
Sewage pump station
27 6 100% On-grid
KH.1.WP.02 Ma'an pump station
Water pump station
60 12 100% PV diesel
hybrid
RF.1.WP.07 Rafah
UNDP PS (El Balad)
Water pump station
100 4 100% PV water
pump
3M-003 El Hoor Private
desalination plant
42 6 33% On-grid
DS141/2018 Al Sahed Private
desalination plant
60 22 58% PV diesel
hybrid
NU.1.DP.01 Forqan well desalination
plant
Public desalination
plant 39 6 35% On-grid
BS.1.DP.01
Bani Suhila Area
desalination plant
Public desalination
plant 110 15 95%
PV diesel hybrid
DB.1.PW.20 Al Basheer
well Water well 44.5 18 78% On-grid

41 | P a g e
Facility code
Facility name
Facility type
Total electricity
consumption (kWh)
Total daily operation
(hr)
% of the available area for
PV system
Proposed system
RF.1.PW.09 Abu Zohri Water well 48.5 13 88% PV diesel
hybrid
4.4 Local market capacity and equipment available
There are more than 40 local PV systems suppliers in the Gaza Strip selling various capacities of PV
systems. The main suppliers are located in Gaza City and Khanyounis City. All PV equipment is
imported from many countries in Europe and Asia. This section presents the capacity of the local
market and the available equipment types and manufacturers.
Local market capacity
The entire population of the Gaza Strip can access solar PV system traders from the north or the
south. There are more than nine large companies specializing in solar PV systems (both selling and
installing); these companies participate in ‘Request for Quotations’ for funded projects. Other retailers
are only selling PV components rather than importing them from abroad. Interviews conducted with PV
system traders mentioned that the stores of the local suppliers often run out of the various
components of PV systems (such as panels, inverter or batteries); items that arrive at the market are
sold immediately, sometimes items are sold even before reaching the market.
PV system cost
The prices of various PV components in the Gaza Strip market have decreased by about 20%
compared to their prices three years ago. The main reasons for this are as follows:
Globally, prices of solar PV panels decreased by 50% between the end of 2009 and the end of
2015.
Competition between solar PV system companies in the Gaza Strip is high, as more new
companies have entered this field. In 2014, there were fewer than five companies; today,
there are more than 40.
Market capacity
The market capacity depends on the quantity of available material. The main constraints in upgrading
market capacity are: skilled workers who can professionally install solar power systems; and the
restrictions on cross borders. In terms of skilled workers, each company has an average of two to
three teams of four workers. The number of skilled workers could easily be increased, given the high
educational level of unemployed technicians and engineers in the Gaza Strip. Regarding the
restrictions on cross borders, about 40,000 PV panels entered the Gaza Strip in 2018. In light of the
current high demand, and if no limitations are placed on quantities allowed into Gaza, the number of
PV panels and other components is likely to increase significantly in the future.
Market-related barriers to upscaling in the Gaza Strip: Despite the increasing adoption of solar
energy by households, coupled with the interest of a large number of international donors, the sector

42 | P a g e
is prone to some challenges. These include policy, personnel, financial, technological, and consumer-
related challenges.
Crossing borders/barriers: The uncertainty traders face regarding crossing borders and the ‘dual-
use items list’ imposed by the Israeli authorities prevents them from importing large quantities, in order
to avoid unseen risks. These risks include their imported goods getting stuck at the port, which would
lead to huge financial losses. Traders do not have problems in storing large quantities in their
warehouses in the Gaza Strip, but they will not place orders for large quantities (more than 0.3 MW of
solar PV panels) as the Israeli authority may suddenly add solar PV panels to the list of dual-use items
(as happened in 2015). As a result, the supplied quantity will always be lower than the demand, and
there will be always a time gap between purchasing and delivery.
Unskilled technicians: There are solar technicians who do not have the necessary professional
skills, yet still have connections with solar distributors and retailers who subcontract them. This
happens because there are no governmental regulations, which would allow only licensed technicians
to provide design and installation services for solar PV systems. Normally, to become licensed,
technicians have to undertake a solar training course and understand solar PV regulations, which
currently do not exist in the Gaza Strip.
4.5 Strategy, legal and regulatory environment
The most up-to-date law for renewable energy in OPT is the Decree Law related to renewable energy
and energy efficiency, issued in 2015. Article 2 of the Decree Law states that the objective of the law
is to encourage utilization of renewable energy sources and their applications, increase their
contribution to total energy balance and achieve secure energy provision in line with renewable energy
strategy. The law also aims to ensure environmental protection and fulfilment of sustainable
development requirements.
The Decree Law has specified the roles and responsibilities of the various institutions and bodies
involved in the regulation, monitoring, production, distribution and transfer of energy. It also describes
the role and responsibility of the Energy Research Center in conducting research to define the best
alternatives and locations for renewable energy production and raising awareness and capacity
building in this sector.
The second relevant law is the Electricity Decree Law No.13, issued in 2009. The Electricity Decree
has the main objective of restructuring and improving the electricity sector, as well as fostering
national and foreign investment in order to obtain an adequate power supply and properly priced
services. The Electricity Decree stipulates the establishment of an Electricity Regulatory Council. It
also identifies the Council’s duties and responsibilities.
The Electricity Decree is the first step in sector regulation and in achieving a new structure. In addition,
it stipulated the establishment of a fully government-owned National Transmission Company, which is
obligated to allow generators and suppliers to use the national grid. It is also authorized to purchase
and sell power from any source and to resell the purchased power to distribution companies.
Additionally, the Electricity Decree defined the penalties for actions such as stealing, destroying or
vandalizing any component of the electricity network’s infrastructure. Later in 2012, the Decree was

43 | P a g e
amended to modify some of the penalties related to offences in the electricity sector.
With regard to renewable energy sources, the Electricity Decree Law explicitly mentions that the
Environmental Quality Authority (EQA) must encourage research into alternative energy sources, as
well as regulating its exploitation using by-laws. Finally, the environmental law is addressing the issue
to some extent, indirectly, and provides some ground for encouraging clean energy production and
reduction of emissions.

44 | P a g e
5 Baseline situation
5.1 Background
A baseline study was conducted to review the current situation of solar energy usage in WASH
facilities of the Gaza Strip (mainly municipal water wells, municipal water pump stations, public
desalination plants, private desalination plants, wastewater pump stations and wastewater treatment
plants). The geographical scope of the baseline study is the Gaza Strip’s five governorates; namely
North Gaza, Gaza, Middle Area, Khan Younis and Rafah, as shown in Figure 5.1.
Figure 5.1 – Administrative map of Gaza Strip governorates
To achieve the objectives of the baseline study, three methods were used to gather the required data:
field visits, meetings and checklists. The data was then verified and validated by conducting meetings
with the following parties:
Palestinian Water Authority (PWA)
Costal Municipalities Water Utility (CMWU)
Environmental Quality Authority (EQA)
Municipalities/local units
International associations
Local and international associations and WASH Cluster members.

45 | P a g e
The main points and information covered in the meetings were:
The type, status and capacity (in m3) of each of the WASH facilities in each municipality
(operational or non-operational)
Construction area in m2
Total power consumption (kWh)
Generator availability
Daily operation of generator (hrs/day)
Number of available pumps and total daily operation.
The required data was collected, analysed and mapped using Geographic Information Systems (GIS
10.1). All sites were described by spatial and attribute data using GIS Environment.
5.2 Data collection
The target area was identified and extracted from satellite imagery (Google Earth). The extracted
image was then imported to GIS software, specifically ArcGIS 10.1, and then geo-referenced and
digitized to produce a digital map. The coordinates of each facility were imported into the ArcGIS 10.1
as a text file, then converted to a shape file to show the spatial distribution on the digital maps as well
as the satellite images. The following symbols were used to show the types of WASH facilities:
In order to keep track of the location of each facility, a coding system was applied for sites, as XY00.
The first two letters (XY00) are for the local authority/municipality code, and the two numbers (00) are
the serial number of facilities. Data collected from different sources for each facility are presented in
Annex 3.1.
5.3 Outcomes of the data collection and processing
Detailed findings of the study of WASH facilities are given below for each facility type.
Municipal wells
Data for municipal wells reveals that there are 266 active wells in the Gaza Strip. These are distributed
over the five governorates, as follows:
North Gaza: 55 wells (Fig 5.2a)
Gaza: 74 wells (Fig 5.2b)
Middle Gaza: 60 wells (Fig 5.2c)

46 | P a g e
Khan Younis: 48 wells (Fig 5.2d)
Rafah: 29 wells (Fig 5.2e).
Discharge capacity and water quality: Data shows that the discharge capacity of all wells ranges
from 29 to 225m3/hr,
with an average discharge of 79m
3/hr. The consultant also estimated water
quality (chloride and nitrate) based on the updated PWA maps.
Construction area: Data shows that the construction area of all wells ranges from 15 to 15,000m2,
with an average area of 477m2. The area distribution per well in all governorates is as follows:
North Gaza: 60 to 1,670m2; average area 320m
2/55 wells
Gaza: 30 to 15,000m2; average area 705m
2/74 wells
Middle Gaza: 15 to 1,500m2; average area 236m
2/60 wells
Khan Younis: 20 to 3,800m2; average area 500m
2/48 wells
Rafah: 140 to 3,209m2; average area 645m
2/29 wells.
Availability of generators: Among the 266 active wells, there are 226 wells with generators. Of these
226, 43 wells have zero daily operation of their generators (8 in North Gaza, 29 in Gaza, 5 in Middle
Area and 1 in Rafah), which means that the generators are not working. The consultant
obtained/estimated the generator capacity and its daily operational hours.
Power source: Based on the availability of power source(s), daily operation is classified into three
types.
Type 1 – wells that operate using municipal electricity only:
o A total of 40 wells have no generators and depend on electricity, with an average daily
operation of 7.6 hours (min. 2 hours, max. 12 hours). The average power electricity
consumption is 41 kWh (min. 11 kWh, max.146 kWh).
o A total of 43 wells have generators but with zero operation, which means that they
depend mainly on the grid, with an average daily operation of 8.1 hours (min. 2 hours,
max. 22 hours).
Type 2 – wells that operate using generators only:
o Only 2 wells operate using generators, with an average daily operation of 7.5 hours.
The average power consumption is 48.5 kWh.
Type 3 – wells that use both grid electricity and generators:
o A total of 181 wells operate using electricity and generators, with an average daily
operation of electricity of: 8.9 hours (min. 3 hours, max. 22 hours). The average power
electricity consumption is 44.5 kWh (min. 9 kWh, max. 125 kWh).
o The average daily operation of generators is: 4.6 hours (min. 1 hour, max. 12 hours).

47 | P a g e
(a) Governorate of North Gaza
(b) Governorate of Gaza

48 | P a g e
(c) Governorate of Middle Area
(d) Governorate of Khan Younis

49 | P a g e
(e) Governorate of Rafah
Figure 5.2 – Distribution of wells in the Gaza Strip
Public desalination plants
There are 52 public desalination plants (operated by CMWU and municipalities) and 21 privately
owned desalination plants with different capacities, which are willing to operate in emergencies,
according to GVC. Therefore, these 21 private desalination plants are considered for subsequent
analysis under this study. Figure 5.3 shows the distribution of public desalination plants in the Gaza
Strip. Public desalination plants for the five governorates are as follows:
North Gaza: 3 public desalination plants (Fig 5.3a).
Gaza: only 1 public desalination plant (Fig 5.3b)
Middle Gaza: 16 public desalination plants (Fig 5.3c)
Khan Younis: 23 public desalination plants (Fig 5.3d)
Rafah: 9 public desalination plants (Fig 5.3e).
Discharge capacity: Data shows that the discharge capacity of all public desalination plants ranges
from 24 to 1,200 m3/day, with an average discharge of 167m
3/day.
Construction area: Data shows that the construction area of all public desalination plants ranges
from 16 to 2,400m2, with an average area of 392m
2. The area distribution of public desalination plants
in each governorate is as follows:
North Gaza: 80 to 300m2; average area 167m
2/3 public desalination plants

50 | P a g e
Gaza: 308m2/1 public desalination plant
Middle Gaza: 16 to 900m2; average area 304 m
2/16 public desalination plants
Khan Younis: 20 to 2,400 m2; average area 450m
2/23 public desalination plants
Rafah: 20 to 1,511m2 ; average area 487m
2/9 public desalination plants.
Availability of generators: Among the 52 public desalination plants, 33 plants have generators. Out
of these 33 plants, 8 have zero daily operation of generators (2 in the Middle Area, 4 in Khan Younis
and 2 in Rafah), which means generators are not working.
Power source: Based on the power source, daily operation is classified into three types.
Type 1 – public desalination plants that operate using municipal electricity only:
o Total public desalination plants that have no generators and depend on electricity: 19,
with an average daily operation of 6.9 hours (min. 0 hours, max. 12 hours). The
average power electricity consumption is 13 kWh (min. 3.75 kWh, max. 50 kWh).
o Total public desalination plants that have generators but with zero operation: 7, which
means they depend mainly on electricity, with an average daily operation of 5.2 hours
(min. 0 hours, max. 15 hours).
Type 2 – public desalination plants that operate using generators only:
o Total public desalination plants operating using only generators: 1. The power
consumption is 92 kWh. Its average daily operation is 0 hours, which means this plant
is not operational.
Type 3 – public desalination plants that operate using both electricity and generators:
o Total public desalination plants operating using electricity and generators: 25
o Average daily operation of electricity: 5.08 hours (min. 2 hours, max. 10 hours). The
average power electricity consumption is 24.6 kWh (min. 2 kWh, max. 132 kWh).
o Average daily operation of generators: 3.6 hours (min. 1 hour, max. 12 hours).
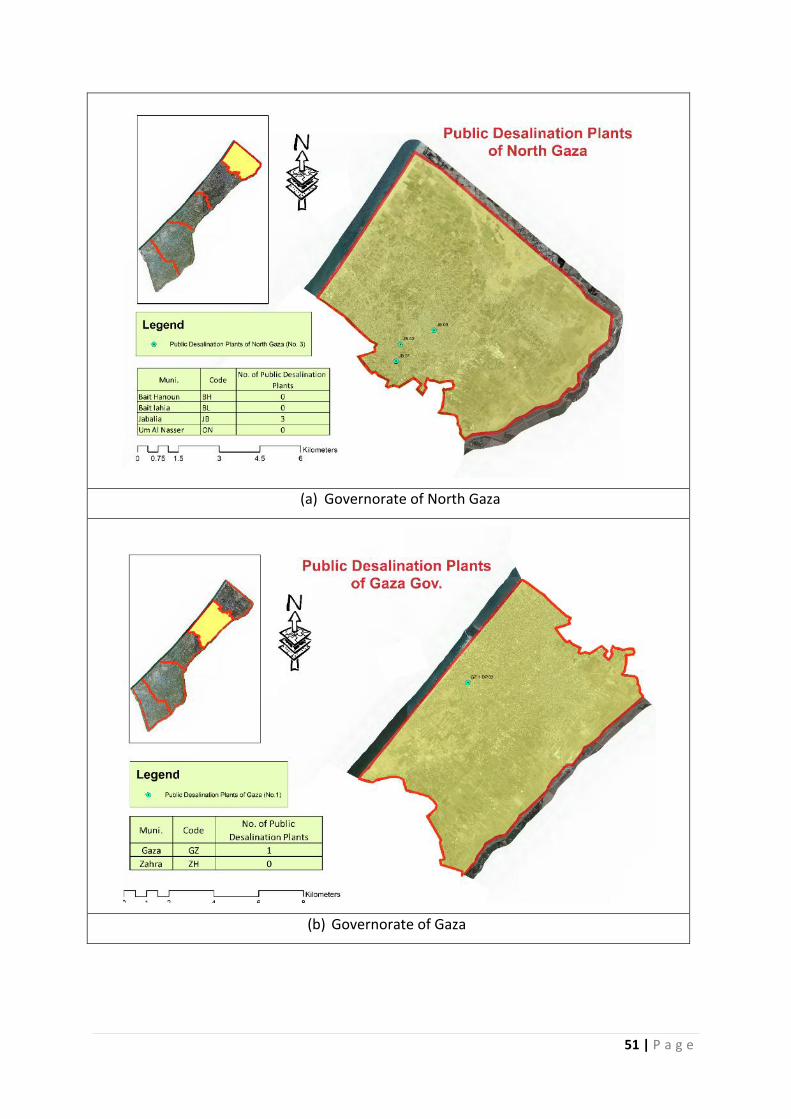
51 | P a g e
(a) Governorate of North Gaza
(b) Governorate of Gaza

52 | P a g e
(c) Governorate of Middle Area
(d) Governorate of Khan Younis

53 | P a g e
(e) Governorate of Rafah
Figure 5.3 – Distribution of public desalination plants in the Gaza Strip
Private desalination plants
There are 21 private desalination plants, which are distributed across the five governorates as follows:
North Gaza: 4 private desalination plants (Fig 5.4a)
Gaza: 5 private desalination plants (Fig 5.4b)
Middle Gaza: 5 private desalination plants (Fig 5.4c)
Khan Younis: 4 private desalination plants (Fig 5.4d)
Rafah: 3 private desalination plants (Fig 5.4e).
Discharge capacity: The discharge capacity of all private desalination plants ranges from 35 to 1,300
m3/day,
with an average discharge of 204 m
3/day.
Construction area: The construction area of all wells ranges from 16 to 700m2, with an average area
of 269m2. The area distribution of private desalination plants in each governorate is as follows:
North Gaza: 4 private desalination plants, with area ranging from 150 to 550m2; average area
350m2
Gaza: 5 private desalination plants, with area ranging from 110 to 500m2; average area 222m
2
Middle Gaza: 5 private desalination plants, with area ranging from 16 to 700 m2
; average area
221m2
Khan Younis: 4 private desalination plants, with area ranging from 30 to 700m2; average area

54 | P a g e
283m2
Rafah: 3 private desalination plants, with area ranging from 200 to 500m2; average area
300m2.
Availability of generators: Among the 21 private desalination plants, only 18 plants have generators.
Power source: The source of power for daily operation is classified into two types:
Type 1 – private desalination plants that operate using municipal electricity only:
o Total private desalination plants that have no generators and depend on electricity: 3,
with an average daily operation of 8.3 hours (min. 5 hours, max. 10 hours).
Type 2 – private desalination plants that operate using both electricity and generators:
o A total of 18 private desalination plants operate using electricity and generators.
o Average daily operation of electricity: 6.5 hours (min. 4 hours, max. 16 hours).
o Average daily operation of generators: 2.9 hours (min. 1 hour, max. 6 hours).
(a) Governorate of North Gaza

55 | P a g e
(b) Governorate of Gaza
(c) Governorate of Middle Area

56 | P a g e
(d) Governorate of Khan Younis
(e) Governorate of Rafah
Figure 5.4 – Distribution of private desalination plants in the Gaza Strip

57 | P a g e
Water pump stations
A reviewing of the available data reveals that there are 42 water pump stations in the Gaza Strip,
which are distributed across the five governorates as follows:
North Gaza: 5 water pump stations (Fig 5.5a)
Gaza: 5 water pump stations (Fig 5.5b)
Middle Gaza: 9 water pump stations (Fig 5.5c)
Khan Younis: 11 water pump stations (Fig 5.5d)
Rafah: 12 water pump stations (Fig 5.5e).
Discharge capacity: Data shows that the discharge capacity of all water pump stations ranges from
100 to 750m3/hr,
with an average discharge capacity of 340m
3/hr.
Construction area: Data shows that the construction area of all water pump stations ranges from 80
to 3,800m2, with an average area of 1,345m
2. The area distribution of water pump stations per
governorate is as follows:
North Gaza: 487 to 2,000m2, with an average area of 1,417m
2
Gaza: 140 to 3,410m2, with an average area of 1,736m
2
Middle Gaza: 80 to 2,000m2, with an average area of 1,398m
2
Khan Younis: 200 to 3,800m2, with an average area of 1,346m
2
Rafah: 200 to 1,989m2, with an average area of 1,114m
2.
Availability of generators: Out of the 42 water pump stations, 34 have generators.
Power source: Based on the power source, daily operation is classified into two types:
Type 1 – only use municipal electricity for operation:
o A total of 8 water pump stations have no generators and depend on electricity, with an
average daily operation of 9.75 hours (min. 8 hours, max. 12 hours). The average
power electricity consumption is 80.25 kWh (min. 20 kWh, max. 225 kWh).
Type 2 – use both electricity and generators to operate:
o Water pump stations that use electricity and generators to operate: 34. Average daily
operation of electricity is 7 hours (min. 2.5 hours, max. 12 hours) while the average
daily operation of generators is 3.3 hours (min. 0.5 hours, max. 10 hours). The
average power electricity consumption is 114.5 kWh (min. 11 kWh, max. 540 kWh).

58 | P a g e
(a) Governorate of North Gaza
(b) Governorate of Gaza

59 | P a g e
(c) Governorate of Middle Area
(d) Governorate of Khan Younis

60 | P a g e
(e) Governorate of Rafah
Figure 5.5 – Distribution of water pump stations in the Gaza Strip
Sewage pump stations
A review of the available data revealed that there are 49 sewage pump stations distributed across the
five governorates as follows:
North Gaza: 16 sewage pump stations (Fig 5.6a).
Gaza: 11 sewage pump stations (Fig 5.6b)
Middle Gaza: 11 sewage pump stations (Fig 5.6c)
Khan Younis: 6 sewage pump stations (Fig 5.6d)
Rafah: 5 sewage pump stations (Fig 5.6e).
Discharge capacity: Data shows that the discharge capacity of all sewage pump stations ranges
from 5 to 8,000 m3/hr,
with an average discharge of 667m
3/hr.
Construction area: Data shows that the construction area per pump station ranges from 30 to 5,000
m2, with an average area of 822m
2. The area distribution of sewage pump stations per governorate is
as follows:
North Gaza: 16 sewage pump stations, with a construction area ranging from 250 to 5,000m2;
average area 954m2
Gaza: 11 sewage pump stations, with construction area ranging from 100 to 3,000m2; average
area 1,082m2

61 | P a g e
Middle Gaza: 11 sewage pump stations, with construction area ranging from 30 to 2,000m2;
average area 541m2
Khan Younis: 6 sewage pump stations, with construction area ranging from 100 to 1,600m2;
average area 645m2
Rafah: 5 sewage pump stations, with construction area ranging from 197 to 1,083m2; average
area 662m2.
Availability of generators: Of the 49 sewage pump stations, 48 have generators.
Power source: Based on the power source, daily operation is classified into three types of sewage
pump stations.
Type 1 – uses municipal electricity only:
o Only 1 sewage pump station has no generator and depends on electricity, with 8
hours of daily operation and with power consumption of 50 kWh.
Type 2 – uses generators only:
o A total of 2 stations operate using only generators, with daily power consumption of
0.75 hours and with an average power consumption of 11.5 kWh.
Type 3 – uses both electricity and generators:
o A total of 46 stations operate using electricity and generators. The average daily
operation of electricity is 6.2 hours (min. 1 hour, max. 18 hours), while the average
daily operation of generators is 6.6 hours (min. 1 hour, max. 18 hours). The average
power consumption is 128.55 kWh (min. 5 kWh, max. 1,320 kWh).
(a) Governorate of North Gaza

62 | P a g e
(b) Governorate of Gaza
(c) Governorate of Middle Area

63 | P a g e
(d) Governorate of Khan Younis
(e) Governorate of Rafah
Figure 5.6 – Distribution of sewage pump stations in the Gaza Strip

64 | P a g e
Sewage treatment plants
There are 8 treatment plants in the Gaza Strip, which are either operational, under construction or
planned for closure. These are distributed across the five governorates of the Gaza Strip as follows:
Northern Gaza: 1 planned for closure, and 1 under new operation (Fig 5.7a)
Gaza: 1 existing plant (Fig 5.7b)
Middle Gaza: 1 existing and 1 under construction (Fig 5.7c)
Khan Younis: 1 existing and 1 under construction (Fig 5.7d)
Rafah: 1 existing plant (Fig 5.7e).
Figure 5.7 – Distribution of sewage treatment plants in the Gaza Strip
The existing and under-construction sewage treatment plants have their own plans for PV system
installation. Regarding the under-construction plants, PV systems are part of a KFW project at the
Gaza Central treatment plant while there are plans with PWA and CMWU for the Rafah treatment
plant. Therefore, the consultant will not include the sewage treatment plants as part of the study for PV
feasibility.

65 | P a g e
6 Feasibility study
This chapter discuss the financial, social and environmental, and technical feasibility of installing PV
systems for WASH facilities in Gaza. Within financial feasibility, Net Present Value (NPV) and payback
periods were calculated with the cost of electricity production from PV. The technical feasibility is
based on many criteria such as land availability, power consumption, availability of generators, facility
size and water quality. Social and environmental benefits are also determined, based on improving the
service by increasing hours of operation and reducing CO2 emissions.
6.1 Financial feasibility
For a solar PV system, two costs are incurred annually:
1. Initial investment costs of installing the system, which is assumed to occur at beginning of the
project (year 0).
2. Maintenance cost for the maintenance of the system (inventor, panels, water pumps), based on
the maintenance cost of electrical equipment and the experience in Gaza. It is assumed to be 5%
of the initial investment cost of the system; this cost occurs each year.
As stated in the methodology chapter, the consultant estimated the capital costs of a PV system
based on current ongoing projects and current market prices. Table 6.1 presents a summary of the
planned, ongoing and installed PV systems in Gaza for WASH facilities.
Table 6.1 – Summary of installed, ongoing and planned PV systems for WASH facilities
Institution No of
projects Facility type PV type
PV capacity
kWp
Cost $/kWp Project status Range Average
GVC 10 Private
desalination plants
Hybrid diesel
system 36–47
839–
1,003 880 Ongoing
UNICEF
1 WWTP On-grid 250 1,600 Ongoing
1 Seawater
desalination plant
On-grid 680 1,765 Completed
4 Water wells On-grid 80–150 1,250–
1,333 1,290
Under tender
1 Water wells On-grid 40 1,250 Ongoing
PHG 5 Sewage pump
stations On-grid 23-40
2,126–
1,551 1,579 Ongoing
AAH 10 Private
desalination Off-Grid 10
Ongoing

66 | P a g e
Institution No of
projects Facility type PV type
PV capacity
kWp
Cost $/kWp Project status Range Average
plants
10 Private
desalination plants
Off-Grid 10
Planned
Source: Compiled by author using data collected
Table 6.1 shows that the capital cost differs from project to project depending on the PV type and
capacity, and taking into consideration year of installation, as prices vary significantly in Gaza. The
ongoing projects show that the capital cost ranges from $880/kWp to $1,765/kWp, with an average of
$1,322/kWp. Tables 6.2–6.6 represent the consultant’s estimations for all PV types, with the estimated
cost ranging from $700–$1,500/kWp. The consultant therefore used an average estimated cost of
$1,200/kWp as the most feasible figure for financial analyses.
Table 6.2 – Cost analysis of off-grid system
Off-grid system
No. Components $
1 PV panels with mounting 500
2 Charge controller 50
3 Battery inverter 600
4 Battery 250
5 Accessories such as DC & AC cable and DBs
100
$/kWp: 1,500
Table 6.3 – Cost analysis of on-grid system
On-grid system
No. Components $
1 PV panels with mounting 500
2 On-grid inverter 100
3 Accessories such as DC & AC cable and DBs 100
$/kWp: 700

67 | P a g e
Table 6.4 – Cost analysis of on-grid with backup system
On-grid with backup system (hybrid)
No. Components $
1 PV panels with mounting 500
2 On-grid inverter 100
3 Battery inverter 600
4 Battery 250
5 Accessories such as DC & AC Cable and DBs 100
$/kWp: 1,550
Table 6.5 – Cost analysis of PV diesel hybrid system
PV diesel hybrid system
No. Components $
1 PV panels with mounting 500
2 On-grid inverter 100
3 Accessories such as DC & AC cable and DBs 100
4 Fuel save controller 100
5 Synchronizing 100
$/kWp: 900
Table 6.6 – Cost analysis of PV direct water pump
PV direct water pumping
No. Components $
1 PV panels with mounting 500
2 Pump controller 100
3 Pump 100
4 Accessories such as DC & AC cable and DBs 100
$/kWp: 800
To estimate the cost saving due to PV installation, the consultant considered savings from the grid and
from diesel generators, taking into account that the availability of the public electricity grid in Gaza
ranges from 25–75% of daytime.
Most WASH facilities depend on generators as a backup to the public electricity grid. The consultant
estimated the cost of kWh generated from diesel generators, as shown in Table 6.7.

68 | P a g e
Table 6.7 – Cost of electricity generated from diesel generators
Generator capacity KVA 40 110
Capital cost $ 16,000 25,000
Maintenance cost
Percent of capital
cost per year 10% 10%
Fuel consumption Litre/hours 10 22
Fuel cost $/Litre 1.4 1.4
Life hours Hours 35,000 35,000
Daily operation Hours 7 7
Electricity
production kWh 30 82.5
Calculation
Years of operation Years 13.7 13.7
Yearly production kWh 76,650 210,787.5
Yearly maintenance
cost $ 1,600 2,500
Yearly fuel cost $ 35,770 78,694
Cost of kWh
Capital cost $/kWh 0.015 0.009
Maintenance cost $/kWh 0.021 0.012
Fuel cost $/kWh 0.467 0.373
Total cost
$/kWh 0.503 0.394
NIS/kWh 1.810 1.418
It is clear that the cost of generating electricity from diesel generators ranges from 1.4 to 1.8 NIS/kWh.
The consultant estimated a cost of 1.6 NIS/kWh as the average cost.
The NPV and the payback period (PbP) were calculated for each facility type based on an assumed
value of the minimum attractive rate of return (MARR) of 4.5%.
The consultant assumed that availability of the public electricity grid ranges from 25–75% of daytime.
All WASH facilities except sewage pump stations can benefit 70% of the PV time, while sewage pump
stations can benefit 30% of the PV time.

69 | P a g e
The following assumptions are used:
Yearly maintenance percent 5 Percent of capital cost
Daily production kWh 5.3 kWh/day
Cost of power production – generator
1.6 NIS/kW
MARR 4.5 %
Project lifetime 20 Years
Cost of power production – grid 0.6 NIS/kW
NIS/$ 3.6
Based on these assumptions, the consultant calculated the NPV and payback period. Detailed
financial analysis and calculations are included in Annex 6.1.
Tables 6.8–6.11 present the NPV and payback period for each facility type for different public
electricity grid availability. Table 6.12 presents the summary of the NPV and payback period.
Table 6.8 – NPV and payback period for WASH facilities except sewage pump stations (grid availability 25%)
Years Yearly cost $ Yearly
revenues $ Yearly cost/profit
$ Accumulation
saving $
0 1,200 0 -1,200 -1,200
1 0 512 512 -688
2 0 512 512 -177
3 60 512 452 275
NPV ($) 4,582
Table 6.9 – NPV and payback period for WASH facilities except sewage pump stations (grid availability 75%)
Years Yearly cost $ Yearly
revenues $ Yearly cost/profit
$ Accumulation
saving $
0 1,200 0 -1,200 -1,200
1 0 321 321 -879
2 0 321 321 -558
3 60 321 261 -297
4 60 321 261 -36
5 60 321 261 225
NPV ($) 2,209

70 | P a g e
Table 6.10 – NPV and payback period for sewage pump stations (grid availability 25%)
Years Yearly cost $ Yearly
revenues $ Yearly cost/profit
$ Accumulation
saving $
0 1,200 0 -1,200 -1,200
1 0 219 219 -981
2 0 219 219 -761
3 60 219 159 -602
4 60 219 159 -443
5 60 219 159 -283
6 60 219 159 -124
7 60 219 159 35
NPV ($) 942
Table 6.11 – NPV and payback period for sewage pump stations (grid availability 75%)
Years Yearly cost $ Yearly
revenues $ Yearly cost/profit
$ Accumulation
saving $
0 1,200 0 -1,200 -1,200
1 0 138 138 -1,062
2 0 138 138 -925
3 60 138 78 -847
4 60 138 78 -770
5 60 138 78 -692
6 60 138 78 -614
7 60 138 78 -537
8 60 138 78 -459
9 60 138 78 -382
10 60 138 78 -304
11 60 138 78 -227
12 60 138 78 -149
13 60 138 78 -71
14 60 138 78 6
NPV ($) -75

71 | P a g e
Table 6.12 – Summary of NPV and payback period (PbP)
Grid availability 25% 75%
NPV $ PbP NPV $ PbP
All facilities except sewage pump station
4,582 3 2,209 5
Sewage pump stations
942 7 -75 14
The NPV for WASH facilities except sewage pump stations ranges from $2,209 to $4,582/kWp with
payback periods of 3 to 5 years, while for sewage pump stations the NPV ranges from minus $75 to
$942/kWp with payback periods of 7 to 14 years. It is clear that PV systems are financially feasible for
WASH facilities with high NPV and short payback periods, except for sewage pump stations, which
have low NPV and high payback periods.
To calculate the production cost of PV systems, the consultant calculated the capital and operational
cost for 20 years, which is equal to $2,280. This assumes capital costs of $1,200/kWp and
maintenance costs of $60/year (5% of capital cost) for 20 years (the lifetime of the system). Power
production is based on 5.31kWh/kWp/day for 20 years. The WASH facilities could benefit from 30–
70% of production. According to these calculations, the cost of kWh production from PV ranges from
0.3–0.71 NIS/kWh.
6.2 Social and environmental benefits
Improving WASH services in Gaza will have a positive impact socially, environmentally and on public
health. The availability of water supply and desalinated water will be enhanced; discharge of
wastewater to the sea will be reduced and pollution from diesel generators will be minimized. The
benefits are summarized below.
General benefits
1. The PV system can be considered as a sustainable independent source of energy as it is not
affected by the internal unsettled Palestinian situation, which has a very negative impact on the
continuous supplies of fuels and consequently on operation hours of WASH facilities.
2. Renewable energy technologies require more labour resources than mechanized fossil fuel
technologies. This results in a greater prospect of creating jobs through market augmentation. The
main players in the solar market include engineers, contractors, consultants, labourers etc.
Currently more than 40 PV companies are working in Gaza and greater adoption of PV systems
as a source of energy would significantly increase the number of these companies, in turn creating
more jobs.
3. Increased installation of PV systems would decrease the unit cost of the equipment (panels,
invertors, batteries etc.). This will minimize the capital cost and make the system more feasible as
the cost of providing services decreases.
Installing PV systems will increase the operation hours of water wells and desalination plants. This will

72 | P a g e
increase production, with the following impacts:
1. Increase of production from water wells will minimize the shortage of water supplies, particularly in
summer months. This will improve public health and meet the needs of residents. Meeting
community needs will also improve relations between communities and municipalities, with a
positive impact on municipalities’ revenues.
2. Currently, many residents dig private wells in their homes in order to meet their water needs.
Increasing the operation hours of the municipal water wells will encourage the community to stop
such illegal activities.
3. Increasing the operation hours of the desalination plants will enable service providers to produce
greater quantities of desalinated water to meet the needs of the community at lower prices. Such
production will improve public health and sustain the service.
4. Installing PV systems will reduce production of CO2 by 0.76kg of CO2/kWh and will reduce the
energy content by 10.9 MJ/kWp. This is due to the fact that 100 litres of diesel produces 0.27
tonnes of CO2 (2.7kg CO2/L) with energy content of 3.84 gigajoules (GJ). Diesel generators
consume 0.284 L/kWh and so produce 0.76kg of CO2/kWh with energy content of 10.9 MJ/kWp.
In addition, due to fuel shortage many municipalities deliver raw sewage to the sea, which has the
following negative impacts:
1. Creates serious environmental health problems for residents who use the sea as a recreation
area.
2. Decreases the number of residents who use the sea as a recreation area; will impact negatively
on tourism and significantly reduce the jobs created from recreation, particularly in summer.
3. Pollution of seawater increases the cost of seawater desalination.
6.3 Technical feasibility
Having completed the data entry phase, the consultant applied a scientific approach to the selection of
the most feasible WASH facilities’ requirements for installation of a PV solar system. The selection
process used multi-criteria analysis, a valuable tool that can be used to make complex decisions with
several criteria inputs. It is a logical process that mainly utilizes the analytical hierarchy process (AHP),
which has a built-in consistency checking test.
As stated in the methodology chapter, the consultant calculated the feasibility index (FI) for each
facility. The following example shows how the consultant computed the FI index for water pump
stations.
Example of calculating FI for water pump stations
The consultant collected the facility data from the municipality and CMWU. The basic data collected is
listed below in Table 6.13.

73 | P a g e
Table 6.13 – Water pump station basic data
Data Value
WPS code RF.1.WP.06
WPS name (English) Rafah UNDP P.S (Tel Sultan)
WPS name (Arabic) تل السلطان -رفح الوكالة
Governorate Rafah
Municipality Rafah
Beneficiary Rafah
WPS capacity (m3/hr) 520
Construction area m2 1,604.5
Total electricity consumption (kWh) 100
Generator availability (Yes, No) Yes
Daily operation electricity (Hr/Day) 4
Daily operation generator (Hr/Day) 2
Required operation (Hr/Day) 6
1. Land availability
To operate a 100 kW facility, we need a 130 kWp PV system.
The required area for generating 130 kWh from a PV system is 1,430m2.
The available area for a PV system is 1,604.5m2.
Note: The maximum percentage is not more than 100%.
2. Hours of facility operation
The total required operation hours of facility is 6 hours.
3. Operational hours of generator
The total daily operation of the generator is 2 hours, and:

74 | P a g e
4. Cost of production
The computed consumption power cost/facility capacity is $0.03/m3. Using Table 3.3, the value is
between (0.01–0.04), the weight is 0.8:
5. Facility capacity
The capacity of the well is 520m3/hr. Using Table 3.8, the value ranges between 500 and 650; the
weight is 0.8.
6. Feasibility index

75 | P a g e
For each facility the consultant prepared a data sheet presenting the data collected and calculations,
with results as shown in Figure 6.1.
Figure 6.1 – Facility data sheet

76 | P a g e
Table 6.14 indicates the FI for each facility. The consultant classified the FI into three categories (40%
or less; 40% to 60%; and more than 60%).
Table 6.14 – Summary of feasibility index for each facility
Facility 40% or less 40% to 60% More than
60%
Water wells 95 128 43
Public desalination plants 15 30 7
Private desalination plants
10 7 4
Wastewater pump stations
10 30 9
Water pump stations 8 19 15
Total 138 214 78
According to Table 6.14 and FI calculations, the FI of 1.0 facilities is less 40%, there are 219 facilities
between 40% and 60%, and 00 facilities score more than 60%. Based on this, 78 WASH facilities are
feasible to install a PV system while 214 are moderately feasible and 138 are not feasible to install PV.
The consultant developed an excel data sheet to show the feasibility index for each facility, as shown
in Annex 4.1. Annex 6.2 shows the feasible facilities (wells, water pump stations, sewage pump
stations, public and private desalination plants). The results are classified by facility type, governorate
and municipality.
UN critical facilities
Life-saving services in Gaza currently depend on the UN’s delivery of emergency fuel, due to an
energy crisis that affects the two million Palestinian residents of Gaza, as grid availability ranges from
25% to 75% per day. Based on the current electricity deficit in Gaza, a minimum of $4.5m
(https://www.ochaopt.org/) is required to sustain these essential services until the end of the year.
Without fuel, people will potentially be affected by serious public health concerns as sewage could
overflow onto streets. Overall, water and wastewater services are dropping to less than 20% of
capacity and water availability is dropping below 50 litres per capita per day, less than half of the
minimum requirement according to the WHO. Additionally, some essential infrastructure risks
significant damage due to lack of fuel to operate key parts, with potential loss of donor investments as
a result (https://www.ochaopt.org/).
Most critical WASH facilities in the Gaza Strip receive fuel from the UN system. In 2018, 186 facilities
received about 2.04 million litres of fuel. According to the above technical feasibility calculations on
WASH facilities, the consultant found that there are 01 technically feasible and moderately feasible
critical WASH facilities to be targeted with solar PV systems. Tables 6.15–6.18 show the critical
WASH facilities where installation of a PV system is feasible and moderately feasible.

77 | P a g e
Table 6.15 – Feasible and moderately feasible critical sewage pump stations
Sewage pump stations
CMWU code Facility name Municipality Proposed PV
(kW) Feasibility
Capital cost ($)
GZ.2.SP.09 Sewage PS 7B (Al-
Zayton) Gaza 181
Moderately feasible
162,900
GZ.2.SP.01 Sewage PS5 (Al-
Baqqara) Gaza 136
Moderately feasible
122,400
GZ.2.SP.06 Sewage PS6A (Al-
Samr) Gaza 50
Moderately feasible
45,000
GZ.2.SP.05 Sewage PS1 (Al-
Montada) Gaza 109
Moderately feasible
98,100
MG.1.PS.01 Al Moghragah sewage pump
station Al Moghraqa 63
Moderately feasible
56,700
KH.2.SP.01 Hesbat Elsamak sewage pump
station Khanyounis 81
Moderately feasible
72,900
KH.2.SP.04 Al Maqaber
sewage pump station
Khanyounis 13 Moderately
feasible 9,100
BJ.2.SP.02 Block 12 Al Buraij 2 Moderately
feasible 1,800
BJ.2.SP.01 Block 7 Al Buraij 2 Moderately
feasible 1,800
NU.2.SP.02 Al Hasaiyna sewage
pump station Al Nusirat 72
Moderately feasible
64,800
NU.2.SP.01 New Camp PS Al Nusirat 30 Moderately
feasible 24,000
DB.2.SP.02 Al Basa sewage pump station
Dear AlBalah 45 Moderately
feasible 40,500
DB.2.SP.01 Al Berka sewage
pump station Dear AlBalah 50
Moderately feasible
35,000
BL.2.SP.05 Aslan 5 sewage pump station
Bait lahia 45 Moderately
feasible 31,500
JB.2.SP.01 Abu Rashed PS Jabalia 260 Feasible 234,000
JB.2.SP.04 Hawaber PS Jabalia 63 Feasible 56,700
JB.2.SP.06 Mahader PS Jabalia 40 Moderately 36,000

78 | P a g e
Sewage pump stations
CMWU code Facility name Municipality Proposed PV
(kW) Feasibility
Capital cost ($)
feasible
ON.2.SP.01 Um Al Nassir pump
satation Um Al Nasser 36
Moderately feasible
25,200
RF.2.SP.02 Jumizit Al Sabiel PS Rafah 98 Feasible 88,200
RF.2.SP.04 Tal Al Sultan PS Rafah 61 Feasible 54,900
RF.2.SP.03 Al Juninah PS Rafah 59 Feasible 53,100
RF.2.SP.01 Block O PS Rafah 17 Moderately
feasible 13,600
RF.2.SP.05 UNDP PS Rafah 13 Moderately
feasible 10,400
costlatoT colatoT ($ ) 1,338,600

79 | P a g e
Table 6.16 – Feasible and moderately feasible critical water pump stations
Water pump stations
CMWU code Facility name Municipality Proposed PV
(kW) Feasibility
Capital cost ($)
KH.1.WP.01 Al Sa'ada booster Khanyounis 169 Feasible 152,100
KH.1.WP.03 Al Rahma booster Khanyounis 72 Moderately
feasible 64,800
KH.1.WP.02 Ma'an booster Khanyounis 78 Feasible 70,200
BS.1.WP.02 Bani Suhaila new
booster Bani Suhaila 45
Moderately feasible
40,500
BS.1.WP.01 Eastern booster station-regional
Bani Suhaila 26 Feasible 23,400
RF.1.WP.05 Rafah ground tank Rafah 143 Feasible 100,100
latoT colatoT caot ($) 451,100
Table 6.17 – Feasible and moderately feasible critical wells
Wells
CMWU code Facility name Municipality Proposed PV
(kW) Feasibility
Capital cost ($)
GZ.1.PW.01 Al Shajaia 2 water
well Gaza 54 Feasible 105,300
GZ.1.PW.03 Al Shajaia 4 water
well Gaza 30
Moderately feasible
34,300
GZ.1.PW.24 Al Shaekh Ejleen 5
water well Gaza 45 Feasible 44,100
JB.1.PW.11 Sheikh Radwan water
well no. 10w Gaza 28
Moderately feasible
128,700
GZ.1.PW.82 Sheikh Radwan water
well no. 14 Gaza 36
Moderately feasible
64,800
BL.1.PW.01 Sheikh Radwan water
well no. 15 Gaza 36
Moderately feasible
171,000
GZ.1.PW.30 Al-Safa water well
no. 5 (Zimmo) Gaza 25
Moderately feasible
171,000

80 | P a g e
Wells
CMWU code Facility name Municipality Proposed PV
(kW) Feasibility
Capital cost ($)
MG.1.PW.01 Mun. F203 Al Moghraqa 18 Moderately
feasible 45,900
MG.1.PW.02 Al Kauthar well F264 Al Moghraqa 71 Feasible 63,900
ZH.1.PW.04 Shoblaq water well Al Zahra 3 Moderately
feasible 10,800
WG.1.PW.01 Wadi Gaza Wadi Gaza 32 Moderately
feasible 28,800
KH.1.PW.08 Al Kewaity water well Khanyounis 13 Moderately
feasible 38,700
KH.1.PW.27 Al Rahma well Khanyounis 13 Moderately
feasible 58,500
KH.1.PW.10 EV2 Khanyounis 22 Moderately
feasible 63,900
KH.1.PW.11 EV3 Khanyounis 22 Moderately
feasible 88,200
KH.1.PW.01 Eastern well Khanyounis 81 Moderately
feasible 80,100
AN.1.PW.01 Abassan Al Jadida N-
04 Abasan Al Jadidah 45
Moderately feasible
45,500
RF.1.PW.12 Al Fukhari Al Fohkari 22 Moderately
feasible 40,500
QR.1.PW.02 Al Matahin Al Qarara 72 Feasible 64,800
WS.1.PW.01 Wadi Salqa Wadi Alsalqa 21 Feasible 18,900
MU.1.PW.01 Al Mussadar Al Musader 31 Moderately
feasible 41,400
ZW.1.PW.03 Khalid Ibn Al Walied
water well Al Zawayda 18
Moderately feasible
27,300
ZW.1.PW.01 Al Zohor water well
H90 Al Zawayda 20
Moderately feasible
35,100

81 | P a g e
Wells
CMWU code Facility name Municipality Proposed PV
(kW) Feasibility
Capital cost ($)
BJ.1.PW.01 Miun. S72 Al Buraij 9 Moderately
feasible 53,100
MZ.1.PW.04 S-80Mohammed Al Maghazi 27 Moderately
feasible 34,300
MZ.1.PW.03 S-82 Al Buhairi water
well Al Maghazi 45
Moderately feasible
32,200
NU.1.PW.05 Al Faroq F-225 Al Nusirat 18 Moderately
feasible 32,400
ZH.1.PW.03 Al Zahra water well
F-208 Al Nusirat 2
Moderately feasible
35,700
DB.1.PW.10 Al Sahil4 Dear AlBalah 13 Moderately
feasible 19,800
DB.1.PW.12 Al Sahil 5 Dear AlBalah 13 Moderately
feasible 33,300
DB.1.PW.02 Abu Marwan water
well Dear AlBalah 26 Feasible 18,200
MZ.1.PW.08 Al Montaza water
well Al Maghazi 27
Moderately feasible
36,900
BH.1.PW.09 Ayda water well Bait Hanoun 45 Moderately
feasible 70,200
BL.1.PW.03 Al Mashrou water
well Bait lahia 90 Feasible 131,400
BL.1.PW.09 Al Shekh Zayed water
well Bait lahia 45
Moderately feasible
88,200
BL.1.PW.06 Al Atatra water well Bait lahia 45 Moderately
feasible 45,000
JB.1.PW.01 Al Khazan water well Jabalia 27 Moderately
feasible 46,800
JB.1.PW.06 Al Zohor water well Jabalia 23 Feasible 34,200
JB.1.PW.05 Amer water well Jabalia 36 Moderately 36,900

82 | P a g e
Wells
CMWU code Facility name Municipality Proposed PV
(kW) Feasibility
Capital cost ($)
feasible
JB.1.PW.04 Abu Talal water well Jabalia 8 Moderately
feasible 49,500
ON.1.PW.01 Um Al Nassir Um Al Nasser 13 Moderately
feasible 53,100
RF.1.PW.14 Al Nassir 1 Al Nasser 45 Moderately
feasible 70,200
RF.1.PW.11 Al Shouka well Al Shoukah 59 Feasible 53,100
RF.1.PW.31 Al Malizei well Al Shoukah 59 Feasible 53,100
RF.1.PW.03 Abu Hashem water
well P124 Rafah 118 Feasible 106,200
RF.1.PW.09 Abu Zohri water well
P138 Rafah 56
Moderately feasible
57,600
RF.1.PW.10 Al Hashash water
well P145 Rafah 24
Moderately feasible
51,300
RF.1.PW.07 Al Eskan water well
P153 Rafah 66 Feasible 59,400
RF.1.PW.04 Canada P 144 Rafah 24 Feasible 21,600
RF.1.PW.06 PWA well Rafah 37 Moderately
feasible 79,200
latoT colatoT caot ($) 2,874,400

83 | P a g e
Table 6.18 – Feasible and moderately feasible critical public desalination plants
Public desalination plants
CMWU code Facility name Municipality Proposed PV
(kW) Feasibility
Capital cost ($)
RF.1.DP.02 Al Salam desalination
plant Rafah 72
Moderately feasible
70,200
RF.1.DP.01 Al Shoot desalination
plant Rafah 55
Moderately feasible
49,500
latoT colatoT caot ($) 119,700
84 | P a g e
7 Conclusions and recommendations
This study, entitled ‘Comprehensive Study of Renewable Energy Sources in Gaza’s WASH Sector for
Public and Private WASH Facilities’, obtained significant findings. The following paragraphs present
the main findings of the study along with its conclusions and recommendations.
The literature review showed that direct technology to generate electricity is optimally achieved
through installing solar PV technologies, and this is also recommended for producing electricity in the
Gaza Strip. The study therefore gave this type of technology its full consideration.
OPT has a high solar energy potential because the average solar energy ranges from 2.87 kWh/m2
per day in December to 8.07 kWh/m2 per day in June, and the daily average solar radiation intensity
on a horizontal surface, peak sunshine hour (PSSH), is 5.31 kWh/m2 per day.
There are 438 WASH facilities in the Gaza Strip, including 266 water wells, 52 public desalination
plants, 21 private desalination plants, 42 water pump stations, 49 wastewater pump stations and 8
wastewater treatment plants. Most public facilities (417 facilities) use generators to bridge the
shortage of the public electricity grid. There are 359 diesel generators operating for more than 3 hours
per day.
The consultant found that from 2013 to 2017, there were approximately 330 projects installing PV
systems for public and private institutions in the Gaza Strip, with a total capacity of about 5,611 kWp.
There are many suppliers of PV technology in the Gaza Strip; all of them are private sector. The local
market has a high capacity, and professional knowledge and experience regarding PV systems and
installation are developing. Currently, there are some suppliers who have established workshops for
repair and maintenance. The available equipment is of high quality and complies with local and
international standards. All equipment is imported from well-known manufacturers, including some
brand names. The capacity of local suppliers is still limited and capacity building is needed for people
working in this sector, such as suppliers, engineers and contractors, etc. Capacity building is also
required for energy management.
Existing power resources provide 25–75 % of the daily demand. Therefore, WASH facilities face a
serious problem as diesel fuel for generators, usually used during electricity shortage periods, is
expensive and not continuously available, due to the political and financial circumstances.
The consultant computed the capital and operational costs of PV systems for 20 years, assuming that
the capital cost is $1,200/kWp and the maintenance cost is $60/year (5% of capital cost) for 20 years
(the lifetime of the system). The cost of producing 1 kWh from a PV system was found to be 0.3
NIS/kWh for WASH facilities except sewage pump stations, where the cost reached 0.71 NIS/kWh.
The Net Present Value (NPV) of a PV system for WASH facilities except sewage pump stations
ranges from $2,209 to $4,582/kWp, with a payback period of 3 to 5 years. The NPV of sewage pump
stations ranges from minus $75 to $942/kWpkWp, with a payback period of 7 to 14 years.
Implementation of feasible projects will result in 9.75 Mwh of energy savings annually. Feasible and
moderately feasible projects will save 29.6 Mwh per year.

85 | P a g e
The cost of generating electricity from diesel generators ranges from 1.4 to 1.8 NIS/kWh. The
consultant estimated an average cost of 1.6 NIS/kWh.
The study showed that installing PV systems would reduce the production of CO2 by 0.76kg of
CO2/kWh and reduce the energy content by 10.9 MJ/kWp. This is due to the fact that 100 litres of
diesel produces 0.27 tonnes of CO2 (2.7kg CO2/L), with energy content of 3.84 gigajoules (GJ). Diesel
generators consume 0.284 L/kWh and so produce 0.76 kg of CO2/kWh and energy content of 10.9
MJ/kWp.
Based on the technical feasibility study, 78 WASH facilities are feasible for installing a PV system,
while 214 are moderately feasible and 138 are not feasible to install PV. Most critical WASH facilities
in the Gaza Strip receive fuel from the UN system; in 2018, 186 facilities received about 2.04 million
litres of fuel. Of the critical WASH facilities, 01 are technically feasible and moderately feasible tfor
installation of solar PV systems. The cost of implementation of feasible and moderately feasible
facilities is about $9m, while the cost of implementation of feasible facilities is about $4.7m.
This study is considered as providing the baseline for further installation of solar energy systems for
any WASH facilities. The classification of WASH facilities in this study as feasible, moderately feasible
and not feasible can guide all agencies interested in providing WASH facilities with solar energy.
Based on the findings of the study, an action plan for implementing solar energy projects as a priority
action should be prepared for WASH facilities throughout the Gaza Strip. It is recommended that this
commences with a selected group of facilities (5 to 10 facilities) as a pilot for monitoring over a certain
period.
The capacity of the private sector (designers, suppliers and operators) requires enhancement through
technical, marketing and managerial capacity-building programmes. This capacity building could be
carried out locally, regionally or internationally.
The findings of study can be considered as a roadmap to help identify the necessary next actions,
which have to be agreed among the WASH Cluster, PWA and any other stakeholders.

86 | P a g e
References 1. AAH (2018). Technical Verification and Assessment of Public Desalination Plants in Gaza Strip,
Gaza, OPT.
2. AAH (2018). Technical Feasibility Study and Unit Design for Piloting a Hydropower Electric
System, Gaza, OPT.
3. Ajan, C.W., S.S. Ahmed, H.B. Ahmad, F. Taha and A.A.B. Mohd Zin (2003). ‘On the policy of
photovoltaic and diesel generation mix for an off-grid site: East Malaysian perspectives’. Solar
Energy 74, 453–467.
4. Desalination Journal 196 (2006). 1–12. H. Baalousha, ‘Desalination status in the Gaza Strip and
its environmental impact’.
5. ICRC (2017). Rapid Assessment on Solar Energy for Gaza House Hold, Ramallah, OPT.
6. Hass, R. (1995). ‘The value of photovoltaic electricity for society’. Solar Energy 54, 1: 25–31.
7. Kolhe, M., S. Kolhe and J.C. Joshi (2002). ‘Economic viability of stand-alone solar photovoltaic
system in comparison with diesel-powered system for India’. Energy Economics 24, 2: 155–65.
8. Marafia, A.-H. (2001). ‘Feasibility study of photovoltaic technology in Qatar’. Renewable Energy
24, 3: 565–3.
9. Matsuhashi, R., Y. Momobayashi and H. Ishitani (2002). ‘Feasibility study on a CDM project
utilizing photovoltaic systems’. Environmental Economics and Policy Systems 5, 2: 105–19.
10. Mogheir Y., Ahmad A. Foul, A.A. Abuhabib and A.W. Mohammad (2013). ‘Assessment of large
scale brackish water desalination plants in the Gaza Strip’, Desalination Journal 314 96–100,
Gaza, OPT.
11. Muneer, T., M. Asif and J. Kubie (2003). ‘Generation and transmission prospects for solar
elecricity: UK and global markets’. Energy Conversion and Management 44, 1: 35–5.
12. Nieuwlaar, E. and E. Alsema (1997). Environmental aspects of PV power systems. Workshop
Summary Report, Department of Science, Technology and Society, Utrecht University.
13. Palestinian Environmental NGOs Network – Friends of the Earth Palestine (2016). Pre Master
Plan Solar Energy Production in Palestine, OPT.
14. PWA (2013). Water Desalination Strategy in Gaza Strip: Challenges and Opportunities, Gaza,
OPT.
15. PWA, GIZ (2015). Survey of Private and Public Brackish Desalination Plants in Gaza Strip, Gaza,
OPT.
16. Sawin, J.L. (2004). Worldwatch Paper 169: Mainstreaming Renewable Energy in the 21st Century.
Washington D.C.: Worldwatch Institute.
17. Ouda, M. (2003). Prospects of Renewable Energy in Gaza Strip, Energy Research and
Development Center, Islamic University of Gaza, OPT.
18. Solar Energy as an Alternative to Conventional Energy in Gaza Strip: Questionnaire Based Study,
Gaza, OPT.
19. Survey of Private and Public Brackish Desalination Plants in Gaza Strip, Gaza, OPT.
20. Voss, A. (2001) LCA and External Costs in Comparative Assessment of Electricity Chains.
Decision Support for Sustainable Electricity Provision? Institute of Energy Economics and the

87 | P a g e
Rational Use of Energy, Stuttgart (Germany). Externalities and Energy Policy: The Life Cycle
Analysis Approach. Workshop Proceedings. Paris France 15–16 November 2001, Nuclear Energy
Agency Organisation for Economic Co-Operation and Development. Pp. 163–181.
21. Yasin A., (2008). Optimal Operation Strategy and Economic Analysis of Rural Electrification of
Atouf Village by Electric Network, Diesel Generator and Photovoltaic System, Najah University,
Nablus, OPT.
22. Hussam A. AlBorsh, Said M. Ghabayen (2017). ‘Solar energy to optimize the cost of RO
desalination plant case study: Deir Elbalah SWRO plant in Gaza strip’, Journal of Engineering
Research And Technology, Volume 4, Issue 4, December 2017.

88 | P a g e
Annexes Annex no. Description Availability
3.1 Schedule of the conducted field visits See below
3.2 Collected data of WASH facilities Excel file available on request:
3.3 Checklist template See below
3.4 Water quality of water wells See below
4.1 Proposed PV system and feasibility index for each facility
Excel file available on request:
6.1 Financial analyses of WASH facilities Excel file available on request
6.2 Feasible WASH facilities Word file available on request
Annex 3.1 – Schedule of the conducted field visits
Visits plan
ENFRA team
(project manager & water engineers)
Sunday, 21 /10/ 2018 2:00 pm to 3:00 pm Coastal Municipality Water utility
Wednesday, 31/10/2018
10:00 am to 11:00 am PENRA, Gaza
Wednesday, 31/10/2018
12:00 pm to 1:00 pm PWA Office, Gaza
ENFRA Team
(electrical engineer) with international experts
Tuesday, 06/11/2018 9:00 to 10:00 am OCHA team
Tuesday, 06/11/2018 10:00 to 11:30 am Al Amal Desalination plant
Tuesday, 06/11/2018 11:30 to 12:00 am WASH Cluster Coordinator
Tuesday, 06/11/2018 12:00 am to 12:30 pm Coastal Municipality Water Utility
Tuesday, 06/11/2018 12:30 pm to 3:00 pm some WASH facilities
Wednesday, 07/11/2018
10:00 to 11:00 am Palestinian Water Authority staff, Ramallah
Wednesday, 07/11/2018
11:30 am to 1:00 Two private companies
Wednesday, 07/11/2018
1:00 pm to 2:00 Abdel Salam Yaseen Company
ENFRA team
(project manager & water engineers)
Tuesday, 06/11/2018 12:30 pm to 1:30 pm Coastal Municipality Water Utility
Saturday, 10/11/2018 12:00 pm to 1:30 pm Abdel Salam Yaseen Company
Sunday 11/11/2018 12:00 pm to 1:00 pm Action Against Hunger
Sunday 11/11/2018 1:00 pm to 2:00 pm PENRA, Gaza

89 | P a g e
Annex 3.3 – Checklist template
Check List for Comprehensive Study of Renewable Energy Sources in Gaza's WASH Sector for Public and Private Water
Facility General Information
Visit Data: Visit time:
Location (Coordinates)
About the operators
Background Qualification: Years of experience:
No. of operators:
Facility technical information
Unit type:
Wells
Public Desalination plants (brackish)
Private Desalination plants (brackish)
Water Pump Stations
sewage Pumping Station
Wastewater Treatment plants
Capacity:
Source of Power
GRID , Subscription rate
PV System, Type of PV System
Generators, No of Generators , Generators rates
Other
Power needed \ KW \ HP
Pumping
Desalination Units
Other
Power consumption ………
Running Operating ……………hours\day …………Day /Night
Total Area available: ……… Roofs: ……….. Land:………
Is There an Obstacles toward south yes / no
Statues
Current statues: Active Stop
Parts need maintenance:
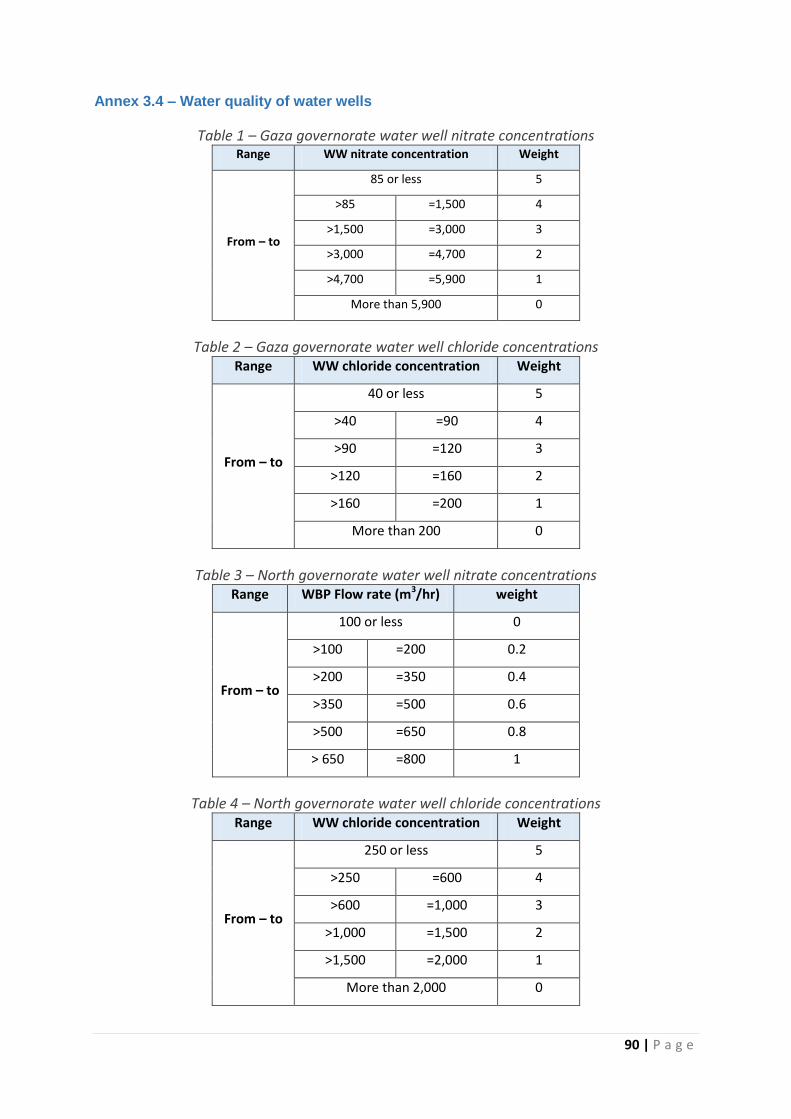
90 | P a g e
Annex 3.4 – Water quality of water wells
Table 1 – Gaza governorate water well nitrate concentrations Range WW nitrate concentration Weight
From – to
85 or less 5
>85 =1,500 4
>1,500 =3,000 3
>3,000 =4,700 2
>4,700 =5,900 1
More than 5,900 0
Table 2 – Gaza governorate water well chloride concentrations Range WW chloride concentration Weight
From – to
40 or less 5
>40 =90 4
>90 =120 3
>120 =160 2
>160 =200 1
More than 200 0
Table 3 – North governorate water well nitrate concentrations Range WBP Flow rate (m3/hr) weight
From – to
100 or less 0
>100 =200 0.2
>200 =350 0.4
>350 =500 0.6
>500 =650 0.8
> 650 =800 1
Table 4 – North governorate water well chloride concentrations Range WW chloride concentration Weight
From – to
250 or less 5
>250 =600 4
>600 =1,000 3
>1,000 =1,500 2
>1,500 =2,000 1
More than 2,000 0

91 | P a g e
Table 5 – Middle Area governorate water well nitrate concentrations Range WW nitrate concentration Weight
From – to
10 or less 5
>10 =100 4
>100 =150 3
>150 =200 2
>200 =300 1
More than 300 0
Table 6 – Middle Area governorate water well chloride concentrations Range WW chloride concentration Weight
From – to
65 or less 5
>65 =500 4
>500 =1,000 3
>1,000 =1,500 2
>1,500 =2,050 1
More than 2,050 0
Table 7 – Khanyounis governorate water well nitrate concentrations Range WW nitrate concentration Weight
From – to
50 or less 5
>50 =100 4
>100 =150 3
>150 =220 2
>220 =380 1
More than 380 0
Table 8 – Khanyounis governorate water well nitrate concentrations Range WW chloride concentration Weight
From – to
100 or less 5
>100 =600 4
>600 =1,000 3
>1,000 =1,500 2
>1,500 =2,100 1
More than 2,100 0

92 | P a g e
Table 9 – Rafah governorate water well nitrate concentrations Range WW nitrate concentration Weight
From – to
15 or less 5
>15 =100 4
>100 =150 3
>150 =200 2
>200 =300 1
More than 300 0
Table 10 – Rafah governorate water well chloride concentrations Range WW chloride concentration Weight
From – to
120 or less 5
>120 =300 4
>300 =500 3
>500 =800 2
>800 =1,000 1
More than 1,000 0
© Oxfam International July 2019
For further information on the issues raised in this paper please email Wassem Mushtaha (WASH
Programme Manager) [email protected])
Published by Oxfam GB for Oxfam International under
ISBN 978-1-78748-466-5 in July 2019. DOI: 10.21201/2019.4665
Oxfam GB, Oxfam House, John Smith Drive, Cowley, Oxford, OX4 2JY, UK.
OXFAM Oxfam is an international confederation of 19 organizations networked together in more than 90
countries, as part of a global movement for change, to build a future free from the injustice of poverty.
Please write to any of the agencies for further information, or visit www.oxfam.org