Daniel Flórez-Orrego, Julio A. M. da Silva, Héctor Velásquez, Silvio de Oliveira Jr.
Renewable and Non-Renewable Exergy Costs
and CO2 Emissions in the Production of Fuels for
Brazilian Transportation Sector
ECOS 2014 - THE 27TH INTERNATIONAL CONFERENCE ON
EFFICIENCY, COST, OPTIMIZATION, SIMULATION AND ENVIRONMENTAL IMPACT OF ENERGY SYSTEMS
JUNE 15-19, 2014, TURKU, FINLAND
Polytechnic School, University of São Paulo, São Paulo, Brazil
Faculty of Mines, National University of Colombia, Medellin, Colombia
Polytechnic School, Federal University of Bahia, Salvador, Brazil
Universidade de São Paulo
INTRODUCTION
• Transportation sector: Important issue across the global economy.
• The quest for higher energy efficiencies through the advent of new technologies can also alter the
vehicle demand profiles, as well as modify the levels of emissions and fuel consumption.
• The dependence of petroleum-derived fuels is forecast to decline. However, the extent to which
alternative fuels can make the fossil fuel substitution will depend largely on how they are produced.
• Brazilian electricity generation and transportation sector mixes have been characterized by an
approach that is peculiar within the international context of dependence on fossil fuels.
2/16
ECOS 2014 - THE 27TH INTERNATIONAL CONFERENCE ON
EFFICIENCY, COST, OPTIMIZATION, SIMULATION AND ENVIRONMENTAL IMPACT OF ENERGY SYSTEMS
JUNE 15-19, 2014, TURKU, FINLAND
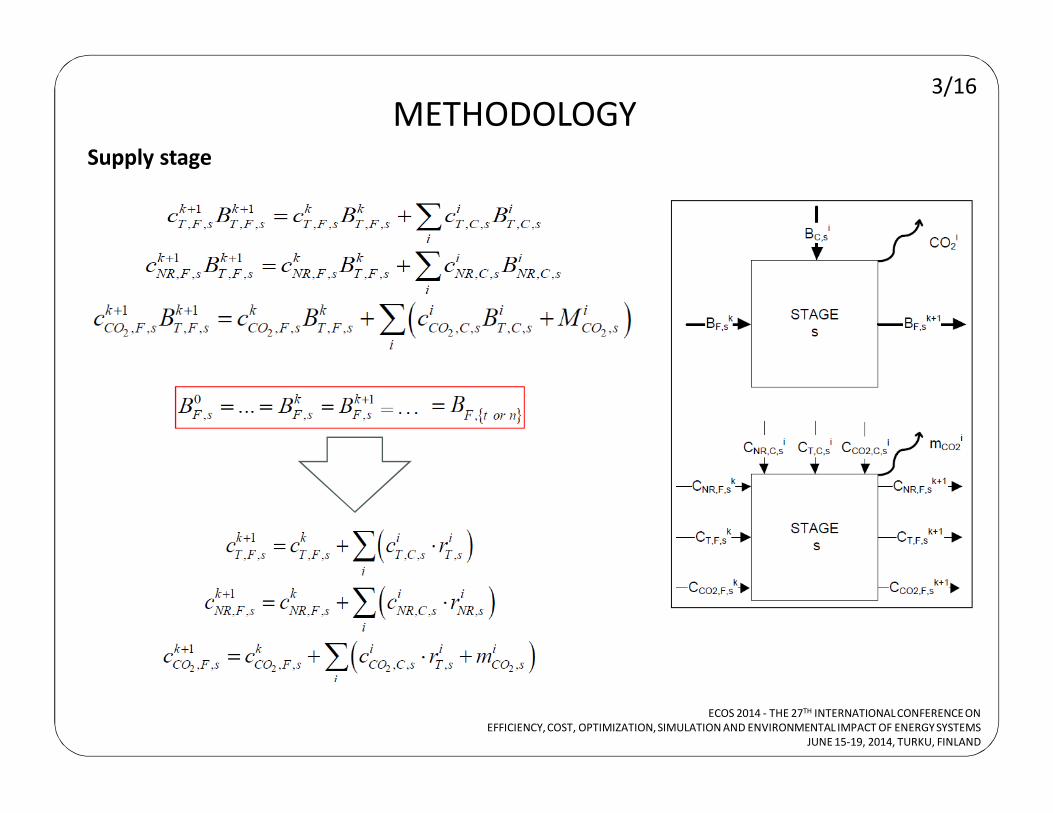
METHODOLOGYSupply stage
3/16
ECOS 2014 - THE 27TH INTERNATIONAL CONFERENCE ON
EFFICIENCY, COST, OPTIMIZATION, SIMULATION AND ENVIRONMENTAL IMPACT OF ENERGY SYSTEMS
JUNE 15-19, 2014, TURKU, FINLAND
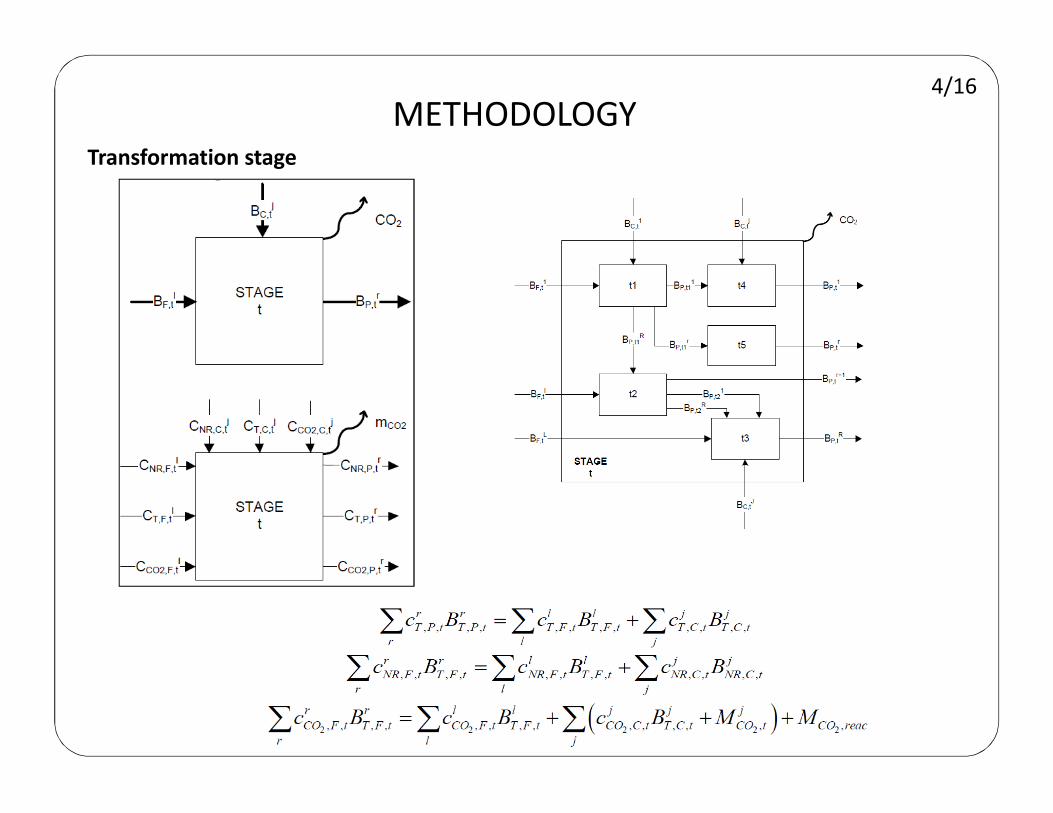
METHODOLOGYTransformation stage
4/16
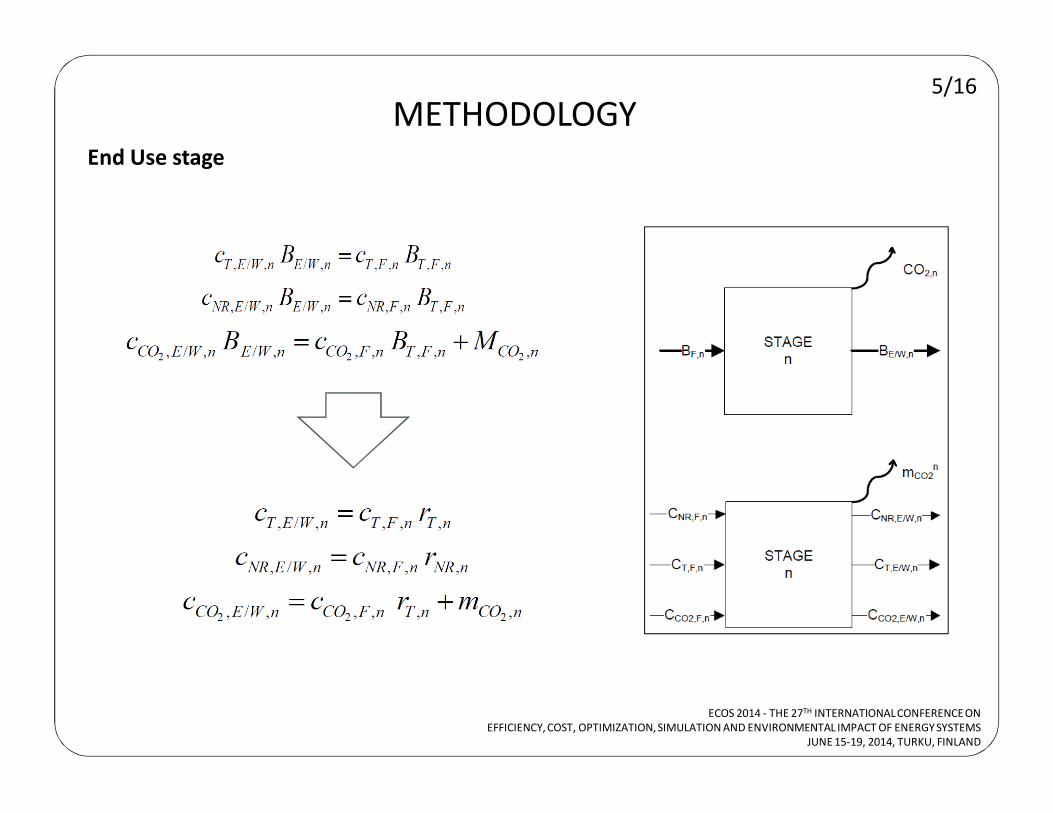
METHODOLOGYEnd Use stage
5/16
ECOS 2014 - THE 27TH INTERNATIONAL CONFERENCE ON
EFFICIENCY, COST, OPTIMIZATION, SIMULATION AND ENVIRONMENTAL IMPACT OF ENERGY SYSTEMS
JUNE 15-19, 2014, TURKU, FINLAND
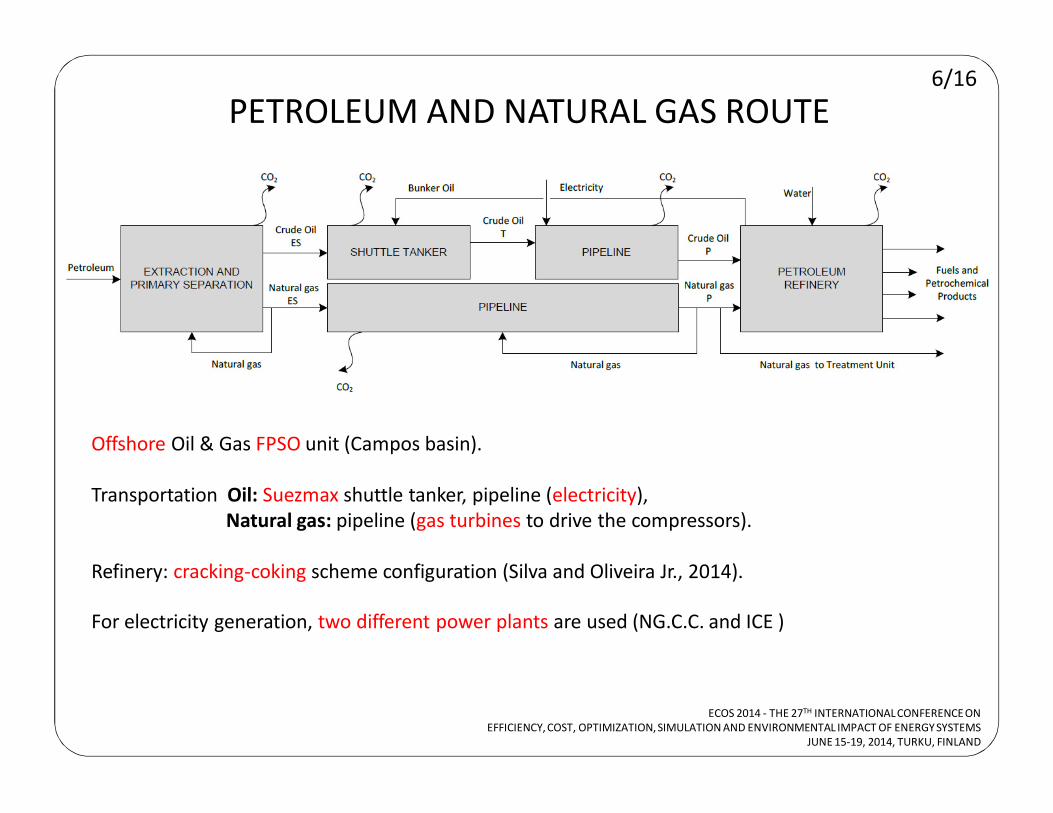
PETROLEUM AND NATURAL GAS ROUTE
Offshore Oil & Gas FPSO unit (Campos basin).
Transportation Oil: Suezmax shuttle tanker, pipeline (electricity),
Natural gas: pipeline (gas turbines to drive the compressors).
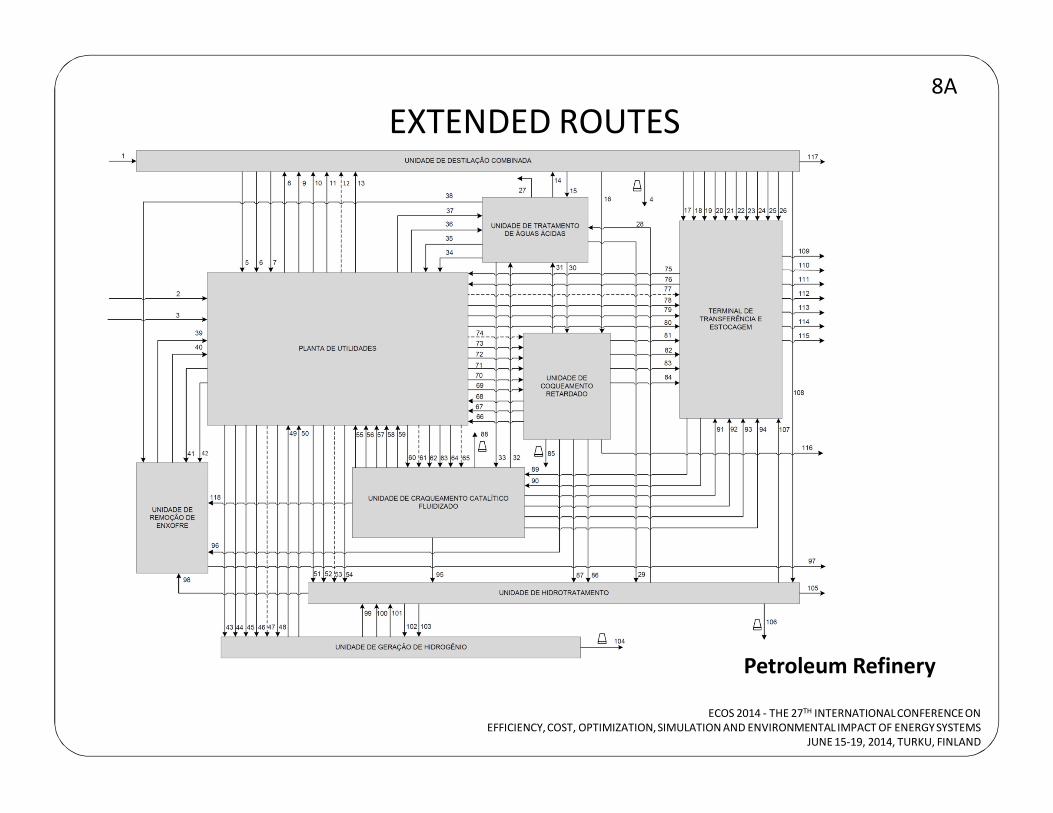
Refinery: cracking-coking scheme configuration (Silva and Oliveira Jr., 2014).
For electricity generation, two different power plants are used (NG.C.C. and ICE )
6/16
ECOS 2014 - THE 27TH INTERNATIONAL CONFERENCE ON
EFFICIENCY, COST, OPTIMIZATION, SIMULATION AND ENVIRONMENTAL IMPACT OF ENERGY SYSTEMS
JUNE 15-19, 2014, TURKU, FINLAND
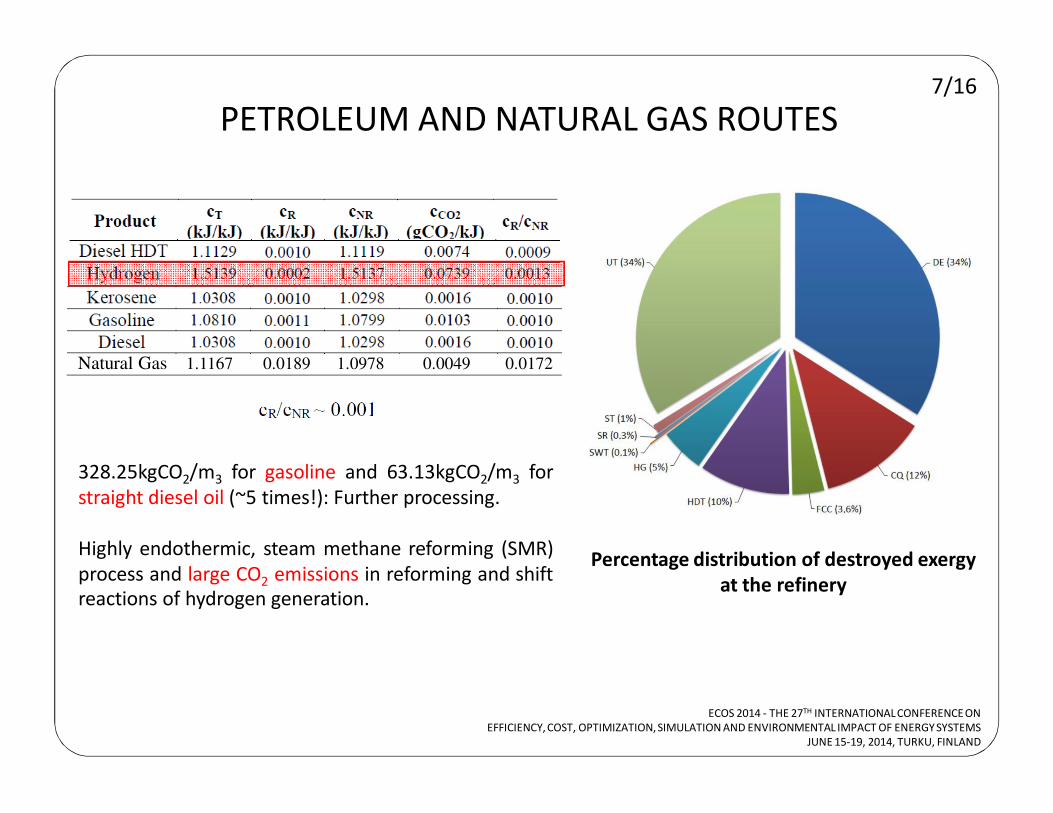
PETROLEUM AND NATURAL GAS ROUTES7/16
Percentage distribution of destroyed exergy
at the refinery
328.25kgCO2/m3 for gasoline and 63.13kgCO2/m3 for
straight diesel oil (~5 times!): Further processing.
Highly endothermic, steam methane reforming (SMR)
process and large CO2 emissions in reforming and shift
reactions of hydrogen generation.
Natural Gas 1.1167 0.0189 1.0978 0.0049 0.0172
ECOS 2014 - THE 27TH INTERNATIONAL CONFERENCE ON
EFFICIENCY, COST, OPTIMIZATION, SIMULATION AND ENVIRONMENTAL IMPACT OF ENERGY SYSTEMS
JUNE 15-19, 2014, TURKU, FINLAND
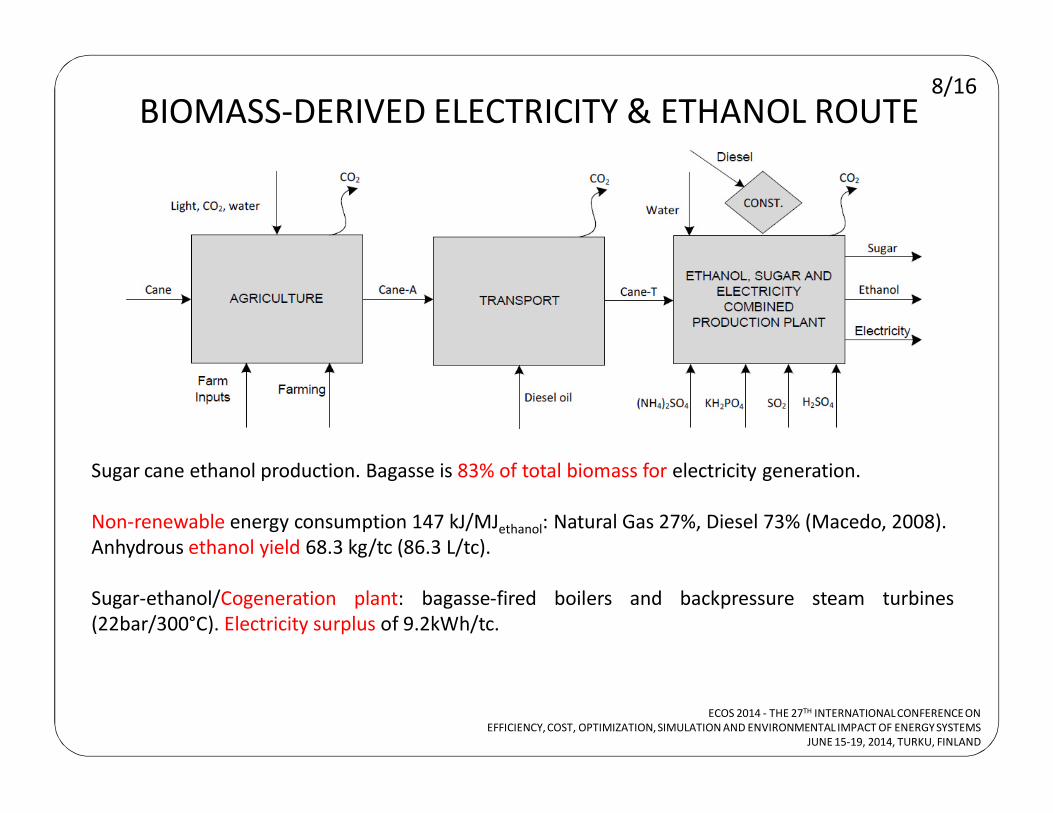
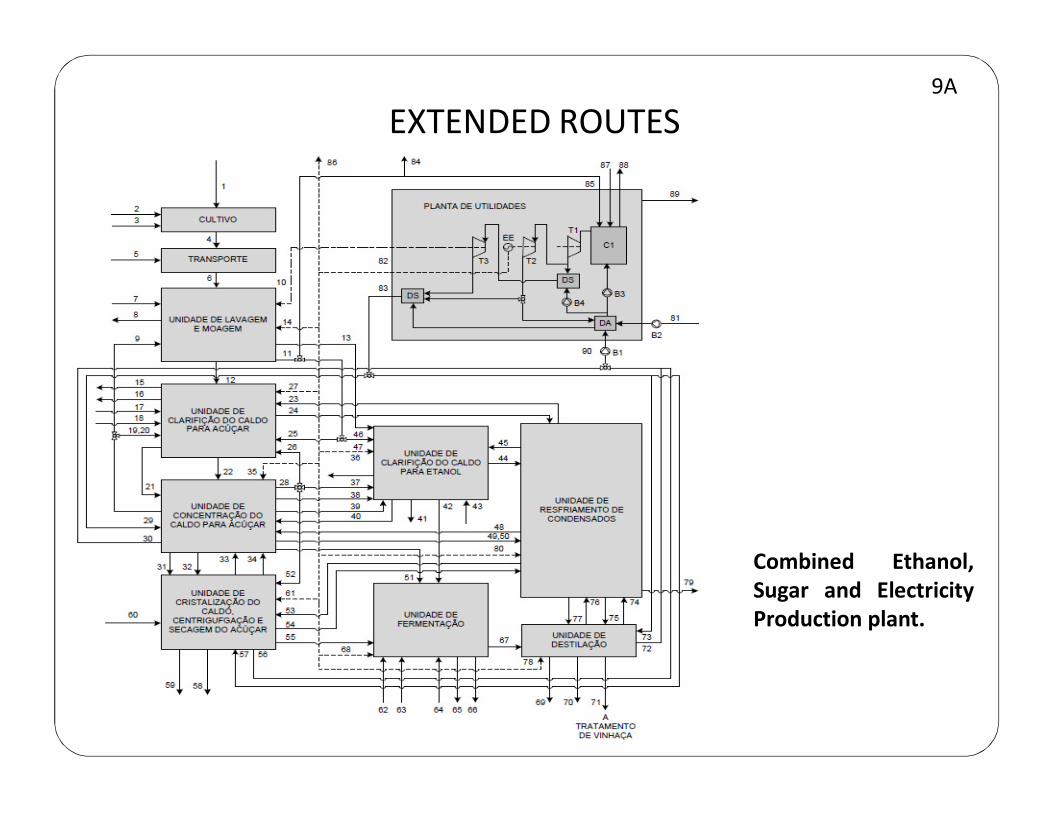
Sugar cane ethanol production. Bagasse is 83% of total biomass for electricity generation.
Non-renewable energy consumption 147 kJ/MJethanol: Natural Gas 27%, Diesel 73% (Macedo, 2008).
Anhydrous ethanol yield 68.3 kg/tc (86.3 L/tc).
Sugar-ethanol/Cogeneration plant: bagasse-fired boilers and backpressure steam turbines
(22bar/300°C). Electricity surplus of 9.2kWh/tc.
BIOMASS-DERIVED ELECTRICITY & ETHANOL ROUTE8/16
ECOS 2014 - THE 27TH INTERNATIONAL CONFERENCE ON
EFFICIENCY, COST, OPTIMIZATION, SIMULATION AND ENVIRONMENTAL IMPACT OF ENERGY SYSTEMS
JUNE 15-19, 2014, TURKU, FINLAND
BIOMASS-DERIVED ELECTRICITY & ETHANOL ROUTE9/16
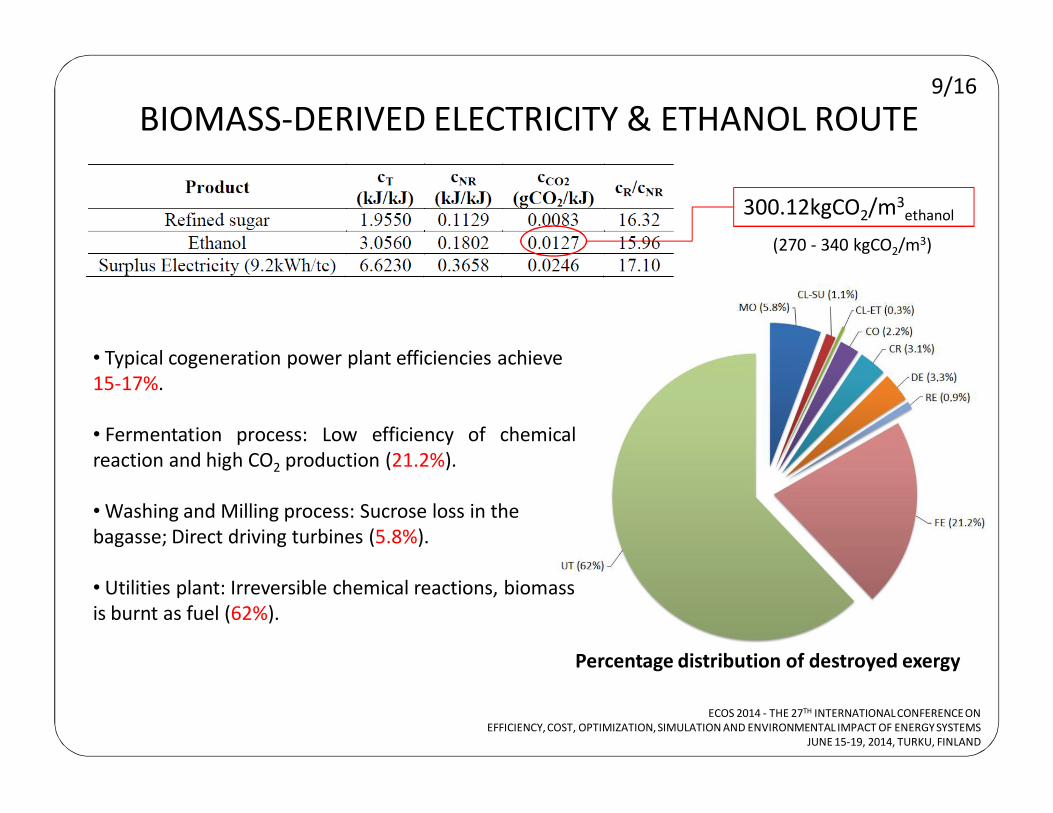
Percentage distribution of destroyed exergy
• Typical cogeneration power plant efficiencies achieve
15-17%.
• Fermentation process: Low efficiency of chemical
reaction and high CO2 production (21.2%).
• Washing and Milling process: Sucrose loss in the
bagasse; Direct driving turbines (5.8%).
• Utilities plant: Irreversible chemical reactions, biomass
is burnt as fuel (62%).
300.12kgCO2/m3ethanol
ECOS 2014 - THE 27TH INTERNATIONAL CONFERENCE ON
EFFICIENCY, COST, OPTIMIZATION, SIMULATION AND ENVIRONMENTAL IMPACT OF ENERGY SYSTEMS
JUNE 15-19, 2014, TURKU, FINLAND
(270 - 340 kgCO2/m3)
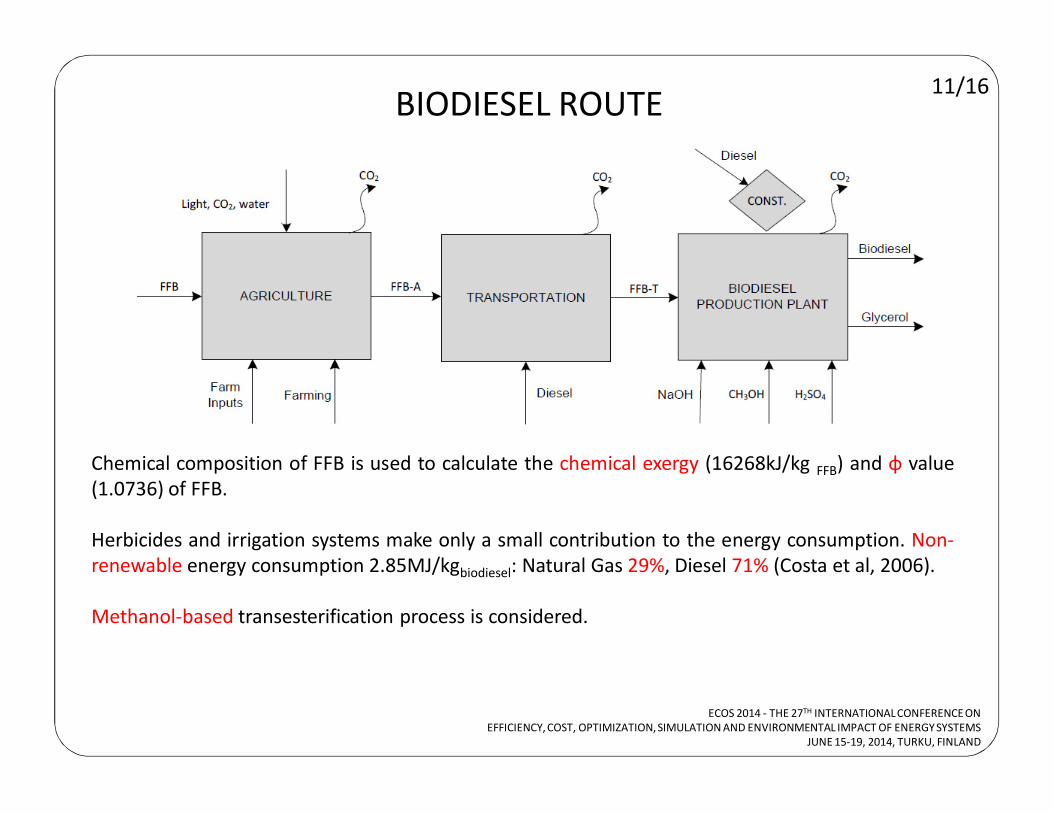
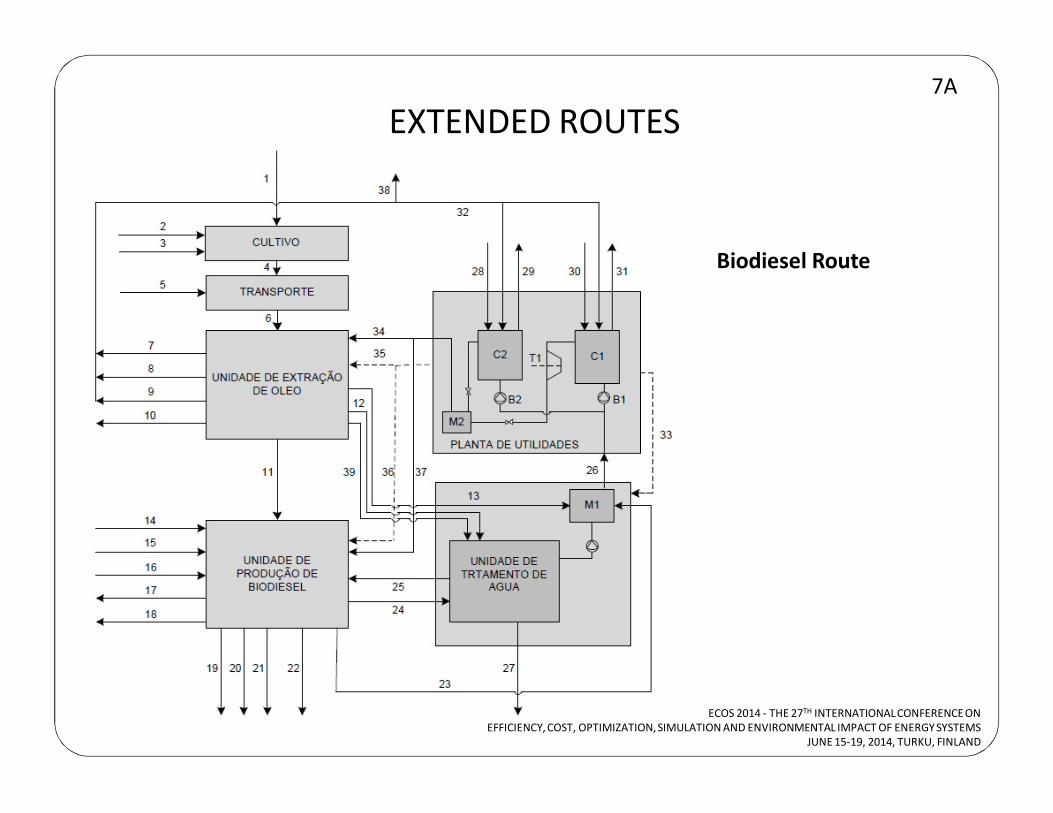
Chemical composition of FFB is used to calculate the chemical exergy (16268kJ/kg FFB) and φ value
(1.0736) of FFB.
Herbicides and irrigation systems make only a small contribution to the energy consumption. Non-
renewable energy consumption 2.85MJ/kgbiodiesel: Natural Gas 29%, Diesel 71% (Costa et al, 2006).
Methanol-based transesterification process is considered.
BIODIESEL ROUTE11/16
ECOS 2014 - THE 27TH INTERNATIONAL CONFERENCE ON
EFFICIENCY, COST, OPTIMIZATION, SIMULATION AND ENVIRONMENTAL IMPACT OF ENERGY SYSTEMS
JUNE 15-19, 2014, TURKU, FINLAND
BIODIESEL ROUTE12/16
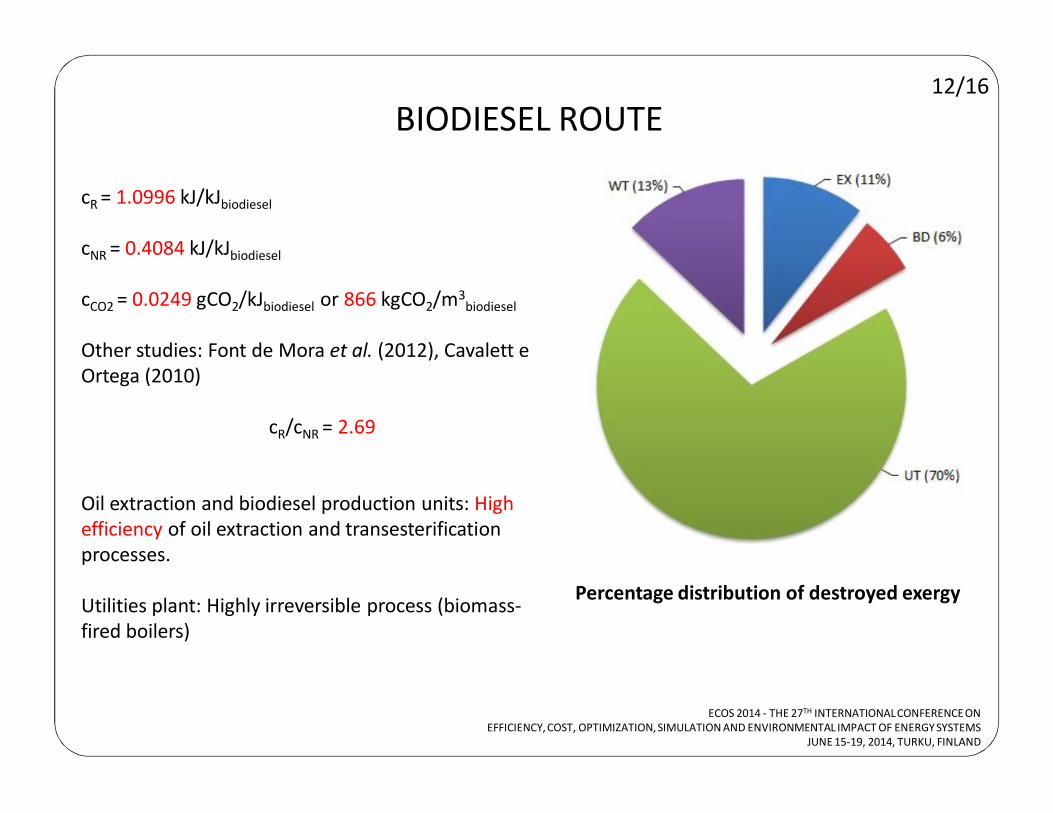
Percentage distribution of destroyed exergy
cR = 1.0996 kJ/kJbiodiesel
cNR = 0.4084 kJ/kJbiodiesel
cCO2 = 0.0249 gCO2/kJbiodiesel or 866 kgCO2/m3biodiesel
Other studies: Font de Mora et al. (2012), Cavalett e
Ortega (2010)
cR/cNR = 2.69
Oil extraction and biodiesel production units: High
efficiency of oil extraction and transesterification
processes.
Utilities plant: Highly irreversible process (biomass-
fired boilers)
ECOS 2014 - THE 27TH INTERNATIONAL CONFERENCE ON
EFFICIENCY, COST, OPTIMIZATION, SIMULATION AND ENVIRONMENTAL IMPACT OF ENERGY SYSTEMS
JUNE 15-19, 2014, TURKU, FINLAND
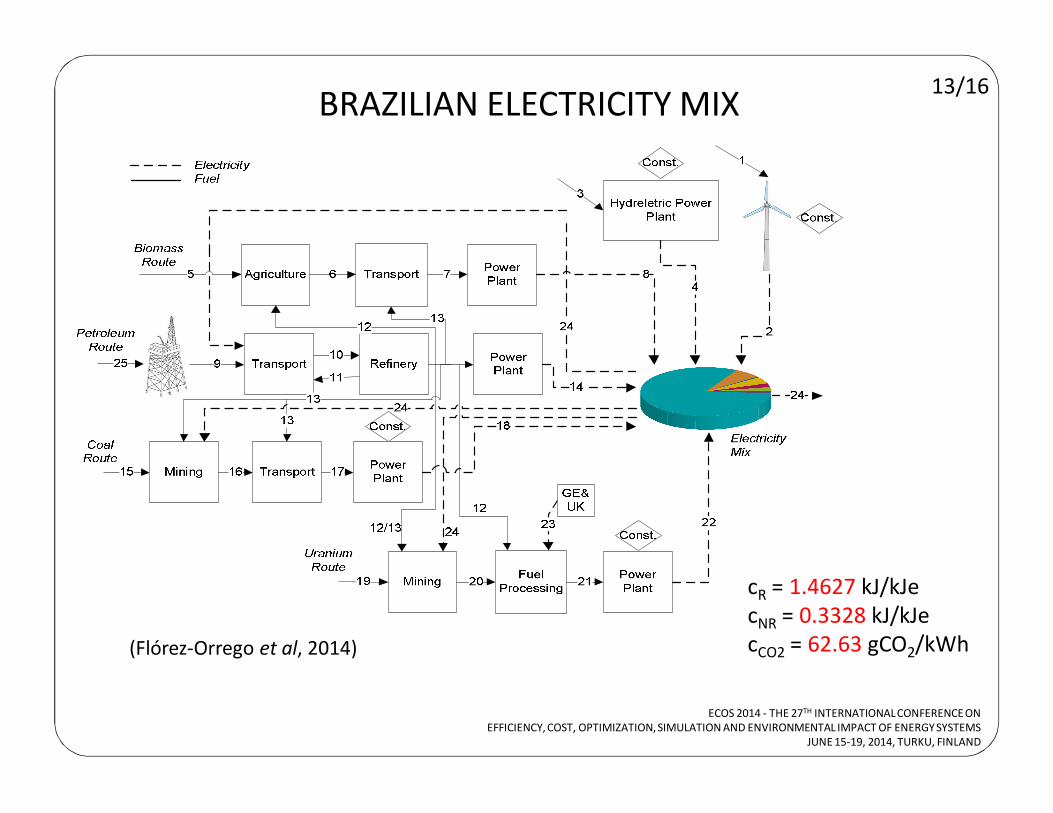
BRAZILIAN ELECTRICITY MIX
(Flórez-Orrego et al, 2014)
13/16
cR = 1.4627 kJ/kJe
cNR = 0.3328 kJ/kJe
cCO2 = 62.63 gCO2/kWh
ECOS 2014 - THE 27TH INTERNATIONAL CONFERENCE ON
EFFICIENCY, COST, OPTIMIZATION, SIMULATION AND ENVIRONMENTAL IMPACT OF ENERGY SYSTEMS
JUNE 15-19, 2014, TURKU, FINLAND
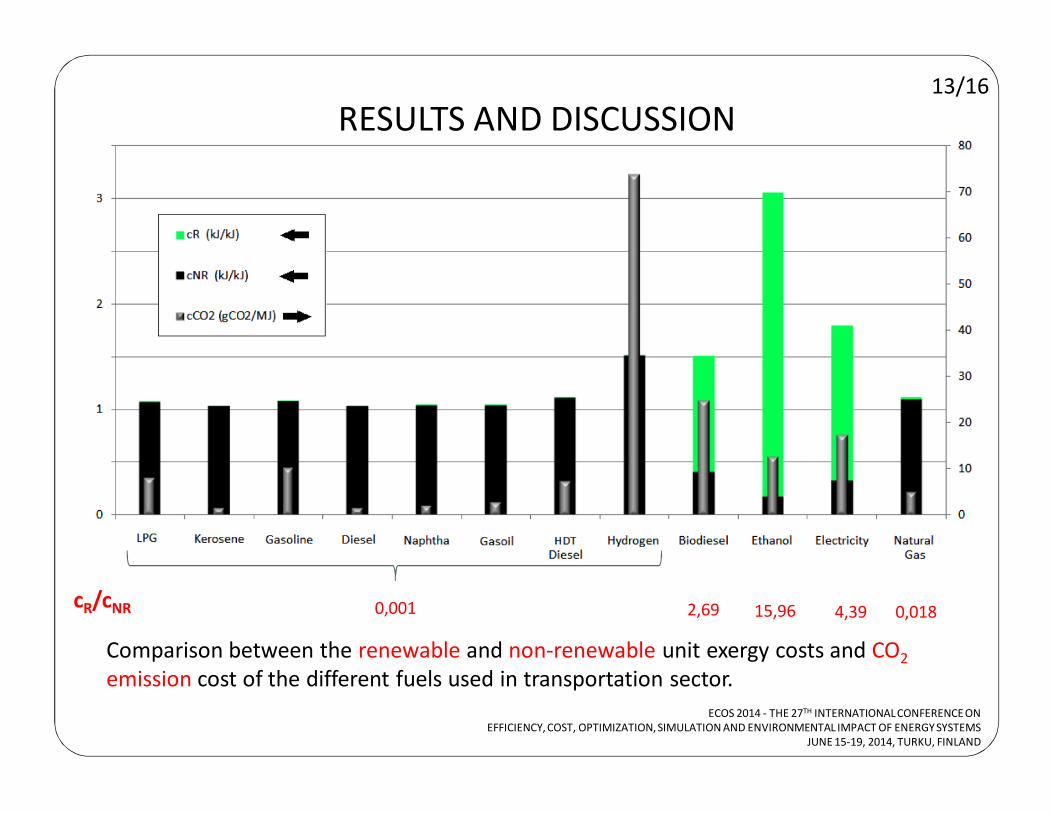
Comparison between the renewable and non-renewable unit exergy costs and CO2
emission cost of the different fuels used in transportation sector.
RESULTS AND DISCUSSION13/16
ECOS 2014 - THE 27TH INTERNATIONAL CONFERENCE ON
EFFICIENCY, COST, OPTIMIZATION, SIMULATION AND ENVIRONMENTAL IMPACT OF ENERGY SYSTEMS
JUNE 15-19, 2014, TURKU, FINLAND
0,001 2,69 15,96 4,39 0,018cR/cNR
CONCLUSIONS
• Fossil fuels require the lowest exergy investment for the entire production route. However, the
renewable fraction of invested exergy is almost negligible. CO2 emission cost will depend on the level
of processing of the fuel.
• Subsidies and governmental policies, higher efficiencies of cogeneration power plants and
defossilization of the exergy consumption at the upstream stages are required as renewable fuels
scale up. In this way, lower unit exergy costs and CO2 emissions could be achieved.
• The ratios between the renewable to non-renewable invested exergy (cR/cNR) are obtained as 2.69
for biodiesel, 4.39 for electricity, and 15.96 for ethanol.
• Regarding hydrogen used as a transport fuel, as far as it depends on fossil fuels for its production,
the cost-to-benefit and environmental impacts suggest that other fossil sources such as natural gas or
petroleum derivatives may accomplish a better performance.
14/16
ECOS 2014 - THE 27TH INTERNATIONAL CONFERENCE ON
EFFICIENCY, COST, OPTIMIZATION, SIMULATION AND ENVIRONMENTAL IMPACT OF ENERGY SYSTEMS
JUNE 15-19, 2014, TURKU, FINLAND
ACKNOWLEDGMENTS
National Agency of Petroleum, Natural Gas and Biofuels – ANP
National University of Colombia – Faculty of Mines
Brazilian National Research Council – CNPq
15/16
ECOS 2014 - THE 27TH INTERNATIONAL CONFERENCE ON
EFFICIENCY, COST, OPTIMIZATION, SIMULATION AND ENVIRONMENTAL IMPACT OF ENERGY SYSTEMS
JUNE 15-19, 2014, TURKU, FINLAND

THANKS FOR YOUR ATTENTION !!!
Kiitos huomiota
16/16
ECOS 2014 - THE 27TH INTERNATIONAL CONFERENCE ON
EFFICIENCY, COST, OPTIMIZATION, SIMULATION AND ENVIRONMENTAL IMPACT OF ENERGY SYSTEMS
JUNE 15-19, 2014, TURKU, FINLAND
EXTENDED ROUTES7A
ECOS 2014 - THE 27TH INTERNATIONAL CONFERENCE ON
EFFICIENCY, COST, OPTIMIZATION, SIMULATION AND ENVIRONMENTAL IMPACT OF ENERGY SYSTEMS
JUNE 15-19, 2014, TURKU, FINLAND
Biodiesel Route
EXTENDED ROUTES8A
ECOS 2014 - THE 27TH INTERNATIONAL CONFERENCE ON
EFFICIENCY, COST, OPTIMIZATION, SIMULATION AND ENVIRONMENTAL IMPACT OF ENERGY SYSTEMS
JUNE 15-19, 2014, TURKU, FINLAND
Petroleum Refinery
EXTENDED ROUTES9A
Combined Ethanol,
Sugar and Electricity
Production plant.