2016/6/16
1
Recent research on combustion and NOx reduction at Donghua University
Dr. Prof. Yaxin Su
School of Environmental Science and Engineering,
Donghua University
2016.6.24
Report at Institute of Chemical Processing of Coal, Poland, 2016.6.24
1. Introduction
Before going to the academic topics, I’d like to show you where Donghua University locates and what Donghua looks like.
2016/6/16
2
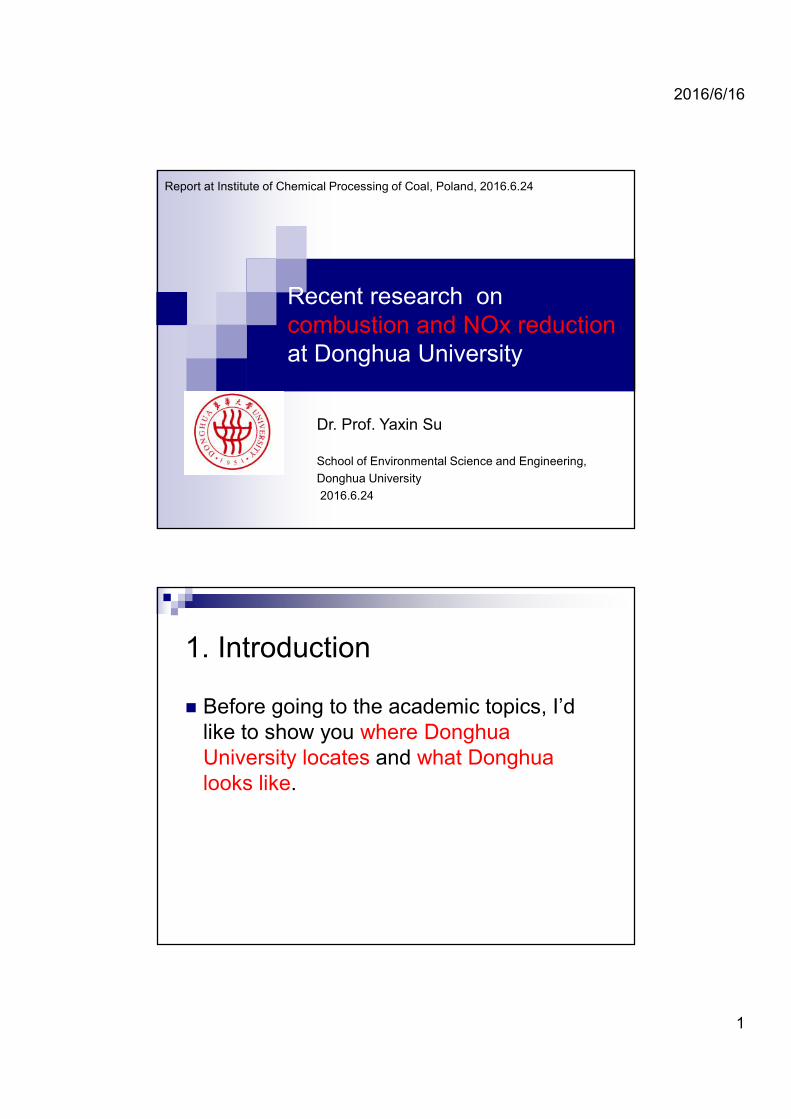
1.1 Location of Shanghai in China
Qinlin Moutains-Huaihe River
Changjiang River
1.2a City view of Shanghai

2016/6/16
3
1.2b City view of Shanghai
492m,2008
632m,2016.3.12
420.5m,1999
1.2c City view of Shanghai
2016/6/16
4
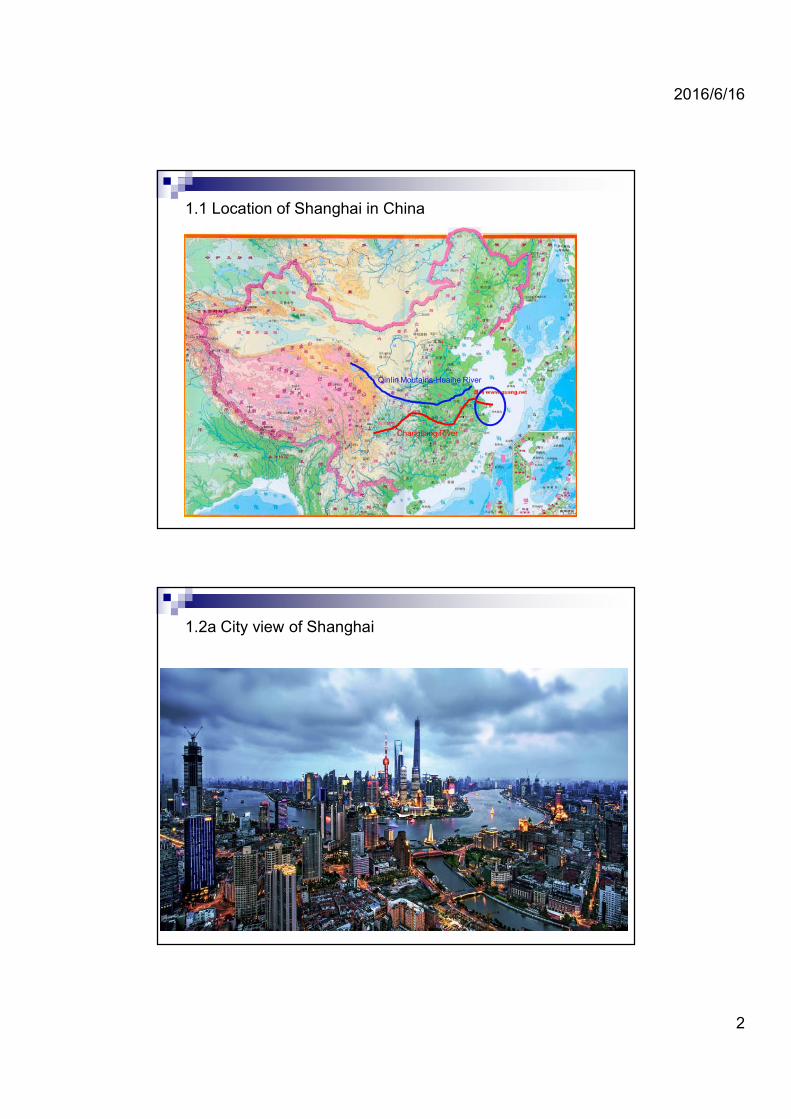
1.2d City view of Shanghai
The 1st maglev train in the world
Max Speed:430 km/h,
Length: 29.863 km
Run since 2002.12.31
From Pudong International airport to the Metro Line 2 at Longyang Road
1.3 Some basic data of Shanghai
Shanghai covers about 6340 km2 with a population 24.1527 millions (2015)
GDP per capita is 103100 CNY, about 14900 US $( 2015)
Human Development Index is 0.9
Metro line: 617km
2 Airport, 3 main railway stations and 6 minor railway stations
GDP: No. 1 in China and No. 2 in Asia (2014)
Shanghai port cargo handling capacity and container throughput : No. 1 in the world in 2014
41 universities and 25 colleges
59 Institutions authorized to provide graduate degrees (MS, PhD)
2016/6/16
5
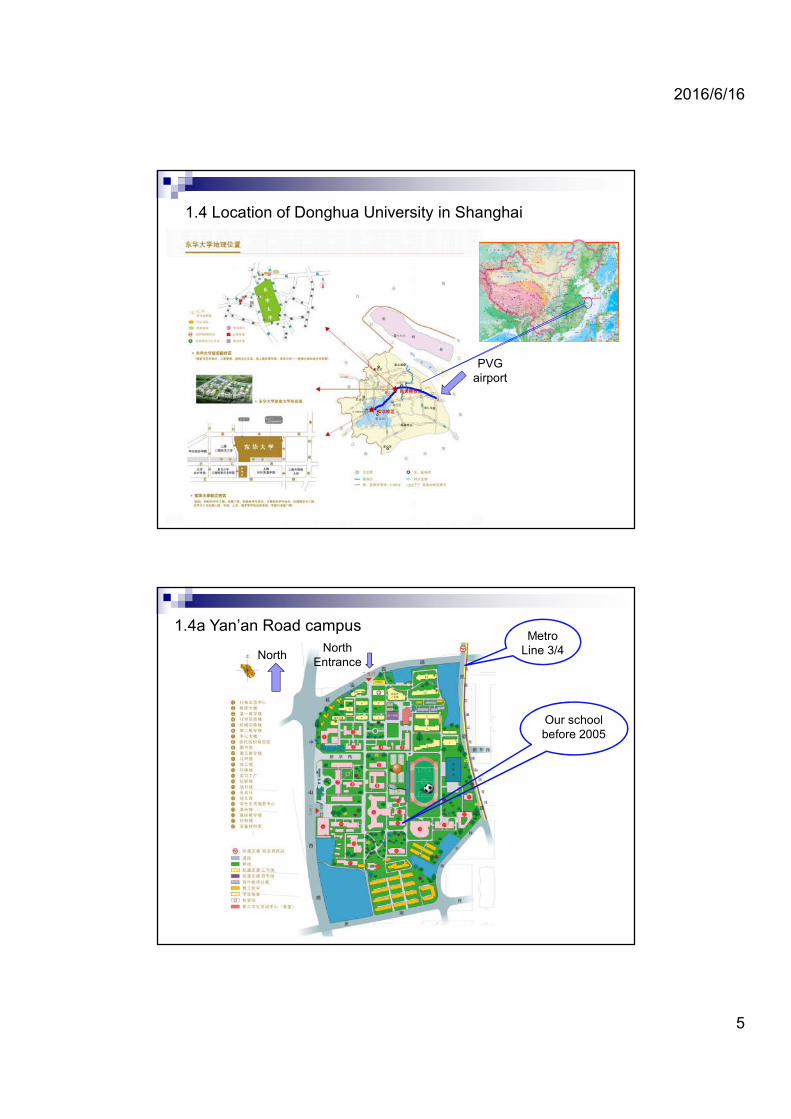
1.4 Location of Donghua University in Shanghai
PVG airport
1.4a Yan’an Road campusMetro
Line 3/4NorthNorth
Entrance
Our school before 2005
2016/6/16
6
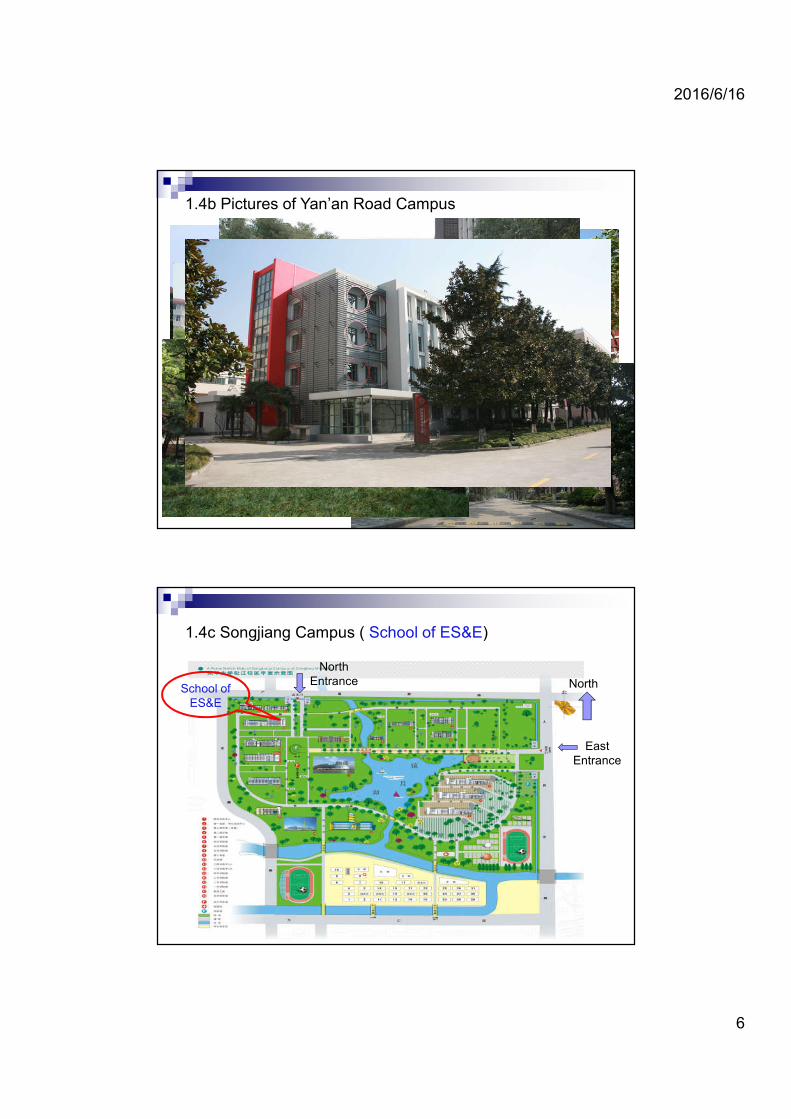
1.4b Pictures of Yan’an Road Campus
1.4c Songjiang Campus ( School of ES&E)
North
East Entrance
North Entrance
School of ES&E
2016/6/16
7
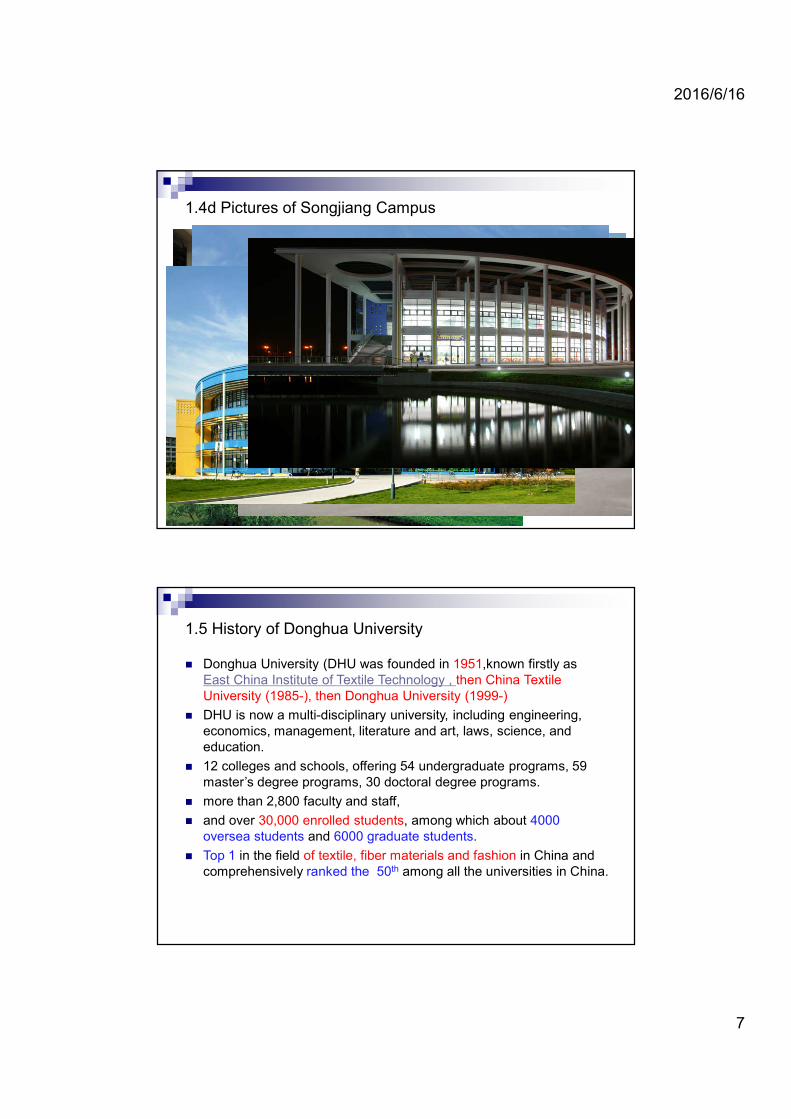
1.4d Pictures of Songjiang Campus
1.5 History of Donghua University
Donghua University (DHU was founded in 1951,known firstly as East China Institute of Textile Technology , then China Textile University (1985-), then Donghua University (1999-)
DHU is now a multi-disciplinary university, including engineering, economics, management, literature and art, laws, science, and education.
12 colleges and schools, offering 54 undergraduate programs, 59 master’s degree programs, 30 doctoral degree programs.
more than 2,800 faculty and staff,
and over 30,000 enrolled students, among which about 4000 oversea students and 6000 graduate students.
Top 1 in the field of textile, fiber materials and fashion in China and comprehensively ranked the 50th among all the universities in China.

2016/6/16
8
History of Donghua University
Back
A video by an International student—Shanghai in my eyes
http://english.dhu.edu.cn/_s126/7b/dd/c5178a97245/page.psp
2016/6/16
9
2. Combustion related research: Completed and going-on
CFB combustion Desulfur, deNOx model in furnace; Heat transfer in furnace; Cyclone separator;
HiTAC( High Temperature Air Combustion) Multi-jet burners; Swirling burners;
NOx reduction by reburning
Mixed fuels based on common wastes, e.g., tires, biomass and lignite ash, biomass ash and iron oxides;
by HC, like CH4,C2H6,C3H8,etc, over iron/iron oxides by HC over iron-based supported catalysts
CO2 capture Sludge pyrolysis and combustion
2.1.1 High Temperature Air Combustion (HiTAC)
Also known as MILD(Moderate and Intensive Low-oxygen Dilution), Flameless Oxidation – FLOX
Advantages: Significantly increased thermal efficiency by recovering the heat
from exhaust flue gases with regenerative system to preheat the combsution air to , e.g., above 1000 C;
Very low NO emission by controlling the O2 in preheated air, e.g., as low as 2%-5 vol. %;
methods of realization of HiTAC Burners- the most important device;
Support combustion with low O2
Regenerative system: ceramic honeycomb Recover waste heat from flue gas
For industrial application and furnace design, the jet parameters and burner configuration are very critical for a good combustion in the furnace.

2016/6/16
10
2.1.2 Burners of HiTAC
Basically, two types of burners used in industrya. the combustion air is provided by a central, strong (high-momentum)
air jet that is surrounded by a number of weak (low-momentum) fuel jets (in industrial applications typically two jets are used).
b. a central fuel jet and a number of air jets positioned in the relative vicinity of the central fuel jet—recognized in the literature as a “classical” method of achieving flameless combustion
Fuel jet
Preheated air jet
2.1.3 Burners developed in our lab
Multi-jets burner
Swirling burner
furnace
Swirling burner
fuel
air
air
fuel
Multi-jets burners
one circular fuel jet in the center surrounded by 5 circular air jets distributed equably according to the air straddle angle, , an inclined angle of the fuel jet,
D
L
2016/6/16
11
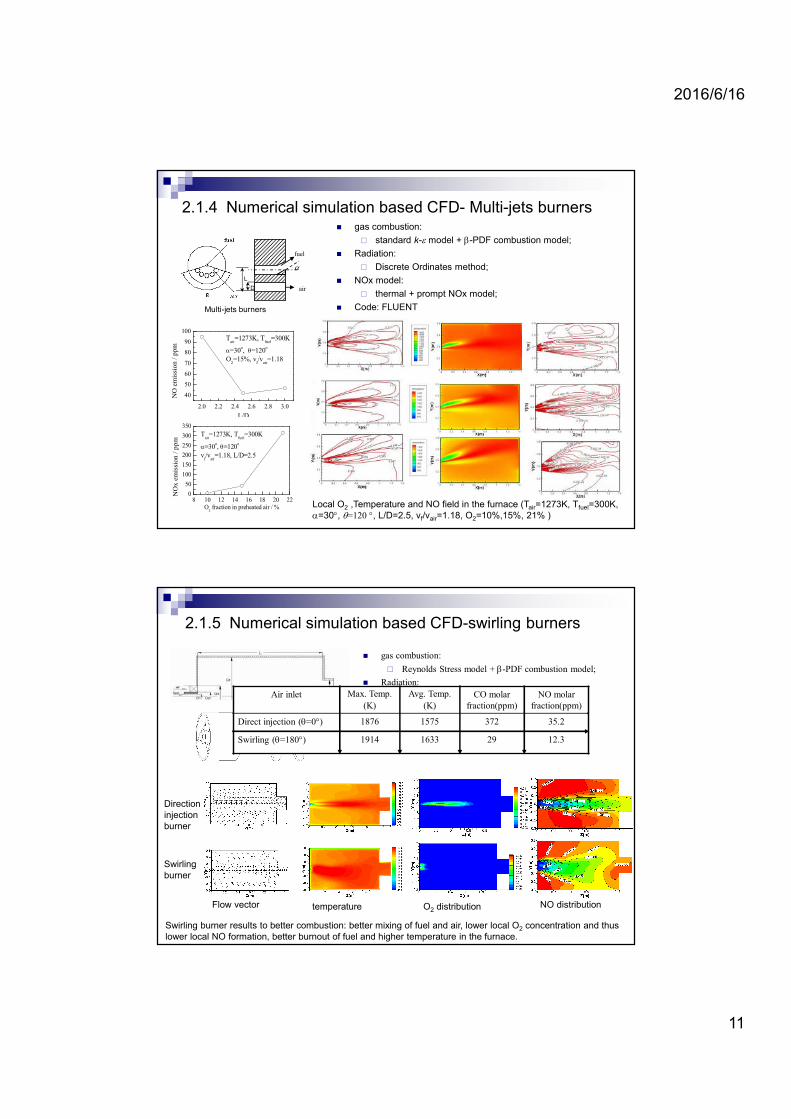
2.1.4 Numerical simulation based CFD- Multi-jets burners gas combustion:
standard k- model + -PDF combustion model;
Radiation:
Discrete Ordinates method;
NOx model:
thermal + prompt NOx model;
Code: FLUENT
Local O2 ,Temperature and NO field in the furnace (Tair=1273K, Tfuel=300K, =30, =120 , L/D=2.5, vf/vair=1.18, O2=10%,15%, 21% )
8 10 12 14 16 18 20 220
50
100
150
200
250
300
350
Tair
=1273K, Tfuel
=300K
=30o, =120
o
vf/v
air=1.18, L/D=2.5
NO
x e
mis
sio
n /
pp
m
O2 fraction in preheated air / %
2.0 2.2 2.4 2.6 2.8 3.0
40
50
60
70
80
90
100T
air=1273K, T
fuel=300K
=30o, =120
o
O2=15%, v
f/v
air=1.18
NO
em
issi
on /
ppm
L/D
air
fuel
Multi-jets burners
D
L
2.1.5 Numerical simulation based CFD-swirling burners
gas combustion:
Reynolds Stress model + -PDF combustion model;
Radiation:
Discrete Ordinates method;
NOx model:
thermal + prompt NOx model;
Code: FLUENT
Direction injection burner
Swirling burner
Flow vector temperature O2 distribution NO distribution
Air inlet Max. Temp.
(K)
Avg. Temp.
(K)CO molar
fraction(ppm)NO molar
fraction(ppm)
Direct injection (=0) 1876 1575 372 35.2
Swirling (=180) 1914 1633 29 12.3
Swirling burner results to better combustion: better mixing of fuel and air, lower local O2 concentration and thus lower local NO formation, better burnout of fuel and higher temperature in the furnace.
2016/6/16
12
2.1.6 Papers and patents on HTAC
2 China patents authorized;
10 Chinese Journal papers;
12 International Conference proceeding papers;
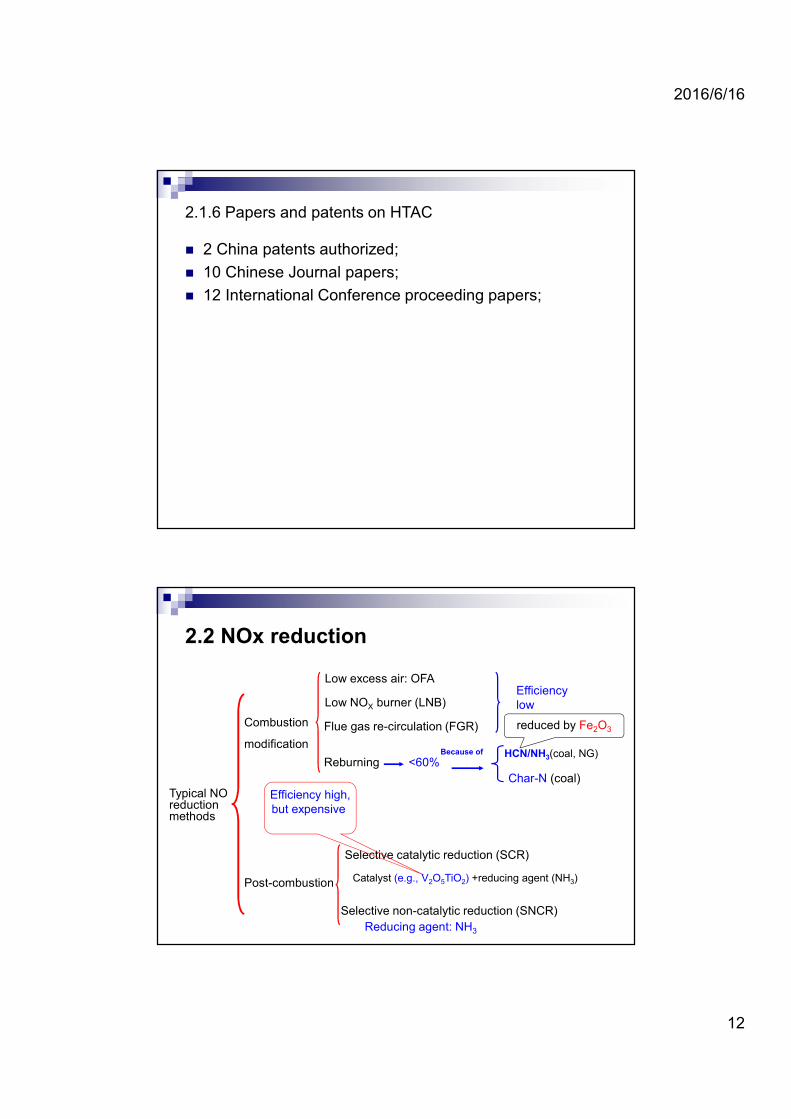
2.2 NOx reduction
Typical NO reduction methods
Post-combustion
Selective catalytic reduction (SCR)
Selective non-catalytic reduction (SNCR)
Reducing agent: NH3
Efficiency high, but expensive
Combustion
modification
Low excess air: OFA
Low NOX burner (LNB)
Flue gas re-circulation (FGR)
Efficiency low
Reburning <60%Because of HCN/NH3(coal, NG)
Char-N (coal)
reduced by Fe2O3
Catalyst (e.g., V2O5TiO2) +reducing agent (NH3)
2016/6/16
13
2.2 our recent work on NOx reduction
We did the following researches on NO reduction since 2010. by reburning
Mixed fuels based on common wastes, e.g., tires, biomass and lignite ash, biomass ash and iron oxides;
by HC, e.g., CH4,C2H6,C3H8,etc, over iron/iron oxides by HC over iron-based supported catalysts
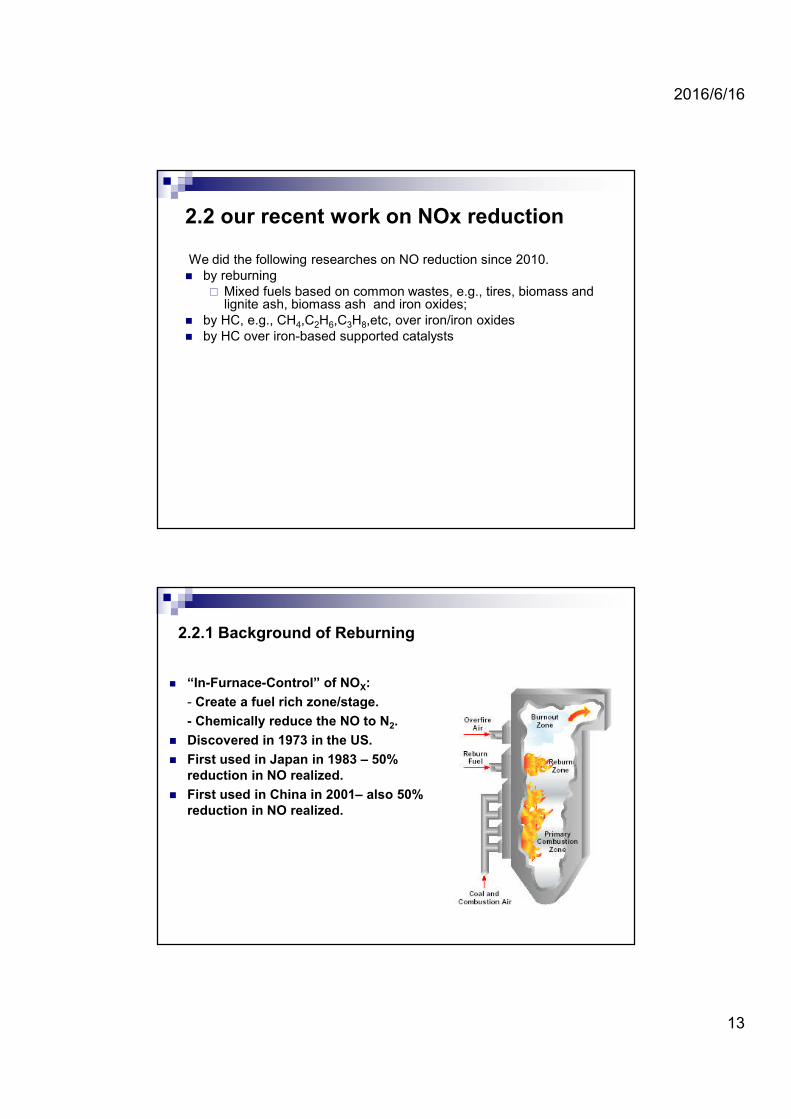
2.2.1 Background of Reburning
“In-Furnace-Control” of NOX:
- Create a fuel rich zone/stage.
- Chemically reduce the NO to N2.
Discovered in 1973 in the US.
First used in Japan in 1983 – 50% reduction in NO realized.
First used in China in 2001– also 50% reduction in NO realized.
2016/6/16
14
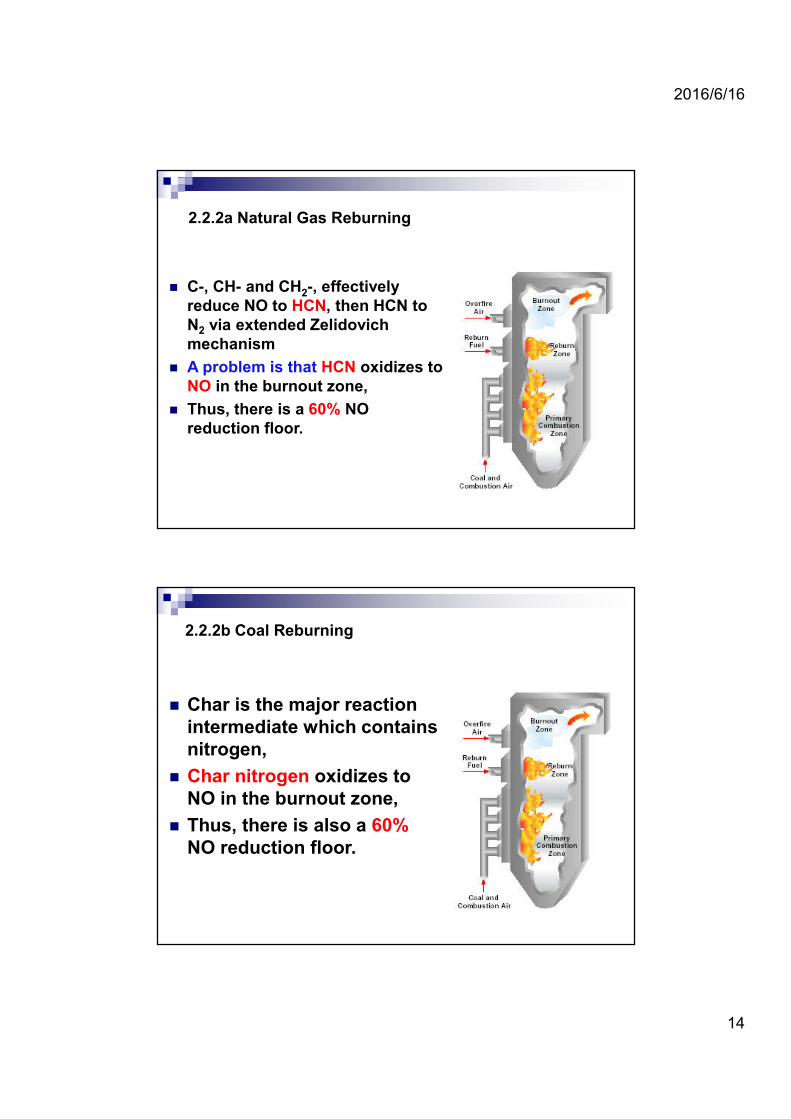
2.2.2a Natural Gas Reburning
C-, CH- and CH2-, effectively reduce NO to HCN, then HCN to N2 via extended Zelidovich mechanism
A problem is that HCN oxidizes to NO in the burnout zone,
Thus, there is a 60% NO reduction floor.
2.2.2b Coal Reburning
Char is the major reaction intermediate which contains nitrogen,
Char nitrogen oxidizes to NO in the burnout zone,
Thus, there is also a 60%NO reduction floor.
2016/6/16
15
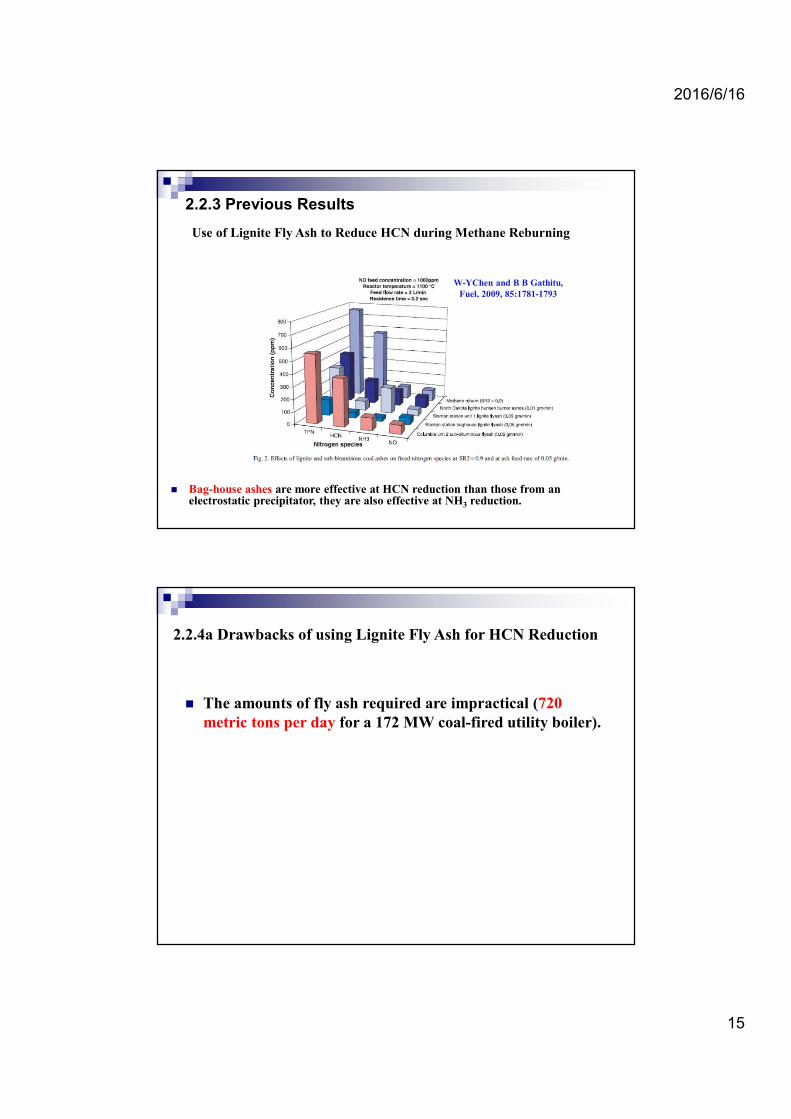
2.2.3 Previous Results
Use of Lignite Fly Ash to Reduce HCN during Methane Reburning
Bag-house ashes are more effective at HCN reduction than those from an electrostatic precipitator, they are also effective at NH3 reduction.
W-YChen and B B Gathitu, Fuel, 2009, 85:1781-1793
2.2.4a Drawbacks of using Lignite Fly Ash for HCN Reduction
The amounts of fly ash required are impractical (720 metric tons per day for a 172 MW coal-fired utility boiler).

2016/6/16
16
2.2.4b Substitutes Lignite Fly Ash
Substitute for lignite fly ash: Required quantities should be reasonable.
It should not impact boiler performance adversely i.e. slagging and fouling.
Iron oxides selected as lignite fly ash substitute after critical review of literature.
2.2.5 NOx reduction by mixed fuels Reburning
We proposed mixed fuels based on several widely available wastes and demonstrated a NO reduction efficiency of more than 85% after burnout, which made it more competitive than currently preferred technologies such as SCR.
The major contribution is that a method to control reburning intermediates, HCN/NH3 was recognized.
2016/6/16
17
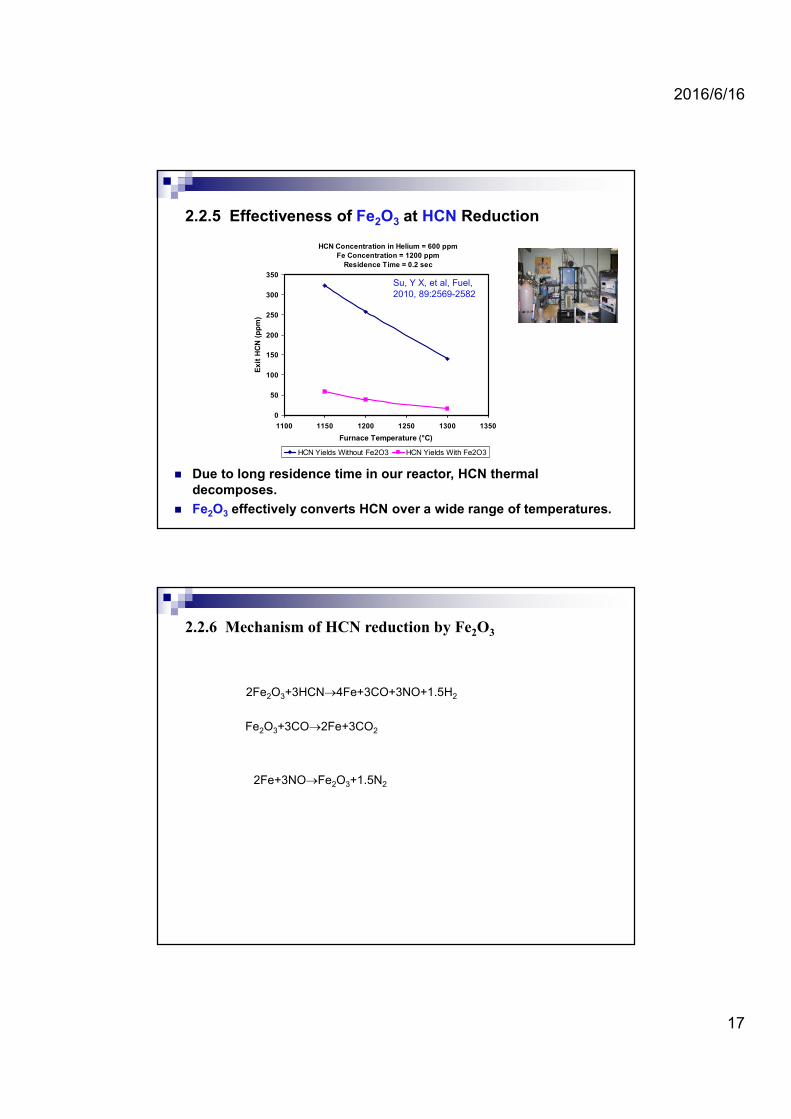
2.2.5 Effectiveness of Fe2O3 at HCN Reduction
Due to long residence time in our reactor, HCN thermal decomposes.
Fe2O3 effectively converts HCN over a wide range of temperatures.
HCN Concentration in Helium = 600 ppm
Fe Concentration = 1200 ppm
Residence Time = 0.2 sec
0
50
100
150
200
250
300
350
1100 1150 1200 1250 1300 1350
Furnace Temperature (°C)
Exit
HC
N (
pp
m)
HCN Yields Without Fe2O3 HCN Yields With Fe2O3
Su, Y X, et al, Fuel, 2010, 89:2569-2582
2.2.6 Mechanism of HCN reduction by Fe2O3
Fe2O3+3CO2Fe+3CO2
2Fe+3NOFe2O3+1.5N2
2Fe2O3+3HCN4Fe+3CO+3NO+1.5H2
2016/6/16
18
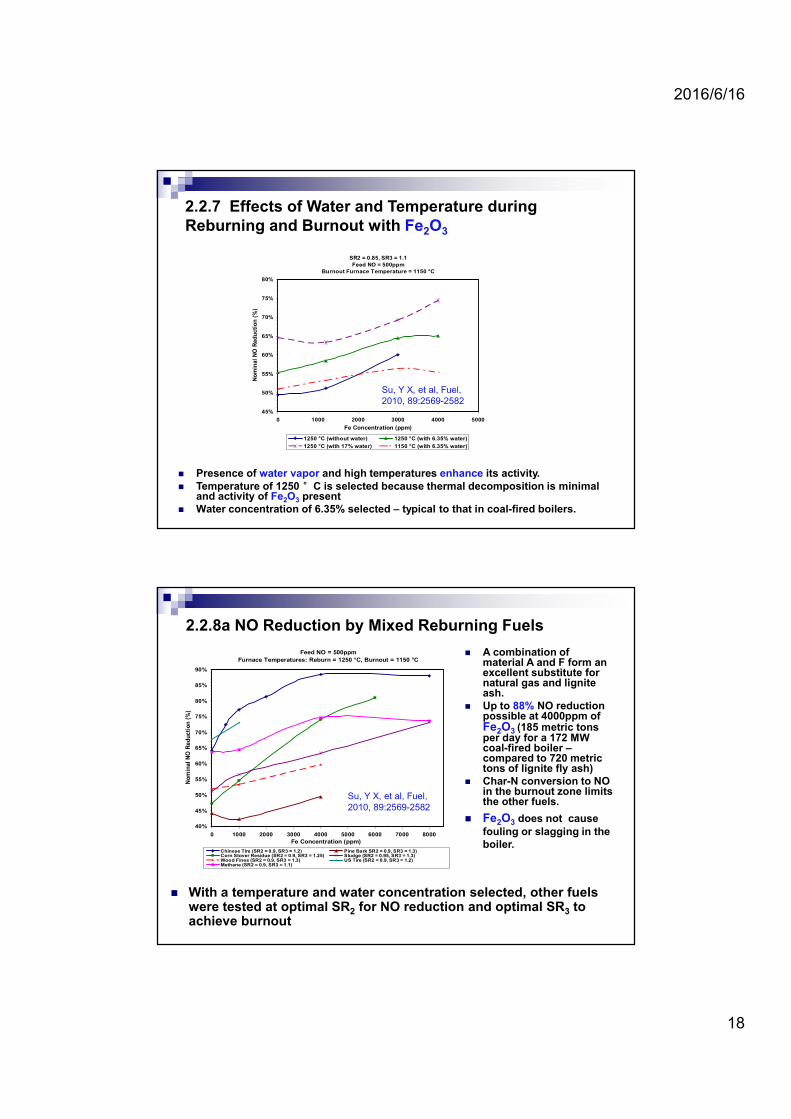
2.2.7 Effects of Water and Temperature during Reburning and Burnout with Fe2O3
Presence of water vapor and high temperatures enhance its activity. Temperature of 1250 °C is selected because thermal decomposition is minimal
and activity of Fe2O3 present Water concentration of 6.35% selected – typical to that in coal-fired boilers.
SR2 = 0.85, SR3 = 1.1
Feed NO = 500ppmBurnout Furnace Temperature = 1150 °C
45%
50%
55%
60%
65%
70%
75%
80%
0 1000 2000 3000 4000 5000
Fe Concentration (ppm)
No
min
al
NO
Red
ucti
on
(%
)
1250 °C (without water) 1250 °C (with 6.35% water)
1250 °C (with 17% water) 1150 °C (with 6.35% water)
Su, Y X, et al, Fuel, 2010, 89:2569-2582
2.2.8a NO Reduction by Mixed Reburning Fuels
With a temperature and water concentration selected, other fuels were tested at optimal SR2 for NO reduction and optimal SR3 to achieve burnout
Feed NO = 500ppm
Furnace Temperatures: Reburn = 1250 °C, Burnout = 1150 °C
40%
45%
50%
55%
60%
65%
70%
75%
80%
85%
90%
0 1000 2000 3000 4000 5000 6000 7000 8000
Fe Concentration (ppm)
No
min
al
NO
Red
ucti
on
(%
)
Chinese Tire (SR2 = 0.9, SR3 = 1.2) Pine Bark SR2 = 0.9, SR3 = 1.3)Corn Stover Residue (SR2 = 0.9, SR3 = 1.25) Sludge (SR2 = 0.95, SR3 = 1.3)Wood Fines (SR2 = 0.9, SR3 = 1.3) US Tire (SR2 = 0.9, SR3 = 1.2)Methane (SR2 = 0.9, SR3 = 1.1)
A combination of material A and F form an excellent substitute for natural gas and lignite ash.
Up to 88% NO reduction possible at 4000ppm of Fe2O3 (185 metric tons per day for a 172 MW coal-fired boiler –compared to 720 metric tons of lignite fly ash)
Char-N conversion to NO in the burnout zone limits the other fuels.
Fe2O3 does not cause fouling or slagging in the boiler.
Su, Y X, et al, Fuel, 2010, 89:2569-2582

2016/6/16
19
2.2.8b NO Reduction by Mixed Reburning Fuels
Feed NO = 500ppm
Furnace Temperatures: Reburn = 1250 °C, Burnout = 1150 °C
60%
65%
70%
75%
80%
85%
90%
0 1000 2000 3000 4000 5000 6000 7000 8000
Fe Concentration (ppm)
No
min
al
NO
Re
du
cti
on
(%
)
Chinese Tire with Mill Scale (SR2 = 0.9, SR3 = 1.2) Methane with Mill Scale (SR2 = 0.9, SR3 = 1.1)
Chinese Tire with Sea Nodules (SR2 = 0.9, SR3 = 1.2) Methane with Sea Nodules (SR2 = 0.9, SR3 = 1.1)
Effects of mill scale and sea nodules on NO reduction efficiencies of tire and methane as reburning fuels during two-stage tests.
A mixture of tire and mill scale can achieve up to 82% NO reduction, while tire and sea nodules can achieve 78% NO reduction. Mill scale contains 90 % Fe2O3 while sea nodules contain only 20% Fe2O3 making mill scale the better option.
Su, Y X, et al, Fuel, 2010, 89:2569-2582
At present, there is a great incentive to use natural gas or other hydrocarbons as reductant in stationary SCR units rather than NH3, because of:
In many new power plants, NG is commonly used as fuel and is readily available;
NH3 is more expensive, requires special handling and storage and needs a sophisticated metering system to avoid NH3 slip.
We recently experimentally demonstrated that methane could effectively reduce NO over iron/ iron oxides.
2.3 NOx reduction by iron with HC

2016/6/16
20
2.3.1 First work on NO reduction by iron
B. Gradon & J. Lasek,Fuel 89 (2010) 3505–3509
NO molar fractions measured in the gas leaving the reactor in function of time: temperature 850 C, gas mixture 1015 ppm NO/N2, four iron samples of surface area 1.2110-3 m2, gas stream 9.54 10-4 mol/s.
Influence of vary oxygen molar fractions in the reacting gas on the NO reduction efficiency at temperature 850 C and average iron surface area1.16 10-3 m2.
Iron ball of diameter of 10mm as iron sample
We continued and improved the work.
2.3.2 our further work--Experimental setup
Length
Wid
th
6mm6mm
Iron mesh Mesh roll
Fig. 2 Iron mesh roll
Iron mesh roll
Electrically heat furnace
Reactor tube
Simulated flue gas
To analyzer
Fig 1 Experimental setup
simulated flue gas consisting 0.05% NO in nitrogen base,flow rate:1.5 L/min
ceramic tube of inner diameter of 2.5 cm
online analyzer (ECOM-J2KN, Germany)
iron mesh size160mm×80mm
80mm×80mm
160mm×40mm
Reacting time0.13s0.13s0.06s

2016/6/16
21
2.3.3 Results and discussion
2.1 Reduction of NO by iron.
20
40
60
80
100
300 600 900 1200
temperature (°C)
Eff
icie
ncy
(%
)
160mm x 80mm
80mm x 80mm
160mm x 40mm
Reacting time0.13s0.13s0.06s
4 0 5 0 6 0 7 0 8 0 9 00
5 0 0
1 0 0 0
1 5 0 0
2 0 0 0
T w o - T h e ta ( d e g )
F e
F e ,N i
XRD results of the original iron
XRD results of the iron after reaction with NOin N2 atmosphere (1100 C)
3 0 4 0 5 0 6 0 7 0 8 0 9 0 1 0 0 1 1 0 1 2 00
5 0 0
1 0 0 0
1 5 0 0
2 0 0 0
2 5 0 0
T w o -T h e ta ( d e g )
F e
F e + 2 F e 2 + 3 O 4
F e 2 O 3
2x yFe NO Fe O N
2.3.3 Results and discussion
2.3.3.1 Reduction of NO by iron
0 10 20 30 40 50 60 70
20
40
60
80
100
NO
red
ucti
on /
%
durable time /hr
durable reduction of NO by metallic iron in N2 atmosphere (flow rate 1.5L/min, NO=0.05in N2 base at 800 C)
10 20 30 40 50 60 70 80 900
500
1000
1500
2000
Fe2O3
Fe+2
Fe2+3
O4
Inte
nsit
y(C
PS
)
2()
XRD pattern of iron oxides after durable reaction
Fe could reduce NO to N2, while it is oxidized to FexOy( finally Fe2O3), resulting to decreased NO reduction. Therefore, a reducing agent should be added to reduce iron oxides to iron in order to keep the reaction. CO and CH4 were used as reducing agents and NO reduction was tested respectively in simulated flue gas. The iron oxides after the above durable test was used as iron oxides in the following test.

2016/6/16
22
2.3.3 Results and discussion
2. 3.3.2 Reduction of NO by iron + CO/CH4
0
20
40
60
80
100
0 20 40 60 80 100
durable t ime, hr
NO
red
uct
ion
, %
stop CO and feed 1.17% CH4
Durable reaction of NO reduction by CO/CH4 over iron oxides in simulated flue gas (O2: 2.0%, CO2: 16.8%, NO: 524ppm in N2
base) at 1000 C
10 20 30 40 50 60 70 80 900
500
1000
1500
2000
2500
3000
3500
FeO
+ Fe+2
Fe2
+3O4
+
+
++++
++
++
++
+Inte
nsit
y(C
PS
)
2()
+
XRD pattern of iron oxides after durable reaction with CH4 and NO at 1000 C
Very good NO reduction when CH4 was used as reducing agent over iron oxides. Iron oxides( Fe2O3) was partly reduced ( Fe3+ Fe2+)
Further test was conducted in N2 atmosphere to find out the mechanism.
2.3.3 Results and discussion 2.3.3.2 Reduction of NO by CH4 over iron oxides
2 0 0 3 0 0 4 0 0 5 0 0 6 0 0 7 0 0 8 0 0 9 0 0 1 0 0 0 1 1 0 00
2 0
4 0
6 0
8 0
1 0 0
NO reduction/
%
T e m p e r a t u r e /℃
NO reduction by methane over iron oxides (flow rate 1.5L/min, CH4=1.17%, NO=0.05% in N2 base)
2 00 300 400 50 0 600 7 00 80 0 900 1 000 11000
100 0
200 0
300 0
400 0
500 0
600 0
Exit
CO
/ p
pm
Temperature/℃
C H4=1.17%
CO formation (flow rate 1.5L/min, CH4=1.17%, NO=0.05% in N2 base)
10 20 30 40 50 60 70 80 90
0
200
400
600
800
1000
6
88
6
8
6
8
8
8 FeO
6 FeFe2O3
Fe+2
Fe2
+3O4
Inte
nsit
y(C
PS
)
2()
XRD pattern of iron oxides after reaction (flow rate 1.5L/min, CH4=1.17%, NO=0.05% in N2 base, 1050C)
SEM image of iron oxides after reaction (flow rate 1.5L/min, CH4=1.17%, NO=0.05% in N2 base, 1050C)
CO formed
Iron oxides reduced to iron
Carbon formed

2016/6/16
23
2.3.3 Results and discussion 2.3.3.3 mechanism of NO reduction by methane over iron oxides
The mechanism was rather complex and includes the following paths:
NO reduction by methane via reburning
Iron oxides reduction to iron by methane
NO reduction by iron
2.3.3 Results and discussion 2.3.3.3 mechanism of NO reduction by methane over iron oxides
NO reduction by methane via reburning
In fuel rich conditions, methane could reduce NO through reburning mechanism with the following basic route
HCNNOCH i (R1)
Then HCN was reduced to N2 according to the extended reverse Zeldovich reactions:
HNCO OHCN
CONHHNCO
2HN HNH
ON NON 2
(R2)
(R3)
(R4)
(R5)
Fe2O3 could reduce HCN:
2 3 2 23 2 3 1.5 1.5Fe O HCN Fe CO N H R(6)
Discussion:
Reburning needs O radical, as showed in (R2). Iron oxides could provide lattice oxygen to make reburning happen. However, in N2 atmosphere, O radical provided by iron oxides is not enough to make reburning the dominant mechanism. However, in real condition where there is O2 in the flue gas, reburning happens.

2016/6/16
24
2.3.3 Results and discussion
-600
-500
-400
-300
-200
-100
0
100
200
300
300 500 700 900
Temperature/ oC
△G
R10 R11 R12
R13 R14 R15
2.3.3.3 mechanism of NO reduction by methane over iron oxides
Iron oxides reduction to iron by methane
The lattice oxygen provided by iron oxides (Fe2O3 and Fe3O4) at high temperature could partially oxidize methane to
CO/CO2 and the iron oxides would be reduced to metallic iron at the same time by methane above 570 C according to
the sequence Fe2O3 Fe3O4 FeOFe.
Main reactions:
2 3 4 3 4 23 ( ) 2 ( ) 2 ( )Fe O CH g Fe O CO g H g
3 4 4 2( ) 3 ( ) 2 ( )Fe O CH g FeO CO g H g
4 2( ) ( ) 2 ( )FeO CH g Fe CO g H g
(R10)
(R(11)
(R12)
Secondary reactions:
2 3 4 3 4 2 212 ( ) 8 ( ) 2 ( )Fe O CH g Fe O CO g H O g
3 4 4 2 24 ( ) 12 ( ) 2 ( )Fe O CH g FeO CO g H O g
4 2 24 ( ) 4 ( ) 2 ( )FeO CH g Fe CO g H O g
(R13)
(R(14)
(R15)
100
150
200
250
300
350
400
450
500
300 500 700 900
Temperature/ oC
△H
R10 R11 R12
R13 R14 R15
changes of the thermodynamics Gibbs free energy, G, and the reaction heat, H
1
2
3
CO formed during the reaction of iron oxides with methane. CO /H2 will further react with iron oxides and reduce iron oxides to iron.
In addition, methane will decompose to C and H2 at high temperature:
2.3.3 Results and discussion 2.3.3.3 mechanism of NO reduction by methane over iron oxides
Iron oxides reduction to iron by methane
4 2( ) 2 ( )CH g C H g
The cracking reaction of methane begins at 550C, but it goes on very slowly at 600-850 C and no more than 3.4% methane could decompose below 850C .
The carbon due to the decomposition of methane was very active and reacted with iron oxides immediately to reduce iron oxides to metallic iron :
2 3 21.5 2 1.5Fe O C Fe CO

2016/6/16
25
2.3.3 Results and discussion 2.3.3.3 mechanism of NO reduction by methane over iron oxides
NO reduction by iron
2 3 22 3 1.5Fe NO Fe O N
Since iron oxides will be reduced to iron by methane during the reaction and then iron will reduce NO to N2 while iron will be oxidized to iron oxides, the NO reductions will be the same whether iron or iron oxides is used when methane is the reductant.
2.3.3.4 NO reduction by methane over iron oxides in flue gas atmosphere
2.3.3 Results and discussion
1
2
3
7
3 8
456
Experimental setup1: gas sources; 2-flow meter; 3- ceramic tube; 4: iron/iron oxides roll; 5-
electrically heated furnace; 6- secondary oxygen input; 7- electrically heated furnace; 8-flue gas analyzer
Simulated flue gas:1.5L/min, 0.05 vol. % NO, 2.0 vol. % O2, 17.0 vol. % CO2 in N2 base
methane: controlled by stoichiometric ratio (SR)
SR : the ratio of actual oxygen in the flue gas and the oxygen that complete combustion of methane requires.
SR1: redurning
SR2: burnout

2016/6/16
26
2.3.3 Results and discussion
300 400 500 600 700 800 900 1000 11000
20
40
60
80
100
NO
red
ucti
on /
%temperature /
oC
without Fe2O
3, SR
1=0.7, SR
2=0.7
with Fe2O
3, SR
1=0.7, SR
2=0.7
without Fe2O
3, SR
1=0.7, SR
2=1.2
with Fe2O
3, SR
1=0.7, SR
2=1.2
without Fe2O
3, SR
1=1.0, SR
2=1.0
with Fe2O
3, SR
1=1.0, SR
2=1.0
without Fe2O
3, SR
1=1.0, SR
2=1.2
with Fe2O
3, SR
1=1.0, SR
2=1.2
without Fe2O
3, SR
1=1.2, SR
2=1.2
with Fe2O
3, SR
1=1.2, SR
2=1.2
Comparison of NO reduction by methane in simulated flue gas atmosphere when iron oxides was or was not used (flow rate 1.5L/min, O2=2.0 vol. %, NO =0.05 vol. %, CO2=17.0 vol. % in N2 base)
2.3.3.4 NO reduction by methane over iron oxides in flue gas atmosphere
300 400 500 600 700 800 900 1000 11000
20
40
60
80
100
NO
red
uct
ion /
%
temperature / oC
SR1=0.7, SR
2=0.7
SR1=0.7, SR
2=1.2
SR1=0.8, SR
2=0.8
SR1=0.8, SR
2=1.2
SR1=0.9, SR
2=0.9
SR1=0.9, SR
2=1.2
SR1=1.0, SR
2=1.0
SR1=1.0, SR
2=1.2
SR1=1.1, SR
2=1.1
SR1=1.1, SR
2=1.2
SR1=1.2
NO reduction by methane over iron oxides in simulated flue gas atmosphere (flow rate 1.5L/min, O2=2.0 vol. %, NO =0.05 vol. %, CO2=17.0 vol. % in N2 base)
200 400 600 800 1000 1200
0
20
40
60
80
100
NO
red
uct
ion
/%
Temperature/oC
CH4=0.2%
CH4=0.4%
CH4=0.8%
CH4=1.0%
CH4=1.17%, Fe
2O
3
NO reduction by methane over iron in N2 atmosphere
300 450 600 750 900 10500
1000
2000
3000
4000
5000
exit
CO
/ p
pm
temperature / oC
CH4=0.2%
CH4=0.4%
CH4=0.8%
CH4=1.0%
Exit CO when methane reducing NO over iron in N2 atmosphere
Results showed the same results when iron/iron oxides was used.
2.3.3.5 NO reduction by methane over iron
NO reduction by methane over iron in N2 atmosphere
2.3.3 Results and discussion

2016/6/16
27
2.3.3 Results and discussion 2.3.3.5 NO reduction by methane over iron
NO reduction by methane over iron in simulated flue gas atmosphere
300 400 500 600 700 800 900 1000 11000
20
40
60
80
100
NO
red
uct
ion
/ %
temperature / oC
SR1=0.7, SR
2=0.7
SR1=0.7, SR
2=1.2
SR1=0.8, SR
2=0.8
SR1=0.8, SR
2=1.2
SR1=0.9, SR
2=0.9
SR1=0.9, SR
2=1.2
SR1=1.0, SR
2=1.0
SR1=1.0, SR
2=1.2
SR1=1.1, SR
2=1.1
SR1=1.1, SR
2=1.2
SR1=1.2
NO reduction by methane over metallic iron in simulated flue gas atmosphere (flow rate 1.5L/min, O2=2.0 vol. %, NO =0.05 vol. %, CO2=17.0 vol. % in N2 base)
300 400 500 600 700 800 900 1000 11000
20
40
60
80
100
NO
red
ucti
on /
%
temperature / oC
without iron, SR1=0.7, SR
2=0.7
without iron, SR1=0.7, SR
2=1.2
with iron, SR1=0.7, SR
2=0.7
with iron, SR1=0.7, SR
2=1.2
without iron, SR1=1.0, SR
2=1.0
without iron, SR1=1.0, SR
2=1.2
with iron, SR1=1.0, SR
2=1.0
with iron, SR1=1.0, SR
2=1.2
without iron, SR1=1.2, SR
2=1.2
with iron, SR1=1.2, SR
2=1.2
Comparison of NO reduction by methane in simulated flue gas atmosphere when iron was or was not used(flow rate 1.5L/min, O2=2.0 vol. %, NO =0.05 vol. %, CO2=17.0 vol. % in N2 base)
2.3.3 Results and discussion
300 400 500 600 700 800 900 1000 11000
20
40
60
80
100
NO
red
ucti
on /
%
temperature / oC
iron, SR1=0.7, SR
2=0.7
iron, SR1=0.7, SR
2=1.2
iron oxides, SR1=0.7, SR
2=0.7
iron oxides, SR1=0.7, SR
2=1.2
iron, SR1=1.0, SR
2=1.0
iron, SR1=1.0, SR
2=1.2
iron oxides, SR1=1.0, SR
2=1.0
iron oxides, SR1=1.0, SR
2=1.2
iron, SR1=1.2
iron oxides, SR1=1.2
Comparison of NO reduction by methane over metallic iron and iron oxides
(flow rate 1.5L/min, O2=2.0 vol. %, NO =0.05 vol. %, CO2=17.0 vol. % in N2 base)
2.3.3.5 NO reduction by methane over iron
Comparison between NO reduction by methane over iron and iron oxides in simulated flue gas atmosphere
Yaxin Su, et al. Fuel, 2015, 160: 80-86

2016/6/16
28
2.3.3 Results and discussion 2.3.3.6 Effect of SO2 on NO reduction by iron in N2 base
200 400 600 800 10000
20
40
60
80
100
NO
red
ucti
on /
%
Tempereture / oC
SO2=0.01%
SO2=0.02%
SO2=0.04%
Effect of SO2 on NO reduction over metallic iron in N2 atmosphere (flow
rate 1.5L/min, NO=0.05%, SO2=0.01%-0.04% in N2 base)
200 400 600 800 10000
20
40
60
80
100
SO
2 re
duct
ion
/ %
Tempereture / oC
SO2=0.01%
SO2=0.02%
SO2=0.04%
SO2 reduction during the reaction of NO with iron (flow rate
1.5L/min, NO=0.05%, SO2=0.01%-0.04% in N2 base)
10 20 30 40 50 60 70 80 900
100
200
300
400
500
600
700
800
2 / o
Inte
nsit
y(C
PS
)
FeOFeS
* Fe
XRD pattern of iron sample after reducing NO in N2 atmosphere when
SO2=0.04% (flow rate 1.5L/min, NO=0.05%, SO2=0.04% in N2 base,
1050C)
2.3.3 Results and discussion 2.3.3.6 Effect of SO2 on NO reduction by iron in N2 base
0 10 20 30 40 50 60 70
20
40
60
80
100
NO
reducti
on /
%
durable time /hr
SO2=0.022%
SO2=0
Effect of SO2 on durable reduction of NO by metallic iron in N2 atmosphere at 800 C
(flow rate 1.5L/min, NO=0.05%, SO2=0/0.022% in N2 base, 800 C)
10 20 30 40 50 60 70 80 90
0
500
1000
1500
2000
Fe2O
3
Fe+2
Fe2
+3O
4
Inte
nsit
y(C
PS
)
2 / o
(a) SO2=0
10 20 30 40 50 60 70 80 900
1000
2000
3000
4000
5000
6000
Fe2O3
Inte
nsit
y(C
PS
)
2 / o
(b) SO2=0.022%
2016/6/16
29
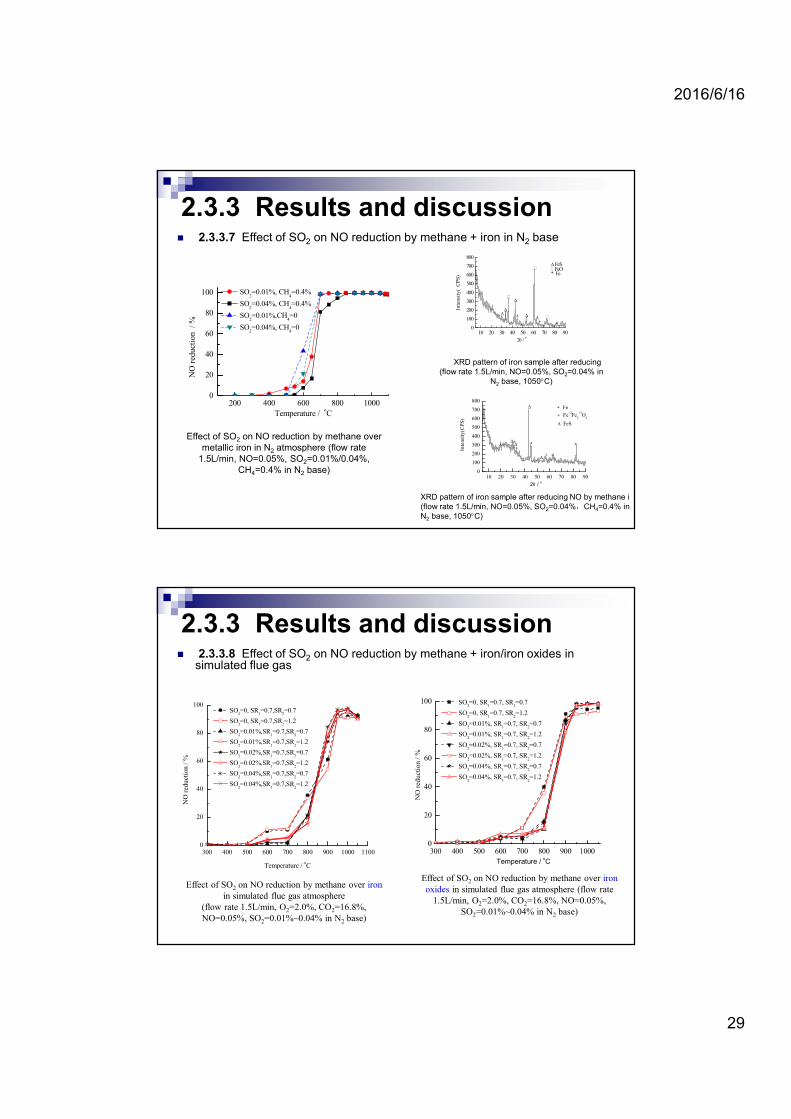
2.3.3 Results and discussion
200 400 600 800 10000
20
40
60
80
100
NO
red
ucti
on /
%
Temperature / oC
SO2=0.01%, CH
4=0.4%
SO2=0.04%, CH
4=0.4%
SO2=0.01%,CH
4=0
SO2=0.04%, CH
4=0
Effect of SO2 on NO reduction by methane over metallic iron in N2 atmosphere (flow rate
1.5L/min, NO=0.05%, SO2=0.01%/0.04%, CH4=0.4% in N2 base)
2.3.3.7 Effect of SO2 on NO reduction by methane + iron in N2 base
10 20 30 40 50 60 70 80 900
100
200
300
400
500
600
700
800
2 / o
Inte
nsit
y(C
PS
)
FeOFeS
* Fe
XRD pattern of iron sample after reducing (flow rate 1.5L/min, NO=0.05%, SO2=0.04% in
N2 base, 1050C)
10 20 30 40 50 60 70 80 900
100
200
300
400
500
600
700
800
Inte
nsit
y(C
PS
)
2 / o
Fe
Fe+2
Fe2
+3O
4
FeS
XRD pattern of iron sample after reducing NO by methane i (flow rate 1.5L/min, NO=0.05%, SO2=0.04%,CH4=0.4% in N2 base, 1050C)
300 400 500 600 700 800 900 1000 11000
20
40
60
80
100
NO
red
ucti
on /
%
Temperature / oC
SO2=0, SR
1=0.7,SR
2=0.7
SO2=0, SR
1=0.7,SR
2=1.2
SO2=0.01%,SR
1=0.7,SR
2=0.7
SO2=0.01%,SR
1=0.7,SR
2=1.2
SO2=0.02%,SR
1=0.7,SR
2=0.7
SO2=0.02%,SR
1=0.7,SR
2=1.2
SO2=0.04%,SR
1=0.7,SR
2=0.7
SO2=0.04%,SR
1=0.7,SR
2=1.2
Effect of SO2 on NO reduction by methane over ironin simulated flue gas atmosphere
(flow rate 1.5L/min, O2=2.0%, CO2=16.8%, NO=0.05%, SO2=0.01%~0.04% in N2 base)
2.3.3 Results and discussion 2.3.3.8 Effect of SO2 on NO reduction by methane + iron/iron oxides in
simulated flue gas
300 400 500 600 700 800 900 10000
20
40
60
80
100
NO
red
uct
ion
/ %
Temperature / oC
SO2=0, SR
1=0.7, SR
2=0.7
SO2=0, SR
1=0.7, SR
2=1.2
SO2=0.01%, SR
1=0.7, SR
2=0.7
SO2=0.01%, SR
1=0.7, SR
2=1.2
SO2=0.02%, SR
1=0.7, SR
2=0.7
SO2=0.02%, SR
1=0.7, SR
2=1.2
SO2=0.04%, SR
1=0.7, SR
2=0.7
SO2=0.04%, SR
1=0.7, SR
2=1.2
Effect of SO2 on NO reduction by methane over iron oxides in simulated flue gas atmosphere (flow rate
1.5L/min, O2=2.0%, CO2=16.8%, NO=0.05%, SO2=0.01%~0.04% in N2 base)
2016/6/16
30
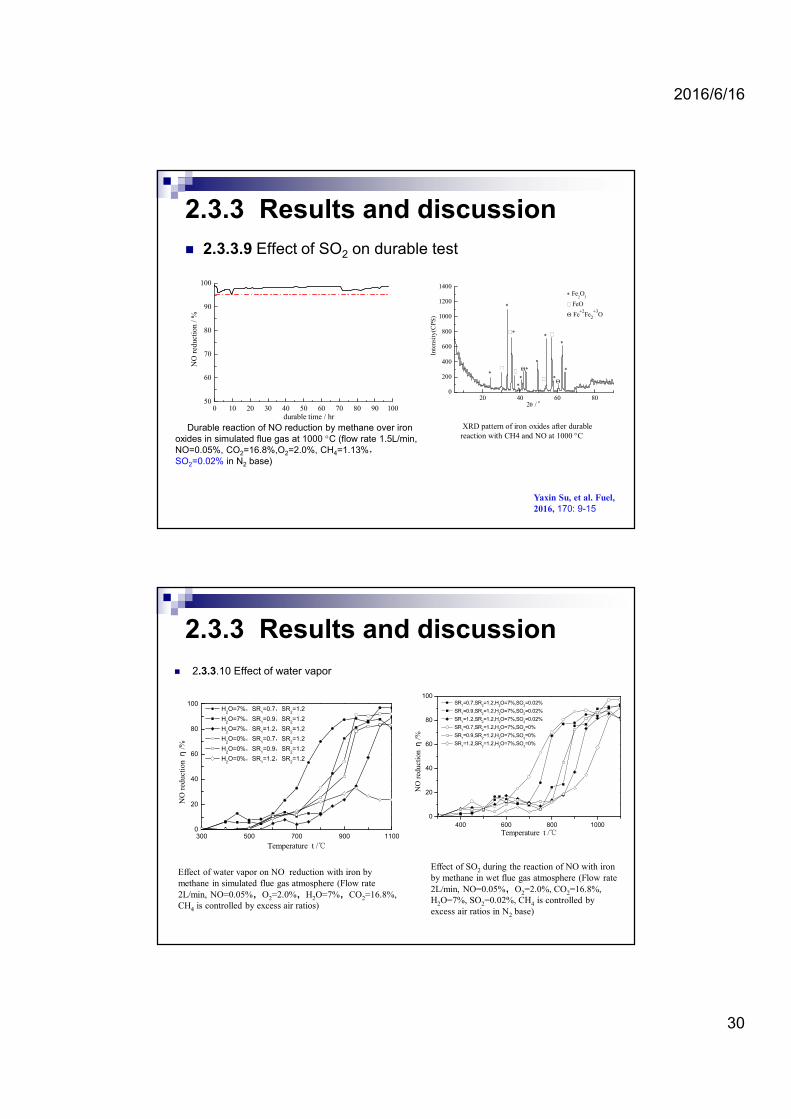
2.3.3.9 Effect of SO2 on durable test
2.3.3 Results and discussion
0 10 20 30 40 50 60 70 80 90 10050
60
70
80
90
100
NO
red
ucti
on /
%
durable time / hr
Durable reaction of NO reduction by methane over iron oxides in simulated flue gas at 1000 C (flow rate 1.5L/min, NO=0.05%, CO2=16.8%,O2=2.0%, CH4=1.13%,SO2=0.02% in N2 base)
20 40 60 800
200
400
600
800
1000
1200
1400
Fe2O
3
FeO
Fe+2
Fe2
+3O
Inte
nsit
y(C
PS
)
2 / o
XRD pattern of iron oxides after durable reaction with CH4 and NO at 1000 C
Yaxin Su, et al. Fuel, 2016, 170: 9-15
2.3.3 Results and discussion
2.3.3.10 Effect of water vapor
300 500 700 900 11000
20
40
60
80
100 H
2O=7%,SR
1=0.7,SR
2=1.2
H2O=7%,SR
1=0.9,SR
2=1.2
H2O=7%,SR
1=1.2,SR
2=1.2
H2O=0%,SR
1=0.7,SR
2=1.2
H2O=0%,SR
1=0.9,SR
2=1.2
H2O=0%,SR
1=1.2,SR
2=1.2
NO
red
uct
ion η
/%
Temperature t /℃
Effect of water vapor on NO reduction with iron by methane in simulated flue gas atmosphere (Flow rate 2L/min, NO=0.05%,O2=2.0%,H2O=7%,CO2=16.8%, CH4 is controlled by excess air ratios)
400 600 800 1000
0
20
40
60
80
100 SR
1=0.7,SR
2=1.2,H
2O=7%,SO
2=0.02%
SR1=0.9,SR
2=1.2,H
2O=7%,SO
2=0.02%
SR1=1.2,SR
2=1.2,H
2O=7%,SO
2=0.02%
SR1=0.7,SR
2=1.2,H
2O=7%,SO
2=0%
SR1=0.9,SR
2=1.2,H
2O=7%,SO
2=0%
SR1=1.2,SR
2=1.2,H
2O=7%,SO
2=0%
NO
red
uct
ion η
/%
Temperature t /℃
Effect of SO2 during the reaction of NO with iron by methane in wet flue gas atmosphere (Flow rate 2L/min, NO=0.05%,O2=2.0%, CO2=16.8%, H2O=7%, SO2=0.02%, CH4 is controlled by excess air ratios in N2 base)

2016/6/16
31
2.3.3 Results and discussion
2.3.3.11 Effect of H2O+SO2 on durable test
Durable reaction of NO reduction by methane over iron oxides in simulated flue gas at 1050 C (flow rate 2 L/min, NO = 0.05%, CO2 = 16.8%,O2 = 2.0%, CH4 = 1.14%,H2O = 7%,SO2 = 0.02% in N2 base)
0 10 20 30 40 5050
60
70
80
90
100
NO
red
ucti
on,
/ %
durable time / h
Zhou, Hao, Su, Yaxin*, Qi, Yuezhou, et al. J Fuel Chem Tech ( in Chinese), 2014,42(11): 1378-1386
2.3.3 Results and discussion
2.3.3.12 C2H6 reducing NO over Fe
200 300 400 500 600 700 800 900 1000 11000
20
40
60
80
100
NO
red
ucti
on
C2H
6=0.1%
C2H
6=0.2%
C2H
6=0.3%
without iron, C2H
6=0.1%
CH4=0.1%, [25]
CH4=0.2%, [25]
Temperature / oC
NO reduction by ethane over iron in N2 atmosphereflow rate 2L/min, NO=0.05%, C2H6=0.1%~0.3% in N2 base
20 40 60 800
500
1000
1500
2000
2500
* * * *+
+
++ +
+
+
+
(a) C2H
6=0.1%
+
+ Fe3O
4
* FeO
2()
Inte
nsi
ty (
CP
S)
20 40 60 800
500
1000
1500
2000
2500
+
+
+ ++
##
(b) C2H
6=0.2%
+
#
2()
Inte
nsit
y (C
PS
)
# Fe
+ Fe3O
4
XRD pattern of iron samples after reducing NO in N2 atmosphere when C2H6=0.1%/0.2%
flow rate 2 L/min, NO=0.05%, in N2 base, 1100C
COOHFeHCOFe 691035 26232
226232 691437 COOHFeHCOFe
20 40 60 800
200
400
600
800
1000
1200(a) iron oxides before reaction
** *
#
#
# # #
++
++
+
+
+
*#
+
Inte
nsit
y (
CP
S)
2()
+ Fe3O
4
# Fe2O
3
* FeO
20 40 60 800
500
1000
1500
2000
2500
3000 ( b) after reaction with C2H
6=0.1%
Inte
nsi
ty (
CP
S)
#
#
## Fe
2()
400 600 800 10000
20
40
60
80
100
SR1=0.7,SR
2=1.2,C
2H
6
SR1=0.8,SR
2=1.2,C
2H
6
SR1=0.9,SR
2=1.2,C
2H
6
SR1=1.0,SR
2=1.2,C
2H
6
SR1=1.1,SR
2=1.2,C
2H
6
SR1=1.2,SR
2=1.2,C
2H
6
SR1=0.7,SR
2=1.2,CH
4
SR1=0.8,SR
2=1.2,CH
4
SR1=0.9,SR
2=1.2,CH
4
SR1=1.0,SR
2=1.2,CH
4
SR1=1.1,SR
2=1.2,CH
4
SR1=1.2,SR
2=1.2,CH
4NO
red
ucti
on
/ %
Temperature / oC
Comparison of NO reduction by ethane and methane over iron in simulated flue gas atmosphere flow rate 2L/min, O2=2.0%, CO2=17.0%, NO=0.05%, in
N2 base
DOU Yifeng, SU Yaxin*, et al. J Fuel Chem Tech ( in Chinese), 2015, 43(10):1273-1280
2016/6/16
32
2.3.3 Results and discussion
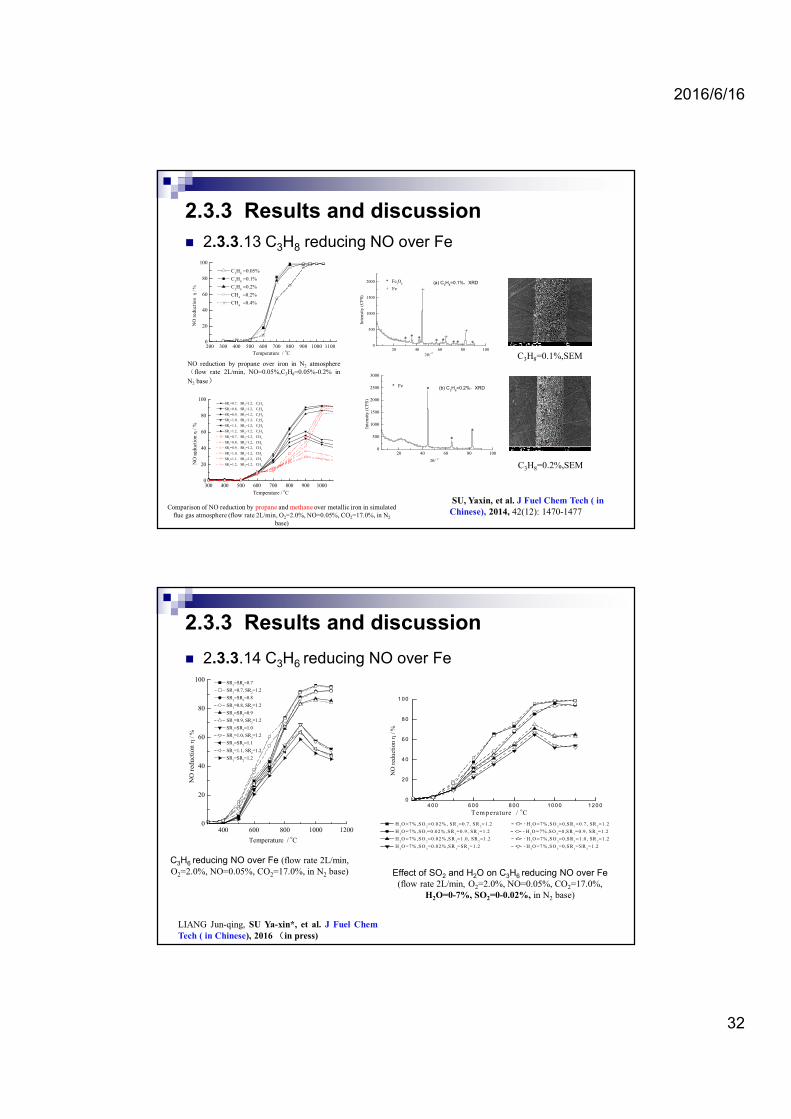
2.3.3.13 C3H8 reducing NO over Fe
200 300 400 500 600 700 800 900 1000 11000
20
40
60
80
100
NO
red
uct
ion
Temperature / oC
C3H
8 =0.05%
C3H
8 =0.1%
C3H
8 =0.2%
CH4 =0.2%
CH4 =0.4%
NO reduction by propane over iron in N2 atmosphere(flow rate 2L/min, NO=0.05%,C3H8=0.05%-0.2% in
N2 base)
20 40 60 80 1000
500
1000
1500
2000 (a) C3H
8=0.1%,XRD
++
* * * * * * *
* Fe3O
4
+ Fe
Inte
nsi
ty (
CP
S)
/ o
*
+
20 40 60 80 1000
500
1000
1500
2000
2500
3000
(b) C3H
8=0.2%,XRD
/ o
*
*
* * Fe
Inte
nsi
ty (
CP
S)
C3H8=0.1%,SEM
C3H8=0.2%,SEM
300 400 500 600 700 800 900 10000
20
40
60
80
100
?
NO
red
ucti
on
/ %
Temperature / oC
SR1=0.7, SR
2=1.2, C
3H
8
SR1=0.8, SR
2=1.2, C
3H
8
SR1=0.9, SR
2=1.2, C
3H
8
SR1=1.0, SR
2=1.2, C
3H
8
SR1=1.1, SR
2=1.2, C
3H
8
SR1=1.2, SR
2=1.2, C
3H
8
SR1=0.7, SR
2=1.2, CH
4
SR1=0.8, SR
2=1.2, CH
4
SR1=0.9, SR
2=1.2, CH
4
SR1=1.0, SR
2=1.2, CH
4
SR1=1.1, SR
2=1.2, CH
4
SR1=1.2, SR
2=1.2, CH
4
Comparison of NO reduction by propane and methane over metallic iron in simulated flue gas atmosphere (flow rate 2L/min, O2=2.0%, NO=0.05%, CO2=17.0%, in N2
base)
SU, Yaxin, et al. J Fuel Chem Tech ( in Chinese), 2014, 42(12): 1470-1477
2.3.3 Results and discussion
2.3.3.14 C3H6 reducing NO over Fe
400 600 800 1000 12000
20
40
60
80
100 SR
1=SR
2=0.7
SR1=0.7, SR
2=1.2
SR1=SR
2=0.8
SR1=0.8, SR
2=1.2
SR1=SR
2=0.9
SR1=0.9, SR
2=1.2
SR1=SR
2=1.0
SR1=1.0, SR
2=1.2
SR1=SR
2=1.1
SR1=1.1, SR
2=1.2
SR1=SR
2=1.2
NO
red
ucti
on
Temperature / oC
C3H6 reducing NO over Fe (flow rate 2L/min, O2=2.0%, NO=0.05%, CO2=17.0%, in N2 base)
4 00 600 8 00 10 00 120 00
20
40
60
80
1 00
NO
red
uct
ion
/ %
T em p erature / oC
H2O = 7% ,S O
2= 0 .02% , S R
1= 0 .7 , S R
2= 1 .2 H
2O = 7% ,S O
2= 0 ,S R
1= 0 .7 , SR
2=1 .2
H2O = 7% ,S O 2= 0 .02% ,S R
1= 0 .9 , S R
2= 1 .2 H
2O = 7% ,S O
2= 0 ,S R
1= 0 .9 , S R
2= 1 .2
H2O = 7% ,S O
2= 0 .02% ,S R
1= 1 .0 , SR
2=1 .2 H
2O = 7% ,S O
2= 0 ,S R
1= 1 .0 , SR
2=1 .2
H2O = 7% ,S O
2= 0 .02% ,S R
1= S R
2= 1 .2 H
2O = 7% ,S O
2= 0 ,S R
1= S R
2= 1 .2
Effect of SO2 and H2O on C3H6 reducing NO over Fe (flow rate 2L/min, O2=2.0%, NO=0.05%, CO2=17.0%,
H2O=0-7%, SO2=0-0.02%, in N2 base)
LIANG Jun-qing, SU Ya-xin*, et al. J Fuel ChemTech ( in Chinese), 2016 (in press)
2016/6/16
33
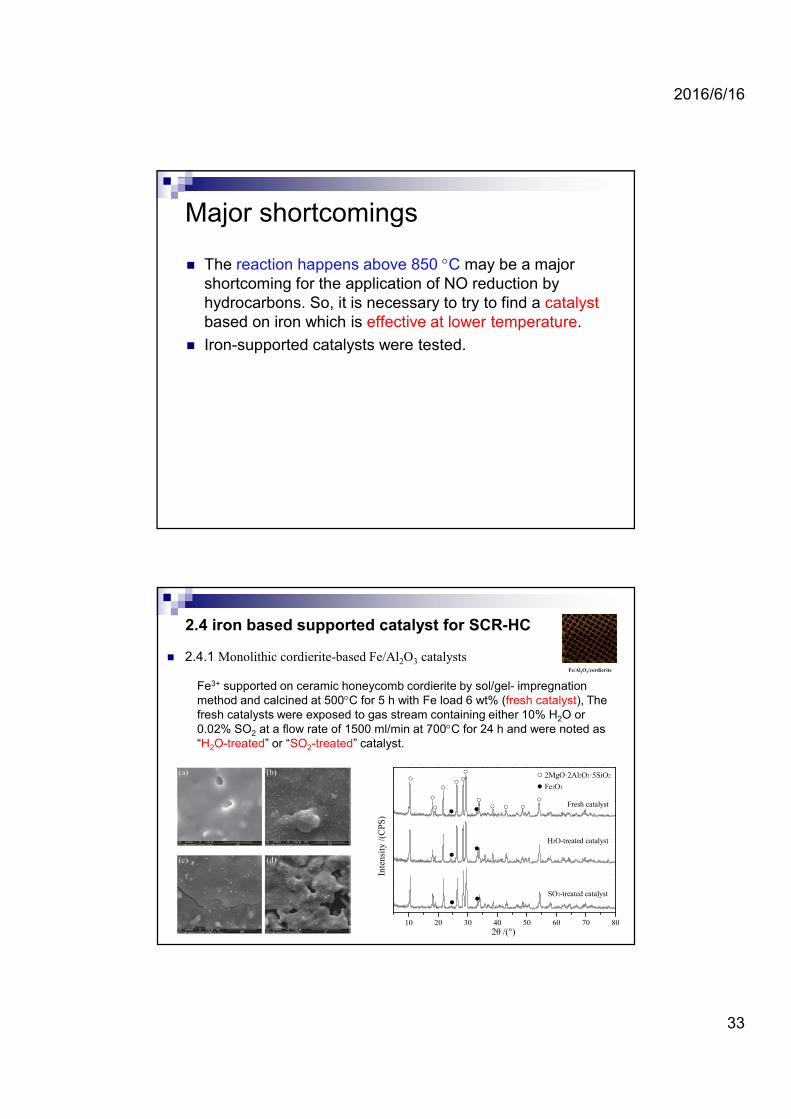
Major shortcomings
The reaction happens above 850 C may be a major shortcoming for the application of NO reduction by hydrocarbons. So, it is necessary to try to find a catalystbased on iron which is effective at lower temperature.
Iron-supported catalysts were tested.
2.4 iron based supported catalyst for SCR-HC
2.4.1 Monolithic cordierite-based Fe/Al2O3 catalysts
10 20 30 40 50 60 70 80
SO2-treated catalyst
H2O-treated catalyst
Fresh catalyst
○ 2MgO·2Al2O3·5SiO2
● Fe2O3
Inte
nsit
y /(
CP
S)
2θ /(°)
○
○○
○○ ○
○
○○ ○ ○
○●●
●●
● ●
Fe3+ supported on ceramic honeycomb cordierite by sol/gel- impregnation method and calcined at 500C for 5 h with Fe load 6 wt% (fresh catalyst), The fresh catalysts were exposed to gas stream containing either 10% H2O or 0.02% SO2 at a flow rate of 1500 ml/min at 700C for 24 h and were noted as “H2O-treated” or “SO2-treated” catalyst.
Fe/Al2O3/cordierite

2016/6/16
34
2.4 iron based supported catalyst for SCR-HC
2.4.2 NO reduction with C3H8
(a) 500 ppm NO, 800 ppm C3H8, GHSV =18000 h-1
200 300 400 500 600
0
20
40
60
80
100
NOx
C3H8
Temperature (°C)
NO
x C
onve
rsio
n (%
)
0
20
40
60
80
C3H
8 Conversion (%
)
(a)
200 300 400 500 600 700
0
20
40
60
80
100
NOx
C3H8
Temperature (°C)
NO
x C
onve
rsio
n (%
)
0
20
40
60
80
100
C3H
8 Conversion (%
)
(b)
(b) 500 ppm NO, 0.3% C3H8, 1% O2, GHSV
=18000 h-1
200 300 400 500 600 700
0
20
40
60
80
100
NO
x C
onv
ersi
on (
%)
Temperature (°C)
Fresh catalyst H2O-treated catalyst SO2-treated catalyst
2.4 iron based supported catalyst for SCR-HC
2.4.3 Effect of H2O/SO2
0 2 4 6 8 10 12
0
20
40
60
80
100
550°C
Removing SO2
Reaction tiome t/h
Adding H2O
NO
x C
onv
ersi
on (
%)
Adding SO2 Removing H
2O
600°C
500 ppm NO, 0.3% C3H8, 1% O2, 0.02% SO2 (when used), 2.5% H2O (when used), GHSV =18000 h-1, T = 600 /550℃
2016/6/16
35
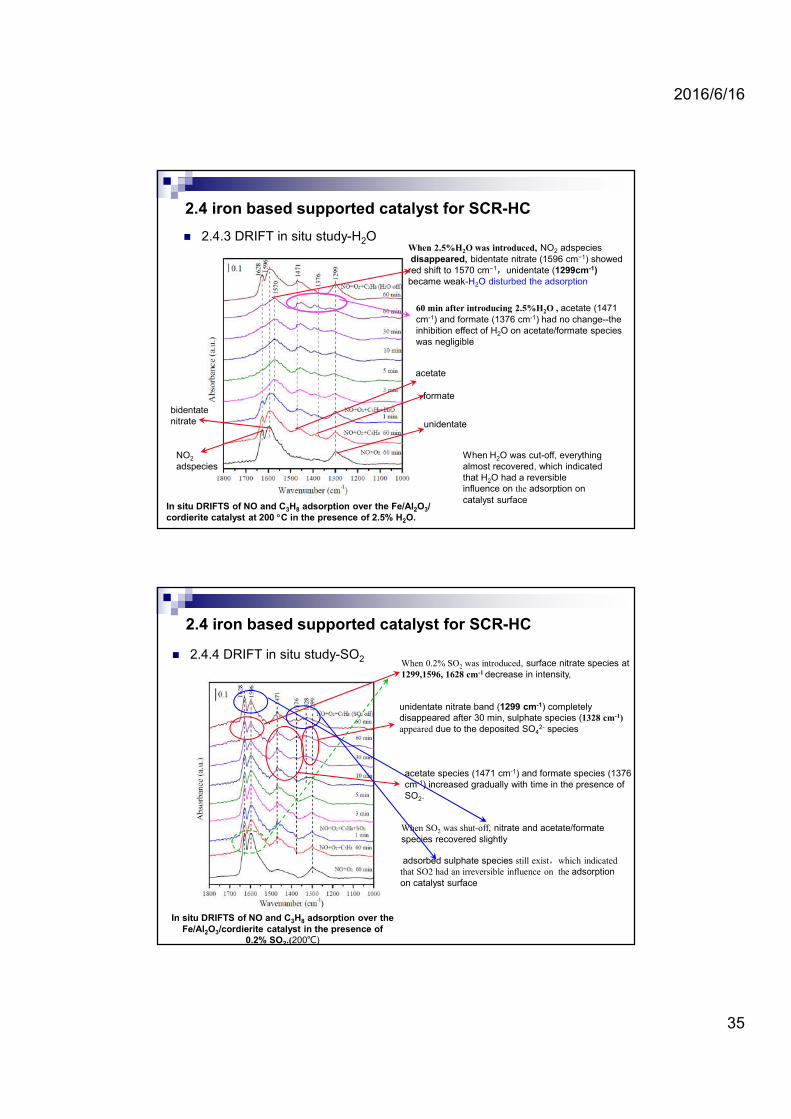
2.4.3 DRIFT in situ study-H2O
2.4 iron based supported catalyst for SCR-HC
In situ DRIFTS of NO and C3H8 adsorption over the Fe/Al2O3/ cordierite catalyst at 200 C in the presence of 2.5% H2O.
NO2
adspecies
bidentate nitrate unidentate
acetate
formate
When 2.5%H2O was introduced, NO2 adspeciesdisappeared, bidentate nitrate (1596 cm−1) showed red shift to 1570 cm−1,unidentate (1299cm-1) became weak-H2O disturbed the adsorption
60 min after introducing 2.5%H2O , acetate (1471 cm-1) and formate (1376 cm-1) had no change--the inhibition effect of H2O on acetate/formate species was negligible
When H2O was cut-off, everything almost recovered, which indicated that H2O had a reversible influence on the adsorption on catalyst surface
2.4 iron based supported catalyst for SCR-HC
In situ DRIFTS of NO and C3H8 adsorption over the Fe/Al2O3/cordierite catalyst in the presence of
0.2% SO2.(200℃)
When 0.2% SO2 was introduced, surface nitrate species at1299,1596, 1628 cm-1 decrease in intensity,
unidentate nitrate band (1299 cm-1) completely disappeared after 30 min, sulphate species (1328 cm-1) appeared due to the deposited SO4
2- species
acetate species (1471 cm-1) and formate species (1376 cm-1) increased gradually with time in the presence of SO2.
When SO2 was shut-off, nitrate and acetate/formate species recovered slightly
adsorbed sulphate species still exist,which indicated that SO2 had an irreversible influence on the adsorption on catalyst surface
2.4.4 DRIFT in situ study-SO2
2016/6/16
36
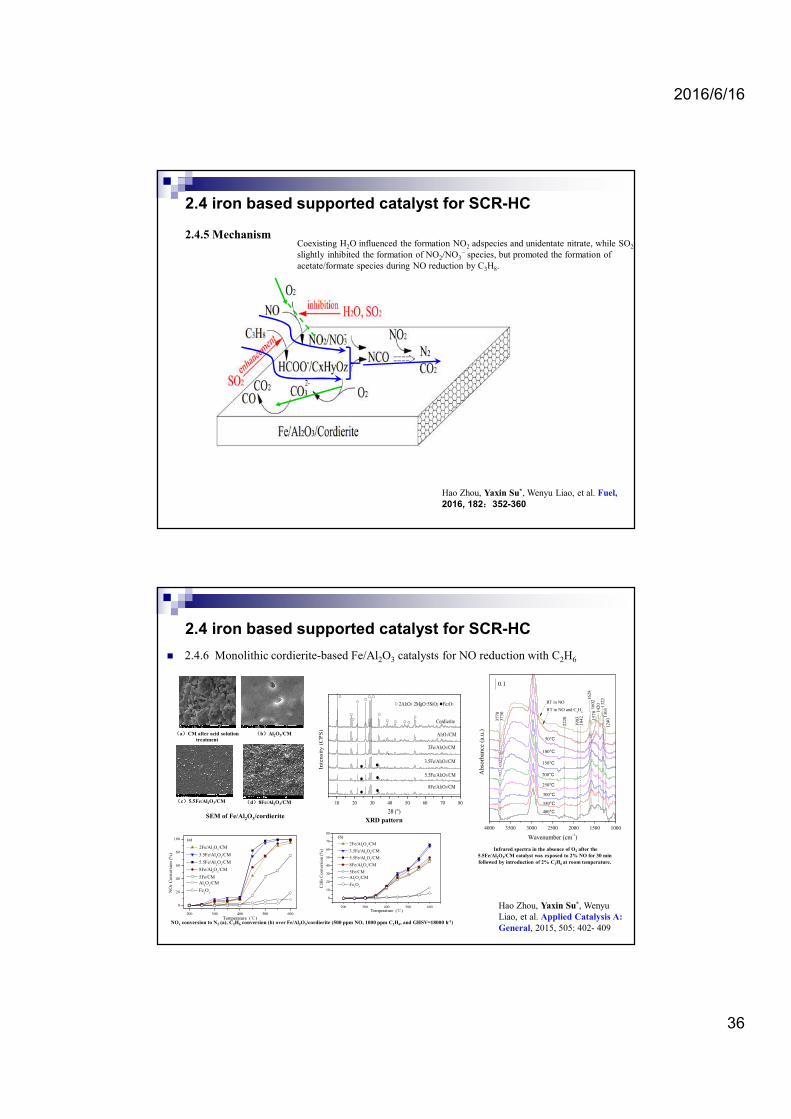
2.4.5 Mechanism
2.4 iron based supported catalyst for SCR-HC
Hao Zhou, Yaxin Su*, Wenyu Liao, et al. Fuel, 2016, 182:352-360
Coexisting H2O influenced the formation NO2 adspecies and unidentate nitrate, while SO2
slightly inhibited the formation of NO2/NO3− species, but promoted the formation of
acetate/formate species during NO reduction by C3H8.
2.4 iron based supported catalyst for SCR-HC
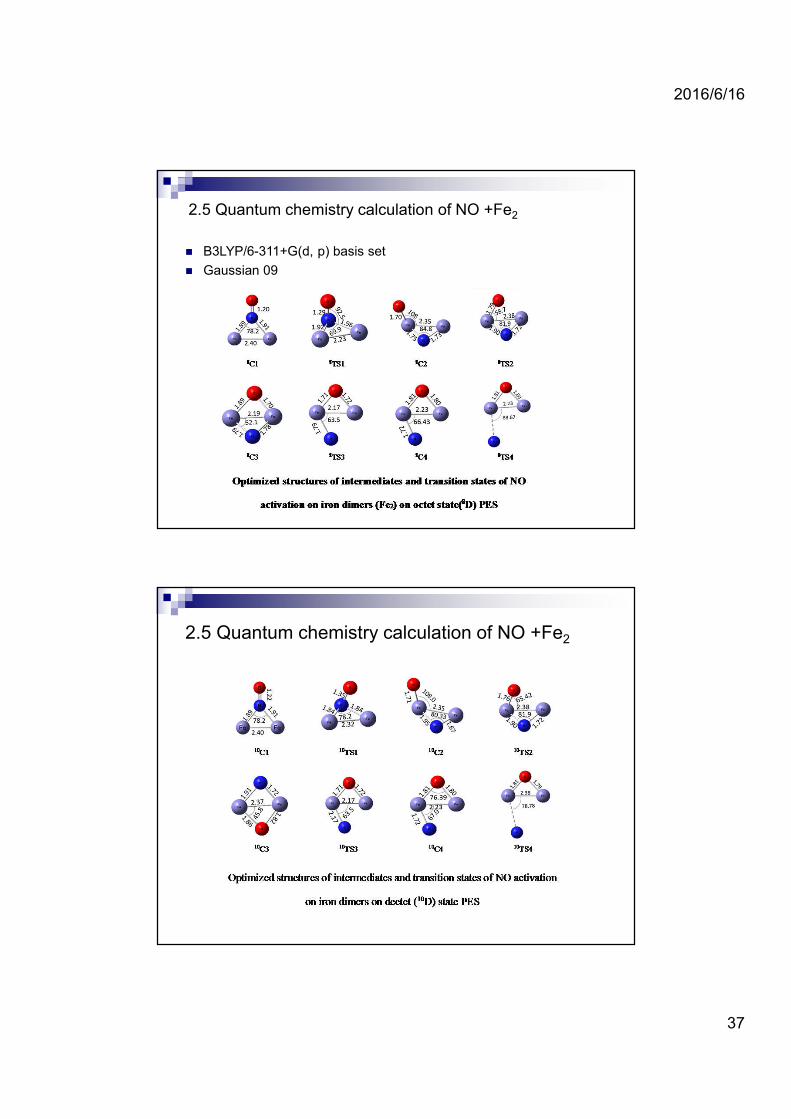
2.4.6 Monolithic cordierite-based Fe/Al2O3 catalysts for NO reduction with C2H6
SEM of Fe/Al2O3/cordierite
(a)CM after acid solutiontreatment
(b)Al2O3/CM
(c)5.5Fe/Al2O3/CM (d)8Fe/Al2O3/CM
200 300 400 500 600
0
20
40
60
80
100
2Fe/Al2O
3/CM
3.5Fe/Al2O
3/CM
5.5Fe/Al2O
3/CM
8Fe/Al2O
3/CM
5Fe/CM Al
2O
3/CM
Fe2O
3
NO
x C
onve
rsio
n (%
)
Temperature (℃)
(a)
200 300 400 500 600
0
10
20
30
40
50
60
70
80
2Fe/Al2O
3/CM
3.5Fe/Al2O
3/CM
5.5Fe/Al2O
3/CM
8Fe/Al2O
3/CM
5Fe/CM Al
2O
3/CM
Fe2O
3
C2 H
6 C
onve
rsio
n (%
)
Temperature (℃)
(b)
NOx conversion to N2 (a), C2H6 conversion (b) over Fe/Al2O3/cordierite (500 ppm NO, 1000 ppm C2H6, and GHSV=18000 h-1)
4000 3500 3000 2500 2000 1500 1000
1303
157
0
124
013
22
142
0
222
0
190
318
42
1602
1628
RT in NO
400°C
350°C
300°C
250°C
200°C
150°C
100°C
50°C
Abso
rban
ce (
a.u.)
Wavenumber (cm-1
)
RT in NO and C2H
6
3730
377
0
0.1
Infrared spectra in the absence of O2 after the 5.5Fe/Al2O3/CM catalyst was exposed to 2% NO for 30 min followed by introduction of 2% C2H6 at room temperature.
10 20 30 40 50 60 70 80
●
●
●
●
○
3.5Fe/Al2O3/CM
5.5Fe/Al2O3/CM
○ 2Al2O3·2MgO·5SiO2 ●Fe2O3
8Fe/Al2O3/CM
2Fe/Al2O3/CM
Al2O3/CM
Cordierite○
○○○○○
○○○○○
○
● ●
Inte
nsi
ty (
CP
S)
2θ (°)
XRD pattern
Hao Zhou, Yaxin Su*, Wenyu Liao, et al. Applied Catalysis A: General, 2015, 505: 402- 409
2016/6/16
37
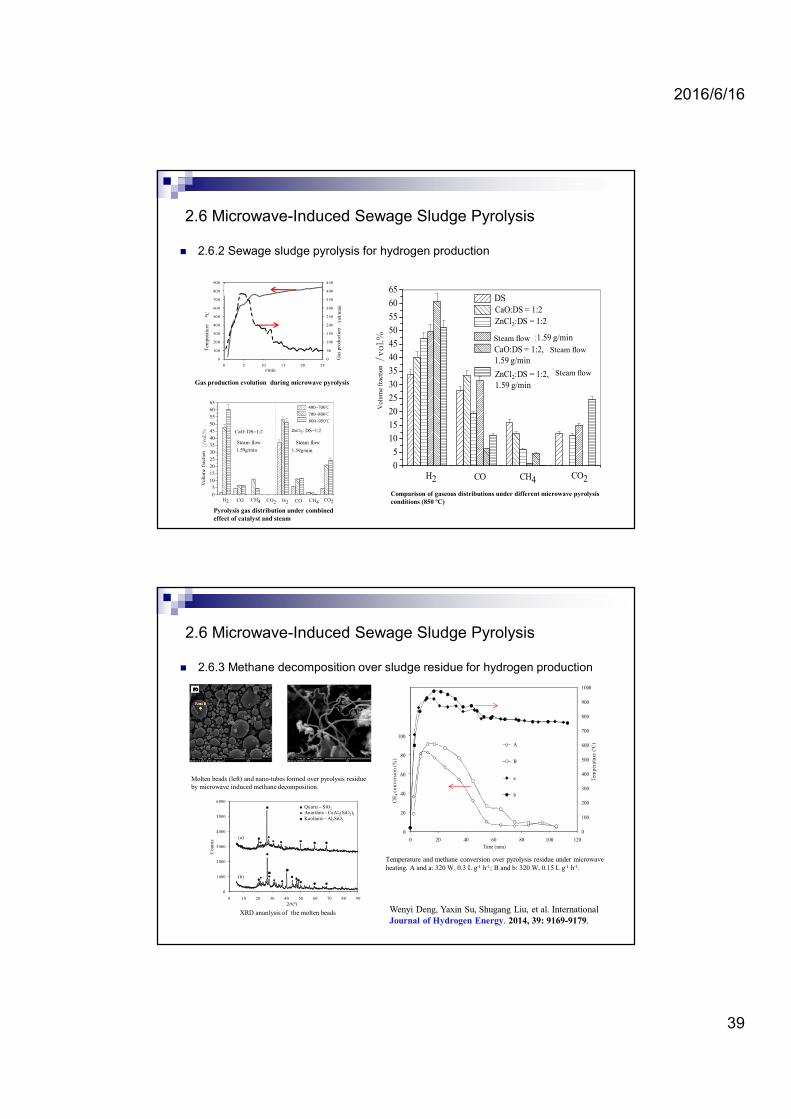
2.5 Quantum chemistry calculation of NO +Fe2
B3LYP/6-311+G(d, p) basis set
Gaussian 09
2.5 Quantum chemistry calculation of NO +Fe2

2016/6/16
38
2.5 Quantum chemistry calculation of NO +Fe2
Erel/(kCal ∙ mol-1) E'/( kCal ∙ mol-1)
octet decuplet octet decuplet
Fe2+NO 0 4.21 - -
C1(C1') -48.25 -25.20 - -
TS1(TS1') -26.88 -16.97 21.37 8.23
C2(C2') -50.86 -32.63 - -
TS2(TS2') -40.76 -28.26 10.10 4.37
C3(C3') -64.84 -61.88 - -
TS3(TS3') -54.19 -39.72 10.65 22.16
C4(C4') -54.58 -39.86 - -
TS4(TS4') -5.05 -9.25 49.53 30.61
Fe2O+N -71.47 -102.24 - -
benchmark
Reaction activation energy results from the cleavage of N-O bond.
Energies of various species in reaction of Fe2+NO→Fe2O+N on two state PES
2.6 Microwave-Induced Sewage Sludge Pyrolysis
2.6.1 Microwave heating introduction
Single-mode microwave heating device
Microwave heating principle
Main Advantages of microwave heating
Precisely controllable and can be turned on and off instantly
More compact, requiring a smaller equipment footprint
Non-contact heating technology
Microwave energy provides uniform energy distribution
2016/6/16
39
2.6 Microwave-Induced Sewage Sludge Pyrolysis
0
50
100
150
200
250
300
350
400
450
0
100
200
300
400
500
600
700
800
900
0 5 10 15 20 25
Tempera ture
Gas product
Tem
per
autr
e/⁰C
Gas
pro
duct
flo
w rat
e/m
l min
-1
t/min
(b)
温度
气相产物
温度
气相产率
/(m
l/m
in)
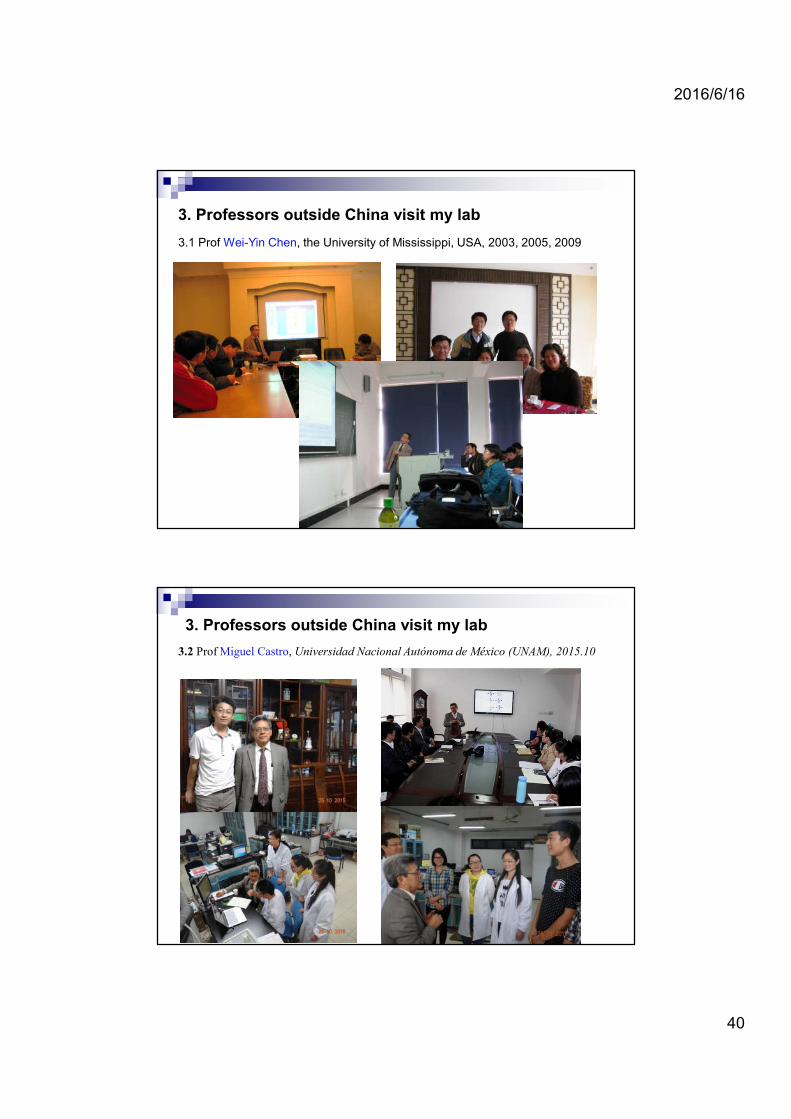
Gas production evolution during microwave pyrolysis
Tem
pera
ture
Gas
pro
duct
ion
0
5
10
15
20
25
30
35
40
45
50
55
60
65
CO2CH4COH2
ZnCl2: DS=1:2
(wt/wt)水蒸气流量1.59g/min
Gas
con
cent
rati
on /
vol
.%
400-700℃ 700-850℃ >850℃
CaO: DS=1:2 (wt/wt)水蒸气流量 1.59g/min
H2 CO CH4 CO2
体积分数/vol.%
800~950℃
700~800℃
400~700℃
Pyrolysis gas distribution under combined effect of catalyst and steam
Vol
um
e fr
acti
on
Steam flow Steam flow
2.6.2 Sewage sludge pyrolysis for hydrogen production
0
5
10
15
20
25
30
35
40
45
50
55
60
65
Gas
con
centr
atio
n /
vol.
%
DS CaO: DS=1:2(wt/wt)
ZnCl2: DS=1:2(wt/wt)
水蒸气流量 1.59g/min
CaO: DS=1:2(wt/wt),水蒸气
流量1.59g/min ZnCl2: DS=1:2(wt/wt),水蒸气
流量1.59g/min
H2 CO CH4 CO2
体积分数/vol.%
CaO:DS = 1:2
ZnCl2:DS = 1:2
CaO:DS = 1:2, 水蒸气流量1.59 g/min
ZnCl2:DS = 1:2, 水蒸气流量1.59 g/min
水蒸气流量1.59 g/min
Comparison of gaseous distributions under different microwave pyrolysisconditions (850 ºC)
Vol
um
e fr
acti
on
Steam flow
Steam flow
Steam flow
2.6 Microwave-Induced Sewage Sludge Pyrolysis
2.6.3 Methane decomposition over sludge residue for hydrogen production
0
100
200
300
400
500
600
700
800
900
1000
0
0.2
0.4
0.6
0.8
1
1.2
1.4
0 20 40 60 80 100 120
320 W, 0.3 L g-1 h-1
320 W, 0.15 L g-1 h-1
320 W,0.3 L g-1 h-1
320 W, 0.15 L g-1 h-1
A
B
a
b
100
80
60
40
20
0
Time (min)
Tem
per
atu
re (
ºC)
CH
4co
nv
ersi
on
(%
)
Temperature and methane conversion over pyrolysis residue under microwave heating. A and a: 320 W, 0.3 L g-1 h-1; B and b: 320 W, 0.15 L g-1 h-1.
0
1000
2000
3000
4000
5000
6000
0 10 20 30 40 50 60 70 80 90
2θ (º)
Co
un
ts
(a)
(b)
Quartz – SiO2
Anorthite – CaAl2(SiO2)4
Kaolinite – Al2SiO5
XRD ananlysis of the molten beads
Molten beads (left) and nano-tubes formed over pyrolysis residue by microwave induced methane decomposition.
Wenyi Deng, Yaxin Su, Shugang Liu, et al. International Journal of Hydrogen Energy. 2014, 39: 9169-9179.
2016/6/16
40
3. Professors outside China visit my lab
3.1 Prof Wei-Yin Chen, the University of Mississippi, USA, 2003, 2005, 2009
3. Professors outside China visit my lab
3.2 Prof Miguel Castro, Universidad Nacional Autónoma de México (UNAM), 2015.10
2016/6/16
41
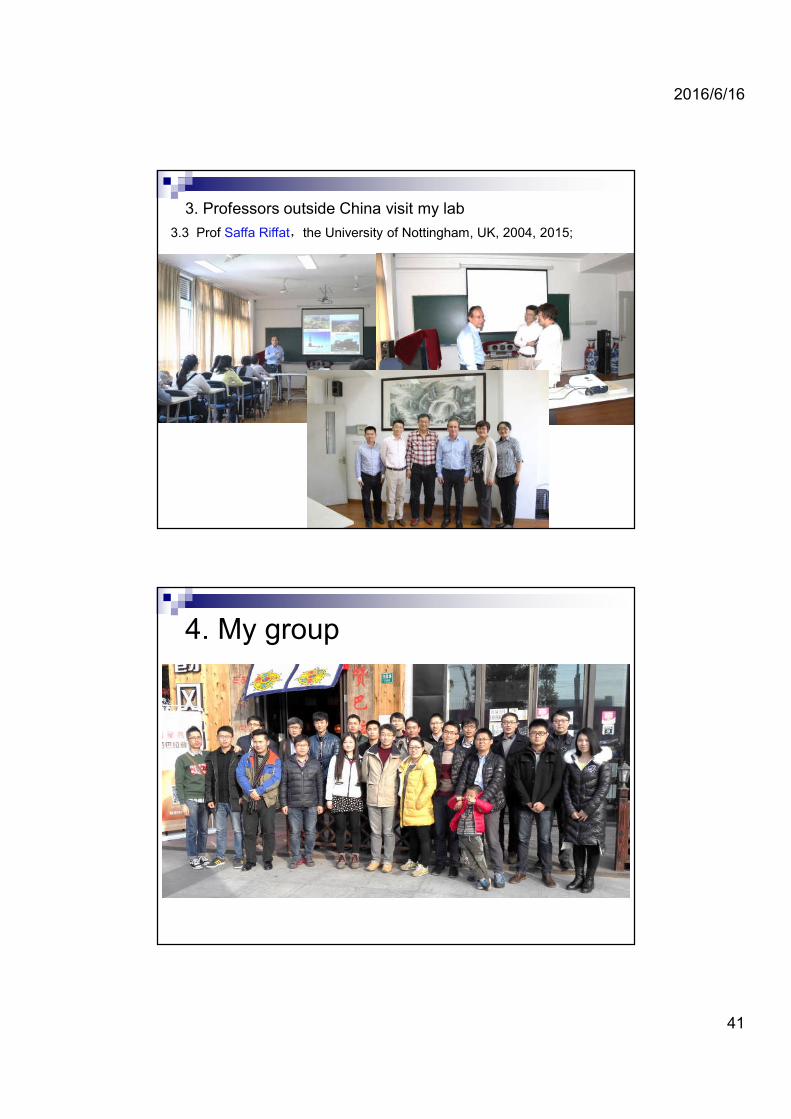
3. Professors outside China visit my lab
3.3 Prof Saffa Riffat,the University of Nottingham, UK, 2004, 2015;
4. My group

2016/6/16
42
4. My group
Thank you and welcome to visit Shanghai!