University of South Florida University of South Florida
Scholar Commons Scholar Commons
Graduate Theses and Dissertations Graduate School
November 2019
Ratios and Proportional Reasoning Representations in Open Ratios and Proportional Reasoning Representations in Open
Educational Resources Educational Resources
Keisha L. Albritton University of South Florida
Follow this and additional works at: https://scholarcommons.usf.edu/etd
Part of the Science and Mathematics Education Commons
Scholar Commons Citation Scholar Commons Citation Albritton, Keisha L., "Ratios and Proportional Reasoning Representations in Open Educational Resources" (2019). Graduate Theses and Dissertations. https://scholarcommons.usf.edu/etd/8000
This Dissertation is brought to you for free and open access by the Graduate School at Scholar Commons. It has been accepted for inclusion in Graduate Theses and Dissertations by an authorized administrator of Scholar Commons. For more information, please contact [email protected].
Ratios and Proportional Reasoning Representations in Open Educational Resources
by
Keisha L. Albritton
A dissertation submitted in partial fulfillment of the requirements for the degree of
Doctor of Philosophy in Curriculum and Instruction with a concentration in Mathematics Education
Department of Teaching and Learning College of Education
University of South Florida
Major Professor: Ruthmae Sears, Ph.D. Darlene DeMarie, Ph.D.
Tonisha Lane, Ph.D. Liliana Rodriguez-Campos, Ph.D.
Michael Sherry, Ph.D.
Date of Approval: October 21, 2019
Keywords: Online textbooks, middle school mathematics, Standards for Mathematical Practice,
concept image
Copyright © 2019, Keisha L. Albritton
Dedication
To my family, I love you. You are the most important people in my world, and I
appreciate all that you have given and sacrificed for me to have gotten to this point. To my
husband, Tony Albritton, your love and support have been invaluable. You have held it together
in multiple ways and occasions. I love you. I appreciate you taking this journey with me and
cheering me on along the way. To my children, Godchildren and Butter, thank you for the grace
you have given me to miss games and events to get the next assignment done. Your encouraging
words have fueled me in ways I can’t explain. I hope I have made you all as proud of me as I am
of all of you (Amani & Justin, Elijah, Caleb, Zaria, Philip & Je’Neen & PJ). To my Dad,
Nathaniel Smith, you are my superhero. I love you and I appreciate all you have done for me
along this journey. I could not have done this without you. To my extended family, church
family, coworkers and friends, thank you for your love and support.
To the village of queens who continually straighten my crown and send me back out to
conquer another day, (Doretha Jackson, Ayakao Watkins, Carrie Hepburn, Tara Fowler, April
Fletcher). You have dried my tears and encouraged me. You have held the mirror to check me on
more than one occasion and I am and will continue to be forever grateful. Joy, Gail, Michelle,
Chantae, Tameka and Loretta, thank you for holding me accountable, for allowing me into your
lives and taking this journey with me.
Thank you, Lord, for this journey. I could not have even started without you, but to finish
what you started in me is truly a blessing. May my brave excite You. May my fearless, honor
You. May my steps, failing or valiant, bring glory to Your Kingdom.
Acknowledgements
I would like to thank all of my professors at the University of South Florida and
especially my committee members. You challenged my perspectives and provided opportunities
for me to learn. You fostered my growth as a researcher and as an educator. My experience at
USF has been unforgettable. I value the time you have taken with me, the attention to detail in
my work and your respect for my interests and perspectives.
Special thanks to Dr. Ruthmae Sears for being my guide, advisor and mentor through this
program and dissertation process. I started this program with a challenge from you to get things
done. You have provided opportunities for me to explore my interests and the feedback I needed
to improve my craft. Your support has been vital and instrumental to my completion. I am
forever grateful.
Thank you to my fellow doctoral students at the University of South Florida. I have
grown because of your thoughtful perspective and willingness to question everything. I am
especially indebted to Gail Stewart, Tara Fowler and Latonya Hill for your help with this study.
Your time, patience and feedback were invaluable.
i
Table of Contents
List of Tables .................................................................................................................... iv List of Figures .................................................................................................................. viii Abstract .................................................................................................................... ix Chapter 1 Introduction and Study Rationale ................................................................................... 1 Significance of Proportionality, Ratios and Proportions .................................................... 1 Examples of Proportionality ............................................................................................... 2 Curriculum Documents that Attend to Ratios and Proportions .......................................... 3 Research Question .................................................................................................. 4 Theoretical Perspective ....................................................................................................... 4 Definitions ..................................................................................................................... 7 Different Contexts for Ratios .................................................................................. 8 Solutions Strategies for Solving Proportions .......................................................... 9 Chapter 2 Literature Review ......................................................................................................... 10 Proportionality .................................................................................................................. 10 Teachers’ Use of Textbook ............................................................................................... 19 Features of Textbooks ........................................................................................... 22 Open Education Resources ................................................................................... 22 International and National Studies ........................................................................ 24 Developing Mathematical Proficiency and Literacy ........................................................ 25 NCTM Process Standards ..................................................................................... 25 Problem-Solving ....................................................................................... 26 Reasoning and Proof ................................................................................. 26 Communications ....................................................................................... 26 Connections ............................................................................................... 27 Representations ......................................................................................... 27 Mathematical Proficiency ..................................................................................... 29 Conceptual Understanding ........................................................................ 29 Procedural Fluency ................................................................................... 29 Strategic Competence ............................................................................... 29 Adaptive Reasoning .................................................................................. 30 Productive Disposition .............................................................................. 30 Standards for Mathematical Practice .................................................................... 30 Making Sense of Problems and Persevere in Solving Them .................... 31 Reason Abstractly and Quantitatively ...................................................... 31
ii
Construct Viable Arguments and Critiques the Reasoning of Others ...... 32 Model with Mathematics .......................................................................... 32 Use Appropriate Tools Strategically ......................................................... 33 Attend to Precision .................................................................................... 33 Look for and Make Use of Structure ........................................................ 33 Look for and Express Regularity in Repeated Reasoning ........................ 34 Summary of Literature Review ......................................................................................... 34 Chapter 3 Methods ................................................................................................................... 36 Selection of Textbooks ..................................................................................................... 38 Engage NY ............................................................................................................ 38 Open Up Resources ............................................................................................... 40 Utah Middle School Mathematics Project ............................................................ 42 Procedure for Analysis ...................................................................................................... 43 Frameworks ........................................................................................................... 46 Data Analysis ........................................................................................................ 60 Reliability and Validity ..................................................................................................... 60 Delimitations and Limitations ........................................................................................... 60 Conclusion ................................................................................................................... 63 Chapter 4 Findings ................................................................................................................... 64 Textbook Organizational Structures and Features ............................................................ 65 Engage NY ............................................................................................................ 65 Open Up ................................................................................................................ 76 Utah Middle School Math Project ........................................................................ 87 Similarities and Differences by Framework ..................................................................... 99 Van de Walle (2007) ............................................................................................. 99 Part-to-Whole Ratios ................................................................................ 99 Part-to-Part Ratios ................................................................................... 100 Rates as Ratios ........................................................................................ 102 In the Same Ratio (Identify) ................................................................... 103 In the Same Ratio (Create) ...................................................................... 104 Solving a Proportion ............................................................................... 105 Slope or Rate of Change ......................................................................... 106 Corresponding Parts of Similar Figures .................................................. 107 Categories without Representative Tasks ............................................... 107 Van de Walle (2007) Summary .............................................................. 107 Lamon (2012) ...................................................................................................... 109 Part-Part-Whole ...................................................................................... 110 Associated Sets ....................................................................................... 111 Well-Chunked Measures ......................................................................... 112 Stretchers and Shrinkers ......................................................................... 113 Lamon (2012) Summary ......................................................................... 114 Lesh et al. (1998) ................................................................................................ 115 Missing Value ......................................................................................... 116 Comparison ............................................................................................. 117
iii
Transformation ........................................................................................ 118 Mean Value ............................................................................................. 120 Conversion from Ratios to Rates to Fractions ........................................ 120 Units with their Measures ....................................................................... 121 Translating Representational Modes ....................................................... 122 Lesh et al. (1998) Summary .................................................................... 124 Tall and Vinner (1981) ........................................................................................ 125 Figure ...................................................................................................... 126 Table ...................................................................................................... 127 Graph and Model ................................................................................... 128 Real World Scenario ............................................................................... 130 Formal Property Stated ........................................................................... 131 Formal Definition .................................................................................... 133 Student Created Definition ..................................................................... 134 Tool for Manipulation ............................................................................. 136 Tall and Vinner (1981) Summary ........................................................... 137 Hunsader et al (2014) .......................................................................................... 141 Reasoning and Proof ............................................................................... 142 Opportunity for Mathematical Communication ...................................... 143 Connections ............................................................................................. 145 Representation: Role of Graphics ........................................................... 147 Representation: Translation of Representational Forms ......................... 149 Hunsader et al. (2014) Summary ............................................................ 151 Summary ................................................................................................................. 156 Chapter 5 Summary, Discussion, Recommendations and Limitations ....................................... 161 Summary of the Problem and Research Questions ......................................................... 161 Methods ................................................................................................................. 161 Findings ................................................................................................................. 163 Similarities and Differences Between the Organizational Structures and Features ....... 163 Opportunities for Students to Utilize the Standards for Mathematical Practice ............. 165 Discussion ................................................................................................................. 167 Recommendations for Future Research .......................................................................... 171 Summary ................................................................................................................. 172 References ................................................................................................................. 175
iv
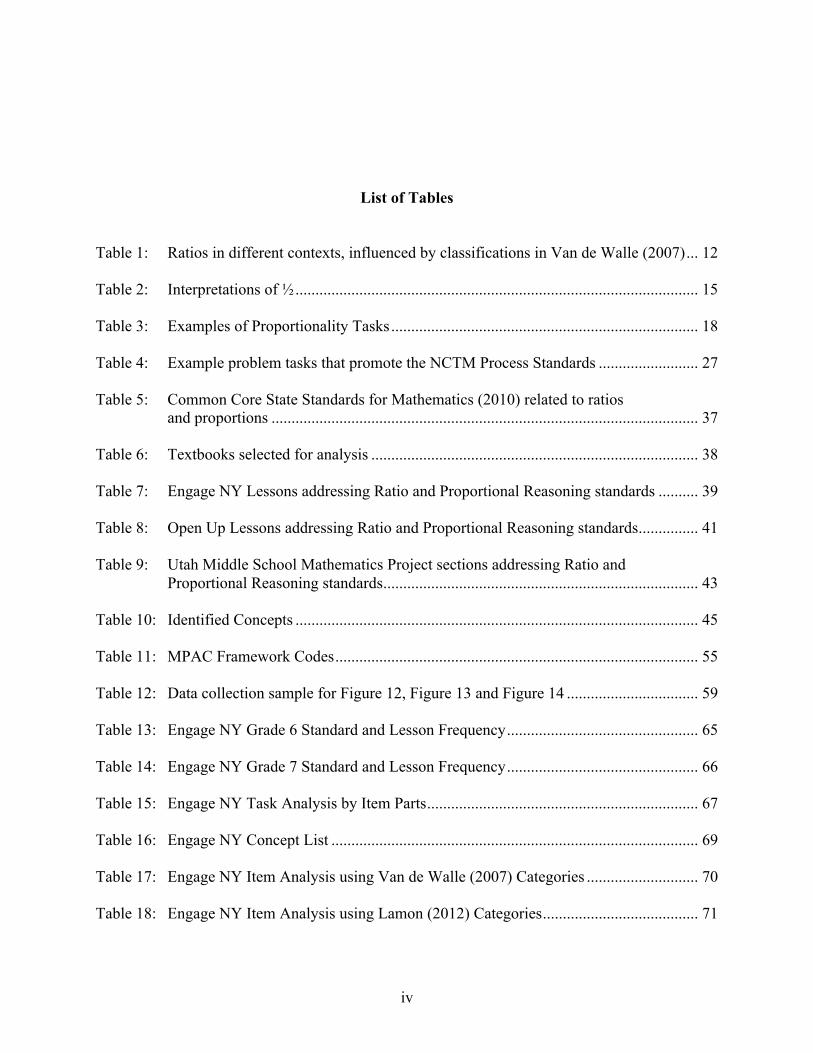
List of Tables
Table 1: Ratios in different contexts, influenced by classifications in Van de Walle (2007) ... 12 Table 2: Interpretations of ½ ..................................................................................................... 15 Table 3: Examples of Proportionality Tasks ............................................................................. 18 Table 4: Example problem tasks that promote the NCTM Process Standards ......................... 27 Table 5: Common Core State Standards for Mathematics (2010) related to ratios and proportions ........................................................................................................... 37 Table 6: Textbooks selected for analysis .................................................................................. 38 Table 7: Engage NY Lessons addressing Ratio and Proportional Reasoning standards .......... 39 Table 8: Open Up Lessons addressing Ratio and Proportional Reasoning standards ............... 41 Table 9: Utah Middle School Mathematics Project sections addressing Ratio and Proportional Reasoning standards ............................................................................... 43 Table 10: Identified Concepts ..................................................................................................... 45 Table 11: MPAC Framework Codes ........................................................................................... 55 Table 12: Data collection sample for Figure 12, Figure 13 and Figure 14 ................................. 59 Table 13: Engage NY Grade 6 Standard and Lesson Frequency ................................................ 65 Table 14: Engage NY Grade 7 Standard and Lesson Frequency ................................................ 66 Table 15: Engage NY Task Analysis by Item Parts .................................................................... 67 Table 16: Engage NY Concept List ............................................................................................ 69 Table 17: Engage NY Item Analysis using Van de Walle (2007) Categories ............................ 70 Table 18: Engage NY Item Analysis using Lamon (2012) Categories ....................................... 71
v
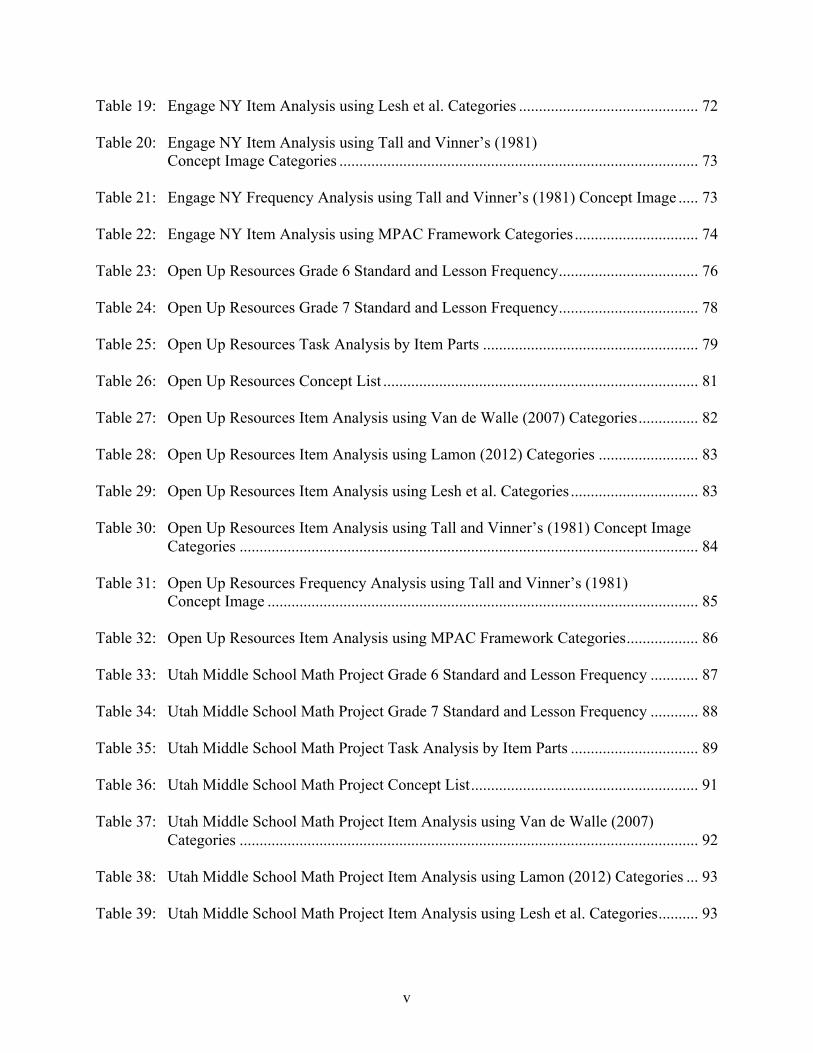
Table 19: Engage NY Item Analysis using Lesh et al. Categories ............................................. 72 Table 20: Engage NY Item Analysis using Tall and Vinner’s (1981) Concept Image Categories .......................................................................................... 73 Table 21: Engage NY Frequency Analysis using Tall and Vinner’s (1981) Concept Image ..... 73 Table 22: Engage NY Item Analysis using MPAC Framework Categories ............................... 74 Table 23: Open Up Resources Grade 6 Standard and Lesson Frequency ................................... 76 Table 24: Open Up Resources Grade 7 Standard and Lesson Frequency ................................... 78 Table 25: Open Up Resources Task Analysis by Item Parts ...................................................... 79 Table 26: Open Up Resources Concept List ............................................................................... 81 Table 27: Open Up Resources Item Analysis using Van de Walle (2007) Categories ............... 82 Table 28: Open Up Resources Item Analysis using Lamon (2012) Categories ......................... 83 Table 29: Open Up Resources Item Analysis using Lesh et al. Categories ................................ 83 Table 30: Open Up Resources Item Analysis using Tall and Vinner’s (1981) Concept Image Categories ................................................................................................................... 84 Table 31: Open Up Resources Frequency Analysis using Tall and Vinner’s (1981) Concept Image ............................................................................................................ 85 Table 32: Open Up Resources Item Analysis using MPAC Framework Categories .................. 86 Table 33: Utah Middle School Math Project Grade 6 Standard and Lesson Frequency ............ 87 Table 34: Utah Middle School Math Project Grade 7 Standard and Lesson Frequency ............ 88 Table 35: Utah Middle School Math Project Task Analysis by Item Parts ................................ 89 Table 36: Utah Middle School Math Project Concept List ......................................................... 91 Table 37: Utah Middle School Math Project Item Analysis using Van de Walle (2007)
Categories ................................................................................................................... 92 Table 38: Utah Middle School Math Project Item Analysis using Lamon (2012) Categories ... 93 Table 39: Utah Middle School Math Project Item Analysis using Lesh et al. Categories .......... 93
vi
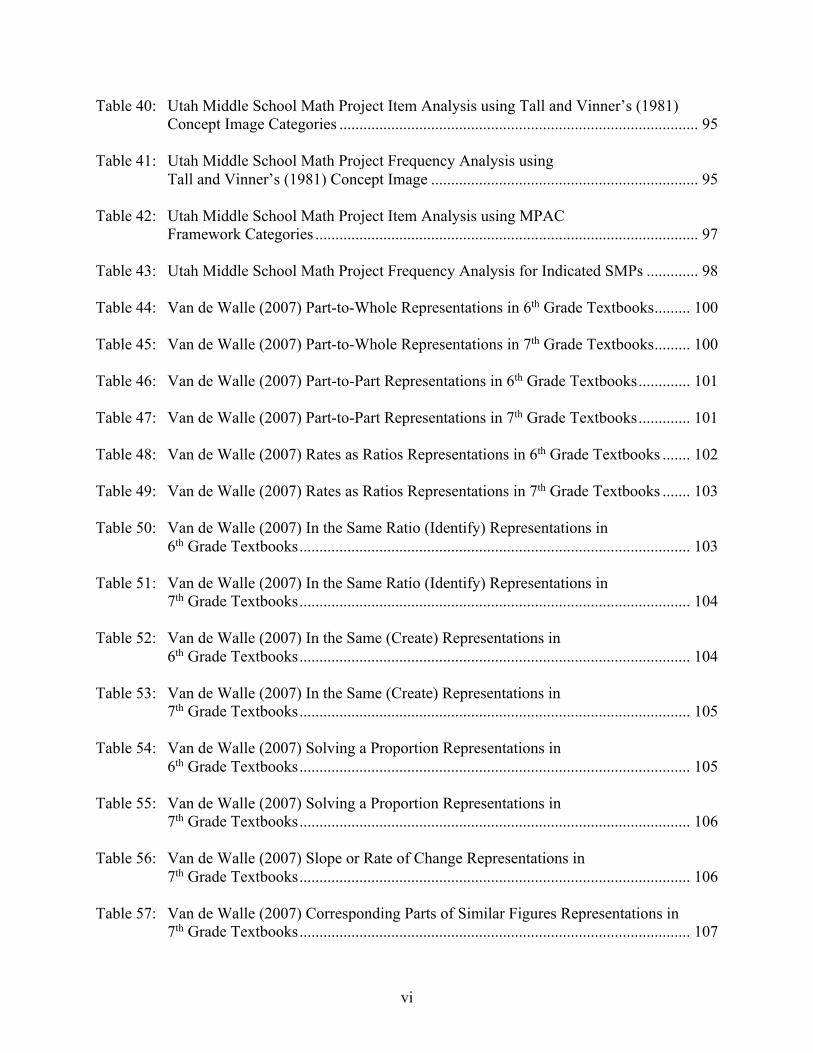
Table 40: Utah Middle School Math Project Item Analysis using Tall and Vinner’s (1981) Concept Image Categories .......................................................................................... 95 Table 41: Utah Middle School Math Project Frequency Analysis using Tall and Vinner’s (1981) Concept Image ................................................................... 95 Table 42: Utah Middle School Math Project Item Analysis using MPAC Framework Categories ................................................................................................ 97 Table 43: Utah Middle School Math Project Frequency Analysis for Indicated SMPs ............. 98 Table 44: Van de Walle (2007) Part-to-Whole Representations in 6th Grade Textbooks ......... 100 Table 45: Van de Walle (2007) Part-to-Whole Representations in 7th Grade Textbooks ......... 100 Table 46: Van de Walle (2007) Part-to-Part Representations in 6th Grade Textbooks ............. 101 Table 47: Van de Walle (2007) Part-to-Part Representations in 7th Grade Textbooks ............. 101 Table 48: Van de Walle (2007) Rates as Ratios Representations in 6th Grade Textbooks ....... 102 Table 49: Van de Walle (2007) Rates as Ratios Representations in 7th Grade Textbooks ....... 103 Table 50: Van de Walle (2007) In the Same Ratio (Identify) Representations in 6th Grade Textbooks .................................................................................................. 103 Table 51: Van de Walle (2007) In the Same Ratio (Identify) Representations in 7th Grade Textbooks .................................................................................................. 104 Table 52: Van de Walle (2007) In the Same (Create) Representations in 6th Grade Textbooks .................................................................................................. 104 Table 53: Van de Walle (2007) In the Same (Create) Representations in 7th Grade Textbooks .................................................................................................. 105 Table 54: Van de Walle (2007) Solving a Proportion Representations in 6th Grade Textbooks .................................................................................................. 105 Table 55: Van de Walle (2007) Solving a Proportion Representations in 7th Grade Textbooks .................................................................................................. 106 Table 56: Van de Walle (2007) Slope or Rate of Change Representations in 7th Grade Textbooks .................................................................................................. 106 Table 57: Van de Walle (2007) Corresponding Parts of Similar Figures Representations in 7th Grade Textbooks .................................................................................................. 107
vii
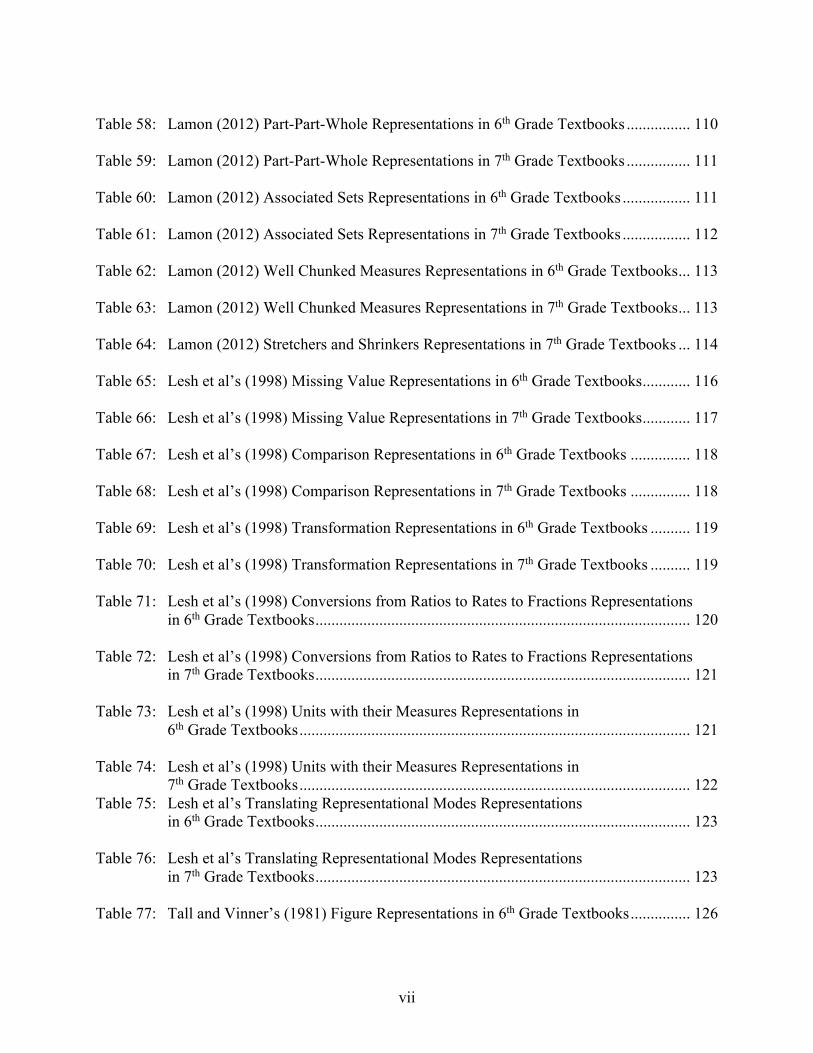
Table 58: Lamon (2012) Part-Part-Whole Representations in 6th Grade Textbooks ................ 110 Table 59: Lamon (2012) Part-Part-Whole Representations in 7th Grade Textbooks ................ 111 Table 60: Lamon (2012) Associated Sets Representations in 6th Grade Textbooks ................. 111 Table 61: Lamon (2012) Associated Sets Representations in 7th Grade Textbooks ................. 112 Table 62: Lamon (2012) Well Chunked Measures Representations in 6th Grade Textbooks ... 113 Table 63: Lamon (2012) Well Chunked Measures Representations in 7th Grade Textbooks ... 113 Table 64: Lamon (2012) Stretchers and Shrinkers Representations in 7th Grade Textbooks ... 114 Table 65: Lesh et al’s (1998) Missing Value Representations in 6th Grade Textbooks ............ 116 Table 66: Lesh et al’s (1998) Missing Value Representations in 7th Grade Textbooks ............ 117 Table 67: Lesh et al’s (1998) Comparison Representations in 6th Grade Textbooks ............... 118 Table 68: Lesh et al’s (1998) Comparison Representations in 7th Grade Textbooks ............... 118 Table 69: Lesh et al’s (1998) Transformation Representations in 6th Grade Textbooks .......... 119 Table 70: Lesh et al’s (1998) Transformation Representations in 7th Grade Textbooks .......... 119 Table 71: Lesh et al’s (1998) Conversions from Ratios to Rates to Fractions Representations in 6th Grade Textbooks .............................................................................................. 120 Table 72: Lesh et al’s (1998) Conversions from Ratios to Rates to Fractions Representations in 7th Grade Textbooks .............................................................................................. 121 Table 73: Lesh et al’s (1998) Units with their Measures Representations in 6th Grade Textbooks .................................................................................................. 121 Table 74: Lesh et al’s (1998) Units with their Measures Representations in 7th Grade Textbooks .................................................................................................. 122 Table 75: Lesh et al’s Translating Representational Modes Representations in 6th Grade Textbooks .............................................................................................. 123 Table 76: Lesh et al’s Translating Representational Modes Representations in 7th Grade Textbooks .............................................................................................. 123 Table 77: Tall and Vinner’s (1981) Figure Representations in 6th Grade Textbooks ............... 126
viii
Table 78: Tall and Vinner’s (1981) Figure Representations in 7th Grade Textbooks ............... 127 Table 79: Tall and Vinner’s (1981) Table Representations in 6th Grade Textbooks ................ 128 Table 80: Tall and Vinner’s (1981) Table Representations in 7th Grade Textbooks ................ 128 Table 81: Tall and Vinner’s (1981) Graph or Model Representations in 6th Grade Textbooks .............................................................................................. 129 Table 82: Tall and Vinner’s (1981) Graph or Model Representations in 7th Grade Textbooks .............................................................................................. 130 Table 83: Tall and Vinner’s (1981) Real-World Representations in 6th Grade Textbooks ...... 130 Table 84: Tall and Vinner’s (1981) Real-World Representations in 7th Grade Textbooks ...... 131 Table 85: Tall and Vinner’s (1981) Properties Representations in 6th Grade Textbooks ......... 132 Table 86: Tall and Vinner’s (1981) Properties Representations in 7th Grade Textbooks ......... 133 Table 87: Tall and Vinner’s (1981) Definition Representations in 6th Grade Textbooks ......... 133 Table 88: Tall and Vinner’s (1981) Definition Representations in 7th Grade Textbooks ......... 134 Table 89: Tall and Vinner’s (1981) Student Created Definition Representations in 6th Grade Textbooks .............................................................................................. 135 Table 90: Tall and Vinner’s (1981) Student Created Definition Representations in 7th Grade Textbooks .............................................................................................. 136 Table 91: Tall and Vinner’s (1981) Tools for Manipulation Representations in 6th Grade Textbooks .............................................................................................. 136 Table 92: Tall and Vinner’s (1981) Tools for Manipulation Representations in 7th Grade Textbooks .............................................................................................. 137 Table 93: Comparative Item Analysis using MPAC Framework Category: Reasoning and Proof in 6th Grade ............................................................................. 142 Table 94: Comparative Item Analysis using MPAC Framework Category: Reasoning and Proof in 7th Grade ............................................................................. 143 Table 95: Comparative Item Analysis using MPAC Framework Category: Opportunity for Mathematical Communication in 6th Grade .................................... 144 Table 96: Comparative Item Analysis using MPAC Framework Category:
ix
Opportunity for Mathematical Communication in 7th Grade .................................... 145
Table 97: Comparative Item Analysis using MPAC Framework Category: Mathematical Connections in 6th Grade .................................................................... 146
Table 98: Comparative Item Analysis using MPAC Framework Category: Mathematical Connections in 7th Grade .................................................................... 147
Table 99: Comparative Item Analysis using MPAC Framework Category: Representation: Role of Graphics in 6th Grade ......................................................... 148
Table 100: Comparative Item Analysis using MPAC Framework Category: Representation: Role of Graphics in 7th Grade ......................................................... 149
Table 101: Comparative Item Analysis using MPAC Framework Category: Representation: Translation of Representational Forms in 6th Grade ....................... 150
Table 102: Comparative Item Analysis using MPAC Framework Category: Representation: Translation of Representational Forms in 7th Grade ....................... 151
x
List of Figures
Figure 1: Exemplification of concept image and concept definition from Rösken and Rolka (2007) .............................................................................................. 5 Figure 2: Exemplification of concept image and concept definition of scale from Rösken and Rolka (2007) .............................................................................................. 6 Figure 3: A conceptual framework to guide the analysis of proportionality in textbooks ......... 44 Figure 4: Illustration of a Part to Whole Ratio task .................................................................... 46 Figure 5: Illustration of a Part to Part Ratio task ........................................................................ 47 Figure 6: Illustration of a Rates and Ratio task .......................................................................... 47 Figure 7: Illustration of an In the Same Ratio (Identify) task .................................................... 48 Figure 8: Illustration of an In the Same Ratio (Create) task ....................................................... 49 Figure 9: Illustration of Solving a Proportion task ..................................................................... 49 Figure 10: Illustration of Slope or Rate of Change task ............................................................... 50 Figure 11: Illustration of Corresponding Parts of Similar Figures task ....................................... 51 Figure 12: Open Up Resources Cooking Oatmeal Task .............................................................. 52 Figure 13: Engage NY Exercise 5 ................................................................................................ 53 Figure 14: Utah Middle School Math Project Lemon Juice task ................................................. 57 Figure 15: Open Up Resources Turning Green task .................................................................... 58 Figure 16: Example of a task omitted from analysis .................................................................... 62 Figure 17: Van de Walle Percentage Comparisons based on Van de Walle (2007) Categories in 6th Grade Textbooks ............................................................................ 108
xi
Figure 18: Van de Walle Percentage Comparisons based on Van de Walle (2007) Categories in 7th Grade Textbooks ............................................................................ 109 Figure 19: Lamon Percentage Comparisons based on Lamon (2012)
Categories in 6th Grade Textbooks ............................................................................ 114 Figure 20: Lamon Percentage Comparisons based on Lamon (2012) Categories in 7th Grade Textbooks .................................................................................................. 115 Figure 21: Lesh et al. Percentage Comparisons based on Lesh, Post, and Behr (1988) Categories in 6th Grade Textbooks .............................................................................................. 124 Figure 22: Lesh et al. Percentage Comparisons based on Lesh et al. (1988) Categories in 7th Grade Textbooks .............................................................................................. 125 Figure 23: Tall and Vinner Percentage Comparisons in 6th Grade Textbooks ........................... 138 Figure 24: Tall and Vinner Percentage Comparisons in 7th Grade Textbooks ........................... 139 Figure 25: Tall and Vinner Percentage Concept Image Components Addressed in Each Task in 6th Grade Textbooks ........................................................................ 140 Figure 26: Tall and Vinner Percentage Concept Image Components Addressed in Each Task in 7th Grade Textbooks ........................................................................ 141 Figure 27: Comparative Percentage Analysis of Reasoning and Proof Representations Across Grade Levels ................................................................................................. 152 Figure 28: Comparative Percentage Analysis of Connections Across Grade Levels ................ 153 Figure 29: Comparative Percentage Analysis of Opportunities for Mathematical Communication Across Grade Levels ...................................................................... 154 Figure 30: Comparative Percentage Analysis of Role of Graphics Across Grade Levels ......... 155 Figure 31: Comparative Percentage Analysis of Translation of Representational Forms Across Grade Levels ...................................................................................... 156
xii
Abstract
This study analyzed Open Educational Resource (OER) textbooks to determine
similarities and differences between the resources in relation to the content addressing ratio and
proportional reasoning standards. This study also analyzed whether the selected resources
provided opportunities for students to engage with the Standards for Mathematical Practice. Data
were collected from tasks within the 6th and 7th grade textbooks from Engage NY, Open Up
Resources and Utah Middle School Math Project. Each task was analyzed according to
frameworks from Van de Walle (2007), Lamon (2012), Lesh et al. (1988) Tall and Vinner
(1981), and Hunsader et al. (2014). The tasks were examined for their general presence within
the textbook, features of the task, capacity to support students in developing their concept image
for proportionality concepts and implementing the Standards for Mathematical Practice. The data
were analyzed using a comparative analysis of the frequencies and percentages of the various
characteristics evident in the textbooks.
The study found that OERs have the potential to provide access and opportunity for
students from various backgrounds to engage in research supported mathematics. The textbooks
presented in this study provided varied tasks and contexts for students to investigate
proportionality. Generally, the OERs did not differ significantly from traditional textbooks. The
implication of the study suggest the resources selected by teachers can provide a buffer from the
impact of variations in the state standards, content sequencing, and transient students. Each of
xiii
these OERs relied on the teacher to provide instruction on the concepts in the textbooks, hence
teacher preparation for using the textbooks selected will be critical for students.
1
Chapter 1
Introduction and Study Rationale
This dissertation examined how ratios and proportions are addressed within online
textbooks. Thus, to provide a rationale for the need for the study, this chapter will highlight the
significance of ratios, proportions, and proportionality. Subsequently, it will describe how ratios,
proportions, and proportionality are represented historically in the research literature and the
standards. Finally, it will highlight how theoretical perspectives frame representation of
textbooks relative to proportionality.
Significance of Proportionality, Ratios, and Proportions
Proportionality, ratios, and proportions are critical concepts in mathematics. Often
researchers and textbook publishers use the terms proportionality and proportional reasoning
interchangeably. Proportionality permeates multiple domains across middle grades mathematics
(NCTM, 2000, p. 151) and can be illustrated in multiple ways. Lanius and Williams (2003)
describe three distinct ways proportionality can be represented: (1) algebraically, as a linear
function, y=kx or y=mx; (2) graphically, as a line that intersects the origin on the coordinate
plane; and (3) verbally, as a description of the relationship. Algebraic representations of
proportionality initially appear in most curricula when students explore ratio and proportional
reasoning standards and again as students study expressions and equations. Graphical
representations appear in both geometry and measurement domains. Verbal descriptions support
students with problem-solving, communication, and connection skills as they manipulate the
mathematical construct (NCTM, 2000).
2
In the model, y=kx, k represents the constant of proportionality. This term quantifies the
relationship between the x and y values. In an equation, k is a constant coefficient to the
independent variable. Graphically, k is the slope of the line intersecting the origin. In a table, k
determines the difference between entries, respectively (Lamon, 2012). Also, this variance may
be labeled a rate or scale factor depending on the context of the problem. Proportionality and its
associated concepts affect many domains. It is vital to understand the history behind
proportionality.
Examples of Proportionality
Proportionality has been illustrated in multiple ways, “including ratio and proportion,
percent, similarity, scaling, linear equations, slope, relative-frequency, histograms, and
probability” (NCTM, 2000, p. 212). Proportional reasoning also emerges when problem-solving,
reasoning, and connecting concepts with other mathematical and non-mathematical topics.
Proportional reasoning was a significant concept addressed in the National Research
Council's (NRC) Adding It Up (2001). Proportional reasoning included understanding ratios as
multiplicative relationships and converting ratios to unit rates. Proficiency with proportional
reasoning depended on three aspects, (1) learning to make multiplicative comparisons, (2)
discerning between static and variable features of proportional situations, and (3) building
composite units. Students exposed to proportional relationships may see problems in varied
forms. Adding It Up (2001) illustrated missing value problems, numerical comparison problems,
and qualitative comparison problems. NRC recommended a gradual transition from concrete
situations or materials to models or algorithmic problems. The focus on conceptual
representations supports the development of mathematical proficiency rather than a narrow focus
solely on computation.
3
Van de Walle (2007) also set proportionality as the foundation for multiple concepts. For
example, creating equivalent fractions relys on the multiplicative process inherent in proportional
relationships. The concept of similarity provides a visual representation of proportionality. Both
probability and relative frequency depend on a Part-to-Whole ratio relationships for their
calculations. Also, in algebra, the concept of slope and rate of change are both ratios used to find
graphical and numeric predictions and relationships. These essential understandings provide a
framework for the content conveyed in textbooks claiming alignment with the Common Core
State Standards.
Curriculum Documents that Attend to Ratios and Proportions
Curriculum documents, to which textbooks frequently align, for almost the past century
have placed attention on ratios and proportions. As early as 1923, mathematical associations
made recommendations on what the standard curriculum should contain. More often than not,
proportionality, ratios, and proportions are covered topics. In 1989 and 2000, The National
Council of Teachers of Mathematics (NCTM) recommended that instruction on ratios begin with
practical applications where ratios naturally occur. They also suggested that discussions based on
ratios emphasize the order of the quantities and the multiplicative relationship between the
quantities. Once students have grasped ratios in varied contexts and forms, they can use that
knowledge to explore proportion, slope, and rational numbers. In 2010, the Common Core State
Standards for Mathematics (CCSSM) content standards explicated what students should
understand relative to ratios and proportions. This resulted in textbook publishers , releasing new
editions of textbooks to address the published standards.
Since textbooks are a vital tool for mathematics instruction, it is essential to examine the
content they present and how students are expected to learn that content. Being sensitive to the
4
increasing popularity of web-based resources or Open Educational Resource (OER) textbooks,
this study focuses on how these textbooks addressed ratios, proportions, and proportionality.
This study documented similarities and differences, and the extent to which the questions relative
to proportionality increases opportunities for students to engage with the Standards for
Mathematical Practice.
Research Questions
This study addressed the following research questions:
1. What are similarities and differences between the organizational structures and
features of online OER textbooks with relation to ratio and proportional reasoning
standards?
2. To what extent do online OER textbooks provide opportunities for students to utilize
the Standards for Mathematical Practice to address ratio and proportional reasoning
standards?
Theoretical Perspective
This study examined the content of textbooks related to ratios and proportions based on
images, text, and other features. Hence, the researcher adhered to Tall and Vinner (1981), who
theorized how students understand mathematical concepts. Tall and Vinner (1981) proposed that
when students interacted with an idea, they formed a concept image. This concept image was the
combination of the mental pictures, processes, and properties that the students associated with
that concept, over time. The concept image may be different from the concept definition, which
is the language used to specify the concept, either personally or formally constructed. The
concept definition also generated its concept image within the students, which then becomes a
part of the original concept image. These images remain intact until the students experiences
5
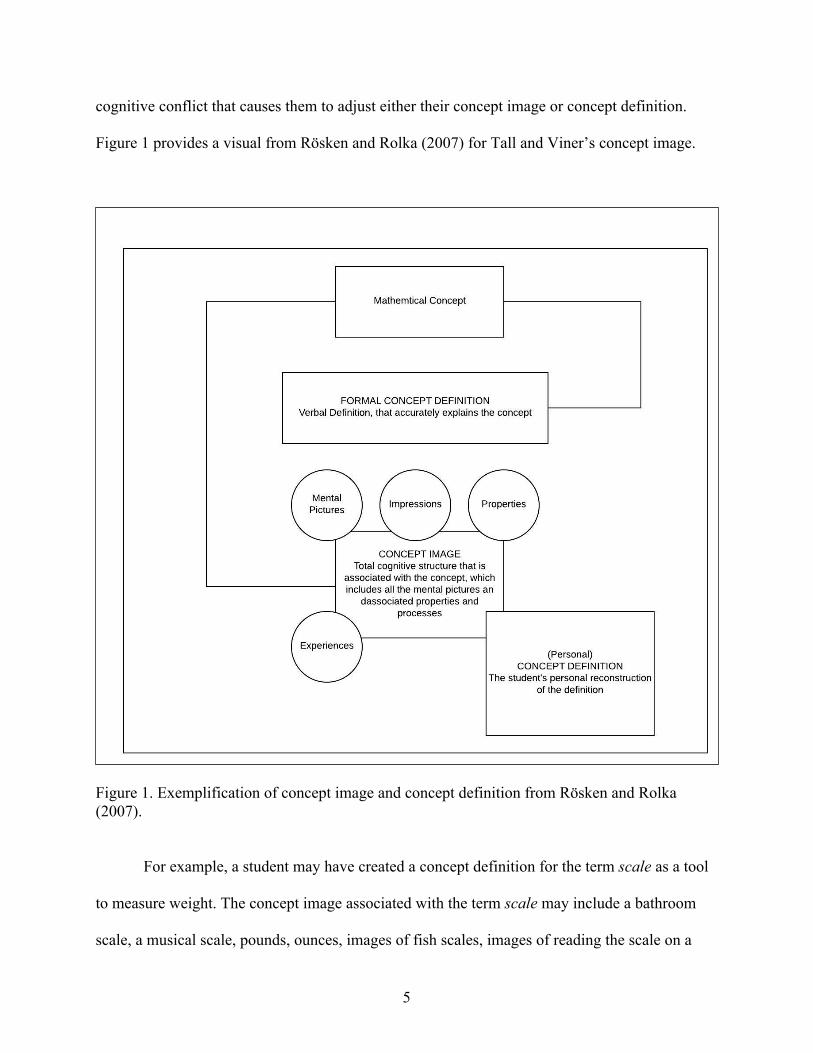
cognitive conflict that causes them to adjust either their concept image or concept definition.
Figure 1 provides a visual from Rösken and Rolka (2007) for Tall and Viner’s concept image.
Figure 1. Exemplification of concept image and concept definition from Rösken and Rolka (2007).
For example, a student may have created a concept definition for the term scale as a tool
to measure weight. The concept image associated with the term scale may include a bathroom
scale, a musical scale, pounds, ounces, images of fish scales, images of reading the scale on a
6
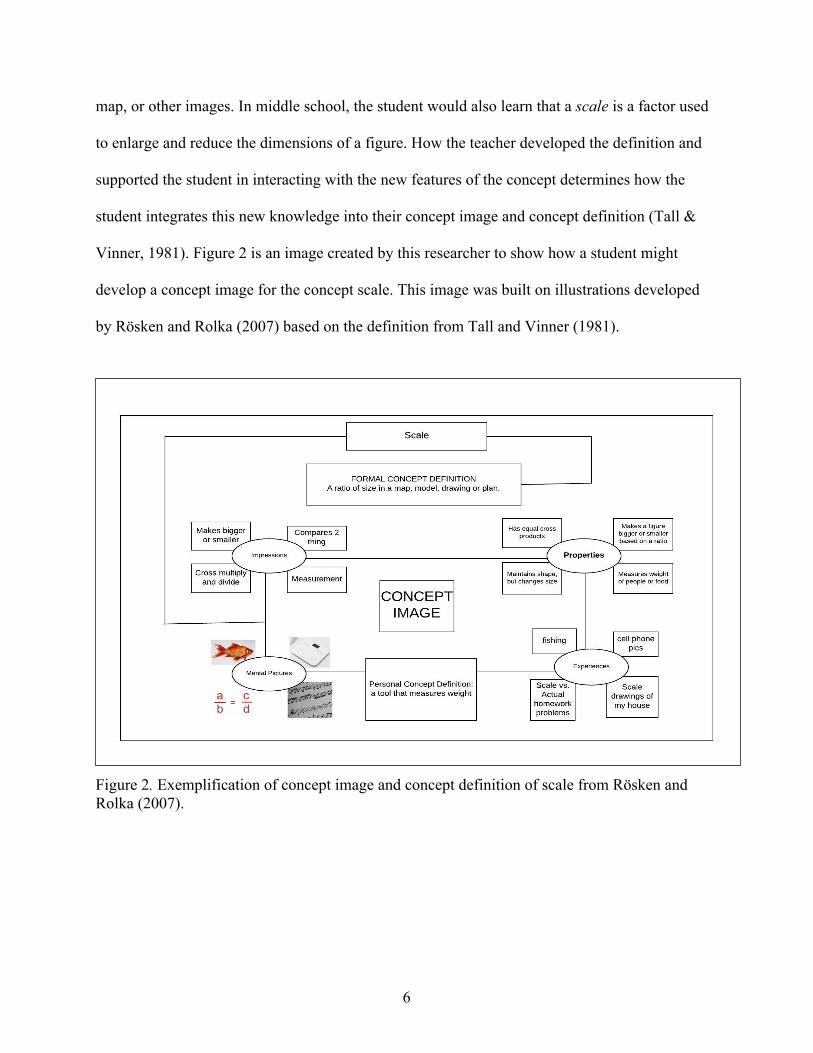
map, or other images. In middle school, the student would also learn that a scale is a factor used
to enlarge and reduce the dimensions of a figure. How the teacher developed the definition and
supported the student in interacting with the new features of the concept determines how the
student integrates this new knowledge into their concept image and concept definition (Tall &
Vinner, 1981). Figure 2 is an image created by this researcher to show how a student might
develop a concept image for the concept scale. This image was built on illustrations developed
by Rösken and Rolka (2007) based on the definition from Tall and Vinner (1981).
Figure 2. Exemplification of concept image and concept definition of scale from Rösken and Rolka (2007).
7
Van de Walle (2007) described eight different types of ratios and proportional
representations that could be used to illustrate proportionality. They are Part-to-Whole ratios;
Part-to-Part ratios; rates as ratios; corresponding parts of similar figures; slope/rate of change;
the golden ratio; in the same ratio; and solving a proportion (Van de Walle, 2007). This study
will examine the extent to which each OER textbooks utilized each representation.
Also, this study will examine these resources to the extent that students are allowed to
engage with the Standards for Mathematical Practice (SMP). The Mathematical Processes
Assessment Coding (MPAC) framework, developed by Hunsader et al. (2014), was used to
identify how well the textbooks provided an opportunity for students to engage with the process
standards that helped create the SMPs. The MPAC framework addresses Reasoning and Proof,
Opportunity for Mathematical Communication, Connections, Representations: Role of Graphics,
and Representations: Translation of Representational Forms. The Problem Solving standard
relied heavily on enacted instruction, which is not evident in textbook materials. Therefore, the
researcher did not collect data related to this standard.
Definitions
Concept Image: The researcher adhered to Tall and Viner's (1981) definition that states a
concept image is content evoked by a concept's name or visual within a learner's memory;
representations of a concept within a person's mind including related properties, actions, and
images (Tall & Vinner, 1981).
Concept Definition: The researcher adhered to Tall and Viner’s (1981) definition that
states a concept definition is language used to specify a concept (Tall & Vinner, 1981).
8
Proportionality: A unique quality of a relation such that it can be written in the form of
a proportion, namely, !" = #
$ “ (Lanius & Williams, 2003, p. 392). Proportionality refers to the
mathematical construct.
Proportional reasoning: It is a “mathematical way of thinking in which students
recognize proportional versus non-proportional situations and can use multiple approaches, not
just cross-products approach, for solving problems about proportional situations” (Lanius &
Williams, 2003, p. 392). Proportional reasoning refers to the thinking process required to make
multiplicative comparisons in ratio and proportional situations (Hart, 1988; Ozgun-Koca &
Altay, 2009; Shield & Dole, 2008). It also includes the ability to use descriptions, tables, graphs,
or expressions to find equivalent ratios, make predictions or inferences (Hart, 1988; Lesh et al.,
1988; Sen & Guler, 2017).
Ratio: Is a numerical relation between two quantities (Lobato, Ellis, & Zbiek, 2010; Tall
& Vinner, 1981) or a situational multiplicative comparison between quantities. A proportion
describes an equivalence statement between two ratios.
Different Contexts for Ratios
Part-to-Whole Ratios: a comparison between a part and a whole, for example, the
number of boys in a class compared to the total number of students (boys and girls) in the class
(Van de Walle, 2007).
Part-to-Part Ratios: a comparison between a part of a whole to another part of the same
whole, for example, the number of female dogs in a kennel compared to the number of male
dogs in a kennel (Van de Walle, 2007).
9
Rates as Ratios: a comparison between two different quantities with different measures
(Van de Walle, 2007).
Corresponding parts of similar figures: a comparison of the ratios of corresponding
parts of similar figures (Van de Walle, 2007).
Slope/Rate of Change: a ratio between the vertical and horizontal change in a linear
equation; it denotes the rate of change of a linear equation or function (Van de Walle, 2007).
Solutions strategies for solving proportions
Equivalent Fractions: using common factors to determine the missing value in a
proportion (Bright, Litwiller, & National Council of Teachers Mathematics., 2002).
One-Step Equations: multiplying the equivalent ratio by the denominator of the ratio with the
missing value (Bright et al., 2002).
Cross Multiplication: cross multiplying the numerator and denominator of each
equivalent ratio and dividing the products by the coefficient of the missing term (Bright et al.,
2002).
Find a unit rate: using the unit rate of one ratio to find the missing value in the
equivalent ratio (Bright et al., 2002).
Repeated-Subtraction: calculating the unit rate of the ratio and using repeated addition
or subtraction to find the missing value (Bright et al., 2002).
Size-Change: using the scale factor to determine missing value by multiplying it by the
whole of the missing quantity (Bright et al., 2002).
10
Chapter 2
Literature Review
The purpose of Chapter 2 is to review relevant literature related to proportionality,
textbooks, and the Standards for Mathematical Practice students should exhibit. This
presentation of the research literature provides a foundation for the curricular analysis
methodological approach described in chapter 3. This chapter is divided into three sections,
proportionality, textbooks, and Standards for Mathematical Practice (Common Core State
Standards, 2010).
Proportionality
Proportionality is critical to the field of mathematics in that it examines how relations
covary, as well as how expressions maintain equality (Lesh et al., 1988). In addition to being an
essential concept in itself, proportionality connects many other middle school mathematics topics
(NCTM, 2000). Proportionality presents itself in topics like linear functions, the distance
between points, scale drawings, geometric formulas, and measurements.
Textbooks often use the terms proportion, proportionality, and proportional reasoning
interchangeably. Proportionality concepts include ratios, the equivalence of two or more ratios,
and filtering relevant information from irrelevant details within the context of tasks (Ozgun-Koca
& Altay, 2009). During the elementary years, students focus on comparing entities using additive
or subtractive methods (Dole, 2008). For example, when comparing the number of red bears to
blue bears, in which the ratio of red bears to blue bears is 3 to 4, students may say there is one
11
more blue bear than red bears. Based on this reasoning, if there were six red bears, there would
be seven blue bears. "Being able to describe proportional situations using multiplicative language
is an indicator of proportional reasoning" (Dole, 2008, p. 18). Often teachers use multiplicative
strategies like doubling, tripling, and multiplying by tens to help students develop proportional
reasoning (Kent, Arnosky, & McMonagle, 2002). Researchers suggest providing students with
contextual problems and problems that could be modeled easily with representational images
(Kenney, Lindquist, & Heffernan, 2002; Kent et al., 2002). Providing students with models to
investigate proportional relationships supported teachers in examining student thinking. For
example, students investigated scenario relationships with animal parts, recipes, and parking lots
to demonstrate proportional reasoning. Ratio tables also supported students in exploring
proportional situations.
Van de Walle (2007) classified eight different types of proportionality problems: part-to-
whole ratios; Part-to-Part ratios; rates as ratios; corresponding parts of similar figures; slope/rate
of change; the golden ratio; in the same ratio; and solving a proportion. Part-to-Whole ratios
denote comparison between a part and a whole. For example, boys in a class compared to the
total number of students in the class (Van de Walle, 2007). Part-to-Part ratios compares a part of
a whole to another part of the same whole. To clarify, the number of female dogs in a kennel
compared to the number of male dogs in a kennel (Van de Walle, 2007). Rates as ratios describe
a comparison between two different quantities with different measures (Van de Walle, 2007).
Case in point, three cans of tomatoes were on sale for $5 or 3 cans per $5. Corresponding parts
of similar figures correlate the measures of the parts of similar figures (Van de Walle, 2007). For
instance, a student might use the length of a side of a triangle to prove that the same side of
another triangle is proportional and, therefore, similar. Slope/Rate of Change identifies a ratio
12
between the vertical and horizontal change, or rate of change, in a linear equation or function
(Van de Walle, 2007). Additionally, the golden ratio is a ratio found in nature that describes the
relationships found in spirals, pinecones, and architecture (Van de Walle, 2007). Students are
asked to recognize and compare relationships in varied settings to determine whether
relationships are in the same ratio. This comparison assists students in identifying relations as
proportional. Finally, solving proportions "involves applying a known ratio to a situation that is
proportional (relevant measures are in the same ratio) and finding one of these measures when
the other is given" (Van de Walle, 2007, pp. 354-355). For example, given 12 slices of pizza
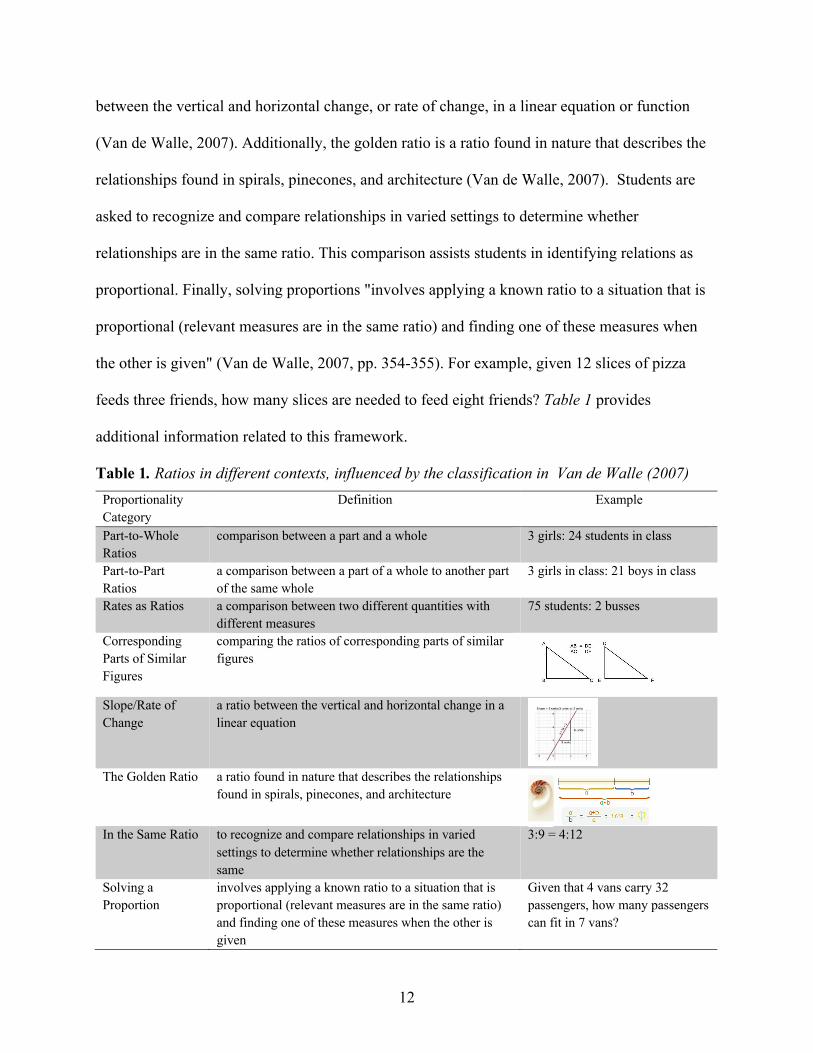
feeds three friends, how many slices are needed to feed eight friends? Table 1 provides
additional information related to this framework.
Table 1. Ratios in different contexts, influenced by the classification in Van de Walle (2007) Proportionality Category
Definition Example
Part-to-Whole Ratios
comparison between a part and a whole 3 girls: 24 students in class
Part-to-Part Ratios
a comparison between a part of a whole to another part of the same whole
3 girls in class: 21 boys in class
Rates as Ratios a comparison between two different quantities with different measures
75 students: 2 busses
Corresponding Parts of Similar Figures
comparing the ratios of corresponding parts of similar figures
Slope/Rate of Change
a ratio between the vertical and horizontal change in a linear equation
The Golden Ratio a ratio found in nature that describes the relationships
found in spirals, pinecones, and architecture
In the Same Ratio to recognize and compare relationships in varied
settings to determine whether relationships are the same
3:9 = 4:12
Solving a Proportion
involves applying a known ratio to a situation that is proportional (relevant measures are in the same ratio) and finding one of these measures when the other is given
Given that 4 vans carry 32 passengers, how many passengers can fit in 7 vans?
13
De La Cruz (2008) suggested difficulties in proportional reasoning stemmed from
deficiencies in the prerequisite components for proportional reasoning. She labeled five
components that influence proportional reasoning: multiplicative reasoning, relative thinking, the
ability to partition and unitize, understanding rational numbers in different forms, and ratio
sense. The development of proportional reasoning depends on an emphasis of multiplicative
versus additive reasoning (Lamon,1993).
Clark and Kamii (1996) described several levels in the transition from additive to
multiplicative strategies. The initial level suggested no serial correspondence or serial
correspondence with qualitative quantification. This implies that students can generalize answers
as more or less compared to other quantities in the situation. Students at this level have not begun
to reason additively. The second and third levels are categorized by additive reasoning within
one or two quantities and two/three or more quantities, respectively. The final level, labeled
multiplicative reasoning, was split into two parts: multiplicative thinking without immediate
success and multiplicative thinking with immediate success.
In contrast, Confrey and Smith (1995) suggested that additive reasoning should not be a
prerequisite for multiplicative reasoning. They explained that additive reasoning was a very
inadequate explanation for multiplication. These researchers promoted using the concept of
splitting to describe multiplication instead. This rationale created a more fluid transition between
multiplication and counting, as well as a more cohesive connection between multiplication and
division. Re-envisioning multiplication also repositioned the development of ratios. According to
Confrey and Smith (1995), the concepts of ratio, multiplication, and division should co-evolve
together. The early development of similarity within geometric concepts lent itself as a
foundation for students to recognize proportions. "Ratios are never singular instances of a
14
relationship between magnitudes but are constructed by objectifying and naming that which is
the same across proportions" (Confrey & Smith, 1995, p. 74).
Lamon (2012) agrees that relative reasoning, also called multiplicative thinking, involves
the analysis of part-part-whole relations. It influences several things: how students interpret the
size of pieces versus the number of pieces in a relation, how students compare units written in
fractional form, how students interpret the meaning of ratios in context, and how students
understand equivalent ratios and fractions. Relational reasoning entails a level of abstraction that
is absent in additive reasoning.
Also, relational reasoning was essential to the process of unitizing. Unitizing describes
grouping and maintaining elements as a new unit rather than looking at elements. Lamon (2012)
posited that difficulty with proportionality could stem from a student's inability to group
individual elements into a single unit mentally. De La Cruz (2008) defined unitizing as building
composite units from a single unit. Unitizing is the opposite of partitioning, which is the
breaking apart of a larger unit into smaller groups or units. Finding the most efficient method to
unitize is a necessary component for proportional reasoning. Children typically utilize one of
three strategies when partitioning: preserved-pieces, mark-all, or distribution. In the preserved-
pieces strategy, the whole was left intact for dispersal, and only the left-over piece was split into
parts. For the mark-all strategy, the learner marked all of the whole pieces into equal shares and
then split up any left-over pieces. The final strategy, distribution, illustrates a learner who
marked, cut, and then distributed all of the pieces. These strategies become the foundation for
strategies that students use to solve proportionality problems.
Proportionality problems are composed of rational numbers. Unfortunately, students
often struggle with proportional reasoning because of the multiple interpretations of rational
15
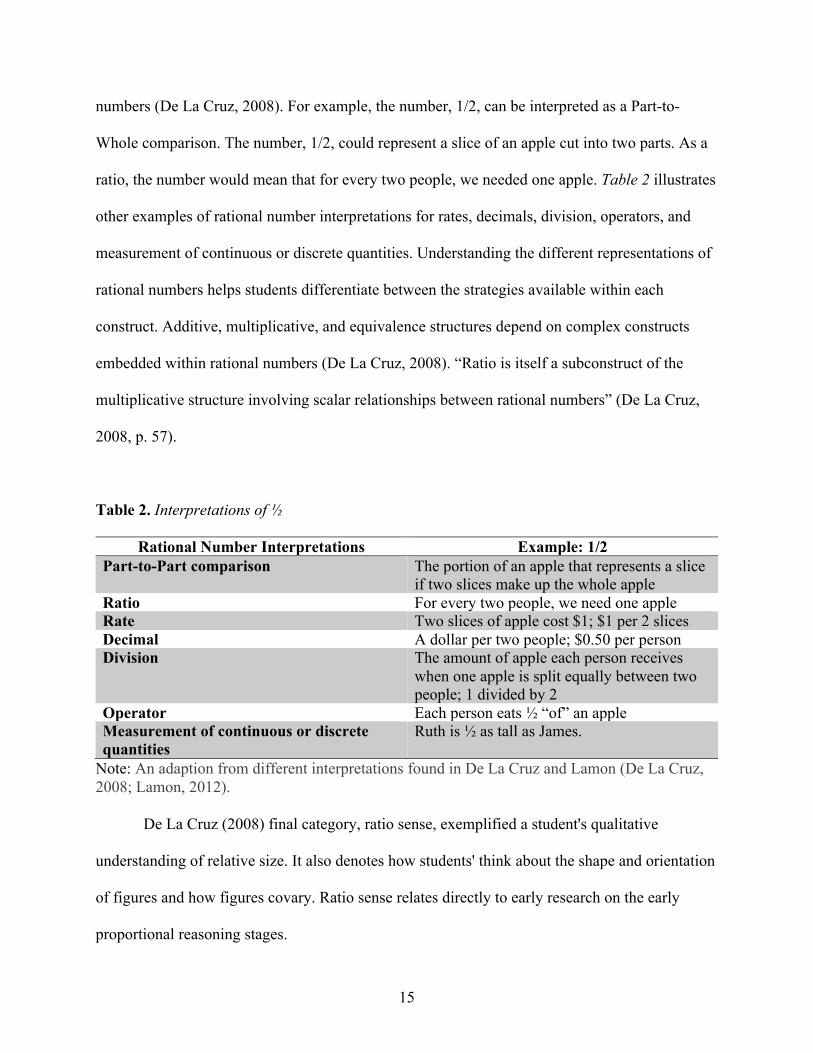
numbers (De La Cruz, 2008). For example, the number, 1/2, can be interpreted as a Part-to-
Whole comparison. The number, 1/2, could represent a slice of an apple cut into two parts. As a
ratio, the number would mean that for every two people, we needed one apple. Table 2 illustrates
other examples of rational number interpretations for rates, decimals, division, operators, and
measurement of continuous or discrete quantities. Understanding the different representations of
rational numbers helps students differentiate between the strategies available within each
construct. Additive, multiplicative, and equivalence structures depend on complex constructs
embedded within rational numbers (De La Cruz, 2008). “Ratio is itself a subconstruct of the
multiplicative structure involving scalar relationships between rational numbers” (De La Cruz,
2008, p. 57).
Table 2. Interpretations of ½
Rational Number Interpretations Example: 1/2 Part-to-Part comparison The portion of an apple that represents a slice
if two slices make up the whole apple Ratio For every two people, we need one apple Rate Two slices of apple cost $1; $1 per 2 slices Decimal A dollar per two people; $0.50 per person Division The amount of apple each person receives
when one apple is split equally between two people; 1 divided by 2
Operator Each person eats ½ “of” an apple Measurement of continuous or discrete quantities
Ruth is ½ as tall as James.
Note: An adaption from different interpretations found in De La Cruz and Lamon (De La Cruz, 2008; Lamon, 2012). De La Cruz (2008) final category, ratio sense, exemplified a student's qualitative
understanding of relative size. It also denotes how students' think about the shape and orientation
of figures and how figures covary. Ratio sense relates directly to early research on the early
proportional reasoning stages.
16
Karplus and Karplus (2002) hypothesize proportional reasoning into three developmental
stages: Level I (Intuition and intuitive computation), Level II (Scaling and Addition), and Level
III (Addition and Scaling, Proportional Reasoning). In their longitudinal study, they determined
that students transitioned between these stages as they developed proportional reasoning.
Students in Level I seemed to demonstrate the "most naïve approach to the ratio task" (Karplus
& Karplus, 2002, p. 122). Students whose answers were classified as Level I referred to
estimates, guesses, and appearances that either did not use data or used it haphazardly.
Unfortunately, their study could not determine whether the stages in Level II were alternate or
sequential. Level II answers referenced a scale but not one inherent to the provided data.
Alternate answers at this stage explained the data relationships using difference strategies instead
of multiplicative language. This level of understanding aligns with the work of other researchers
in that both strategies are precursors to more sophisticated reasoning strategies. At Level III,
Addition and Scaling strategies describe explanations that focused on differences between the
figures and involved factors inherent to perceivable characteristics. Formal proportional
reasoning also resides in Level III. Responses in this category used proportionality to describe
the ratio using known measurements. Identifying where students are in their development can
assist teachers in creating scenarios and introducing problems that will support students in
investigating different types of reasoning.
Proportionality problems appear in multiple forms in texts. Typically, proportionality
illustrates a ratio, proportion, percent, and direct variation problems. Lamon (1993) identified
four different types of ratio problems: part-part-whole, associated sets, well-chunked measures,
and Stretchers and Shrinkers. First, part-part-whole ratios denote problems where subsets of the
whole are compared to the entire group. For example, a ratio might compare pencils to pens in a
17
pencil pouch or pencils to the total number of items in a pencil pouch. Second, well-chunked
measures define ratio problems whose quantities are typical like miles per gallon or salary per
hour. Next, associated sets denote problems where the context artificially relates two concepts.
For example, a problem might relate to baseball gloves and swimming pools. Finally, problems
that manipulate characteristics of a given item as its quantities are called Stretchers and
Shrinkers. In this type of problem, a student might determine the area if the length of the
rectangle doubles.
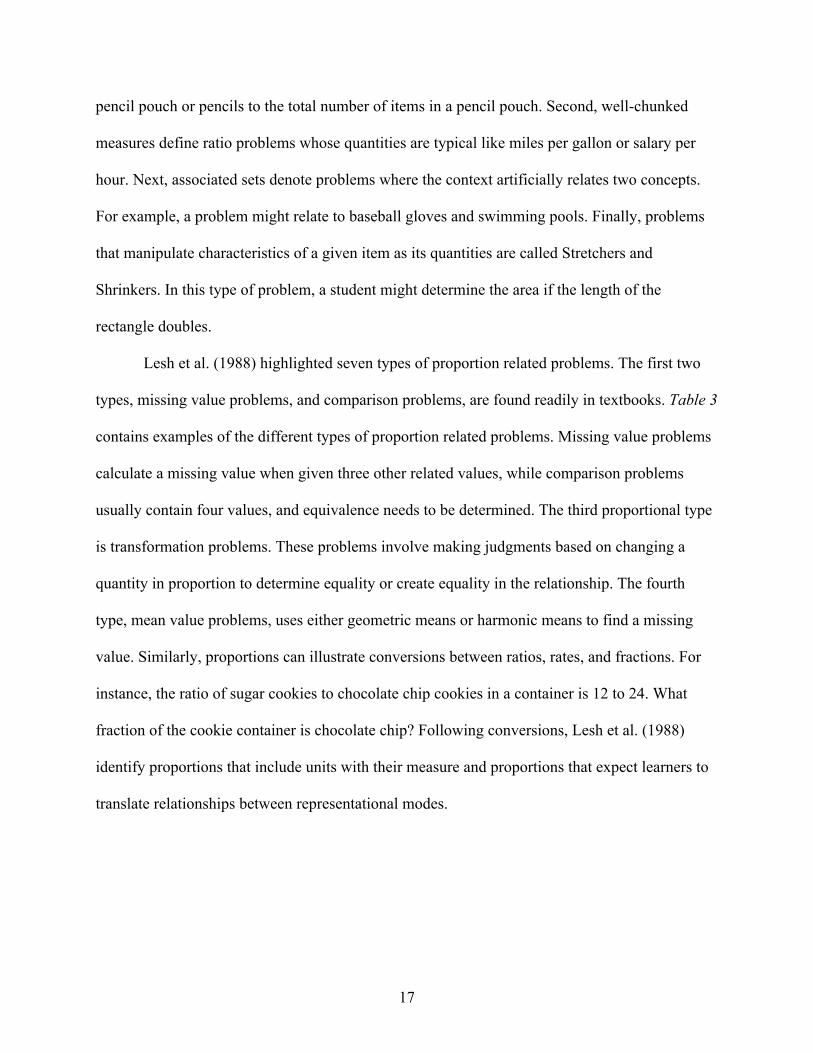
Lesh et al. (1988) highlighted seven types of proportion related problems. The first two
types, missing value problems, and comparison problems, are found readily in textbooks. Table 3
contains examples of the different types of proportion related problems. Missing value problems
calculate a missing value when given three other related values, while comparison problems
usually contain four values, and equivalence needs to be determined. The third proportional type
is transformation problems. These problems involve making judgments based on changing a
quantity in proportion to determine equality or create equality in the relationship. The fourth
type, mean value problems, uses either geometric means or harmonic means to find a missing
value. Similarly, proportions can illustrate conversions between ratios, rates, and fractions. For
instance, the ratio of sugar cookies to chocolate chip cookies in a container is 12 to 24. What
fraction of the cookie container is chocolate chip? Following conversions, Lesh et al. (1988)
identify proportions that include units with their measure and proportions that expect learners to
translate relationships between representational modes.
18
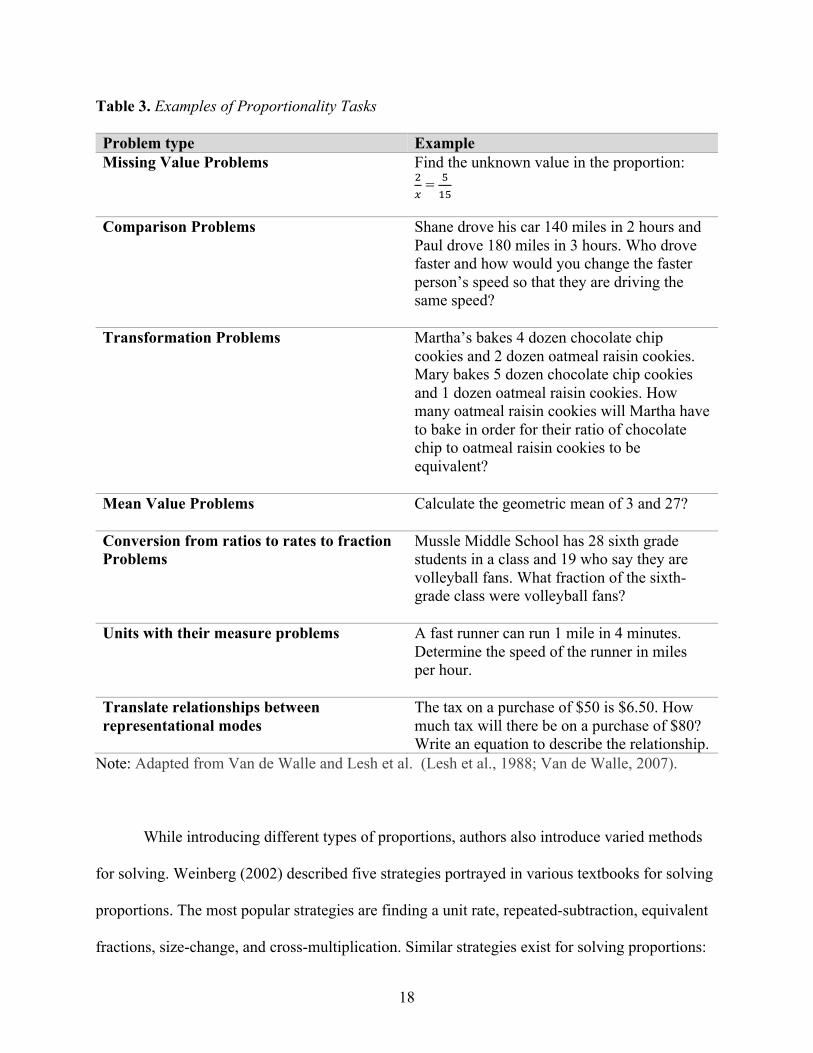
Table 3. Examples of Proportionality Tasks
Problem type Example Missing Value Problems Find the unknown value in the proportion:
%& = '
('
Comparison Problems Shane drove his car 140 miles in 2 hours and
Paul drove 180 miles in 3 hours. Who drove faster and how would you change the faster person’s speed so that they are driving the same speed?
Transformation Problems Martha’s bakes 4 dozen chocolate chip cookies and 2 dozen oatmeal raisin cookies. Mary bakes 5 dozen chocolate chip cookies and 1 dozen oatmeal raisin cookies. How many oatmeal raisin cookies will Martha have to bake in order for their ratio of chocolate chip to oatmeal raisin cookies to be equivalent?
Mean Value Problems Calculate the geometric mean of 3 and 27?
Conversion from ratios to rates to fraction Problems
Mussle Middle School has 28 sixth grade students in a class and 19 who say they are volleyball fans. What fraction of the sixth-grade class were volleyball fans?
Units with their measure problems A fast runner can run 1 mile in 4 minutes. Determine the speed of the runner in miles per hour.
Translate relationships between representational modes
The tax on a purchase of $50 is $6.50. How much tax will there be on a purchase of $80? Write an equation to describe the relationship.
Note: Adapted from Van de Walle and Lesh et al. (Lesh et al., 1988; Van de Walle, 2007).
While introducing different types of proportions, authors also introduce varied methods
for solving. Weinberg (2002) described five strategies portrayed in various textbooks for solving
proportions. The most popular strategies are finding a unit rate, repeated-subtraction, equivalent
fractions, size-change, and cross-multiplication. Similar strategies exist for solving proportions:
19
equivalent fractions, one-step equations, and cross-multiplication. Exposure to different solution
methods increased the students' capacity to recognize and explain proportionality situations.
Supporting varied explanations and problem types helped students connect the mathematics
examined in classrooms to their real-world situations, helped students connect concepts within
mathematics, and it helped to reinforce students' problem solving, communication, and reasoning
skills (Weinberg, 2002).
In addition to varying the types of problems available to students, teachers and districts
often vary the types of resources they use with students. Flexible use of resources allows teachers
the opportunity to take advantage of the dynamic features in digital resources. Digital resources
allow teachers and students to manipulate relationships using graphing and tabular technology
and receive the most updated content available. Many districts have purchased digital resources,
but a host of options are available for free.
Teachers’ Use of Textbooks
The textbooks teachers use heavily influence the extent to which ratio and proportions are
attended. Horizon Research conducted a study of US mathematics education that included an
analysis of instructional resources, how teachers used them, and teachers' perceptions of the
quality of their instructional resources (Banilower et al., 2013). According to their study, more
than 80% of mathematics teachers surveyed used one or more commercially published textbooks
or programs most of the time. Only 19% of those surveyed used non-commercially published
textbooks most of the time. Likewise, middle school mathematics teachers reported covering the
majority of the textbook in their instruction, 81% reported they covered 50% or more of the
textbook at the middle school level. Teachers in 49% of middle school mathematics classes
reported using the textbook more than 75% of the time, while 71% used it to guide their unit's
20
overall structure and content emphasis. Most teachers (68%) incorporated supplemental activities
into their instruction to fill in parts the textbook lacked; while 51% selected essential
components from the unit and discarded the rest of the content. More than 72 % of the teachers
described their reasons for supplementing as additional practice, differentiation, and standardized
testing. Similar to the NAEP study, 78 % of the teachers in this study skipped material in the
textbook because it included material that was not included in their pacing guide or the course
standards of their courses. Additionally, 57% skipped material because their students either
already knew the content or did not need the textbook lesson to learn the content.
Moreover, Stein, Remillard, and Smith (2006) noted:
The majority of mathematics teachers rely on curriculum materials as their primary tool
for teaching mathematics (Grouws, Smith & Sztain, 2004). If curriculum materials do not
include a topic, there is a good chance that teachers will not cover it. Moreover, as noted
by Hiebert and Grouws (2006), one of the best-substantiated findings in the literature on
classroom teaching and student learning is that students do not learn content to which
they are not exposed. Thus, the identification of what mathematical topics a given set of
curriculum materials covers is of fundamental importance (Stein et al., 2006, p. 327).
Researchers have found that “teachers tend to assign fewer problems to students than the
textbook authors recommended and covered less than 70% of the textbook content on
average”(Fan, Zhu, & Miao, 2013, p. 641). The pedagogical and mathematical choices teachers
make, based on the content within textbooks, significantly affect the classroom interactions
students and teachers exchange (Remillard & Heck, 2014). Also, the curriculum materials
provided for the teacher principally guides the content enacted by the classroom teachers. Those
21
materials may include a pacing calendar or course outline. Traditionally, a textbook resource is
provided even in the absence of other curricular resources. The textbook typically guides the
content selection and organizational structure that helps the teacher determine their instructional
progression (Stein et al., 2006). According to Tarr, Chavez, and Reys (2006), "approximately 60-
70% of textbook lessons" are taught by teachers regardless of the type of textbook resource
provided to the teacher (p.6). Although textbooks do not select content for the instructor, the
mathematics teachers attend to is influenced by the examples and activities provided by the
resource (Wijaya, van den Heuvel-Panhuizen, & Doorman, 2015). Often, teachers modify their
focus on areas addressed by the text and may even omit content based on its absence from the
textbook (Usiskin, 2013). Therefore, textbooks can play a critical role in the teacher's capacity to
meet the expectations established by the school, district, or state directives for student learning.
Teachers' usage of textbooks is influenced by multiple factors (Seeley, 2003). Students'
access to textbooks may influence how and whether the teachers use textbooks. Schools that
limit students' textbook access to students' request or require students to purchase books may
incline teachers to use textbooks on a limited basis with students. Schools whose administration
believes their selected textbooks are inappropriately leveled for their student population may
discourage or encourage explicit usage of particular textbooks. Further, teachers unfamiliar with
the content they are teaching may lean on the perceived expertise of the textbook and its
ancillary resources. "Many teachers rely on textbooks for instructional materials, which they may
or may not supplement to make connections and emphasize mathematics beyond basic skills"
(Vincent & Stacey, 2008, p. 85).
22
Features of textbooks
Modern textbooks combine a variety of features, like theory, expanded content,
reasoning, concept exploration, real-world situations, exam preparation, and technology
(Usiskin, 2013). Despite the multitude of features textbooks attempt to include, prior knowledge
of students and the students' desire to spend time learning the mathematical concepts (Usiskin,
2013).
Open Education Resources
The Hewlett Foundation defines OERs as “teaching, learning and research materials in
any medium – digital or otherwise – that reside in the public domain or have been released under
an open license that permits no-cost access, use, adaptation and redistribution by others with no
or limited restrictions”(W & F Foundation, 2019, p. Open Educational Resources). OERs are
touted for their flexibility, innovation, and cost savings (Foundation, 2019). OERs appear in
varied institutional platforms, including higher education, and K-12 institutions.
Robinson, Fischer, Wiley, and Hilton (2014) conducted a quantitative study to analyze
whether science learning was affected by the adoption of OER science textbooks for secondary
students in three different disciplines. This quasi-experimental study compared 4,183 students
and 43 teachers in a single school district in Utah. Approximately 57% of the students used a
traditional textbook. Approximately 43% of the students used a printed copy of an Open
Educational Resource as their textbook that had been curated by their instructors based on
content published initially by the CK-12 Foundation. Researchers found statistically significant
effects for OER usage, although the results had limited educational significance. Both teacher
effect and student grade point average had beta weights, 𝛽=.21 and 𝛽=.11, that were significantly
higher than OER usage, at 𝛽=.03. Researchers did find that OERs had other beneficial features
23
for their implementers. Open resources improved student access to textbook materials by
providing quality materials at a significantly lower cost. Simultaneously, OERs repositioned
teachers to take a more active role in the revision and development of student resources.
Unfortunately, access to technology proved a barrier for many teachers and students. Robinson et
al. (2014) suggested a gradual switch from print OERs to digital resources by using the cost
savings to purchase technology to support the transition.
Other researchers have also examined the benefits and challenges of using OERs.
Ganapathi (2018) examined multiple features of OERs. Cultural and linguistic diversity creates a
challenge for most textbook publishers. OERs allowed creators to cater to the language needs
and cultural differences of multiple audiences while providing equitable content. Ganapathi
(2018) found the option to access resources both online and offline in multiple native languages
increased the usability for consumers. Also, OERs created the potential to address issues of
"access, infrastructure, technology, and equitable distribution of education and educational
content" (Ganapathi, 2018, p. 119).
Similarly, Kimmons (2015) found that multiple factors played a role in teachers favoring
open and open/adapted resources. The post-secondary instructors in their study were more
concerned with who curated the resource, quality control of content, and the credentials of the
creator. At the elementary and secondary levels, teachers favored OERs because they could
adopt them at any time. These teachers were more concerned with alignment to content
standards, supplemental materials, access on media platforms, and content features like
readability, engaging content, conciseness of content passages, and ease of use for
differentiation.
24
In addition to its benefits, OERs face multiple challenges. Often creators of resources are
not fluent with copyright and licensure rights (Hylén, 2006). Also, quality assurance presented an
issue when resource creation and revision is not limited to content experts. In addition to
concerns with curation, many OER critics have voiced concerns with the sustainability of a
resource that can be created, adapted, and distributed by any user. The Redstone Strategy Group
(2018) identified five challenges to sustaining OERs:
1. Creating, updating, and refreshing content is time-intensive and knowledge-intensive.
2. OER adoption requires buy-in from stakeholders, i.e., administrators, teachers,
research institutions.
3. OER adoption is not currently available on the same scale as traditional textbooks in
most distribution channels.
4. Quality OER materials do not necessarily produce improved student outcomes.
5. OER availability may devalue the content development created by local authors and
hinder distribution in local markets.
International and National Studies
The Trends in International Mathematics and Science Study (TIMSS) is an international
assessment, sponsored by the International Association for the Evaluation of Educational
Achievement (IEA), in mathematics and science designed to compare student achievement.
Gonzales (2001) comparison of the international curricula from the 1995 and 1999 TIMSS
administrations shows distinct differences between the US and other nations. Notably, many
countries, like Japan and Germany, set the curriculum at the national level, whereas the United
States sets the curriculum at the local level. This feature affects the content represented in
textbooks. Instead of addressing the required content, textbook publishers focus on a broad range
25
of content to make their product marketable to the broadest audience (Gonzales, 2001). Often
this means textbooks contain more topics than teachers could address in a school year. Recently,
many local entities in the United States have used curriculum studies based on TIMSS to fine-
tune curricular standards in the US. For example, the critical issues of focus, coherence, and
rigor, described in several TIMSS analyses, became guiding tenants for the Common Core State
Standards for Mathematics (Schmidt & Burroughs, 2016).
Developing mathematical proficiency and literacy
Researchers have argued that students should exhibit mathematical habits of mind
(Cuoco, Goldenberg, & Mark, 2010) related to the process standards (NCTM, 2000), and the
Standards for Mathematical Practice(Common Core State Standards Initiative, 2010). Thus, in
examining textbooks for proportionality, the researcher also intends to consider how these
textbooks support students in becoming mathematically proficient.
NCTM Process Standards
According to NCTM, Problem Solving, Communication, Reasoning, and Mathematical
Connections should exist at every grade band in varying levels based on developmental
readiness, mathematical background, and content. They posited "the curriculum should include
deliberate attempts, through specific instructional activities, to connect ideas and procedures both
among different topics and with other content areas" (NCTM, 1989, p. 11). By the time
Principles and Standards for School Mathematics was published, NCTM had revised the process
standards to Problem Solving, Reasoning and Proof, Connections, Communication, and
Representation.
26
Problem-solving
Students should deepen their understanding of mathematical concepts through
exploration activities and application problems. Problem-solving from this perspective should
include practical contexts relevant to student's experiences, language, and skillsets. "The essence
of problem-solving is knowing what to do when confronted with unfamiliar problems"
(NCTM, 2000, p. 259). For example, teachers could use a problem-solving task like the one in
Table 4 to promote discussion of varied strategies and approaches to determine their own
argument’s strengths and weaknesses.
Reasoning and proof
Reasoning and proof are integral to identifying and examining patterns, as well as making
and analyzing conjectures for generalizations. Students engaged in reasoning tasks should: (1)
detect regularities by examining patterns and mathematical structures; (2) use observed
regularities to formulate conjectures and conjectures; (3) assess conjectures; and (4) create and
analyze mathematical arguments (NCTM, 2000). An example of reasoning and proof tasks is in
Table 4.
Communications
Next, teachers should identify communication tasks that allow students to interpret,
justify, and make conjectures about important mathematical ideas that are accessible using
multiple representations and approaches (NCTM, 2000). Additionally,, students should be
expected to not only explain their reasoning but critique the reasoning, meaningfulness,
efficiency of others. Students might begin with a task like the one in Table 4 and extend their
discussion to include correcting misconceptions, questioning peers, and exploring multiple
strategies.
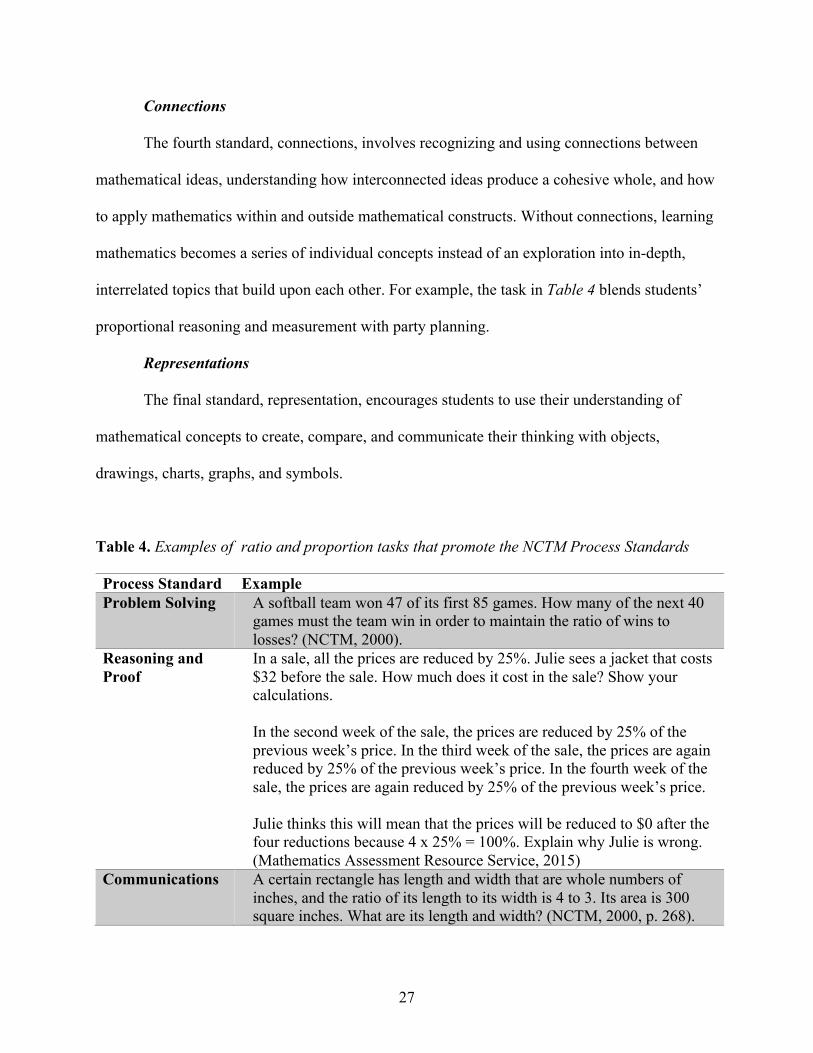
27
Connections
The fourth standard, connections, involves recognizing and using connections between
mathematical ideas, understanding how interconnected ideas produce a cohesive whole, and how
to apply mathematics within and outside mathematical constructs. Without connections, learning
mathematics becomes a series of individual concepts instead of an exploration into in-depth,
interrelated topics that build upon each other. For example, the task in Table 4 blends students’
proportional reasoning and measurement with party planning.
Representations
The final standard, representation, encourages students to use their understanding of
mathematical concepts to create, compare, and communicate their thinking with objects,
drawings, charts, graphs, and symbols.
Table 4. Examples of ratio and proportion tasks that promote the NCTM Process Standards
Process Standard Example Problem Solving A softball team won 47 of its first 85 games. How many of the next 40
games must the team win in order to maintain the ratio of wins to losses? (NCTM, 2000).
Reasoning and Proof
In a sale, all the prices are reduced by 25%. Julie sees a jacket that costs $32 before the sale. How much does it cost in the sale? Show your calculations. In the second week of the sale, the prices are reduced by 25% of the previous week’s price. In the third week of the sale, the prices are again reduced by 25% of the previous week’s price. In the fourth week of the sale, the prices are again reduced by 25% of the previous week’s price. Julie thinks this will mean that the prices will be reduced to $0 after the four reductions because 4 x 25% = 100%. Explain why Julie is wrong. (Mathematics Assessment Resource Service, 2015)
Communications A certain rectangle has length and width that are whole numbers of inches, and the ratio of its length to its width is 4 to 3. Its area is 300 square inches. What are its length and width? (NCTM, 2000, p. 268).
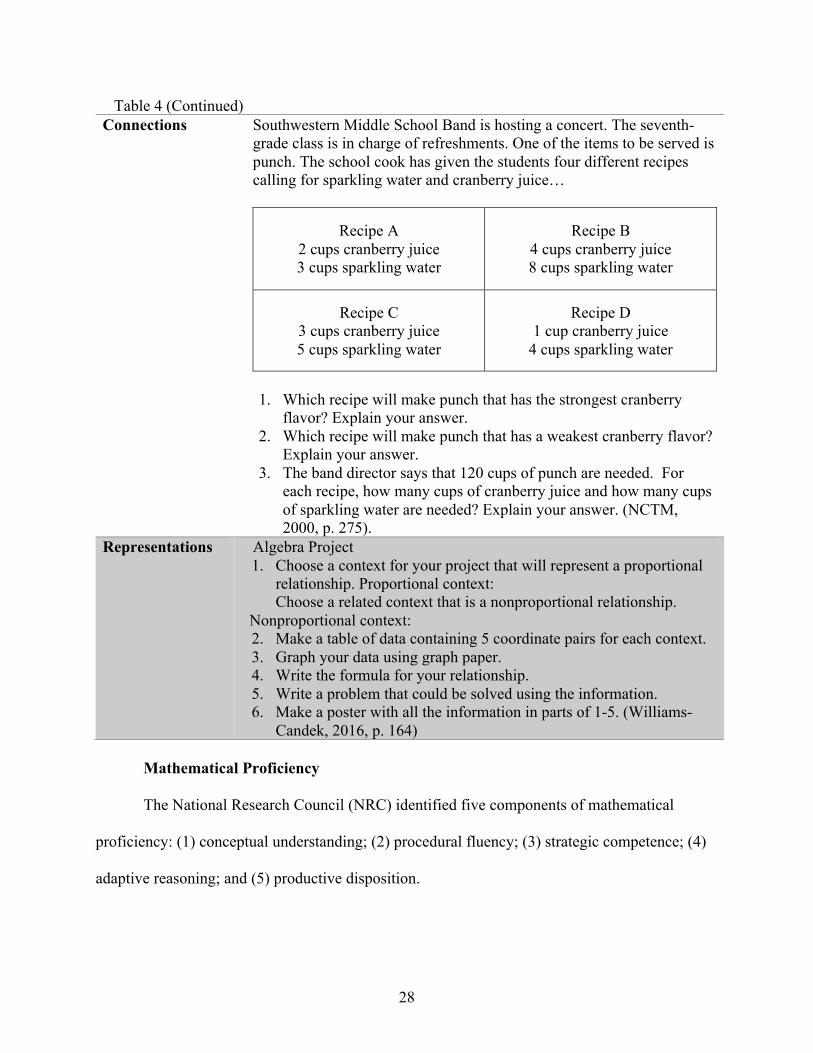
28
Table 4 (Continued) Connections Southwestern Middle School Band is hosting a concert. The seventh-
grade class is in charge of refreshments. One of the items to be served is punch. The school cook has given the students four different recipes calling for sparkling water and cranberry juice…
Recipe A 2 cups cranberry juice 3 cups sparkling water
Recipe B 4 cups cranberry juice 8 cups sparkling water
Recipe C 3 cups cranberry juice 5 cups sparkling water
Recipe D 1 cup cranberry juice
4 cups sparkling water
1. Which recipe will make punch that has the strongest cranberry
flavor? Explain your answer. 2. Which recipe will make punch that has a weakest cranberry flavor?
Explain your answer. 3. The band director says that 120 cups of punch are needed. For
each recipe, how many cups of cranberry juice and how many cups of sparkling water are needed? Explain your answer. (NCTM, 2000, p. 275).
Representations Algebra Project 1. Choose a context for your project that will represent a proportional
relationship. Proportional context: Choose a related context that is a nonproportional relationship.
Nonproportional context: 2. Make a table of data containing 5 coordinate pairs for each context. 3. Graph your data using graph paper. 4. Write the formula for your relationship. 5. Write a problem that could be solved using the information. 6. Make a poster with all the information in parts of 1-5. (Williams-
Candek, 2016, p. 164)
Mathematical Proficiency
The National Research Council (NRC) identified five components of mathematical
proficiency: (1) conceptual understanding; (2) procedural fluency; (3) strategic competence; (4)
adaptive reasoning; and (5) productive disposition.
29
Conceptual understanding
Conceptual understanding refers to how students integrate mathematical ideas as a
coherent whole and connect them with what they already know. (National Research Council,
2001) Students who demonstrate conceptual understanding can represent situations in different
ways for different purposes. This component supports how students identify similarities and
differences between situations and new ideas.
Procedural fluency
Procedural fluency describes the efficient, clever, and adaptable use of skills and
procedures in their appropriate context (National Research Council, 2001). Procedural fluency
assists conceptual understanding in that fluency is required before students can manipulate their
knowledge to determine similarities and predict solutions. According to the NRC (2001),
"students develop procedural fluency as they use their strategic competence to choose among
effective procedures" (p.129).
Strategic competence
Strategic competence is the ability to examine a problem, formulate a strategy, translate
the task into a mathematical representation, and solve it. Expert strategic problem-solvers
examine structural relationships and models to find insights on how to solve the task at hand.
Flexible mastery of concepts helps learners to expand their understanding of novel situations and
non-routine problems (National Research Council, 2001).
Adaptive reasoning
The third strand, adaptive reasoning, describes how students use patterns, concepts, and
situations to examine their understanding logically, explanations, and justifications both
intuitively and deductively. It helps students filter through the plethora of "facts, procedures,
30
concepts, and solution methods and to see that they all fit together in some way, that they make
sense" (National Research Council, 2001, p.129). Adaptive reasoning confers competence for
students to decide whether a strategy or procedure is a valid option for their problem.
Productive disposition
The final component, the productive disposition is "the tendency to see the sense in
mathematics, to perceive it as both useful and worthwhile, to believe that steady effort in
learning mathematics pays off, and to see oneself as an effective learner and doer of
mathematics" (National Research Council, 2001, p.131). Productive disposition demands that
educators provide frequent opportunities for students to wrestle with mathematical concepts so
that they can both recognize and benefit from making sense of them.
Standards for Mathematical Practice
The National Governors Association Center for Best Practices and the Council of Chief
State School Officers synthesized the five strands of mathematical proficiency from the NRC
and the five process standards from NCTM to create the Standards for Mathematical Practice
(SMP) released in 2010 (Common Core State Standards Initiative, 2010). The Standards for
Mathematical Practice were created to illustrate the expertise teachers should cultivate in their
students as they instruct mathematics. They are:
(1) Make sense of problems and persevere in solving them.
(2) Reason abstractly and quantitatively.
(3) Construct viable arguments and critique the reasoning of others.
(4) Model with mathematics.
(5) Use appropriate tools strategically.
(6) Attend to precision.
31
(7) Look for and make use of structure.
(8) Look for and express regularity in repeated reasoning.
Making sense of problems and persevere in solving them.
The first standard, "make sense of problems and persevere in solving them," posits that a
proficient student should be able to explain the meaning of a problem and discover a way to find
its solution. They should also be able to make conjectures strategically based on the structure and
context of the problem to ensure that the approach to the problem honors the meaning of the
solution. A student who has a grasp of this SMP can determine if a solution makes sense and
evaluate their progress (Common Core State Standards Initiative, 2010). Bartell et al. (2017)
theorized that the SMPs also provide a vehicle for equitable instruction. They suggested that
teachers explicitly creating or adapting problems that incorporated the family practices,
experiences, or community could support the development of SMP 1 (Bartell et al., 2017).
“Moreover, students are more likely to persevere in a problem that is of interest to them
(Renninger, Ewen, & Lasher, 2002) and to make sense of a problem and identify an entry
point if a task is introduced in a way that includes discussion of key contextual features
(Jackson, Garrison, Wilson, Gibbons, & Shahan, 2013)” (Bartell et al., 2017, p. 14).
Reason abstractly and quantitatively
The second standard, "reason abstractly and quantitatively," involves making sense of
relationships in order to de-contextualize and contextualize situations. Students manipulating this
SMP can create coherent representations of problems within their constraints and utilize
properties of operations and manipulatives to solve problems. As students share their thinking,
students’ abilities to reason based on context from their peers and their abilities to compute with
adapted strategies improves (Common Cores State Standards Initiative, 2010).
32
Construct viable arguments and critiques the reasoning of others
"Constructing viable arguments and critiquing the reasoning of others" is the third SMP.
Mathematically proficient students explore the truth of their logical arguments by following
logical progressions of their previous products, definitions, and assumptions. They can analyze
situations using examples and counterexamples to justify or refute their conclusions. Students
who can utilize this standard can compare two plausible arguments, differentiate between correct
and unsound logic and concisely compose an explanation about the argument (Initiative, 2019b).
Model with mathematics
Modeling with mathematics involves describing lived experiences using mathematics and
applying mathematics to situations in daily life. Students can use diagrams, tables, graphs, flow-
charts, or formulas to illustrate meaningful relationships in scenarios. They can then use those
tools to analyze the relationships and make conclusions (Common Core State Standards
Initiative, 2010). Davis, Choppin, Drake, Roth McDuffie, and Carson (2018) investigated the
perceptions of middle school mathematics teachers regarding the SMPs and whether the type of
textbook they used affected their perceptions. Their literature analysis determined that teachers
had a difficult time defining modeling. High school teachers were statistically (p < .01) more
likely to define modeling using the language of the standard than elementary teachers.
Elementary teachers were more likely to associate modeling with problem-solving using
manipulatives or tools than their high school counterparts (Roth McDuffie, Choppin, Drake, &
Davis, 2018). Bartell et al. (2017) suggested that teachers pose ill-defined problems from real-
world contexts that require students to struggle with embedded mathematics and their
sociopolitical disposition.
33
Use appropriate tools strategically
The fifth standard, "Use appropriate tools strategically," highlights students' opportunities
to make appropriate choices for themselves. Tools may include calculators, graph paper,
manipulatives, models, spreadsheets, paper and pencil, measuring implements, and technology.
Proficient students can use the context of the situation to determine the limitations and benefits
of the available resources (Common Core State Standards Initiative, 2010).
Attend to precision
Mathematically proficient students are expected to "attend to precision." Attending to
precision describes how students communicate their reasoning and conjectures precisely. It
incorporates the explanation of symbolic representations, accurate computations within the
context of the task as well as, the labeling of data to precisely communicate its meaning
(Common Core State Standards Initiative, 2010). Moschkovich (2013) expressed a need for
clarity regarding precision. “Precise claims can be expressed in imperfect language and that
attending to precision only at the individual word level will get in the way of students’
expressing their emerging mathematical ideas” (Moschkovich, 2013, p. 271). Teachers
intending to focus on this practice should ensure that the focus of instruction is the precision of
the claim argued and not merely the formal mathematical language (Moschkovich, 2013).
Look for and make use of structure
The seventh SMP, "Look for and make use of structure," examines how students use the
structure or pattern of a problem to help solve it. It uses the student's conceptual understanding of
a concept to identify relationships between multiple components that can be used to solve the
complex problem sets (Common Core State Standards Initiative, 2010).
34
Look for and express regularity in repeated reasoning
Finally, mathematically proficient students demonstrate looking for and expressing
regularity in repeated reasoning by noticing whether answers or strategies are repeated and using
them to look for shortcuts or generalizations. This SMP illustrates the simultaneous attention to
the details while maintaining an overall perspective. In order to do this, students must also self-
evaluate to determine if their strategies are practical and efficient (Common Core State Standards
Initiative, 2010).
The SMPs were never intended to be taught in isolation. The intent was for students to
utilize them to interact with mathematical concepts. These processes and proficiencies should be
integrated into the everyday lessons enacted with students. Students who have the disposition to
persevere when problems are challenging and create pathways to a solution while using tools and
procedures fluently are better at demonstrating their conceptual understanding and more skillful
mathematics learners.
Summary of Literature Review
Proportionality concepts are important because they connect multiple topics across the
standards in grades 6-8 (NCTM, 2000). Proportionality concepts include eight different types of
ratio and proportional representations embedded within topics like scale drawings, functions,
measurements, and formulas. How students understand that proportionality problems are
primarily affected by their reasoning skills (De La Cruz, 2008; Lamon, 1993). Students’ learning
about proportionality may also be impacted by how they perceive the rational numbers
embedded within the mathematical problems (De La Cruz, 2008; Lamon, 1993). Moreover, the
appearance or lack of different types of problems for students to engage in may affect a teachers’
35
capacity to support student learning. These include missing value, comparison, transformation,
mean value, conversion, units with their measure, and translation between representational
modes.
Curriculum documents, textbooks, and other curriculum materials greatly influence the
organizational structure and pedagogical choices made by teachers. Thus, OERs need to be
examined for the nature of mathematical features and opportunities to engage with the Standards
for Mathematical Practice. Several benefits of OERs include: availability in multiple languages,
alignment with content standards, ease in adoption as a resource, and availability in varied
platforms (Ganapathi, 2018; Kimmons, 2015). Likewise, open resources had several challenges
like expertise requirements for content revisions; stakeholder buy-in; outcomes are not always
superior to traditional textbooks; and adoption availability (Redstone Strategy Group, 2018).
In addition to exposing students to mathematical content, textbooks should promote
varied thinking strategies. The processes and proficiencies promoted by NCTM and the NRC
illustrate what teachers should nurture in their students as they teach the mathematical content.
The Standards for Mathematical Practice takes these two dispositions and blends them into the
Common Core State Standards for Mathematics. Bartell et al. (2017) even proposed that the
Standards for Mathematical Practice could even stimulate equitable instruction within
classrooms.
36
Chapter 3
Methods
This study is a textbook analysis of the extent OER textbooks attends to ratio and
proportional reasoning. Although proportionality appears in earlier grades, the standards
designed to address ratios and proportions expressly are in grades 6 and 7. Particularly, there are
three Common Core State Standards (2010) in 6th grade, and three standards assigned to 7th
grade that focus explicitly on ratios and proportional reasoning. Thus, the foci, of the analysis
will be on 6 and 7 grade textbooks. The Common Core State Standards that focuses on Ratios
and Proportional Reasoning are identified in Table 5.
For this study, the following OERs (Table 6) were examined: Engage NY, Open Up
Resources, and Utah Middle School Mathematics Project. These textbooks were available as a
complete series available for grades 6, 7, and 8. The 8th-grade texts from each series were
omitted due to the absence of a Ratio and Proportional Reasoning standard in the 8th Grade
Common Core State Standards for Mathematics. Although, ratio and proportional reasoning
impacts several concepts in 8th grade, specific standards for ratio and proportional reasoning do
not exist within 8th grade Common Core State Standards; thus, the 8th grade textbooks were not
examined. Each series was available online in its entirety with teacher resource materials. Also,
each free OER had been adopted by at least one district as their primary curriculum. Hence, this
study analyzed only the grades 6 and 7 textbooks from Engage NY, Open Up Resources, and
Utah Middle School Math Project.
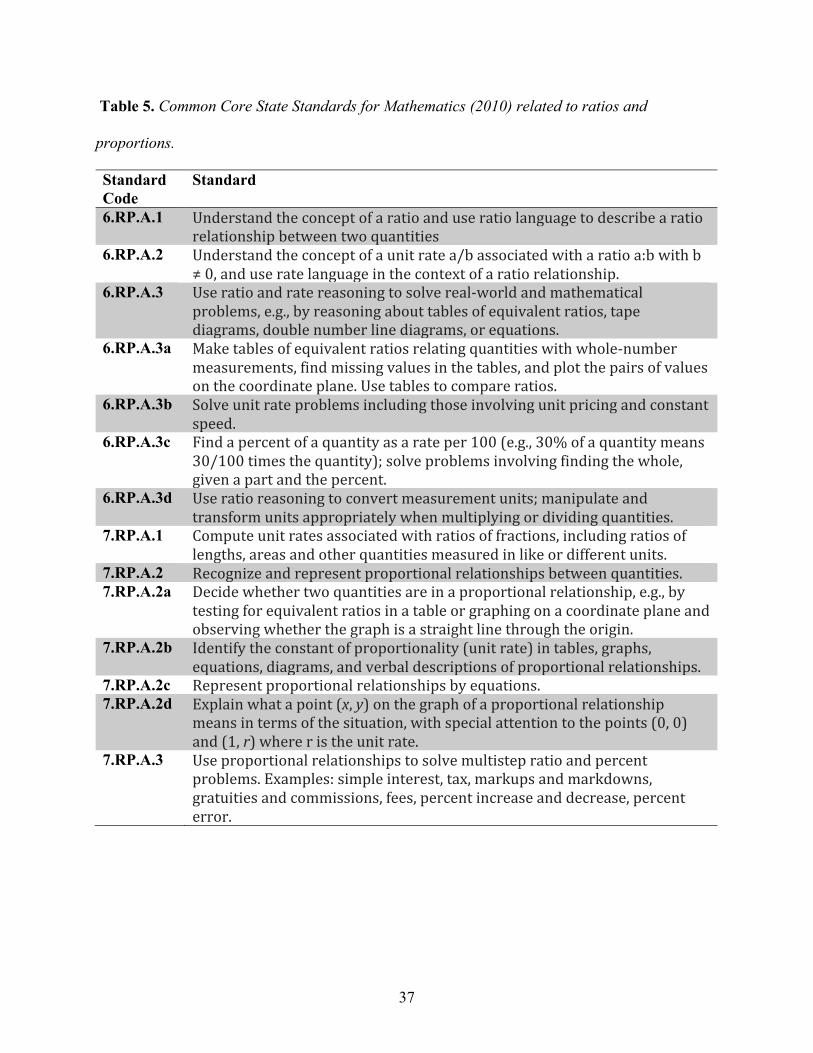
37
Table 5. Common Core State Standards for Mathematics (2010) related to ratios and
proportions.
Standard Code
Standard
6.RP.A.1 Understandtheconceptofaratioanduseratiolanguagetodescribearatiorelationshipbetweentwoquantities
6.RP.A.2 Understandtheconceptofaunitratea/bassociatedwitharatioa:bwithb≠0,anduseratelanguageinthecontextofaratiorelationship.
6.RP.A.3 Useratioandratereasoningtosolvereal-worldandmathematicalproblems,e.g.,byreasoningabouttablesofequivalentratios,tapediagrams,doublenumberlinediagrams,orequations.
6.RP.A.3a Maketablesofequivalentratiosrelatingquantitieswithwhole-numbermeasurements,findmissingvaluesinthetables,andplotthepairsofvaluesonthecoordinateplane.Usetablestocompareratios.
6.RP.A.3b Solveunitrateproblemsincludingthoseinvolvingunitpricingandconstantspeed.
6.RP.A.3c Findapercentofaquantityasarateper100(e.g.,30%ofaquantitymeans30/100timesthequantity);solveproblemsinvolvingfindingthewhole,givenapartandthepercent.
6.RP.A.3d Useratioreasoningtoconvertmeasurementunits;manipulateandtransformunitsappropriatelywhenmultiplyingordividingquantities.
7.RP.A.1 Computeunitratesassociatedwithratiosoffractions,includingratiosoflengths,areasandotherquantitiesmeasuredinlikeordifferentunits.
7.RP.A.2 Recognizeandrepresentproportionalrelationshipsbetweenquantities. 7.RP.A.2a Decidewhethertwoquantitiesareinaproportionalrelationship,e.g.,by
testingforequivalentratiosinatableorgraphingonacoordinateplaneandobservingwhetherthegraphisastraightlinethroughtheorigin.
7.RP.A.2b Identifytheconstantofproportionality(unitrate)intables,graphs,equations,diagrams,andverbaldescriptionsofproportionalrelationships.
7.RP.A.2c Representproportionalrelationshipsbyequations. 7.RP.A.2d Explainwhatapoint(x,y)onthegraphofaproportionalrelationship
meansintermsofthesituation,withspecialattentiontothepoints(0,0)and(1,r)whereristheunitrate.
7.RP.A.3 Useproportionalrelationshipstosolvemultistepratioandpercentproblems.Examples:simpleinterest,tax,markupsandmarkdowns,gratuitiesandcommissions,fees,percentincreaseanddecrease,percenterror.
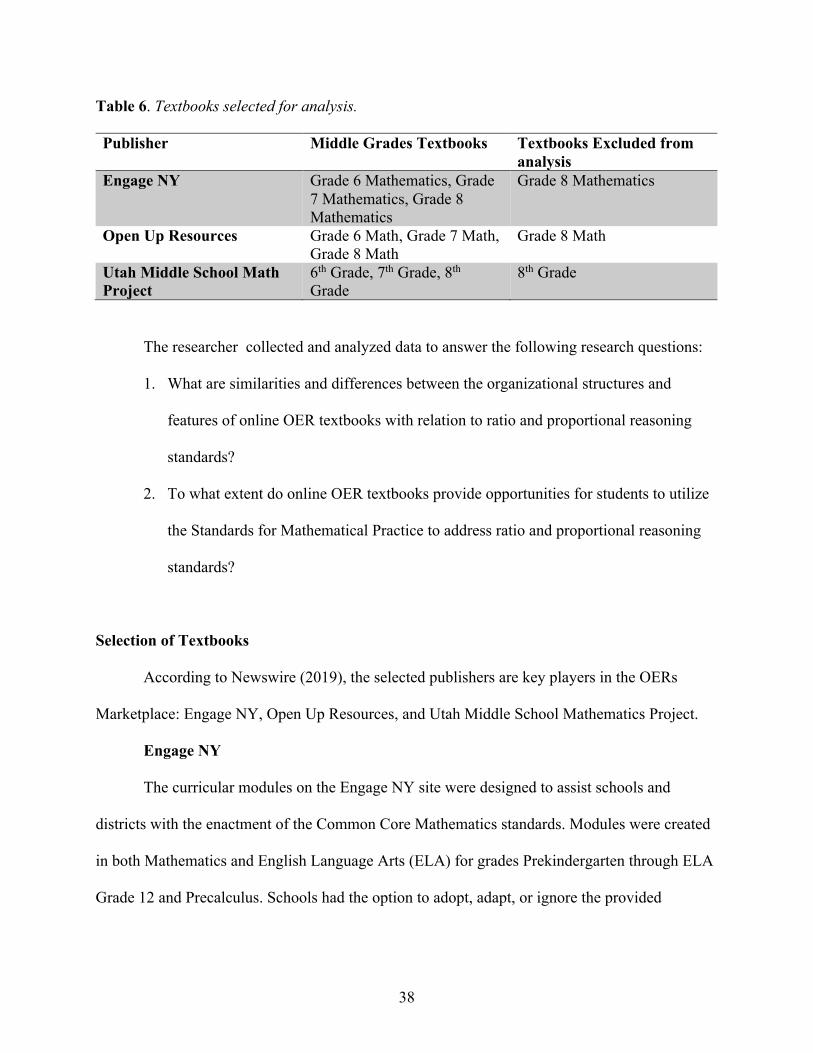
38
Table 6. Textbooks selected for analysis.
Publisher Middle Grades Textbooks Textbooks Excluded from analysis
Engage NY Grade 6 Mathematics, Grade 7 Mathematics, Grade 8 Mathematics
Grade 8 Mathematics
Open Up Resources Grade 6 Math, Grade 7 Math, Grade 8 Math
Grade 8 Math
Utah Middle School Math Project
6th Grade, 7th Grade, 8th Grade
8th Grade
The researcher collected and analyzed data to answer the following research questions:
1. What are similarities and differences between the organizational structures and
features of online OER textbooks with relation to ratio and proportional reasoning
standards?
2. To what extent do online OER textbooks provide opportunities for students to utilize
the Standards for Mathematical Practice to address ratio and proportional reasoning
standards?
Selection of Textbooks
According to Newswire (2019), the selected publishers are key players in the OERs
Marketplace: Engage NY, Open Up Resources, and Utah Middle School Mathematics Project.
Engage NY
The curricular modules on the Engage NY site were designed to assist schools and
districts with the enactment of the Common Core Mathematics standards. Modules were created
in both Mathematics and English Language Arts (ELA) for grades Prekindergarten through ELA
Grade 12 and Precalculus. Schools had the option to adopt, adapt, or ignore the provided
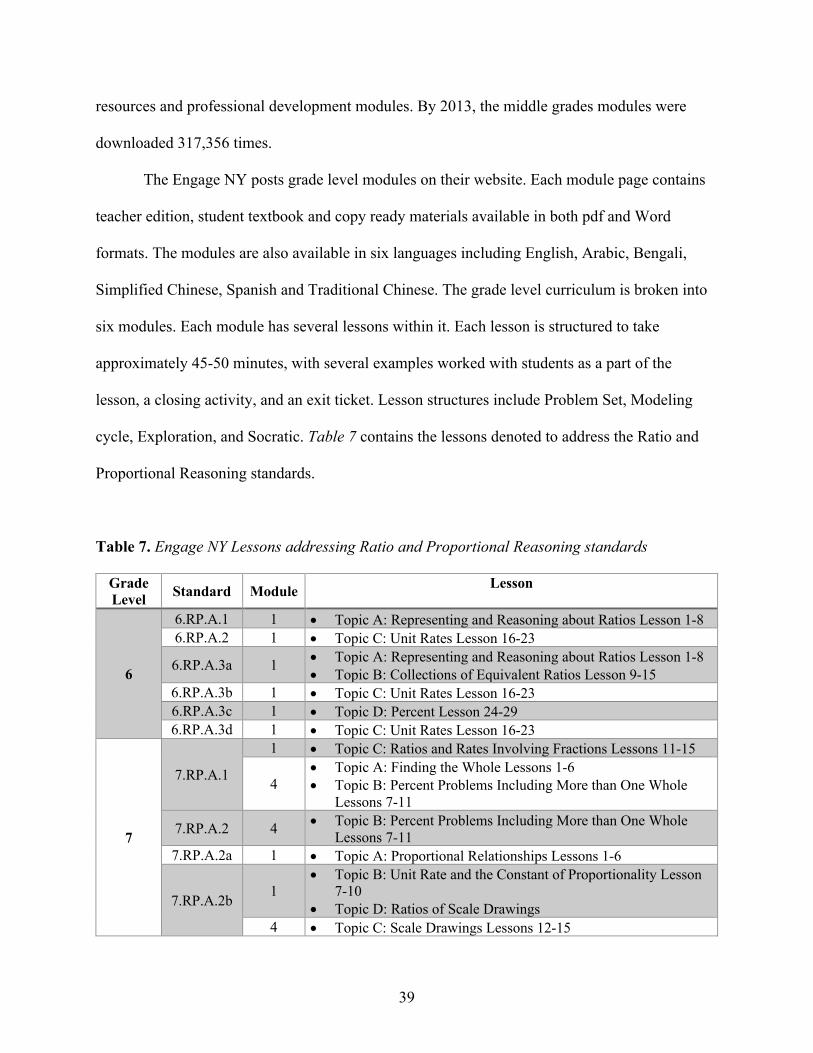
39
resources and professional development modules. By 2013, the middle grades modules were
downloaded 317,356 times.
The Engage NY posts grade level modules on their website. Each module page contains
teacher edition, student textbook and copy ready materials available in both pdf and Word
formats. The modules are also available in six languages including English, Arabic, Bengali,
Simplified Chinese, Spanish and Traditional Chinese. The grade level curriculum is broken into
six modules. Each module has several lessons within it. Each lesson is structured to take
approximately 45-50 minutes, with several examples worked with students as a part of the
lesson, a closing activity, and an exit ticket. Lesson structures include Problem Set, Modeling
cycle, Exploration, and Socratic. Table 7 contains the lessons denoted to address the Ratio and
Proportional Reasoning standards.
Table 7. Engage NY Lessons addressing Ratio and Proportional Reasoning standards
Grade Level Standard Module Lesson
6
6.RP.A.1 1 • Topic A: Representing and Reasoning about Ratios Lesson 1-8 6.RP.A.2 1 • Topic C: Unit Rates Lesson 16-23
6.RP.A.3a 1 • Topic A: Representing and Reasoning about Ratios Lesson 1-8 • Topic B: Collections of Equivalent Ratios Lesson 9-15
6.RP.A.3b 1 • Topic C: Unit Rates Lesson 16-23 6.RP.A.3c 1 • Topic D: Percent Lesson 24-29 6.RP.A.3d 1 • Topic C: Unit Rates Lesson 16-23
7
7.RP.A.1
1 • Topic C: Ratios and Rates Involving Fractions Lessons 11-15
4 • Topic A: Finding the Whole Lessons 1-6 • Topic B: Percent Problems Including More than One Whole
Lessons 7-11
7.RP.A.2 4 • Topic B: Percent Problems Including More than One Whole Lessons 7-11
7.RP.A.2a 1 • Topic A: Proportional Relationships Lessons 1-6
7.RP.A.2b 1 • Topic B: Unit Rate and the Constant of Proportionality Lesson
7-10 • Topic D: Ratios of Scale Drawings
4 • Topic C: Scale Drawings Lessons 12-15
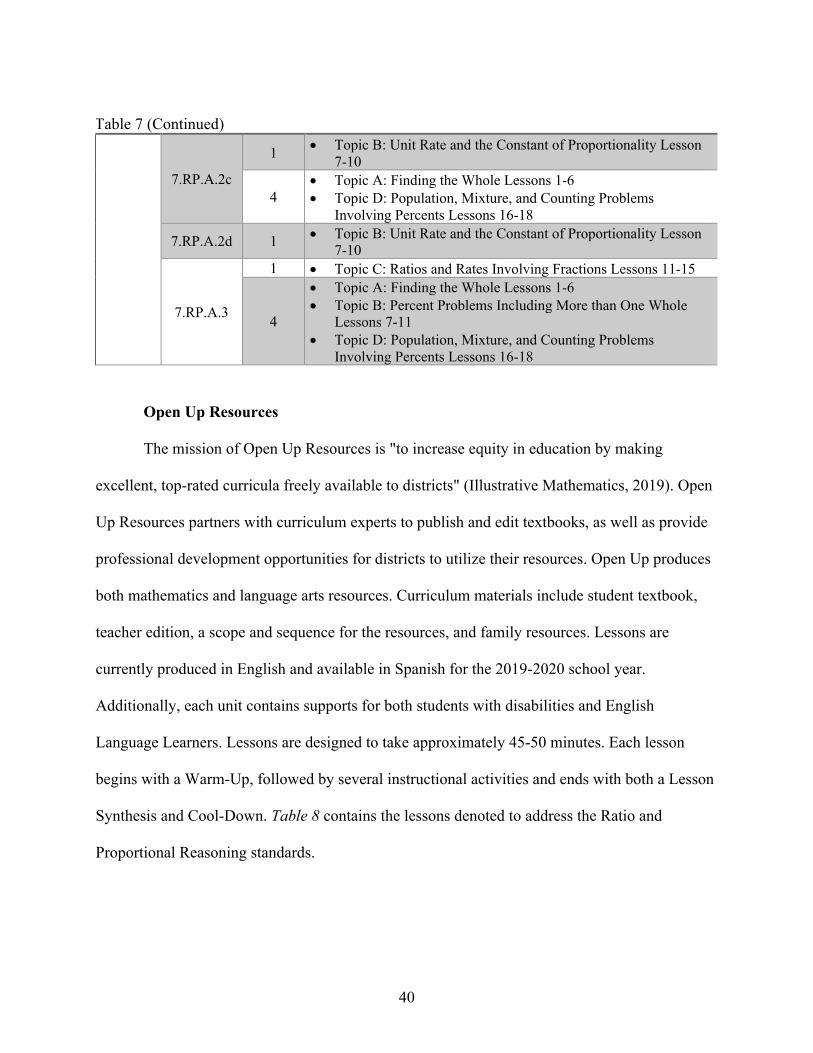
40
Table 7 (Continued)
7.RP.A.2c
1 • Topic B: Unit Rate and the Constant of Proportionality Lesson 7-10
4 • Topic A: Finding the Whole Lessons 1-6 • Topic D: Population, Mixture, and Counting Problems
Involving Percents Lessons 16-18
7.RP.A.2d 1 • Topic B: Unit Rate and the Constant of Proportionality Lesson 7-10
7.RP.A.3
1 • Topic C: Ratios and Rates Involving Fractions Lessons 11-15
4
• Topic A: Finding the Whole Lessons 1-6 • Topic B: Percent Problems Including More than One Whole
Lessons 7-11 • Topic D: Population, Mixture, and Counting Problems
Involving Percents Lessons 16-18
Open Up Resources
The mission of Open Up Resources is "to increase equity in education by making
excellent, top-rated curricula freely available to districts" (Illustrative Mathematics, 2019). Open
Up Resources partners with curriculum experts to publish and edit textbooks, as well as provide
professional development opportunities for districts to utilize their resources. Open Up produces
both mathematics and language arts resources. Curriculum materials include student textbook,
teacher edition, a scope and sequence for the resources, and family resources. Lessons are
currently produced in English and available in Spanish for the 2019-2020 school year.
Additionally, each unit contains supports for both students with disabilities and English
Language Learners. Lessons are designed to take approximately 45-50 minutes. Each lesson
begins with a Warm-Up, followed by several instructional activities and ends with both a Lesson
Synthesis and Cool-Down. Table 8 contains the lessons denoted to address the Ratio and
Proportional Reasoning standards.
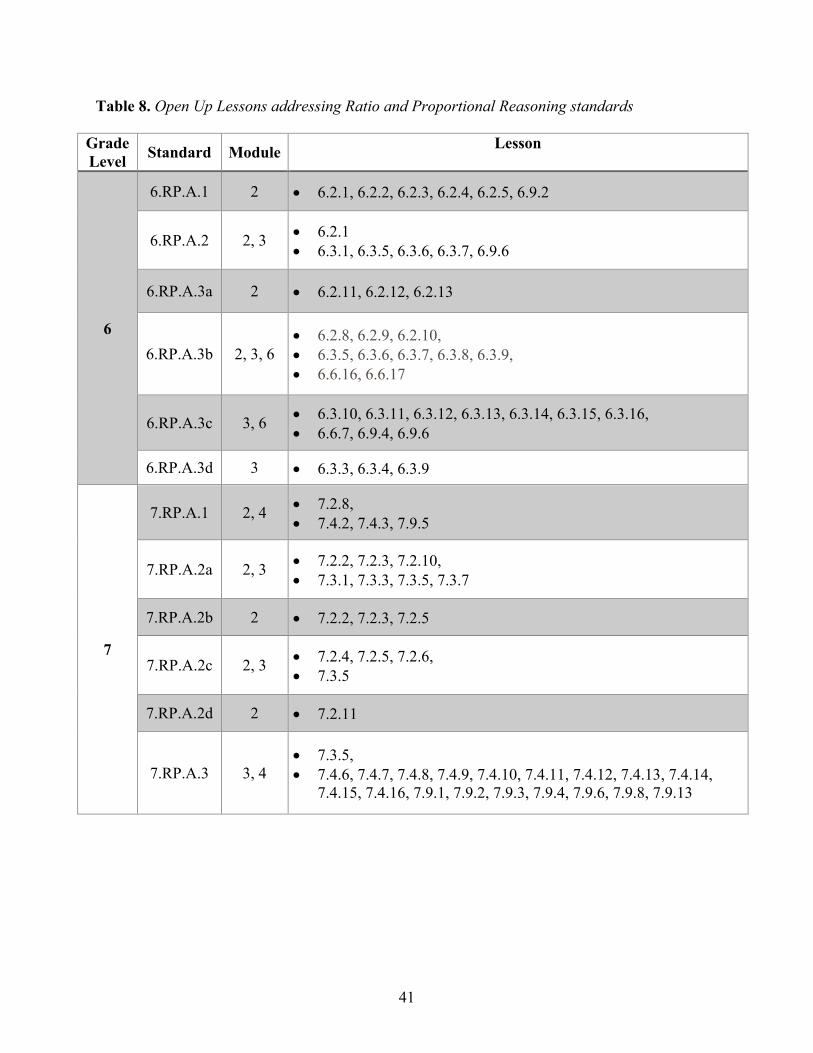
41
Table 8. Open Up Lessons addressing Ratio and Proportional Reasoning standards
Grade Level Standard Module Lesson
6
6.RP.A.1 2 • 6.2.1, 6.2.2, 6.2.3, 6.2.4, 6.2.5, 6.9.2
6.RP.A.2 2, 3 • 6.2.1 • 6.3.1, 6.3.5, 6.3.6, 6.3.7, 6.9.6
6.RP.A.3a 2 • 6.2.11, 6.2.12, 6.2.13
6.RP.A.3b 2, 3, 6 • 6.2.8, 6.2.9, 6.2.10, • 6.3.5, 6.3.6, 6.3.7, 6.3.8, 6.3.9, • 6.6.16, 6.6.17
6.RP.A.3c 3, 6 • 6.3.10, 6.3.11, 6.3.12, 6.3.13, 6.3.14, 6.3.15, 6.3.16, • 6.6.7, 6.9.4, 6.9.6
6.RP.A.3d 3 • 6.3.3, 6.3.4, 6.3.9
7
7.RP.A.1 2, 4 • 7.2.8, • 7.4.2, 7.4.3, 7.9.5
7.RP.A.2a 2, 3 • 7.2.2, 7.2.3, 7.2.10, • 7.3.1, 7.3.3, 7.3.5, 7.3.7
7.RP.A.2b 2 • 7.2.2, 7.2.3, 7.2.5
7.RP.A.2c 2, 3 • 7.2.4, 7.2.5, 7.2.6, • 7.3.5
7.RP.A.2d 2 • 7.2.11
7.RP.A.3 3, 4 • 7.3.5, • 7.4.6, 7.4.7, 7.4.8, 7.4.9, 7.4.10, 7.4.11, 7.4.12, 7.4.13, 7.4.14,
7.4.15, 7.4.16, 7.9.1, 7.9.2, 7.9.3, 7.9.4, 7.9.6, 7.9.8, 7.9.13
42
Utah Middle School Mathematics Project
The Utah State Board of Education initially funded the curricular modules produced by
the Utah Education Network. A collaboration between the University of Utah, Utah State
University, Snow College, Weber State College, and four school districts in Utah designed the
textbooks. The Utah Middle School Mathematics Project (UMSMP) lessons were designed to
assist schools and districts with the enactment of the Common Core. Modules were created for
7th and 8th grade and then later added for 6th grade.
The UMSMP posted grade-level chapters on their website as pdfs and Word documents.
Each chapter contained a teacher workbook, student workbook, mathematical foundations,
parent edition, and PowerPoint lessons (for 7th and 8th-grade content). The 6th-grade curriculum
has six chapters. The 7th-grade curriculum has eight chapters. The 8th-grade curriculum
contained ten chapters. Each chapter has several sections with multiple lessons within them.
Each section begins with an anchor problem that guides the rest of the section's content. Each
lesson is structured to take approximately 45-50 minutes with several class activities worked
with students as a part of the lesson, homework activities, a spiral review, and an exit ticket.
Table 9 contains the chapters denoted to address the Ratio and Proportional Reasoning standards.
Section notations, for the 6th-grade content, were not available at the time of this study.
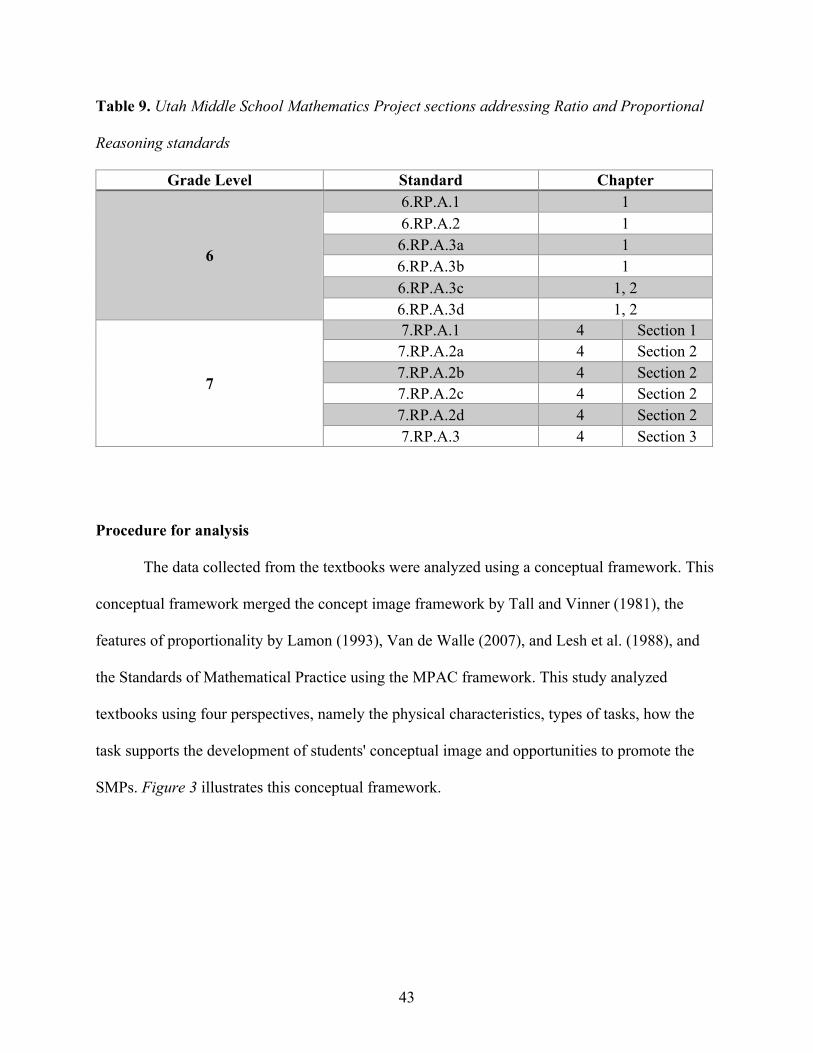
43
Table 9. Utah Middle School Mathematics Project sections addressing Ratio and Proportional
Reasoning standards
Grade Level Standard Chapter
6
6.RP.A.1 1 6.RP.A.2 1 6.RP.A.3a 1 6.RP.A.3b 1 6.RP.A.3c 1, 2 6.RP.A.3d 1, 2
7
7.RP.A.1 4 Section 1 7.RP.A.2a 4 Section 2 7.RP.A.2b 4 Section 2 7.RP.A.2c 4 Section 2 7.RP.A.2d 4 Section 2 7.RP.A.3 4 Section 3
Procedure for analysis
The data collected from the textbooks were analyzed using a conceptual framework. This
conceptual framework merged the concept image framework by Tall and Vinner (1981), the
features of proportionality by Lamon (1993), Van de Walle (2007), and Lesh et al. (1988), and
the Standards of Mathematical Practice using the MPAC framework. This study analyzed
textbooks using four perspectives, namely the physical characteristics, types of tasks, how the
task supports the development of students' conceptual image and opportunities to promote the
SMPs. Figure 3 illustrates this conceptual framework.
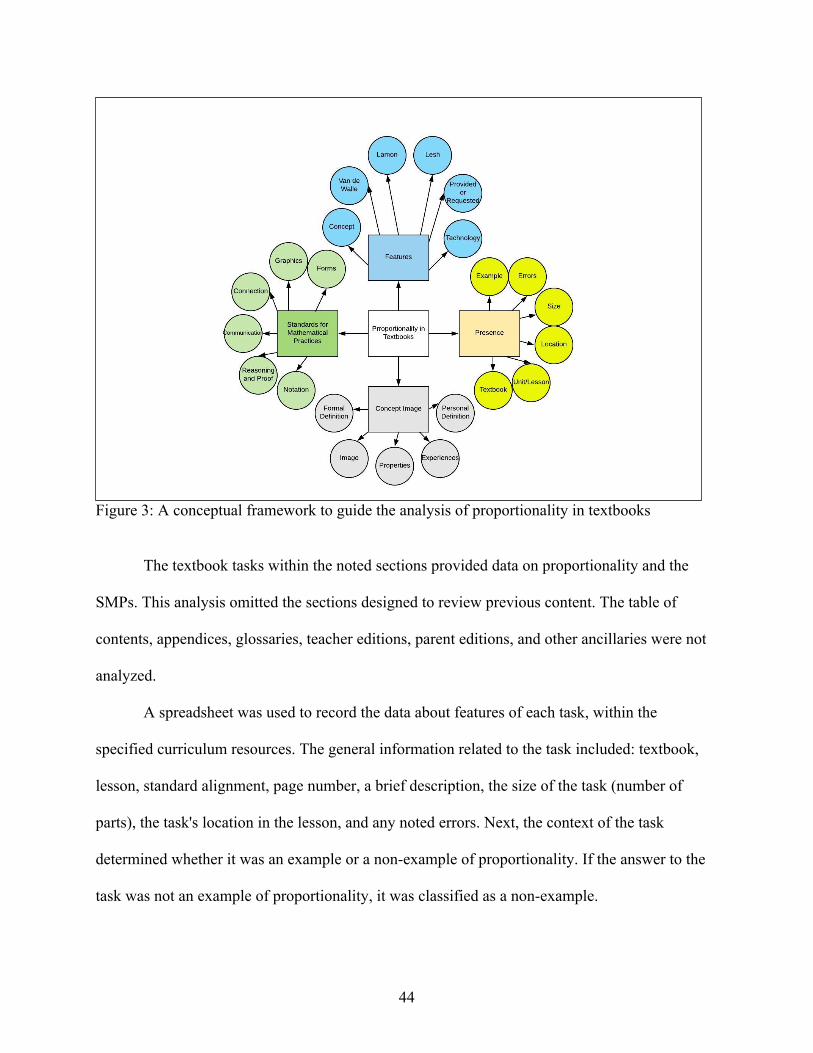
44
Figure 3: A conceptual framework to guide the analysis of proportionality in textbooks
The textbook tasks within the noted sections provided data on proportionality and the
SMPs. This analysis omitted the sections designed to review previous content. The table of
contents, appendices, glossaries, teacher editions, parent editions, and other ancillaries were not
analyzed.
A spreadsheet was used to record the data about features of each task, within the
specified curriculum resources. The general information related to the task included: textbook,
lesson, standard alignment, page number, a brief description, the size of the task (number of
parts), the task's location in the lesson, and any noted errors. Next, the context of the task
determined whether it was an example or a non-example of proportionality. If the answer to the
task was not an example of proportionality, it was classified as a non-example.
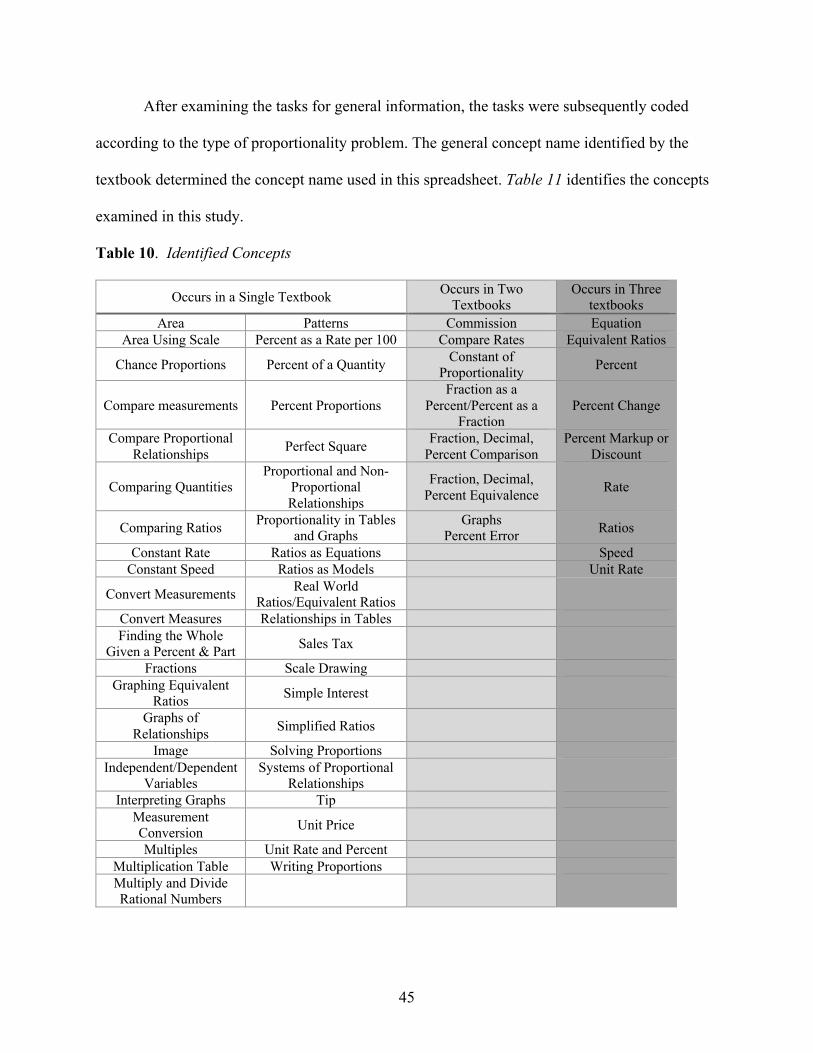
45
After examining the tasks for general information, the tasks were subsequently coded
according to the type of proportionality problem. The general concept name identified by the
textbook determined the concept name used in this spreadsheet. Table 11 identifies the concepts
examined in this study.
Table 10. Identified Concepts
Occurs in a Single Textbook Occurs in Two Textbooks
Occurs in Three textbooks
Area Patterns Commission Equation Area Using Scale Percent as a Rate per 100 Compare Rates Equivalent Ratios
Chance Proportions Percent of a Quantity Constant of Proportionality Percent
Compare measurements Percent Proportions Fraction as a
Percent/Percent as a Fraction
Percent Change
Compare Proportional Relationships Perfect Square Fraction, Decimal,
Percent Comparison Percent Markup or
Discount
Comparing Quantities Proportional and Non-
Proportional Relationships
Fraction, Decimal, Percent Equivalence Rate
Comparing Ratios Proportionality in Tables and Graphs
Graphs Percent Error Ratios
Constant Rate Ratios as Equations Speed Constant Speed Ratios as Models Unit Rate
Convert Measurements Real World Ratios/Equivalent Ratios
Convert Measures Relationships in Tables Finding the Whole
Given a Percent & Part Sales Tax
Fractions Scale Drawing Graphing Equivalent
Ratios Simple Interest
Graphs of Relationships Simplified Ratios
Image Solving Proportions Independent/Dependent
Variables Systems of Proportional
Relationships
Interpreting Graphs Tip Measurement Conversion Unit Price
Multiples Unit Rate and Percent Multiplication Table Writing Proportions Multiply and Divide Rational Numbers
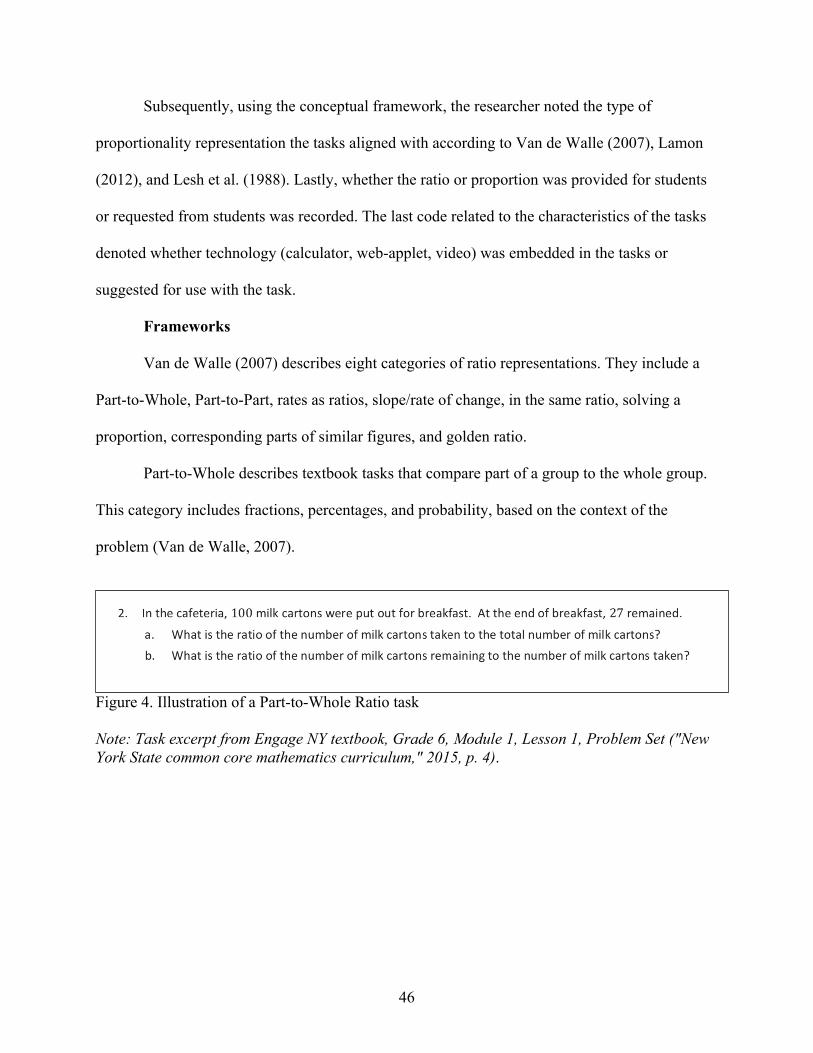
46
Subsequently, using the conceptual framework, the researcher noted the type of
proportionality representation the tasks aligned with according to Van de Walle (2007), Lamon
(2012), and Lesh et al. (1988). Lastly, whether the ratio or proportion was provided for students
or requested from students was recorded. The last code related to the characteristics of the tasks
denoted whether technology (calculator, web-applet, video) was embedded in the tasks or
suggested for use with the task.
Frameworks
Van de Walle (2007) describes eight categories of ratio representations. They include a
Part-to-Whole, Part-to-Part, rates as ratios, slope/rate of change, in the same ratio, solving a
proportion, corresponding parts of similar figures, and golden ratio.
Part-to-Whole describes textbook tasks that compare part of a group to the whole group.
This category includes fractions, percentages, and probability, based on the context of the
problem (Van de Walle, 2007).
Figure 4. Illustration of a Part-to-Whole Ratio task Note: Task excerpt from Engage NY textbook, Grade 6, Module 1, Lesson 1, Problem Set ("New York State common core mathematics curriculum," 2015, p. 4).
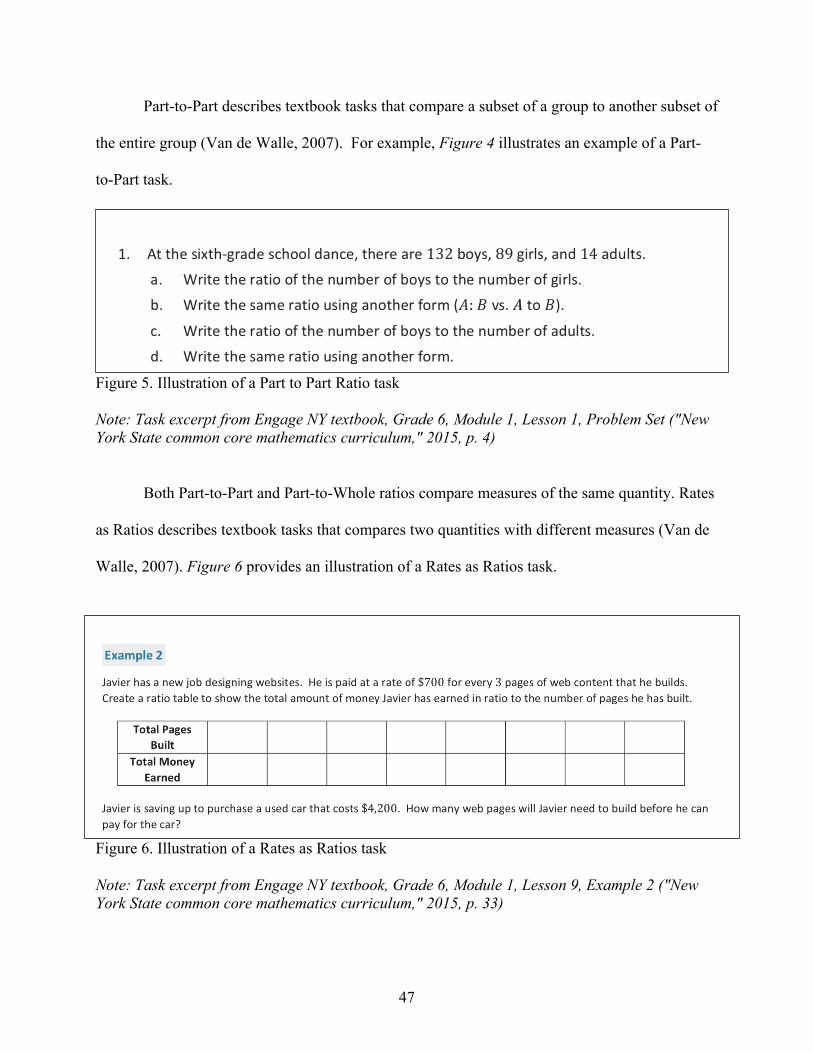
47
Part-to-Part describes textbook tasks that compare a subset of a group to another subset of
the entire group (Van de Walle, 2007). For example, Figure 4 illustrates an example of a Part-
to-Part task.
Figure 5. Illustration of a Part to Part Ratio task
Note: Task excerpt from Engage NY textbook, Grade 6, Module 1, Lesson 1, Problem Set ("New York State common core mathematics curriculum," 2015, p. 4)
Both Part-to-Part and Part-to-Whole ratios compare measures of the same quantity. Rates
as Ratios describes textbook tasks that compares two quantities with different measures (Van de
Walle, 2007). Figure 6 provides an illustration of a Rates as Ratios task.
Figure 6. Illustration of a Rates as Ratios task Note: Task excerpt from Engage NY textbook, Grade 6, Module 1, Lesson 9, Example 2 ("New York State common core mathematics curriculum," 2015, p. 33)
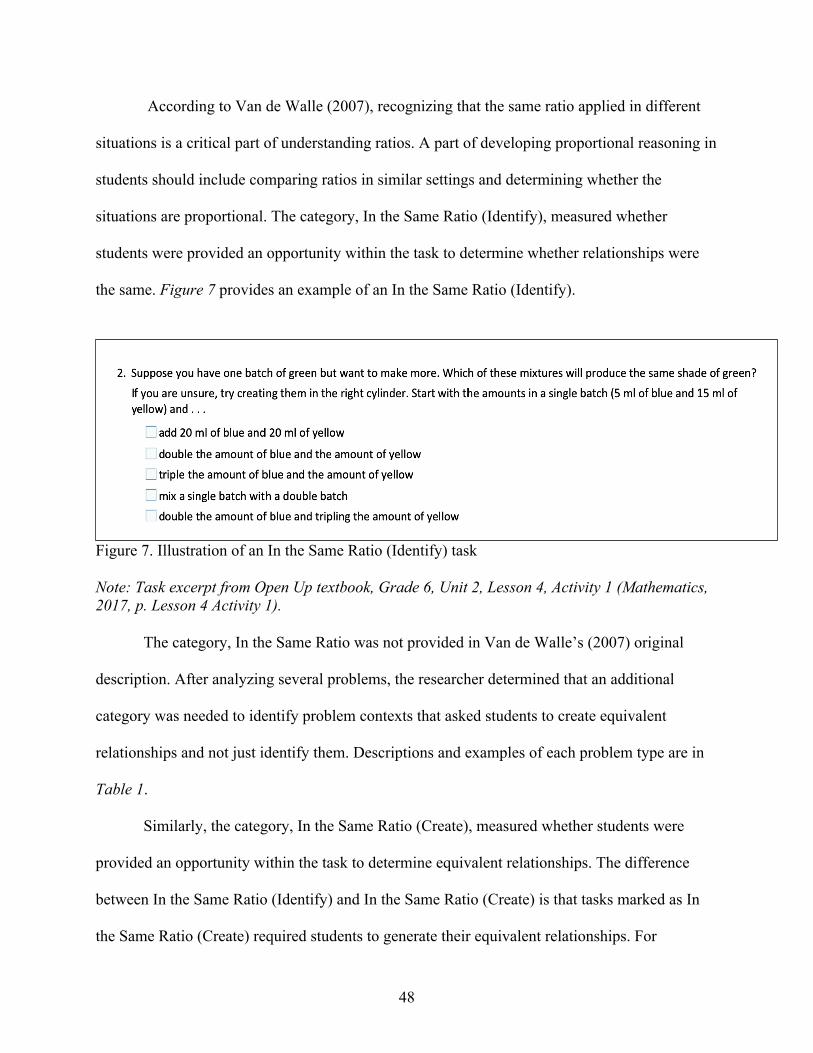
48
According to Van de Walle (2007), recognizing that the same ratio applied in different
situations is a critical part of understanding ratios. A part of developing proportional reasoning in
students should include comparing ratios in similar settings and determining whether the
situations are proportional. The category, In the Same Ratio (Identify), measured whether
students were provided an opportunity within the task to determine whether relationships were
the same. Figure 7 provides an example of an In the Same Ratio (Identify).
Figure 7. Illustration of an In the Same Ratio (Identify) task Note: Task excerpt from Open Up textbook, Grade 6, Unit 2, Lesson 4, Activity 1 (Mathematics, 2017, p. Lesson 4 Activity 1).
The category, In the Same Ratio was not provided in Van de Walle’s (2007) original
description. After analyzing several problems, the researcher determined that an additional
category was needed to identify problem contexts that asked students to create equivalent
relationships and not just identify them. Descriptions and examples of each problem type are in
Table 1.
Similarly, the category, In the Same Ratio (Create), measured whether students were
provided an opportunity within the task to determine equivalent relationships. The difference
between In the Same Ratio (Identify) and In the Same Ratio (Create) is that tasks marked as In
the Same Ratio (Create) required students to generate their equivalent relationships. For
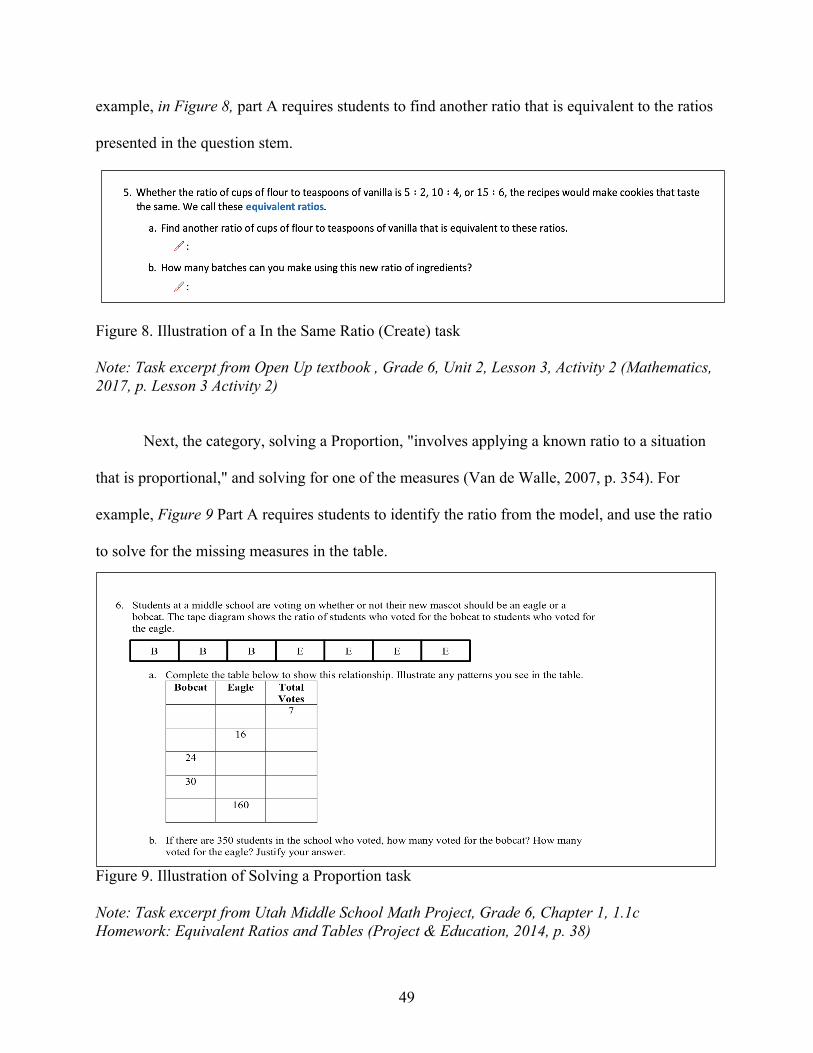
49
example, in Figure 8, part A requires students to find another ratio that is equivalent to the ratios
presented in the question stem.
Figure 8. Illustration of a In the Same Ratio (Create) task
Note: Task excerpt from Open Up textbook , Grade 6, Unit 2, Lesson 3, Activity 2 (Mathematics, 2017, p. Lesson 3 Activity 2)
Next, the category, solving a Proportion, "involves applying a known ratio to a situation
that is proportional," and solving for one of the measures (Van de Walle, 2007, p. 354). For
example, Figure 9 Part A requires students to identify the ratio from the model, and use the ratio
to solve for the missing measures in the table.
Figure 9. Illustration of Solving a Proportion task Note: Task excerpt from Utah Middle School Math Project, Grade 6, Chapter 1, 1.1c Homework: Equivalent Ratios and Tables (Project & Education, 2014, p. 38)
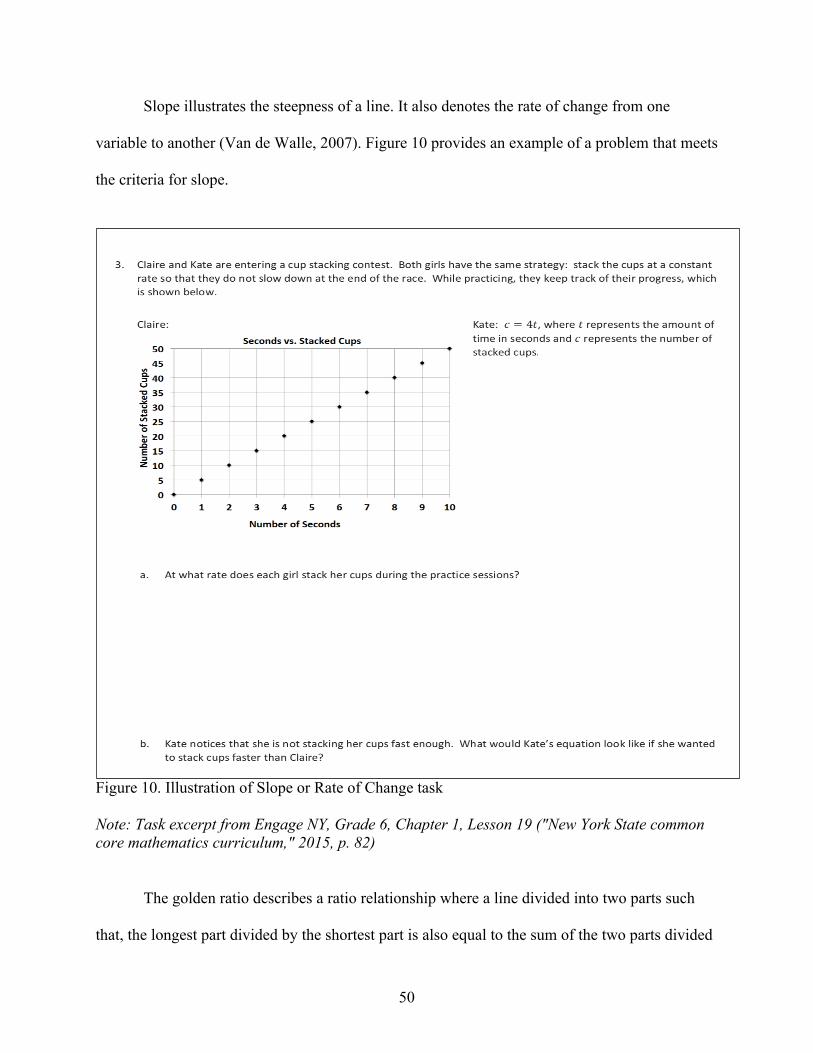
50
Slope illustrates the steepness of a line. It also denotes the rate of change from one
variable to another (Van de Walle, 2007). Figure 10 provides an example of a problem that meets
the criteria for slope.
Figure 10. Illustration of Slope or Rate of Change task Note: Task excerpt from Engage NY, Grade 6, Chapter 1, Lesson 19 ("New York State common core mathematics curriculum," 2015, p. 82)
The golden ratio describes a ratio relationship where a line divided into two parts such
that, the longest part divided by the shortest part is also equal to the sum of the two parts divided
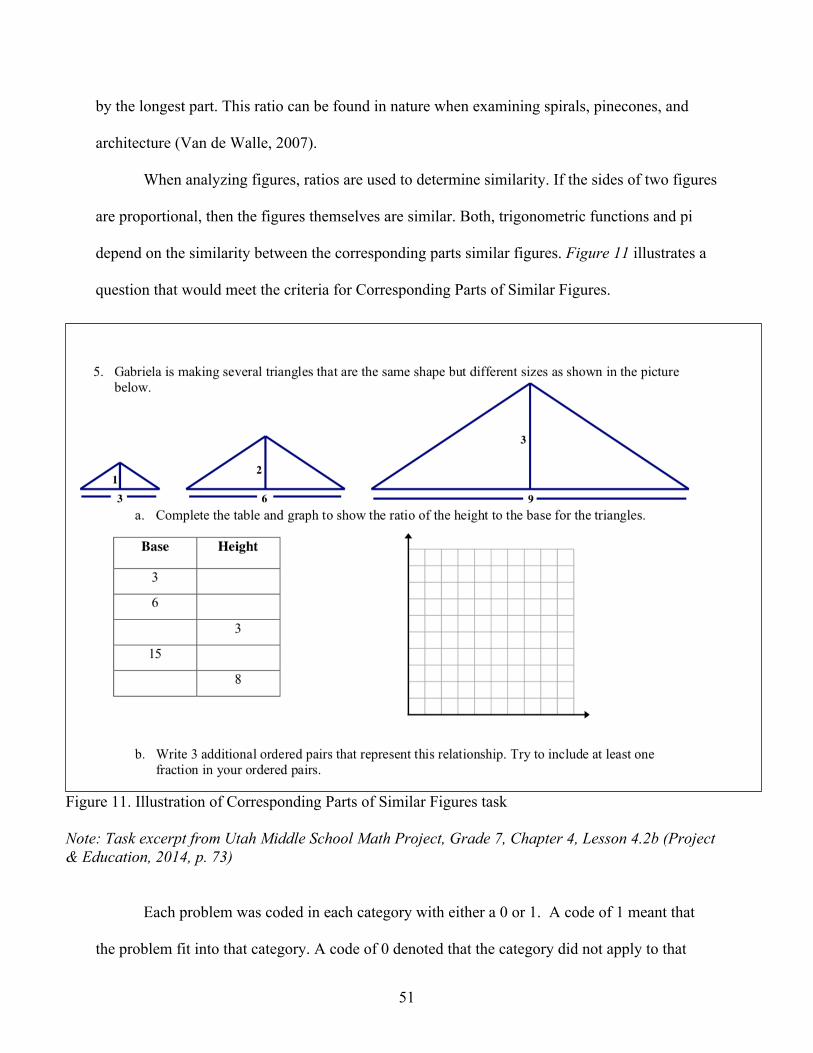
51
by the longest part. This ratio can be found in nature when examining spirals, pinecones, and
architecture (Van de Walle, 2007).
When analyzing figures, ratios are used to determine similarity. If the sides of two figures
are proportional, then the figures themselves are similar. Both, trigonometric functions and pi
depend on the similarity between the corresponding parts similar figures. Figure 11 illustrates a
question that would meet the criteria for Corresponding Parts of Similar Figures.
Figure 11. Illustration of Corresponding Parts of Similar Figures task Note: Task excerpt from Utah Middle School Math Project, Grade 7, Chapter 4, Lesson 4.2b (Project & Education, 2014, p. 73)
Each problem was coded in each category with either a 0 or 1. A code of 1 meant that
the problem fit into that category. A code of 0 denoted that the category did not apply to that
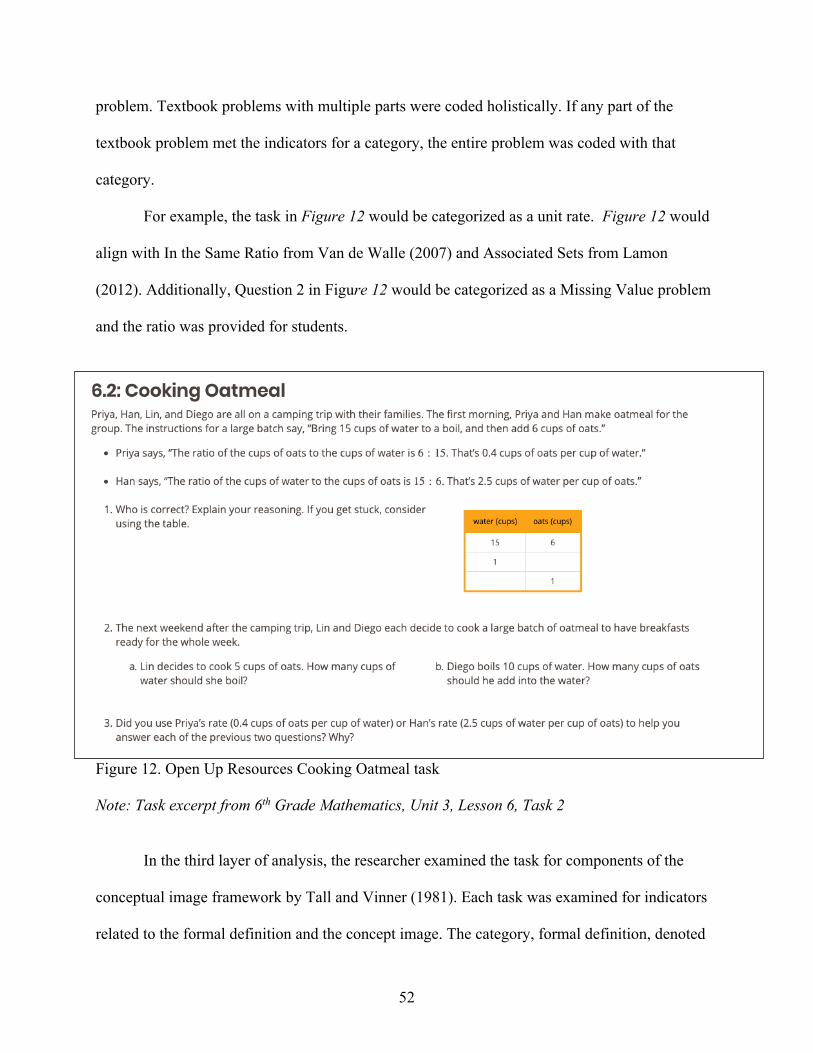
52
problem. Textbook problems with multiple parts were coded holistically. If any part of the
textbook problem met the indicators for a category, the entire problem was coded with that
category.
For example, the task in Figure 12 would be categorized as a unit rate. Figure 12 would
align with In the Same Ratio from Van de Walle (2007) and Associated Sets from Lamon
(2012). Additionally, Question 2 in Figure 12 would be categorized as a Missing Value problem
and the ratio was provided for students.
Figure 12. Open Up Resources Cooking Oatmeal task
Note: Task excerpt from 6th Grade Mathematics, Unit 3, Lesson 6, Task 2
In the third layer of analysis, the researcher examined the task for components of the
conceptual image framework by Tall and Vinner (1981). Each task was examined for indicators
related to the formal definition and the concept image. The category, formal definition, denoted
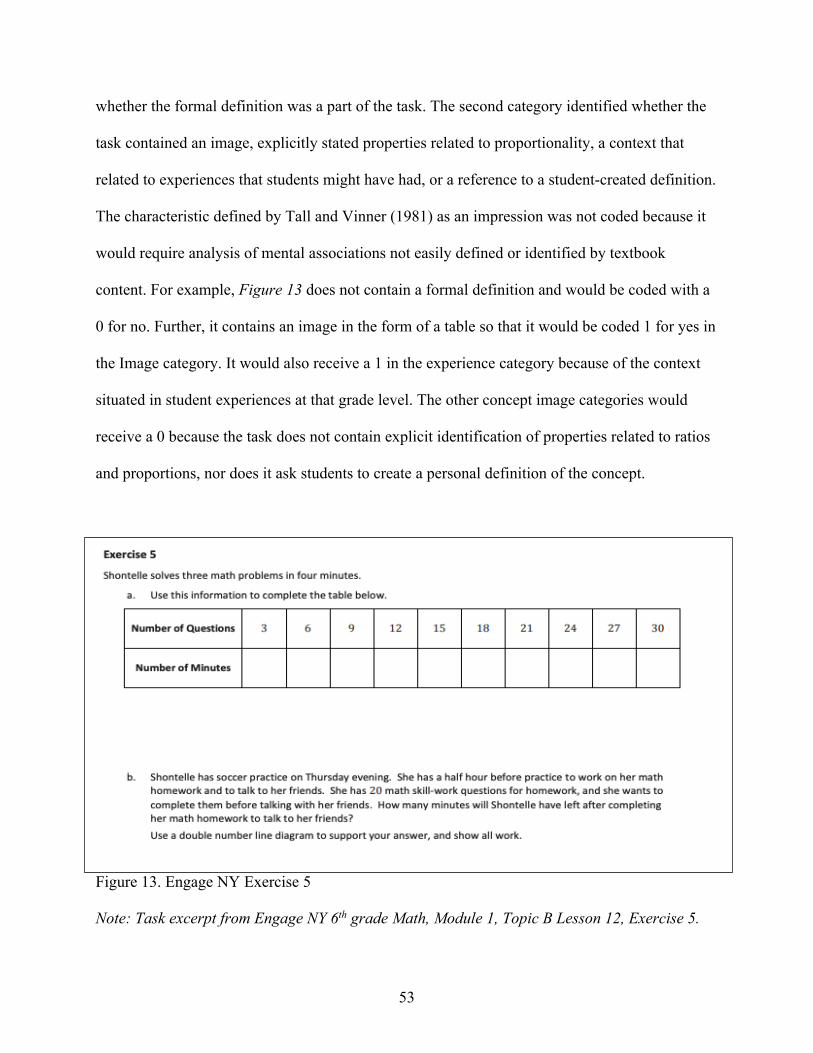
53
whether the formal definition was a part of the task. The second category identified whether the
task contained an image, explicitly stated properties related to proportionality, a context that
related to experiences that students might have had, or a reference to a student-created definition.
The characteristic defined by Tall and Vinner (1981) as an impression was not coded because it
would require analysis of mental associations not easily defined or identified by textbook
content. For example, Figure 13 does not contain a formal definition and would be coded with a
0 for no. Further, it contains an image in the form of a table so that it would be coded 1 for yes in
the Image category. It would also receive a 1 in the experience category because of the context
situated in student experiences at that grade level. The other concept image categories would
receive a 0 because the task does not contain explicit identification of properties related to ratios
and proportions, nor does it ask students to create a personal definition of the concept.
Figure 13. Engage NY Exercise 5
Note: Task excerpt from Engage NY 6th grade Math, Module 1, Topic B Lesson 12, Exercise 5.
54
Finally, the Mathematical Processes Assessment Coding (MPAC) framework, developed
by Hunsader et al. (2014), was used to examine SMP opportunities. Hunsader et al. (2014)
created their framework to analyze assessment questions across content strands and grade levels.
The MPAC categories include Reasoning and Proof, Opportunity for Mathematical
Communication, Connections, Representations: Role of Graphics, and Representations:
Translation of Representational Forms. Table 11 contains a list of the codes within each category
in the MPAC framework.
The reasoning and proof category examine whether students are asked to answer a
question and justify their answers. Similarly, a notation within the Communication category
addresses whether students are asked to record their answers using words, symbols, or graphics.
The Connections category looks at the context of the task and can be real-world situations or
other mathematical content. The final categories relate to representations within the tasks. The
first representation category, Role of the Graphics, notates whether the task has an image and the
intended use of the image. The second category, Translation of Representational Forms,
indicates whether students are asked to "present the mathematics in one representation and asks
the student to represent the essence of the mathematics in another form" (Hunsader et al., 2014,
p. 801). The researcher recorded any SMP designations provided by the publisher within the
textbook.
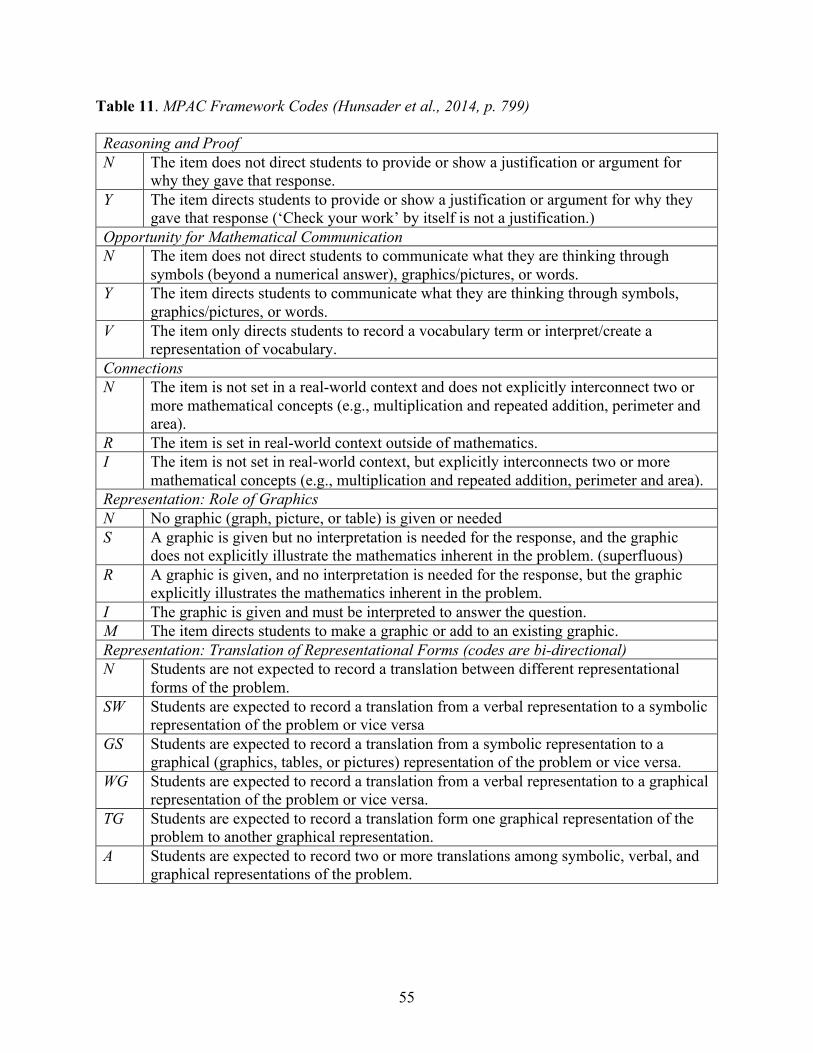
55
Table 11. MPAC Framework Codes (Hunsader et al., 2014, p. 799)
Reasoning and Proof N The item does not direct students to provide or show a justification or argument for
why they gave that response. Y The item directs students to provide or show a justification or argument for why they
gave that response (‘Check your work’ by itself is not a justification.) Opportunity for Mathematical Communication N The item does not direct students to communicate what they are thinking through
symbols (beyond a numerical answer), graphics/pictures, or words. Y The item directs students to communicate what they are thinking through symbols,
graphics/pictures, or words. V The item only directs students to record a vocabulary term or interpret/create a
representation of vocabulary. Connections N The item is not set in a real-world context and does not explicitly interconnect two or
more mathematical concepts (e.g., multiplication and repeated addition, perimeter and area).
R The item is set in real-world context outside of mathematics. I The item is not set in real-world context, but explicitly interconnects two or more
mathematical concepts (e.g., multiplication and repeated addition, perimeter and area). Representation: Role of Graphics N No graphic (graph, picture, or table) is given or needed S A graphic is given but no interpretation is needed for the response, and the graphic
does not explicitly illustrate the mathematics inherent in the problem. (superfluous) R A graphic is given, and no interpretation is needed for the response, but the graphic
explicitly illustrates the mathematics inherent in the problem. I The graphic is given and must be interpreted to answer the question. M The item directs students to make a graphic or add to an existing graphic. Representation: Translation of Representational Forms (codes are bi-directional) N Students are not expected to record a translation between different representational
forms of the problem. SW Students are expected to record a translation from a verbal representation to a symbolic
representation of the problem or vice versa GS Students are expected to record a translation from a symbolic representation to a
graphical (graphics, tables, or pictures) representation of the problem or vice versa. WG Students are expected to record a translation from a verbal representation to a graphical
representation of the problem or vice versa. TG Students are expected to record a translation form one graphical representation of the
problem to another graphical representation. A Students are expected to record two or more translations among symbolic, verbal, and
graphical representations of the problem.
56
For example, Figure 14 contains a 7th-grade task from UMSMP. None of the SMPs were
noted for this particular problem. Also, it does ask students to explain their reasoning. However,
it does not ask students to justify their answer so that it received a 1 in the Opportunity for
Mathematical Communication category and a 0 in the Reasoning and Proof category. In
addition, the task uses real-world context for the problem and was coded with a 1 in the Real-
World Connections category. The fourth category, Representations: The Role of Graphics, would
be coded with a 1 in the category Make/Add to a Graphic because it included a graph that
students must complete as a part of the problem. Finally, the category for Representation: The
Transformation of Representational Forms was coded with a 1 in Verbal to Graphical, Graphical
to Graphical, and Multiple Representations because students are asked to utilize multiple forms
of representations within the same task, including graphical, verbal and symbolic.
The task in Figure 15 provides a virtual manipulative for students to investigate
manipulating ratios to achieve equality.
In Table 12, this researcher provides a complete summary of how the sample tasks
(Figure 12, Figure 13, and Figure 14) were coded for all of the identified criteria.
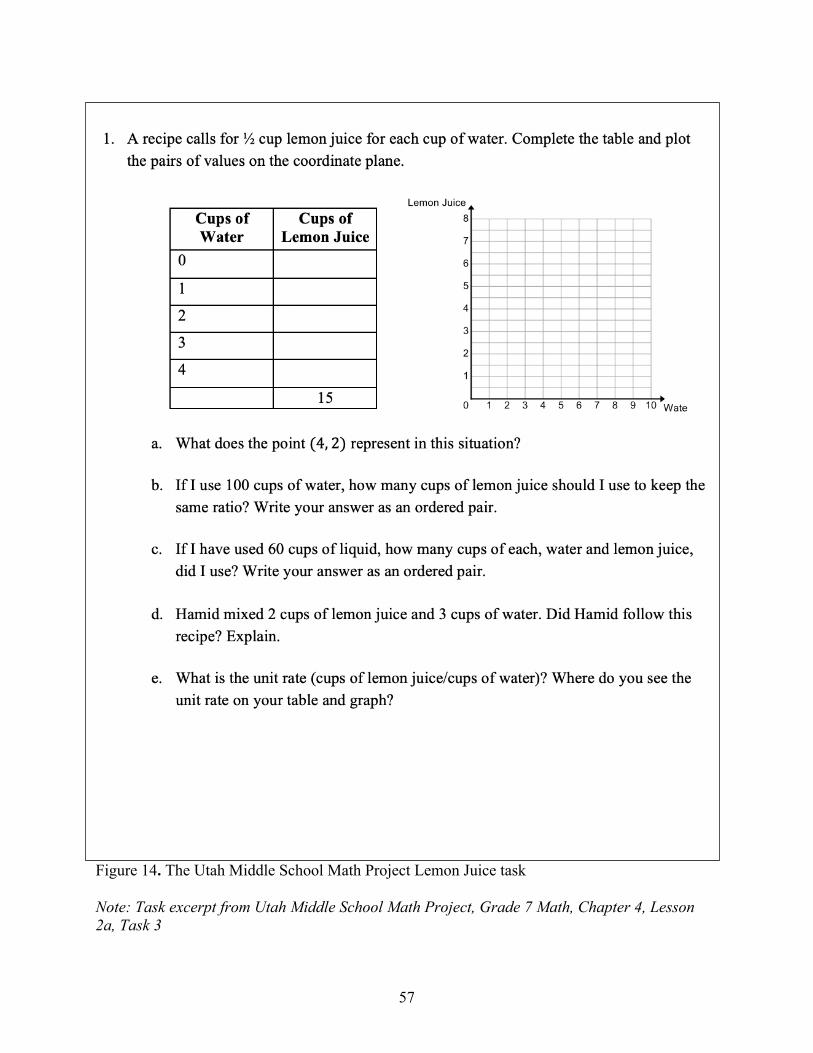
57
Figure 14. The Utah Middle School Math Project Lemon Juice task Note: Task excerpt from Utah Middle School Math Project, Grade 7 Math, Chapter 4, Lesson 2a, Task 3
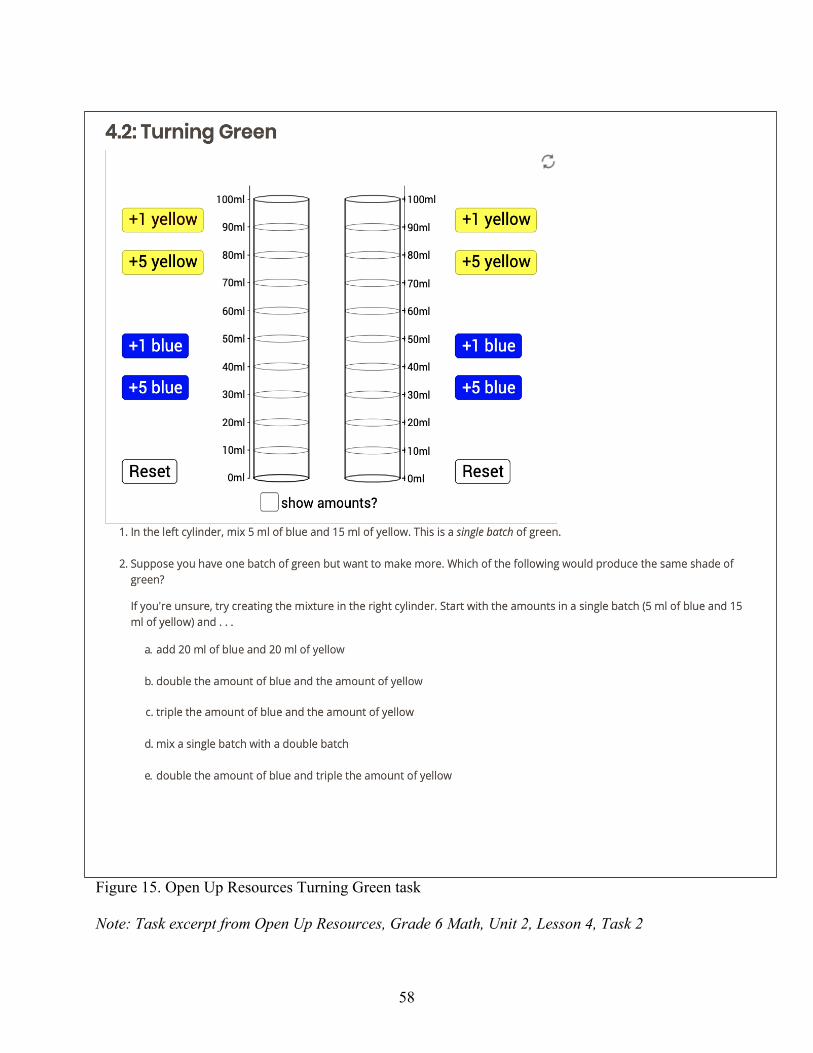
58
Figure 15. Open Up Resources Turning Green task
Note: Task excerpt from Open Up Resources, Grade 6 Math, Unit 2, Lesson 4, Task 2
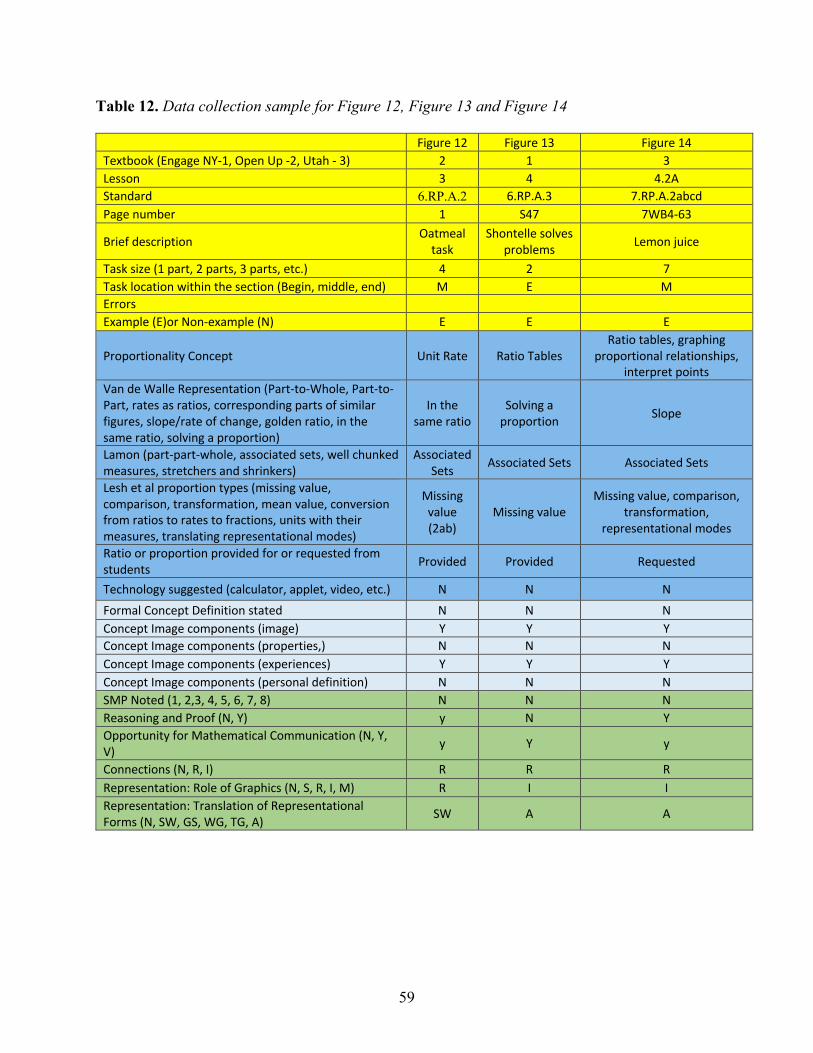
59
Table 12. Data collection sample for Figure 12, Figure 13 and Figure 14
Figure 12 Figure 13 Figure 14 Textbook (Engage NY-1, Open Up -2, Utah - 3) 2 1 3 Lesson 3 4 4.2A Standard 6.RP.A.2 6.RP.A.3 7.RP.A.2abcd Page number 1 S47 7WB4-63
Brief description Oatmeal task
Shontelle solves problems Lemon juice
Task size (1 part, 2 parts, 3 parts, etc.) 4 2 7 Task location within the section (Begin, middle, end) M E M Errors
Example (E)or Non-example (N) E E E
Proportionality Concept Unit Rate Ratio Tables Ratio tables, graphing
proportional relationships, interpret points
Van de Walle Representation (Part-to-Whole, Part-to-Part, rates as ratios, corresponding parts of similar figures, slope/rate of change, golden ratio, in the same ratio, solving a proportion)
In the same ratio
Solving a proportion Slope
Lamon (part-part-whole, associated sets, well chunked measures, stretchers and shrinkers)
Associated Sets Associated Sets Associated Sets
Lesh et al proportion types (missing value, comparison, transformation, mean value, conversion from ratios to rates to fractions, units with their measures, translating representational modes)
Missing value (2ab)
Missing value Missing value, comparison,
transformation, representational modes
Ratio or proportion provided for or requested from students Provided Provided Requested
Technology suggested (calculator, applet, video, etc.) N N N Formal Concept Definition stated N N N Concept Image components (image) Y Y Y Concept Image components (properties,) N N N Concept Image components (experiences) Y Y Y Concept Image components (personal definition) N N N SMP Noted (1, 2,3, 4, 5, 6, 7, 8) N N N Reasoning and Proof (N, Y) y N Y Opportunity for Mathematical Communication (N, Y, V) y Y y
Connections (N, R, I) R R R Representation: Role of Graphics (N, S, R, I, M) R I I Representation: Translation of Representational Forms (N, SW, GS, WG, TG, A) SW A A
60
Data Analysis
Once the data was entered into a Microsoft Excel spreadsheet, the researcher
subsequently imported the Excel file into SPSS software. The software was used to generate
frequencies and measures of central tendencies for each code. This data was used to determine
similarities and differences between the textbooks.
Reliability and validity
The reliability of coding was established through the following procedures. To begin, two
other coders were trained and coded a section of the textbook from each textbook to establish
inter-coder reliability. The coders also read chapter 2 and chapter 3 of this study to understand
the purpose of the coding process. Coders had an opportunity to practice coding and ask
questions, then compare their results to the author and each other. Discussions and comparison
occurred until the authors and coders obtained 90% agreement or higher. Additional coding
categories and the allowance of multiple codes within a framework for a task were adjustments
made to the coding matrix based on the discussions. For example, Figure 14 was coded with
Missing Value, Comparison, Transformation, and Representational modes. Multiple codes
allowed the researcher and coders to identify the varied parts of a task without having to break
the task into multiple questions. Finally, the coders randomly scored 10% of the remaining
sections to examine the validity of the researcher's coding.
Delimitations and Limitations
This study has several delimitations created by the author and limitations. First, the
delimitations of the study include the number of resources and their current usage, resource
61
sustainability, and tools needed for implementation. This study selected three OERs: Engage
NY, Open Up Resources and Utah Middle School Math Project. There are numerous OERs
available on varied platforms for teachers to choose, adapt, or post for their or others' usage. The
researcher limited the scope to these resources based on its availability and current usage by
educators. Each textbook series was adopted previously by multiple districts as their primary
instructional resource. Furthermore, each resource could be implemented with or without student
access to technology. Popular video resource platforms like Khan Academy were omitted based
on their need for online access for each student.
Another factor in the selection process was sustainability. The selection was filtered
based on the previous adoption to buffer against the resources themselves being removed within
the next five years. The nature of open resources makes them susceptible to modification.
Nevertheless, choosing resources that had been previously adopted was an attempt to mediate
this issue. In addition to being utilized by multiple districts, the selected resources were initially
funded by state grants. Utilizing a resource that has been district adopted and state-sanctioned
may incline the publisher to continue to host an OER so that schools can continue to access the
resources.
In addition, this study limited its selection to resources that were full curricula series for
middle grades mathematics. Selecting a series allows for an examination for coherence across the
curriculum. Coherence between and across grade levels supports teachers who are instructing
multiple grade level courses or are communicating with their peers. Utilizing a single publisher
also helps promote continuity as students change grade levels or schools across the district. The
textbook teachers use plays a significant role in what students are exposed to (Stein et al., 2006).
Providing similar resources increases the likelihood of students producing similar results.
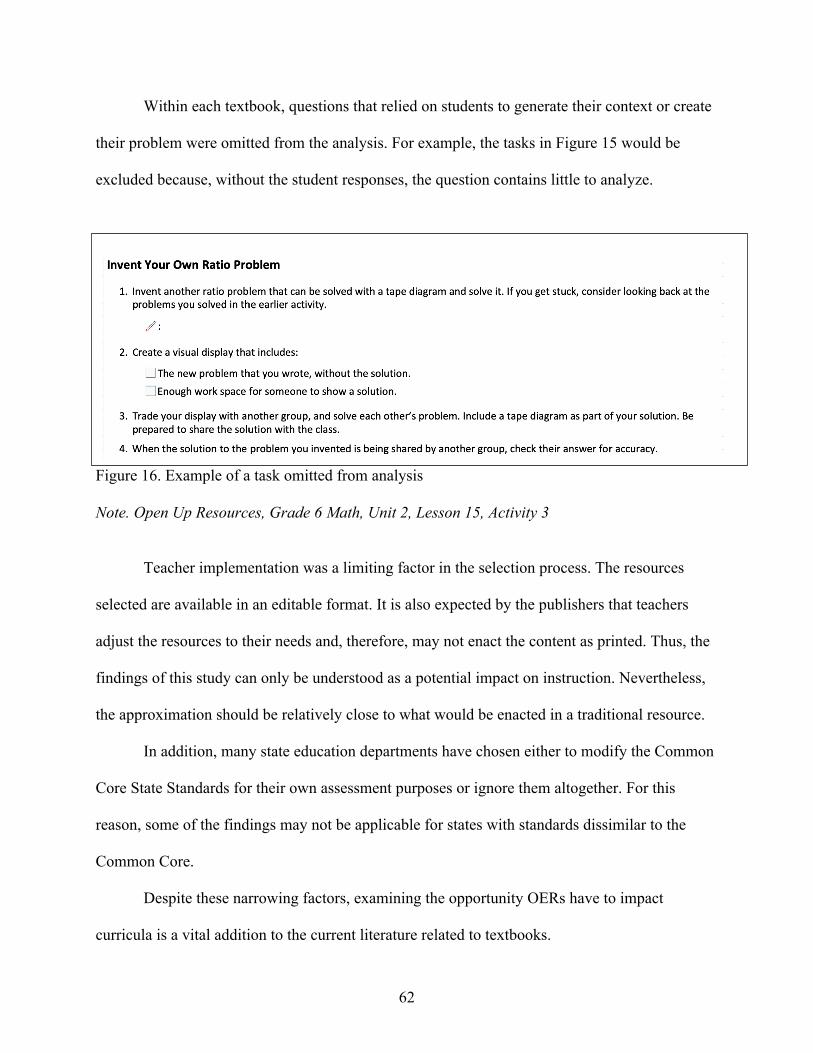
62
Within each textbook, questions that relied on students to generate their context or create
their problem were omitted from the analysis. For example, the tasks in Figure 15 would be
excluded because, without the student responses, the question contains little to analyze.
Figure 16. Example of a task omitted from analysis Note. Open Up Resources, Grade 6 Math, Unit 2, Lesson 15, Activity 3
Teacher implementation was a limiting factor in the selection process. The resources
selected are available in an editable format. It is also expected by the publishers that teachers
adjust the resources to their needs and, therefore, may not enact the content as printed. Thus, the
findings of this study can only be understood as a potential impact on instruction. Nevertheless,
the approximation should be relatively close to what would be enacted in a traditional resource.
In addition, many state education departments have chosen either to modify the Common
Core State Standards for their own assessment purposes or ignore them altogether. For this
reason, some of the findings may not be applicable for states with standards dissimilar to the
Common Core.
Despite these narrowing factors, examining the opportunity OERs have to impact
curricula is a vital addition to the current literature related to textbooks.
63
Conclusion
The author of this study conducted a textbook analysis focused on Ratio and Proportional
Reasoning content within the middle school mathematics OER textbooks published by Engage
NY, Open Up Resources, and the Utah Middle School Math Project. These resources were
chosen because they are key players in the K-12 Education OER market. Each of the resources
contains at least one module, unit, or chapter that contains several lessons related to
proportionality. Each lesson was analyzed from four perspectives: proportionality, concept
image, textbook features, and opportunities to promote student engagement with the SMPs.
The data analysis procedure described within this chapter were designed to explore
similarities and differences between their organizational structures and features as well as the
opportunity their content provides for students to utilize the SMPs. To support validity and
reliability of claims made, the data were analyzed by multiple researchers, and an inter-rater
reliability of at least 90% on each item was documented. The results of the study could provide
insight into how OER textbooks currently attends to ratio and proportional reasoning, and may
impact the nature of what students learn in their middle school mathematics classes.
64
Chapter 4
Findings
This chapter documents the results of the textbook analysis that examined the extent to
which open educational textbooks address ratios and proportional reasoning. These results
answered the following research questions:
1. What are similarities and differences between the organizational structures and
features of online OER textbooks with relation to ratio and proportional reasoning
standards?
3. To what extent do online OER textbooks provide opportunities for students to utilize
the Standards for Mathematical Practice to address ratio and proportional reasoning
standards?
The results are organized by the research question they address. First, the general
characteristics for each textbook are explained. This includes the problem types used in the
textbooks and the extent the tasks required the use of technology. Second, results are presented
to describe similarities and differences between the textbooks in 6th grade, followed by the 7th
grade. This includes characteristics delineated by Van de Walle (2007), Lamon (1993), and Lesh
et al. (1988). It also includes features that would support the development of Tall and Vinner's
(1981) concept image. Finally, results are presented to illustrate similarities and differences
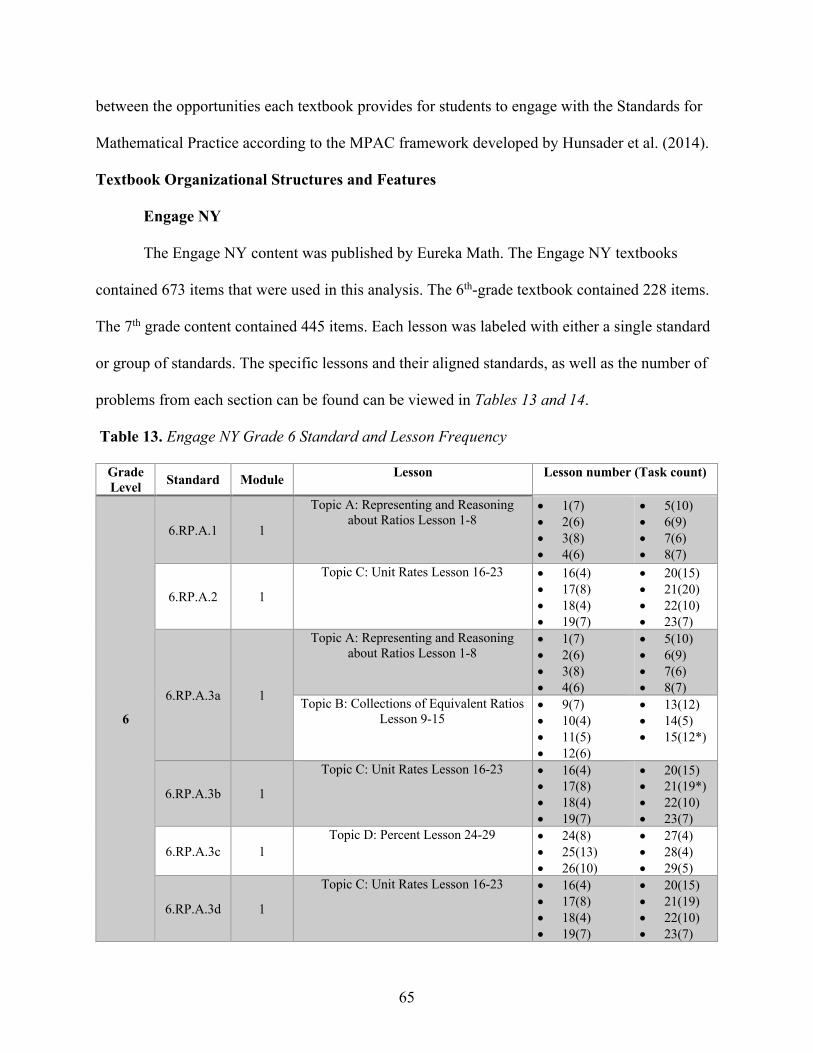
65
between the opportunities each textbook provides for students to engage with the Standards for
Mathematical Practice according to the MPAC framework developed by Hunsader et al. (2014).
Textbook Organizational Structures and Features
Engage NY
The Engage NY content was published by Eureka Math. The Engage NY textbooks
contained 673 items that were used in this analysis. The 6th-grade textbook contained 228 items.
The 7th grade content contained 445 items. Each lesson was labeled with either a single standard
or group of standards. The specific lessons and their aligned standards, as well as the number of
problems from each section can be found can be viewed in Tables 13 and 14.
Table 13. Engage NY Grade 6 Standard and Lesson Frequency
Grade Level Standard Module Lesson Lesson number (Task count)
6
6.RP.A.1 1
Topic A: Representing and Reasoning about Ratios Lesson 1-8
• 1(7) • 2(6) • 3(8) • 4(6)
• 5(10) • 6(9) • 7(6) • 8(7)
6.RP.A.2 1
Topic C: Unit Rates Lesson 16-23 • 16(4) • 17(8) • 18(4) • 19(7)
• 20(15) • 21(20) • 22(10) • 23(7)
6.RP.A.3a 1
Topic A: Representing and Reasoning about Ratios Lesson 1-8
• 1(7) • 2(6) • 3(8) • 4(6)
• 5(10) • 6(9) • 7(6) • 8(7)
Topic B: Collections of Equivalent Ratios Lesson 9-15
• 9(7) • 10(4) • 11(5) • 12(6)
• 13(12) • 14(5) • 15(12*)
6.RP.A.3b 1
Topic C: Unit Rates Lesson 16-23 • 16(4) • 17(8) • 18(4) • 19(7)
• 20(15) • 21(19*) • 22(10) • 23(7)
6.RP.A.3c 1 Topic D: Percent Lesson 24-29 • 24(8)
• 25(13) • 26(10)
• 27(4) • 28(4) • 29(5)
6.RP.A.3d 1
Topic C: Unit Rates Lesson 16-23 • 16(4) • 17(8) • 18(4) • 19(7)
• 20(15) • 21(19) • 22(10) • 23(7)
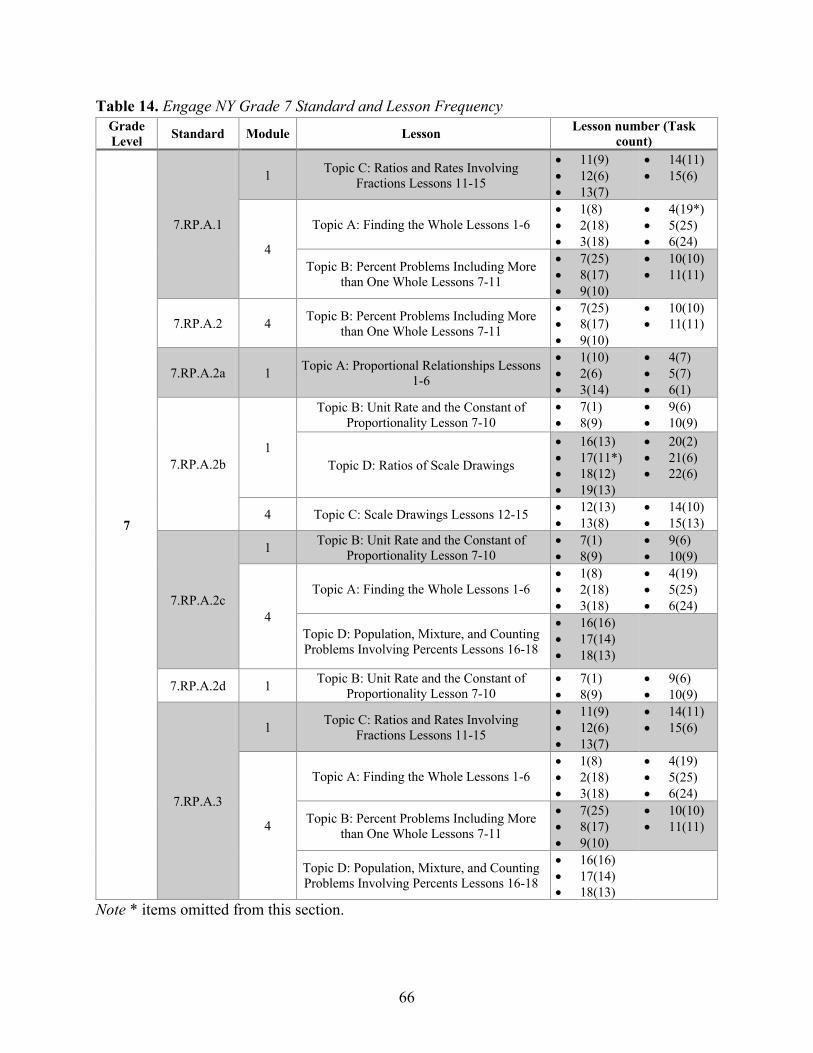
66
Table 14. Engage NY Grade 7 Standard and Lesson Frequency Grade Level Standard Module Lesson Lesson number (Task
count)
7
7.RP.A.1
1 Topic C: Ratios and Rates Involving Fractions Lessons 11-15
• 11(9) • 12(6) • 13(7)
• 14(11) • 15(6)
4
Topic A: Finding the Whole Lessons 1-6 • 1(8) • 2(18) • 3(18)
• 4(19*) • 5(25) • 6(24)
Topic B: Percent Problems Including More than One Whole Lessons 7-11
• 7(25) • 8(17) • 9(10)
• 10(10) • 11(11)
7.RP.A.2 4 Topic B: Percent Problems Including More than One Whole Lessons 7-11
• 7(25) • 8(17) • 9(10)
• 10(10) • 11(11)
7.RP.A.2a 1 Topic A: Proportional Relationships Lessons 1-6
• 1(10) • 2(6) • 3(14)
• 4(7) • 5(7) • 6(1)
7.RP.A.2b 1
Topic B: Unit Rate and the Constant of Proportionality Lesson 7-10
• 7(1) • 8(9)
• 9(6) • 10(9)
Topic D: Ratios of Scale Drawings
• 16(13) • 17(11*) • 18(12) • 19(13)
• 20(2) • 21(6) • 22(6)
4 Topic C: Scale Drawings Lessons 12-15 • 12(13) • 13(8)
• 14(10) • 15(13)
7.RP.A.2c
1 Topic B: Unit Rate and the Constant of Proportionality Lesson 7-10
• 7(1) • 8(9)
• 9(6) • 10(9)
4
Topic A: Finding the Whole Lessons 1-6 • 1(8) • 2(18) • 3(18)
• 4(19) • 5(25) • 6(24)
Topic D: Population, Mixture, and Counting Problems Involving Percents Lessons 16-18
• 16(16) • 17(14) • 18(13)
7.RP.A.2d 1 Topic B: Unit Rate and the Constant of Proportionality Lesson 7-10
• 7(1) • 8(9)
• 9(6) • 10(9)
7.RP.A.3
1 Topic C: Ratios and Rates Involving Fractions Lessons 11-15
• 11(9) • 12(6) • 13(7)
• 14(11) • 15(6)
4
Topic A: Finding the Whole Lessons 1-6 • 1(8) • 2(18) • 3(18)
• 4(19) • 5(25) • 6(24)
Topic B: Percent Problems Including More than One Whole Lessons 7-11
• 7(25) • 8(17) • 9(10)
• 10(10) • 11(11)
Topic D: Population, Mixture, and Counting Problems Involving Percents Lessons 16-18
• 16(16) • 17(14) • 18(13)
Note * items omitted from this section.
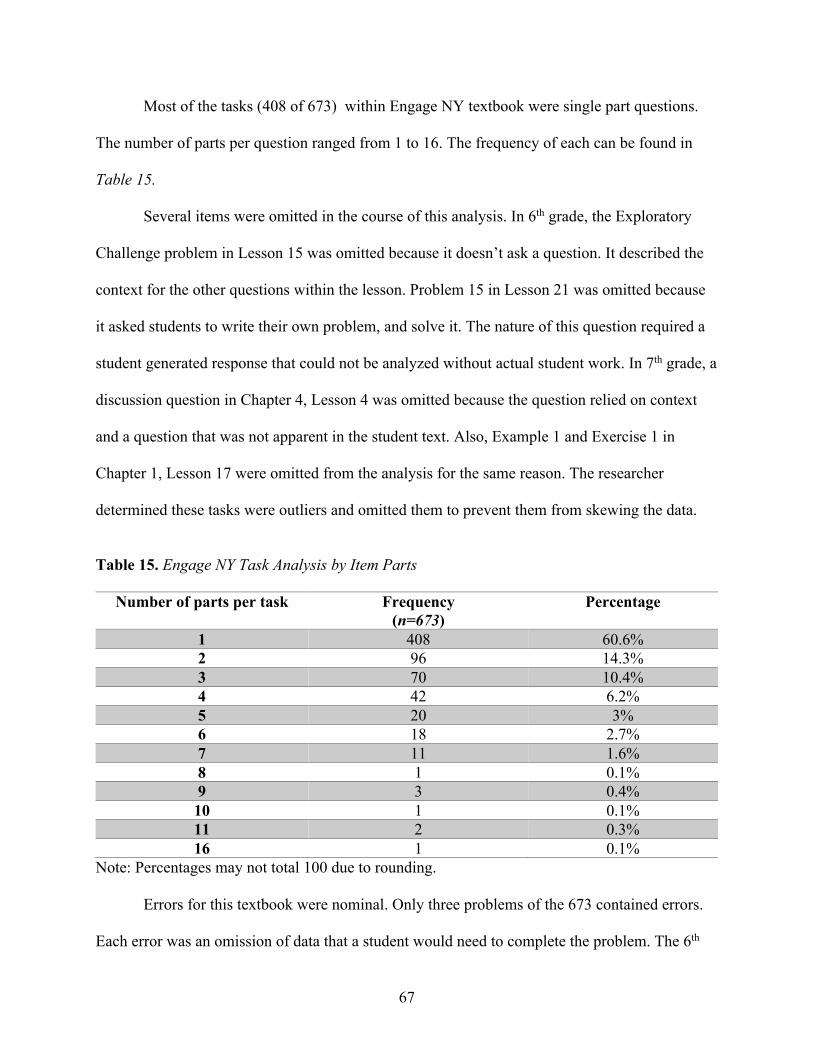
67
Most of the tasks (408 of 673) within Engage NY textbook were single part questions.
The number of parts per question ranged from 1 to 16. The frequency of each can be found in
Table 15.
Several items were omitted in the course of this analysis. In 6th grade, the Exploratory
Challenge problem in Lesson 15 was omitted because it doesn’t ask a question. It described the
context for the other questions within the lesson. Problem 15 in Lesson 21 was omitted because
it asked students to write their own problem, and solve it. The nature of this question required a
student generated response that could not be analyzed without actual student work. In 7th grade, a
discussion question in Chapter 4, Lesson 4 was omitted because the question relied on context
and a question that was not apparent in the student text. Also, Example 1 and Exercise 1 in
Chapter 1, Lesson 17 were omitted from the analysis for the same reason. The researcher
determined these tasks were outliers and omitted them to prevent them from skewing the data.
Table 15. Engage NY Task Analysis by Item Parts
Number of parts per task Frequency (n=673)
Percentage
1 408 60.6% 2 96 14.3% 3 70 10.4% 4 42 6.2% 5 20 3% 6 18 2.7% 7 11 1.6% 8 1 0.1% 9 3 0.4% 10 1 0.1% 11 2 0.3% 16 1 0.1%
Note: Percentages may not total 100 due to rounding.
Errors for this textbook were nominal. Only three problems of the 673 contained errors.
Each error was an omission of data that a student would need to complete the problem. The 6th
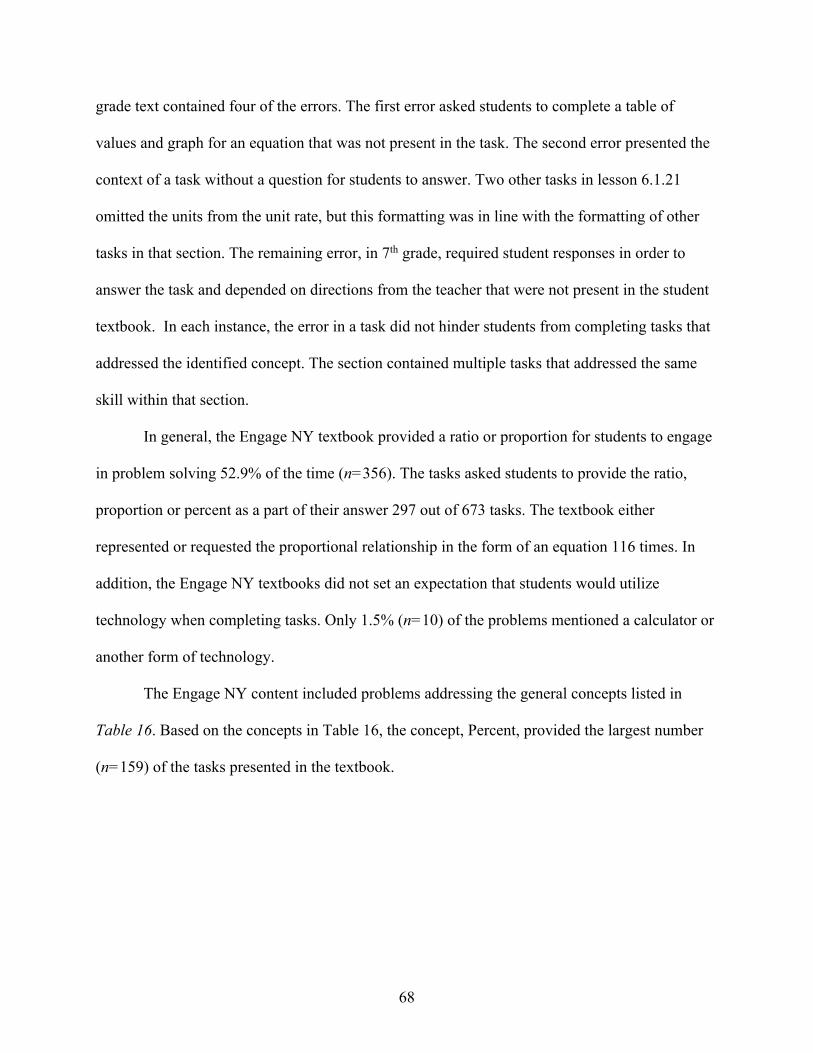
68
grade text contained four of the errors. The first error asked students to complete a table of
values and graph for an equation that was not present in the task. The second error presented the
context of a task without a question for students to answer. Two other tasks in lesson 6.1.21
omitted the units from the unit rate, but this formatting was in line with the formatting of other
tasks in that section. The remaining error, in 7th grade, required student responses in order to
answer the task and depended on directions from the teacher that were not present in the student
textbook. In each instance, the error in a task did not hinder students from completing tasks that
addressed the identified concept. The section contained multiple tasks that addressed the same
skill within that section.
In general, the Engage NY textbook provided a ratio or proportion for students to engage
in problem solving 52.9% of the time (n=356). The tasks asked students to provide the ratio,
proportion or percent as a part of their answer 297 out of 673 tasks. The textbook either
represented or requested the proportional relationship in the form of an equation 116 times. In
addition, the Engage NY textbooks did not set an expectation that students would utilize
technology when completing tasks. Only 1.5% (n=10) of the problems mentioned a calculator or
another form of technology.
The Engage NY content included problems addressing the general concepts listed in
Table 16. Based on the concepts in Table 16, the concept, Percent, provided the largest number
(n=159) of the tasks presented in the textbook.
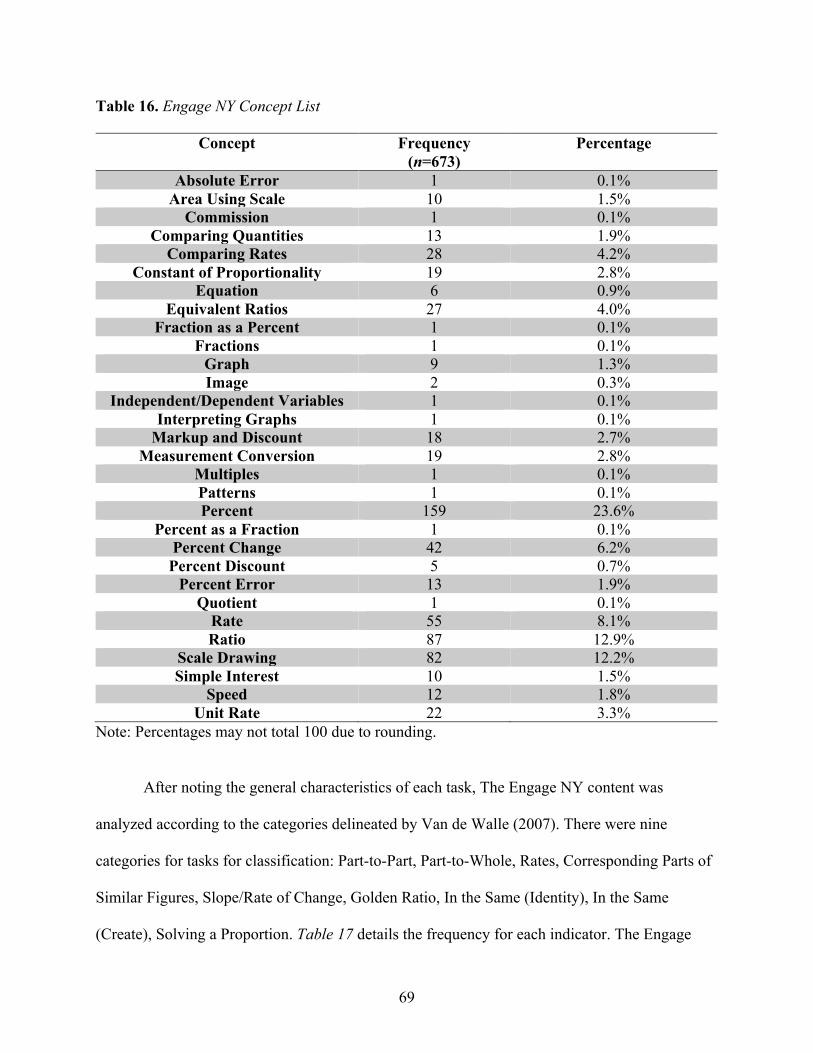
69
Table 16. Engage NY Concept List
Concept Frequency (n=673)
Percentage
Absolute Error 1 0.1% Area Using Scale 10 1.5%
Commission 1 0.1% Comparing Quantities 13 1.9%
Comparing Rates 28 4.2% Constant of Proportionality 19 2.8%
Equation 6 0.9% Equivalent Ratios 27 4.0%
Fraction as a Percent 1 0.1% Fractions 1 0.1%
Graph 9 1.3% Image 2 0.3%
Independent/Dependent Variables 1 0.1% Interpreting Graphs 1 0.1%
Markup and Discount 18 2.7% Measurement Conversion 19 2.8%
Multiples 1 0.1% Patterns 1 0.1% Percent 159 23.6%
Percent as a Fraction 1 0.1% Percent Change 42 6.2% Percent Discount 5 0.7%
Percent Error 13 1.9% Quotient 1 0.1%
Rate 55 8.1% Ratio 87 12.9%
Scale Drawing 82 12.2% Simple Interest 10 1.5%
Speed 12 1.8% Unit Rate 22 3.3%
Note: Percentages may not total 100 due to rounding.
After noting the general characteristics of each task, The Engage NY content was
analyzed according to the categories delineated by Van de Walle (2007). There were nine
categories for tasks for classification: Part-to-Part, Part-to-Whole, Rates, Corresponding Parts of
Similar Figures, Slope/Rate of Change, Golden Ratio, In the Same (Identity), In the Same
(Create), Solving a Proportion. Table 17 details the frequency for each indicator. The Engage
70
NY textbook provided tasks for each of the categories except Golden Ratio. Solving a Proportion
(n=388) consumed 57.7% of the tasks presented in the selected sections of textbook, making it
the largest category . Forty-one tasks were categorized as Slope/Rate of Change (6.1%), making
it the smallest of the categories with presented items. Several tasks were coded in multiple
categories based on the requirements for student responses to answer the task.
Table 17. Engage NY Item Analysis using Van de Walle (2007) Categories
Van de Walle Category Number of Examples (n=673) Percent of Examples
Part-to-Part 288 42.8% Part-to-Whole 192 28.5%
Rates 192 28.5% Corresponding Parts of Similar Figures 103 15.3%
Slope/Rate of Change 41 6.1% Golden Ratio 0 0%
In the Same (Identity) 82 12.2% In the Same (Create) 65 9.7% Solving a Proportion 388 57.7%
Note: Percentages may not total 100 due to rounding.
Second, the tasks were examined based on Lamon (2012) categories for proportionality.
Lamon (2012) discusses the following four categories: Part-Part-Whole, Associated Sets, Well-
Chunked Measures, and Stretchers and Shrinkers. The Engage NY content provided multiple
examples for each of the indicators. Specific frequencies and percentages can be located in Table
18. Part-Part-Whole representations (n=244) occurred in 36.3% of the 673 tasks in the 6th and 7th
grade textbooks. This follows the pattern of representations since Part-to-Part (42.8%)
representations occurred in 288 tasks and Part-to-Whole (28.5%) representations occurred in 192
of the 673 tasks. Stretchers and Shrinkers (n=101) and Associated Sets (n=115) occupied 15%
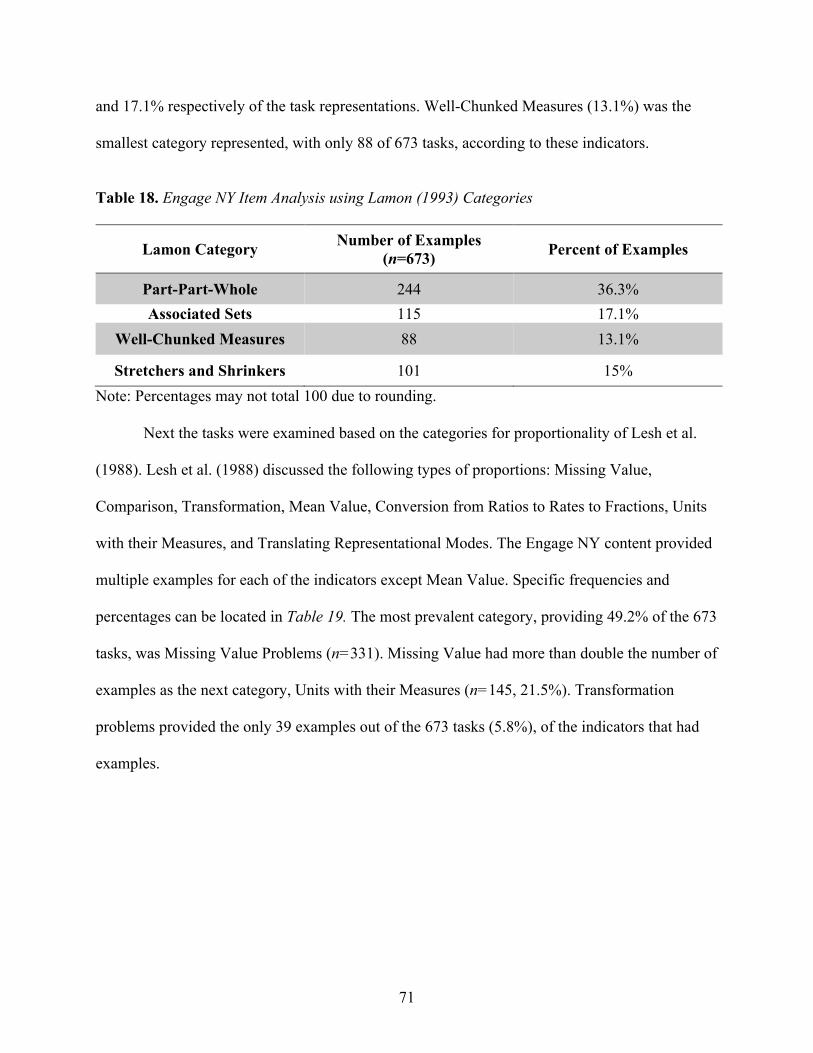
71
and 17.1% respectively of the task representations. Well-Chunked Measures (13.1%) was the
smallest category represented, with only 88 of 673 tasks, according to these indicators.
Table 18. Engage NY Item Analysis using Lamon (1993) Categories
Lamon Category Number of Examples (n=673) Percent of Examples
Part-Part-Whole 244 36.3% Associated Sets 115 17.1%
Well-Chunked Measures 88 13.1%
Stretchers and Shrinkers 101 15% Note: Percentages may not total 100 due to rounding.
Next the tasks were examined based on the categories for proportionality of Lesh et al.
(1988). Lesh et al. (1988) discussed the following types of proportions: Missing Value,
Comparison, Transformation, Mean Value, Conversion from Ratios to Rates to Fractions, Units
with their Measures, and Translating Representational Modes. The Engage NY content provided
multiple examples for each of the indicators except Mean Value. Specific frequencies and
percentages can be located in Table 19. The most prevalent category, providing 49.2% of the 673
tasks, was Missing Value Problems (n=331). Missing Value had more than double the number of
examples as the next category, Units with their Measures (n=145, 21.5%). Transformation
problems provided the only 39 examples out of the 673 tasks (5.8%), of the indicators that had
examples.
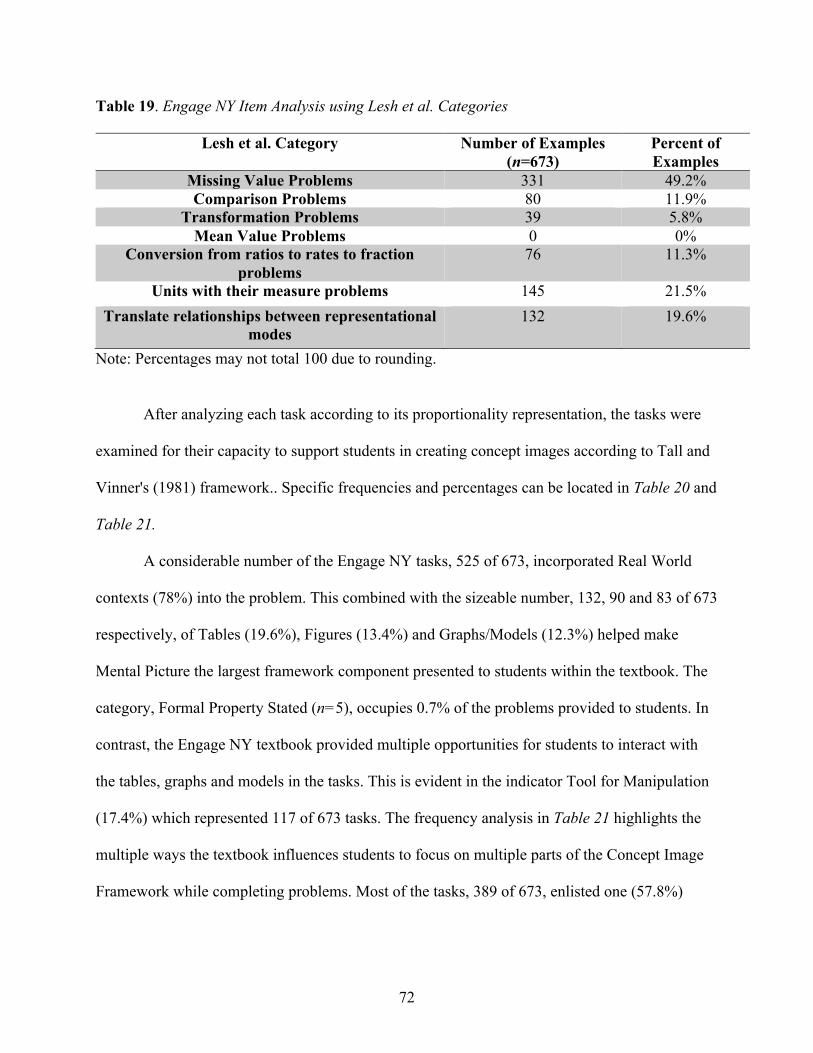
72
Table 19. Engage NY Item Analysis using Lesh et al. Categories
Lesh et al. Category Number of Examples (n=673)
Percent of Examples
Missing Value Problems 331 49.2% Comparison Problems 80 11.9%
Transformation Problems 39 5.8% Mean Value Problems 0 0%
Conversion from ratios to rates to fraction problems
76 11.3%
Units with their measure problems 145 21.5% Translate relationships between representational
modes 132 19.6%
Note: Percentages may not total 100 due to rounding.
After analyzing each task according to its proportionality representation, the tasks were
examined for their capacity to support students in creating concept images according to Tall and
Vinner's (1981) framework.. Specific frequencies and percentages can be located in Table 20 and
Table 21.
A considerable number of the Engage NY tasks, 525 of 673, incorporated Real World
contexts (78%) into the problem. This combined with the sizeable number, 132, 90 and 83 of 673
respectively, of Tables (19.6%), Figures (13.4%) and Graphs/Models (12.3%) helped make
Mental Picture the largest framework component presented to students within the textbook. The
category, Formal Property Stated (n=5), occupies 0.7% of the problems provided to students. In
contrast, the Engage NY textbook provided multiple opportunities for students to interact with
the tables, graphs and models in the tasks. This is evident in the indicator Tool for Manipulation
(17.4%) which represented 117 of 673 tasks. The frequency analysis in Table 21 highlights the
multiple ways the textbook influences students to focus on multiple parts of the Concept Image
Framework while completing problems. Most of the tasks, 389 of 673, enlisted one (57.8%)
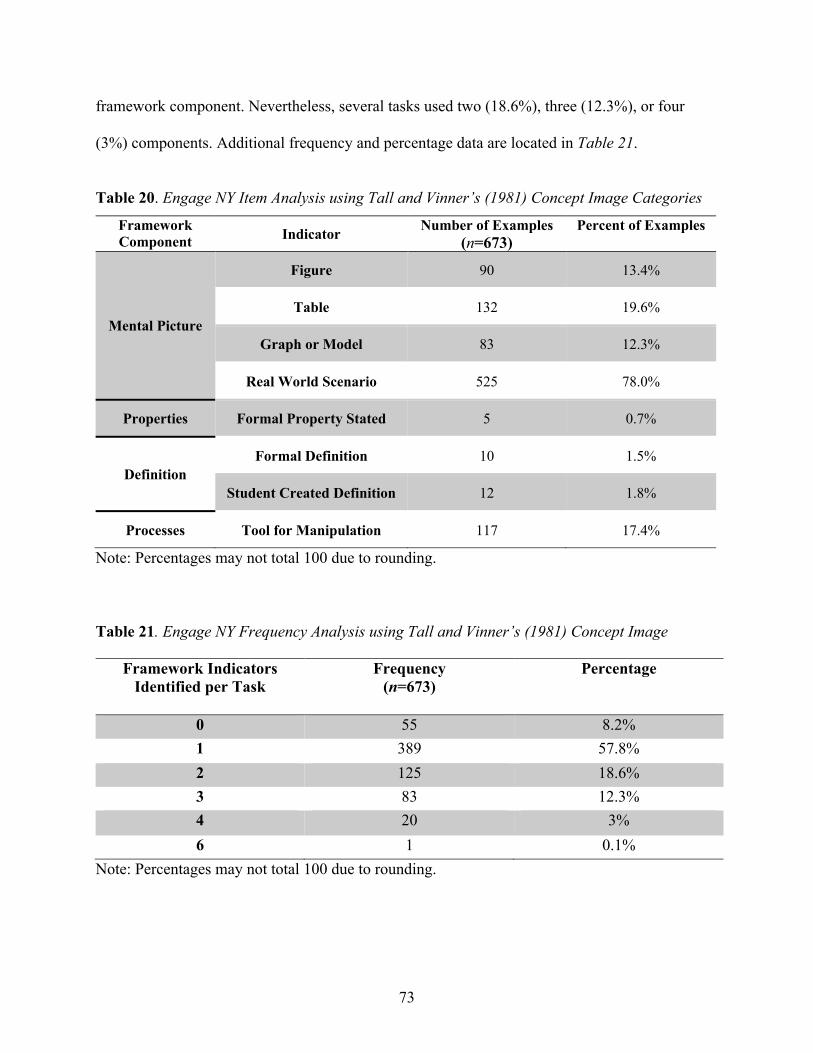
73
framework component. Nevertheless, several tasks used two (18.6%), three (12.3%), or four
(3%) components. Additional frequency and percentage data are located in Table 21.
Table 20. Engage NY Item Analysis using Tall and Vinner’s (1981) Concept Image Categories
Framework Component Indicator Number of Examples
(n=673) Percent of Examples
Mental Picture
Figure 90 13.4%
Table 132 19.6%
Graph or Model 83 12.3%
Real World Scenario 525 78.0%
Properties Formal Property Stated 5 0.7%
Definition Formal Definition 10 1.5%
Student Created Definition 12 1.8%
Processes Tool for Manipulation 117 17.4%
Note: Percentages may not total 100 due to rounding.
Table 21. Engage NY Frequency Analysis using Tall and Vinner’s (1981) Concept Image
Framework Indicators Identified per Task
Frequency (n=673)
Percentage
0 55 8.2% 1 389 57.8% 2 125 18.6% 3 83 12.3% 4 20 3% 6 1 0.1%
Note: Percentages may not total 100 due to rounding.
74
The final indicators relate to the second research question addressing the Standards for
Mathematical Practice. The Engage NY textbook does not identify specific problems or sections
that focus on the SMPs. Evidence to support students enacting the SMPs was obtained from the
MPAC Framework developed by Hunsader et al. (2014). Table 11 identifies the specifics for
each indicator in the Framework. Table 22 lists the frequencies for each indicator obtained from
the Engage NY content.
First, The Engage NY textbook contained 43 opportunities for students to provide
justification for their answers. This is noted in the Reasoning and Proof section of Table 22.
Second, students were provided with 233 opportunities to explain their answer and 68
opportunities to record or provide an example of mathematical vocabulary term. Thirdly, Real
world problems (78.5%) were the dominant representations presented to students, 528 of 673.
This provides ample opportunities for students to make mental connections. In contrast, 373 of
673 problems did not contain graphics (55.4%). Of the remaining problems that did provide
graphics, 20.2% asked students to interpret the graphic (n=136) and 25.3 % asked students to
make or add to a graphic (n=170). The last category, Translation of Representational Forms
identifies the changes between the forms students must process or produce to answer tasks. The
most frequently used categories, providing 64.8% and 29.4% of the 673 tasks respectively, were
Verbal to Symbolic (n=436) and Verbal to Graphical (n=198). Translations from one graphical
representation to another graphical representation (10.8%) occurred only in 73 of 673 tasks.
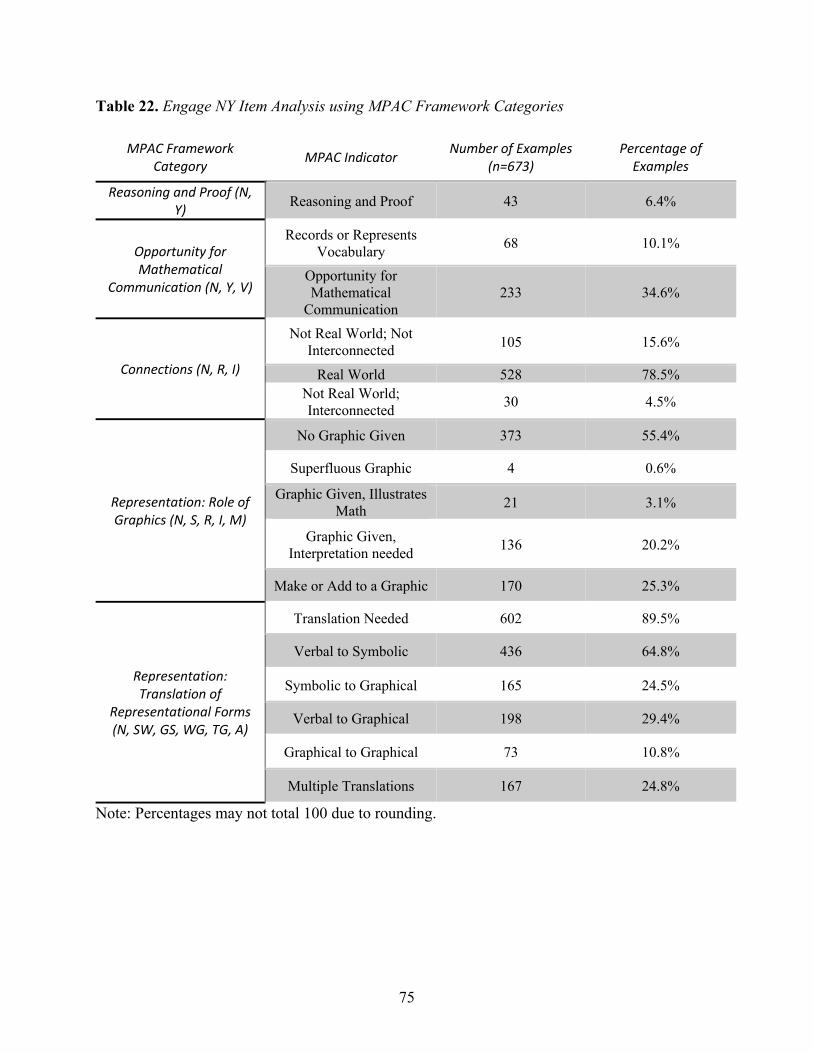
75
Table 22. Engage NY Item Analysis using MPAC Framework Categories
MPAC Framework Category MPAC Indicator Number of Examples
(n=673) Percentage of
Examples
Reasoning and Proof (N, Y) Reasoning and Proof 43 6.4%
Opportunity for Mathematical
Communication (N, Y, V)
Records or Represents Vocabulary 68 10.1%
Opportunity for Mathematical
Communication 233 34.6%
Connections (N, R, I)
Not Real World; Not Interconnected 105 15.6%
Real World 528 78.5% Not Real World; Interconnected 30 4.5%
Representation: Role of Graphics (N, S, R, I, M)
No Graphic Given 373 55.4%
Superfluous Graphic 4 0.6%
Graphic Given, Illustrates Math 21 3.1%
Graphic Given, Interpretation needed 136 20.2%
Make or Add to a Graphic 170 25.3%
Representation: Translation of
Representational Forms (N, SW, GS, WG, TG, A)
Translation Needed 602 89.5%
Verbal to Symbolic 436 64.8%
Symbolic to Graphical 165 24.5%
Verbal to Graphical 198 29.4%
Graphical to Graphical 73 10.8%
Multiple Translations 167 24.8%
Note: Percentages may not total 100 due to rounding.
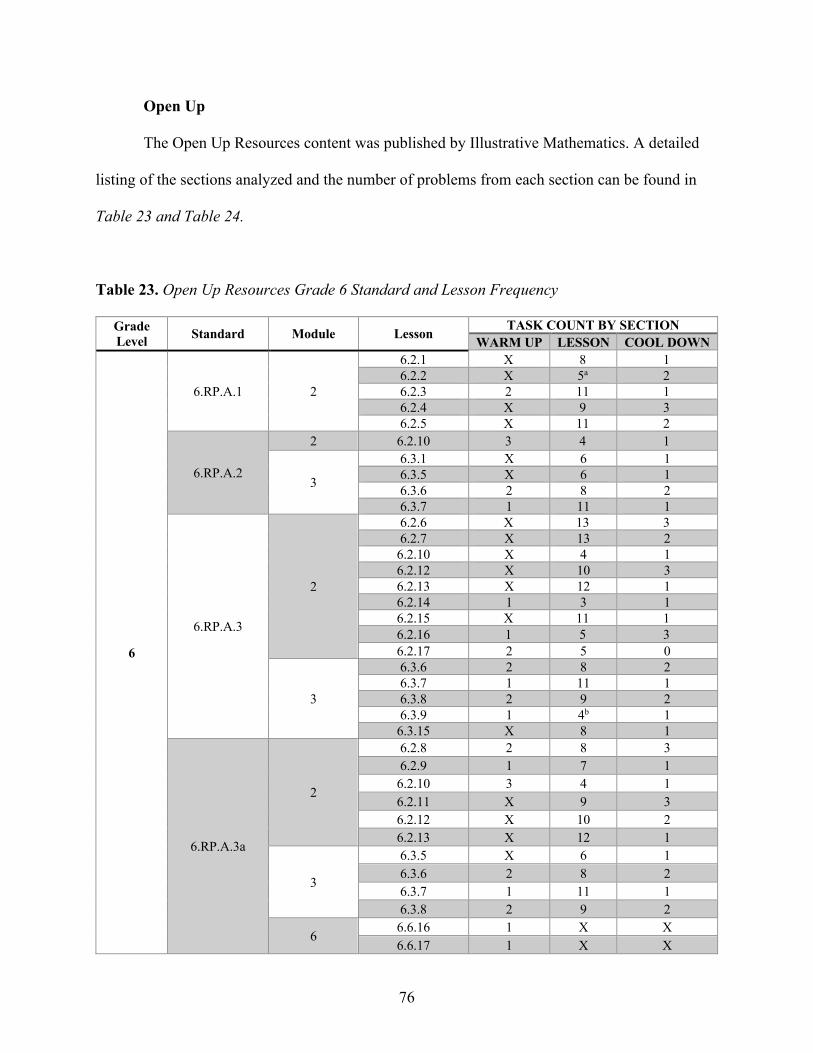
76
Open Up
The Open Up Resources content was published by Illustrative Mathematics. A detailed
listing of the sections analyzed and the number of problems from each section can be found in
Table 23 and Table 24.
Table 23. Open Up Resources Grade 6 Standard and Lesson Frequency
Grade Level Standard Module Lesson TASK COUNT BY SECTION
WARM UP LESSON COOL DOWN
6
6.RP.A.1 2
6.2.1 X 8 1 6.2.2 X 5a 2 6.2.3 2 11 1 6.2.4 X 9 3 6.2.5 X 11 2
6.RP.A.2
2 6.2.10 3 4 1
3
6.3.1 X 6 1 6.3.5 X 6 1 6.3.6 2 8 2 6.3.7 1 11 1
6.RP.A.3
2
6.2.6 X 13 3 6.2.7 X 13 2 6.2.10 X 4 1 6.2.12 X 10 3 6.2.13 X 12 1 6.2.14 1 3 1 6.2.15 X 11 1 6.2.16 1 5 3 6.2.17 2 5 0
3
6.3.6 2 8 2 6.3.7 1 11 1 6.3.8 2 9 2 6.3.9 1 4b 1 6.3.15 X 8 1
6.RP.A.3a
2
6.2.8 2 8 3 6.2.9 1 7 1 6.2.10 3 4 1 6.2.11 X 9 3 6.2.12 X 10 2 6.2.13 X 12 1
3
6.3.5 X 6 1 6.3.6 2 8 2 6.3.7 1 11 1 6.3.8 2 9 2
6 6.6.16 1 X X 6.6.17 1 X X
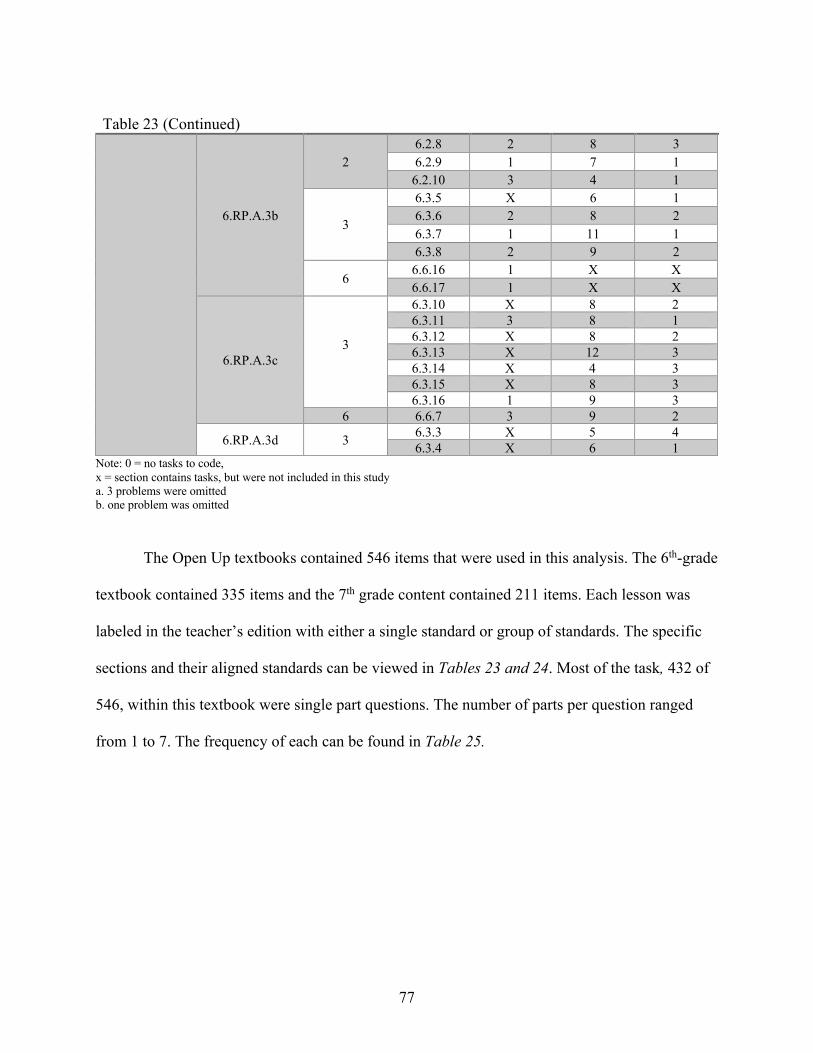
77
Table 23 (Continued)
6.RP.A.3b
2 6.2.8 2 8 3 6.2.9 1 7 1 6.2.10 3 4 1
3
6.3.5 X 6 1 6.3.6 2 8 2 6.3.7 1 11 1 6.3.8 2 9 2
6 6.6.16 1 X X 6.6.17 1 X X
6.RP.A.3c 3
6.3.10 X 8 2 6.3.11 3 8 1 6.3.12 X 8 2 6.3.13 X 12 3 6.3.14 X 4 3 6.3.15 X 8 3 6.3.16 1 9 3
6 6.6.7 3 9 2
6.RP.A.3d 3 6.3.3 X 5 4 6.3.4 X 6 1
Note: 0 = no tasks to code, x = section contains tasks, but were not included in this study a. 3 problems were omitted b. one problem was omitted
The Open Up textbooks contained 546 items that were used in this analysis. The 6th-grade
textbook contained 335 items and the 7th grade content contained 211 items. Each lesson was
labeled in the teacher’s edition with either a single standard or group of standards. The specific
sections and their aligned standards can be viewed in Tables 23 and 24. Most of the task, 432 of
546, within this textbook were single part questions. The number of parts per question ranged
from 1 to 7. The frequency of each can be found in Table 25.
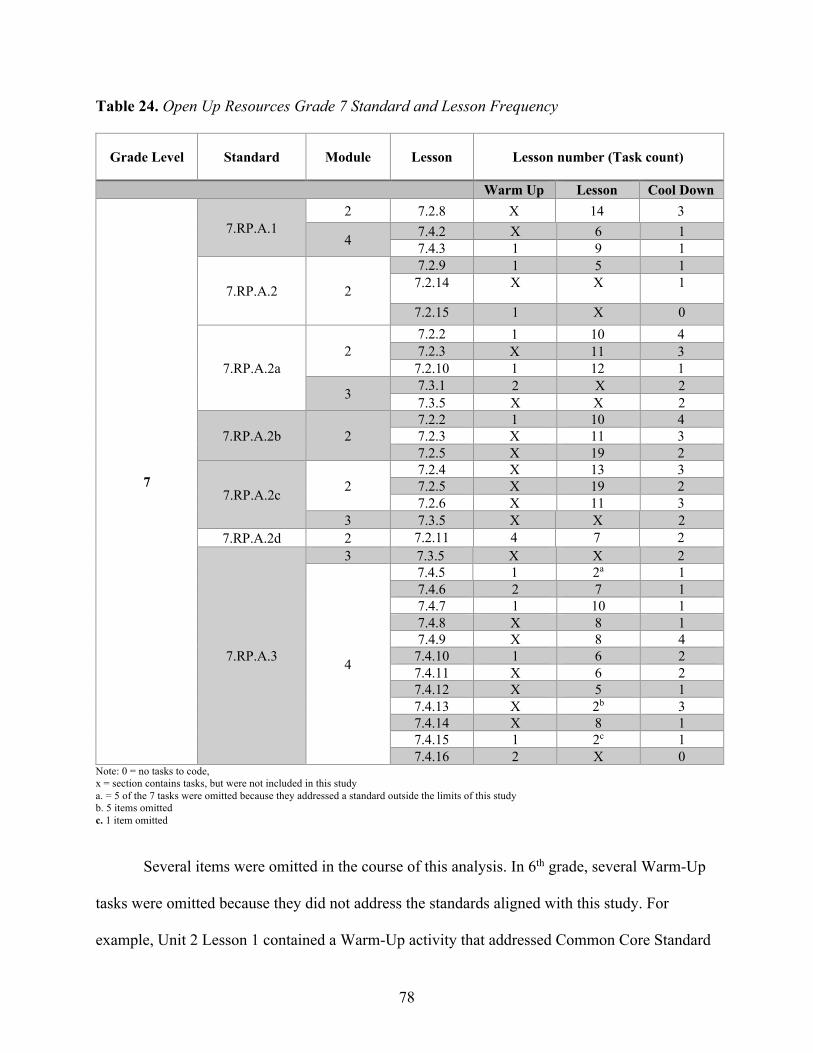
78
Table 24. Open Up Resources Grade 7 Standard and Lesson Frequency
Grade Level Standard Module Lesson Lesson number (Task count)
Warm Up Lesson Cool Down
7
7.RP.A.1 2 7.2.8 X 14 3
4 7.4.2 X 6 1 7.4.3 1 9 1
7.RP.A.2 2
7.2.9 1 5 1 7.2.14 X X 1
7.2.15 1 X 0
7.RP.A.2a 2
7.2.2 1 10 4 7.2.3 X 11 3 7.2.10 1 12 1
3 7.3.1 2 X 2 7.3.5 X X 2
7.RP.A.2b 2 7.2.2 1 10 4 7.2.3 X 11 3 7.2.5 X 19 2
7.RP.A.2c 2 7.2.4 X 13 3 7.2.5 X 19 2 7.2.6 X 11 3
3 7.3.5 X X 2 7.RP.A.2d 2 7.2.11 4 7 2
7.RP.A.3
3 7.3.5 X X 2
4
7.4.5 1 2a 1 7.4.6 2 7 1 7.4.7 1 10 1 7.4.8 X 8 1 7.4.9 X 8 4 7.4.10 1 6 2 7.4.11 X 6 2 7.4.12 X 5 1 7.4.13 X 2b 3 7.4.14 X 8 1 7.4.15 1 2c 1 7.4.16 2 X 0
Note: 0 = no tasks to code, x = section contains tasks, but were not included in this study a. = 5 of the 7 tasks were omitted because they addressed a standard outside the limits of this study b. 5 items omitted c. 1 item omitted
Several items were omitted in the course of this analysis. In 6th grade, several Warm-Up
tasks were omitted because they did not address the standards aligned with this study. For
example, Unit 2 Lesson 1 contained a Warm-Up activity that addressed Common Core Standard
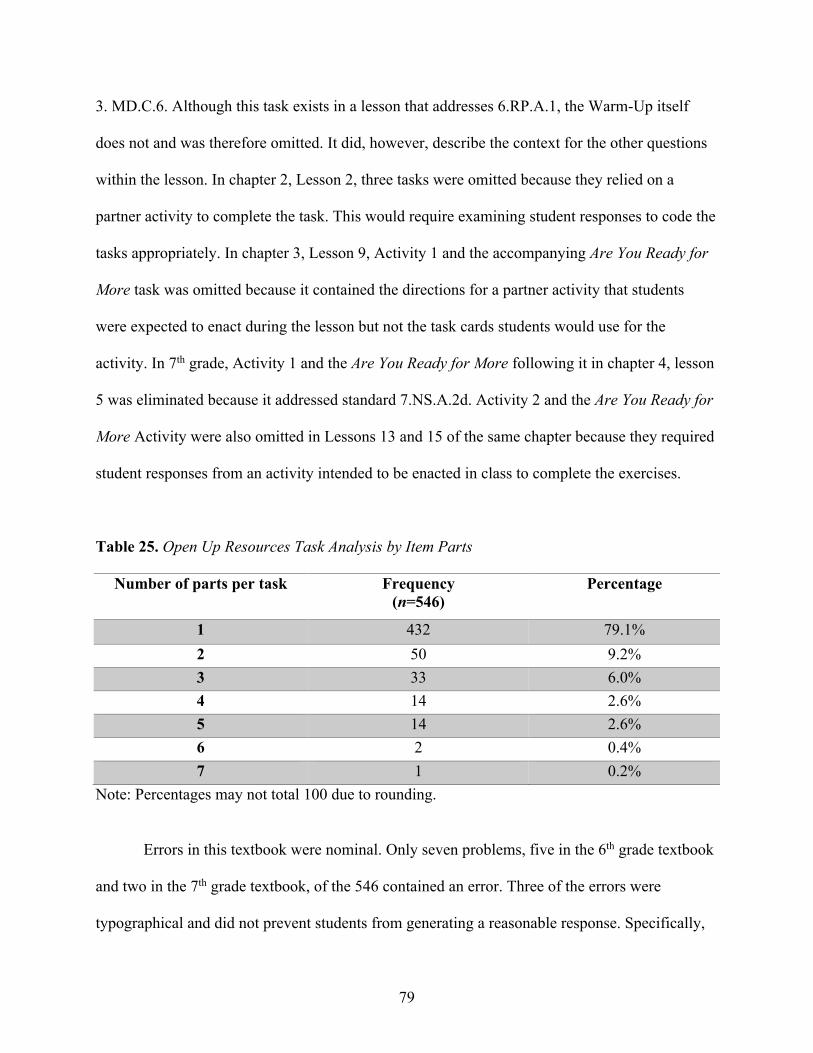
79
3. MD.C.6. Although this task exists in a lesson that addresses 6.RP.A.1, the Warm-Up itself
does not and was therefore omitted. It did, however, describe the context for the other questions
within the lesson. In chapter 2, Lesson 2, three tasks were omitted because they relied on a
partner activity to complete the task. This would require examining student responses to code the
tasks appropriately. In chapter 3, Lesson 9, Activity 1 and the accompanying Are You Ready for
More task was omitted because it contained the directions for a partner activity that students
were expected to enact during the lesson but not the task cards students would use for the
activity. In 7th grade, Activity 1 and the Are You Ready for More following it in chapter 4, lesson
5 was eliminated because it addressed standard 7.NS.A.2d. Activity 2 and the Are You Ready for
More Activity were also omitted in Lessons 13 and 15 of the same chapter because they required
student responses from an activity intended to be enacted in class to complete the exercises.
Table 25. Open Up Resources Task Analysis by Item Parts
Number of parts per task Frequency (n=546)
Percentage
1 432 79.1% 2 50 9.2% 3 33 6.0% 4 14 2.6% 5 14 2.6% 6 2 0.4% 7 1 0.2%
Note: Percentages may not total 100 due to rounding.
Errors in this textbook were nominal. Only seven problems, five in the 6th grade textbook
and two in the 7th grade textbook, of the 546 contained an error. Three of the errors were
typographical and did not prevent students from generating a reasonable response. Specifically,
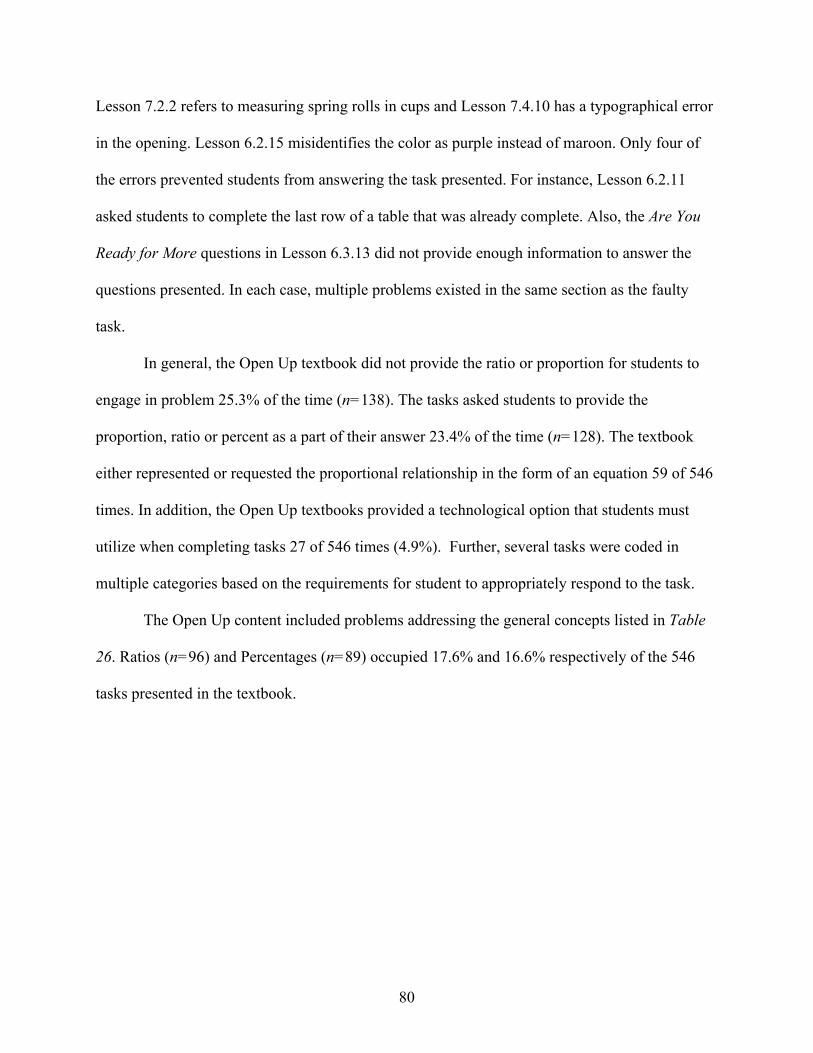
80
Lesson 7.2.2 refers to measuring spring rolls in cups and Lesson 7.4.10 has a typographical error
in the opening. Lesson 6.2.15 misidentifies the color as purple instead of maroon. Only four of
the errors prevented students from answering the task presented. For instance, Lesson 6.2.11
asked students to complete the last row of a table that was already complete. Also, the Are You
Ready for More questions in Lesson 6.3.13 did not provide enough information to answer the
questions presented. In each case, multiple problems existed in the same section as the faulty
task.
In general, the Open Up textbook did not provide the ratio or proportion for students to
engage in problem 25.3% of the time (n=138). The tasks asked students to provide the
proportion, ratio or percent as a part of their answer 23.4% of the time (n=128). The textbook
either represented or requested the proportional relationship in the form of an equation 59 of 546
times. In addition, the Open Up textbooks provided a technological option that students must
utilize when completing tasks 27 of 546 times (4.9%). Further, several tasks were coded in
multiple categories based on the requirements for student to appropriately respond to the task.
The Open Up content included problems addressing the general concepts listed in Table
26. Ratios (n=96) and Percentages (n=89) occupied 17.6% and 16.6% respectively of the 546
tasks presented in the textbook.
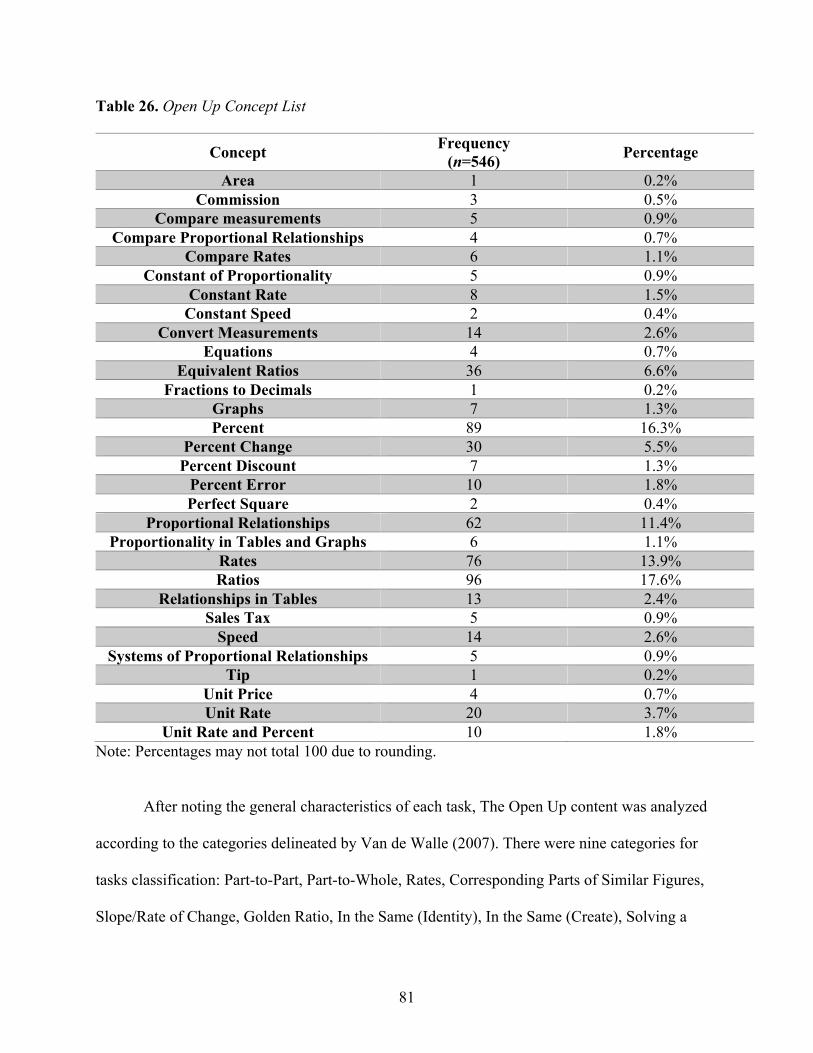
81
Table 26. Open Up Concept List
Concept Frequency (n=546) Percentage
Area 1 0.2% Commission 3 0.5%
Compare measurements 5 0.9% Compare Proportional Relationships 4 0.7%
Compare Rates 6 1.1% Constant of Proportionality 5 0.9%
Constant Rate 8 1.5% Constant Speed 2 0.4%
Convert Measurements 14 2.6% Equations 4 0.7%
Equivalent Ratios 36 6.6% Fractions to Decimals 1 0.2%
Graphs 7 1.3% Percent 89 16.3%
Percent Change 30 5.5% Percent Discount 7 1.3%
Percent Error 10 1.8% Perfect Square 2 0.4%
Proportional Relationships 62 11.4% Proportionality in Tables and Graphs 6 1.1%
Rates 76 13.9% Ratios 96 17.6%
Relationships in Tables 13 2.4% Sales Tax 5 0.9%
Speed 14 2.6% Systems of Proportional Relationships 5 0.9%
Tip 1 0.2% Unit Price 4 0.7% Unit Rate 20 3.7%
Unit Rate and Percent 10 1.8% Note: Percentages may not total 100 due to rounding. After noting the general characteristics of each task, The Open Up content was analyzed
according to the categories delineated by Van de Walle (2007). There were nine categories for
tasks classification: Part-to-Part, Part-to-Whole, Rates, Corresponding Parts of Similar Figures,
Slope/Rate of Change, Golden Ratio, In the Same (Identity), In the Same (Create), Solving a
82
Proportion. Table 27 details the frequency for each indicator. The Open Up textbook provided
tasks for each of the categories except Corresponding Parts of Similar Figures and Golden Ratio.
Rates (n=306) was the largest category presented, 56%, in the textbook. Slope/Rate of Change
(6.2%) was the smallest of the categories with items presented with 34 of 546 tasks.
Table 27. Open Up Item Analysis using Van de Walle (2007) Categories
Van de Walle Category Number of Examples (n=546)
Percent of Examples
Part-to-Part 88 16.1% Part-to-Whole 109 20%
Rates 306 56%
Corresponding Parts of Similar Figures 0 0%
Slope/Rate of Change 34 6.2% Golden Ratio 0 0%
In the Same (Identity) 80 14.7% In the Same (Create) 98 17.9% Solving a Proportion 262 48%
Note: Percentages may not total 100 due to rounding.
Next, the tasks were examined based on Lamon (2012) categories for proportionality.
Lamon (2012) discussed the following four categories: Part-Part-Whole, Associated Sets, Well-
Chunked Measures, and Stretchers and Shrinkers. The Open Up content provided multiple
examples for each of the indicators except Stretchers and Shrinkers. Specific frequencies and
percentages can be located in Table 28. Associated Sets representations (n=191) occurred in
35% of the tasks in the textbook. Part-Part-Whole (n=144) also occupied a sizable share, 26.4%,
of the problem task representations. While Well-Chunked Measures (n=114) had the smallest
percentage, 20.9%, of the categories with indicated tasks.
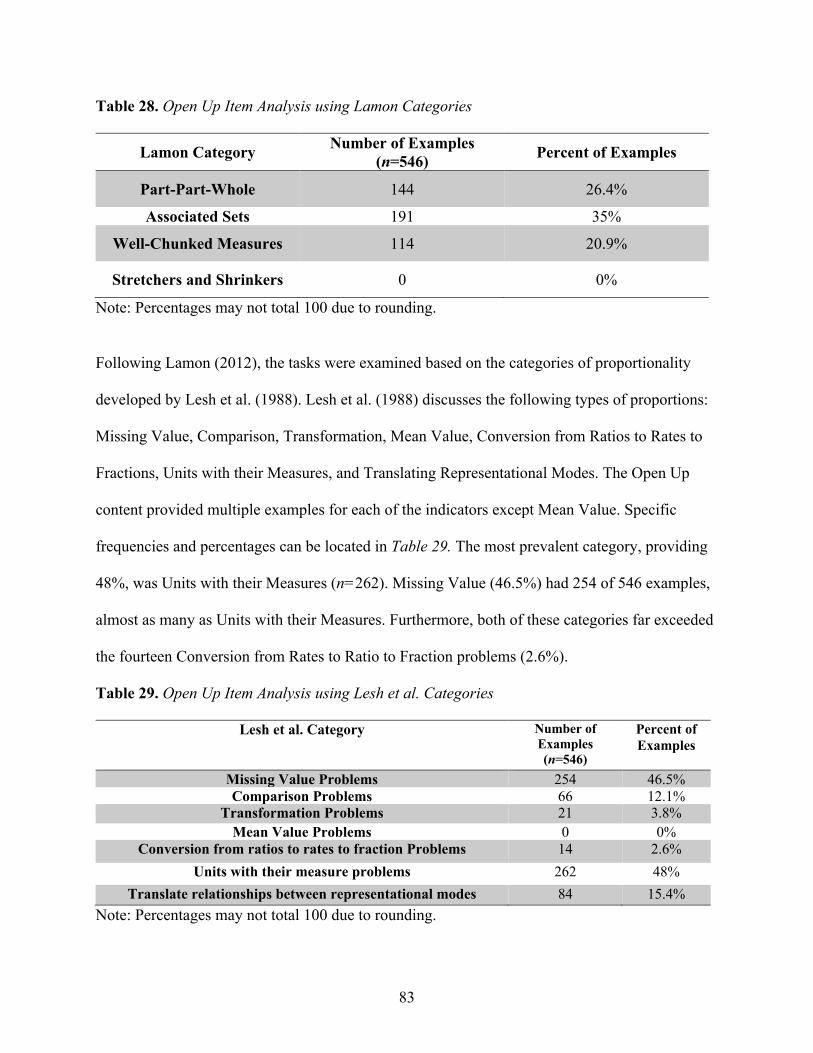
83
Table 28. Open Up Item Analysis using Lamon Categories
Lamon Category Number of Examples (n=546) Percent of Examples
Part-Part-Whole 144 26.4%
Associated Sets 191 35%
Well-Chunked Measures 114 20.9%
Stretchers and Shrinkers 0 0%
Note: Percentages may not total 100 due to rounding.
Following Lamon (2012), the tasks were examined based on the categories of proportionality
developed by Lesh et al. (1988). Lesh et al. (1988) discusses the following types of proportions:
Missing Value, Comparison, Transformation, Mean Value, Conversion from Ratios to Rates to
Fractions, Units with their Measures, and Translating Representational Modes. The Open Up
content provided multiple examples for each of the indicators except Mean Value. Specific
frequencies and percentages can be located in Table 29. The most prevalent category, providing
48%, was Units with their Measures (n=262). Missing Value (46.5%) had 254 of 546 examples,
almost as many as Units with their Measures. Furthermore, both of these categories far exceeded
the fourteen Conversion from Rates to Ratio to Fraction problems (2.6%).
Table 29. Open Up Item Analysis using Lesh et al. Categories
Lesh et al. Category Number of Examples (n=546)
Percent of Examples
Missing Value Problems 254 46.5% Comparison Problems 66 12.1%
Transformation Problems 21 3.8% Mean Value Problems 0 0%
Conversion from ratios to rates to fraction Problems 14 2.6% Units with their measure problems 262 48%
Translate relationships between representational modes 84 15.4% Note: Percentages may not total 100 due to rounding.
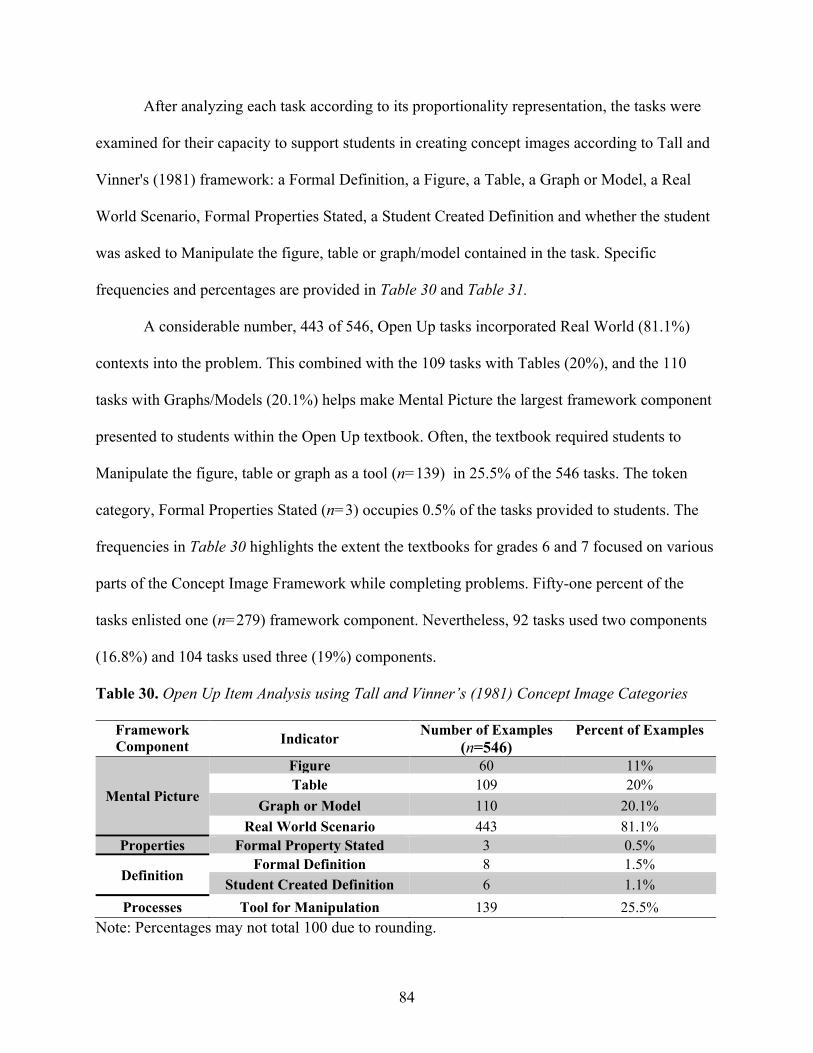
84
After analyzing each task according to its proportionality representation, the tasks were
examined for their capacity to support students in creating concept images according to Tall and
Vinner's (1981) framework: a Formal Definition, a Figure, a Table, a Graph or Model, a Real
World Scenario, Formal Properties Stated, a Student Created Definition and whether the student
was asked to Manipulate the figure, table or graph/model contained in the task. Specific
frequencies and percentages are provided in Table 30 and Table 31.
A considerable number, 443 of 546, Open Up tasks incorporated Real World (81.1%)
contexts into the problem. This combined with the 109 tasks with Tables (20%), and the 110
tasks with Graphs/Models (20.1%) helps make Mental Picture the largest framework component
presented to students within the Open Up textbook. Often, the textbook required students to
Manipulate the figure, table or graph as a tool (n=139) in 25.5% of the 546 tasks. The token
category, Formal Properties Stated (n=3) occupies 0.5% of the tasks provided to students. The
frequencies in Table 30 highlights the extent the textbooks for grades 6 and 7 focused on various
parts of the Concept Image Framework while completing problems. Fifty-one percent of the
tasks enlisted one (n=279) framework component. Nevertheless, 92 tasks used two components
(16.8%) and 104 tasks used three (19%) components.
Table 30. Open Up Item Analysis using Tall and Vinner’s (1981) Concept Image Categories
Framework Component Indicator Number of Examples
(n=546) Percent of Examples
Mental Picture
Figure 60 11% Table 109 20%
Graph or Model 110 20.1% Real World Scenario 443 81.1%
Properties Formal Property Stated 3 0.5%
Definition Formal Definition 8 1.5%
Student Created Definition 6 1.1% Processes Tool for Manipulation 139 25.5%
Note: Percentages may not total 100 due to rounding.
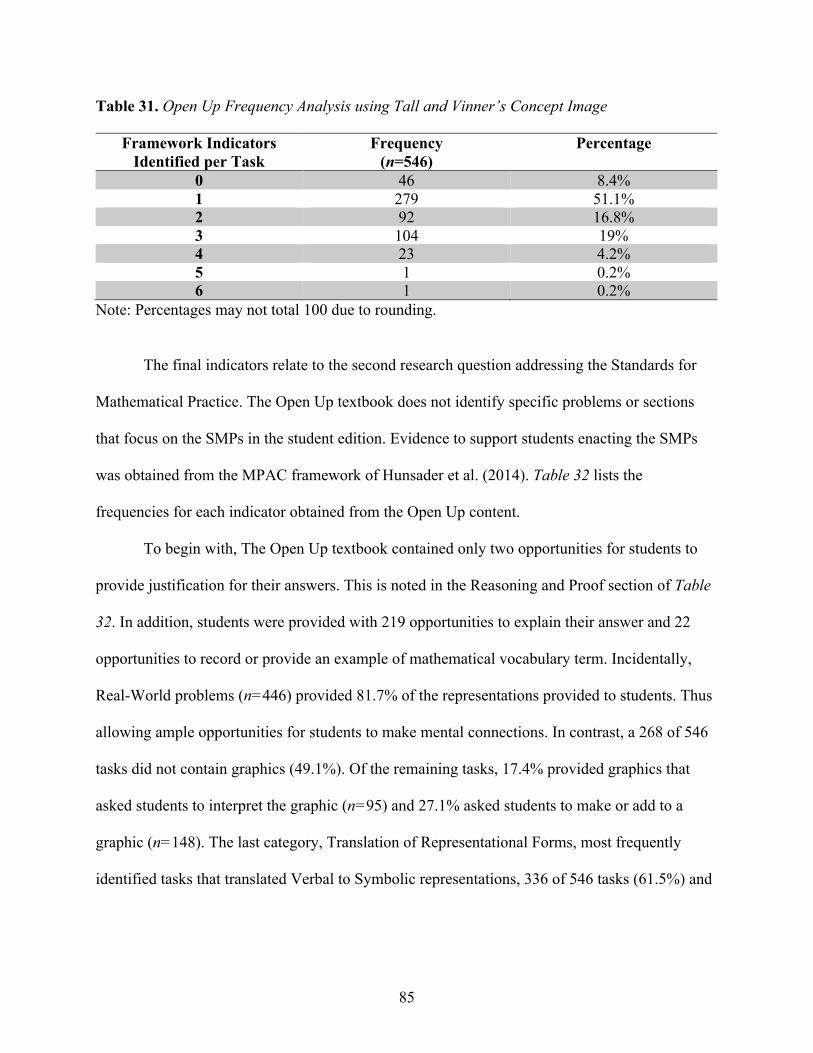
85
Table 31. Open Up Frequency Analysis using Tall and Vinner’s Concept Image
Framework Indicators Identified per Task
Frequency (n=546)
Percentage
0 46 8.4% 1 279 51.1% 2 92 16.8% 3 104 19% 4 23 4.2% 5 1 0.2% 6 1 0.2%
Note: Percentages may not total 100 due to rounding.
The final indicators relate to the second research question addressing the Standards for
Mathematical Practice. The Open Up textbook does not identify specific problems or sections
that focus on the SMPs in the student edition. Evidence to support students enacting the SMPs
was obtained from the MPAC framework of Hunsader et al. (2014). Table 32 lists the
frequencies for each indicator obtained from the Open Up content.
To begin with, The Open Up textbook contained only two opportunities for students to
provide justification for their answers. This is noted in the Reasoning and Proof section of Table
32. In addition, students were provided with 219 opportunities to explain their answer and 22
opportunities to record or provide an example of mathematical vocabulary term. Incidentally,
Real-World problems (n=446) provided 81.7% of the representations provided to students. Thus
allowing ample opportunities for students to make mental connections. In contrast, a 268 of 546
tasks did not contain graphics (49.1%). Of the remaining tasks, 17.4% provided graphics that
asked students to interpret the graphic (n=95) and 27.1% asked students to make or add to a
graphic (n=148). The last category, Translation of Representational Forms, most frequently
identified tasks that translated Verbal to Symbolic representations, 336 of 546 tasks (61.5%) and
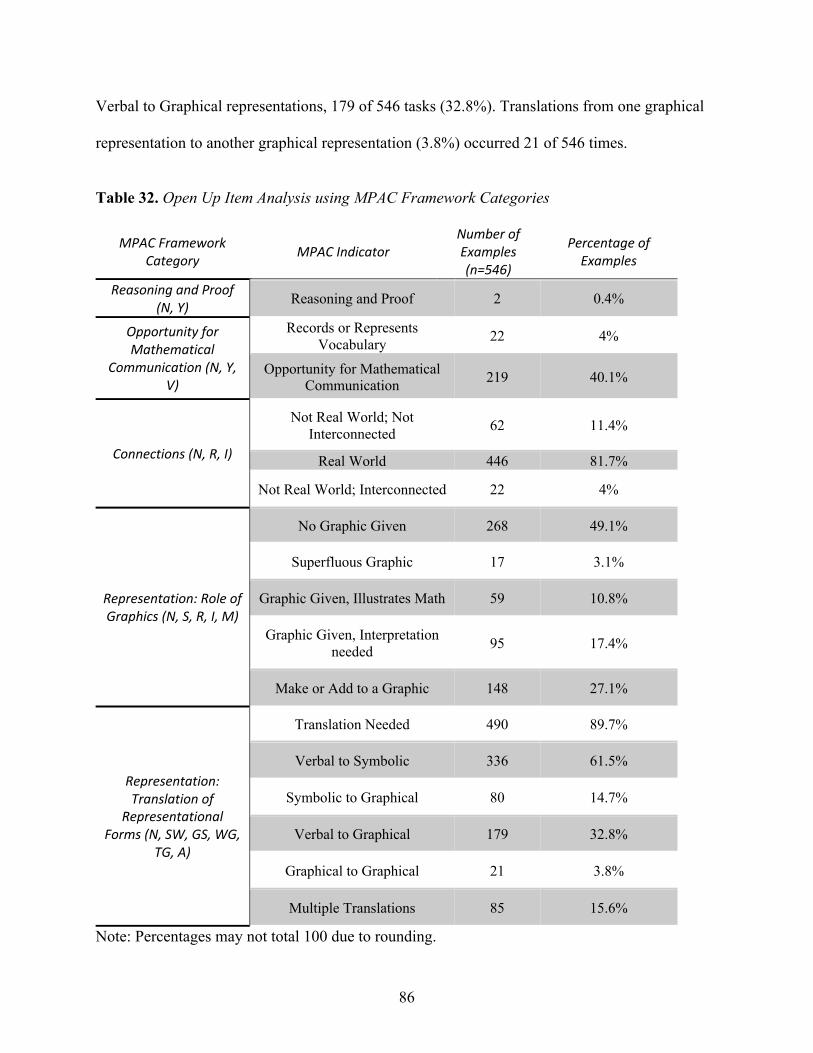
86
Verbal to Graphical representations, 179 of 546 tasks (32.8%). Translations from one graphical
representation to another graphical representation (3.8%) occurred 21 of 546 times.
Table 32. Open Up Item Analysis using MPAC Framework Categories
MPAC Framework Category MPAC Indicator
Number of Examples (n=546)
Percentage of Examples
Reasoning and Proof (N, Y) Reasoning and Proof 2 0.4%
Opportunity for Mathematical
Communication (N, Y, V)
Records or Represents Vocabulary 22 4%
Opportunity for Mathematical Communication 219 40.1%
Connections (N, R, I)
Not Real World; Not Interconnected 62 11.4%
Real World 446 81.7%
Not Real World; Interconnected 22 4%
Representation: Role of Graphics (N, S, R, I, M)
No Graphic Given 268 49.1%
Superfluous Graphic 17 3.1%
Graphic Given, Illustrates Math 59 10.8%
Graphic Given, Interpretation needed 95 17.4%
Make or Add to a Graphic 148 27.1%
Representation: Translation of
Representational Forms (N, SW, GS, WG,
TG, A)
Translation Needed 490 89.7%
Verbal to Symbolic 336 61.5%
Symbolic to Graphical 80 14.7%
Verbal to Graphical 179 32.8%
Graphical to Graphical 21 3.8%
Multiple Translations 85 15.6%
Note: Percentages may not total 100 due to rounding.
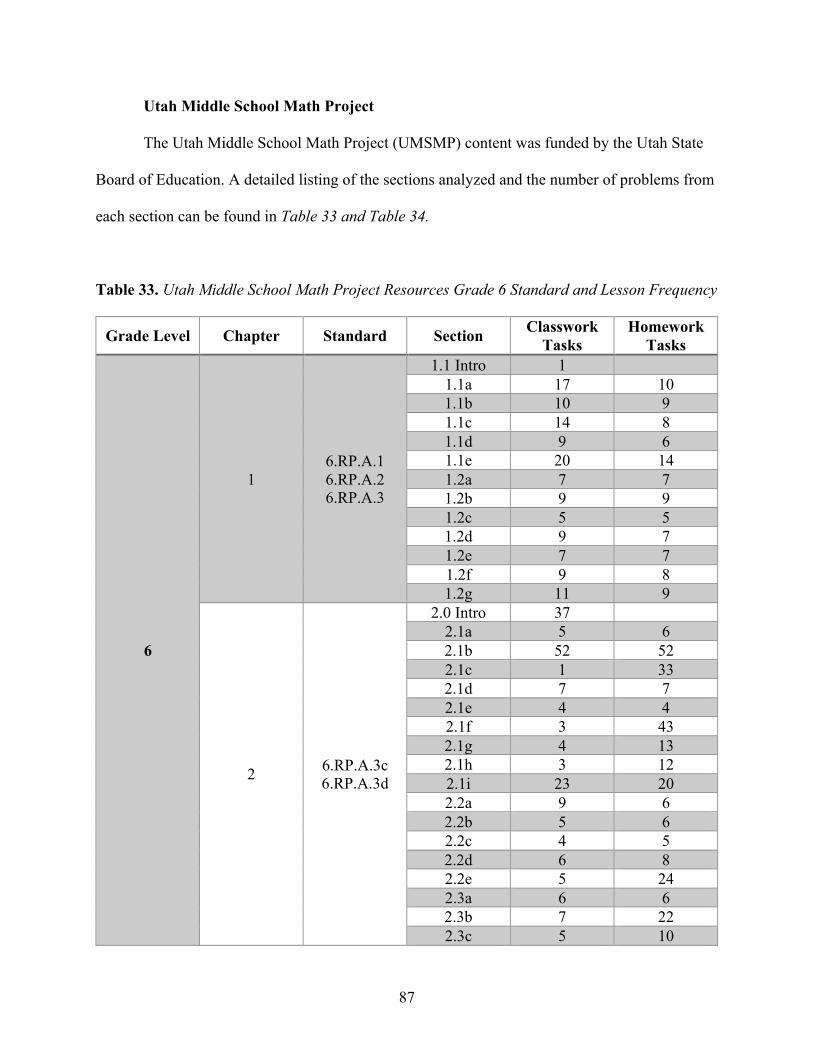
87
Utah Middle School Math Project
The Utah Middle School Math Project (UMSMP) content was funded by the Utah State
Board of Education. A detailed listing of the sections analyzed and the number of problems from
each section can be found in Table 33 and Table 34.
Table 33. Utah Middle School Math Project Resources Grade 6 Standard and Lesson Frequency
Grade Level Chapter Standard Section Classwork Tasks
Homework Tasks
6
1 6.RP.A.1 6.RP.A.2 6.RP.A.3
1.1 Intro 1 1.1a 17 10 1.1b 10 9 1.1c 14 8 1.1d 9 6 1.1e 20 14 1.2a 7 7 1.2b 9 9 1.2c 5 5 1.2d 9 7 1.2e 7 7 1.2f 9 8 1.2g 11 9
2 6.RP.A.3c 6.RP.A.3d
2.0 Intro 37 2.1a 5 6 2.1b 52 52 2.1c 1 33 2.1d 7 7 2.1e 4 4 2.1f 3 43 2.1g 4 13 2.1h 3 12 2.1i 23 20 2.2a 9 6 2.2b 5 6 2.2c 4 5 2.2d 6 8 2.2e 5 24 2.3a 6 6 2.3b 7 22 2.3c 5 10
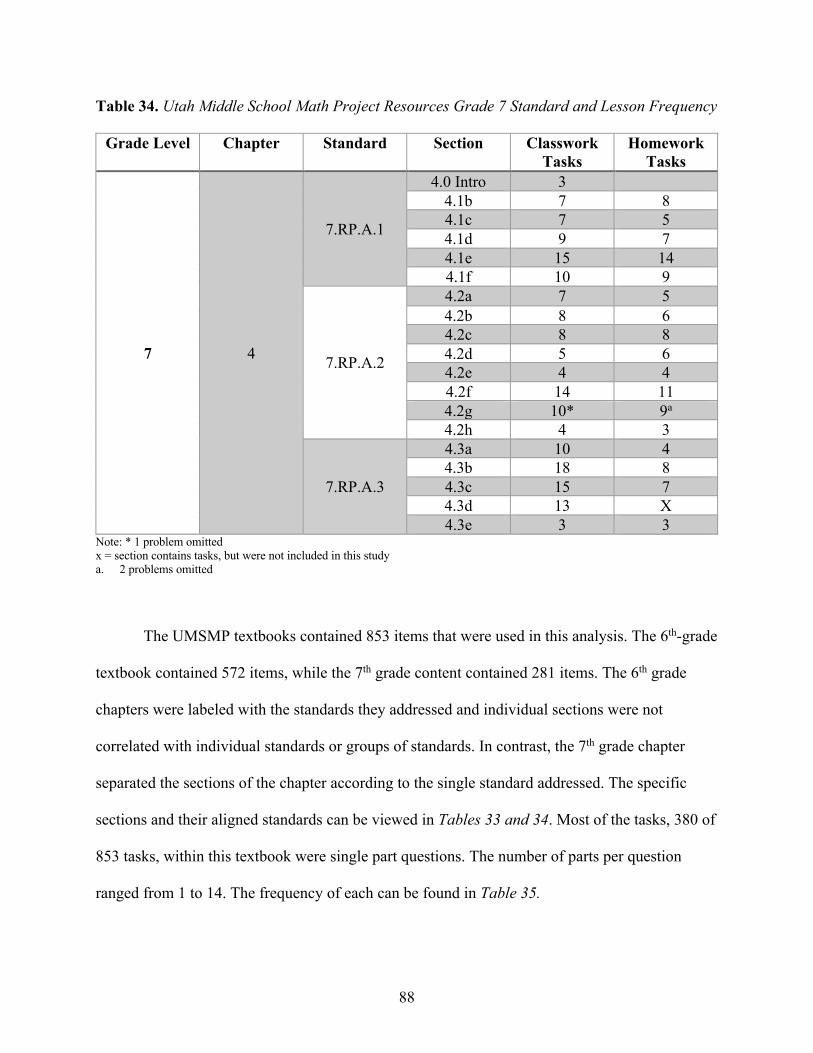
88
Table 34. Utah Middle School Math Project Resources Grade 7 Standard and Lesson Frequency
Grade Level Chapter Standard Section Classwork Tasks
Homework Tasks
7 4
7.RP.A.1
4.0 Intro 3 4.1b 7 8 4.1c 7 5 4.1d 9 7 4.1e 15 14 4.1f 10 9
7.RP.A.2
4.2a 7 5 4.2b 8 6 4.2c 8 8 4.2d 5 6 4.2e 4 4 4.2f 14 11 4.2g 10* 9a
4.2h 4 3
7.RP.A.3
4.3a 10 4 4.3b 18 8 4.3c 15 7 4.3d 13 X 4.3e 3 3
Note: * 1 problem omitted x = section contains tasks, but were not included in this study a. 2 problems omitted
The UMSMP textbooks contained 853 items that were used in this analysis. The 6th-grade
textbook contained 572 items, while the 7th grade content contained 281 items. The 6th grade
chapters were labeled with the standards they addressed and individual sections were not
correlated with individual standards or groups of standards. In contrast, the 7th grade chapter
separated the sections of the chapter according to the single standard addressed. The specific
sections and their aligned standards can be viewed in Tables 33 and 34. Most of the tasks, 380 of
853 tasks, within this textbook were single part questions. The number of parts per question
ranged from 1 to 14. The frequency of each can be found in Table 35.
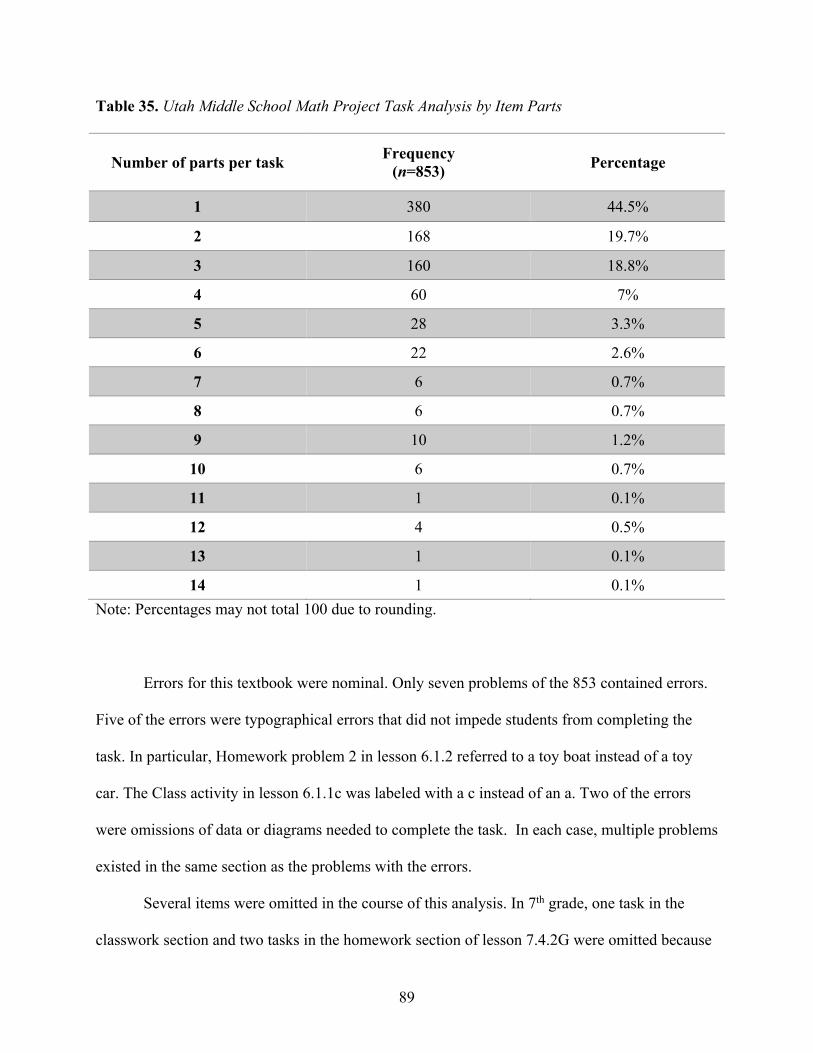
89
Table 35. Utah Middle School Math Project Task Analysis by Item Parts
Number of parts per task Frequency (n=853) Percentage
1 380 44.5%
2 168 19.7%
3 160 18.8%
4 60 7%
5 28 3.3%
6 22 2.6%
7 6 0.7%
8 6 0.7%
9 10 1.2%
10 6 0.7%
11 1 0.1%
12 4 0.5%
13 1 0.1%
14 1 0.1% Note: Percentages may not total 100 due to rounding.
Errors for this textbook were nominal. Only seven problems of the 853 contained errors.
Five of the errors were typographical errors that did not impede students from completing the
task. In particular, Homework problem 2 in lesson 6.1.2 referred to a toy boat instead of a toy
car. The Class activity in lesson 6.1.1c was labeled with a c instead of an a. Two of the errors
were omissions of data or diagrams needed to complete the task. In each case, multiple problems
existed in the same section as the problems with the errors.
Several items were omitted in the course of this analysis. In 7th grade, one task in the
classwork section and two tasks in the homework section of lesson 7.4.2G were omitted because
90
they provided a blank table, graph and coordinate grid for students to create their own
proportional relationship. The homework portion of lesson 4.3d was omitted because it required
students to brainstorm and create their own percentage problem and compare their constructions
with others in the class.
In general, the UMSMP textbook provided the ratio or proportion for students to engage
in problem solving 243 times (28.5%). The tasks asked students to provide the proportion, ratio
or percent as a part of their answer 273 out of 853 times. The textbook either represented or
requested the proportional relationship in the form of an equation 146 of 853 times. In addition,
the UMSMP textbooks did not set an expectation that students would utilize technology when
completing tasks. Only 2.5% (n=21) of the problems mentioned a calculator or other form of
technology.
The UMSMP content included tasks addressing the general concepts listed in Table 36.
Unit Rate (n=112) occupied the 13.1% of the 853 tasks presented in the textbooks. When
examining these textbooks, it is important to understand that many of the tasks have multiple
parts. A concept that is listed as having one question may have multiple parts that would require
students to effectively answer multiple questions on that concept. For this reason, several tasks
were coded in multiple categories based on the requirements for student responses to answer the
task.
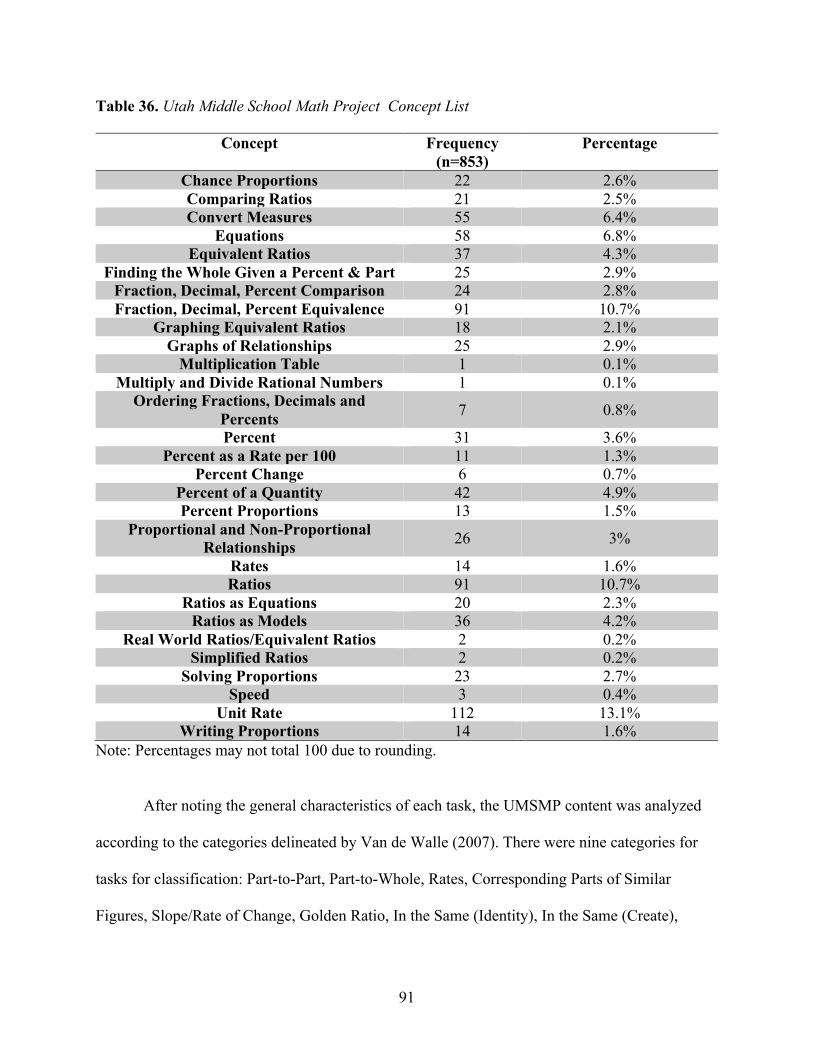
91
Table 36. Utah Middle School Math Project Concept List
Concept Frequency (n=853)
Percentage
Chance Proportions 22 2.6% Comparing Ratios 21 2.5% Convert Measures 55 6.4%
Equations 58 6.8% Equivalent Ratios 37 4.3%
Finding the Whole Given a Percent & Part 25 2.9% Fraction, Decimal, Percent Comparison 24 2.8% Fraction, Decimal, Percent Equivalence 91 10.7%
Graphing Equivalent Ratios 18 2.1% Graphs of Relationships 25 2.9%
Multiplication Table 1 0.1% Multiply and Divide Rational Numbers 1 0.1%
Ordering Fractions, Decimals and Percents 7 0.8%
Percent 31 3.6% Percent as a Rate per 100 11 1.3%
Percent Change 6 0.7% Percent of a Quantity 42 4.9% Percent Proportions 13 1.5%
Proportional and Non-Proportional Relationships 26 3%
Rates 14 1.6% Ratios 91 10.7%
Ratios as Equations 20 2.3% Ratios as Models 36 4.2%
Real World Ratios/Equivalent Ratios 2 0.2% Simplified Ratios 2 0.2%
Solving Proportions 23 2.7% Speed 3 0.4%
Unit Rate 112 13.1% Writing Proportions 14 1.6%
Note: Percentages may not total 100 due to rounding.
After noting the general characteristics of each task, the UMSMP content was analyzed
according to the categories delineated by Van de Walle (2007). There were nine categories for
tasks for classification: Part-to-Part, Part-to-Whole, Rates, Corresponding Parts of Similar
Figures, Slope/Rate of Change, Golden Ratio, In the Same (Identity), In the Same (Create),
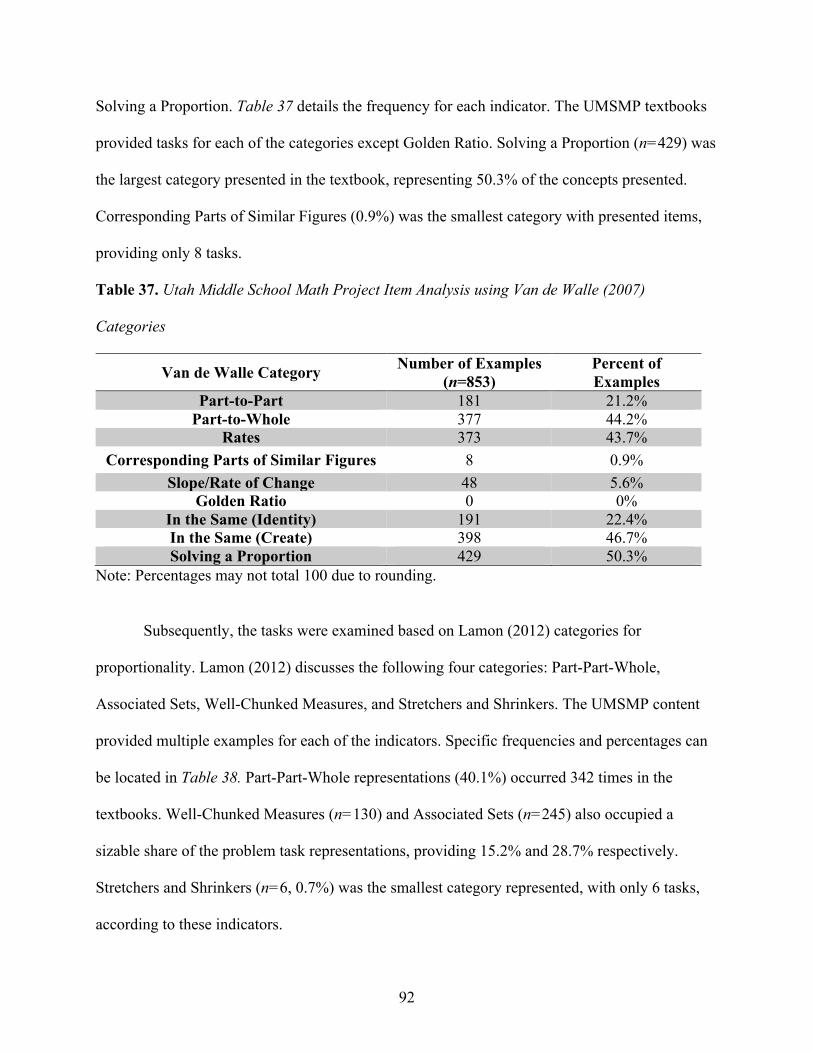
92
Solving a Proportion. Table 37 details the frequency for each indicator. The UMSMP textbooks
provided tasks for each of the categories except Golden Ratio. Solving a Proportion (n=429) was
the largest category presented in the textbook, representing 50.3% of the concepts presented.
Corresponding Parts of Similar Figures (0.9%) was the smallest category with presented items,
providing only 8 tasks.
Table 37. Utah Middle School Math Project Item Analysis using Van de Walle (2007)
Categories
Van de Walle Category Number of Examples (n=853)
Percent of Examples
Part-to-Part 181 21.2% Part-to-Whole 377 44.2%
Rates 373 43.7% Corresponding Parts of Similar Figures 8 0.9%
Slope/Rate of Change 48 5.6% Golden Ratio 0 0%
In the Same (Identity) 191 22.4% In the Same (Create) 398 46.7% Solving a Proportion 429 50.3%
Note: Percentages may not total 100 due to rounding.
Subsequently, the tasks were examined based on Lamon (2012) categories for
proportionality. Lamon (2012) discusses the following four categories: Part-Part-Whole,
Associated Sets, Well-Chunked Measures, and Stretchers and Shrinkers. The UMSMP content
provided multiple examples for each of the indicators. Specific frequencies and percentages can
be located in Table 38. Part-Part-Whole representations (40.1%) occurred 342 times in the
textbooks. Well-Chunked Measures (n=130) and Associated Sets (n=245) also occupied a
sizable share of the problem task representations, providing 15.2% and 28.7% respectively.
Stretchers and Shrinkers (n=6, 0.7%) was the smallest category represented, with only 6 tasks,
according to these indicators.
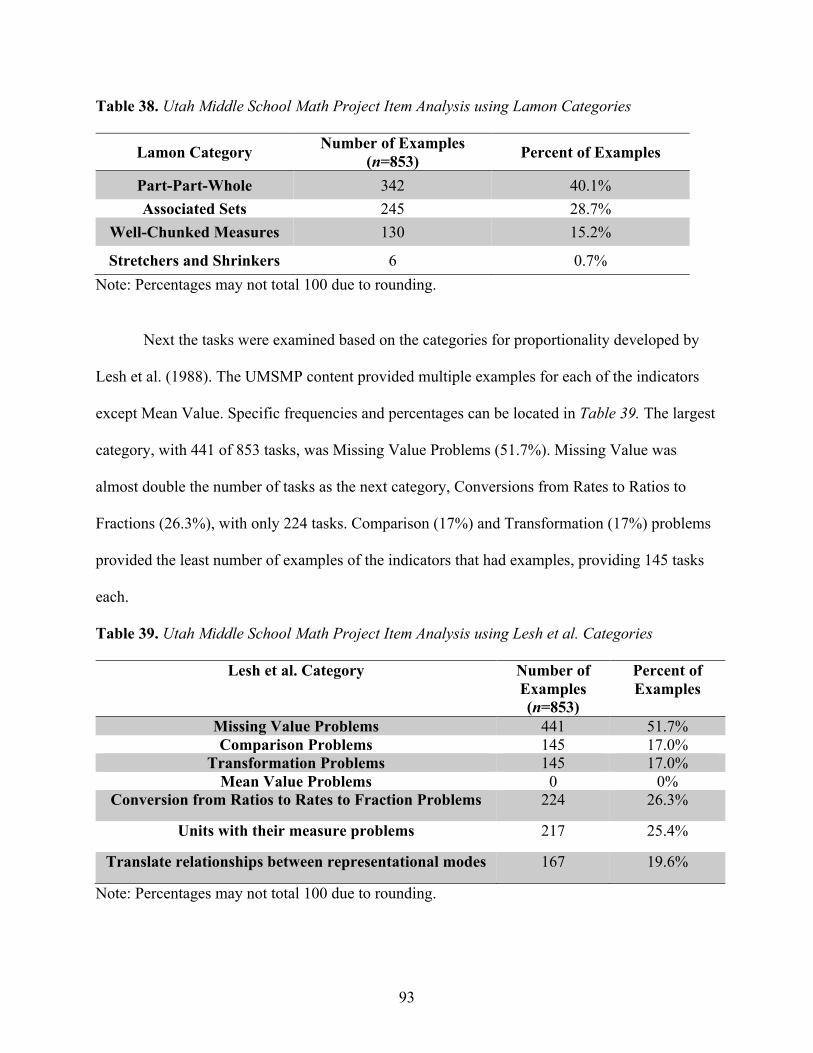
93
Table 38. Utah Middle School Math Project Item Analysis using Lamon Categories
Lamon Category Number of Examples (n=853) Percent of Examples
Part-Part-Whole 342 40.1% Associated Sets 245 28.7%
Well-Chunked Measures 130 15.2%
Stretchers and Shrinkers 6 0.7% Note: Percentages may not total 100 due to rounding.
Next the tasks were examined based on the categories for proportionality developed by
Lesh et al. (1988). The UMSMP content provided multiple examples for each of the indicators
except Mean Value. Specific frequencies and percentages can be located in Table 39. The largest
category, with 441 of 853 tasks, was Missing Value Problems (51.7%). Missing Value was
almost double the number of tasks as the next category, Conversions from Rates to Ratios to
Fractions (26.3%), with only 224 tasks. Comparison (17%) and Transformation (17%) problems
provided the least number of examples of the indicators that had examples, providing 145 tasks
each.
Table 39. Utah Middle School Math Project Item Analysis using Lesh et al. Categories
Lesh et al. Category Number of Examples (n=853)
Percent of Examples
Missing Value Problems 441 51.7% Comparison Problems 145 17.0%
Transformation Problems 145 17.0% Mean Value Problems 0 0%
Conversion from Ratios to Rates to Fraction Problems 224 26.3%
Units with their measure problems 217 25.4%
Translate relationships between representational modes 167 19.6%
Note: Percentages may not total 100 due to rounding.
94
After analyzing each task according to its proportionality representation, the tasks were
examined for their capacity to support students in creating concept images according to Tall and
Vinner's (1981) framework. Specific frequencies and percentages can be located in Table 40 and
Table 41.
A considerable number, 504 of the 853 tasks in the UMSMP textbooks, incorporated
Real-World (59.1%) contexts into the tasks. This combined with the 273 tasks with Tables
(32%), and 236 tasks with Graphs/Models (27.7%) makes Mental Picture the largest framework
component presented to students within the textbook. In addition to having students use tables
and graphs to present information, students were asked to make or add to tables, graphs and
figures 259 times (30.4%). This textbook provided six opportunities for students to examine
Formal Definitions (0.7%) and two opportunities for Student Created Definitions (0.2%) for
mathematical terms. The frequencies in Table 40 highlights the extent the textbook focused on
multiple parts of the Concept Image Framework while completing problems. Most of the tasks,
367 of 853, enlisted one (43%) framework component. In addition, 166 tasks used two (19.5%)
and 100 used four (11.7%) components. Unfortunately, a task was 5.5% more likely to present
zero components (n=147 of 853, 17.2%) of the concept image than it was to present four
components.
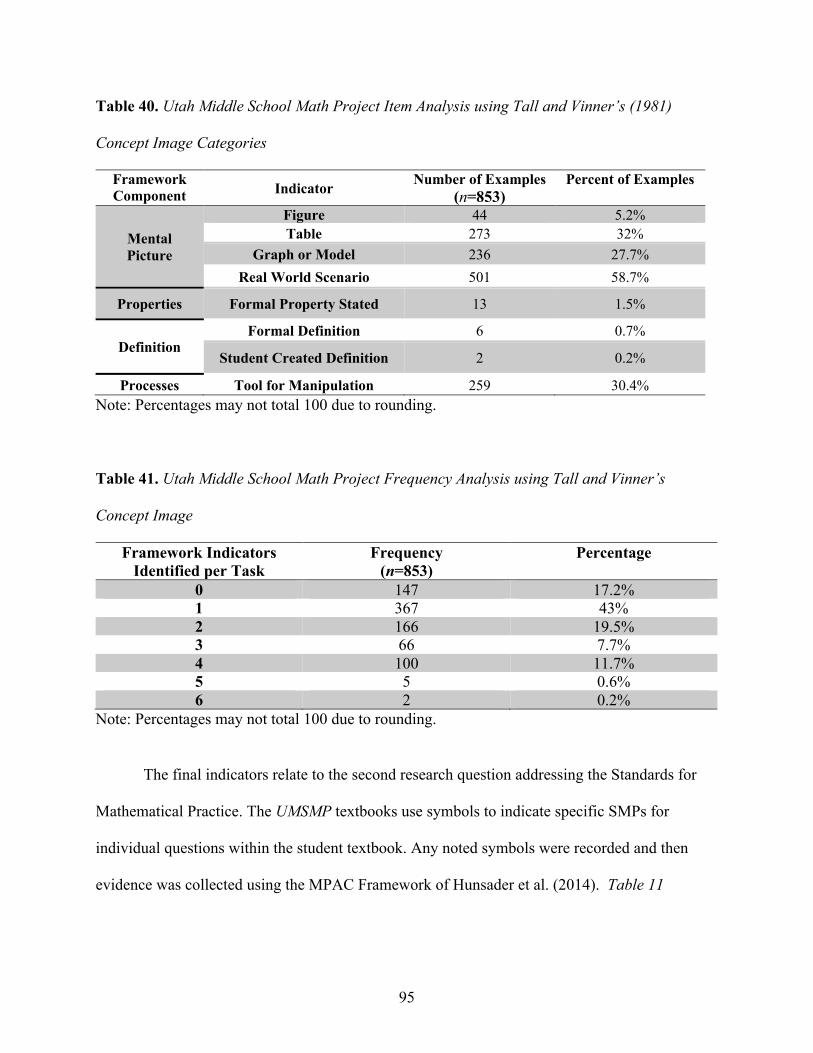
95
Table 40. Utah Middle School Math Project Item Analysis using Tall and Vinner’s (1981)
Concept Image Categories
Framework Component Indicator Number of Examples
(n=853) Percent of Examples
Mental Picture
Figure 44 5.2% Table 273 32%
Graph or Model 236 27.7% Real World Scenario 501 58.7%
Properties Formal Property Stated 13 1.5%
Definition Formal Definition 6 0.7%
Student Created Definition 2 0.2%
Processes Tool for Manipulation 259 30.4% Note: Percentages may not total 100 due to rounding.
Table 41. Utah Middle School Math Project Frequency Analysis using Tall and Vinner’s
Concept Image
Framework Indicators Identified per Task
Frequency (n=853)
Percentage
0 147 17.2% 1 367 43% 2 166 19.5% 3 66 7.7% 4 100 11.7% 5 5 0.6% 6 2 0.2%
Note: Percentages may not total 100 due to rounding.
The final indicators relate to the second research question addressing the Standards for
Mathematical Practice. The UMSMP textbooks use symbols to indicate specific SMPs for
individual questions within the student textbook. Any noted symbols were recorded and then
evidence was collected using the MPAC Framework of Hunsader et al. (2014). Table 11
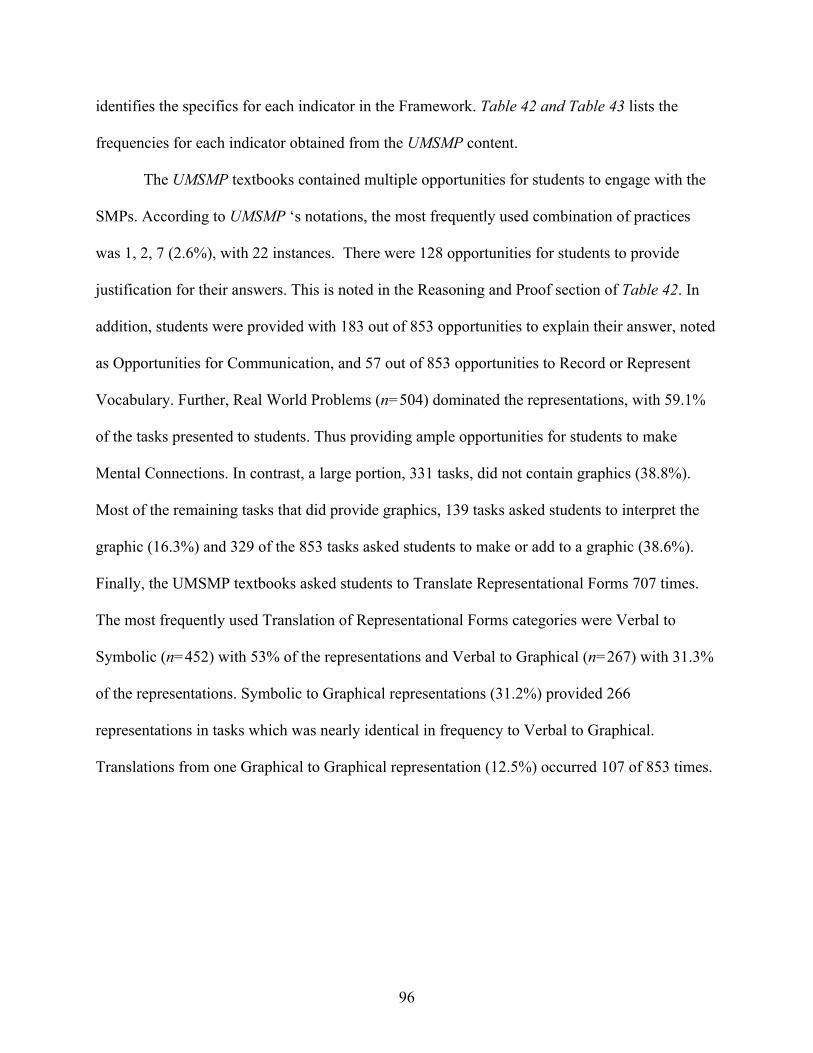
96
identifies the specifics for each indicator in the Framework. Table 42 and Table 43 lists the
frequencies for each indicator obtained from the UMSMP content.
The UMSMP textbooks contained multiple opportunities for students to engage with the
SMPs. According to UMSMP ‘s notations, the most frequently used combination of practices
was 1, 2, 7 (2.6%), with 22 instances. There were 128 opportunities for students to provide
justification for their answers. This is noted in the Reasoning and Proof section of Table 42. In
addition, students were provided with 183 out of 853 opportunities to explain their answer, noted
as Opportunities for Communication, and 57 out of 853 opportunities to Record or Represent
Vocabulary. Further, Real World Problems (n=504) dominated the representations, with 59.1%
of the tasks presented to students. Thus providing ample opportunities for students to make
Mental Connections. In contrast, a large portion, 331 tasks, did not contain graphics (38.8%).
Most of the remaining tasks that did provide graphics, 139 tasks asked students to interpret the
graphic (16.3%) and 329 of the 853 tasks asked students to make or add to a graphic (38.6%).
Finally, the UMSMP textbooks asked students to Translate Representational Forms 707 times.
The most frequently used Translation of Representational Forms categories were Verbal to
Symbolic (n=452) with 53% of the representations and Verbal to Graphical (n=267) with 31.3%
of the representations. Symbolic to Graphical representations (31.2%) provided 266
representations in tasks which was nearly identical in frequency to Verbal to Graphical.
Translations from one Graphical to Graphical representation (12.5%) occurred 107 of 853 times.
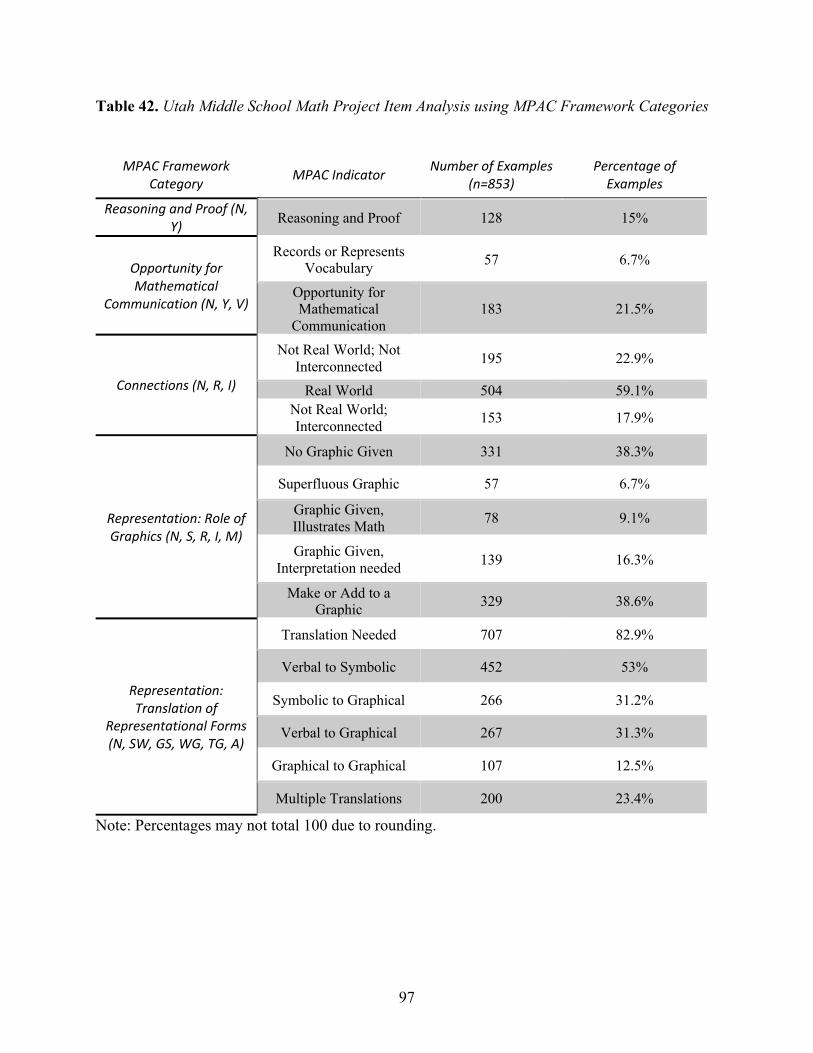
97
Table 42. Utah Middle School Math Project Item Analysis using MPAC Framework Categories
MPAC Framework
Category MPAC Indicator Number of Examples (n=853)
Percentage of Examples
Reasoning and Proof (N, Y) Reasoning and Proof 128 15%
Opportunity for Mathematical
Communication (N, Y, V)
Records or Represents Vocabulary 57 6.7%
Opportunity for Mathematical
Communication 183 21.5%
Connections (N, R, I)
Not Real World; Not Interconnected 195 22.9%
Real World 504 59.1% Not Real World; Interconnected 153 17.9%
Representation: Role of Graphics (N, S, R, I, M)
No Graphic Given 331 38.3%
Superfluous Graphic 57 6.7%
Graphic Given, Illustrates Math 78 9.1%
Graphic Given, Interpretation needed 139 16.3%
Make or Add to a Graphic 329 38.6%
Representation: Translation of
Representational Forms (N, SW, GS, WG, TG, A)
Translation Needed 707 82.9%
Verbal to Symbolic 452 53%
Symbolic to Graphical 266 31.2%
Verbal to Graphical 267 31.3%
Graphical to Graphical 107 12.5%
Multiple Translations 200 23.4%
Note: Percentages may not total 100 due to rounding.
98
Table 43. Utah Middle School Math Project Frequency Analysis for Indicated SMPs
Noted Standard for Mathematical Practice
Frequency (n=853)
Percentage
0 612 71.7% 1 10 1.2%
1, 2 1 0.1% 1, 2, 3, 4, 5, 6, 7, 8 1 0.1%
1, 2, 3, 5 1 0.1% 1, 2, 4, 5 14 1.6%
1, 2, 4, 5, 6, 7, 8 1 0.1% 1, 2, 5, 8 1 0.1% 1, 2, 7 22 2.6% 1, 3 9 1.1%
1, 3, 5 1 0.1% 1, 5 11 1.3%
1, 5, 8 16 1.9% 1, 6 2 0.2% 1, 7 1 0.1%
1, 4, 5 2 0.2% 2, 4 1 0.1%
2, 4, 5 12 1.4% 2, 6 1 0.1% 2, 7 1 0.1%
2, 7, 8 1 0.1% 2, 4, 5, 6, 7 1 0.1%
2, 4, 6 3 0.4% 3 6 0.7%
3, 6 3 0.4% 3, 4, 6 1 0.1% 3, 7 2 0.2% 4 9 1.1%
4, 5 4 0.5% 4, 6 2 0.2% 4, 8 2 0.2%
4, 5, 7 3 0.4% 4, 7, 8 1 0.1%
5 32 3.8% 5, 6, 7, 8 17 2%
6 31 3.6% 6, 8 1 0.1% 7 5 0.6%
7, 8 2 0.2% 8 6 0.7%
Note: Percentages may not total 100 due to rounding.
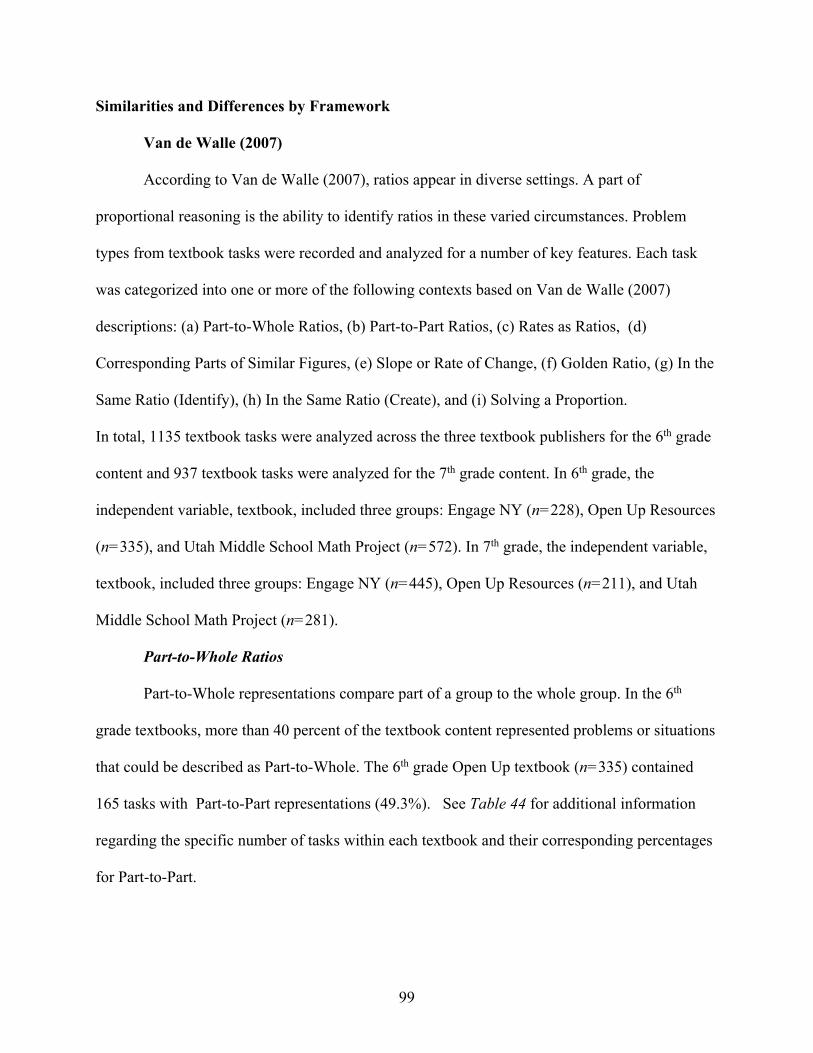
99
Similarities and Differences by Framework
Van de Walle (2007)
According to Van de Walle (2007), ratios appear in diverse settings. A part of
proportional reasoning is the ability to identify ratios in these varied circumstances. Problem
types from textbook tasks were recorded and analyzed for a number of key features. Each task
was categorized into one or more of the following contexts based on Van de Walle (2007)
descriptions: (a) Part-to-Whole Ratios, (b) Part-to-Part Ratios, (c) Rates as Ratios, (d)
Corresponding Parts of Similar Figures, (e) Slope or Rate of Change, (f) Golden Ratio, (g) In the
Same Ratio (Identify), (h) In the Same Ratio (Create), and (i) Solving a Proportion.
In total, 1135 textbook tasks were analyzed across the three textbook publishers for the 6th grade
content and 937 textbook tasks were analyzed for the 7th grade content. In 6th grade, the
independent variable, textbook, included three groups: Engage NY (n=228), Open Up Resources
(n=335), and Utah Middle School Math Project (n=572). In 7th grade, the independent variable,
textbook, included three groups: Engage NY (n=445), Open Up Resources (n=211), and Utah
Middle School Math Project (n=281).
Part-to-Whole Ratios
Part-to-Whole representations compare part of a group to the whole group. In the 6th
grade textbooks, more than 40 percent of the textbook content represented problems or situations
that could be described as Part-to-Whole. The 6th grade Open Up textbook (n=335) contained
165 tasks with Part-to-Part representations (49.3%). See Table 44 for additional information
regarding the specific number of tasks within each textbook and their corresponding percentages
for Part-to-Part.
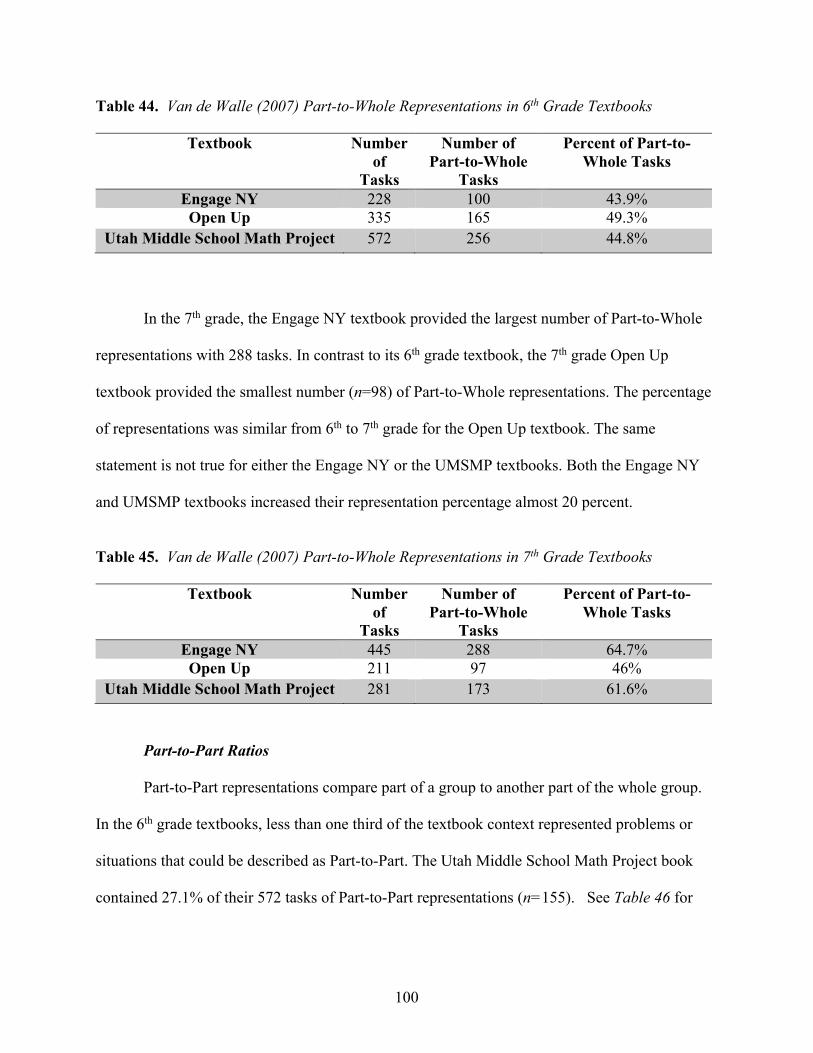
100
Table 44. Van de Walle (2007) Part-to-Whole Representations in 6th Grade Textbooks
Textbook Number of
Tasks
Number of Part-to-Whole
Tasks
Percent of Part-to-Whole Tasks
Engage NY 228 100 43.9% Open Up 335 165 49.3%
Utah Middle School Math Project 572 256 44.8%
In the 7th grade, the Engage NY textbook provided the largest number of Part-to-Whole
representations with 288 tasks. In contrast to its 6th grade textbook, the 7th grade Open Up
textbook provided the smallest number (n=98) of Part-to-Whole representations. The percentage
of representations was similar from 6th to 7th grade for the Open Up textbook. The same
statement is not true for either the Engage NY or the UMSMP textbooks. Both the Engage NY
and UMSMP textbooks increased their representation percentage almost 20 percent.
Table 45. Van de Walle (2007) Part-to-Whole Representations in 7th Grade Textbooks
Textbook Number of
Tasks
Number of Part-to-Whole
Tasks
Percent of Part-to-Whole Tasks
Engage NY 445 288 64.7% Open Up 211 97 46%
Utah Middle School Math Project 281 173 61.6%
Part-to-Part Ratios
Part-to-Part representations compare part of a group to another part of the whole group.
In the 6th grade textbooks, less than one third of the textbook context represented problems or
situations that could be described as Part-to-Part. The Utah Middle School Math Project book
contained 27.1% of their 572 tasks of Part-to-Part representations (n=155). See Table 46 for
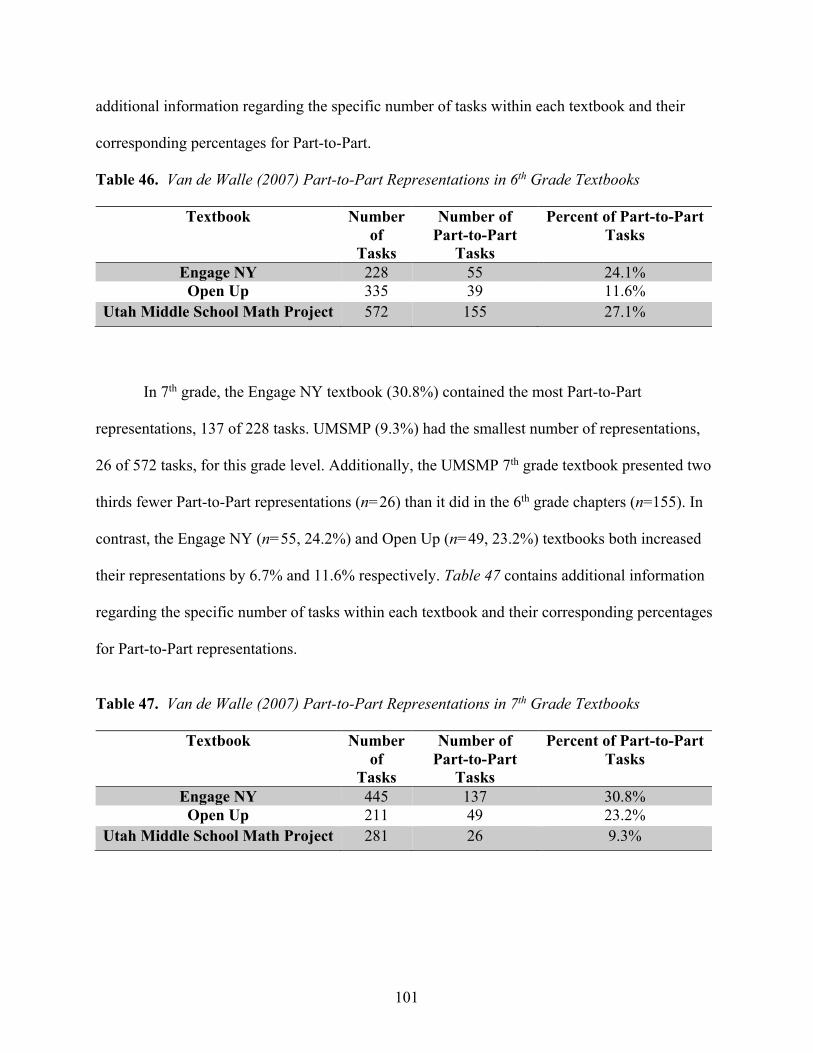
101
additional information regarding the specific number of tasks within each textbook and their
corresponding percentages for Part-to-Part.
Table 46. Van de Walle (2007) Part-to-Part Representations in 6th Grade Textbooks
Textbook Number of
Tasks
Number of Part-to-Part
Tasks
Percent of Part-to-Part Tasks
Engage NY 228 55 24.1% Open Up 335 39 11.6%
Utah Middle School Math Project 572 155 27.1%
In 7th grade, the Engage NY textbook (30.8%) contained the most Part-to-Part
representations, 137 of 228 tasks. UMSMP (9.3%) had the smallest number of representations,
26 of 572 tasks, for this grade level. Additionally, the UMSMP 7th grade textbook presented two
thirds fewer Part-to-Part representations (n=26) than it did in the 6th grade chapters (n=155). In
contrast, the Engage NY (n=55, 24.2%) and Open Up (n=49, 23.2%) textbooks both increased
their representations by 6.7% and 11.6% respectively. Table 47 contains additional information
regarding the specific number of tasks within each textbook and their corresponding percentages
for Part-to-Part representations.
Table 47. Van de Walle (2007) Part-to-Part Representations in 7th Grade Textbooks
Textbook Number of
Tasks
Number of Part-to-Part
Tasks
Percent of Part-to-Part Tasks
Engage NY 445 137 30.8% Open Up 211 49 23.2%
Utah Middle School Math Project 281 26 9.3%
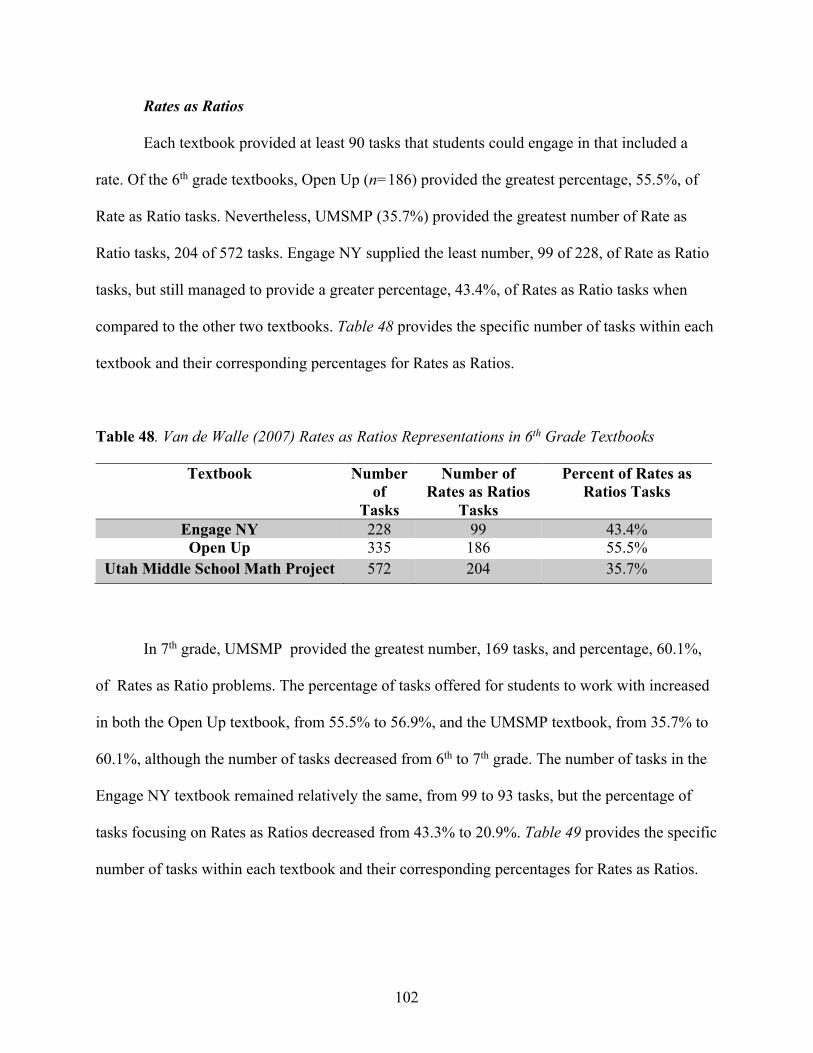
102
Rates as Ratios
Each textbook provided at least 90 tasks that students could engage in that included a
rate. Of the 6th grade textbooks, Open Up (n=186) provided the greatest percentage, 55.5%, of
Rate as Ratio tasks. Nevertheless, UMSMP (35.7%) provided the greatest number of Rate as
Ratio tasks, 204 of 572 tasks. Engage NY supplied the least number, 99 of 228, of Rate as Ratio
tasks, but still managed to provide a greater percentage, 43.4%, of Rates as Ratio tasks when
compared to the other two textbooks. Table 48 provides the specific number of tasks within each
textbook and their corresponding percentages for Rates as Ratios.
Table 48. Van de Walle (2007) Rates as Ratios Representations in 6th Grade Textbooks
Textbook Number of
Tasks
Number of Rates as Ratios
Tasks
Percent of Rates as Ratios Tasks
Engage NY 228 99 43.4% Open Up 335 186 55.5%
Utah Middle School Math Project 572 204 35.7%
In 7th grade, UMSMP provided the greatest number, 169 tasks, and percentage, 60.1%,
of Rates as Ratio problems. The percentage of tasks offered for students to work with increased
in both the Open Up textbook, from 55.5% to 56.9%, and the UMSMP textbook, from 35.7% to
60.1%, although the number of tasks decreased from 6th to 7th grade. The number of tasks in the
Engage NY textbook remained relatively the same, from 99 to 93 tasks, but the percentage of
tasks focusing on Rates as Ratios decreased from 43.3% to 20.9%. Table 49 provides the specific
number of tasks within each textbook and their corresponding percentages for Rates as Ratios.
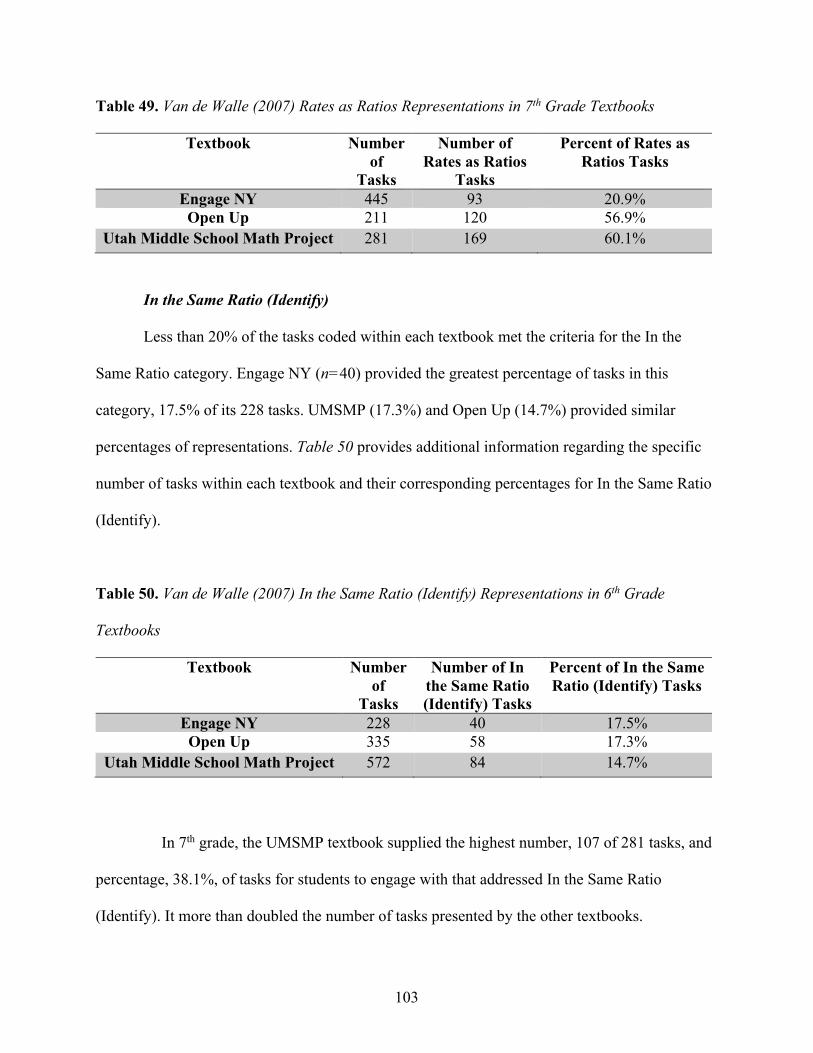
103
Table 49. Van de Walle (2007) Rates as Ratios Representations in 7th Grade Textbooks
Textbook Number of
Tasks
Number of Rates as Ratios
Tasks
Percent of Rates as Ratios Tasks
Engage NY 445 93 20.9% Open Up 211 120 56.9%
Utah Middle School Math Project 281 169 60.1%
In the Same Ratio (Identify)
Less than 20% of the tasks coded within each textbook met the criteria for the In the
Same Ratio category. Engage NY (n=40) provided the greatest percentage of tasks in this
category, 17.5% of its 228 tasks. UMSMP (17.3%) and Open Up (14.7%) provided similar
percentages of representations. Table 50 provides additional information regarding the specific
number of tasks within each textbook and their corresponding percentages for In the Same Ratio
(Identify).
Table 50. Van de Walle (2007) In the Same Ratio (Identify) Representations in 6th Grade
Textbooks
Textbook Number of
Tasks
Number of In the Same Ratio (Identify) Tasks
Percent of In the Same Ratio (Identify) Tasks
Engage NY 228 40 17.5% Open Up 335 58 17.3%
Utah Middle School Math Project 572 84 14.7%
In 7th grade, the UMSMP textbook supplied the highest number, 107 of 281 tasks, and
percentage, 38.1%, of tasks for students to engage with that addressed In the Same Ratio
(Identify). It more than doubled the number of tasks presented by the other textbooks.
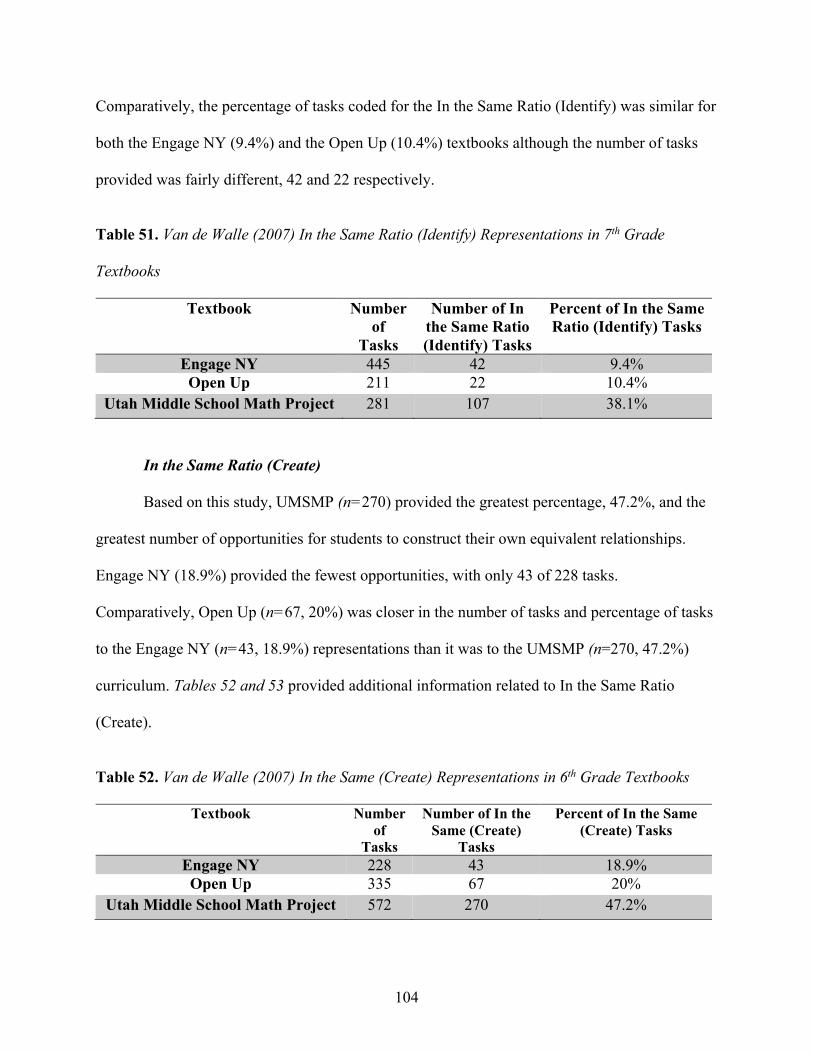
104
Comparatively, the percentage of tasks coded for the In the Same Ratio (Identify) was similar for
both the Engage NY (9.4%) and the Open Up (10.4%) textbooks although the number of tasks
provided was fairly different, 42 and 22 respectively.
Table 51. Van de Walle (2007) In the Same Ratio (Identify) Representations in 7th Grade
Textbooks
Textbook Number of
Tasks
Number of In the Same Ratio (Identify) Tasks
Percent of In the Same Ratio (Identify) Tasks
Engage NY 445 42 9.4% Open Up 211 22 10.4%
Utah Middle School Math Project 281 107 38.1%
In the Same Ratio (Create)
Based on this study, UMSMP (n=270) provided the greatest percentage, 47.2%, and the
greatest number of opportunities for students to construct their own equivalent relationships.
Engage NY (18.9%) provided the fewest opportunities, with only 43 of 228 tasks.
Comparatively, Open Up (n=67, 20%) was closer in the number of tasks and percentage of tasks
to the Engage NY (n=43, 18.9%) representations than it was to the UMSMP (n=270, 47.2%)
curriculum. Tables 52 and 53 provided additional information related to In the Same Ratio
(Create).
Table 52. Van de Walle (2007) In the Same (Create) Representations in 6th Grade Textbooks
Textbook Number of
Tasks
Number of In the Same (Create)
Tasks
Percent of In the Same (Create) Tasks
Engage NY 228 43 18.9% Open Up 335 67 20%
Utah Middle School Math Project 572 270 47.2%
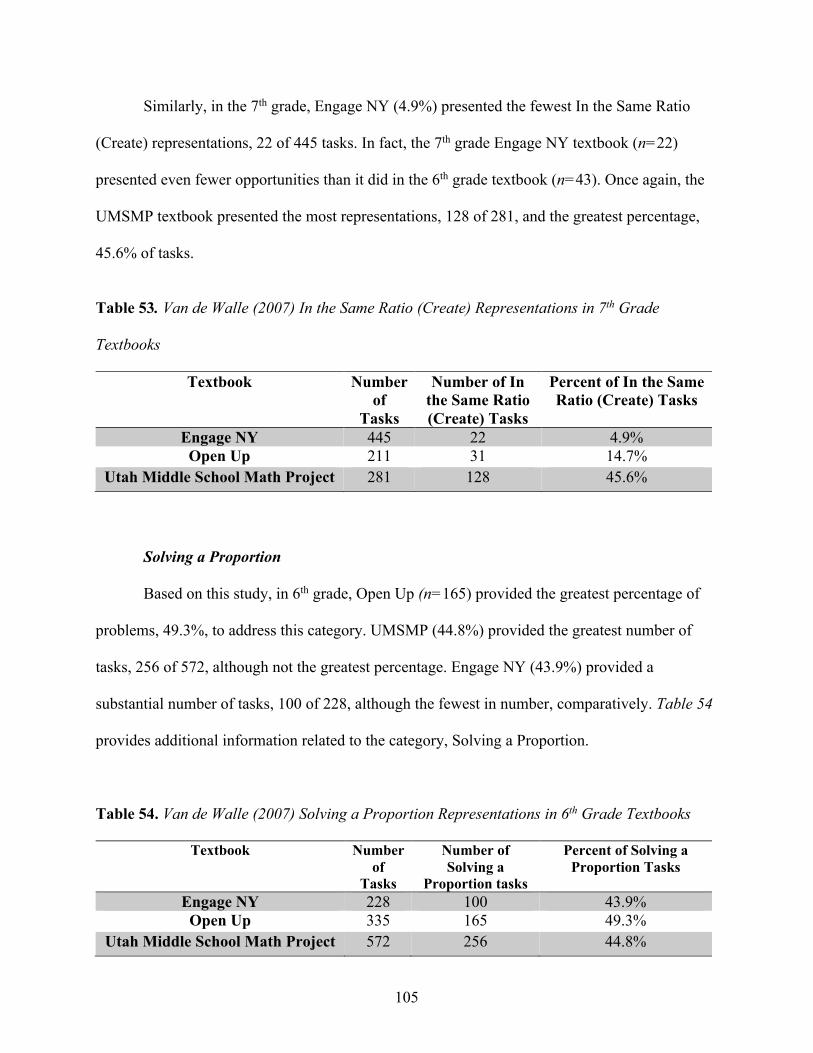
105
Similarly, in the 7th grade, Engage NY (4.9%) presented the fewest In the Same Ratio
(Create) representations, 22 of 445 tasks. In fact, the 7th grade Engage NY textbook (n=22)
presented even fewer opportunities than it did in the 6th grade textbook (n=43). Once again, the
UMSMP textbook presented the most representations, 128 of 281, and the greatest percentage,
45.6% of tasks.
Table 53. Van de Walle (2007) In the Same Ratio (Create) Representations in 7th Grade
Textbooks
Textbook Number of
Tasks
Number of In the Same Ratio (Create) Tasks
Percent of In the Same Ratio (Create) Tasks
Engage NY 445 22 4.9% Open Up 211 31 14.7%
Utah Middle School Math Project 281 128 45.6%
Solving a Proportion
Based on this study, in 6th grade, Open Up (n=165) provided the greatest percentage of
problems, 49.3%, to address this category. UMSMP (44.8%) provided the greatest number of
tasks, 256 of 572, although not the greatest percentage. Engage NY (43.9%) provided a
substantial number of tasks, 100 of 228, although the fewest in number, comparatively. Table 54
provides additional information related to the category, Solving a Proportion.
Table 54. Van de Walle (2007) Solving a Proportion Representations in 6th Grade Textbooks
Textbook Number of
Tasks
Number of Solving a
Proportion tasks
Percent of Solving a Proportion Tasks
Engage NY 228 100 43.9% Open Up 335 165 49.3%
Utah Middle School Math Project 572 256 44.8%
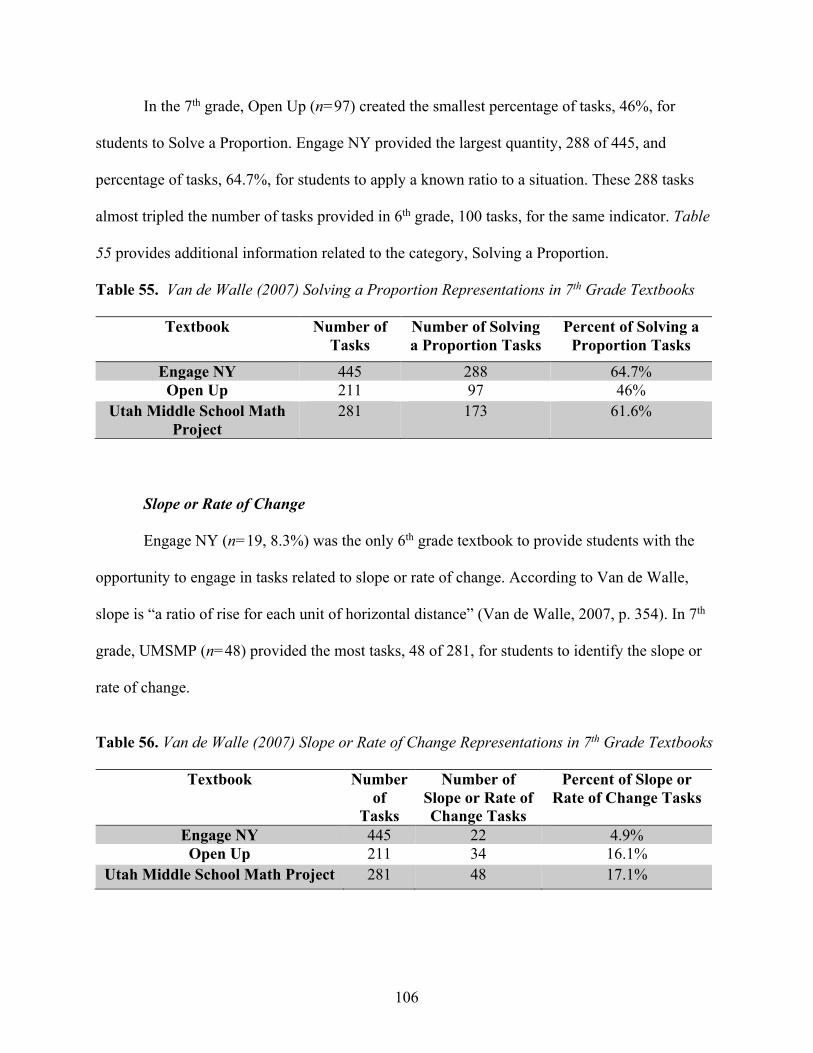
106
In the 7th grade, Open Up (n=97) created the smallest percentage of tasks, 46%, for
students to Solve a Proportion. Engage NY provided the largest quantity, 288 of 445, and
percentage of tasks, 64.7%, for students to apply a known ratio to a situation. These 288 tasks
almost tripled the number of tasks provided in 6th grade, 100 tasks, for the same indicator. Table
55 provides additional information related to the category, Solving a Proportion.
Table 55. Van de Walle (2007) Solving a Proportion Representations in 7th Grade Textbooks
Textbook Number of Tasks
Number of Solving a Proportion Tasks
Percent of Solving a Proportion Tasks
Engage NY 445 288 64.7% Open Up 211 97 46%
Utah Middle School Math Project
281 173 61.6%
Slope or Rate of Change
Engage NY (n=19, 8.3%) was the only 6th grade textbook to provide students with the
opportunity to engage in tasks related to slope or rate of change. According to Van de Walle,
slope is “a ratio of rise for each unit of horizontal distance” (Van de Walle, 2007, p. 354). In 7th
grade, UMSMP (n=48) provided the most tasks, 48 of 281, for students to identify the slope or
rate of change.
Table 56. Van de Walle (2007) Slope or Rate of Change Representations in 7th Grade Textbooks
Textbook Number of
Tasks
Number of Slope or Rate of Change Tasks
Percent of Slope or Rate of Change Tasks
Engage NY 445 22 4.9% Open Up 211 34 16.1%
Utah Middle School Math Project 281 48 17.1%
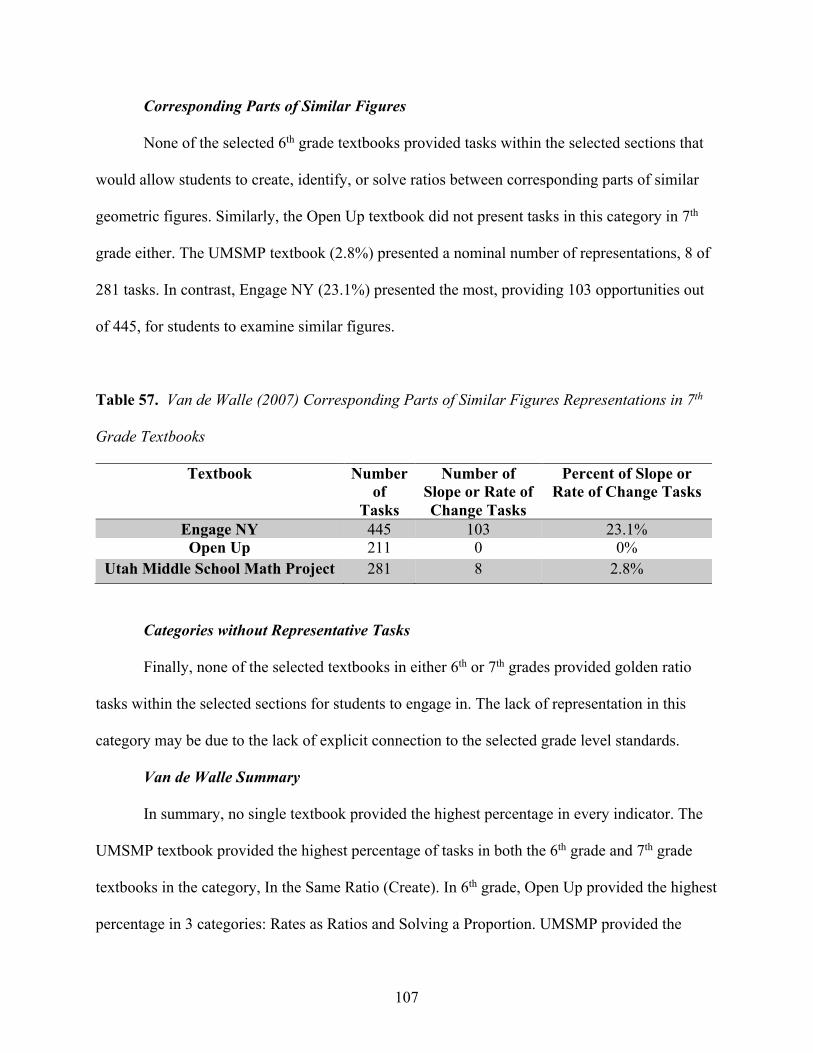
107
Corresponding Parts of Similar Figures
None of the selected 6th grade textbooks provided tasks within the selected sections that
would allow students to create, identify, or solve ratios between corresponding parts of similar
geometric figures. Similarly, the Open Up textbook did not present tasks in this category in 7th
grade either. The UMSMP textbook (2.8%) presented a nominal number of representations, 8 of
281 tasks. In contrast, Engage NY (23.1%) presented the most, providing 103 opportunities out
of 445, for students to examine similar figures.
Table 57. Van de Walle (2007) Corresponding Parts of Similar Figures Representations in 7th
Grade Textbooks
Textbook Number of
Tasks
Number of Slope or Rate of Change Tasks
Percent of Slope or Rate of Change Tasks
Engage NY 445 103 23.1% Open Up 211 0 0%
Utah Middle School Math Project 281 8 2.8%
Categories without Representative Tasks
Finally, none of the selected textbooks in either 6th or 7th grades provided golden ratio
tasks within the selected sections for students to engage in. The lack of representation in this
category may be due to the lack of explicit connection to the selected grade level standards.
Van de Walle Summary
In summary, no single textbook provided the highest percentage in every indicator. The
UMSMP textbook provided the highest percentage of tasks in both the 6th grade and 7th grade
textbooks in the category, In the Same Ratio (Create). In 6th grade, Open Up provided the highest
percentage in 3 categories: Rates as Ratios and Solving a Proportion. UMSMP provided the
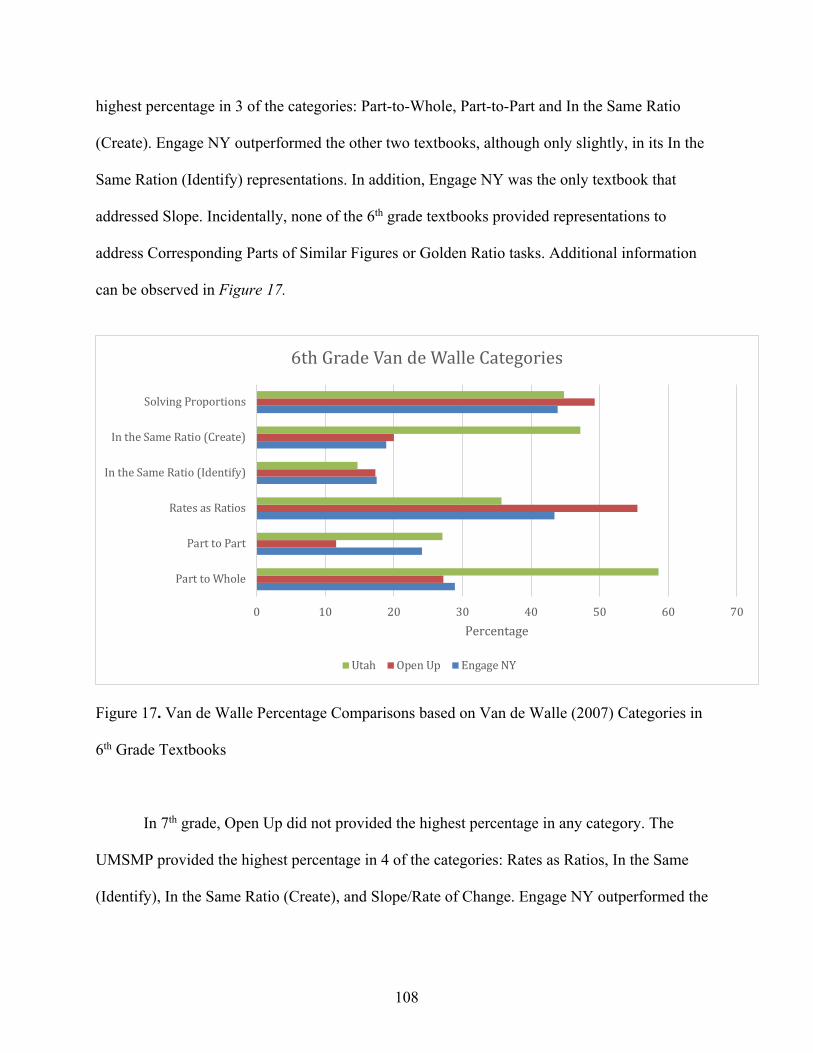
108
highest percentage in 3 of the categories: Part-to-Whole, Part-to-Part and In the Same Ratio
(Create). Engage NY outperformed the other two textbooks, although only slightly, in its In the
Same Ration (Identify) representations. In addition, Engage NY was the only textbook that
addressed Slope. Incidentally, none of the 6th grade textbooks provided representations to
address Corresponding Parts of Similar Figures or Golden Ratio tasks. Additional information
can be observed in Figure 17.
Figure 17. Van de Walle Percentage Comparisons based on Van de Walle (2007) Categories in
6th Grade Textbooks
In 7th grade, Open Up did not provided the highest percentage in any category. The
UMSMP provided the highest percentage in 4 of the categories: Rates as Ratios, In the Same
(Identify), In the Same Ratio (Create), and Slope/Rate of Change. Engage NY outperformed the
0 10 20 30 40 50 60 70
ParttoWhole
ParttoPart
RatesasRatios
IntheSameRatio(Identify)
IntheSameRatio(Create)
SolvingProportions
Percentage
6thGradeVandeWalleCategories
Utah OpenUp EngageNY
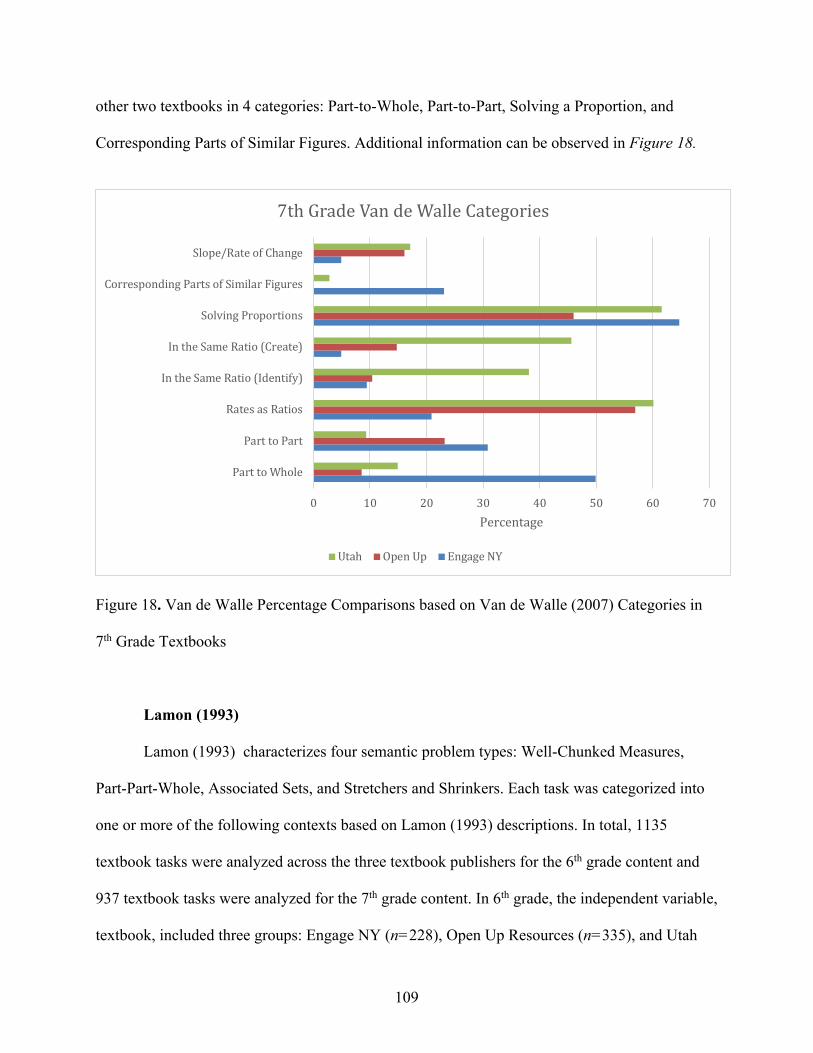
109
other two textbooks in 4 categories: Part-to-Whole, Part-to-Part, Solving a Proportion, and
Corresponding Parts of Similar Figures. Additional information can be observed in Figure 18.
Figure 18. Van de Walle Percentage Comparisons based on Van de Walle (2007) Categories in
7th Grade Textbooks
Lamon (1993)
Lamon (1993) characterizes four semantic problem types: Well-Chunked Measures,
Part-Part-Whole, Associated Sets, and Stretchers and Shrinkers. Each task was categorized into
one or more of the following contexts based on Lamon (1993) descriptions. In total, 1135
textbook tasks were analyzed across the three textbook publishers for the 6th grade content and
937 textbook tasks were analyzed for the 7th grade content. In 6th grade, the independent variable,
textbook, included three groups: Engage NY (n=228), Open Up Resources (n=335), and Utah
0 10 20 30 40 50 60 70
ParttoWhole
ParttoPart
RatesasRatios
IntheSameRatio(Identify)
IntheSameRatio(Create)
SolvingProportions
CorrespondingPartsofSimilarFigures
Slope/RateofChange
Percentage
7thGradeVandeWalleCategories
Utah OpenUp EngageNY
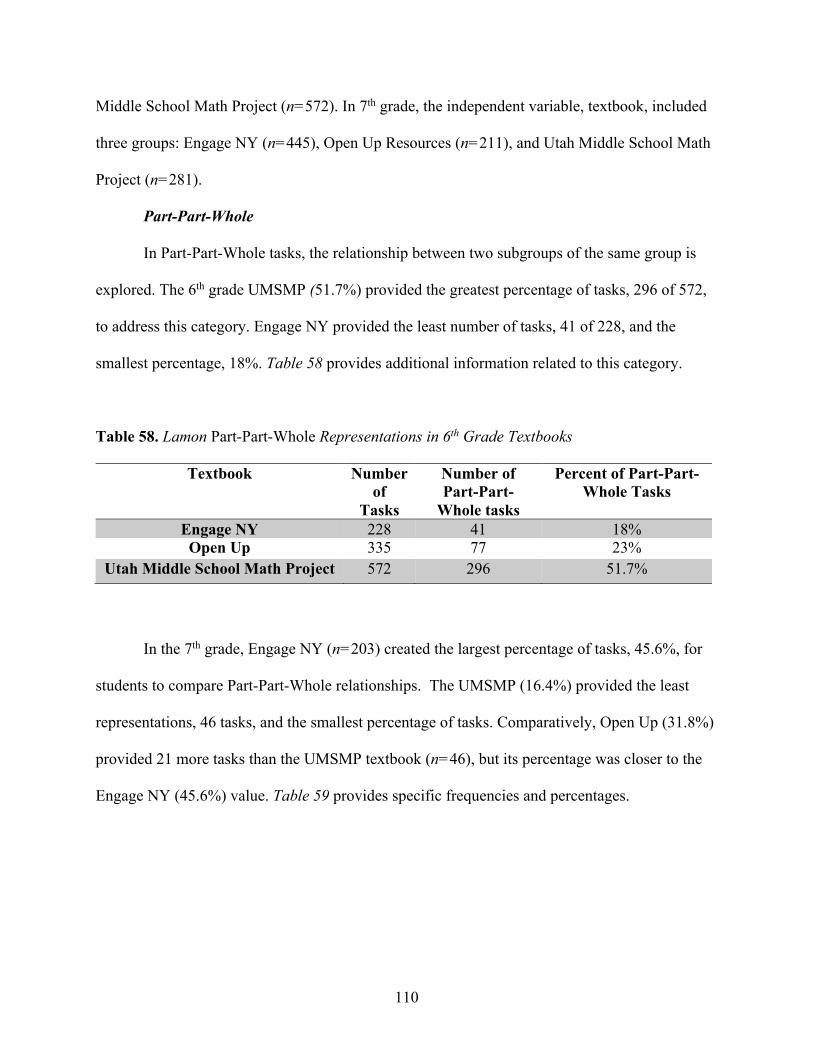
110
Middle School Math Project (n=572). In 7th grade, the independent variable, textbook, included
three groups: Engage NY (n=445), Open Up Resources (n=211), and Utah Middle School Math
Project (n=281).
Part-Part-Whole
In Part-Part-Whole tasks, the relationship between two subgroups of the same group is
explored. The 6th grade UMSMP (51.7%) provided the greatest percentage of tasks, 296 of 572,
to address this category. Engage NY provided the least number of tasks, 41 of 228, and the
smallest percentage, 18%. Table 58 provides additional information related to this category.
Table 58. Lamon Part-Part-Whole Representations in 6th Grade Textbooks
Textbook Number of
Tasks
Number of Part-Part-
Whole tasks
Percent of Part-Part-Whole Tasks
Engage NY 228 41 18% Open Up 335 77 23%
Utah Middle School Math Project 572 296 51.7%
In the 7th grade, Engage NY (n=203) created the largest percentage of tasks, 45.6%, for
students to compare Part-Part-Whole relationships. The UMSMP (16.4%) provided the least
representations, 46 tasks, and the smallest percentage of tasks. Comparatively, Open Up (31.8%)
provided 21 more tasks than the UMSMP textbook (n=46), but its percentage was closer to the
Engage NY (45.6%) value. Table 59 provides specific frequencies and percentages.
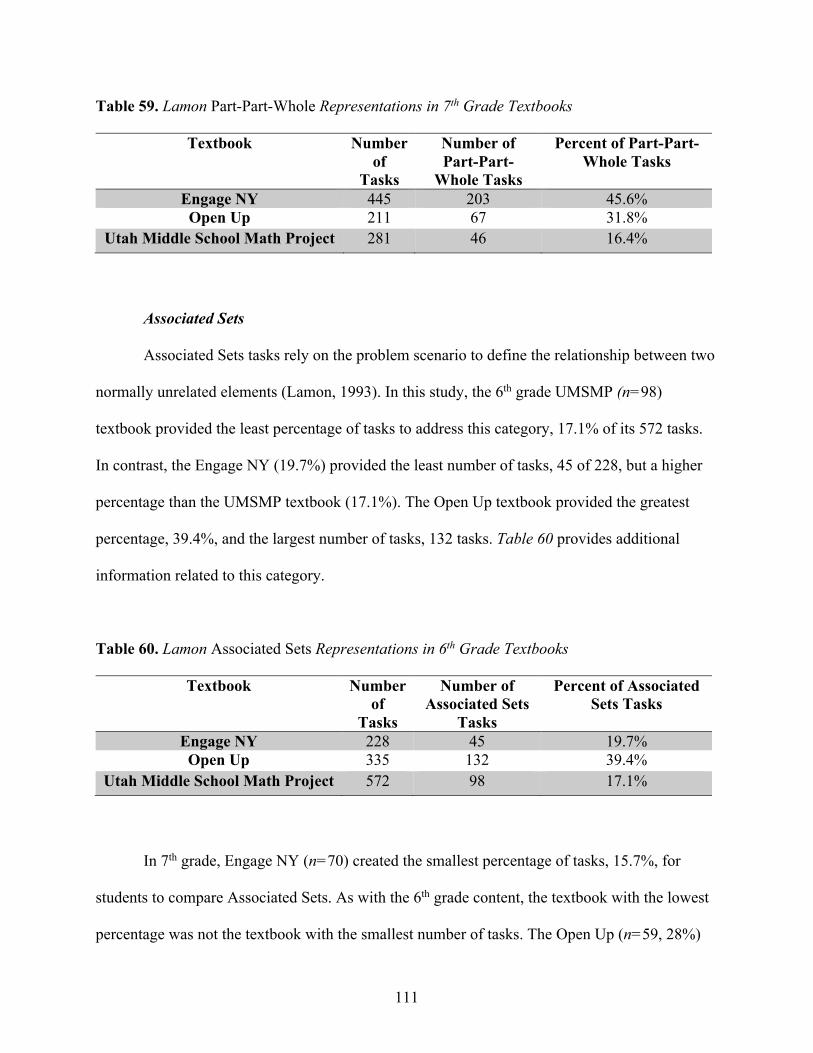
111
Table 59. Lamon Part-Part-Whole Representations in 7th Grade Textbooks
Textbook Number of
Tasks
Number of Part-Part-
Whole Tasks
Percent of Part-Part-Whole Tasks
Engage NY 445 203 45.6% Open Up 211 67 31.8%
Utah Middle School Math Project 281 46 16.4%
Associated Sets
Associated Sets tasks rely on the problem scenario to define the relationship between two
normally unrelated elements (Lamon, 1993). In this study, the 6th grade UMSMP (n=98)
textbook provided the least percentage of tasks to address this category, 17.1% of its 572 tasks.
In contrast, the Engage NY (19.7%) provided the least number of tasks, 45 of 228, but a higher
percentage than the UMSMP textbook (17.1%). The Open Up textbook provided the greatest
percentage, 39.4%, and the largest number of tasks, 132 tasks. Table 60 provides additional
information related to this category.
Table 60. Lamon Associated Sets Representations in 6th Grade Textbooks
Textbook Number of
Tasks
Number of Associated Sets
Tasks
Percent of Associated Sets Tasks
Engage NY 228 45 19.7% Open Up 335 132 39.4%
Utah Middle School Math Project 572 98 17.1%
In 7th grade, Engage NY (n=70) created the smallest percentage of tasks, 15.7%, for
students to compare Associated Sets. As with the 6th grade content, the textbook with the lowest
percentage was not the textbook with the smallest number of tasks. The Open Up (n=59, 28%)
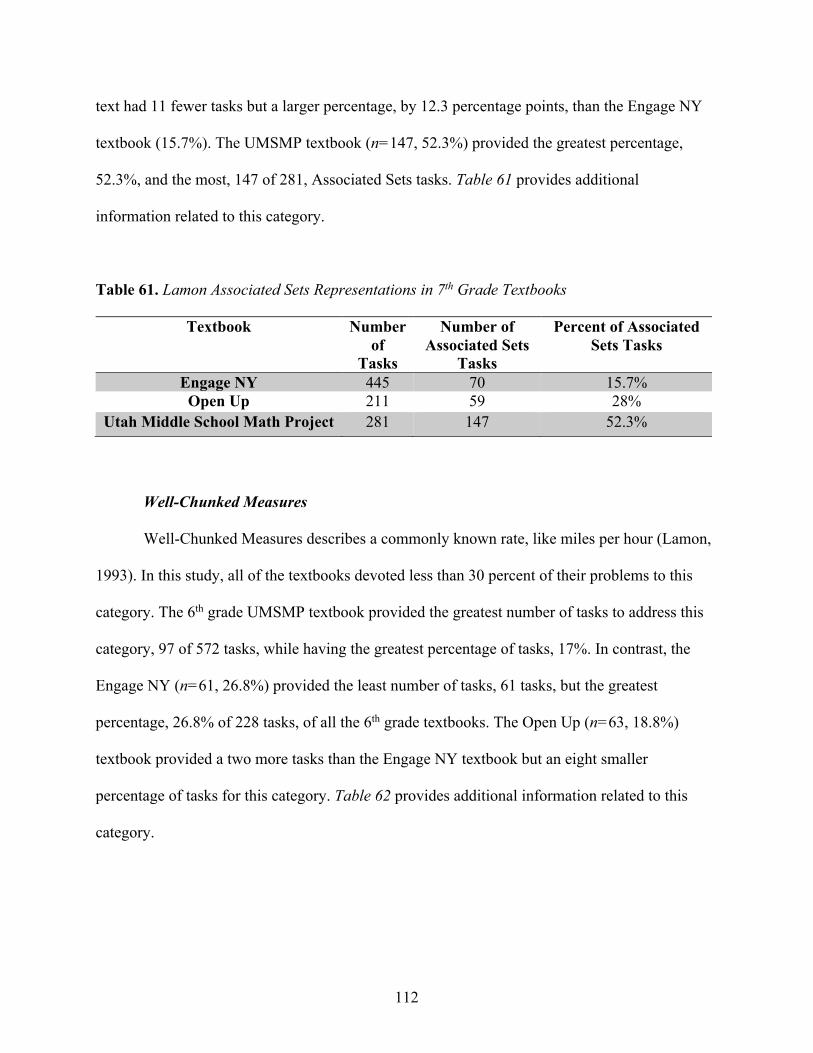
112
text had 11 fewer tasks but a larger percentage, by 12.3 percentage points, than the Engage NY
textbook (15.7%). The UMSMP textbook (n=147, 52.3%) provided the greatest percentage,
52.3%, and the most, 147 of 281, Associated Sets tasks. Table 61 provides additional
information related to this category.
Table 61. Lamon Associated Sets Representations in 7th Grade Textbooks
Textbook Number of
Tasks
Number of Associated Sets
Tasks
Percent of Associated Sets Tasks
Engage NY 445 70 15.7% Open Up 211 59 28%
Utah Middle School Math Project 281 147 52.3%
Well-Chunked Measures
Well-Chunked Measures describes a commonly known rate, like miles per hour (Lamon,
1993). In this study, all of the textbooks devoted less than 30 percent of their problems to this
category. The 6th grade UMSMP textbook provided the greatest number of tasks to address this
category, 97 of 572 tasks, while having the greatest percentage of tasks, 17%. In contrast, the
Engage NY (n=61, 26.8%) provided the least number of tasks, 61 tasks, but the greatest
percentage, 26.8% of 228 tasks, of all the 6th grade textbooks. The Open Up (n=63, 18.8%)
textbook provided a two more tasks than the Engage NY textbook but an eight smaller
percentage of tasks for this category. Table 62 provides additional information related to this
category.
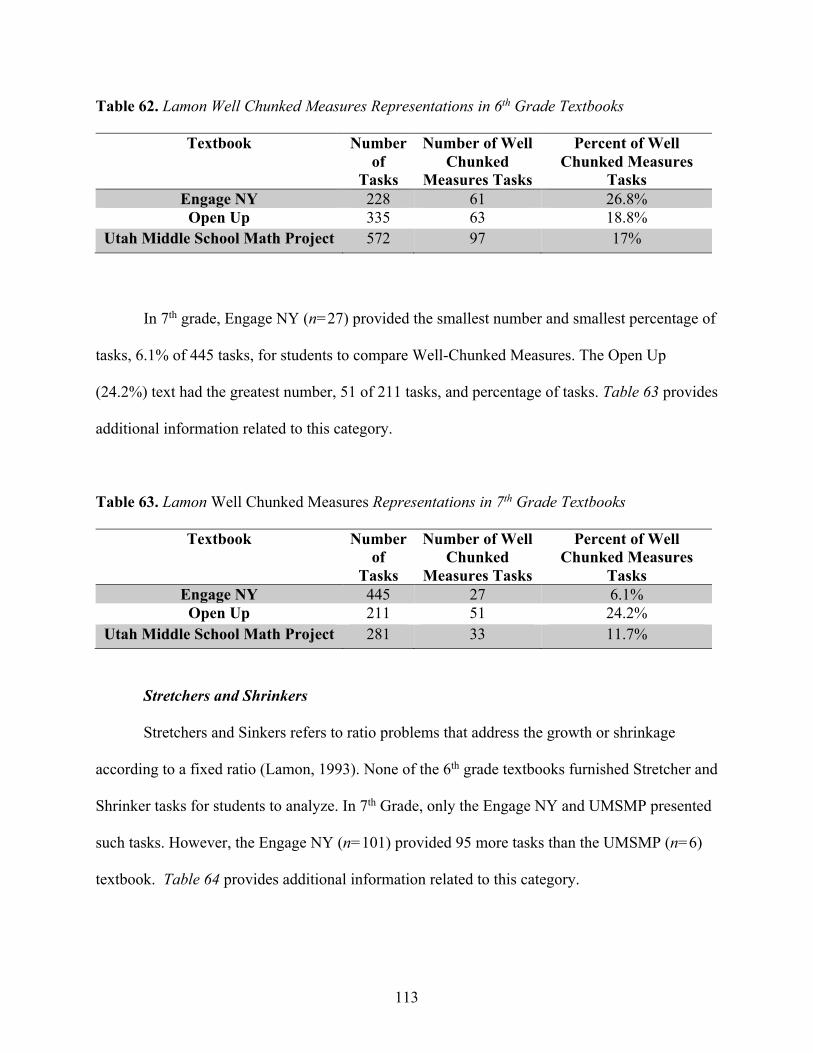
113
Table 62. Lamon Well Chunked Measures Representations in 6th Grade Textbooks
Textbook Number of
Tasks
Number of Well Chunked
Measures Tasks
Percent of Well Chunked Measures
Tasks Engage NY 228 61 26.8% Open Up 335 63 18.8%
Utah Middle School Math Project 572 97 17%
In 7th grade, Engage NY (n=27) provided the smallest number and smallest percentage of
tasks, 6.1% of 445 tasks, for students to compare Well-Chunked Measures. The Open Up
(24.2%) text had the greatest number, 51 of 211 tasks, and percentage of tasks. Table 63 provides
additional information related to this category.
Table 63. Lamon Well Chunked Measures Representations in 7th Grade Textbooks
Textbook Number of
Tasks
Number of Well Chunked
Measures Tasks
Percent of Well Chunked Measures
Tasks Engage NY 445 27 6.1% Open Up 211 51 24.2%
Utah Middle School Math Project 281 33 11.7%
Stretchers and Shrinkers
Stretchers and Sinkers refers to ratio problems that address the growth or shrinkage
according to a fixed ratio (Lamon, 1993). None of the 6th grade textbooks furnished Stretcher and
Shrinker tasks for students to analyze. In 7th Grade, only the Engage NY and UMSMP presented
such tasks. However, the Engage NY (n=101) provided 95 more tasks than the UMSMP (n=6)
textbook. Table 64 provides additional information related to this category.
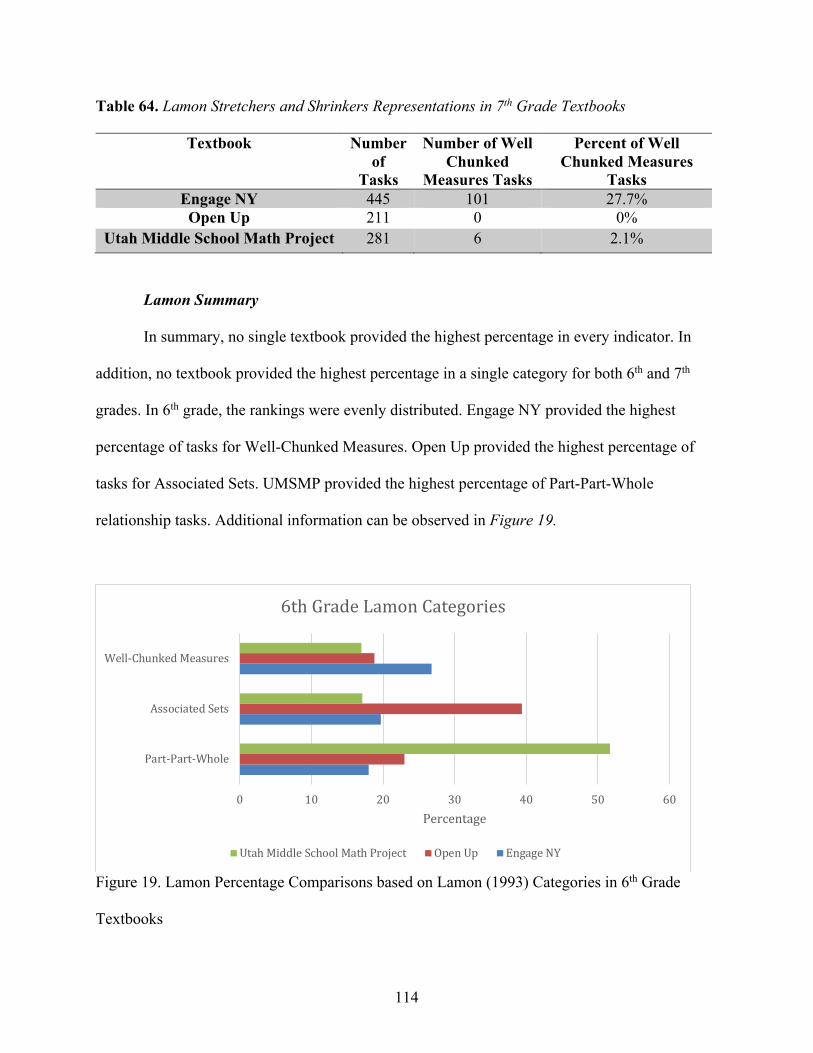
114
Table 64. Lamon Stretchers and Shrinkers Representations in 7th Grade Textbooks
Textbook Number of
Tasks
Number of Well Chunked
Measures Tasks
Percent of Well Chunked Measures
Tasks Engage NY 445 101 27.7% Open Up 211 0 0%
Utah Middle School Math Project 281 6 2.1%
Lamon Summary
In summary, no single textbook provided the highest percentage in every indicator. In
addition, no textbook provided the highest percentage in a single category for both 6th and 7th
grades. In 6th grade, the rankings were evenly distributed. Engage NY provided the highest
percentage of tasks for Well-Chunked Measures. Open Up provided the highest percentage of
tasks for Associated Sets. UMSMP provided the highest percentage of Part-Part-Whole
relationship tasks. Additional information can be observed in Figure 19.
Figure 19. Lamon Percentage Comparisons based on Lamon (1993) Categories in 6th Grade
Textbooks
0 10 20 30 40 50 60
Part-Part-Whole
AssociatedSets
Well-ChunkedMeasures
Percentage
6thGradeLamonCategories
UtahMiddleSchoolMathProject OpenUp EngageNY
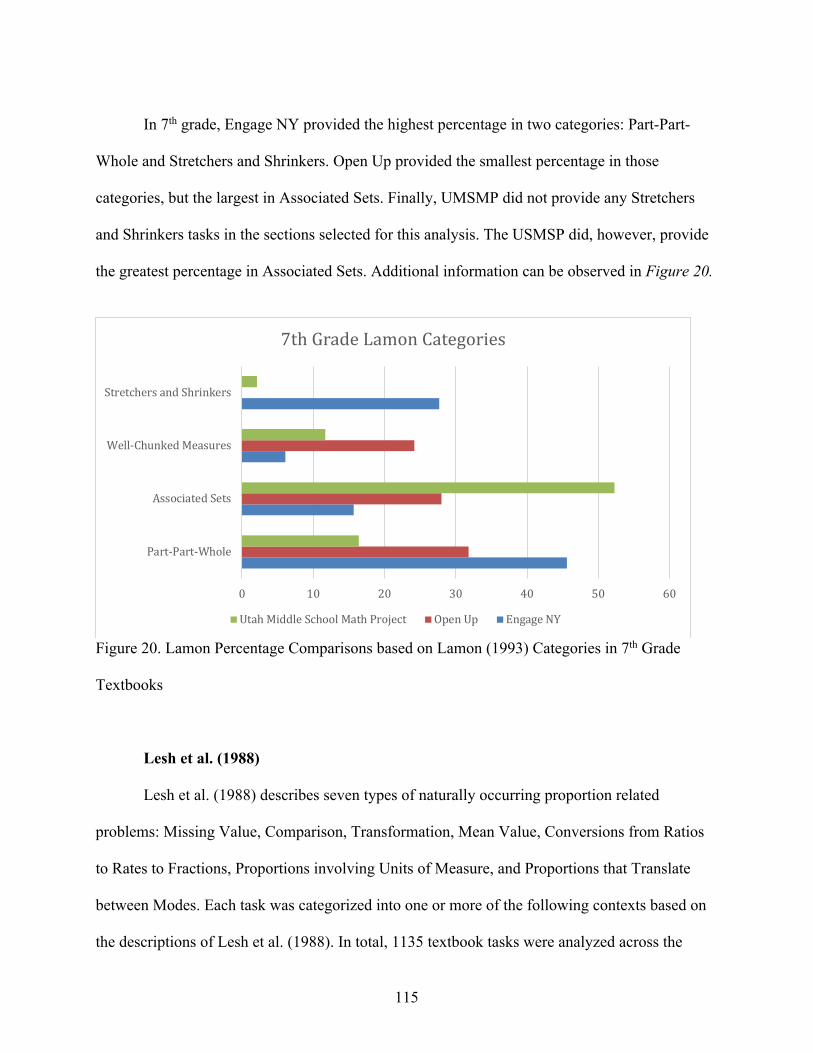
115
In 7th grade, Engage NY provided the highest percentage in two categories: Part-Part-
Whole and Stretchers and Shrinkers. Open Up provided the smallest percentage in those
categories, but the largest in Associated Sets. Finally, UMSMP did not provide any Stretchers
and Shrinkers tasks in the sections selected for this analysis. The USMSP did, however, provide
the greatest percentage in Associated Sets. Additional information can be observed in Figure 20.
Figure 20. Lamon Percentage Comparisons based on Lamon (1993) Categories in 7th Grade
Textbooks
Lesh et al. (1988)
Lesh et al. (1988) describes seven types of naturally occurring proportion related
problems: Missing Value, Comparison, Transformation, Mean Value, Conversions from Ratios
to Rates to Fractions, Proportions involving Units of Measure, and Proportions that Translate
between Modes. Each task was categorized into one or more of the following contexts based on
the descriptions of Lesh et al. (1988). In total, 1135 textbook tasks were analyzed across the
0 10 20 30 40 50 60
Part-Part-Whole
AssociatedSets
Well-ChunkedMeasures
StretchersandShrinkers
7thGradeLamonCategories
UtahMiddleSchoolMathProject OpenUp EngageNY
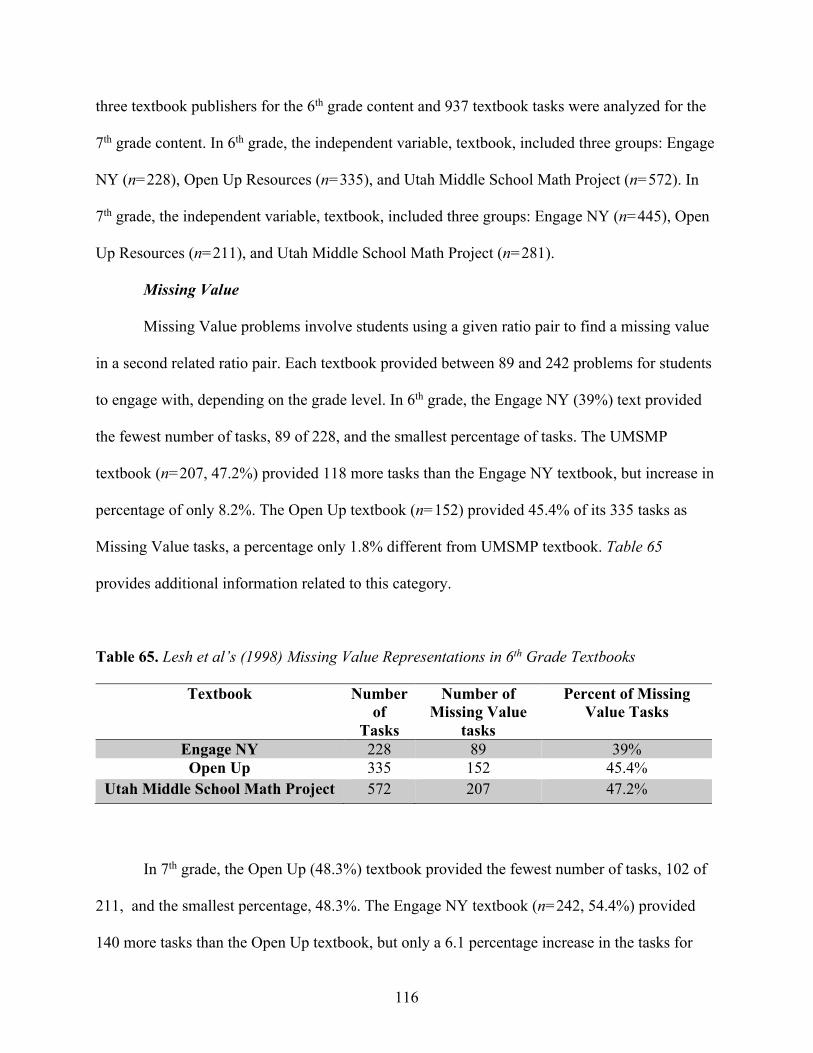
116
three textbook publishers for the 6th grade content and 937 textbook tasks were analyzed for the
7th grade content. In 6th grade, the independent variable, textbook, included three groups: Engage
NY (n=228), Open Up Resources (n=335), and Utah Middle School Math Project (n=572). In
7th grade, the independent variable, textbook, included three groups: Engage NY (n=445), Open
Up Resources (n=211), and Utah Middle School Math Project (n=281).
Missing Value
Missing Value problems involve students using a given ratio pair to find a missing value
in a second related ratio pair. Each textbook provided between 89 and 242 problems for students
to engage with, depending on the grade level. In 6th grade, the Engage NY (39%) text provided
the fewest number of tasks, 89 of 228, and the smallest percentage of tasks. The UMSMP
textbook (n=207, 47.2%) provided 118 more tasks than the Engage NY textbook, but increase in
percentage of only 8.2%. The Open Up textbook (n=152) provided 45.4% of its 335 tasks as
Missing Value tasks, a percentage only 1.8% different from UMSMP textbook. Table 65
provides additional information related to this category.
Table 65. Lesh et al’s (1998) Missing Value Representations in 6th Grade Textbooks
Textbook Number of
Tasks
Number of Missing Value
tasks
Percent of Missing Value Tasks
Engage NY 228 89 39% Open Up 335 152 45.4%
Utah Middle School Math Project 572 207 47.2%
In 7th grade, the Open Up (48.3%) textbook provided the fewest number of tasks, 102 of
211, and the smallest percentage, 48.3%. The Engage NY textbook (n=242, 54.4%) provided
140 more tasks than the Open Up textbook, but only a 6.1 percentage increase in the tasks for
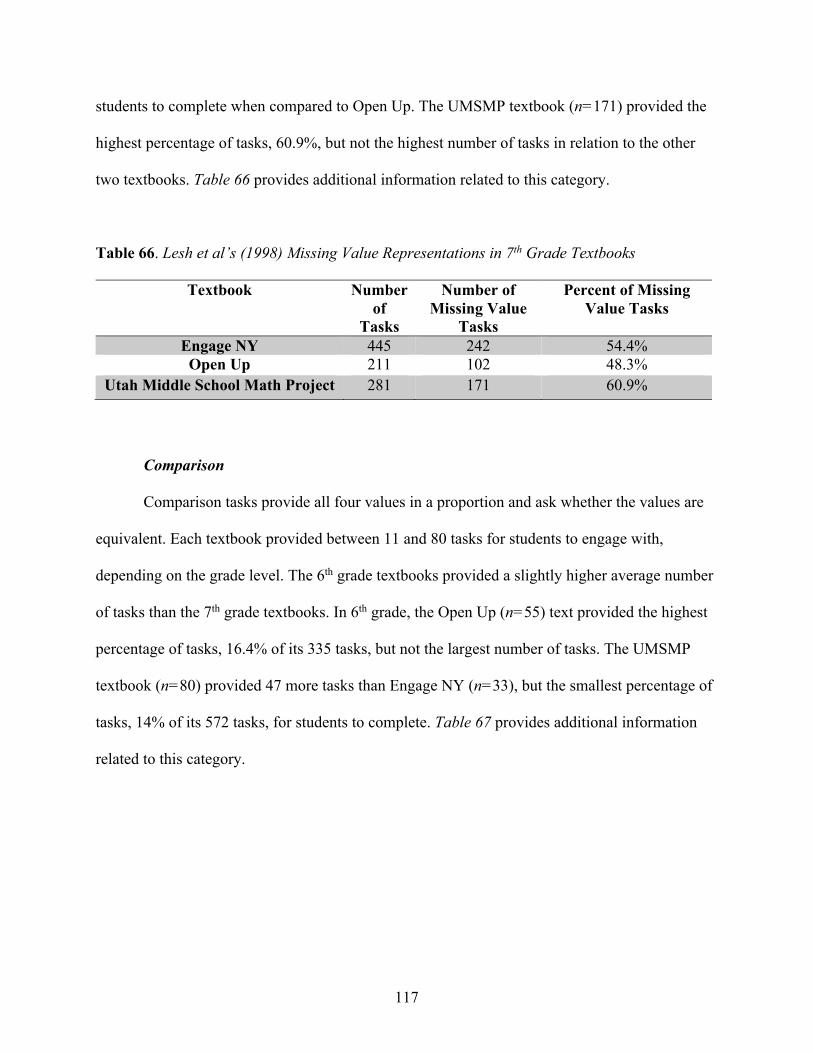
117
students to complete when compared to Open Up. The UMSMP textbook (n=171) provided the
highest percentage of tasks, 60.9%, but not the highest number of tasks in relation to the other
two textbooks. Table 66 provides additional information related to this category.
Table 66. Lesh et al’s (1998) Missing Value Representations in 7th Grade Textbooks
Textbook Number of
Tasks
Number of Missing Value
Tasks
Percent of Missing Value Tasks
Engage NY 445 242 54.4% Open Up 211 102 48.3%
Utah Middle School Math Project 281 171 60.9%
Comparison
Comparison tasks provide all four values in a proportion and ask whether the values are
equivalent. Each textbook provided between 11 and 80 tasks for students to engage with,
depending on the grade level. The 6th grade textbooks provided a slightly higher average number
of tasks than the 7th grade textbooks. In 6th grade, the Open Up (n=55) text provided the highest
percentage of tasks, 16.4% of its 335 tasks, but not the largest number of tasks. The UMSMP
textbook (n=80) provided 47 more tasks than Engage NY (n=33), but the smallest percentage of
tasks, 14% of its 572 tasks, for students to complete. Table 67 provides additional information
related to this category.
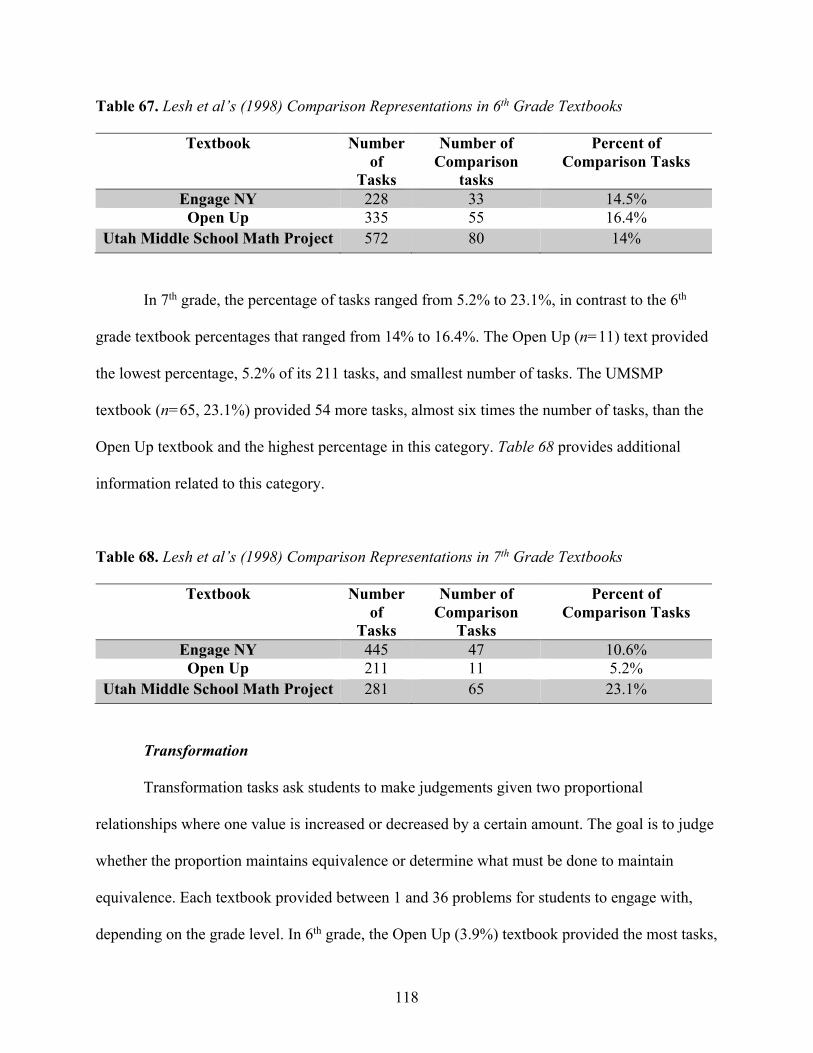
118
Table 67. Lesh et al’s (1998) Comparison Representations in 6th Grade Textbooks
Textbook Number of
Tasks
Number of Comparison
tasks
Percent of Comparison Tasks
Engage NY 228 33 14.5% Open Up 335 55 16.4%
Utah Middle School Math Project 572 80 14%
In 7th grade, the percentage of tasks ranged from 5.2% to 23.1%, in contrast to the 6th
grade textbook percentages that ranged from 14% to 16.4%. The Open Up (n=11) text provided
the lowest percentage, 5.2% of its 211 tasks, and smallest number of tasks. The UMSMP
textbook (n=65, 23.1%) provided 54 more tasks, almost six times the number of tasks, than the
Open Up textbook and the highest percentage in this category. Table 68 provides additional
information related to this category.
Table 68. Lesh et al’s (1998) Comparison Representations in 7th Grade Textbooks
Textbook Number of
Tasks
Number of Comparison
Tasks
Percent of Comparison Tasks
Engage NY 445 47 10.6% Open Up 211 11 5.2%
Utah Middle School Math Project 281 65 23.1%
Transformation
Transformation tasks ask students to make judgements given two proportional
relationships where one value is increased or decreased by a certain amount. The goal is to judge
whether the proportion maintains equivalence or determine what must be done to maintain
equivalence. Each textbook provided between 1 and 36 problems for students to engage with,
depending on the grade level. In 6th grade, the Open Up (3.9%) textbook provided the most tasks,
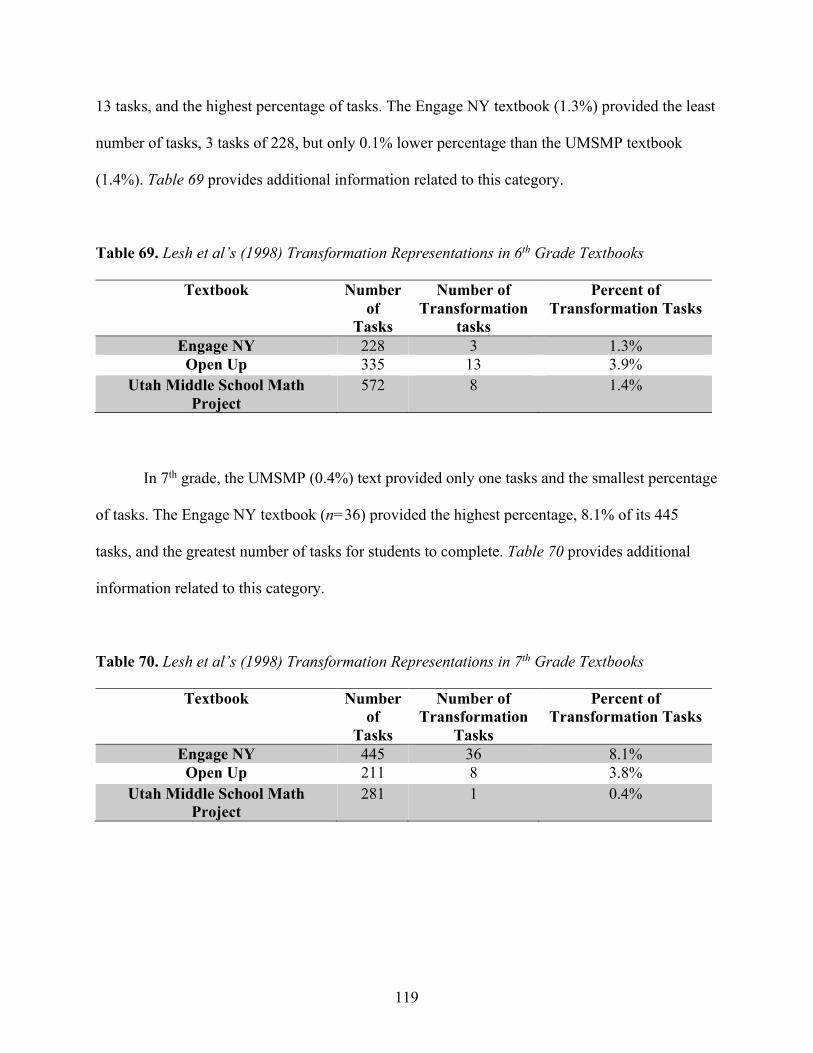
119
13 tasks, and the highest percentage of tasks. The Engage NY textbook (1.3%) provided the least
number of tasks, 3 tasks of 228, but only 0.1% lower percentage than the UMSMP textbook
(1.4%). Table 69 provides additional information related to this category.
Table 69. Lesh et al’s (1998) Transformation Representations in 6th Grade Textbooks
Textbook Number of
Tasks
Number of Transformation
tasks
Percent of Transformation Tasks
Engage NY 228 3 1.3% Open Up 335 13 3.9%
Utah Middle School Math Project
572 8 1.4%
In 7th grade, the UMSMP (0.4%) text provided only one tasks and the smallest percentage
of tasks. The Engage NY textbook (n=36) provided the highest percentage, 8.1% of its 445
tasks, and the greatest number of tasks for students to complete. Table 70 provides additional
information related to this category.
Table 70. Lesh et al’s (1998) Transformation Representations in 7th Grade Textbooks
Textbook Number of
Tasks
Number of Transformation
Tasks
Percent of Transformation Tasks
Engage NY 445 36 8.1% Open Up 211 8 3.8%
Utah Middle School Math Project
281 1 0.4%
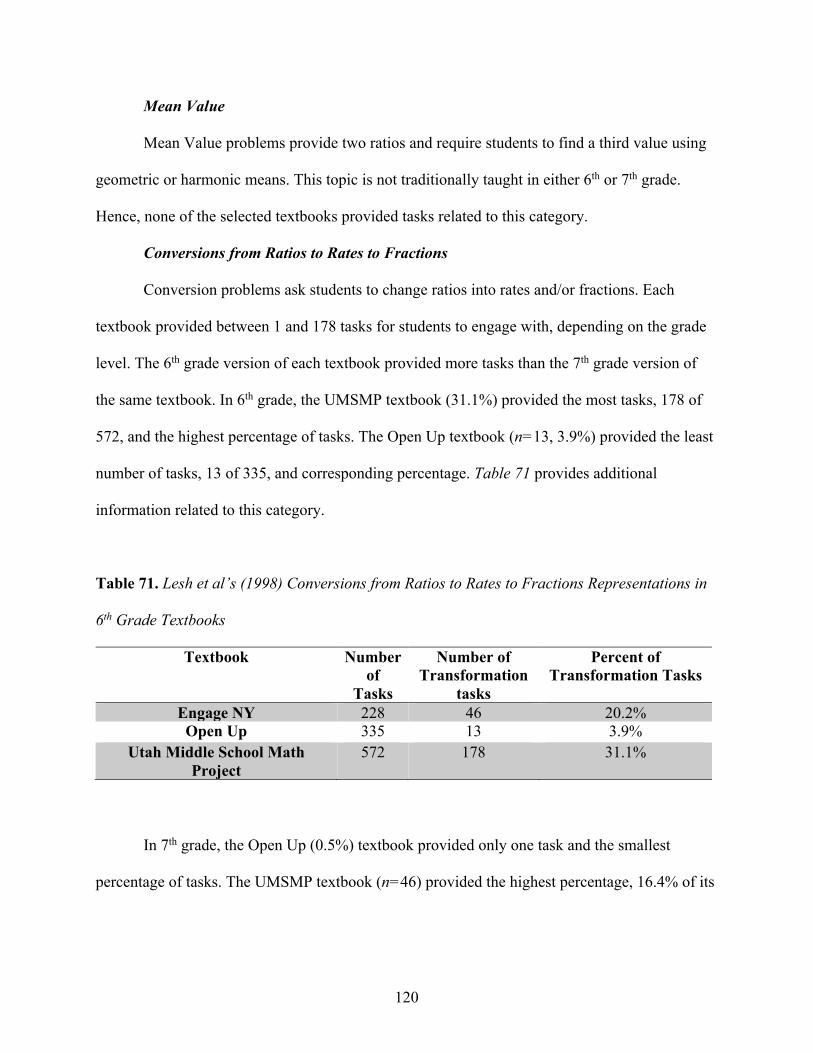
120
Mean Value
Mean Value problems provide two ratios and require students to find a third value using
geometric or harmonic means. This topic is not traditionally taught in either 6th or 7th grade.
Hence, none of the selected textbooks provided tasks related to this category.
Conversions from Ratios to Rates to Fractions
Conversion problems ask students to change ratios into rates and/or fractions. Each
textbook provided between 1 and 178 tasks for students to engage with, depending on the grade
level. The 6th grade version of each textbook provided more tasks than the 7th grade version of
the same textbook. In 6th grade, the UMSMP textbook (31.1%) provided the most tasks, 178 of
572, and the highest percentage of tasks. The Open Up textbook (n=13, 3.9%) provided the least
number of tasks, 13 of 335, and corresponding percentage. Table 71 provides additional
information related to this category.
Table 71. Lesh et al’s (1998) Conversions from Ratios to Rates to Fractions Representations in
6th Grade Textbooks
Textbook Number of
Tasks
Number of Transformation
tasks
Percent of Transformation Tasks
Engage NY 228 46 20.2% Open Up 335 13 3.9%
Utah Middle School Math Project
572 178 31.1%
In 7th grade, the Open Up (0.5%) textbook provided only one task and the smallest
percentage of tasks. The UMSMP textbook (n=46) provided the highest percentage, 16.4% of its
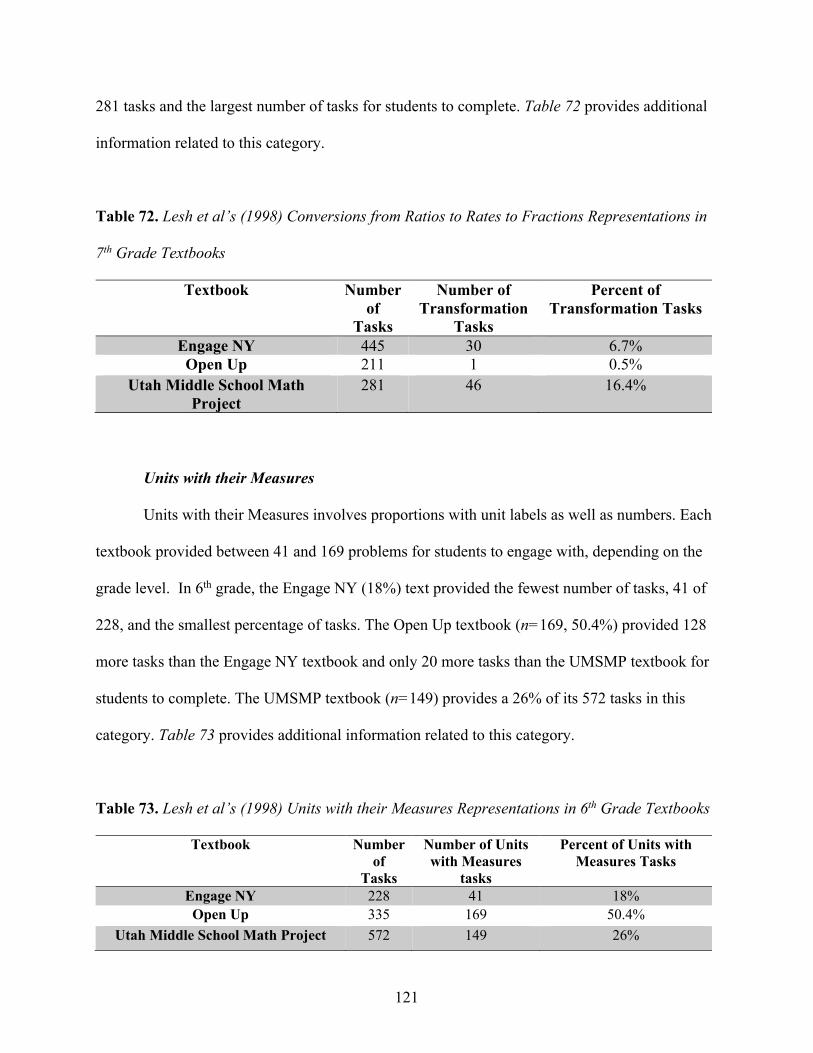
121
281 tasks and the largest number of tasks for students to complete. Table 72 provides additional
information related to this category.
Table 72. Lesh et al’s (1998) Conversions from Ratios to Rates to Fractions Representations in
7th Grade Textbooks
Textbook Number of
Tasks
Number of Transformation
Tasks
Percent of Transformation Tasks
Engage NY 445 30 6.7% Open Up 211 1 0.5%
Utah Middle School Math Project
281 46 16.4%
Units with their Measures
Units with their Measures involves proportions with unit labels as well as numbers. Each
textbook provided between 41 and 169 problems for students to engage with, depending on the
grade level. In 6th grade, the Engage NY (18%) text provided the fewest number of tasks, 41 of
228, and the smallest percentage of tasks. The Open Up textbook (n=169, 50.4%) provided 128
more tasks than the Engage NY textbook and only 20 more tasks than the UMSMP textbook for
students to complete. The UMSMP textbook (n=149) provides a 26% of its 572 tasks in this
category. Table 73 provides additional information related to this category.
Table 73. Lesh et al’s (1998) Units with their Measures Representations in 6th Grade Textbooks
Textbook Number of
Tasks
Number of Units with Measures
tasks
Percent of Units with Measures Tasks
Engage NY 228 41 18% Open Up 335 169 50.4%
Utah Middle School Math Project 572 149 26%
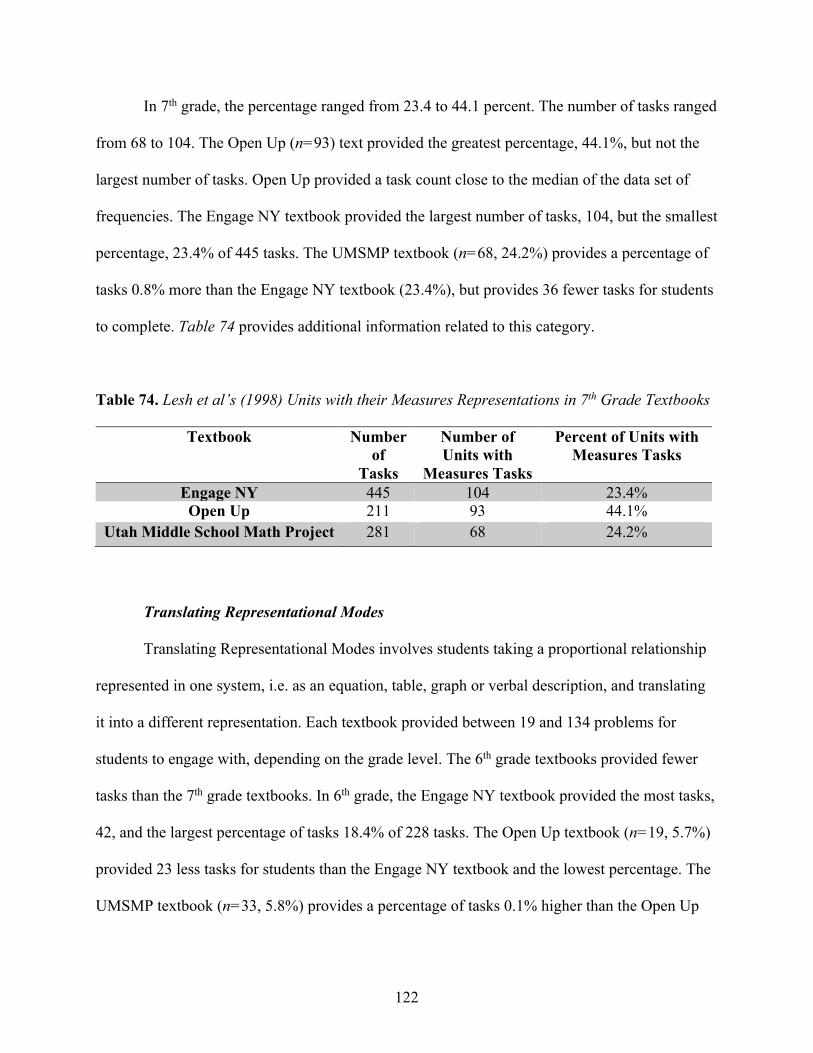
122
In 7th grade, the percentage ranged from 23.4 to 44.1 percent. The number of tasks ranged
from 68 to 104. The Open Up (n=93) text provided the greatest percentage, 44.1%, but not the
largest number of tasks. Open Up provided a task count close to the median of the data set of
frequencies. The Engage NY textbook provided the largest number of tasks, 104, but the smallest
percentage, 23.4% of 445 tasks. The UMSMP textbook (n=68, 24.2%) provides a percentage of
tasks 0.8% more than the Engage NY textbook (23.4%), but provides 36 fewer tasks for students
to complete. Table 74 provides additional information related to this category.
Table 74. Lesh et al’s (1998) Units with their Measures Representations in 7th Grade Textbooks
Textbook Number of
Tasks
Number of Units with
Measures Tasks
Percent of Units with Measures Tasks
Engage NY 445 104 23.4% Open Up 211 93 44.1%
Utah Middle School Math Project 281 68 24.2%
Translating Representational Modes
Translating Representational Modes involves students taking a proportional relationship
represented in one system, i.e. as an equation, table, graph or verbal description, and translating
it into a different representation. Each textbook provided between 19 and 134 problems for
students to engage with, depending on the grade level. The 6th grade textbooks provided fewer
tasks than the 7th grade textbooks. In 6th grade, the Engage NY textbook provided the most tasks,
42, and the largest percentage of tasks 18.4% of 228 tasks. The Open Up textbook (n=19, 5.7%)
provided 23 less tasks for students than the Engage NY textbook and the lowest percentage. The
UMSMP textbook (n=33, 5.8%) provides a percentage of tasks 0.1% higher than the Open Up
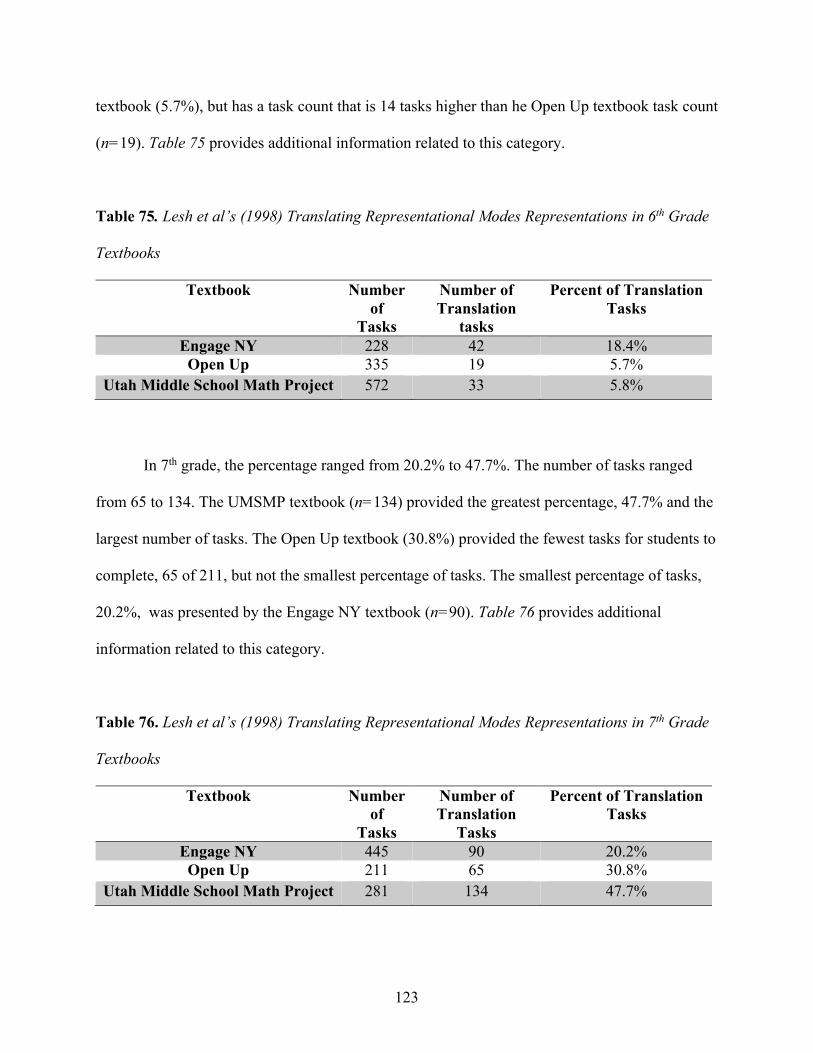
123
textbook (5.7%), but has a task count that is 14 tasks higher than he Open Up textbook task count
(n=19). Table 75 provides additional information related to this category.
Table 75. Lesh et al’s (1998) Translating Representational Modes Representations in 6th Grade
Textbooks
Textbook Number of
Tasks
Number of Translation
tasks
Percent of Translation Tasks
Engage NY 228 42 18.4% Open Up 335 19 5.7%
Utah Middle School Math Project 572 33 5.8%
In 7th grade, the percentage ranged from 20.2% to 47.7%. The number of tasks ranged
from 65 to 134. The UMSMP textbook (n=134) provided the greatest percentage, 47.7% and the
largest number of tasks. The Open Up textbook (30.8%) provided the fewest tasks for students to
complete, 65 of 211, but not the smallest percentage of tasks. The smallest percentage of tasks,
20.2%, was presented by the Engage NY textbook (n=90). Table 76 provides additional
information related to this category.
Table 76. Lesh et al’s (1998) Translating Representational Modes Representations in 7th Grade
Textbooks
Textbook Number of
Tasks
Number of Translation
Tasks
Percent of Translation Tasks
Engage NY 445 90 20.2% Open Up 211 65 30.8%
Utah Middle School Math Project 281 134 47.7%
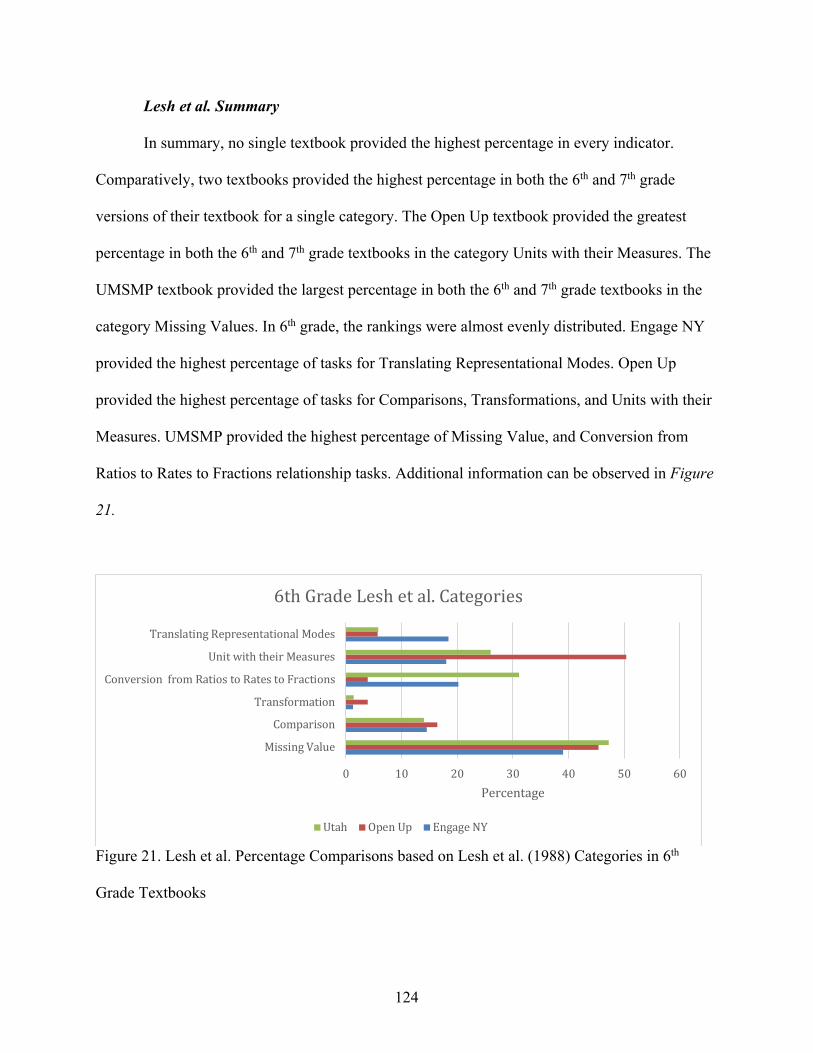
124
Lesh et al. Summary
In summary, no single textbook provided the highest percentage in every indicator.
Comparatively, two textbooks provided the highest percentage in both the 6th and 7th grade
versions of their textbook for a single category. The Open Up textbook provided the greatest
percentage in both the 6th and 7th grade textbooks in the category Units with their Measures. The
UMSMP textbook provided the largest percentage in both the 6th and 7th grade textbooks in the
category Missing Values. In 6th grade, the rankings were almost evenly distributed. Engage NY
provided the highest percentage of tasks for Translating Representational Modes. Open Up
provided the highest percentage of tasks for Comparisons, Transformations, and Units with their
Measures. UMSMP provided the highest percentage of Missing Value, and Conversion from
Ratios to Rates to Fractions relationship tasks. Additional information can be observed in Figure
21.
Figure 21. Lesh et al. Percentage Comparisons based on Lesh et al. (1988) Categories in 6th
Grade Textbooks
0 10 20 30 40 50 60
MissingValue
Comparison
Transformation
ConversionfromRatiostoRatestoFractions
UnitwiththeirMeasures
TranslatingRepresentationalModes
Percentage
6thGradeLeshetal.Categories
Utah OpenUp EngageNY
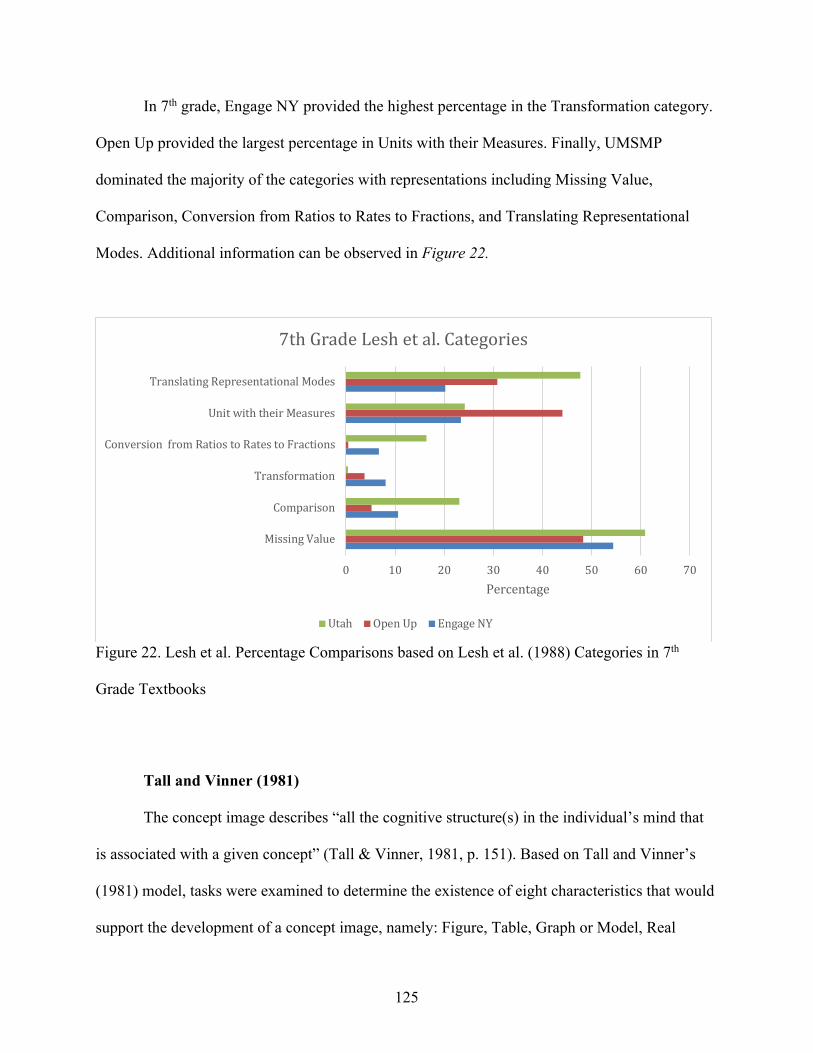
125
In 7th grade, Engage NY provided the highest percentage in the Transformation category.
Open Up provided the largest percentage in Units with their Measures. Finally, UMSMP
dominated the majority of the categories with representations including Missing Value,
Comparison, Conversion from Ratios to Rates to Fractions, and Translating Representational
Modes. Additional information can be observed in Figure 22.
Figure 22. Lesh et al. Percentage Comparisons based on Lesh et al. (1988) Categories in 7th
Grade Textbooks
Tall and Vinner (1981)
The concept image describes “all the cognitive structure(s) in the individual’s mind that
is associated with a given concept” (Tall & Vinner, 1981, p. 151). Based on Tall and Vinner’s
(1981) model, tasks were examined to determine the existence of eight characteristics that would
support the development of a concept image, namely: Figure, Table, Graph or Model, Real
0 10 20 30 40 50 60 70
MissingValue
Comparison
Transformation
ConversionfromRatiostoRatestoFractions
UnitwiththeirMeasures
TranslatingRepresentationalModes
Percentage
7thGradeLeshetal.Categories
Utah OpenUp EngageNY
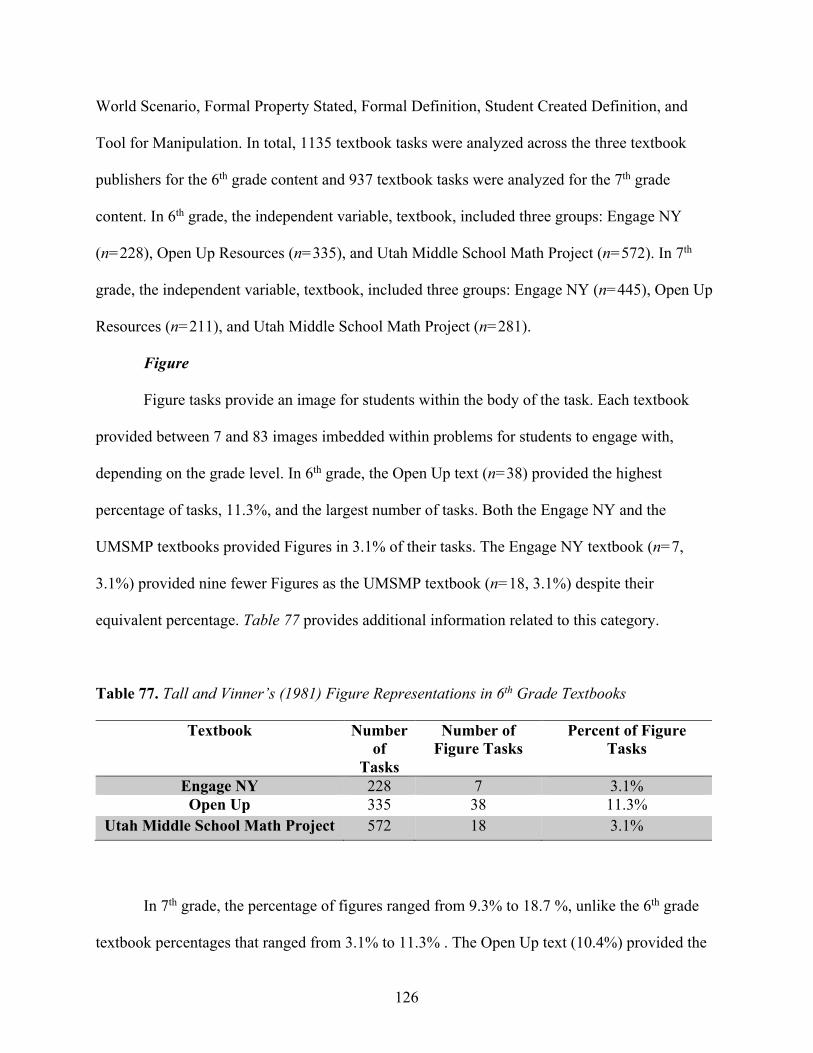
126
World Scenario, Formal Property Stated, Formal Definition, Student Created Definition, and
Tool for Manipulation. In total, 1135 textbook tasks were analyzed across the three textbook
publishers for the 6th grade content and 937 textbook tasks were analyzed for the 7th grade
content. In 6th grade, the independent variable, textbook, included three groups: Engage NY
(n=228), Open Up Resources (n=335), and Utah Middle School Math Project (n=572). In 7th
grade, the independent variable, textbook, included three groups: Engage NY (n=445), Open Up
Resources (n=211), and Utah Middle School Math Project (n=281).
Figure
Figure tasks provide an image for students within the body of the task. Each textbook
provided between 7 and 83 images imbedded within problems for students to engage with,
depending on the grade level. In 6th grade, the Open Up text (n=38) provided the highest
percentage of tasks, 11.3%, and the largest number of tasks. Both the Engage NY and the
UMSMP textbooks provided Figures in 3.1% of their tasks. The Engage NY textbook (n=7,
3.1%) provided nine fewer Figures as the UMSMP textbook (n=18, 3.1%) despite their
equivalent percentage. Table 77 provides additional information related to this category.
Table 77. Tall and Vinner’s (1981) Figure Representations in 6th Grade Textbooks
Textbook Number of
Tasks
Number of Figure Tasks
Percent of Figure Tasks
Engage NY 228 7 3.1% Open Up 335 38 11.3%
Utah Middle School Math Project 572 18 3.1%
In 7th grade, the percentage of figures ranged from 9.3% to 18.7 %, unlike the 6th grade
textbook percentages that ranged from 3.1% to 11.3% . The Open Up text (10.4%) provided the
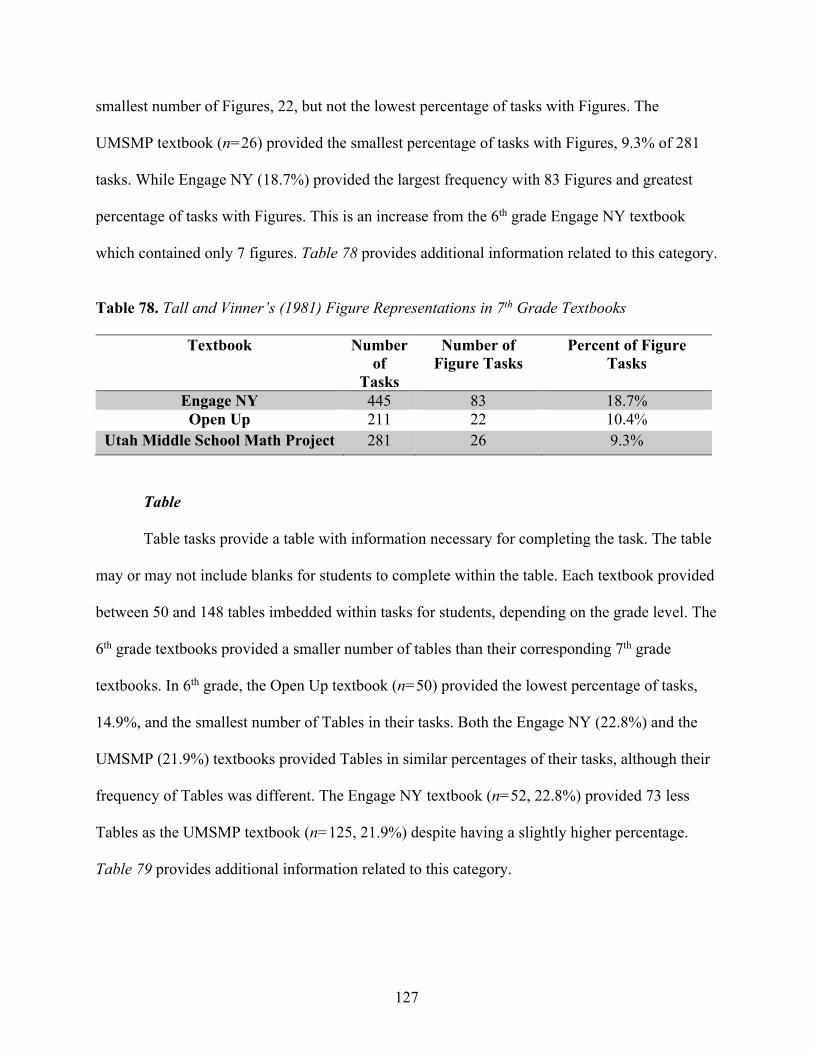
127
smallest number of Figures, 22, but not the lowest percentage of tasks with Figures. The
UMSMP textbook (n=26) provided the smallest percentage of tasks with Figures, 9.3% of 281
tasks. While Engage NY (18.7%) provided the largest frequency with 83 Figures and greatest
percentage of tasks with Figures. This is an increase from the 6th grade Engage NY textbook
which contained only 7 figures. Table 78 provides additional information related to this category.
Table 78. Tall and Vinner’s (1981) Figure Representations in 7th Grade Textbooks
Textbook Number of
Tasks
Number of Figure Tasks
Percent of Figure Tasks
Engage NY 445 83 18.7% Open Up 211 22 10.4%
Utah Middle School Math Project 281 26 9.3%
Table
Table tasks provide a table with information necessary for completing the task. The table
may or may not include blanks for students to complete within the table. Each textbook provided
between 50 and 148 tables imbedded within tasks for students, depending on the grade level. The
6th grade textbooks provided a smaller number of tables than their corresponding 7th grade
textbooks. In 6th grade, the Open Up textbook (n=50) provided the lowest percentage of tasks,
14.9%, and the smallest number of Tables in their tasks. Both the Engage NY (22.8%) and the
UMSMP (21.9%) textbooks provided Tables in similar percentages of their tasks, although their
frequency of Tables was different. The Engage NY textbook (n=52, 22.8%) provided 73 less
Tables as the UMSMP textbook (n=125, 21.9%) despite having a slightly higher percentage.
Table 79 provides additional information related to this category.
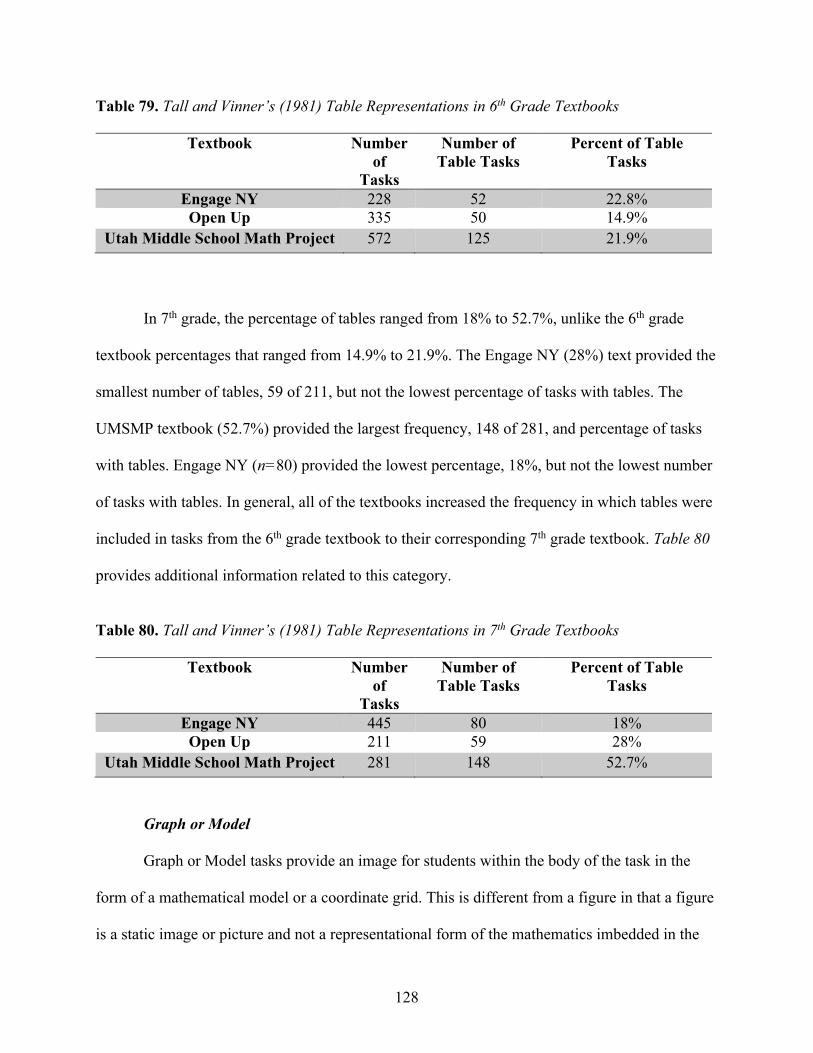
128
Table 79. Tall and Vinner’s (1981) Table Representations in 6th Grade Textbooks
Textbook Number of
Tasks
Number of Table Tasks
Percent of Table Tasks
Engage NY 228 52 22.8% Open Up 335 50 14.9%
Utah Middle School Math Project 572 125 21.9%
In 7th grade, the percentage of tables ranged from 18% to 52.7%, unlike the 6th grade
textbook percentages that ranged from 14.9% to 21.9%. The Engage NY (28%) text provided the
smallest number of tables, 59 of 211, but not the lowest percentage of tasks with tables. The
UMSMP textbook (52.7%) provided the largest frequency, 148 of 281, and percentage of tasks
with tables. Engage NY (n=80) provided the lowest percentage, 18%, but not the lowest number
of tasks with tables. In general, all of the textbooks increased the frequency in which tables were
included in tasks from the 6th grade textbook to their corresponding 7th grade textbook. Table 80
provides additional information related to this category.
Table 80. Tall and Vinner’s (1981) Table Representations in 7th Grade Textbooks
Textbook Number of
Tasks
Number of Table Tasks
Percent of Table Tasks
Engage NY 445 80 18% Open Up 211 59 28%
Utah Middle School Math Project 281 148 52.7%
Graph or Model
Graph or Model tasks provide an image for students within the body of the task in the
form of a mathematical model or a coordinate grid. This is different from a figure in that a figure
is a static image or picture and not a representational form of the mathematics imbedded in the
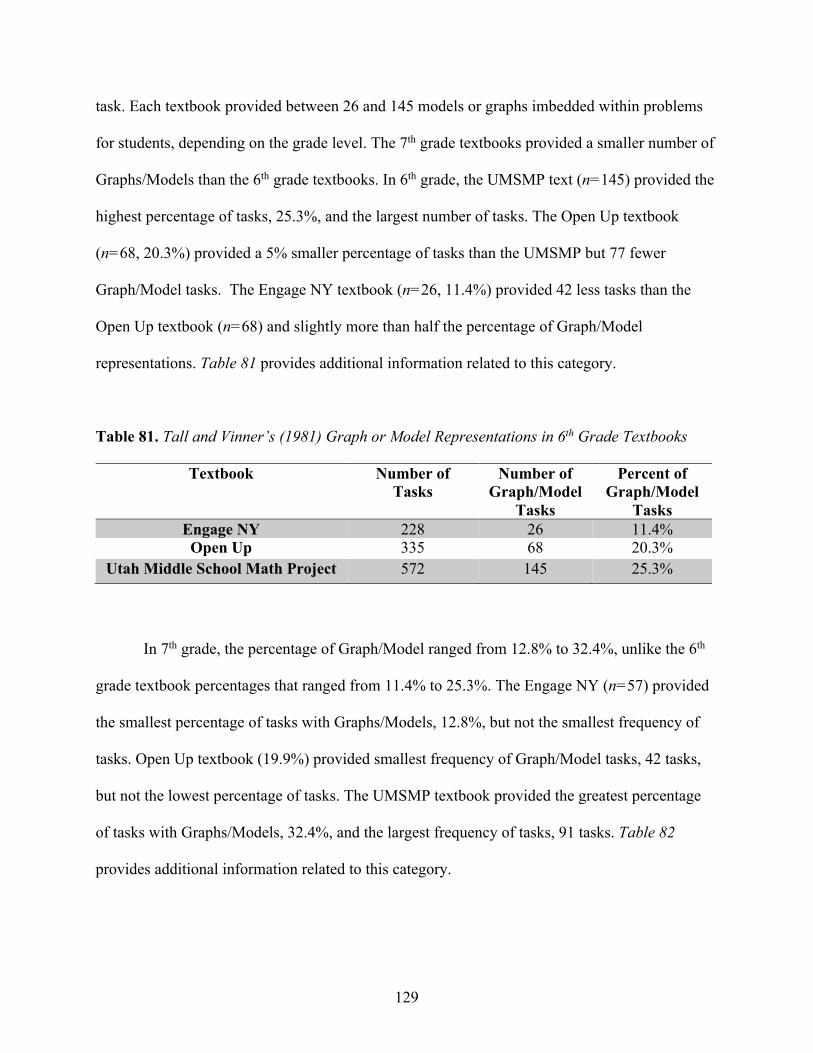
129
task. Each textbook provided between 26 and 145 models or graphs imbedded within problems
for students, depending on the grade level. The 7th grade textbooks provided a smaller number of
Graphs/Models than the 6th grade textbooks. In 6th grade, the UMSMP text (n=145) provided the
highest percentage of tasks, 25.3%, and the largest number of tasks. The Open Up textbook
(n=68, 20.3%) provided a 5% smaller percentage of tasks than the UMSMP but 77 fewer
Graph/Model tasks. The Engage NY textbook (n=26, 11.4%) provided 42 less tasks than the
Open Up textbook (n=68) and slightly more than half the percentage of Graph/Model
representations. Table 81 provides additional information related to this category.
Table 81. Tall and Vinner’s (1981) Graph or Model Representations in 6th Grade Textbooks
Textbook Number of Tasks
Number of Graph/Model
Tasks
Percent of Graph/Model
Tasks Engage NY 228 26 11.4% Open Up 335 68 20.3%
Utah Middle School Math Project 572 145 25.3%
In 7th grade, the percentage of Graph/Model ranged from 12.8% to 32.4%, unlike the 6th
grade textbook percentages that ranged from 11.4% to 25.3%. The Engage NY (n=57) provided
the smallest percentage of tasks with Graphs/Models, 12.8%, but not the smallest frequency of
tasks. Open Up textbook (19.9%) provided smallest frequency of Graph/Model tasks, 42 tasks,
but not the lowest percentage of tasks. The UMSMP textbook provided the greatest percentage
of tasks with Graphs/Models, 32.4%, and the largest frequency of tasks, 91 tasks. Table 82
provides additional information related to this category.
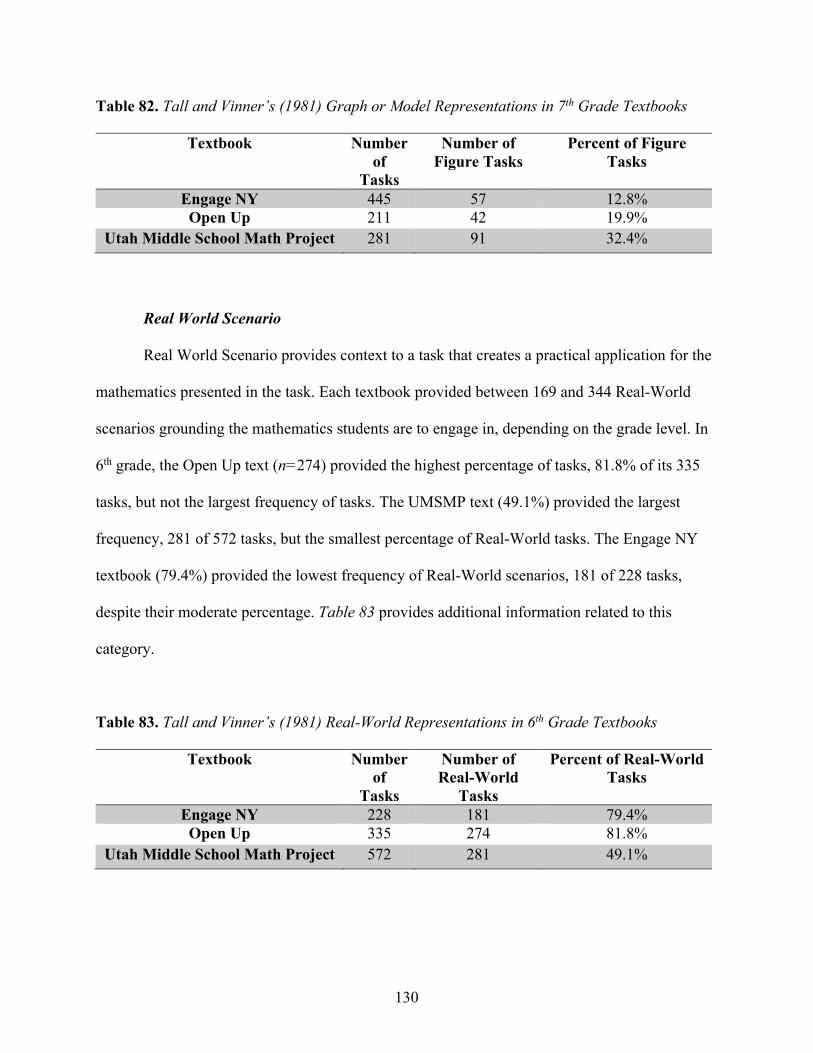
130
Table 82. Tall and Vinner’s (1981) Graph or Model Representations in 7th Grade Textbooks
Textbook Number of
Tasks
Number of Figure Tasks
Percent of Figure Tasks
Engage NY 445 57 12.8% Open Up 211 42 19.9%
Utah Middle School Math Project 281 91 32.4%
Real World Scenario
Real World Scenario provides context to a task that creates a practical application for the
mathematics presented in the task. Each textbook provided between 169 and 344 Real-World
scenarios grounding the mathematics students are to engage in, depending on the grade level. In
6th grade, the Open Up text (n=274) provided the highest percentage of tasks, 81.8% of its 335
tasks, but not the largest frequency of tasks. The UMSMP text (49.1%) provided the largest
frequency, 281 of 572 tasks, but the smallest percentage of Real-World tasks. The Engage NY
textbook (79.4%) provided the lowest frequency of Real-World scenarios, 181 of 228 tasks,
despite their moderate percentage. Table 83 provides additional information related to this
category.
Table 83. Tall and Vinner’s (1981) Real-World Representations in 6th Grade Textbooks
Textbook Number of
Tasks
Number of Real-World
Tasks
Percent of Real-World Tasks
Engage NY 228 181 79.4% Open Up 335 274 81.8%
Utah Middle School Math Project 572 281 49.1%
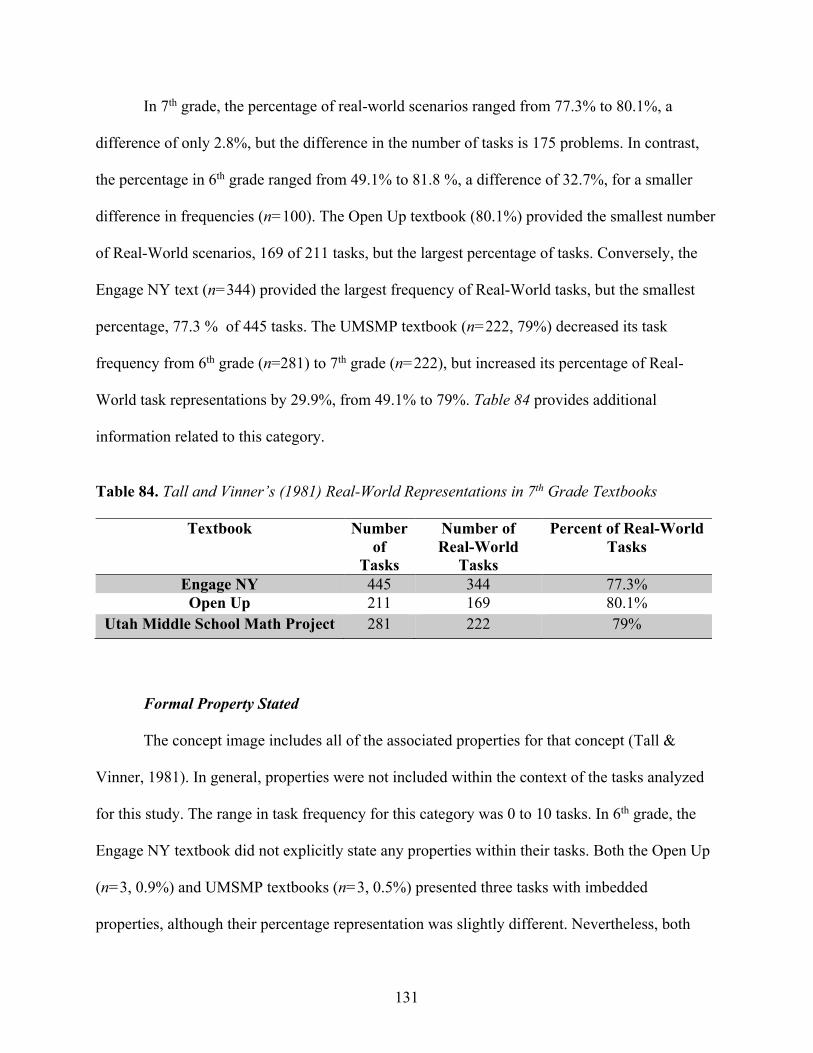
131
In 7th grade, the percentage of real-world scenarios ranged from 77.3% to 80.1%, a
difference of only 2.8%, but the difference in the number of tasks is 175 problems. In contrast,
the percentage in 6th grade ranged from 49.1% to 81.8 %, a difference of 32.7%, for a smaller
difference in frequencies (n=100). The Open Up textbook (80.1%) provided the smallest number
of Real-World scenarios, 169 of 211 tasks, but the largest percentage of tasks. Conversely, the
Engage NY text (n=344) provided the largest frequency of Real-World tasks, but the smallest
percentage, 77.3 % of 445 tasks. The UMSMP textbook (n=222, 79%) decreased its task
frequency from 6th grade (n=281) to 7th grade (n=222), but increased its percentage of Real-
World task representations by 29.9%, from 49.1% to 79%. Table 84 provides additional
information related to this category.
Table 84. Tall and Vinner’s (1981) Real-World Representations in 7th Grade Textbooks
Textbook Number of
Tasks
Number of Real-World
Tasks
Percent of Real-World Tasks
Engage NY 445 344 77.3% Open Up 211 169 80.1%
Utah Middle School Math Project 281 222 79%
Formal Property Stated
The concept image includes all of the associated properties for that concept (Tall &
Vinner, 1981). In general, properties were not included within the context of the tasks analyzed
for this study. The range in task frequency for this category was 0 to 10 tasks. In 6th grade, the
Engage NY textbook did not explicitly state any properties within their tasks. Both the Open Up
(n=3, 0.9%) and UMSMP textbooks (n=3, 0.5%) presented three tasks with imbedded
properties, although their percentage representation was slightly different. Nevertheless, both
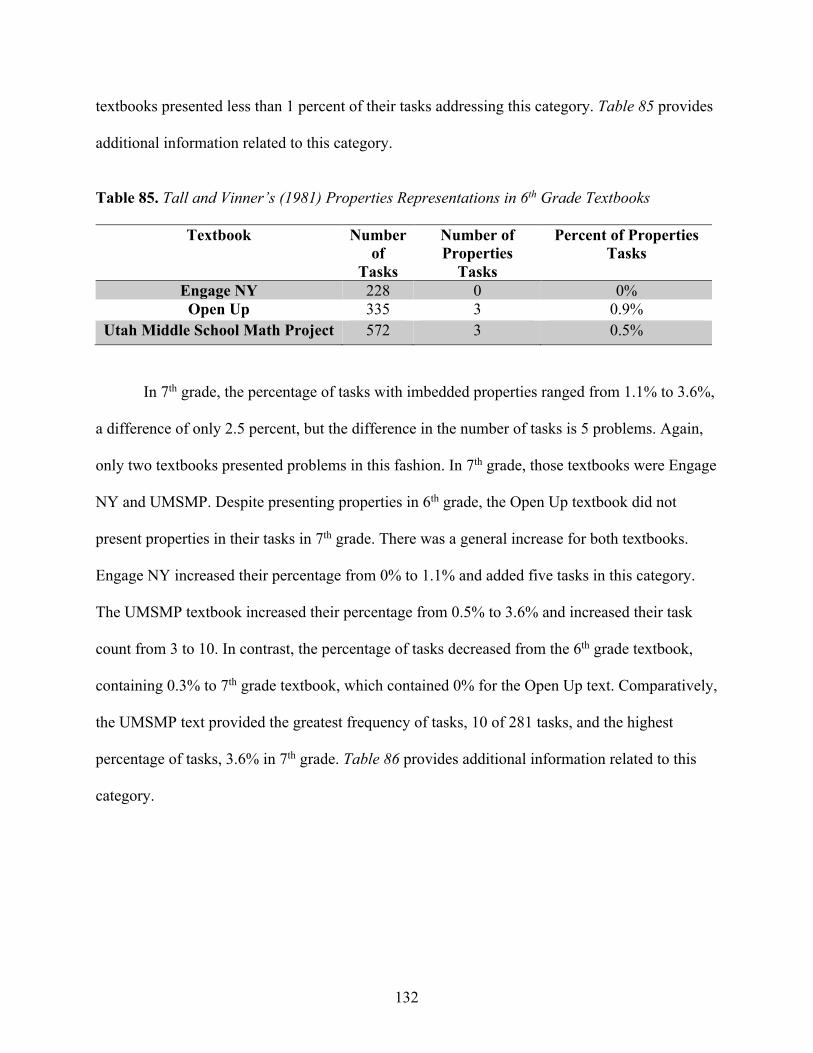
132
textbooks presented less than 1 percent of their tasks addressing this category. Table 85 provides
additional information related to this category.
Table 85. Tall and Vinner’s (1981) Properties Representations in 6th Grade Textbooks
Textbook Number of
Tasks
Number of Properties
Tasks
Percent of Properties Tasks
Engage NY 228 0 0% Open Up 335 3 0.9%
Utah Middle School Math Project 572 3 0.5%
In 7th grade, the percentage of tasks with imbedded properties ranged from 1.1% to 3.6%,
a difference of only 2.5 percent, but the difference in the number of tasks is 5 problems. Again,
only two textbooks presented problems in this fashion. In 7th grade, those textbooks were Engage
NY and UMSMP. Despite presenting properties in 6th grade, the Open Up textbook did not
present properties in their tasks in 7th grade. There was a general increase for both textbooks.
Engage NY increased their percentage from 0% to 1.1% and added five tasks in this category.
The UMSMP textbook increased their percentage from 0.5% to 3.6% and increased their task
count from 3 to 10. In contrast, the percentage of tasks decreased from the 6th grade textbook,
containing 0.3% to 7th grade textbook, which contained 0% for the Open Up text. Comparatively,
the UMSMP text provided the greatest frequency of tasks, 10 of 281 tasks, and the highest
percentage of tasks, 3.6% in 7th grade. Table 86 provides additional information related to this
category.
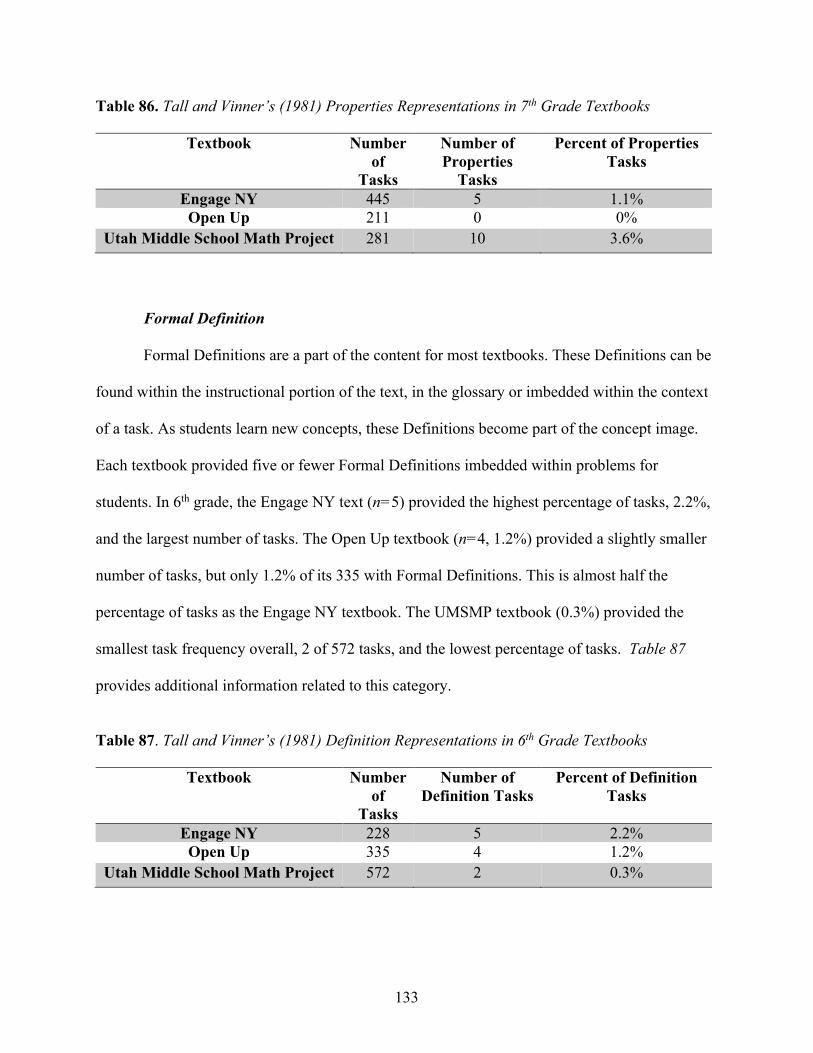
133
Table 86. Tall and Vinner’s (1981) Properties Representations in 7th Grade Textbooks
Textbook Number of
Tasks
Number of Properties
Tasks
Percent of Properties Tasks
Engage NY 445 5 1.1% Open Up 211 0 0%
Utah Middle School Math Project 281 10 3.6%
Formal Definition
Formal Definitions are a part of the content for most textbooks. These Definitions can be
found within the instructional portion of the text, in the glossary or imbedded within the context
of a task. As students learn new concepts, these Definitions become part of the concept image.
Each textbook provided five or fewer Formal Definitions imbedded within problems for
students. In 6th grade, the Engage NY text (n=5) provided the highest percentage of tasks, 2.2%,
and the largest number of tasks. The Open Up textbook (n=4, 1.2%) provided a slightly smaller
number of tasks, but only 1.2% of its 335 with Formal Definitions. This is almost half the
percentage of tasks as the Engage NY textbook. The UMSMP textbook (0.3%) provided the
smallest task frequency overall, 2 of 572 tasks, and the lowest percentage of tasks. Table 87
provides additional information related to this category.
Table 87. Tall and Vinner’s (1981) Definition Representations in 6th Grade Textbooks
Textbook Number of
Tasks
Number of Definition Tasks
Percent of Definition Tasks
Engage NY 228 5 2.2% Open Up 335 4 1.2%
Utah Middle School Math Project 572 2 0.3%
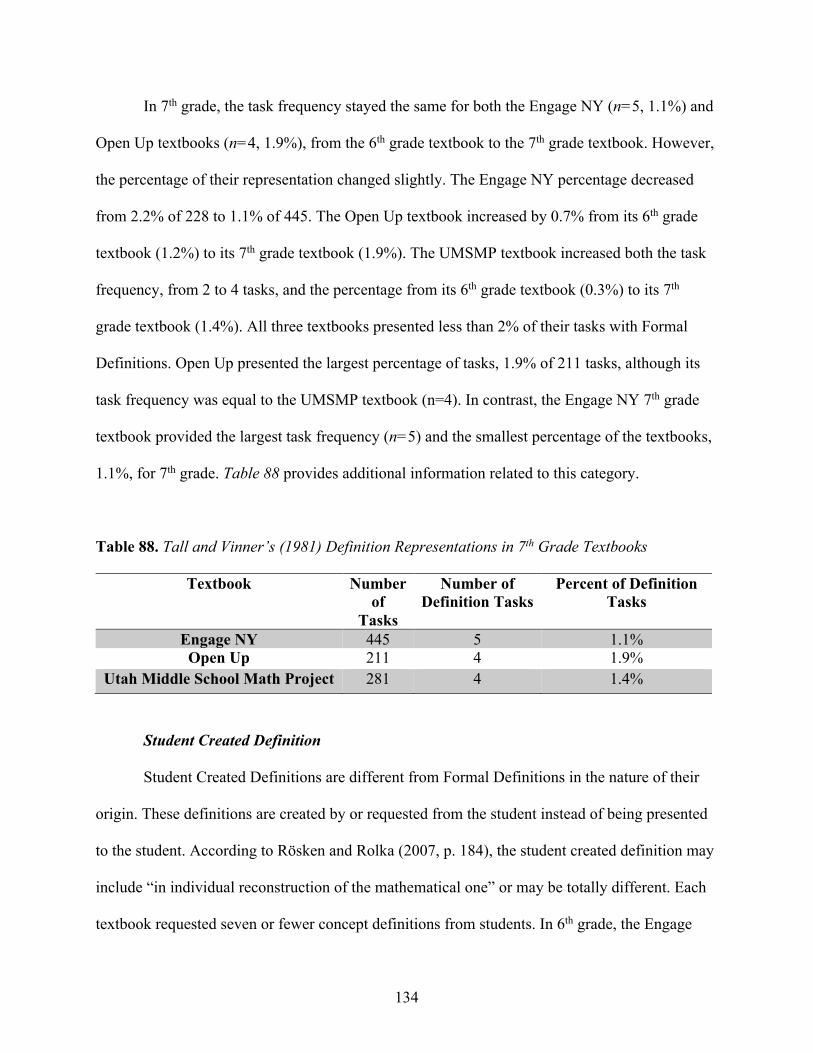
134
In 7th grade, the task frequency stayed the same for both the Engage NY (n=5, 1.1%) and
Open Up textbooks (n=4, 1.9%), from the 6th grade textbook to the 7th grade textbook. However,
the percentage of their representation changed slightly. The Engage NY percentage decreased
from 2.2% of 228 to 1.1% of 445. The Open Up textbook increased by 0.7% from its 6th grade
textbook (1.2%) to its 7th grade textbook (1.9%). The UMSMP textbook increased both the task
frequency, from 2 to 4 tasks, and the percentage from its 6th grade textbook (0.3%) to its 7th
grade textbook (1.4%). All three textbooks presented less than 2% of their tasks with Formal
Definitions. Open Up presented the largest percentage of tasks, 1.9% of 211 tasks, although its
task frequency was equal to the UMSMP textbook (n=4). In contrast, the Engage NY 7th grade
textbook provided the largest task frequency (n=5) and the smallest percentage of the textbooks,
1.1%, for 7th grade. Table 88 provides additional information related to this category.
Table 88. Tall and Vinner’s (1981) Definition Representations in 7th Grade Textbooks
Textbook Number of
Tasks
Number of Definition Tasks
Percent of Definition Tasks
Engage NY 445 5 1.1% Open Up 211 4 1.9%
Utah Middle School Math Project 281 4 1.4%
Student Created Definition
Student Created Definitions are different from Formal Definitions in the nature of their
origin. These definitions are created by or requested from the student instead of being presented
to the student. According to Rösken and Rolka (2007, p. 184), the student created definition may
include “in individual reconstruction of the mathematical one” or may be totally different. Each
textbook requested seven or fewer concept definitions from students. In 6th grade, the Engage
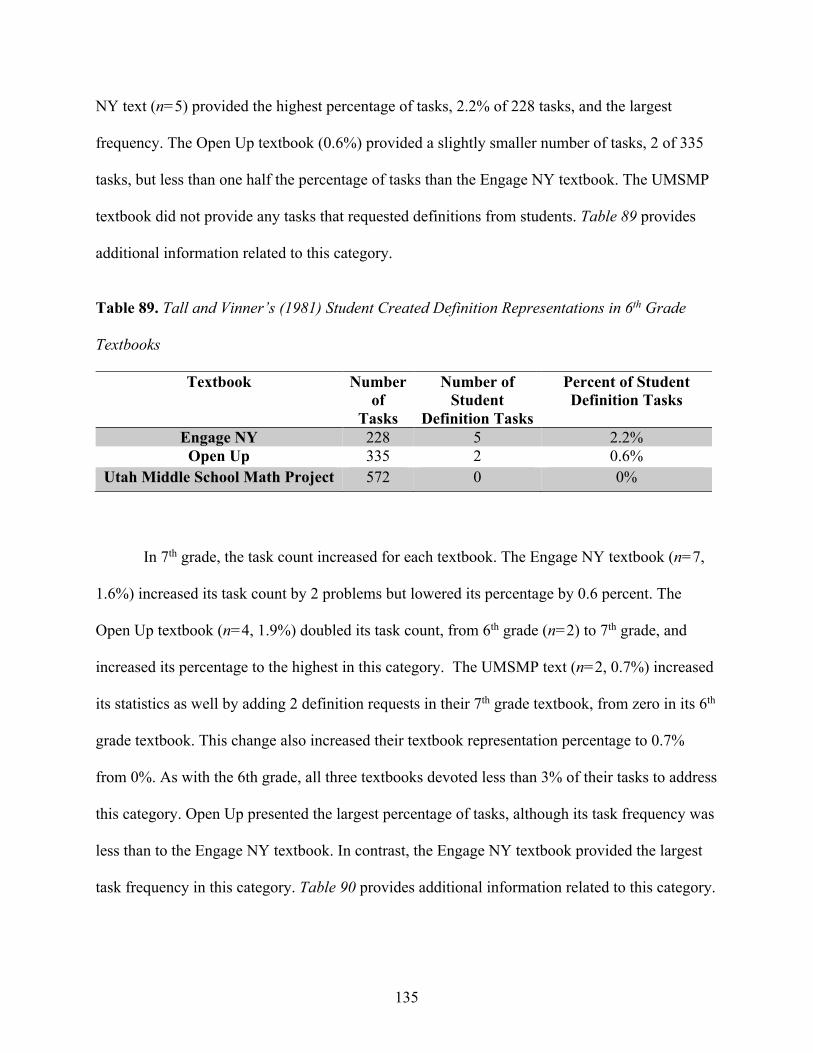
135
NY text (n=5) provided the highest percentage of tasks, 2.2% of 228 tasks, and the largest
frequency. The Open Up textbook (0.6%) provided a slightly smaller number of tasks, 2 of 335
tasks, but less than one half the percentage of tasks than the Engage NY textbook. The UMSMP
textbook did not provide any tasks that requested definitions from students. Table 89 provides
additional information related to this category.
Table 89. Tall and Vinner’s (1981) Student Created Definition Representations in 6th Grade
Textbooks
Textbook Number of
Tasks
Number of Student
Definition Tasks
Percent of Student Definition Tasks
Engage NY 228 5 2.2% Open Up 335 2 0.6%
Utah Middle School Math Project 572 0 0%
In 7th grade, the task count increased for each textbook. The Engage NY textbook (n=7,
1.6%) increased its task count by 2 problems but lowered its percentage by 0.6 percent. The
Open Up textbook (n=4, 1.9%) doubled its task count, from 6th grade (n=2) to 7th grade, and
increased its percentage to the highest in this category. The UMSMP text (n=2, 0.7%) increased
its statistics as well by adding 2 definition requests in their 7th grade textbook, from zero in its 6th
grade textbook. This change also increased their textbook representation percentage to 0.7%
from 0%. As with the 6th grade, all three textbooks devoted less than 3% of their tasks to address
this category. Open Up presented the largest percentage of tasks, although its task frequency was
less than to the Engage NY textbook. In contrast, the Engage NY textbook provided the largest
task frequency in this category. Table 90 provides additional information related to this category.
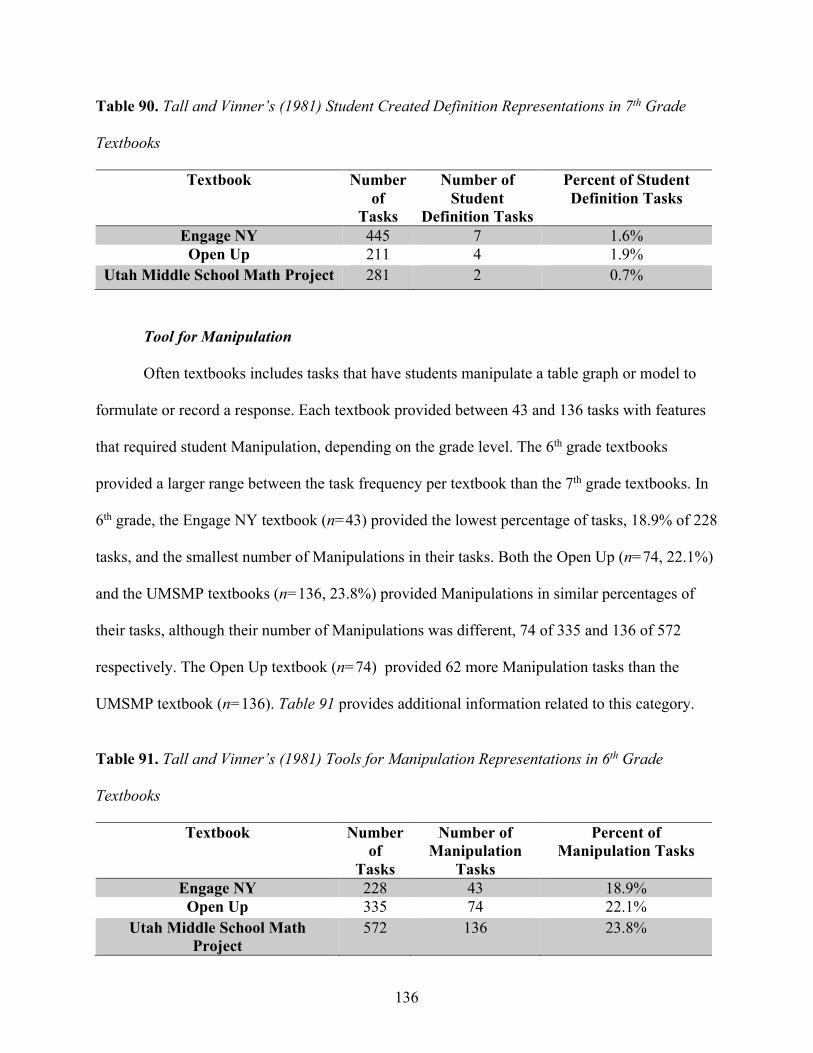
136
Table 90. Tall and Vinner’s (1981) Student Created Definition Representations in 7th Grade
Textbooks
Textbook Number of
Tasks
Number of Student
Definition Tasks
Percent of Student Definition Tasks
Engage NY 445 7 1.6% Open Up 211 4 1.9%
Utah Middle School Math Project 281 2 0.7%
Tool for Manipulation
Often textbooks includes tasks that have students manipulate a table graph or model to
formulate or record a response. Each textbook provided between 43 and 136 tasks with features
that required student Manipulation, depending on the grade level. The 6th grade textbooks
provided a larger range between the task frequency per textbook than the 7th grade textbooks. In
6th grade, the Engage NY textbook (n=43) provided the lowest percentage of tasks, 18.9% of 228
tasks, and the smallest number of Manipulations in their tasks. Both the Open Up (n=74, 22.1%)
and the UMSMP textbooks (n=136, 23.8%) provided Manipulations in similar percentages of
their tasks, although their number of Manipulations was different, 74 of 335 and 136 of 572
respectively. The Open Up textbook (n=74) provided 62 more Manipulation tasks than the
UMSMP textbook (n=136). Table 91 provides additional information related to this category.
Table 91. Tall and Vinner’s (1981) Tools for Manipulation Representations in 6th Grade
Textbooks
Textbook Number of
Tasks
Number of Manipulation
Tasks
Percent of Manipulation Tasks
Engage NY 228 43 18.9% Open Up 335 74 22.1%
Utah Middle School Math Project
572 136 23.8%
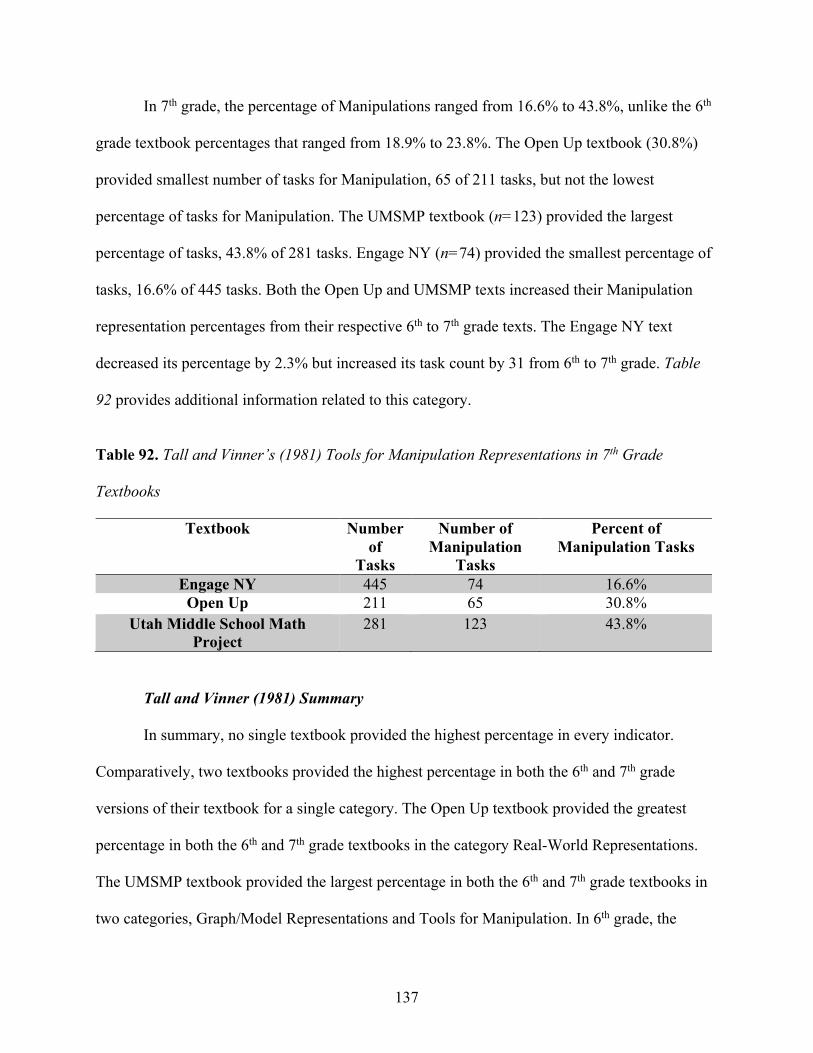
137
In 7th grade, the percentage of Manipulations ranged from 16.6% to 43.8%, unlike the 6th
grade textbook percentages that ranged from 18.9% to 23.8%. The Open Up textbook (30.8%)
provided smallest number of tasks for Manipulation, 65 of 211 tasks, but not the lowest
percentage of tasks for Manipulation. The UMSMP textbook (n=123) provided the largest
percentage of tasks, 43.8% of 281 tasks. Engage NY (n=74) provided the smallest percentage of
tasks, 16.6% of 445 tasks. Both the Open Up and UMSMP texts increased their Manipulation
representation percentages from their respective 6th to 7th grade texts. The Engage NY text
decreased its percentage by 2.3% but increased its task count by 31 from 6th to 7th grade. Table
92 provides additional information related to this category.
Table 92. Tall and Vinner’s (1981) Tools for Manipulation Representations in 7th Grade
Textbooks
Textbook Number of
Tasks
Number of Manipulation
Tasks
Percent of Manipulation Tasks
Engage NY 445 74 16.6% Open Up 211 65 30.8%
Utah Middle School Math Project
281 123 43.8%
Tall and Vinner (1981) Summary
In summary, no single textbook provided the highest percentage in every indicator.
Comparatively, two textbooks provided the highest percentage in both the 6th and 7th grade
versions of their textbook for a single category. The Open Up textbook provided the greatest
percentage in both the 6th and 7th grade textbooks in the category Real-World Representations.
The UMSMP textbook provided the largest percentage in both the 6th and 7th grade textbooks in
two categories, Graph/Model Representations and Tools for Manipulation. In 6th grade, the
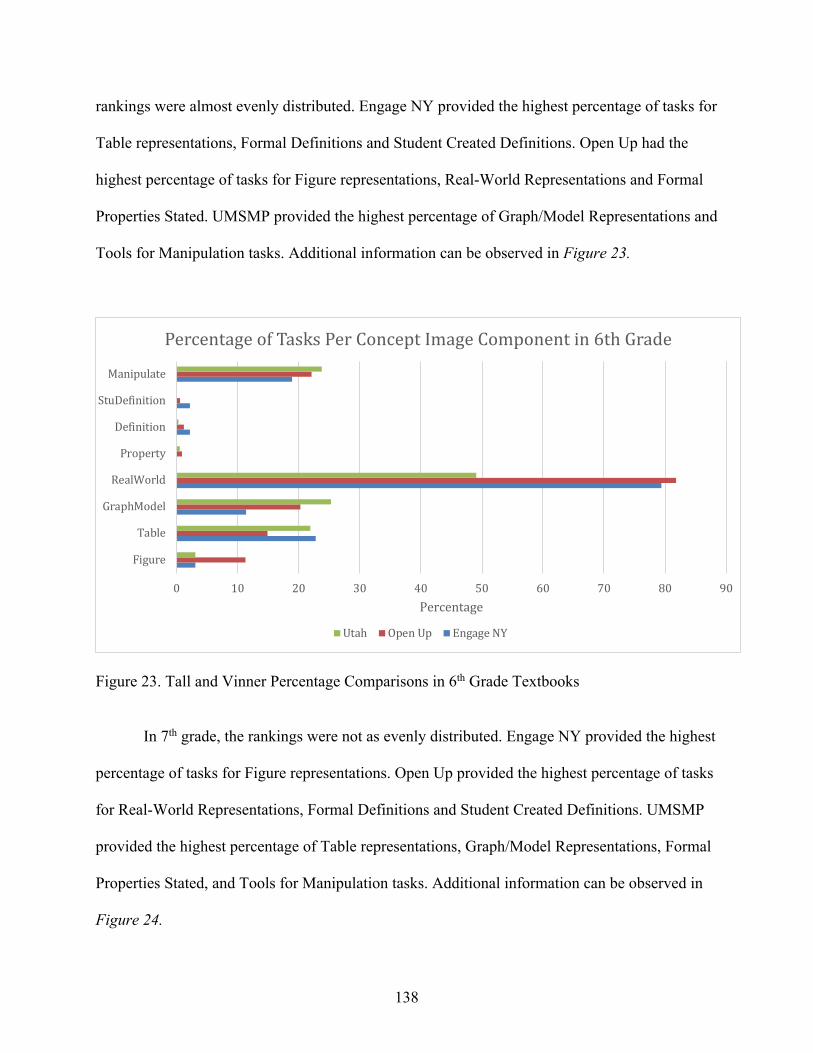
138
rankings were almost evenly distributed. Engage NY provided the highest percentage of tasks for
Table representations, Formal Definitions and Student Created Definitions. Open Up had the
highest percentage of tasks for Figure representations, Real-World Representations and Formal
Properties Stated. UMSMP provided the highest percentage of Graph/Model Representations and
Tools for Manipulation tasks. Additional information can be observed in Figure 23.
Figure 23. Tall and Vinner Percentage Comparisons in 6th Grade Textbooks
In 7th grade, the rankings were not as evenly distributed. Engage NY provided the highest
percentage of tasks for Figure representations. Open Up provided the highest percentage of tasks
for Real-World Representations, Formal Definitions and Student Created Definitions. UMSMP
provided the highest percentage of Table representations, Graph/Model Representations, Formal
Properties Stated, and Tools for Manipulation tasks. Additional information can be observed in
Figure 24.
0 10 20 30 40 50 60 70 80 90
Figure
Table
GraphModel
RealWorld
Property
Definition
StuDefinition
Manipulate
Percentage
PercentageofTasksPerConceptImageComponentin6thGrade
Utah OpenUp EngageNY
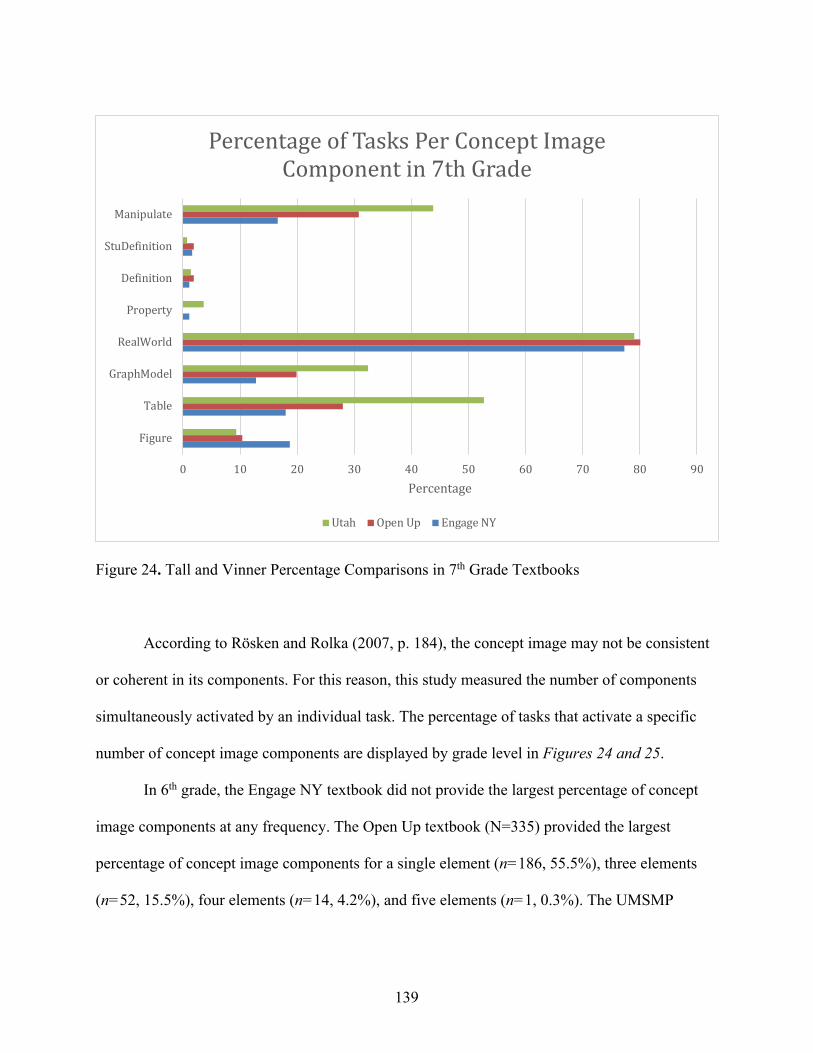
139
Figure 24. Tall and Vinner Percentage Comparisons in 7th Grade Textbooks
According to Rösken and Rolka (2007, p. 184), the concept image may not be consistent
or coherent in its components. For this reason, this study measured the number of components
simultaneously activated by an individual task. The percentage of tasks that activate a specific
number of concept image components are displayed by grade level in Figures 24 and 25.
In 6th grade, the Engage NY textbook did not provide the largest percentage of concept
image components at any frequency. The Open Up textbook (N=335) provided the largest
percentage of concept image components for a single element (n=186, 55.5%), three elements
(n=52, 15.5%), four elements (n=14, 4.2%), and five elements (n=1, 0.3%). The UMSMP
0 10 20 30 40 50 60 70 80 90
Figure
Table
GraphModel
RealWorld
Property
Definition
StuDefinition
Manipulate
Percentage
PercentageofTasksPerConceptImageComponentin7thGrade
Utah OpenUp EngageNY
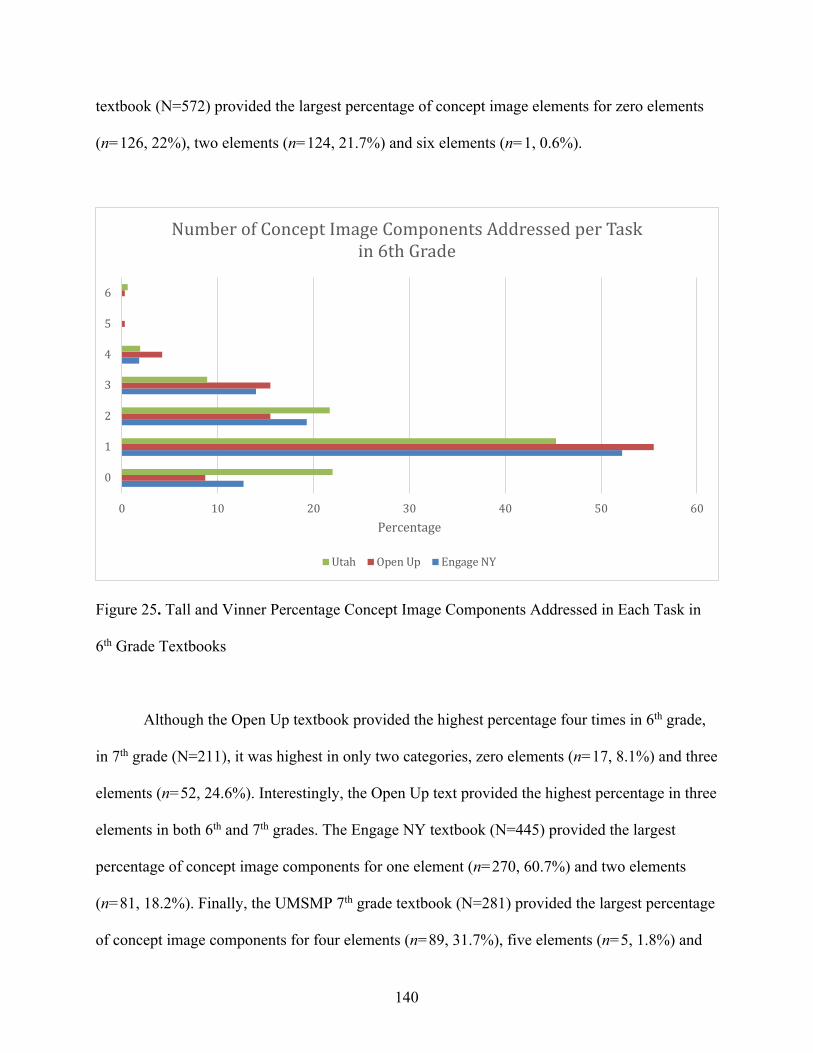
140
textbook (N=572) provided the largest percentage of concept image elements for zero elements
(n=126, 22%), two elements (n=124, 21.7%) and six elements (n=1, 0.6%).
Figure 25. Tall and Vinner Percentage Concept Image Components Addressed in Each Task in
6th Grade Textbooks
Although the Open Up textbook provided the highest percentage four times in 6th grade,
in 7th grade (N=211), it was highest in only two categories, zero elements (n=17, 8.1%) and three
elements (n=52, 24.6%). Interestingly, the Open Up text provided the highest percentage in three
elements in both 6th and 7th grades. The Engage NY textbook (N=445) provided the largest
percentage of concept image components for one element (n=270, 60.7%) and two elements
(n=81, 18.2%). Finally, the UMSMP 7th grade textbook (N=281) provided the largest percentage
of concept image components for four elements (n=89, 31.7%), five elements (n=5, 1.8%) and
0 10 20 30 40 50 60
0
1
2
3
4
5
6
Percentage
NumberofConceptImageComponentsAddressedperTaskin6thGrade
Utah OpenUp EngageNY
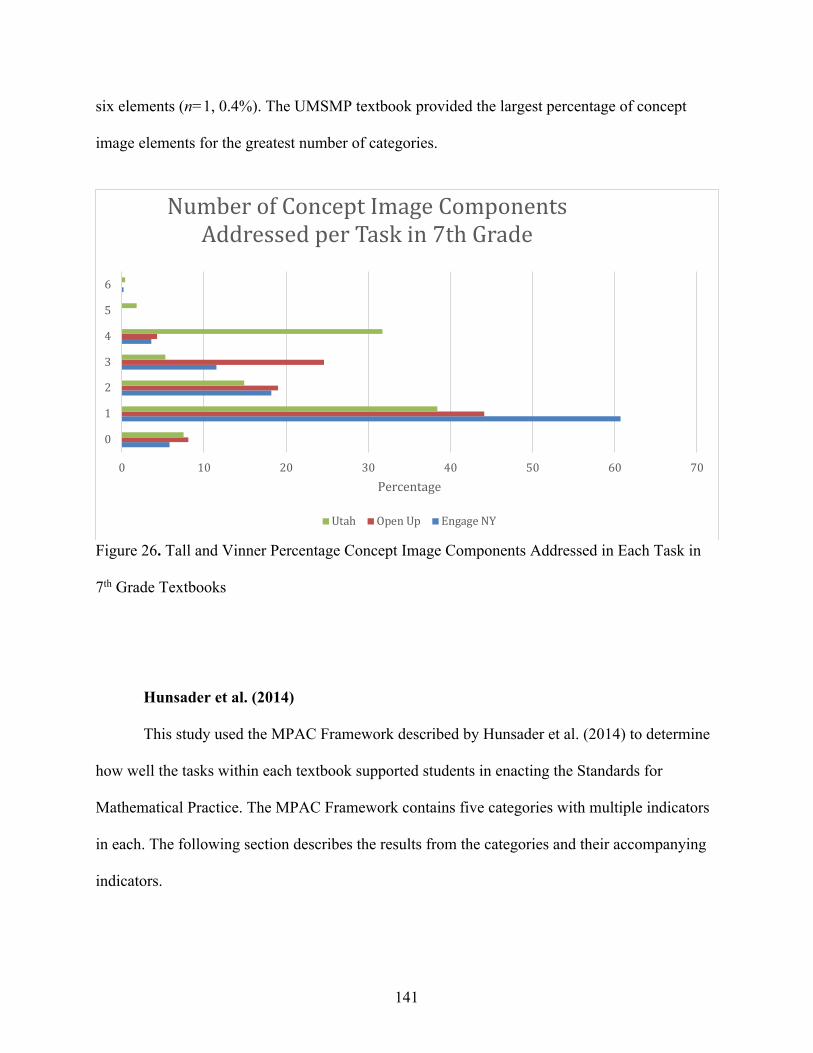
141
six elements (n=1, 0.4%). The UMSMP textbook provided the largest percentage of concept
image elements for the greatest number of categories.
Figure 26. Tall and Vinner Percentage Concept Image Components Addressed in Each Task in
7th Grade Textbooks
Hunsader et al. (2014)
This study used the MPAC Framework described by Hunsader et al. (2014) to determine
how well the tasks within each textbook supported students in enacting the Standards for
Mathematical Practice. The MPAC Framework contains five categories with multiple indicators
in each. The following section describes the results from the categories and their accompanying
indicators.
0 10 20 30 40 50 60 70
0
1
2
3
4
5
6
Percentage
NumberofConceptImageComponentsAddressedperTaskin7thGrade
Utah OpenUp EngageNY
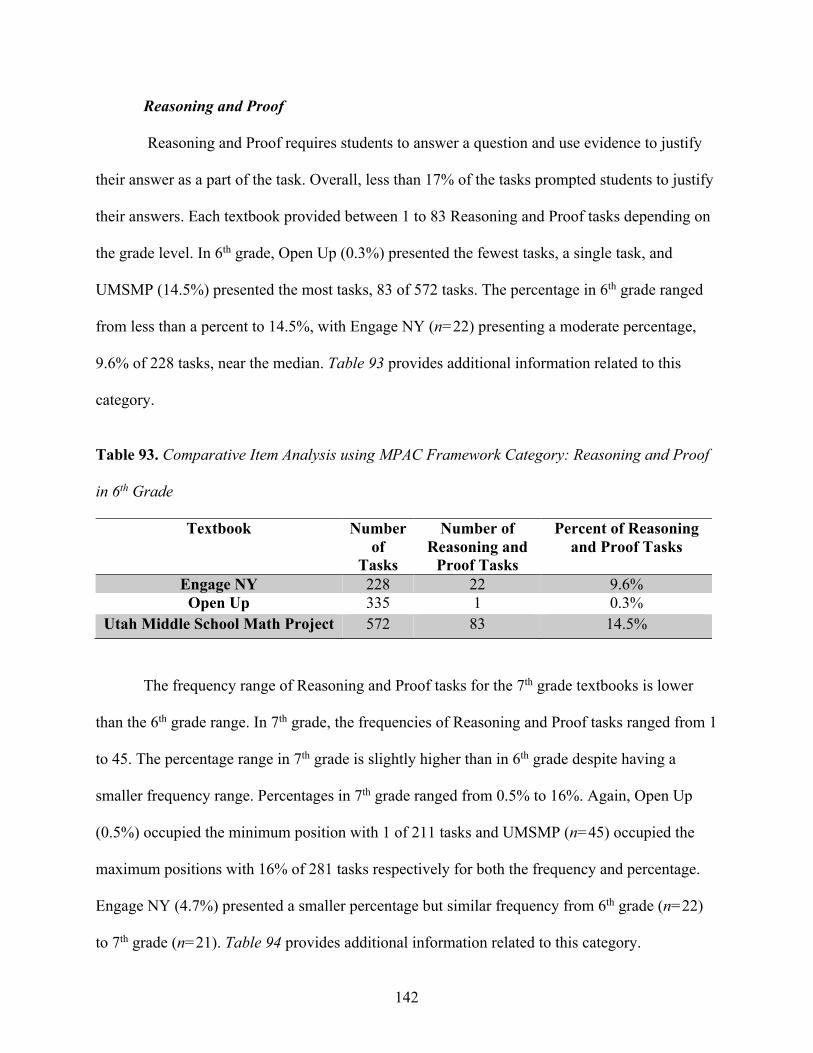
142
Reasoning and Proof
Reasoning and Proof requires students to answer a question and use evidence to justify
their answer as a part of the task. Overall, less than 17% of the tasks prompted students to justify
their answers. Each textbook provided between 1 to 83 Reasoning and Proof tasks depending on
the grade level. In 6th grade, Open Up (0.3%) presented the fewest tasks, a single task, and
UMSMP (14.5%) presented the most tasks, 83 of 572 tasks. The percentage in 6th grade ranged
from less than a percent to 14.5%, with Engage NY (n=22) presenting a moderate percentage,
9.6% of 228 tasks, near the median. Table 93 provides additional information related to this
category.
Table 93. Comparative Item Analysis using MPAC Framework Category: Reasoning and Proof
in 6th Grade
Textbook Number of
Tasks
Number of Reasoning and
Proof Tasks
Percent of Reasoning and Proof Tasks
Engage NY 228 22 9.6% Open Up 335 1 0.3%
Utah Middle School Math Project 572 83 14.5%
The frequency range of Reasoning and Proof tasks for the 7th grade textbooks is lower
than the 6th grade range. In 7th grade, the frequencies of Reasoning and Proof tasks ranged from 1
to 45. The percentage range in 7th grade is slightly higher than in 6th grade despite having a
smaller frequency range. Percentages in 7th grade ranged from 0.5% to 16%. Again, Open Up
(0.5%) occupied the minimum position with 1 of 211 tasks and UMSMP (n=45) occupied the
maximum positions with 16% of 281 tasks respectively for both the frequency and percentage.
Engage NY (4.7%) presented a smaller percentage but similar frequency from 6th grade (n=22)
to 7th grade (n=21). Table 94 provides additional information related to this category.
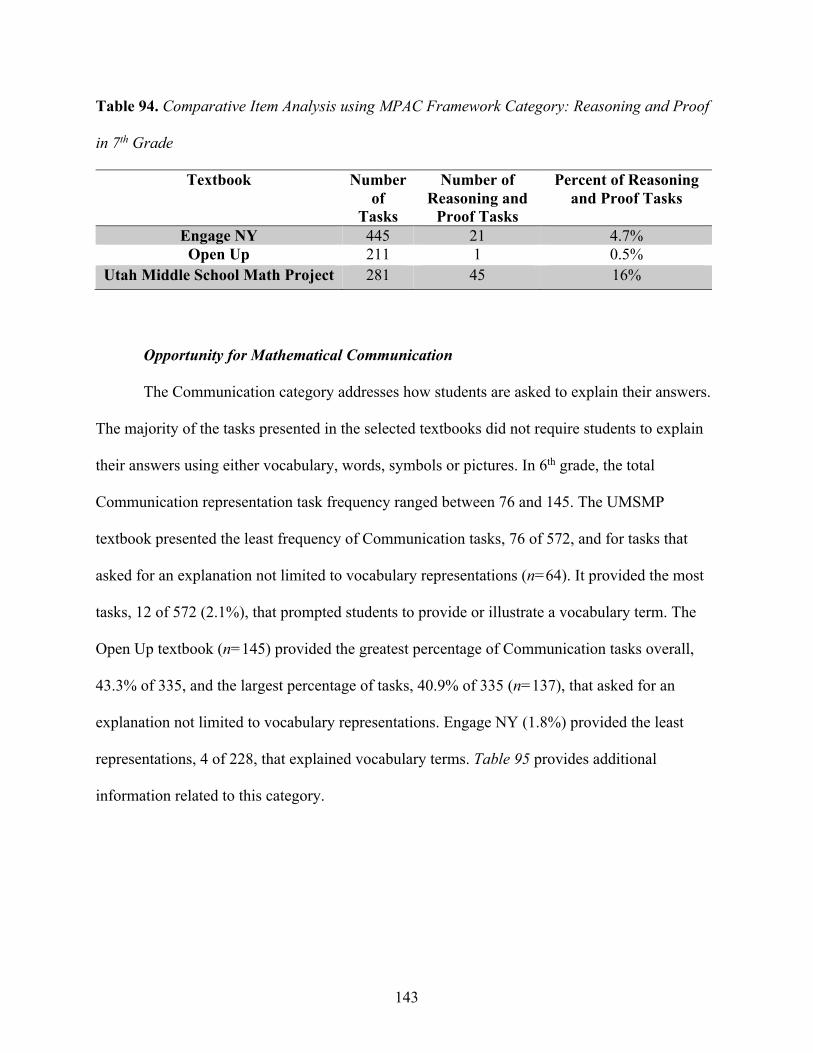
143
Table 94. Comparative Item Analysis using MPAC Framework Category: Reasoning and Proof
in 7th Grade
Textbook Number of
Tasks
Number of Reasoning and
Proof Tasks
Percent of Reasoning and Proof Tasks
Engage NY 445 21 4.7% Open Up 211 1 0.5%
Utah Middle School Math Project 281 45 16%
Opportunity for Mathematical Communication
The Communication category addresses how students are asked to explain their answers.
The majority of the tasks presented in the selected textbooks did not require students to explain
their answers using either vocabulary, words, symbols or pictures. In 6th grade, the total
Communication representation task frequency ranged between 76 and 145. The UMSMP
textbook presented the least frequency of Communication tasks, 76 of 572, and for tasks that
asked for an explanation not limited to vocabulary representations (n=64). It provided the most
tasks, 12 of 572 (2.1%), that prompted students to provide or illustrate a vocabulary term. The
Open Up textbook (n=145) provided the greatest percentage of Communication tasks overall,
43.3% of 335, and the largest percentage of tasks, 40.9% of 335 (n=137), that asked for an
explanation not limited to vocabulary representations. Engage NY (1.8%) provided the least
representations, 4 of 228, that explained vocabulary terms. Table 95 provides additional
information related to this category.
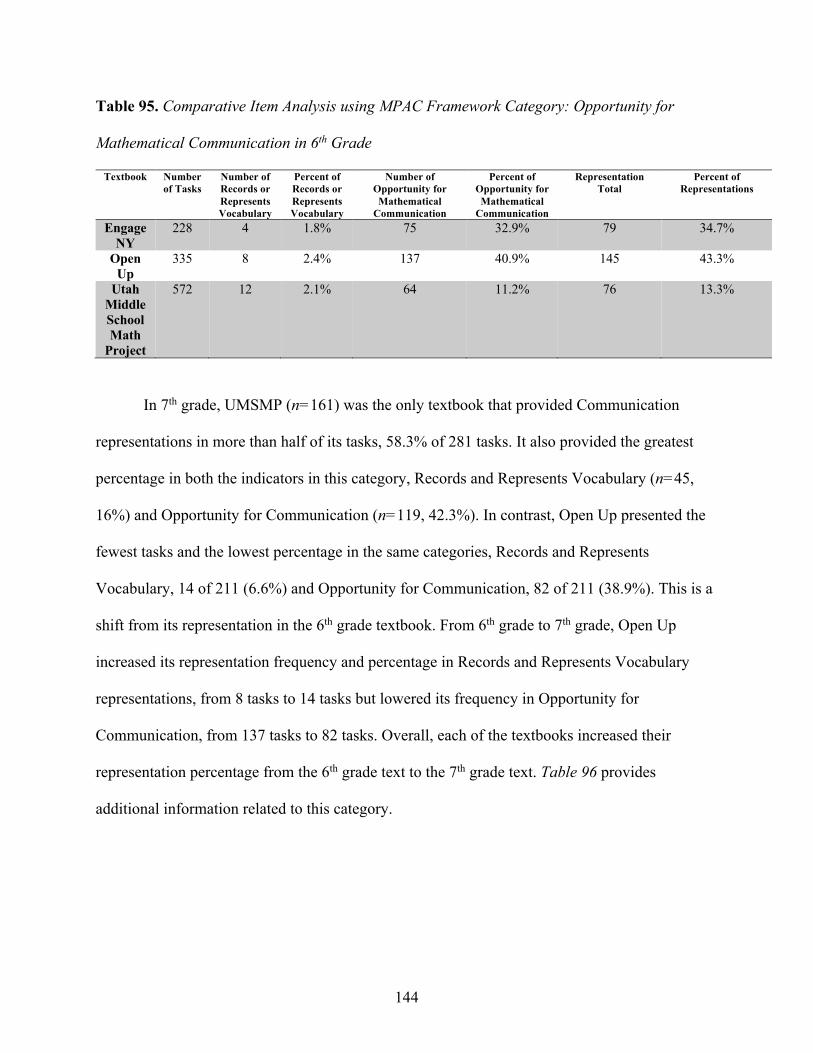
144
Table 95. Comparative Item Analysis using MPAC Framework Category: Opportunity for
Mathematical Communication in 6th Grade
Textbook Number of Tasks
Number of Records or Represents Vocabulary
Percent of Records or Represents Vocabulary
Number of Opportunity for Mathematical
Communication
Percent of Opportunity for Mathematical
Communication
Representation Total
Percent of Representations
Engage NY
228 4 1.8% 75 32.9% 79 34.7%
Open Up
335 8 2.4% 137 40.9% 145 43.3%
Utah Middle School Math
Project
572 12 2.1% 64 11.2% 76 13.3%
In 7th grade, UMSMP (n=161) was the only textbook that provided Communication
representations in more than half of its tasks, 58.3% of 281 tasks. It also provided the greatest
percentage in both the indicators in this category, Records and Represents Vocabulary (n=45,
16%) and Opportunity for Communication (n=119, 42.3%). In contrast, Open Up presented the
fewest tasks and the lowest percentage in the same categories, Records and Represents
Vocabulary, 14 of 211 (6.6%) and Opportunity for Communication, 82 of 211 (38.9%). This is a
shift from its representation in the 6th grade textbook. From 6th grade to 7th grade, Open Up
increased its representation frequency and percentage in Records and Represents Vocabulary
representations, from 8 tasks to 14 tasks but lowered its frequency in Opportunity for
Communication, from 137 tasks to 82 tasks. Overall, each of the textbooks increased their
representation percentage from the 6th grade text to the 7th grade text. Table 96 provides
additional information related to this category.
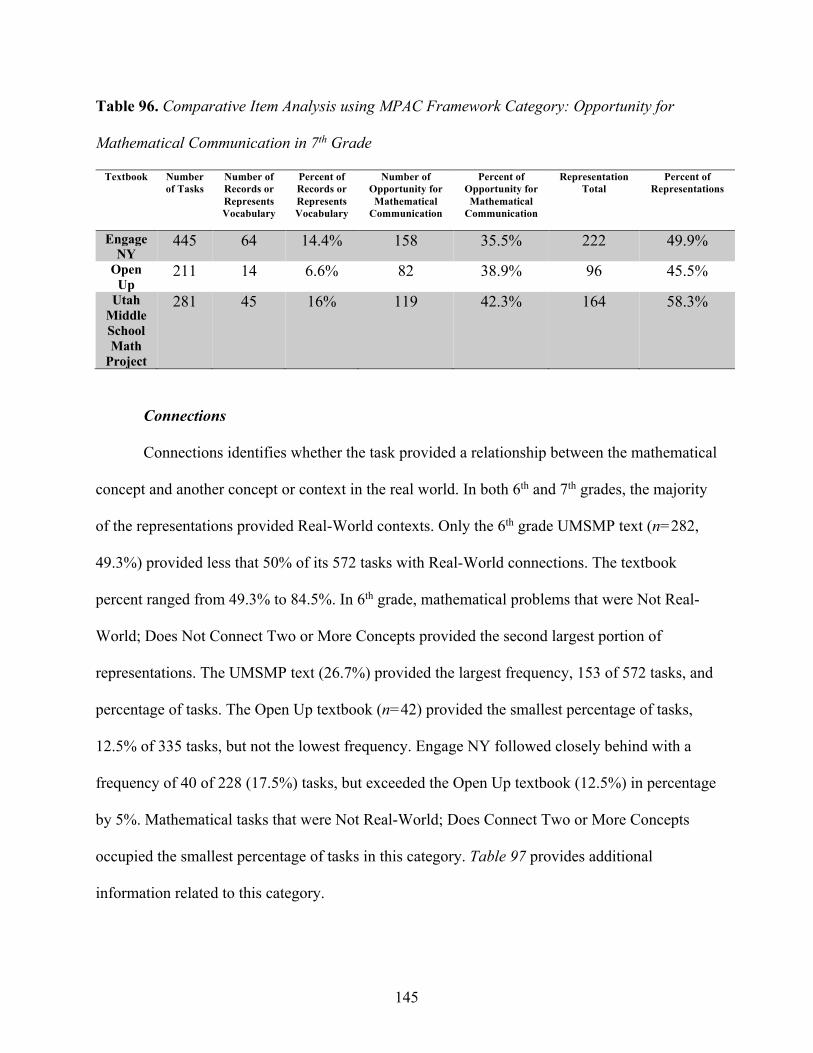
145
Table 96. Comparative Item Analysis using MPAC Framework Category: Opportunity for
Mathematical Communication in 7th Grade
Textbook Number of Tasks
Number of Records or Represents Vocabulary
Percent of Records or Represents Vocabulary
Number of Opportunity for Mathematical
Communication
Percent of Opportunity for Mathematical
Communication
Representation Total
Percent of Representations
Engage NY
445 64 14.4% 158 35.5% 222 49.9%
Open Up
211 14 6.6% 82 38.9% 96 45.5%
Utah Middle School Math
Project
281 45 16% 119 42.3% 164 58.3%
Connections
Connections identifies whether the task provided a relationship between the mathematical
concept and another concept or context in the real world. In both 6th and 7th grades, the majority
of the representations provided Real-World contexts. Only the 6th grade UMSMP text (n=282,
49.3%) provided less that 50% of its 572 tasks with Real-World connections. The textbook
percent ranged from 49.3% to 84.5%. In 6th grade, mathematical problems that were Not Real-
World; Does Not Connect Two or More Concepts provided the second largest portion of
representations. The UMSMP text (26.7%) provided the largest frequency, 153 of 572 tasks, and
percentage of tasks. The Open Up textbook (n=42) provided the smallest percentage of tasks,
12.5% of 335 tasks, but not the lowest frequency. Engage NY followed closely behind with a
frequency of 40 of 228 (17.5%) tasks, but exceeded the Open Up textbook (12.5%) in percentage
by 5%. Mathematical tasks that were Not Real-World; Does Connect Two or More Concepts
occupied the smallest percentage of tasks in this category. Table 97 provides additional
information related to this category.
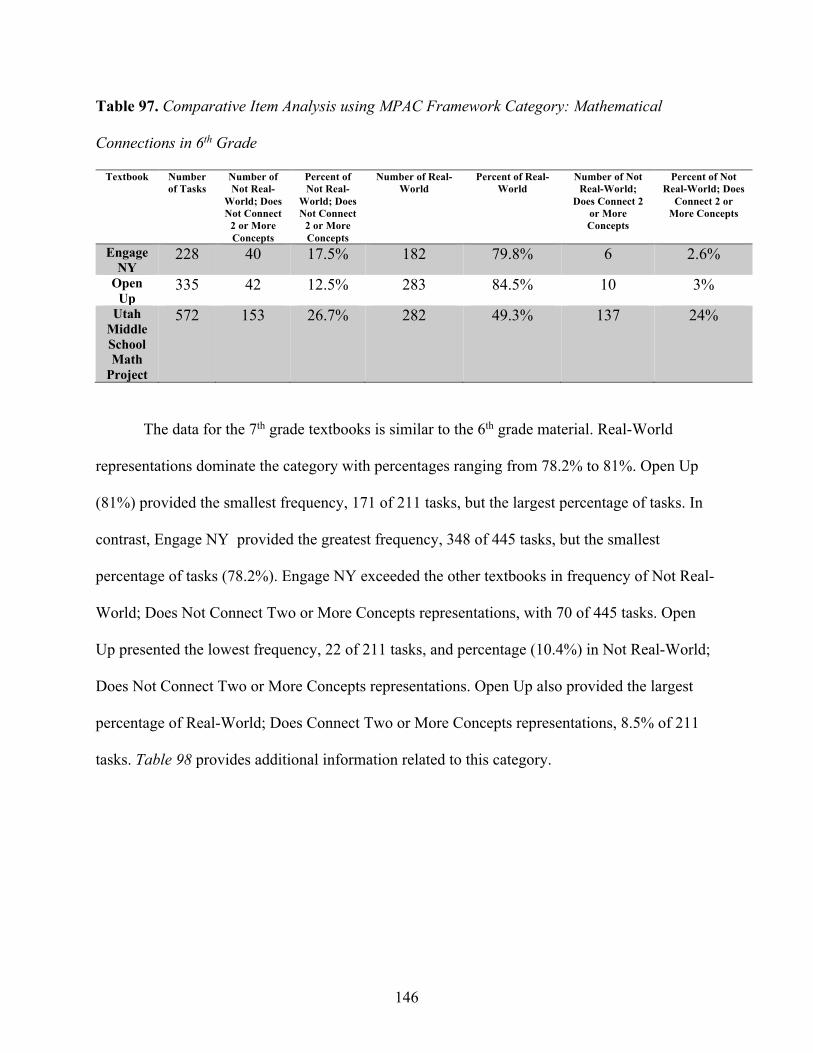
146
Table 97. Comparative Item Analysis using MPAC Framework Category: Mathematical
Connections in 6th Grade
Textbook Number of Tasks
Number of Not Real-
World; Does Not Connect
2 or More Concepts
Percent of Not Real-
World; Does Not Connect
2 or More Concepts
Number of Real-World
Percent of Real-World
Number of Not Real-World;
Does Connect 2 or More Concepts
Percent of Not Real-World; Does
Connect 2 or More Concepts
Engage NY
228 40 17.5% 182 79.8% 6 2.6%
Open Up
335 42 12.5% 283 84.5% 10 3%
Utah Middle School Math
Project
572 153 26.7% 282 49.3% 137 24%
The data for the 7th grade textbooks is similar to the 6th grade material. Real-World
representations dominate the category with percentages ranging from 78.2% to 81%. Open Up
(81%) provided the smallest frequency, 171 of 211 tasks, but the largest percentage of tasks. In
contrast, Engage NY provided the greatest frequency, 348 of 445 tasks, but the smallest
percentage of tasks (78.2%). Engage NY exceeded the other textbooks in frequency of Not Real-
World; Does Not Connect Two or More Concepts representations, with 70 of 445 tasks. Open
Up presented the lowest frequency, 22 of 211 tasks, and percentage (10.4%) in Not Real-World;
Does Not Connect Two or More Concepts representations. Open Up also provided the largest
percentage of Real-World; Does Connect Two or More Concepts representations, 8.5% of 211
tasks. Table 98 provides additional information related to this category.
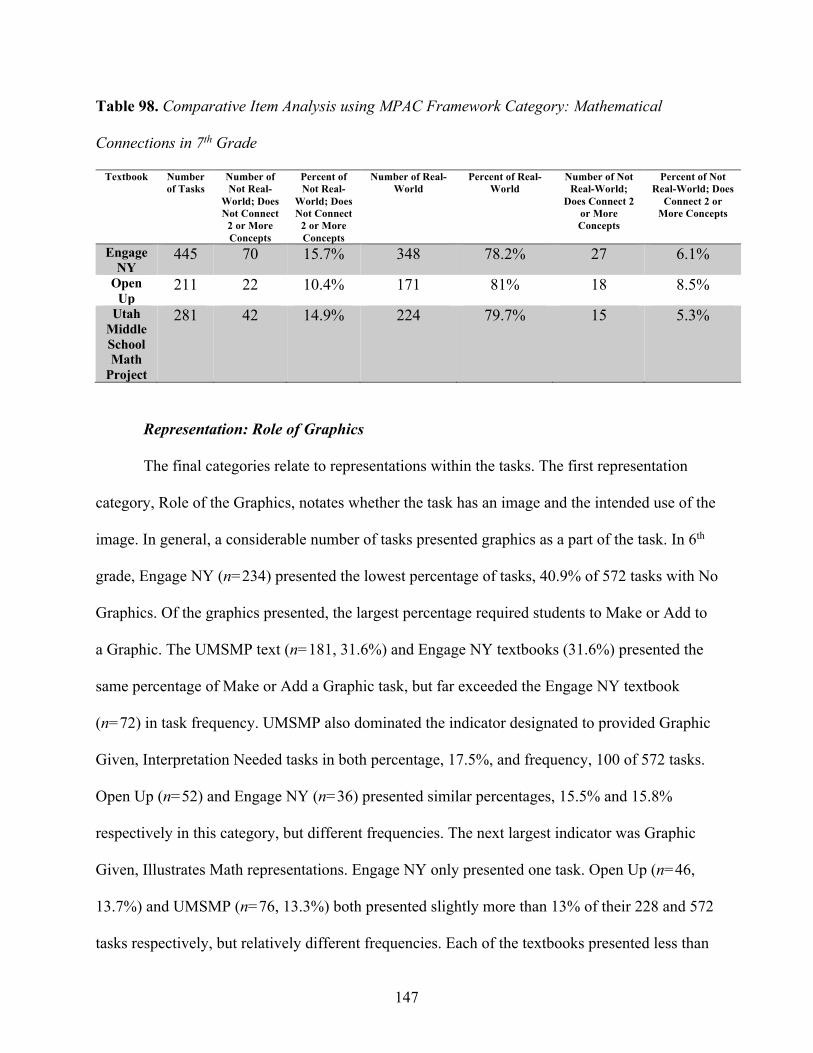
147
Table 98. Comparative Item Analysis using MPAC Framework Category: Mathematical
Connections in 7th Grade
Textbook Number of Tasks
Number of Not Real-
World; Does Not Connect
2 or More Concepts
Percent of Not Real-
World; Does Not Connect
2 or More Concepts
Number of Real-World
Percent of Real-World
Number of Not Real-World;
Does Connect 2 or More Concepts
Percent of Not Real-World; Does
Connect 2 or More Concepts
Engage NY
445 70 15.7% 348 78.2% 27 6.1%
Open Up
211 22 10.4% 171 81% 18 8.5%
Utah Middle School Math
Project
281 42 14.9% 224 79.7% 15 5.3%
Representation: Role of Graphics
The final categories relate to representations within the tasks. The first representation
category, Role of the Graphics, notates whether the task has an image and the intended use of the
image. In general, a considerable number of tasks presented graphics as a part of the task. In 6th
grade, Engage NY (n=234) presented the lowest percentage of tasks, 40.9% of 572 tasks with No
Graphics. Of the graphics presented, the largest percentage required students to Make or Add to
a Graphic. The UMSMP text (n=181, 31.6%) and Engage NY textbooks (31.6%) presented the
same percentage of Make or Add a Graphic task, but far exceeded the Engage NY textbook
(n=72) in task frequency. UMSMP also dominated the indicator designated to provided Graphic
Given, Interpretation Needed tasks in both percentage, 17.5%, and frequency, 100 of 572 tasks.
Open Up (n=52) and Engage NY (n=36) presented similar percentages, 15.5% and 15.8%
respectively in this category, but different frequencies. The next largest indicator was Graphic
Given, Illustrates Math representations. Engage NY only presented one task. Open Up (n=46,
13.7%) and UMSMP (n=76, 13.3%) both presented slightly more than 13% of their 228 and 572
tasks respectively, but relatively different frequencies. Each of the textbooks presented less than
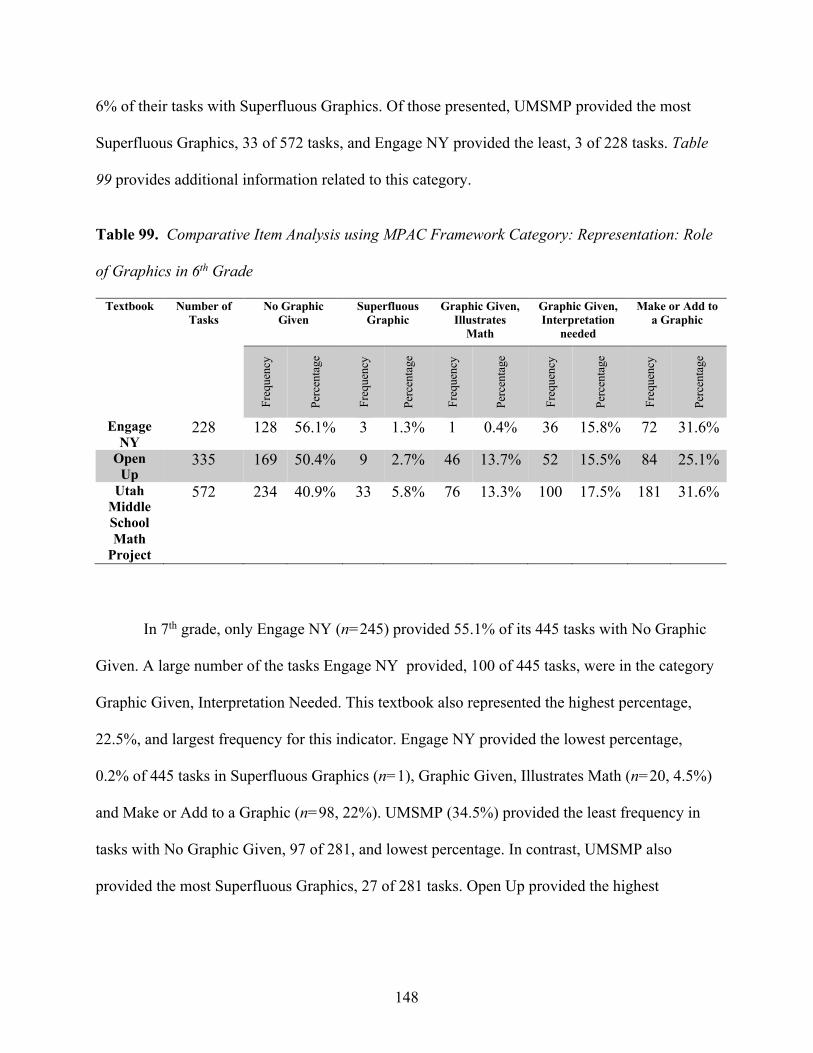
148
6% of their tasks with Superfluous Graphics. Of those presented, UMSMP provided the most
Superfluous Graphics, 33 of 572 tasks, and Engage NY provided the least, 3 of 228 tasks. Table
99 provides additional information related to this category.
Table 99. Comparative Item Analysis using MPAC Framework Category: Representation: Role
of Graphics in 6th Grade
Textbook Number of Tasks
No Graphic Given
Superfluous Graphic
Graphic Given, Illustrates
Math
Graphic Given, Interpretation
needed
Make or Add to a Graphic
Freq
uenc
y
Perc
enta
ge
Freq
uenc
y
Perc
e nta
ge
Freq
uenc
y
Perc
enta
ge
Freq
uenc
y
Perc
enta
ge
Freq
uenc
y
Perc
enta
ge
Engage NY
228 128 56.1% 3 1.3% 1 0.4% 36 15.8% 72 31.6%
Open Up
335 169 50.4% 9 2.7% 46 13.7% 52 15.5% 84 25.1%
Utah Middle School Math
Project
572 234 40.9% 33 5.8% 76 13.3% 100 17.5% 181 31.6%
In 7th grade, only Engage NY (n=245) provided 55.1% of its 445 tasks with No Graphic
Given. A large number of the tasks Engage NY provided, 100 of 445 tasks, were in the category
Graphic Given, Interpretation Needed. This textbook also represented the highest percentage,
22.5%, and largest frequency for this indicator. Engage NY provided the lowest percentage,
0.2% of 445 tasks in Superfluous Graphics (n=1), Graphic Given, Illustrates Math (n=20, 4.5%)
and Make or Add to a Graphic (n=98, 22%). UMSMP (34.5%) provided the least frequency in
tasks with No Graphic Given, 97 of 281, and lowest percentage. In contrast, UMSMP also
provided the most Superfluous Graphics, 27 of 281 tasks. Open Up provided the highest
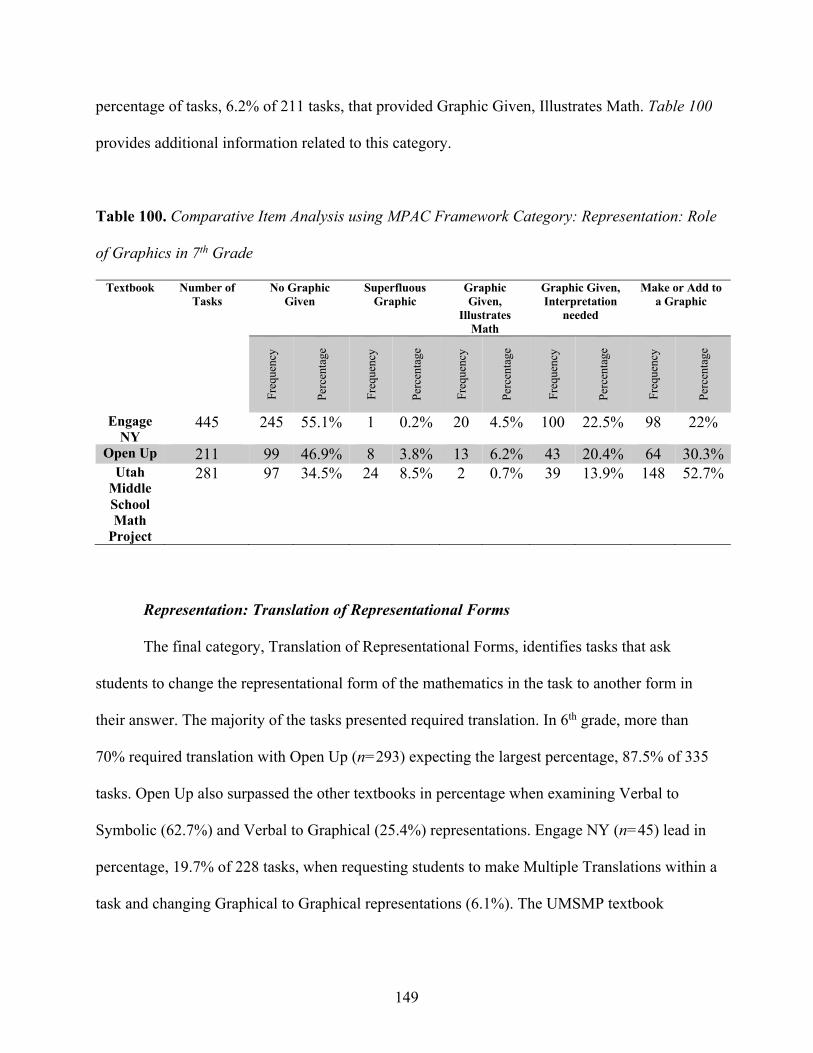
149
percentage of tasks, 6.2% of 211 tasks, that provided Graphic Given, Illustrates Math. Table 100
provides additional information related to this category.
Table 100. Comparative Item Analysis using MPAC Framework Category: Representation: Role
of Graphics in 7th Grade
Textbook Number of Tasks
No Graphic Given
Superfluous Graphic
Graphic Given,
Illustrates Math
Graphic Given, Interpretation
needed
Make or Add to a Graphic
Freq
uenc
y
Perc
enta
ge
Freq
uenc
y
Perc
enta
ge
Freq
uenc
y
Perc
enta
ge
Freq
uenc
y
Perc
enta
ge
Freq
uenc
y
Perc
enta
ge
Engage NY
445 245 55.1% 1 0.2% 20 4.5% 100 22.5% 98 22%
Open Up 211 99 46.9% 8 3.8% 13 6.2% 43 20.4% 64 30.3% Utah
Middle School Math
Project
281 97 34.5% 24 8.5% 2 0.7% 39 13.9% 148 52.7%
Representation: Translation of Representational Forms
The final category, Translation of Representational Forms, identifies tasks that ask
students to change the representational form of the mathematics in the task to another form in
their answer. The majority of the tasks presented required translation. In 6th grade, more than
70% required translation with Open Up (n=293) expecting the largest percentage, 87.5% of 335
tasks. Open Up also surpassed the other textbooks in percentage when examining Verbal to
Symbolic (62.7%) and Verbal to Graphical (25.4%) representations. Engage NY (n=45) lead in
percentage, 19.7% of 228 tasks, when requesting students to make Multiple Translations within a
task and changing Graphical to Graphical representations (6.1%). The UMSMP textbook
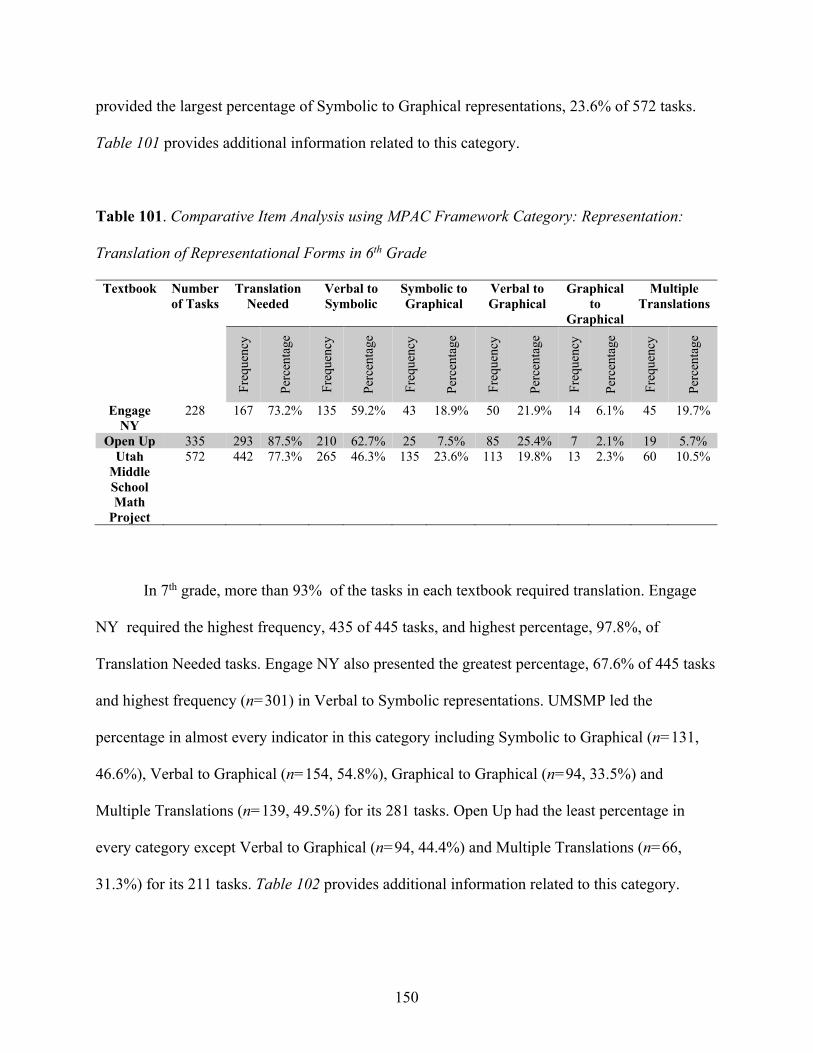
150
provided the largest percentage of Symbolic to Graphical representations, 23.6% of 572 tasks.
Table 101 provides additional information related to this category.
Table 101. Comparative Item Analysis using MPAC Framework Category: Representation:
Translation of Representational Forms in 6th Grade
Textbook Number of Tasks
Translation Needed
Verbal to Symbolic
Symbolic to Graphical
Verbal to Graphical
Graphical to
Graphical
Multiple Translations
Freq
uenc
y
Perc
enta
ge
Freq
uenc
y
Perc
enta
ge
Freq
uenc
y
Perc
enta
ge
Freq
uenc
y
Perc
enta
ge
Freq
uenc
y
Perc
enta
ge
Freq
uenc
y
Perc
enta
ge
Engage NY
228 167 73.2% 135 59.2% 43 18.9% 50 21.9% 14 6.1% 45 19.7%
Open Up 335 293 87.5% 210 62.7% 25 7.5% 85 25.4% 7 2.1% 19 5.7% Utah
Middle School Math
Project
572 442 77.3% 265 46.3% 135 23.6% 113 19.8% 13 2.3% 60 10.5%
In 7th grade, more than 93% of the tasks in each textbook required translation. Engage
NY required the highest frequency, 435 of 445 tasks, and highest percentage, 97.8%, of
Translation Needed tasks. Engage NY also presented the greatest percentage, 67.6% of 445 tasks
and highest frequency (n=301) in Verbal to Symbolic representations. UMSMP led the
percentage in almost every indicator in this category including Symbolic to Graphical (n=131,
46.6%), Verbal to Graphical (n=154, 54.8%), Graphical to Graphical (n=94, 33.5%) and
Multiple Translations (n=139, 49.5%) for its 281 tasks. Open Up had the least percentage in
every category except Verbal to Graphical (n=94, 44.4%) and Multiple Translations (n=66,
31.3%) for its 211 tasks. Table 102 provides additional information related to this category.
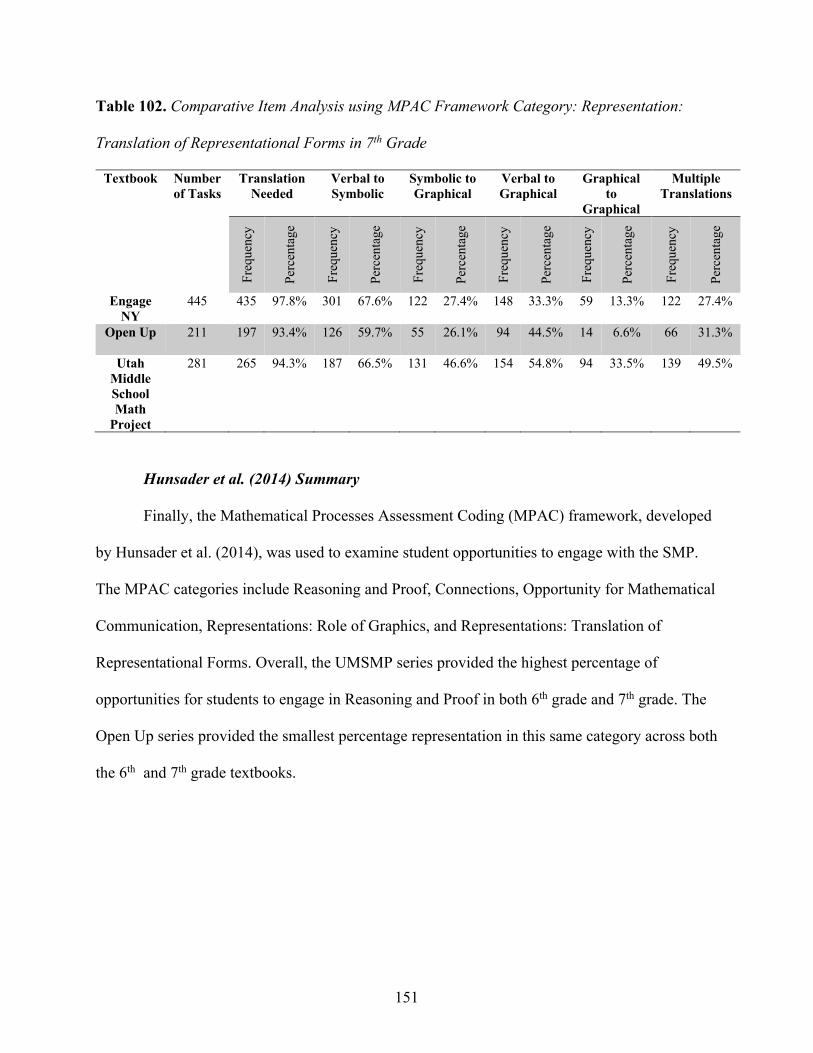
151
Table 102. Comparative Item Analysis using MPAC Framework Category: Representation:
Translation of Representational Forms in 7th Grade
Textbook Number of Tasks
Translation Needed
Verbal to Symbolic
Symbolic to Graphical
Verbal to Graphical
Graphical to
Graphical
Multiple Translations
Freq
uenc
y
Perc
enta
ge
Freq
uenc
y
Perc
enta
ge
Freq
uenc
y
Perc
enta
ge
Freq
uenc
y
Perc
enta
ge
Freq
uenc
y
Perc
enta
ge
Freq
uenc
y
Perc
enta
ge
Engage NY
445 435 97.8% 301 67.6% 122 27.4% 148 33.3% 59 13.3% 122 27.4%
Open Up 211 197 93.4% 126 59.7% 55 26.1% 94 44.5% 14 6.6% 66 31.3%
Utah Middle School Math
Project
281 265 94.3% 187 66.5% 131 46.6% 154 54.8% 94 33.5% 139 49.5%
Hunsader et al. (2014) Summary
Finally, the Mathematical Processes Assessment Coding (MPAC) framework, developed
by Hunsader et al. (2014), was used to examine student opportunities to engage with the SMP.
The MPAC categories include Reasoning and Proof, Connections, Opportunity for Mathematical
Communication, Representations: Role of Graphics, and Representations: Translation of
Representational Forms. Overall, the UMSMP series provided the highest percentage of
opportunities for students to engage in Reasoning and Proof in both 6th grade and 7th grade. The
Open Up series provided the smallest percentage representation in this same category across both
the 6th and 7th grade textbooks.
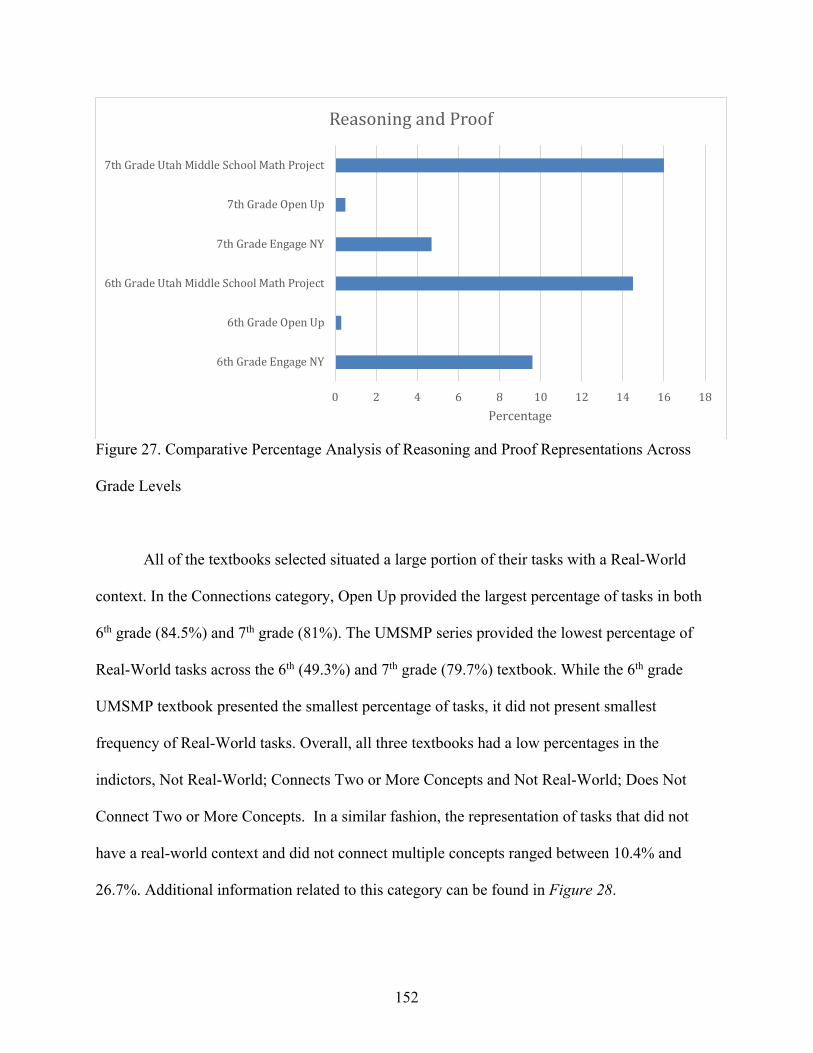
152
Figure 27. Comparative Percentage Analysis of Reasoning and Proof Representations Across
Grade Levels
All of the textbooks selected situated a large portion of their tasks with a Real-World
context. In the Connections category, Open Up provided the largest percentage of tasks in both
6th grade (84.5%) and 7th grade (81%). The UMSMP series provided the lowest percentage of
Real-World tasks across the 6th (49.3%) and 7th grade (79.7%) textbook. While the 6th grade
UMSMP textbook presented the smallest percentage of tasks, it did not present smallest
frequency of Real-World tasks. Overall, all three textbooks had a low percentages in the
indictors, Not Real-World; Connects Two or More Concepts and Not Real-World; Does Not
Connect Two or More Concepts. In a similar fashion, the representation of tasks that did not
have a real-world context and did not connect multiple concepts ranged between 10.4% and
26.7%. Additional information related to this category can be found in Figure 28.
0 2 4 6 8 10 12 14 16 18
6thGradeEngageNY
6thGradeOpenUp
6thGradeUtahMiddleSchoolMathProject
7thGradeEngageNY
7thGradeOpenUp
7thGradeUtahMiddleSchoolMathProject
Percentage
ReasoningandProof
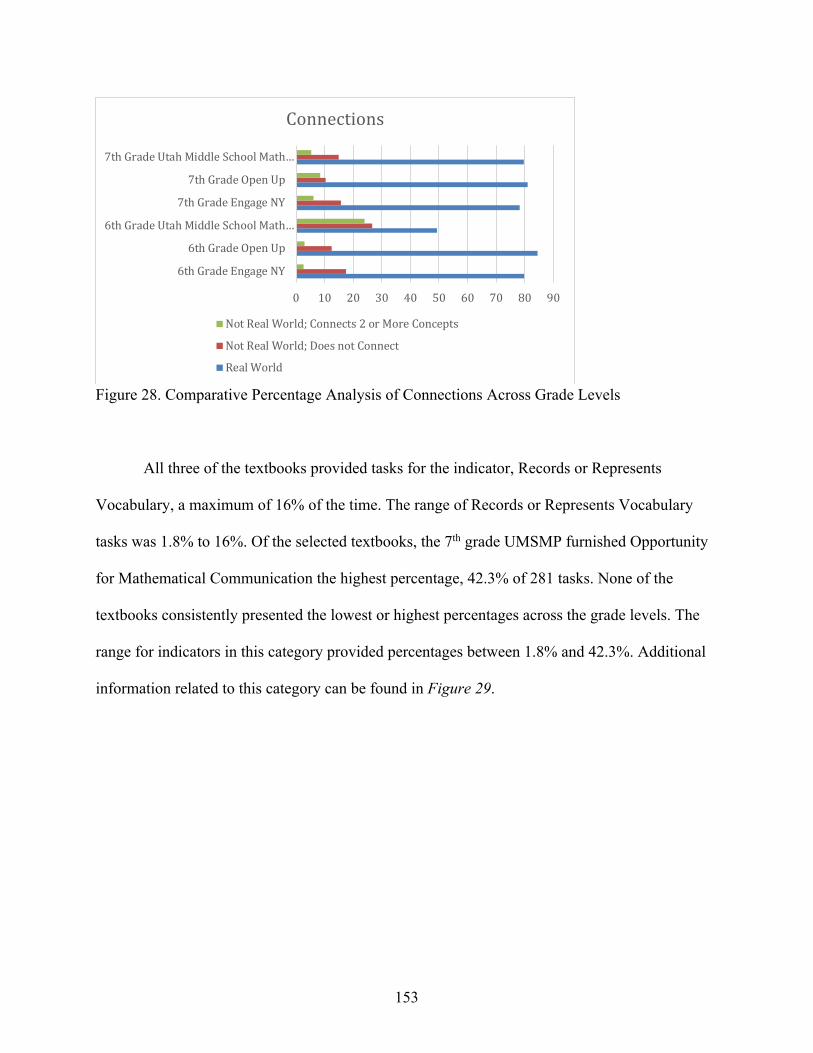
153
Figure 28. Comparative Percentage Analysis of Connections Across Grade Levels
All three of the textbooks provided tasks for the indicator, Records or Represents
Vocabulary, a maximum of 16% of the time. The range of Records or Represents Vocabulary
tasks was 1.8% to 16%. Of the selected textbooks, the 7th grade UMSMP furnished Opportunity
for Mathematical Communication the highest percentage, 42.3% of 281 tasks. None of the
textbooks consistently presented the lowest or highest percentages across the grade levels. The
range for indicators in this category provided percentages between 1.8% and 42.3%. Additional
information related to this category can be found in Figure 29.
0 10 20 30 40 50 60 70 80 90
6thGradeEngageNY
6thGradeOpenUp
6thGradeUtahMiddleSchoolMath…
7thGradeEngageNY
7thGradeOpenUp
7thGradeUtahMiddleSchoolMath…
Connections
NotRealWorld;Connects2orMoreConcepts
NotRealWorld;DoesnotConnect
RealWorld
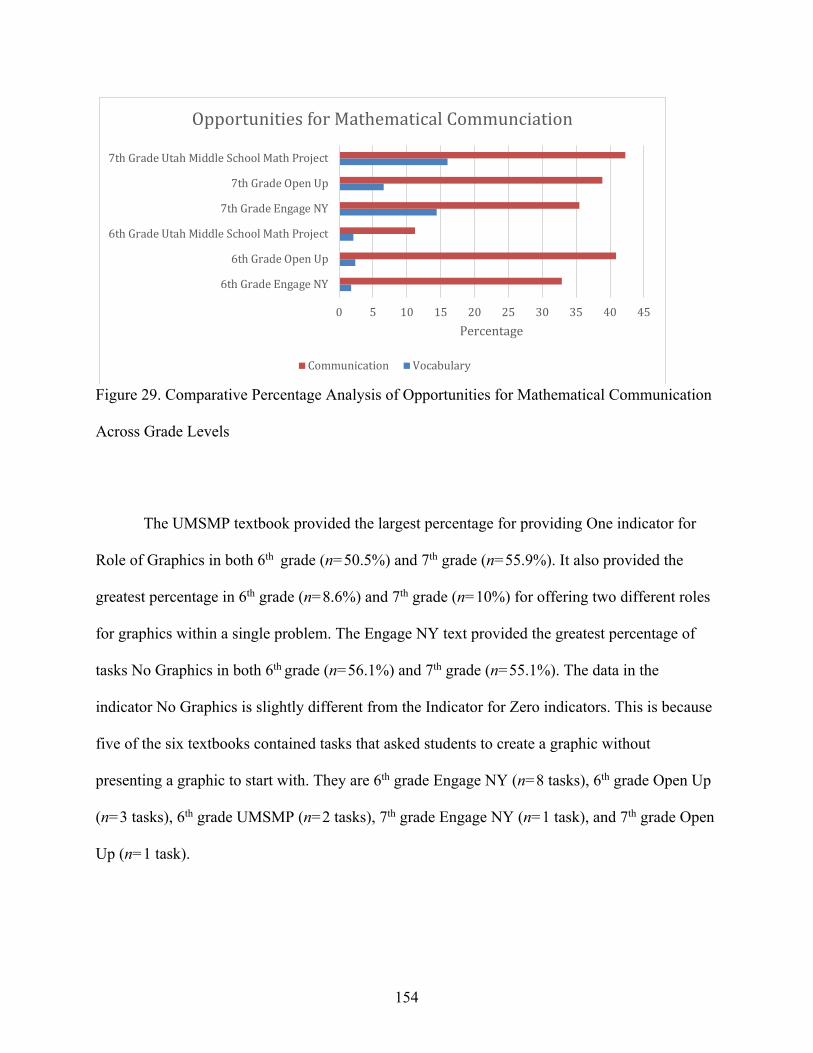
154
Figure 29. Comparative Percentage Analysis of Opportunities for Mathematical Communication
Across Grade Levels
The UMSMP textbook provided the largest percentage for providing One indicator for
Role of Graphics in both 6th grade (n=50.5%) and 7th grade (n=55.9%). It also provided the
greatest percentage in 6th grade (n=8.6%) and 7th grade (n=10%) for offering two different roles
for graphics within a single problem. The Engage NY text provided the greatest percentage of
tasks No Graphics in both 6th grade (n=56.1%) and 7th grade (n=55.1%). The data in the
indicator No Graphics is slightly different from the Indicator for Zero indicators. This is because
five of the six textbooks contained tasks that asked students to create a graphic without
presenting a graphic to start with. They are 6th grade Engage NY (n=8 tasks), 6th grade Open Up
(n=3 tasks), 6th grade UMSMP (n=2 tasks), 7th grade Engage NY (n=1 task), and 7th grade Open
Up (n=1 task).
0 5 10 15 20 25 30 35 40 45
6thGradeEngageNY
6thGradeOpenUp
6thGradeUtahMiddleSchoolMathProject
7thGradeEngageNY
7thGradeOpenUp
7thGradeUtahMiddleSchoolMathProject
Percentage
OpportunitiesforMathematicalCommunciation
Communication Vocabulary
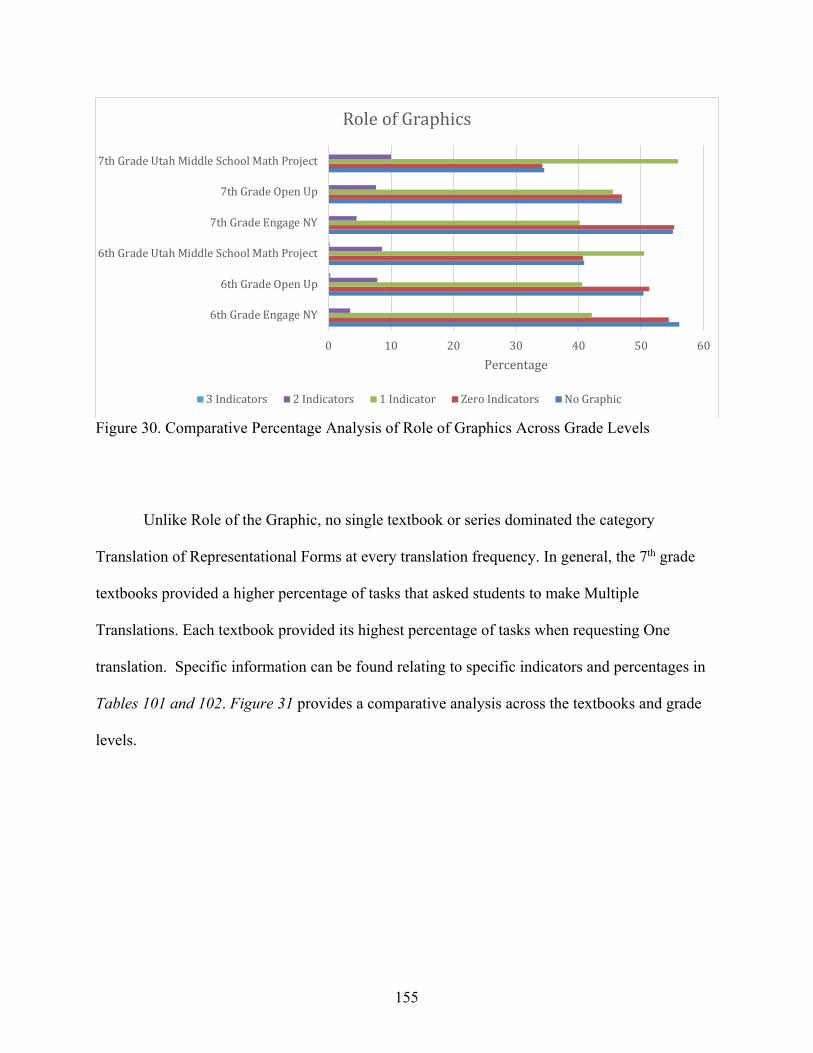
155
Figure 30. Comparative Percentage Analysis of Role of Graphics Across Grade Levels
Unlike Role of the Graphic, no single textbook or series dominated the category
Translation of Representational Forms at every translation frequency. In general, the 7th grade
textbooks provided a higher percentage of tasks that asked students to make Multiple
Translations. Each textbook provided its highest percentage of tasks when requesting One
translation. Specific information can be found relating to specific indicators and percentages in
Tables 101 and 102. Figure 31 provides a comparative analysis across the textbooks and grade
levels.
0 10 20 30 40 50 60
6thGradeEngageNY
6thGradeOpenUp
6thGradeUtahMiddleSchoolMathProject
7thGradeEngageNY
7thGradeOpenUp
7thGradeUtahMiddleSchoolMathProject
Percentage
RoleofGraphics
3Indicators 2Indicators 1Indicator ZeroIndicators NoGraphic
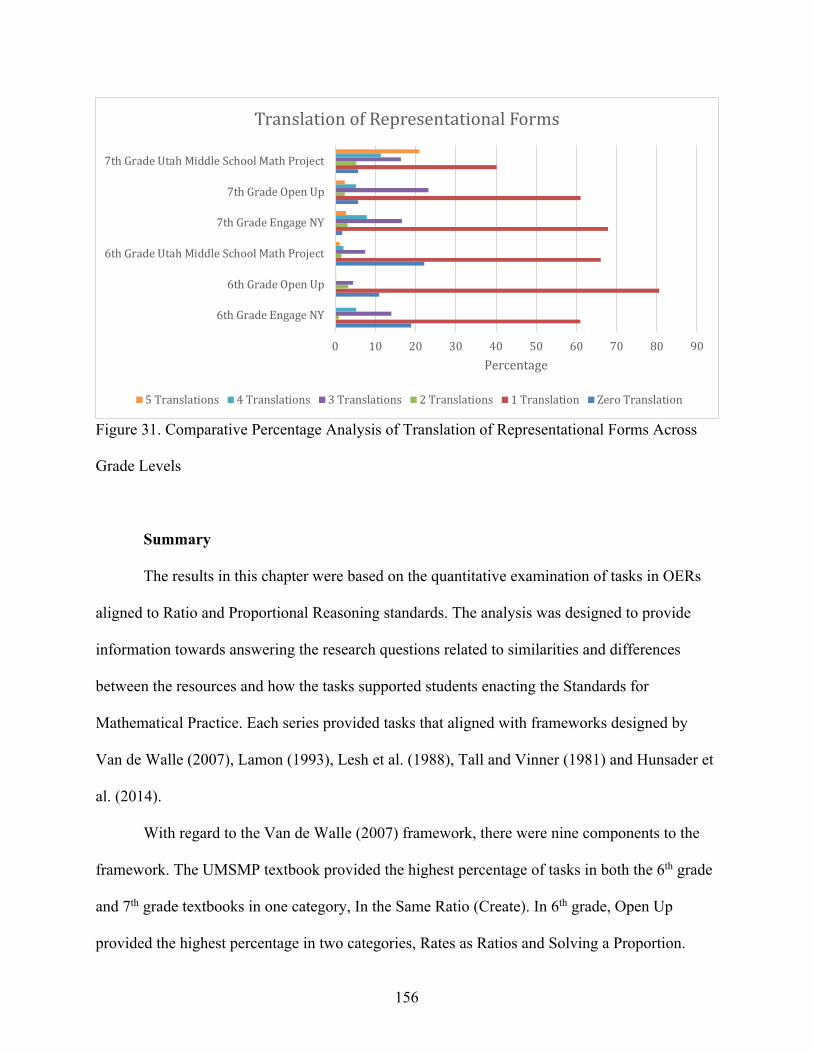
156
Figure 31. Comparative Percentage Analysis of Translation of Representational Forms Across
Grade Levels
Summary
The results in this chapter were based on the quantitative examination of tasks in OERs
aligned to Ratio and Proportional Reasoning standards. The analysis was designed to provide
information towards answering the research questions related to similarities and differences
between the resources and how the tasks supported students enacting the Standards for
Mathematical Practice. Each series provided tasks that aligned with frameworks designed by
Van de Walle (2007), Lamon (1993), Lesh et al. (1988), Tall and Vinner (1981) and Hunsader et
al. (2014).
With regard to the Van de Walle (2007) framework, there were nine components to the
framework. The UMSMP textbook provided the highest percentage of tasks in both the 6th grade
and 7th grade textbooks in one category, In the Same Ratio (Create). In 6th grade, Open Up
provided the highest percentage in two categories, Rates as Ratios and Solving a Proportion.
0 10 20 30 40 50 60 70 80 90
6thGradeEngageNY
6thGradeOpenUp
6thGradeUtahMiddleSchoolMathProject
7thGradeEngageNY
7thGradeOpenUp
7thGradeUtahMiddleSchoolMathProject
Percentage
TranslationofRepresentationalForms
5Translations 4Translations 3Translations 2Translations 1Translation ZeroTranslation
157
UMSMP provided the highest percentage in three categories as well, Part to Whole, Part to Part
and In the Same Ratio (Create). Engage NY outperformed the other two textbooks, although only
slightly, in one category, In the Same Ratio (Identify). None of the 6th grade textbooks provided
representations to address Corresponding Parts of Similar Figures or Golden Ratio tasks. In 7th
grade, Open Up did not provided the highest percentage in any category. The UMSMP provided
the highest percentage in four categories, Rates as Ratios, In the Same Ratio (Identify), In the
Same Ratio (Create) and Slope/Rate of Change. Likewise, Engage NY outperformed the other
two textbooks in 4 categories, Part to Whole, Part to Part, Solving a Proportion and
Corresponding Parts of Similar Figures. Also, as with 6th grade, none of the textbooks offered
Golden Ratio tasks.
Based on Lamon (1993) framework, four different types of proportions were examined.
No single textbook provided the highest percentage in every indicator. In addition, no textbook
provided the highest percentage in a single category for both 6th and 7th grades. In 6th grade, the
rankings were evenly distributed, each textbook providing the highest percentage in different
categories, Engage NY for Well-Chunked Measures, Open Up for Associated Sets and UMSMP
for Part-Part-Whole. Stretchers and Shrinkers was eliminated in 6th grade due to a lack of
representations. In 7th grade, both Engage NY and Open Up included Stretchers and Shrinkers
tasks, but USMSMP did not. The percentages in Engage NY exceeded the other textbooks in
two categories, Part-Part-Whole and Stretchers and Shrinkers, while UMSMP and Open Up
surpassed others in one category each, Associated Sets and Well-Chunked Measures
respectively.
As with the Lamon (1993) framework, no single textbook dominated every category in
the six part framework of Lesh et al (1988). Open Up provided the greatest percentage in both
158
the 6th grade and 7th grade analyses of the same category in Units with their Measures. UMSMP
provided the greatest percentage in both the 6th grade and 7th grade analyses of the same category
in Missing Value and Conversion from Ratios to Rates to Fractions. In addition, in 6th grade,
Open Up presented the greatest percentage in a total of 3 categories, Comparison,
Transformation and Units with their Measures. In 7th grade, UMSMP dominated the majority of
the categories with the highest-ranking percentages in four categories, namely Missing Value,
Comparison, Conversion from Ratios to Rates to Fractions, and Translating Representational
Modes. Engage NY provided the highest percentage of tasks in a single category in 6th grade,
Translating Representational Modes and a different single category in 7th grade, Transformation.
Next, Tall and Vinner's (1981) framework used eight characteristics of the concept image
to analyze tasks, namely, Figure, Table, Graph/Model, Real-World, Formal Properties Stated,
Formal Definition, Student Created Definition, and Tools for Manipulation. Comparatively,
Open Up provided the highest percentage in both the 6th grade and 7th grade versions of their
textbook for a single category, Real-World. Likewise, Open Up provided the highest percentage
of tasks in three 6th grade categories, namely, Figure, Real-World, and Formal Properties Stated,
and three different 7th grade categories, namely, Real-World, Formal Definition, and Student
Created Definition. UMSMP textbook provided the largest percentage in both the 6th and 7th
grade textbooks in two categories, Graph/Model and Tools for Manipulation. In addition,
UMSMP provided the highest percentage in four 7th grade categories, Table, Graph/Model,
Formal Property, and Tools for Manipulation. Engage NY provided the highest percentage of
tasks in three 6th grade categories, namely, Table, Formal Definition, and Student Created
Definition and one 7th grade category, Figure.
159
Moreover, this study also examined the frequency of the number of indicators addressed
in Tall and Vinner's (1981) framework per task. In 6th grade, the Open Up text contributed the
greatest percentage in four concept image component combinations, One Indicator, Three
Indicators, Four Indicators and Five Indicators. The UMSMP textbook provided the largest
percentage of concept image combinations in the remaining three combinations, Zero Indicators,
Two Indicators and Six Indicators. In 7th grade, Open Up exceeded the other textbooks in three
indicator combination categories, Zero Indicators, Two Indicators, and Three Indicators, as did
UMSMP in Four Indicators, Five Indicators and Six Indicators. Engage NY represented the
greatest percentage in the remaining element combinations, One Indicator.
Finally, the framework developed by Hunsader et al. (2014) was used to examine student
opportunities to engage with the SMP. The five MPAC categories were used in this analysis. The
UMSMP series provided the highest percentage of opportunities for students to engage in
Reasoning and Proof in both 6th and 7th grade. The majority of the problems examined contained
Real-World context across each grade level and textbook. The Open Up text provide the greatest
percentage of Real-World representations in both 6th grade and 7th grade. Only the 6th grade
UMSMP textbook provided less than half of their representations with Real-World contexts. All
of the textbooks provided some form of Communication task, whether as Record and Represent
Vocabulary or Opportunity for Mathematical Communication tasks. The 6th grade Open UP
textbook provided the greatest percentage in both indicators, Record and Represent Vocabulary
and Opportunity for Communication. In 7th grade, the largest percentage for each
Communications indicator was provided by UMSMP. For Role of Graphics, The UMSMP
textbook provided the largest percentage of tasks in 7th grade for Graphics Given; Needs
Interpretation and in both 6th and 7th grades that contained Superfluous Graphics, and Make or
160
Add to a Graphic. UMSMP also required the highest percentage for One Indicator and Two
Indicators in both 6th and 7th grades. The Engage NY text provided the greatest percentage of
tasks with No Graphics in both 6th and 7th grades and Given, Needs Interpretation in 6th grade
only. Open Up provided the highest percentage in both 6th and 7th grades for Given not Needed;
Illustrates the Math. In Translation of Representational Forms, no single textbook or series
dominated the category at every translation frequency. In general, the 7th grade textbooks
provided a higher percentage of tasks that asked students to make multiple translations. The
UMSMP 6th and 7th grade textbooks contained the largest percentage of tasks when tasks
contained Zero Translations, Two Translations, and Five Translations. UMSMP also provided
the largest percentage in the 6th grade textbooks for Three Translations, while the 7th grade
textbooks provided the greatest percentage for the category, Five Translations. Interestingly, the
Open Up textbook provided the same percentage as the UMSMP textbook in the category, Zero
Translations. Open Up also contained the highest percentage in 6th grade in the category, One
Translation, and in 7th grade for Three Translations. Likewise, the Engage NY textbook
presented the largest percentage in one 6th grade category, Four Translations, and one 7th grade
category, One Translation.
Each textbook shared positional ranking amongst the analyzed frameworks. One textbook
did not consistently dominate the other textbooks. The following chapter will discuss the
implications and recommendations based on the results.
161
Chapter 5
Summary, Discussion, Recommendations and Limitations
Summary of the Problem and Research Questions
Proportionality concepts connect multiple topics across the standards in grades 6-8
(NCTM, 2000). Moreover, the types of problems students have the opportunity to engage in
affect student learning. Teachers often make pedagogical choices based on the available
curriculum documents, textbooks, and provided materials. This study sought to examine three
OERs to assess the similarities and differences between the resources.
The study analyzed tasks within each student version according to their features,
organizational structure, and influence on how students understand proportionality concepts. The
following questions guided this analysis:
1. What are similarities and differences between the organizational structures and features
of online OER textbooks with relation to ratio and proportional reasoning standards?
2. To what extent do online OER textbooks provide opportunities for students to utilize
the Standards for Mathematical Practice to address ratio and proportional reasoning
standards?
Methods
For this study, three middle school textbook series were examined: Engage NY, Open Up
Resources (Open Up), and the Utah Middle School Math Project (UMSMP). In each of the
series, only the designated sections devoted to the Ratio and Proportional Reasoning standards
162
were examined. The 8th-grade version of each textbook series was omitted. Tasks that displayed
characteristics based on the research collected from Van de Walle (2007), Lamon (1993), and
Lesh et al. (1988) were coded. The researcher used a spreadsheet to organize and code features
of the tasks. The data were coded relative to Van de Walle's (2007) framework, which included a
Part-to-Whole, Part-to-Part, Rates as Ratios, Corresponding Parts of Similar Figures, Slope/rate
of change, Golden Ratio, In the Same Ratio, and Solving a Proportion. The data were also coded
relative to Lamon's (1993) framework, which includes Part-Part-Whole, Associated Sets, Well-
Chunked Measures, and Stretchers and Shrinkers. The data was subsequently coded based on the
framework of Lesh et al. (1988), which includes Missing Value, Comparison, Transformation,
Mean Value, Conversion from Ratios to Rates to Fractions, Units with Their Measures, and
Translating Representational Modes. Additional details and a list of the features coded by the
researcher are found in Table 12.
Next, tasks were examined to determine whether they contained elements that supported
the development of concept images, according to Tall and Vinner (1981). Tall and Vinner's
(1981) framework included a Figure, Table, Graph/Model, Real-World Context, Formal
Properties Stated, Formal Definition, Student Created Definition, and Tools for Manipulation.
Finally, tasks were examined to determine the extent to which they supported students engaging
in the Standards for Mathematical Practice. Tasks that denoted specific Standards for
Mathematical Practice were recorded. The MPAC framework developed by Hunsader et al.
(2014) was used to examine the extent the tasks provided an opportunity for students to engage
with the Standards for Mathematical Practice. Thus, the tasks were coded relative to Reasoning
and Proof, Opportunity for Mathematical Communication, Connections, Role of Graphics and
Translation of Representational Modes. Several of these features contained sub-indicators that
163
can be examined in Table 12. In addition, this study recorded organizational features like
whether a ratio was Provided Or Requested, whether an Equation Described the Relationship,
whether Technology was Suggested or Incorporated into the task, and Task Features. Task
Features included the Name of the Textbook, Grade Level, Lesson Name, Standard Addressed,
Page Number, a Brief Description, the Number Of Parts the task contained, the Location of the
Task Within the Lesson, Errors, whether the task represents an Example or Non-Example, and
the Concept Addressed.
The general approach to this analysis was to examine the relative frequency of codes
from various features distributed across the textbooks. Comparisons among textbook
frequencies were also conducted at various grade levels, in the same series, across textbook
series at different grade levels, and of features of individual frameworks.
Findings
The results in this study were based on the quantitative examination of tasks in OERs that
addressed ratio and proportional reasoning standards. It documented similarities and differences
among the textbooks based on the conceptual framework that embodied Van de Walle (2007),
Lamon (1993), Lesh et al. (1988), Tall and Vinner (1981) and Hunsader et al. (2014).
Similarities and differences between the organizational structures and features
Proportionality representations are critical to multiple concepts in mathematics (NCTM,
2000, p. 151). The textbooks presented multiple opportunities for students to engage in
proportionality representations, namely algebraically, graphically, and verbally (Lanius &
Williams, 2003). The selected textbooks also chose to provide a plethora of real-world and
164
practical application context for students to engage in, as supported by NCTM (NCTM, 2000).
The textbooks are similar in the major concepts they address, the structure of the lessons, and
that teachers are expected to be the facilitator of the content. For example, each teacher's version
of the textbook contained detailed explanations and directions on how to structure the classwork
or activity. Also, each textbook contained very few completed examples like a traditional
textbook would contain. The majority of the examples in these textbooks required input from the
student.
First, based on the Van de Walle (2007) framework, the three 6th grade textbooks were
similar in range in the categories Rates as Ratios, In the Same Ratio (Identify), and Solving
Proportions. They were different in that every category in 7th grade had a remarkably different
percentage value. For example, for the category Part-to-Whole, Engage NY (49.9%) was
significantly higher than its other counterparts, Open Up (8.5%) and UMSMP (14.9%). The 6th
and 7th-grade versions are also different in that none of the 6th-grade versions included tasks
that would address corresponding parts of similar figures or slope.
Second, based on the Lamon (1993) framework, the 6th-grade textbooks all excluded
tasks on Stretchers and Shrinkers in their Ratio and Proportion sections. Open Up did not provide
Stretcher and Shrinker problems in its 7th-grade task either. None of the textbooks dominated
more than the others. This fluctuation in emphasis seems to flow from one grade level to the
next. For example, the 6th-grade version of the UMSMP textbook provided the lowest
percentage in Associated Sets (17.1%) but increased its emphasis in 7th grade to the largest
percentage (52.3%). This balance seems to support coherence between the grade-level textbooks.
Based on Lesh et al. (1988), the textbooks are the same in that coherence appears to be
supported. Areas of emphasis in one grade level are relatively balanced between each other. For
165
instance, in the category for Comparison proportions, the Engage NY textbook presented 14.5%
of its 228 tasks in 6th grade and decreased its representation to 10.6% of its 445 tasks in 7th
grade. The Open Up textbook alternated similarly; its percentage changed from 16.4% in 6th
grade to 5.2% in 7th grade. The textbooks are similar in that they each present less than fifty
percent of their tasks for all of the indicators except Part-Part-Whole in 6th grade and Associated
Sets in 7th grade for the UMSMP textbook. Also, each of the textbooks tends to emphasis
Missing Value problems and tasks that emphasize the Units with their Measures. This aligns
with Adding It Up's (2001) focus on Missing Value problems. The relation may also be a result
of the emphasis on Real-World contexts in the textbooks.
The components of Tall and Vinner's (1981) concept image were addressed in every
textbook. Generally, Formal Properties Stated was not addressed in the student versions of the
texts. Properties were highlighted in the teacher versions but omitted from the tasks for student
completion. Many of the tasks were structured for students to explore mathematical properties
not explicitly stated. Tables, Graph/Models were presented more than Figures. The purpose of
many of the Tables and Graph/Models was for students to manipulate while completing the task.
Although nominal for all, the textbooks varied in their emphasis on Student Created Definitions
for concepts.
Opportunities for students to utilize the Standards for Mathematical Practice
Finally, the MPAC framework, developed by Hunsader et al. (2014), was used to
determine whether the selected textbooks provided students an opportunity to engage in the
Standards for Mathematical Practice. Every textbook provided tasks that addressed every
indicator. Of the categories in the MPAC framework , Reasoning and Proof was the least
166
attended to. All of the textbooks provided at least one task that asked students to justify their
answers. Textbooks did provide Opportunities for Mathematical Communication for students to
explain their answers that ranged between 11.2 % to 42.3% of the total possible tasks. The
majority of the tasks in all of the textbooks contained a Real-World context.
Similarly, the textbooks did not include many Superfluous Graphics. The selected
textbooks were more likely to omit a graphic than they were to include a graphic without a
purpose. Graphics that were Given, Not Needed; Illustrates the Mathematics were slightly higher
than Superfluous Graphics but less so than images that were Given; Needs Interpretation to solve
the problem. The most considerable difference between the textbooks was in how they expected
students to translate their answers from one representation to another representation. One
disadvantage of a textbook that relies heavily on word problems, like these do, is that students
whose native language is not English may struggle with the amount of reading and representation
translations required to complete tasks. The UMSMP textbook supplied multiple problems where
students were asked to change the representation multiple times in a single problem. For
example, a word problem may ask the student to write an equation to describe the situation,
create a table of values for the equation, and then graph it. If a student struggled with
understanding the context of the task, they might have difficulty completing the task despite
having the skills to complete the components of the task. Providing features that allow students
to explore concepts visually or in a tactile fashion could support learners who struggle with
language. The Open Up textbook was the only OER that included dynamic features. Despite this
option, it did not provide the highest percentage for most of the Translation Of Representational
Modes indicators.
167
Discussion
The OERs in this study provided a variety of contexts, and Ratio and Proportional
Reasoning tasks . The content included and excluded from the various curricula created
variations in what students would have the opportunity to learn within the course of instruction.
Sometimes teachers make adjustments knowingly. Other times teachers are disabled or enabled
based on the content in the resource they select and how they choose to enact that content with
students (Usiskin, 2013). Students utilizing these resources have multiple opportunities to engage
in proportionality tasks.
The combination of the multiple frameworks in this study allowed the researcher to
examine each textbook for various characteristics. Few of the categories in the selected
frameworks failed to have tasks aligned. Further, some topics and representations were difficult
to code with the existing research described characteristics. For instance, the selected
frameworks did not explicitly address the percent representations. Percentages constitute a
significant part of proportionality representations that would ideally have its own category. Their
omission was addressed by including percent tasks in other categories based on the context of the
task, like Part-to-Whole ratios. Likewise, the framework did not address an ideal scope and
sequence for proportionality concepts. Textbooks sequence and emphasize proportionality
concepts in a variety of ways across multiple grade levels. Depending on the curriculum
resources teachers use, students may have gaps in their conceptual development of various
mathematical objectives relative to Ratio and Proportional Reasoning. This variance across
textbooks could create issues as students learn subsequent topics, or enroll in courses that rely on
a students' flexible understanding of proportionality, like functions, creating equations,
modeling, and geometry.
168
Additionally, according to the publishers' remarks, all of the selected Common Core State
Standards were addressed. Tasks related to the conceptual framework categories may present
themselves in sections outside the scope of this study. Each of the textbooks selected aligned
their content with the Common Core State Standards for Mathematics. However, several states
have opted to forgo using these standards for their own state generated standards. Moreover,
variations in standards, content sequencing, and emphasis from state to state, or district to district
could create issues for students who move from one location to another.
Careful thought should be taken to consider the depth and complexity of the tasks
provided for teachers to present to students. Identifying whether a textbook adequately addresses
a standard or group of standards is a complex task that should be considered when selecting a
resource. The textbooks presented in this study provided varied tasks and contexts for students to
investigate proportionality. Generally, the textbooks were procedural and did not differ
significantly from traditional textbooks. Each textbook provided numerous opportunities for
students to practice those concepts.
In contrast, the UMSMP textbook tended to offer far more tasks than its counterparts.
However, this practice was often a less rigorous repetition of a relatively simple skills, like
simplifying ratios or converting a fraction to a percent. Students completing the assigned practice
may be lulled into thinking they have mastered a concept but may still be unsuccessful when
provided with a different type of task on the same topic. This type of repetitive practice also
poses an issue for students who fail to comprehend the content. Since proportionality is a
foundational concept, misconceptions could create misunderstandings with probability,
equations, functions, similarity, and other concepts that rely on Proportional Reasoning.
169
Most of the tasks contained context, but students were not provided with a variety of
options for creating a response. For example, neither the UMSMP textbook nor the Engage NY
textbook provided any dynamic features that students could use to create responses. This limited
use of technology can impact how students make connections with other aspects of their
knowledge. Due to the static nature of these textbooks, students could receive the same access to
instruction because the textbook did not rely on dynamic features. The exclusion of dynamic
features allowed students to receive the same access to instruction regardless of the economic
position of the institution they attend. In contrast, the exclusion of these features also limits
students who could most benefit from multiple representations. Overall, students were provided
with opportunities typical to traditional textbook counterparts. Nevertheless, providing static
resources, may not be equitable for all students.
The use of technology within these textbooks is concerning. All three series presented
their materials on self-contained platforms. Despite being OERs, both the UMSMP and Engage
NY did not contain any dynamic features. Further, reference was not made to other standard
resources like calculators, rulers, or manipulatives. Open Up was the only textbook that included
features that could be explored by students. The series includes twenty-seven of these features
within the 546 examined tasks. As publishers upgrade their platforms and textbooks, each of the
resources should consider including and increasing the number of dynamic features available to
students. Allowing students to explore representations in addition to the other features already
included could add value to the resources for other educational entities that provide support for
students but not primary instruction.
Each of these textbooks relied on the teacher to provide instruction on the concepts in the
textbooks. Step by step directions and completed example problems were minimal or non-
170
existent for most of the lessons in the three-textbook series. Thus, teacher guidance is paramount
in how and what features are used in instruction. The examples in the textbooks required students
to access information provided by their teachers in order to complete the examples in the
textbooks. Students were limited to the explanation provided by their teachers, and the types of
tasks explored in the examples. Unfortunately, depending on the preparation of the teacher, the
examples may not provide an adequate explanation to exhaust the types of questions needed for
concept mastery. The dependence on teachers to facilitate instruction also means that these
textbooks are not an ideal resource for self-paced learning. Students would miss a great deal of
explicit instruction attempting to use the UMSMP series without the help of their teacher. The
Open Up series and Engage NY series were slightly better at providing explicit instruction or
exploratory options for students to engage with. In addition, the Open Up textbook was the only
series that included dynamic features for students to explore independently. Including dynamic
features is an option that other textbooks should consider.
Since the intent for each series was for the teacher to provide instruction, careful attention
is needed in teacher planning and preparation. Districts intending to utilize these resources as
their primary textbook need to ensure that teachers have adequate time to participate in
professional development for these resources. Each lesson contains multiple pages, with the
respective teacher's editions, that explain the rationale behind the lesson and often additional
resources to support students with various needs during instruction. Teachers may also need
additional training, or may need to collaborate with their colleagues to achieve desired effects
with these resources.
In summary, each of the resources provided a variety of tasks for students to engage with,
although the mathematical rigor and complexity of the tasks presented could be enhanced.
171
Moreover, the reliance on teacher expertise and preparation, can become a mitigating factor in
how the textbooks are enacted.
Recommendations for Future Research
Additional research is needed to determine the effectiveness of these OERs in
comparison to traditional resources and other OERs. The interaction between the instructional
and operational curriculum that considers students' perceptions of what the curriculum offered
and what students learned, should also be investigated (Thompson & Usiskin, 2014). Qualitative
studies have been performed at the collegiate level in other disciplines related to student
perception, perceived effectiveness, student achievement related to the use of OERs but not in
middle school mathematics. Thus, similar qualitative inquiries could be employed at the middle
grades for OERs.
Additionally, research is needed to compare the enacted curriculum when traditional
textbooks versus OER textbooks are utilized. Considering teachers use textbooks differently, and
may make modification as needed, it can help the field to document similarities and differences
as to how teachers use their OERs when compared to the traditional textbooks.
Further research is needed to identify how districts and other educational institutions are
implementing OERs and counteracting usage barriers, inclusive of access to technology. A
longitudinal comparative analysis of resource implementation versus student achievement would
also be beneficial.
Analysis between OER textbooks available as a series versus textbooks available for a
single grade level should be compared as well. A plethora of resources are available as subject-
specific or concept specific materials. Often these resources are created by individuals or small
172
groups dedicated to addressing a specific, immediate content related need. It would benefit the
education community to determine the similarities and differences between the individual
resources and the resources created as a comprehensive series.
Finally, teachers benefit greatly from seeing instruction modeled with students when
using a new resource. Thus, future studies can examine professional development as to how
teachers are supported to use the various resources. The future studies should also seek to
document potential changes in teachers’ instructional practices after participating in professional
development geared towards using OERs.
Summary
OERs have the potential to provide access and opportunity for students from various
backgrounds to engage in research supported mathematics. The resources included in this study
each have their strengths and weaknesses. Notably, the UMSMP provides an abundance of tasks
for students to engage with and then practice independently. Neither the Engage NY nor
UMSMP textbooks require technology to implement their resources, so they may be quickly
adopted by institutions that may not be able to support a technology-rich curriculum. The
similarity in the types of tasks and availability of the resource would ensure that students who
utilize these resources would not be at an extreme disadvantage. In contrast, the Open Up
textbooks provide options for use with or without technology. Students can access a version of
the textbook online or in print. This textbook also provides a One Note integration for
institutions to use with their existing technology infrastructure.
Despite being open digital resources, each of the textbooks contained several errors.
Errors could prove problematic for teachers utilizing the content with students. Existing errors
173
may remain due to a lack of feedback from users or issues in the internal review process. Ideally,
future revisions of all three of the OERs would examine and correct errors. It is reasonable to
presume that several resources may consider updating their content to include a correlation and
alignment to new standards being produced by multiple states.
Curriculum designers may find the comparison of resources time consuming and taxing
on already limited resources. Future research should include an electronic option for coding,
measuring, and comparing resources to support teachers, district leadership and curriculum
designers in determining the most appropriate resource for their needs.
In general, the differences between the textbooks varied based on different attributes of
the various frameworks utilized. Specifically, the Open Up textbook is the only series with
dynamic features embedded within the tasks for students to use. The other textbooks do not
provide or refer to dynamic features or resources despite being hosted in a self-contained digital
platform. Also, the UMSMP textbook has considerably more tasks than other textbooks. The
number of tasks could pose an issue for a teacher attempting to print student editions on a limited
copy budget. Likewise, the formatting and spacing in the Engage NY textbook might pose the
same issue for teachers despite having fewer actual problems for students to complete.
Comparatively, the Open Up resources provide more features for students and teachers to
manipulate. It also provided fewer problems but more features that allow students to explore the
curriculum independent of the teacher. The quality of the Engage NY and UMSMP series would
improve if they included additional features.
Hence, this study can assist teachers, practitioners, and curriculum developers in seeking
resources to identify appropriate materials to support and enhance student achievement. This
study could also support mathematics educators looking for resources for pre-service teachers to
174
utilize in creating standards-aligned grade-level appropriate lessons before and during clinical
experiences. Further, this study provides insight to those looking to enhance or develop OERs for
students and teachers to use as remediation, intervention, or formal instruction. This study
extends the research relative to Open Education Resources implementation within the K-12
environment, specifically Grade 6 and Grade 7. Finally, this study adds to the body of research
related to ratios and proportions by describing how publishers represent proportionality tasks in a
digital environment.
175
References
Banilower, E. R., Smith, P. S., Weiss, I. R., Malzahn, K. A., Campbell, K. M., & Weis, A. M. (2013). Report of the 2012 national survey of science and mathematics education. Retrieved from Chapel Hill, N.C.: http://www.horizon-research.com/2012nssme/wp-content/uploads/2013/02/2012-NSSME-Full-Report-updated-11-13-13.pdf
Bartell, T., Wager, A., Edwards, A., Battey, D., Foote, M., & Spencer, J. (2017). Toward a Framework for Research Linking Equitable Teaching With the Standards for Mathematical Practice(1), 7. Retrieved from http://ezproxy.lib.usf.edu/login?url=http://search.ebscohost.com/login.aspx?direct=true&db=edsbl&AN=RN609483902&site=eds-live
Clark, F. B., & Kamii, C. (1996). Identification of Multiplicative Thinking in Children in Grades 1-5. Journal for Research in Mathematics Education, 27(1), 41-51. doi:10.2307/749196
Common core state standards initiative (2010) Standards for mathematical practice. Retrieved from http://www.corestandards.org/Math/Practice/
Common core state standards initiative (2010) Standards for mathematics. Retrieved from http://www.corestandards.org/wp-content/uploads/Math_Standards1.pdf
Confrey, J., & Smith, E. (1995, 1995). Splitting Covariation, and Their Role in the Development of Exponential Functions, United States.
Cuoco, A., Goldenberg, E. P., & Mark, J. (2010). Organizing a Curriculum around Mathematical Habits of Mind. Mathematics Teacher, 103(9), 682-688.
Davis, J. D., Choppin, J., Drake, C., Roth McDuffie, A., & Carson, C. (2018). U.S. Middle School Mathematics Teachers' Perceptions of the Standards for Mathematical Practice by Textbook Type. International Journal of Research in Education and Science, 4(1), 55-68. Retrieved from http://ezproxy.lib.usf.edu/login?url=http://search.ebscohost.com/login.aspx?direct=true&db=eric&AN=EJ1169787&site=eds-live
De La Cruz, J. A. (2008). A look at middle school mathematics teachers' instruction related to proportional reasoning: A cognitively guided perspective. (69). ProQuest Information & Learning, Retrieved from http://ezproxy.lib.usf.edu/login?url=http://search.ebscohost.com/login.aspx?direct=true&db=psyh&AN=2008-99190-597&site=eds-live Available from EBSCOhost psyh database.
Dole, S. (2008). Ratio tables to promote proportional reasoning in the primary classroom: Shelley Dole describes ratio tables and demonstrates how they can be used to support the development of proportional reasoning. Australian Primary Mathematics Classroom(2), 18. Retrieved from http://ezproxy.lib.usf.edu/login?url=http://search.ebscohost.com/login.aspx?direct=true&db=edsgao&AN=edsgcl.181898040&site=eds-live
Fan, L., Zhu, Y., & Miao, Z. (2013). Textbook research in mathematics education: Development status and directions. ZDM, 45(September), 633-646. doi:10.1007/s11858-013-0539-x
176
Ganapathi, J. (2018). Open Educational Resources: Challenges and Opportunities in Indian Primary Education. International Review of Research in Open and Distributed Learning, 19(3), 114-128. Retrieved from http://ezproxy.lib.usf.edu/login?url=http://search.ebscohost.com/login.aspx?direct=true&db=eric&AN=EJ1185196&site=eds-live
Gonzales, P. A. (2001). Pursuing excellence : comparisons of international eighth-grade mathematics and science achievement from a U.S. perspective, 1995 and 1999 : initial findings from the Third International Mathematics and Science Study-Repeat: Washington, D.C. : National Center for Education Statistics : For sale by the Supt. of Docs., U.S. G.P.O., [2001].
Hart, K. (1988). Ratio and Proportion. In J. B. Hiebert, M (Ed.), Number Concepts and Operations in Middle Grades (Vol. 2). Reston, VA: National Council of Teachers of Mathematics.
William and Floria Hewlett Foundation (2019). Open Educational Resources. Retrieved from https://hewlett.org/strategy/open-educational-resources/
Hunsader, P. D., Thompson, D. R., Zorin, B., Mohn, A. L., Zakrzewski, J., Karadeniz, I., MacDonald, G. (2014). Assessments accompanying published textbooks: the extent to which mathematical processes are evident(5), 797. Retrieved from http://ezproxy.lib.usf.edu/login?url=http://search.ebscohost.com/login.aspx?direct=true&db=edsbl&AN=RN360765530&site=eds-live
Hylén, J. (2006). Open educational resources: Opportunities and challenges. Proceedings of Open Education, 4963.
Illustrative Mathematics. (Producer). (2017). Introducting Ratios. Grade 6 mathematics. Retrieved from https://access.openupresources.org/curricula/our6-8math-v1/6/teachers/index.html
Karplus, R., & Karplus, E. F. (2002). Intellectual development beyond elementary school III-Ratio: A longitudinal study. In R. G. Fuller (Ed.), A love of discovery: Science Education-The second career of Robert Karplus (pp. 119-125). New York, New York: Kluwer Academic/Plenum Publishers.
Kenney, P. A., Lindquist, M. M., & Heffernan, C. L. (2002). Butterflies and caterpillars: Multiplicative and proportional reasoning in the early years. In B. H. Litwiller & G. W. Bright (Eds.), Making sense of fractions, ratios, and proportions: 2002 yearbook. Reston, Va: National Council of Teachers of Mathematics.
Kent, L. B., Arnosky, J., & McMonagle, J. (2002). Using representational contexts to support multiplicative reasoning. In B. H. Litwiller & G. W. Bright (Eds.), Making sense of fractions, ratios, and proportions (pp. 145-152). Reston, Va: National Council of Teachers of Mathematics.
Kimmons, R. (2015). OER Quality and Adaptation in K-12: Comparing Teacher Evaluations of Copyright-Restricted, Open, and Open/Adapted Textbooks. International Review of Research in Open & Distance Learning, 16(5), 39-57. doi:10.19173/irrodl.v16i5.2341
Lamon, S. J. (1993). Ratio and proportion: Connecting content to children’s thinking. Journal for Research in Mathematics Education, 24(1), 41-61. doi:10.2307/749385 https://www.jstor.org/stable/749385
Lamon, S. J. (2012). Teaching fractions and ratios for understanding; essential content knowledge and instructional strategies for teachers, 3rd ed: Ringgold, Inc.
177
Lanius, C. S., & Williams, S. E. (2003). Proportionality: A Unifying Theme for the Middle Grades. Mathematics Teaching in the Middle School, 8(8), 392. Retrieved from http://ezproxy.lib.usf.edu/login?url=http://search.ebscohost.com/login.aspx?direct=true&db=aph&AN=9506504&site=eds-live
Lesh, R., Post, T., & Behr, M. (1988). Proportional Reasoning. In J. Hiebert & M. Behr (Eds.), Number concepts and operations in the middle grades (Vol. 2, pp. 93-118). Reston, Va: National Council of Teachers of Mathematics.
Mathematics Assessment Resource Service. (2015). 25% Sale. Retrieved from https://www.map.mathshell.org/tasks.php?unit=MA01&collection=9&redir=1
Moschkovich, J. N. (2013). Issues regarding the concept of mathematical practices. In Proficiency and beliefs in learning and teaching mathematics (pp. 257-275): Brill Sense.
National Council for Teachers of Mathematics. (1989) Curriculum and evaluation standards for school mathematics. Reston, Va.: National Council of Teachers of Mathematics.
National Council for Teachers of Mathematics. (2000). Principles and standards for school mathematics. Reston, Va: National Council of Teachers of Mathematics.
National Research Council. (2001). Adding it up: Helpint Children Learn Mathematics. Washington, DC: The National Academies Press. https://doi.org/10.17226/9822.
New York State common core mathematics curriculum. (2015). In Eureka Math. Eureka Math [Open textbook] (pp. 1-242). Retrieved from https://www.engageny.org/resource/grade-6-mathematics-module-1/file/110551
Newswire, P. R. (2019). United States Use of Open Educational Resources in K-12 Schools Market Report 2019. Retrieved from https://www.prnewswire.com/news-releases/united-states-use-of-open-educational-resources-in-k-12-schools-market-report-2019-300795727.html
Ozgun-Koca, S. A., & Altay, M. K. (2009). An Investigation of Proportional Reasoning Skills of Middle School Students. Investigations in Mathematics Learning, 2(1), 26-48. Retrieved from http://ezproxy.lib.usf.edu/login?url=http://search.ebscohost.com/login.aspx?direct=true&db=eric&AN=EJ930110&site=eds-live http://www.unlv.edu/RCML/journal.html
Redstone Strategy Group (2018). Seeking a sustainable OER ecosystem. Retrieved from https://www.redstonestrategy.com/publications/sustainable-oer/
Remillard, J. T., & Heck, D. (2014). Conceptualizing the curriculum enactment process in mathematics education. ZDM, 46(July), 705-718. doi:10.1007/s11858-014-0600-4
Robinson, T. J., Fischer, L., Wiley, D., & Hilton, J. (2014). The Impact of Open Textbooks on Secondary Science Learning Outcomes(7), 341. Retrieved from http://ezproxy.lib.usf.edu/login?url=http://search.ebscohost.com/login.aspx?direct=true&db=edsbl&AN=RN361686510&site=eds-live
Rösken, B., & Rolka, K. (2007). Integrating intuition: The role of concept image and concept definition for students’ learning of integral calculus. The Montana Mathematics Enthusiast, 3, 181-204.
Roth McDuffie, A., Choppin, J., Drake, C., & Davis, J. (2018). Middle school mathematics teachers’ orientations and noticing of features of mathematics curriculum materials. International Journal of Educational Research, 92, 173-187. doi:10.1016/j.ijer.2018.09.019
178
Schmidt, W. H., & Burroughs, N. A. (2016). The Trade-Off between Excellence and Equality: What International Assessments Tell Us. Georgetown Journal of International Affairs, 17(1), 103-109. Retrieved from http://www.jstor.org.ezproxy.lib.usf.edu/stable/26396158
Seeley, C. (2003). Mathematics textbook adoption in the United States. In G. M. A. Stanic & J. Kilpatrick (Ed.), A history of school mathematics (Vol. 2, pp. 957-988). Reston, VA: National Council of Teachers of Mathematics.
Sen, C., & Guler, G. (2017). Effect of strategy teaching for the solution of ratio problems on students’ proportional reasoning skills. Malaysian Online Journal of Educational Sciences, 5(2), 1-15.
Shield, M., & Dole, S. (2008). Proportion in middle-school mathematics: It's everywhere. Australian Mathematics Teacher, (3), 10. Retrieved from http://ezproxy.lib.usf.edu/login?url=http://search.ebscohost.com/login.aspx?direct=true&db=edsgao&AN=edsgcl.188952616&site=eds-live
Stein, M. K., Remillard, J. T., & Smith, M. S. (2006). How curriculum influences student learning. In F. K. Lester (Ed.), Second Handbook of Research on Mathematics Teaching and Learning : A Project of the National Council of Teachers of Mathematics (pp. 319-370). Charlotte, NC: Information Age Publishing, Incorporated.
Tall, D., & Vinner, S. J. (1981). Concept image and concept definition in mathematics with particular reference to limits and continuity. Educational Studies in Mathematics, 12(2), 151-169.
Tarr, J. E., Chavez, O., & Reys, R. E. (2006). From the written to the enacted curricula: The intermediary role of middle school mathematics teachers in shaping students' opportunity to learn. School Science & Mathematics, 106(4), 191-201. doi:10.1111/j.1949-8594.2006.tb18075.x
Usiskin, Z. (2013). Studying textbooks in an information age - A United States perspective. ZDM, 2013(45), 713-723. doi:DOI 10.1007/s11858-013-0514-6
Utah Middle School Math Project, & Utah State Board of Education (2014). In 6th Student Materials. Retrieved from http://utahmiddleschoolmath.org/6th-grade/student-materials.shtml
Van de Walle, J. A. (2007). Elementary and middle school mathematics : Teaching developmentally (6th ed.). Boston: Pearson /Allyn and Bacon.
Vincent, J., & Stacey, K. (2008). Do mathematics textbooks cultivate shallow teaching? Applying the TIMSS video study criteria to australian eighth-grade mathematics textbooks. Mathematics Education Research Journal, 20(1), 82-107. Retrieved from https://eric.ed.gov/contentdelivery/servlet/ERICServlet?accno=EJ798609
Weinberg, S. L. (2002). Proportional reasoning: One problem, many solutions! In B. H. Litwiller & G. W. Bright (Eds.), Making sense of fractions, ratios and proportions: 2002 yearbook. Reston, Va: National Council of Teachers of Mathematics.
Wijaya, A., van den Heuvel-Panhuizen, M., & Doorman, M. (2015). Opportunity-to-learn context-based tasks provided by mathematics textbooks. Educational Studies in Mathematics, 89(1), 41-65. doi:10.1007/s10649-015-9595-1
Williams-Candek, M. (2016). All Talk and More Action. Mathematics Teaching in the Middle School, 22(3), 162-170. Retrieved from http://ezproxy.lib.usf.edu/login?url=http://search.ebscohost.com/login.aspx?direct=true&db=eric&AN=EJ1116779&site=eds-live
179
http://www.nctm.org/Publications/Mathematics-Teaching-in-Middle-School/2016/Vol22/Issue3/All-Talk-and-More-Action/