Rancho Seco License Termination Plan Revision 1 Chapter 2, Site Characterization May 2008
Page 2-i
TABLE OF CONTENTS
2.0 SITE CHARACTERIZATION........................................................................................ 2-1 2.1 Historical Site Assessment Summary ...........................................................................................2-1 2.1.1 Introduction...................................................................................................................................2-1 2.1.2 Objectives of Historical Site Assessment .....................................................................................2-2 2.1.3 Property Identification ..................................................................................................................2-2 2.1.4 HSA Methodology........................................................................................................................2-2 2.1.5 Operational History.......................................................................................................................2-5 2.1.6 Incident Descriptions ..................................................................................................................2-15 2.1.7 Survey Unit Identification and Classification.............................................................................2-17 2.1.8 Area Radiological Impact Summaries ........................................................................................2-18 2.1.9 HSA Findings .............................................................................................................................2-23 2.1.10 HSA Conclusions........................................................................................................................2-24 2.2 Hydrogeological Investigations ..................................................................................................2-24 2.2.1 Methods ......................................................................................................................................2-25 2.2.2 Site Geology and Hydrology ......................................................................................................2-27 2.2.3 Hydrogeology .............................................................................................................................2-28 2.2.4 Groundwater ...............................................................................................................................2-29 2.3 Pre-Characterization Scoping Surveys........................................................................................2-35 2.3.1 Non-Industrial Area Surveys ......................................................................................................2-35 2.4 Site Characterization Survey Methods........................................................................................2-40 2.4.1 Organization and Responsibilities ..............................................................................................2-40 2.4.2 Characterization Data Categories ...............................................................................................2-41 2.4.3 Characterization Survey Design .................................................................................................2-41 2.4.4 Instrument Selection, Use and Minimum Detectable Concentrations (MDCs) ..........................2-42 2.4.5 Quality Assurance.......................................................................................................................2-44 2.4.6 Data Quality Objectives..............................................................................................................2-44 2.4.7 Survey Findings And Results......................................................................................................2-45 2.5 Summary of Initial Characterization Survey (ICS) Results........................................................2-48 2.5.1 Impacted Structures and Surfaces ...............................................................................................2-48 2.5.2 Non-Impacted Structures and Surfaces.......................................................................................2-53 2.5.3 Impacted Plant Systems ..............................................................................................................2-53 2.5.4 Non-Impacted Plant Systems......................................................................................................2-56 2.5.5 Environs Impacted and Non-Impacted .......................................................................................2-56 2.5.6 Ventilation Ducts and Drains......................................................................................................2-59 2.5.7 Paved Areas ................................................................................................................................2-59 2.5.8 Components ................................................................................................................................2-59 2.5.9 Surface and Groundwater ...........................................................................................................2-59 2.5.10 Background.................................................................................................................................2-59 2.5.11 Waste Volumes and Activities....................................................................................................2-60 2.6 Continuing Characterization .......................................................................................................2-60 2.7 Summary.....................................................................................................................................2-60 2.7.1 Impact Of Characterization Data On Decontamination and Decommissioning .........................2-60 2.8 References...................................................................................................................................2-92

Rancho Seco License Termination Plan Revision 1 Chapter 2, Site Characterization May 2008
Page 2-ii
TABLES
2-1 Personnel Observations Summary ................................................................................................2-5 2-2 Operational History Summary ......................................................................................................2-7 2-3 Discharge Canal Sediment..........................................................................................................2-12 2-4 Depression Area Soil Vendor Laboratory Results ......................................................................2-14 2-5 Area Designations.......................................................................................................................2-24 2-6 Well Construction and Water Elevation Data.............................................................................2-26 2-7 General Minerals Results from Analyses of Groundwater .........................................................2-31 2.8 Groundwater Monitoring Radiochemical Results.......................................................................2-34 2-9 Effect of Temporal Variability....................................................................................................2-38 2-10 Effect of Spatial Variability ........................................................................................................2-39 2-11 Gross Activity Variability Due to Plant Operations ...................................................................2-40 2-12 Cs-137 Variability Due to Plant Operations ...............................................................................2-40 2-13 Typical On-Site Characterization Detection Sensitivities...........................................................2-42 2-14 Vendor Laboratory Standard MDA Values ................................................................................2-44 2-15 Specific Soil Contamination Investigation Locations.................................................................2-47 2-16 Concrete Structure Nuclide Fraction ..........................................................................................2-49 2-17 Site Structures Below the DCGL................................................................................................2-50 2-18 Special Area Locations ...............................................................................................................2-51 2-19 Activated Nuclide Fractions For Bioshield Concrete and Rebar ................................................2-52 2-20 Embedded Pipe Gamma- Emitting Nuclide Fractions ................................................................2-54 2-21 Embedded Piping Systems..........................................................................................................2-55 2-22 Buried Piping Nuclide Fractions and Ratio To Cs-137 ..............................................................2-55 2-23 Buried Piping Systems................................................................................................................2-56 2-24 Non-Impacted Systems ...............................................................................................................2-56 2-25 Impacted Soil Area Characterization Results .............................................................................2-57 2-26 Soil Nuclide Fractions.................................................................................................................2-57 2-27 Spent Fuel Cooler Pad Residual Soil Concentrations Comparison To NRC/ORISE Results ....2-58 2-28 Spent Fuel Pool Subsoil Residual Soil Concentrations, NRC/ORISE Results ...........................2-58
FIGURES1
2-1 Rancho Seco Industrial Area Map ..............................................................................................2-61 2-2 Impacted Area.............................................................................................................................2-62 2-3 Area Designations.......................................................................................................................2-63 2-4 Locations of Borings Drilled and Sampled at Rancho Seco .......................................................2-64 2-5 Potentiometric Surface Map for Groundwater Beneth Rancho Seco, December 2005 ..............2-65 2-6 Piper Diagram for Groundwater Concentrations Beneath Rancho Seco ....................................2-66 1 Legends and Notes for Figures 2-8-2-141 are located in Figure 2-32

Rancho Seco License Termination Plan Revision 1 Chapter 2, Site Characterization May 2008
Page 2-iii
2-7 Stiff Diagrams of Cation and Anion Concentrations in Groundwater Beneath and Upgradient from Ranch Seco.........................................................................................................................2-67
2-8 Spent Fuel Cooler Pad Soil Characterization Locations ............................................................2-68 2-9 Tank Farm Soil Characterization Locations, 810001 and 810002..............................................2-69 2-10 Spent Fuel Building-Diesel Generator Room Gap Soil Characterization Location, 826000......2-70 2-11 Effluent Water Course Soil Characterization Locations, 100001...............................................2-71 2-12 RHUT Area Soil Characterization Locations, 837000 ...............................................................2-72 2-13 Old Bechtel Building Soil Characterization Locations, 800004.................................................2-73 2-14 Auxiliary Building –20’ and –29’ El. Concrete Characterization Sample Locations, 813000...2-74 2-15 Auxiliary Building –47’ El. Concrete Characterization Sample Locations, 813000 ..................2-75 2-16 Fuel Storage Building Concrete Characterization Sample Locations, 812000...........................2-76 2-17 Reactor Building 40’ El Concrete Characterization Sample Locations, 811000........................2-77 2-18 Reactor Building 0’ El. Concrete Characterization Locations, 811000......................................2-78 2-19 Reactor Building –27’ El. Concrete Characterization Locations, 811000..................................2-79 2-20 Turbine Building –10’ El. Concrete Characterization Locations, 826000..................................2-80 2-21 Turbine Building 0’ El. Concrete Characterization Locations, 826000......................................2-81 2-22 Reactor Building Activated Concrete Characterization Locations, 811000 ..............................2-82 2-23 Activation Depth Associated with Each Core at the Respective Elevations...............................2-83 2-24 Eu-152 Concentration for the Mid-Core Region ........................................................................2-83 2-25 Turbine Building Grade Level Drains, 826000 ..........................................................................2-84 2-26 Turbine Building 40’ El. Drains, 826000 ...................................................................................2-85 2-27 Auxiliary Building –20’El. Drains..............................................................................................2-86 2-28 Auxiliary Building –47’ El. Drains.............................................................................................2-87 2-29 Spent Fuel Pool Drains ...............................................................................................................2-88 2-29a Spent Fuel Pool Drains 0’ Elevation...........................................................................................2-89 2-30 Reactor Building Drains –27 El. .................................................................................................2-90 2-31 Fuel Storage Building Soil .........................................................................................................2-91
APPENDICES
2-A Miscellaneous Historical Construction Photographs ..................................................................2-94 2-B Site and Structure Drawings With Sample and Survey Locations............................................2-112

Rancho Seco License Termination Plan Revision 1 Chapter 2, Site Characterization May 2008
Page 2-iv
This page intentionally left blank

Rancho Seco License Termination Plan Revision 1 Chapter 2, Site Characterization May 2008
Page 2-1
2.0 SITE CHARACTERIZATION
2.1 Historical Site Assessment Summary
2.1.1 Introduction
The Sacramento Municipal Utility District (herein referred to as the District) has conducted the Historical Site Assessment (HSA) of its Rancho Seco Nuclear Generating Station in accordance with the guidance of NUREG-1575, “Multi-Agency Radiation Survey and Site Investigation Manual (MARSSIM),” [Reference 2-1] in support of the ultimate decommissioning and license termination of the facility.
The HSA formally began in July 2001, following several preliminary assessments of the impact of facility operations on the remediation required prior to the performance of the Final Status Survey(s) (FSS). These preliminary surveys were conducted shortly after the shut down and termination of commercial operation of Rancho Seco in June 1989.
This preliminary characterization effort was undertaken prior to the implementation of the MARSSIM guidelines and therefore, relied primarily on the guidance of NUREG/CR-2082, “Monitoring for Compliance With Decommissioning Termination Survey Criteria,” [Reference 2-2] and Nuclear Regulatory Commission (NRC) Draft Regulatory Guide DG-1005 For Nuclear Reactor Facilities, “Standard Format and Content for Decommissioning Plans for Nuclear Reactors,” [Reference 2-3].
Additional surveys had been anticipated to support the initial plan for deferred DECON beginning in 2008 that included additional characterization surveys and the FSS. With the issuance of MARSSIM, these surveys will be incorporated into the MARSSIM directed site characterization, FSS design, and the District’s License Termination Plan (LTP) for the facility.
The HSA consisted of a review of historical:
• Plant incident records,
• Plant maintenance records,
• Plant modification records,
• Plant radiological survey records, and
• Regulatory reports submitted by the District to various governmental agencies.
The HSA also included written questionnaires and oral interviews with current and past facility employees regarding historical incidents that posed potential impacts to the facility. A review of historic site aerial photographs and physical inspections of the facility were performed to verify and validate the results of the historical record reviews.
Concurrent with the performance of the HSA was the initial segregation of the facility into individual areas and specific, uniquely identified, survey units. This provides the basis for development of area/unit specific site drawings and survey maps required to document the characterization, remediation, and final release survey process. A major output from the HSA process was the information used as the basis for the preliminary MARSSIM classifications of the initial survey units.

Rancho Seco License Termination Plan Revision 1 Chapter 2, Site Characterization May 2008
Page 2-2
The initial classification of the site areas was based on the historical information and site characterization data. Data from subsequent characterization may be used to change the original classification of an area up to the time of the FSS as long as the classification reflects the level of residual activity existing prior to any remediation in the area.
2.1.2 Objectives of Historical Site Assessment
The Sacramento Municipal Utility District conducted the Historical Site Assessment of the Rancho Seco Nuclear Generating Station to:
• Identify known and potential sources of radioactive material and radioactively contaminated areas including systems, structures and environmental media based on the investigation and evaluation of existing information;
• Identify areas of the site with no conceivable or likely potential for radioactive or hazardous materials contamination and assign a preliminary classification of Non-Impacted while assigning a preliminary classification of Impacted to all remaining portions of the site;
• Develop the records to be utilized during the design of subsequent scoping, characterization, remediation, and the FSS; and
• Provide preliminary information necessary to identify and segregate the site into survey units evaluated against the criteria specified in the MARSSIM guidelines for classification. This classification will designate the need for and level of remedial action required within a particular survey unit as well as the level of survey intensity required during the FSS.
2.1.3 Property Identification
A detailed description of the Rancho Seco site and environs is contained in Section 8.5 of this LTP.
2.1.4 HSA Methodology
The methodology used for the Rancho Seco Historical Site Assessment is that found in NUREG-1575, “Multi-Agency Radiation Survey and Site Investigation Manual (MARSSIM).” As described in MARSSIM, Rancho Seco, being a NRC licensee has much of the HSA related information within the records management system used to maintain its records throughout its operational history.
2.1.4.1 Approach and Rationale
The primary objective of the HSA records search process was the identification of those events posing a significant probability of impacting the hazardous material or radiological characterization of the site. These included system, structure, or area contamination from system failures resulting in airborne releases, liquid spills or releases, or the loss of control over solid material management.
Each incident identified that posed a realistic potential to impact the characterization of the site was further investigated. This investigation focused on the scope of contaminant sampling and analysis, remedial actions taken to mitigate the situation, and any post-remedial action sampling, survey, and analysis in an attempt to identify the “as left” condition of the incident

Rancho Seco License Termination Plan Revision 1 Chapter 2, Site Characterization May 2008
Page 2-3
location. The records management system provided the source of a vast majority of the documents inspected.
Also included in the research associated with the development of the HSA were:
• Relevant excerpts from written reports and correspondences;
• Personnel interviews, including the use of questionnaires, of current, former and retired plant personnel to confirm documented incidents and identify undocumented incidents; and
• Site inspection, utilizing historic site drawings, photographs, prints, and diagrams to identify, locate, confirm, and document areas of concern.
Information from this research was used in the HSA development, including the compilation of data, evaluation of results, documentation of findings, and the characterization and identification of Areas and Survey Units.
2.1.4.2 Documents Reviewed
Records maintained to satisfy the requirements of 10 CFR Part 50.75(g)(1) provided a major source of documentation for the HSA records review process.
In researching the HSA, the records reviewed include:
• License and Technical Specification reports,
• Annual operational and environmental reports,
• Environmental investigations performed by independent entities,
• Regulatory actions against the site,
• Documentation from interviews conducted with currently employed and retired/separated site personnel,
• Radiological control surveys associated with identified events,
• Site inspection and surveillance documents associated with identified events,
• Federal, State and local regulations,
• Regulatory and Industry guidance documents,
• Annual Environmental and Operational documents,
• Licensee Event Reports (LERs),
• Occurrence Description Reports (ODRs),
• Quality departure documents, including Potential Deviations from Quality (PDQ) and Deviation from Quality (DQ),
• Radiological and environmental survey documents,
o Routine radioactive release reports,
o Non-routine reports provided to the NRC under the provisions of the facility’s Technical Specifications, 10 CFR Part 20, and 10 CFR Part 50,

Rancho Seco License Termination Plan Revision 1 Chapter 2, Site Characterization May 2008
Page 2-4
o Plant incident or condition reports, and
o Quality Control /Quality Assurance finding documents.
2.1.4.3 Site Reconnaissance
As allowed by MARSSIM Section 3.5, a formal site reconnaissance was not performed, based on the continuous occupancy of the site by the licensee, the detailed information available through the records, and the personnel interviews performed. Investigations were performed to verify locations and current conditions of questionable items or issues (radioactive liquid spills or spread of contamination) discovered during review of historical records or the conduct of personal interviews. .
2.1.4.4 Personnel Interviews
Between August 2001 and December 2002, approximately 150 observations (knowledge of any systems, facilities, or areas of potential radiological impact not already identified on the Rancho Seco Historic Site Assessment Questionnaire) were noted from the individuals contacted in the HSA questionnaire program. These individuals represented a combination of current and past employees, primarily from the operations and radiation protection staffs. These two groups were chosen due to their knowledge of and association with the systems and source terms being investigated for this assessment. A number of the personnel interviewed possessed site knowledge and experience that ranged from the site construction period to the present.
The personnel surveys included a combination of questionnaires completed by a majority of the participants as well as individual and group interviews with several of the participants.
With few exceptions, the personnel observations were corroborated by either the observations of other interviewees or documentation discovered during the records search. Table 2-1 contains a brief summary of the survey results showing the number of observations recorded for the various general areas identified.

Rancho Seco License Termination Plan Revision 1 Chapter 2, Site Characterization May 2008
Page 2-5
Table 2-1 Personnel Observations Summary
General Area of Observation Number of Observations
Auxiliary Boiler, pad, drains sump 10 Auxiliary Building 7 “B” Warehouse 4 Barrel Farm (Waste Storage Area) 4 Balance of Plant (BOP) 14 Building Maintenance/Machine Shop 4 “C” Warehouse 2 Circulating Water Basins and surrounding area 16 Contractor Fabrication Shop 8 Fabrication and Weld Shops Building 2 “GRS” Warehouse 1 Interim Onsite Storage Building (IOSB) 5 Non-Radiological Observations 4 Plant Effluent 4 Quonset Hut 11 Retention Basin 2 Regenerant Hold Up Tanks (RHUT’s) 13 Storm Drains 5 Training and Records Laboratory 1 Tank Farm 13 Tool Room 1 Turbine Building 9 Tritium Evaporator 3 Training Simulator Building (offsite) 1 “Upper/Outer” Storage Yard 1 Sewer Plant 1
2.1.4.5 Historical Construction Photograph Review
Collections of historical construction photographs were reviewed to assess their contribution to this HSA. A selection of construction photographs is included as Appendix 2-A. Also, additional original construction photographs are contained in the Construction Report issued by Bechtel Corporation [Reference 2-9].
2.1.5 Operational History
The following summary of the facility’s history was determined through a review of site records, documents and personnel interviews.

Rancho Seco License Termination Plan Revision 1 Chapter 2, Site Characterization May 2008
Page 2-6
2.1.5.1 Introduction
Rancho Seco was issued its 10 CFR Part 50 operating license (DPR-54) on August 16, 1974 and attained initial criticality one month later, on September 16, 1974. The facility became commercial on April 18, 1975.
The facility is described in multiple licensing documents including:
• “Rancho Seco Nuclear Generating Station Unit 1 Defueled Safety Analysis Report” [Reference 2-10]; and
• US Nuclear Regulatory Commission (formerly the US Atomic Energy Commission), Safety Evaluation by the Directorate of Licensing, US Atomic Energy Commission, in the matter of Sacramento Municipal Utility District Rancho Seco Nuclear Generating Station, Unit 1, Docket 50-312 (SER) [Reference 2-11].
Rancho Seco had a pressurized water reactor (PWR) designed and constructed by Bechtel Power Corporation with its nuclear steam supply system (NSSS), rated at 2,772-MWt, 913-Mwe net, provided by Babcock and Wilcox. Condenser cooling and make-up water was provided via the Folsom-South canal, constructed by the Bureau of Reclamation.
The Rancho Seco site is located in southern Sacramento County, California, approximately 25 miles southeast of Sacramento and 26 miles northeast of Stockton. The site is located on 2,480 acres entirely owned by the District. The facility is located between the Sierra Nevada Mountains to the east, and the Pacific Coast range bordering the Pacific Ocean to the west. The rural area is used almost entirely for agricultural purposes including row and silage crops, cattle graze land, and in recent years, grape production. Within the five-mile radius of the site, there are no significant tourist attractions or variations in population. The nearest population area is approximately 6.5 miles from the site while the closest substantial populations (>20,000) are Galt, and Lodi, California at 10 and 17 miles from the site, respectively. The main access to the site is State Highway 104 (Twin Cities Road), which runs from highway 99 (just north of Galt) in the west, to State Highway 88 (just east of Ione) to the east.
After approximately 15 years of operation, Rancho Seco was shut down for the last time on June 7, 1989, after passage of a non-binding referendum by the ratepayers of Sacramento County recommending the District discontinue operation of Rancho Seco.
The reactor was completely defueled on December 8, 1989.
Unable to attract a buyer for the facility, the District formally notified the U.S. Nuclear Regulatory Commission (NRC) of its intent to permanently shut down the facility, requesting a possession-only license on April 26, 1990.
As noted in the “Rancho Seco Nuclear Generating Station Proposed Decommissioning Plan” (PDP) [Reference 2-12], Rancho Seco operated for approximately 2,149 effective full power days (seven fuel cycles), over the course of its operating lifetime.
A summary of the operational history is provided in Table 2-2 below.

Rancho Seco License Termination Plan Revision 1 Chapter 2, Site Characterization May 2008
Page 2-7
Table 2-2 Operational History Summary
Date Event
Oct. 1968 Received construction permit
Mar. 1969 Commenced site preparation/construction
Aug. 1974 Operating License (OL) issued
Aug. 1974 Completed initial fuel loading
Sept. 1974 Achieved initial criticality
Apr. 1975 Commenced commercial operations
Jun. 1975 – Oct 1976
Two unplanned outages to repair material deficiencies. Full power achieved in Mar. 1976. Full power regained in Oct. after 7-month stator coil outage.
1977 8 months of full power operations (75% capacity factor Jul-Dec.)
Nov. 1978 Completed cycle three refueling in 35 days
Aug. 1980 Turbine rotor failure resolved
Jun. 1982 Frequent electrical inverter trip resolution achieved
Apr. 1983 Turbine oil system associated trip issues resolved
Aug. 1984 Steam Generator repairs and Aux. Feed water modification outage
Dec 1985 Extended plant shutdown resulting from overcooling unusual event
Mar. 1986-88 Extended plant shutdown for post TMI-mod installation, emergency feed water system modifications, detailed system analysis and test program implemented, and installation of two additional backup diesel generators.
Jun 1989 Resolved feed water transient issue, completed restart testing. Public referendum voted to have SMUD discontinue operation of Rancho Seco. Plant shuts down for last time on June 7, 1989.
Aug. 1989 SMUD notifies NRC of its intent to seek a decommissioning amendment to its license.
Sept. 1989 District fails in its attempts to sell Rancho Seco or convert to non-nuclear operation.
Dec. 1989 Reactor defueling completed on December 8, 1989.
Jul. 1990 SMUD submits the Plan for Ultimate Disposition of the Facility in response to NRC request.
1991 MAY - SMUD submits RSNGS Proposed Decommissioning Plan (PDP) October - Board approves California Environmental Quality Act “Negative Declaration” for PDP (State clearinghouse number (SCH#) 91062072)
Mar. 1992 Rancho Seco OL amended to Possession Only
Mar. 1995 NRC approves PDP

Rancho Seco License Termination Plan Revision 1 Chapter 2, Site Characterization May 2008
Page 2-8
Table 2-2 Operational History Summary
Date Event
1997
January - SMUD Board approves Incremental Decommissioning Action Plan (IDAP for 1997 through 1999) and California Environmental Quality Act “Subsequent Negative Declaration” (SCH# 96112047) for IDAP Post Shutdown Decommissioning Activities Report (PSDAR) Submitted IAW 10 CFR Part 50.82 (PSDAR supercedes the PDP)
1999-2000 January 1999 – SMUD Board approves IDAP – Rev. #1 (continue decommissioning through license termination) and CEQA “Subsequent Negative Declaration” for IDAP Rev. #1 (SCH#99042092)
Jun. 2000 June 30, 2000 – NRC issued SMUD a 10 CFR Part 72 license to store Rancho Seco’s spent nuclear fuel at the ISFSI
Aug. 2002
Spent fuel transfer to ISFSI complete – TS amendments 129 and 130 take affect – precludes SF possession on the 10 CFR Part 50 licensed facility and eliminates the need for an Operations Shift Supervisor or Certified Fuel Handlers
Oct 2002 TS amendment 131 takes effect eliminating security plan requirements from the 10 CFR Part 50 licensed facility
The fact that the plant was shut down years before the expiration of its operating license resulted in several significant impacts that include:
• The District’s inability to comply with the requirements of 10 CFR Part 50.75 regarding the submission of a preliminary decommissioning plan five years prior to the cessation of operations;
• A significant shortage of funds within the decommissioning trust fund; and
• The lower operational run time of the facility resulted in a lower source term. As a consequence, the potential migration and distribution of radionuclides was less as was the formation of plant derived radionuclides including Transuranic.
2.1.5.2 Decommissioning Plan Chronology
Prompted by a NRC staff request, the “Plan for Ultimate Disposition of the Facility” (PUDF), was submitted in July 1990 [Reference 2-13]. The original intent of the licensee, as outlined in this document, was to decommission Rancho Seco using the SAFSTOR – Deferred DECON alternative. This alternative was to include Custodial, as well as Hardened, – SAFSTOR applications as generally defined in the “Final Generic Environmental Impact Statement on Decommissioning of Nuclear Facilities,” (FGEIS) NUREG-0586 [Reference 2-14]. Dismantlement following the SAFSTOR period was estimated to occur in the 2008 to 2012 time frame.

Rancho Seco License Termination Plan Revision 1 Chapter 2, Site Characterization May 2008
Page 2-9
On May 20, 1991, the District submitted the PDP for the Rancho Seco facility, dated April 15, 1991, for NRC approval. The District subsequently submitted supplements to the PDP for review dated April 15, August 6, & August 31, 1992; January 7, April 7, & April 19, 1993; and March 23, April 28, July 26, & October 26, 1994. After an extensive NRC staff review, the PDP was approved on March 20, 1995.
Simultaneous with this review was the amendment of the District’s Operating License (DPR-54), to reflect a possession-only authorization on March 17, 1992 and the NRC staff’s review of the associated safety evaluation and environmental assessment of the impacts associated with the decommissioning of Rancho Seco resulted an initial Finding Of No Significant Impact (FONSI), issued on June 16, 1993.
In 1991, the District Board of Directors approved the negative declaration prepared for the original PDP (Resolution No. 91-10-18) on October 17, 1991. (State Clearinghouse No. 91062072)
In January 1997, the District Board of Directors approved (Resolution 97-01-07) the “Incremental Decommissioning Action Plan” (IDAP) and a subsequent negative declaration regarding the potential environmental impacts. (State Clearinghouse No. 96112047)
In April of 1999, the District Board of Directors approved revisions to the IDAP (IDAP – R1) accelerating the schedule of the decommissioning effort. (State Clearinghouse No. 99042092)
In accordance with the applicable provisions of the California Environmental Quality Act (CEQA), the District prepared and circulated the studies and evaluations necessary to support the subsequent negative declarations associated with the PDP, IDAP, and IDAP –R1. This included multiple public meetings convened by the District.
2.1.5.3 Regulatory Overview
Rancho Seco has been, and continues to be, closely monitored in a highly regulated environment. Regulatory oversight is provided by an extensive collection of Federal, State, Local, and licensee personnel in addition to non-regulatory industrial peer groups and local stakeholders.
This hierarchy of oversight has carried out its various responsibilities during the sighting, licensing, construction, operations, and decommissioning phases of the plant’s life and has included:
• United States Atomic Energy Commission (AEC),
• United States Nuclear Regulatory Commission,
• United States Environmental Protection Agency (EPA),
• US Army Corps. Of Engineers – Bureau of Reclamation,
• California Department of Health Services – Radiological Health Branch,
• California Department of Toxic Substance Control (DTSC),
• California Regional Water Quality Control Board,
• State Water Resources Control Board,

Rancho Seco License Termination Plan Revision 1 Chapter 2, Site Characterization May 2008
Page 2-10
• California Department of Fish and Game,
• Sacramento Metropolitan Air Quality Management District,
• Local/County Governments, and
• District Regulatory affairs/licensing.
2.1.5.4 Waste Handling Procedures
Waste materials generated at Rancho Seco are generally described as radioactive, hazardous, mixed (radioactive/hazardous), universal, or non-regulated.
To ensure the conformance with prescribed regulatory requirements, waste handling evolutions are controlled through various administrative and operational procedures.
2.1.5.5 Current Site Usage
2.1.5.5.1 Description of Operations
In August 2002, Rancho Seco completed transferring all of its spent nuclear fuel into dry storage at the ISFSI. With all of the fuel in dry storage, Rancho Seco was able to amend its 10 CFR Part 50 Technical Specifications, reducing procedural and operational requirements at the facility. Current operations focus primarily on tasks and activities required to complete the dismantlement and decontamination of the facility.
2.1.5.5.2 Preliminary Site Characterization
The initial characterization of the Rancho Seco site resulted from the review and evaluation of surveys and evaluations previously conducted to determine the extent and nature of residual contamination. In accordance with the guidance of MARSSIM, this initial site characterization (as to the Impacted or Non-Impacted nature of the site) began in 2001 and was completed in 2002. The HSA including the initial site characterization is the product of the evaluations and investigation necessary to define the current condition at the site and assign preliminary Area classifications. This effort also addressed the hazardous material and “state-only” regulated material at the site that may impact future remediation/dismantlement.
2.1.5.6 Site Dismantlement
2.1.5.6.1 Dismantlement activities within the Power Block
As of January 2006, the decommissioning project has removed virtually all (with the exception of embedded or buried piping) of the secondary plant systems in the Turbine Building including:
• Main Steam,
• Auxiliary Steam,
• Main Feed Water,
• Main Condensate and Make-up,
• Main Circulating Water Pumps, and

Rancho Seco License Termination Plan Revision 1 Chapter 2, Site Characterization May 2008
Page 2-11
• Main Turbine and Condenser.
Within the Auxiliary Building, dismantlement began in the fall of 1999 and a majority of the systems have been removed.
System dismantlement activities are mostly complete within the Spent Fuel Building. Dismantlement began in October 2002. This work included removal of the Fuel Bridge, Fuel Pool cooling components and systems and the spent fuel pool liner plate.
Within the Reactor Containment Building nearly all equipment has been removed, including large components. The Reactor Vessel Internals segmentation project is in progress, and the Reactor vessel remains in the building, scheduled to be removed during 2006.
2.1.5.6.2 Dismantlement Activities Outside the Power Block
Dismantlement activities outside of the facility power block are directed at the removal of temporary buildings and structures and are being carried out in accordance with standard site procedures for the release of potentially contaminated materials and equipment. Final Status Survey’s will be conducted of the “footprint” left from these structures’ dismantlement to verify that any residual contamination meets the release criteria.
2.1.5.7 Radiological Sources
2.1.5.7.1 Industrial Area Contamination
Several areas within the Industrial Area have been identified as having been radiologically impacted by the operation of the facility including:
• Retention Basins,
• Tank Farm,
• Barrel Farm,
• Areas adjacent to the Regenerant Hold Up Tank Area (RHUT’s) (RHUTs have been removed),
• Storm Drains,
• Oily Water Separator,
• Cooling Tower Basins, and
• Turbine Building drains and sumps.
2.1.5.7.2 Non-Industrial Area Contamination
Four locations outside of the Industrial Area have historically had radionuclide concentrations detected above background.

Rancho Seco License Termination Plan Revision 1 Chapter 2, Site Characterization May 2008
Page 2-12
Discharge Canal Sediment
The plant discharge canal sediment has shown detectable concentrations of licensed radioactive material resulting from 10 CFR Part 20.2001(a)(3) authorized radioactive liquid releases. This release path has been the subject of numerous studies by the facility staff as well as the Lawrence Livermore National Laboratory (LLNL) and is routinely monitored via the Radiological Environmental Monitoring Program. As discussed in the PDP, the most recent of the LLNL studies (UCRL-ID-106111, November 1990) reported maximum radioactive sediment concentrations of 1.47 pCi/g Co-60 (April 1989), 1.20 pCi/g Cs-134 (January 1989), and 11.00 pCi/g Cs-137 (January 1989) at points within 1,640 feet (0.5 kilometer) of the plant effluent discharge point (0.3 km for January 1989 sampling and, 0.5 km for April 1989 sampling).
Oak Ridge National Laboratory also evaluated the environmental impact of the authorized radioactive liquid releases for the NRC. This evaluation was applied to both onsite and offsite locations. The results of this evaluation are documented in NUREG/CR-4286, Evaluation of Radioactive Liquid Effluent Releases From the Rancho Seco Nuclear Power Plant [Reference 2-15].
Five sediment samples were collected from the discharge basin in September of 2005. These samples were intended to investigate the sediment to a streambed depth of approximately 60 cm. The outfall basin consists of a pool 3.0 m wide and approximately 2.0 to 2.5 m long (when measured from the outfall culvert). Two samples were collected at points equidistant from the shoreline approximately 2 m from the outfall culvert (Locations 1 and 2) where the basin pool constricts into the stream channel. Three equidistant samples were collected across the widest portion of the outfall basin approximately 1 m from the outfall culvert (Locations 3-5). Prior stream reconnaissance indicates mixed gravel and cobble to a depth of 10 to 20 cm. Very little mud, sand or clay was observed in the top 10-15 cm layer. Table 2-3 presents the sample results for Co-60 and Cs-137. No other plant derived gamma emitters were detected using the on-site gamma spectroscopy analysis system. The sample locations for Table 2-3 are provided in Figure 2-11.
Table 2-3 Discharge Canal Sediment
Location Depth (cm) Co-60 (pCi/g) Cs-137 (pCi/g) 1 15-30 <0.024 0.358 ± 0.059 1 30-60 <0.031 0.355 ± 0.048 2 15-30 <0.036 0.338 ± 0.051 2 30-60 <0.035 0.153 ± 0.035 3 15-30 <0.035 0.170 ± 0.045 3 30-60 <0.023 0.051 ± 0.022 4 15-30 <0.035 0.089 ± 0.030 4 30-60 <0.026 0.074 ± 0.024 5 15-30 <0.035 0.050 ± 0.030 5 30-60 <0.016 <0.040

Rancho Seco License Termination Plan Revision 1 Chapter 2, Site Characterization May 2008
Page 2-13
Discharge Canal Soil
During plant operation and during the period of authorized radioactive liquid releases, discharge canal sediment was dredged from the canal and deposited as a band adjacent to the canal. Because the discharge canal sediment was known to contain radioactive materials of plant origin, sampling of the soil adjacent to the discharge canal was added to the Radiological Environmental Monitoring Program. As reported to the NRC in the 2002 Annual Radiological Environmental Operating Report, eight soil samples were collected from this area. Cs-137 was identified in seven out of eight of these samples at a concentration range of 0.042 to 0.266 pCi/g. These analysis results for Cs-137 are similar to current background levels provided in Section 2.5.10.
Depression Area Soil
The depression area is an onsite location adjacent to “No Name” Creek. The discharge canal, discussed above, flows into “No Name” Creek. On occasion and during periods of authorized radioactive liquid releases, “No Name” Creek overflowed and collected in the depression area. Because of this, sampling of the soil in the depression area was added to the Radiological Environmental Monitoring Program. As reported to the NRC in the 2002 Annual Radiological Environmental Operating Report, 14 soil samples were collected from this area. Cs-137 was identified in 12 of these 14 samples at a concentration range of 0.070 to 48.15 pCi/g. Cs-134 was identified in two samples at a concentration range of 0.060 to 0.177 pCi/g. Co-60 was identified in six samples at a concentration range of 0.086 to 1.10 pCi/g.
In October of 2004 a reconnaissance of the depression area adjacent and north of “No Name” Creek was performed. This region topography consists of swells and swales. The shallow depressions and low ridges traverse in a northwest direction and follow the gentle sloping gradient of the local terrain. The depressions near the effluent stream indicate the occurrence of runoff, flooding and periods of wet conditions. During periods of rain and flood runoff these areas are vegetated primarily with local grasses that retard and filter runoff. The depressions would also concentrate runoff that could undergo both evaporative and infiltration processes. A walk-down of the region using portable NaI detectors was used to determine likely locations for acquisition of soil samples.
On November 1, 2004 four soil samples were collected from those depressions exhibiting the highest response for Eberline SPA-3 or Ludlum 44-10 NaI detectors. The regions represent locations where the highest count rate was observed throughout the depression area. Vegetation, soil and subsurface soil samples were collected and gamma spectroscopy analysis performed. The samples were not dried in order to insure mobile and volatile radionuclides such as tritium would not be lost. The top layer of soil and vegetation was not separated as is normally performed. The surface layer (~5.0 cm) of soil and vegetation resulted in Co-60 concentrations that ranged from 0.04 to 0.5 pCi/g and Cs-137 soil concentrations that ranged from 8.9 to 23.2 pCi/g. The soil region with a general depth ranging from ~5.0 to 15.0 cm was also analyzed and resulted in Co-60 concentrations ranging from <0.05 to 0.4 pCi/g. The Cs-137 concentrations for this same region ranged from 6.4 to 18.8 pCi/g. The lower soil region represented a general depth of 15.0 to 30.0 cm. The Co-60 soil concentration for this region ranged from <0.05 to <0.09 pCi/g and the Cs-137 for the same region exhibited a concentration range of 0.5 to 1.8 pCi/g. A composite sample of four of the above samples representing the highest observed concentrations was sent to a vendor laboratory for hard-to-detect-nuclide analysis. Table 2-4 provides the radionuclide analysis results for those radionuclides that (except for Co-60) were reported at greater than the assigned MDA.

Rancho Seco License Termination Plan Revision 1 Chapter 2, Site Characterization May 2008
Page 2-14
Table 2-4
Depression Area Soil Vendor Laboratory Results
Radionuclide Concentration (pCi/g) H-3 4.01 C-14 1.66
Co-60 < 0.26 Cs-137 19.0
Storm Drain Outfall
The Radiological Environmental Monitoring Program has identified low levels of radioactive materials of potential plant origin in soil samples taken at storm drain locations. As reported to the NRC in the 2002 Annual Radiological Environmental Operating Report, 30 soil samples were collected from 15 storm drain outfall locations during 2002. Gamma spectrometry analysis of these samples indicated the presence of Cs-137 in the range of 0.013 to 0.102 pCi/g with a mean of 0.043 pCi/g and Mn-54 in one sample at a concentration of 0.007 pCi/g.
Remainder of the Non-Industrial Area
During the fourth quarter of 2000, Shonka Research Associates, Inc. (SRA) conducted detailed surveys of selected areas outside of the Industrial Area. These surveys were conducted to support consideration of an area south of the Industrial Area proposed for the Cosumnes Power Plant (CPP) to be constructed on the Rancho Seco site. The surveys also determined the boundary of any Impacted Areas and determined background survey values for comparison to Impacted Area values. These surveys included scan surveys conducted using the Subsurface Multi-Spectral Contamination Monitor (SMCM) system developed by SRA, fixed point in situ NaI(Tl) spectroscopy measurements and soil sampling for laboratory analysis. To manage the surveys, the site was divided into twelve survey areas. Potential Non-Impacted Areas required 10% areal scan surveys and potential Non-Impacted Areas bounding Impacted Areas required 50% areal scan surveys.
The final report on these surveys noted that due to several factors, including the marshy conditions of the fields to the south of the plant, several in situ sample points had to be relocated. According to the study’s authors, this relocated configuration represented the best combination of complete west-east coverage along the storm drain outfall area to the south of the plant.
The SMCM scan and the in situ measurement survey results for the outfall area immediately south of the Industrial Area and for the proposed CPP location showed no evidence of plant-derived contaminants in these areas. Cs-137 MDCs for the SMCM scans of these areas ranged from 0.26 to 0.77 pCi/g and for in situ measurements from 0.31 to 0.40 pCi/g. Two out of five soil samples from these areas tested positive for Cs-137 at a range of 0.03 to 0.30 pCi/g with an analysis MDA of 0.03 pCi/g.
NUREG/CR-4286 established Cs-137 background concentrations in the vicinity of Rancho Seco. Four locations were investigated, at distances of 4 to 10 miles from Rancho Seco and lying approximately north, south, east and west of the site were sampled. The average

Rancho Seco License Termination Plan Revision 1 Chapter 2, Site Characterization May 2008
Page 2-15
concentration of Cs-137 in these locations was 0.41 pCi/g. Decaying this average value from December 1984 (the approximate sampling date for NUREG/CR-4286) to December 2002 gives a background concentration of 0.27 pCi/g.
In addition to the Cs-137 established background found in NUREG/CR-4286, Lawrence Livermore National Laboratory (LLNL) conducted a series of environmental radiological studies from 1984 through 1986 in the vicinity of Rancho Seco. These studies were, in part, assessments of the environmental impact of radionuclides discharged with aqueous releases from Rancho Seco. LLNL Report UCID 20963, Part II, Environmental Radiological Studies Conducted During 1986 in the Vicinity of the Rancho Seco Nuclear Generating Station, [Reference 2-16] provides additional Cs-137 background information in Table VIII-2 of that report. The table provides concentrations of global fallout Cs-137 and some natural radionuclides in surface soils (0 - 4.0 cm) collected at a distance of five miles from Rancho Seco on September 18, 1986. The averaged Cs-137 value for the eight locations was 0.665 pCi/g. Decay correcting the value to December 1, 2002 results a Cs-137 soil value of 0.465 pCi/g. The initial concentrations from this study ranged from 0.19 to 1.65 pCi/g. Examining the data shows that higher concentrations were found in the north, northeast, east and southeast sectors. These locations are regions in which undisturbed soils would predominate while the remaining sectors indicate regions in which soils would be more influenced by animal grazing and agricultural processes. This measure of global fallout by LLNL is expected to best represent undisturbed soil and provides an upper bound condition for the Cs-137 background in the Shonka report discussed in Section 2.3.1.
2.1.6 Incident Descriptions
Based on the review of existing plant records (e.g. annual and semi-annual reports, licensee notifications, Occurrence Description Reports, and PDQ’s) approximately 260 incidents with radiological or hazardous material implications occurred between commencement of plant operation in 1974 and approval to continue decommissioning through license termination in 1999. A number of these took place within the power block and, while contributing to the radiological contamination of the power block structures, were generally contained within the RCA. Those occurring outside of the power block have contributed to the Impacted classification of substantial portions of the industrial area. These include:
• Airborne releases with structural or geological contamination potential,
• Spills outside of the power block or incidents involving potential contamination based on system leakage from systems that had been historically contaminated by primary to secondary leaks,
• Loss of control of radioactive materials resulting in the potential for contamination outside of the power block,
• Plant liquid radioactive effluents resulting in soil contamination,
• Hazardous material spills or losses of control, and
• Contamination of systems not originally designed as radioactive systems outside of the historic power block.
A summary index of these incidents is included in the Rancho Seco Historical Site Assessment [Reference 2-17].

Rancho Seco License Termination Plan Revision 1 Chapter 2, Site Characterization May 2008
Page 2-16
2.1.6.1 Radiological Spills
The records search showed that between 1974 and 1999, 158 documented spills occurred at the facility. Less than forty of these documented spills occurred within the power block and, while contributing to the radiological contamination of the power block structures, were generally contained within the radiologically controlled drains and waste systems. These spills and releases can be grouped into three basic categories as described below.
• Spills that were ultimately contained within the site’s controlled process drain system (including the oily water separator, RHUT’s, and retention basins), contaminating the surfaces between the spill site and drain;
• Spills ultimately entering the site’s uncontrolled storm drain system contaminating the drain system and outfalls as well as the surfaces between the spill site and the drain; and
• Spills resulting in the saturation and contamination of the media in the immediate area surrounding the spill (i.e., concrete, soil, asphalt, gravel, etc.).
These spills generally resulted in the affected areas being designated as Impacted Areas for FSS design purposes.
2.1.6.2 Chemical Spills
The records search revealed that between 1974 and 1999, twenty-eight documented cases involving the mishandling or loss of control over hazardous chemical materials exist. These ranged from spills of acids and caustics used in the plant’s various systems to anti-freeze and transmission fluid from District vehicles. There were a minimal number of chemical spills occurring outside of the building comprising the historic power block. A majority of these occurred within the facility’s structures.
These spills were controlled and remediated in accordance with the policies and procedures associated with these occurrences, including:
• Ranch Seco Hazardous Materials Business Plan,
• RSAP – 0229, Hazardous Waste Management,
• RSAP – 0223, Oil Spill Prevention, Control, and Countermeasures,
• OP-C-32, Onsite Oil Spill,
• OP-C-46A, Hazardous Material Spill/Release, and
• Rancho Seco Emergency Plan.
2.1.6.3 Loss of Radioactive Material Control
The records search showed that between 1974 and 1998, there are 12 documented cases regarding the loss of control of radioactive material or material contaminated with radioactive material resulting in the potential for contamination spread in the immediate vicinity. Areas affected by these incidents will be initially classified as Impacted Areas.

Rancho Seco License Termination Plan Revision 1 Chapter 2, Site Characterization May 2008
Page 2-17
2.1.6.4 System Cross-Contamination
Starting in 1975, with indications of cross contamination of the CCW system from the RCS and expanding dramatically in 1981 with the first indications of primary to secondary leakage through the once through steam generators (OTSGs), systems not originally expected to contain radioactivity became contaminated. The level of contamination varied from system to system and in general, was minimal.
Many systems had the potential for cross contamination including open cycle and closed cycle cooling systems, auxiliary systems, and tankage. Following the guidance in NRC IE Notice 80-10, non-contaminated systems were routinely monitored to identify contamination events in a timely fashion, should they occur. When non-contaminated systems became contaminated, they were evaluated through an Engineering calculation and were considered against 10 CFR Part 50 Appendix I criteria. In addition, systems already contaminated were monitored according to plant chemistry and surveillance procedures to measure and trend the levels of activity within the systems.
Leaks from these secondarily contaminated systems had the potential to contaminate additional site systems and locations not originally expected to be contaminated.
Based on the records search performed for the HSA investigation, 165 documented cases involving events of this nature occurred during the operation of Rancho Seco. These areas associated with these events, primarily within the Turbine Building and Tank Farm, are classified as Impacted Areas.
2.1.7 Survey Unit Identification and Classification
2.1.7.1 Survey Areas
The entire 2,480 acre site is divided into Areas. Areas are typically larger physical sections of the site that may contain one or more survey units depending on their classification. Areas that have no reasonable potential for residual contamination are classified as Non-Impacted Areas. These Areas have no radiological impact from site operations and were identified early in decommissioning. Areas with reasonable potential for residual contamination are classified as Impacted. Impacted Areas of the site are depicted in Figure 2-2, Impacted Areas. Areas of the 2,480 acre site not depicted in Figure 2-2 as Impacted are classified as Non-Impacted.
2.1.7.2 Survey Units
A Survey Unit is a physical area consisting of buildings, structures, or land areas of specifically defined shapes and sizes, for which a unique decision will be made regarding if the presence of any residual radioactive material meets or exceeds predetermined release criteria. A Survey Unit is a single contiguous area, whose size is dependent upon its physical characteristics (open land vs. structural building), radiological conditions and whose operational conditions are reasonably consistent with the exposure modeling used to determine the classification.
2.1.7.3 Initial Designation of Areas
Using reasonable and available physical and documented references, nine Areas were identified and assigned Area identification numbers. Areas one (1) through seven (7) are located outside

Rancho Seco License Termination Plan Revision 1 Chapter 2, Site Characterization May 2008
Page 2-18
of the Industrial Area while Area eight (8) is comprised of the entire Industrial Area. Area nine (9) contains all portions of the 2,480 acre site not included in Areas one through eight.
Current Area designations (Areas of the site are depicted in Figure 2-3, Area Designations.) are:
• Area 1, (100000) Plant Effluent Area;
• Area 2, (200000) South Plant Outfall;
• Area 3, (300000) Southern region;
• Area 4, (400000) South Eastern region;
• Area 5, (500000) North Eastern region– Note: Area 5 contains two Impacted Survey Units;
• Area 6, (600000) Northern;
• Area 7, (700000) Western region (excluding ISFSI and that portion transversed by the railroad spur));
• Area 8, (800000) – Those portions of the District-controlled Rancho Seco property not included in and surrounded by Area 1 through Area 7. Area 8 (800000) is also commonly referred to as the Industrial Area and lies primarily within the industrial area fence with the notable exception of parking areas located to the east of the site; and
• Area 9, – Those portions of the District-controlled Rancho Seco property not included in Areas 1 through 8.
2.1.8 Area Radiological Impact Summaries
2.1.8.1 Area 1 – Plant Effluent Area
Available documentation of the radiological impacts associated with the evaluations from specific incidents during the operational and post operational period include:
2.1.8.1.1 Licensee identified events
Document Equipment/System/location Remarks
ODR 75-46 RHUT overflow ~1,765 gal overflowed to PE before divert (H-3 only)
ODR 76-79 PE diversion for road construction altered PE flow measurements
Flow rate calculation re-verified with minimal impact noted
ODR 81-192 RHUT sample line discharges directly to PE
Cumulative impact unknown (> 500 μCi Co-60) [Also ODR81-193, 209]
ODR 84-223 CST (T-358) overflow ~900 gallons Release within 10 CFR Part 20 limits 96 μCi H-3, 0.21 μCi Cs-137 to PE
ODR 87-764 System drained in contaminated area removed without sample 55 gal. dumped down uncontrolled storm drain between Aux and RB
Cs-137 at 1.75E-7 μCi/ml (no mention of any diversion of PE) 1987 semi-annual report ~1000 gal. Max dose 3.33E-4 mrem

Rancho Seco License Termination Plan Revision 1 Chapter 2, Site Characterization May 2008
Page 2-19
Document Equipment/System/location Remarks
1988 annual report Cs-137 detected during routine monitoring of liquid effluent
57 μCi Cs-137 in 3.10 E+06 gal. release – Est. dose 0.0125 mrem
1988 annual report MSR valve leakage between April and September
Turbine Building floor drains to PE - ~88 gal. / ~ 3 μCi H-3, Cs-134, and Cs-137 released
PDQ 89-512 Radiological survey results (up to 58 uR/hr contact) along creek raise concerns associated with EPA criteria
No limits were exceeded (activity resulted from permitted releases)
2.1.8.1.2 Independent Evaluations Conducted
Document Equipment/System/location Remarks
UCID-20267 Rancho Seco Liquid Effluent Pathway Aquatic and Terrestrial Dietary Survey Report – November 30, 1984
Study to establish and define the potential exposure pathways associated with the liquid effluent releases from Rancho Seco
UCID-20295 Concentration of Radionuclides in Fresh Water Fish Downstream of Rancho Seco Nuclear Generating Plant – December 27, 1984
Established basic correlations between species, diet, size, and radiological concentration of common game fish in downstream waterways - Using consumption data from UCID-20267, calculated maximum intakes of Cs-137 in the 70,000-pCi/year range
UCID-20298 Radionuclides in Sediments Collected Downstream from Rancho Seco Nuclear Power Generating Station
Estimated that only 20% of the Cs-134/137 discharged between 1981 and 1984 are associated with the bottom sediments (to a depth of 12 cm.) in Clay, Hadselville, and Laguna Creeks to a distance of 16.2 miles (26 km) from the plant
UCID-20367 Environmental Radiological Studies Downstream from Rancho Seco Nuclear Power Generating Station. March 22, 1985
Primarily summarizes UCID – 20267, 20295, & 20298 and recommends further investigation of aquatic and terrestrial food source pathways
UCID-20641 Environmental Radiological Studies Downstream from the Rancho Seco Nuclear Power Generating Station - 1985. February 6, 1986.
Part I documents follow-up investigation of radioactivity concentrations in fish and sediment samples. Part II contains appendices with sample data

Rancho Seco License Termination Plan Revision 1 Chapter 2, Site Characterization May 2008
Page 2-20
Document Equipment/System/location Remarks
NUREG/CR-4286 (ORNL-6183)
Evaluation of Radioactive Liquid Effluent Releases From the Rancho Seco Nuclear Power Plant. March 1986
Based on the analysis of the data gathered, the potential for exposures above 25 mrem/yr appear highly unlikely, stating that in its summary “... it seems reasonable to assume that unless some individual is eating 14 to 18 kg of fish per year caught in the sump, Clay Creek, or Hadselville Creek at Clay Station Road, a 25 mrem/year dose. . . is not reached by any individual around Rancho Seco.”
UCID – 20963 Environmental Radiological Studies Conducted During 1986 in the Vicinity of the Rancho Seco Nuclear Power Generating Station March 22, 1987
Documents the continuation of the environmental monitoring research being performed. Cs concentration in fish has returned to background at distances greater than 7.5 km from the plant effluent boundary.
UCRL-106111 Environmental Radiological Studies in 1989 Near the Rancho Seco Nuclear Power Generating Station November 1990
Documents the 1989 follow-up to the environmental effluents studies performed in 84-87 - Recommendations include suspension of the studies unless a normal or above normal precipitation cycle prompts an evaluation of the potential redistribution of the activity inventory
None Rancho Seco Non-Industrial Area Survey Project - Shonka Research Associates, Inc. June 2001
Determined that there is now "no presence of contamination discernable from background" with the exception of the effluent path itself and the associated swales

Rancho Seco License Termination Plan Revision 1 Chapter 2, Site Characterization May 2008
Page 2-21
2.1.8.1.3 District Initiated Evaluations
Document Equipment/System/location Remarks
RPDP 90-001 Over reporting of effluent release activities for Ag110m, Co-57, Co-58, Co-60, Cs-134, Cs-137, Mn-54, & Sb-125 by up to 40%
Based on residual activity detected in retention basin sludge during clean up activities in 1985 & 1989 - Ag-110m~30%, Co-57~2%, Co-58<1%, Co-60~26%, Cs-134~2%, Cs-137~3%, Mn-54~2.5%, & Sb-125~42%
RPDP 90-010 A multiple topical study, including “Field #14” Soil contamination
Estimate that ~350 ft3 of dredging wastes will fail to decay to less than the anticipated 10 mrem/standard utilized in 1990. (See 91-006 for follow-up)
RPDP 91-006 Radiological characterization along the Plant Effluent Stream
Summarized investigation documentation between 1985 and 1989 in preparation for further studies - Noted the elevated levels detected in the dredge piles and that ~1020 ft3 of these piles had been containerized as radwaste
RPDP 92-004 Effluent course characterization Soil contamination depth profile RPDP 92-005 Offsite Soil Sector survey Provided characterization data
from within an approximate 2000-foot radius of Reactor Containment Building (360o) surrounding facility with direct measurement and soil sample correlations
RPDP 92-006 Effluent wastewater course radiological characterization
Provides a summary of studies to date and established soil contamination half-lives and remediation options
RPDP 92-008 Soil activity vs. measured exposure rate wastewater course area
Early attempt to correlate the soil activity to direct gamma readings
RPDP 92-009 Half-life Calculations for Clay Creek Bank
Estimates environmental half-life of effluent creek at ~ 4 years
RPDP 92-010 TEDE calculation for soil sample taken at grid location AI-16
186 mrem/year, decaying to 9.9 mrem/year in ~4 half-lives (17 years)
RPDP 93-002A Evaluation of Soil in Area AH & AI-15
Additional data attempting to correlate soil activity and direct dose measurements
RPDP 93-003 Evaluation of Soil in Area AM-5 Additional data attempting to correlate soil activity - direct dose measurements and various depth of soil removal

Rancho Seco License Termination Plan Revision 1 Chapter 2, Site Characterization May 2008
Page 2-22
Document Equipment/System/location Remarks
RPDP 93-006 Evaluation of Soil in Area AN-2 Activity concentration vs. depth to 6”
RPDP 93-008 Offsite Soil Sector Survey Provided characterization data within 3-mile radius, 360o
surrounding facility with direct measurement and soil sample correlations
RPDP 94-003 Soil environmental half-life evaluation
Estimates environmental half-life of effluent creek at ~ 4 years
RPDP 95-004 Radiological Characterization Report
Summarizes the characterization effort and the decision not to remediate the effluent canal
RPDP 95-007 Offsite uR/hr versus Soil Activity Correlation
Provides two different models with which to estimate annual exposure from measured dose rates in the effluent canal area
2.1.8.2 Area 2 – South Plant Outfall Area
Available documentation of the radiological impacts associated with the evaluations from specific incidents during the operational and post operational period include:
2.1.8.2.1 Licensee Identified Events
Document Equipment/System/location Remarks
ODR 82-0248 Leakage from (auxiliary) large boiler ran down storm drain
Plant Effluent H-3 4.5E-06 to 6.6E-06 (μCi/ml)
ODR 84-0217 Hydro-pump hose burst – water down storm drain
Hydro source CST – H-3 2.00E-05 μCi/ml
ODR 84-0317 Drain hose fails releasing 500 gallons from T-993 to storm drain
2.20E-05 μCi/ml – 2880 μCi total release
ODR 85-0075 Hole in “B” RHUT releases ~ 1000 gallon to storm drain
2.00E-04 μCi/ml at storm drain - < 4.30E-06 at the outfall
PDQ 90-0367 H-3 Evap (RWS-730) leaks 500 gallons across Tank Farm into storm drain south of East cooling tower
H-3 at 3.8E-02 and Cs-137 at 3.6E-08 μCi/ml
PDQ 93-0088 A RHUT agitator leaks 450 gallons down storm drain.
Release – 37 μCi H-3, 8.30E-03 μCi Co-60, 3.15E-03 μCi Cs-134, 8.52E-02 μCi Cs-137

Rancho Seco License Termination Plan Revision 1 Chapter 2, Site Characterization May 2008
Page 2-23
Document Equipment/System/location Remarks
PDQ 02-0015 B RHUT agitator leaks 450 gallons down storm drain resulting in an unmonitored release
H-3 at 4.42E-06 and Cs-137 at 2.80E-09 μCi/ml
2.1.8.3 Areas 3 – 7
With the exception of two Impacted Survey Units contained in Area 5, no radiological impacts were identified in these Areas.
One Impacted Survey Unit within Area 5 consists of the employee parking lot, Parking Area #2 and Parking Area #4. One event was identified in this area; ODR 870301 where a pallet with articles tagged “Contact RP prior to disassembly outside RCA” was found in this area. Also, this area has been used as a staging area for radioactive material shipments, both incoming and outgoing.
The second Impacted Survey Unit consists of the access road to highway 104. Since this access road serves as the point of egress and ingress of radioactive material shipments, it was classified as Impacted in accordance with MARSSIM classification guidance.
2.1.8.4 Area 8
Area 8 is comprised of that area of the site known as the Industrial Area. The identified radiological impacts on the Industrial Area are too numerous to summarize here. A brief summary of each radiological occurrence is included in Appendix A of the HSA, “10 CFR Part 50.75(g) Document Review Summary.”
2.1.8.5 Area 9
Area 9 is comprised of those areas of the entire 2,480 acre site not contained in Areas 1 through 8.
2.1.9 HSA Findings
Rancho Seco, like all commercial nuclear power plants, was designed with multiple boundaries to contain the unit’s radioactive contents within its many systems, components, and structures. Many of these systems and structures have been impacted due to routine operations and maintenance activities during the operational and post operational history of the plant. Structures classified as Impacted by the unit’s operation include the Reactor Containment Building, Auxiliary Building, Spent Fuel Storage Building, Interim Onsite (radwaste) Storage Building (IOSB), and much of the Tank Farm and the systems contained within it. Other systems, components and structures that were not originally anticipated to be contaminated have been impacted as the result of system cross contamination between the primary coolant system and secondary steam systems due to the failure of tubes within the unit’s OTSGs.
The District-controlled property outside of the Industrial Area has been initially classified as Non-Impacted with the exception of the storm drain outfalls (Area 2), the plant effluent water course way (Area 1), and the access road and parking lots #2 and #4 (Area 5).

Rancho Seco License Termination Plan Revision 1 Chapter 2, Site Characterization May 2008
Page 2-24
These preliminary classification assignments have been substantiated by the non-Industrial Area survey work performed by Shonka Research Associates, Inc. This project provided direct scanning of over 300,000 square meters accompanied by over 80,000 gamma spectral samples without the detection of any radioactive material of site origin above background.
Table 2-5 Area Designations
Area 1 (100000) Impacted Area 2 (200000) Impacted Area 3 (300000) Non-Impacted Area 4 (400000) Non-Impacted Area 5 (500000) Non-Impacted* Area 6 (600000) Non-Impacted Area 7 (700000) Non-Impacted Area 8 (800000) Impacted
Area 9 Non-Impacted *Area 5 contains two impacted area within it
2.1.10 HSA Conclusions
The Rancho Seco HSA provides sufficient evidence to support an Impacted Area classification for portions of Area 1 and Area 2, and all of Area 8 only. Area’s 3 through 7 and Area 9 shall be classified as Non-Impacted Areas and excluded from further investigation and survey actions with the exception of two Impacted Areas within Area 5 as described in Section 2.1.7.3. Table 2-5 summarizes the classifications for each area.
Based on current and historic sample results from the Rancho Seco Radiological Environmental Monitoring Program (REMP), there is no indication that surface waters on or near the facility or the ground water beyond the site have been affected by the licensed operation of the facility. However, further evaluations of the groundwater directly below the licensed facility have been conducted. The initial findings of this study are presented in Section 2.2. The plant effluent watercourse contains deposits with measurable amounts of radioactive material resulting from liquid releases conducted in accordance with the regulatory and permit requirements imposed on the facility.
There were periods of liquid effluent releases during operation of the plant where it was determined that calculated dose to a maximally exposed individual via the liquid effluent pathway exceeded the design objective level of 10 CFR Part 50, Appendix I. However, it was also determined that these liquid effluent releases did not exceed the concentration limits of 10 CFR Part 20 or the fuel cycle dose limit of 40 CFR Part 190. The dose from which has already been accounted for in accordance with the regulation governing radioactive effluent from power plants and no remediation is required.
2.2 Hydrogeological Investigations
Section 8.5 in Chapter 8 of this LTP contains a summary description of the geology, hydrogeology and hydrology of the Rancho Seco site and environs. The information contained in Section 8.5 is a summary based on the supplement to Rancho Seco Environmental Report - Post Operating License Stage developed for decommissioning [Reference 2-18]. In general, the information contained in Section 8.5 was derived directly from the Rancho Seco Environmental

Rancho Seco License Termination Plan Revision 1 Chapter 2, Site Characterization May 2008
Page 2-25
Report - Post Operating License Stage and/or the Rancho Seco Historical Site Assessment. The information contained in this Section 2.2 of the LTP contains a summary description of those studies and the studies that have been performed recently to investigate groundwater contamination (both radiological and non-radiological) resulting from the operation of Rancho Seco.
2.2.1 Methods
The hydrogeological investigations were based on a review of existing site data, including the results of several previous site investigations, as well as a series of recent test borings and four nests of monitoring wells completed in the Industrial Area and near the western site boundary, west/southwest of the Industrial Area.
2.2.1.1 Initial Siting Investigation
A soil and foundation investigation program as described in the Rancho Seco Nuclear Generating Station, Unit No. 1, Updated Final Safety Analysis Report [Reference 2-19] was conducted to establish the suitability of the site and to provide the basic criteria for design of Rancho Seco. The drilling and sampling program began on June 28, 1967 and was concluded on August 25, 1967. Preceding the drilling and sampling program, a geologic reconnaissance and mapping program was performed by Bechtel geologists in consultation with Roger Rhodes, consultant geologist to Bechtel Corporation. Borings drilled on the Rancho Seco site included 71 exploratory holes and one domestic water supply well.
Geophysical logging techniques were employed in DH-23, the deepest geologic boring drilled at the site. These techniques provided a continuous geophysical log of materials with depth between sampling intervals and indicated changes of materials, density and firmness with depth. Refraction seismograph traverses also were run in the general area of the proposed site using a portable seismic device. The seismic velocities obtained were used to interpret the densities or changes in the properties of subsurface materials with depth.
2.2.1.2 Geotechnical Investigation for Proposed Evaporation Ponds
A geotechnical investigation of a proposed evaporation pond site at the Rancho Seco site was performed in the summer and fall of 1985. The proposed site is located about one quarter mile southwest of the Industrial Area, in an area of gently rolling topography underlain by unconsolidated alluvium and poorly consolidated sedimentary rocks. The purpose of the geotechnical investigation was to collect subsurface geologic and soils data for use in evaluating the suitability of the site for the proposed evaporation ponds and to establish a baseline groundwater and soil pore water monitoring system. The evaporation ponds were not constructed.
The field work included soil sampling, permeability testing, the installation of observation wells and lysimeters, water sampling and the measurement of groundwater levels. Four permeameter holes were drilled for testing permeability of near-surface soils. Four observation wells and two lysimeters were installed. Four test pits were dug for bulk soil samples and 10 soil borings were drilled to collect soil samples for laboratory testing. The water table at this location is at a depth of approximately 150 feet bgs (below ground surface).

Rancho Seco License Termination Plan Revision 1 Chapter 2, Site Characterization May 2008
Page 2-26
2.2.1.3 2005 Update Investigation
To reduce uncertainties in the hydrogeological conceptual model, an investigation was undertaken in 2005. In the investigation, nests of monitoring wells were constructed at four locations between potential sources of contamination and the Rancho Seco property boundary. Historical borings as well as the new nests of monitoring wells are shown on Figure 2-4, Locations of Borings Drilled and Sampled at Rancho Seco. Each nest was intended to have three monitoring wells constructed within one 12-inch boring. The monitoring wells were constructed such that the well screens were emplaced at three different depths within the boring. Table 2-6 lists the drilling and construction details of each of the well locations (new nested wells, accessible proposed evaporation pond wells and Industrial Area potable water supply wells). Drilling and construction of wells were permitted by the Environmental Management Department of the County of Sacramento.
Table 2-6 Well Construction and Water Elevation Data
Well ID Northing (NAD83)
Easting (NAD 83)
Screen Interval (feet bgs)
Water Use
Groundwater Elevation, 12/06/2005 (feet msl)
Vertical Gradient Between this Well & Shallower Well
(feet/feet) MW1A 1888419.45 6813523.57 160 – 170 Monitoring Dry Well Dry Well MW1B 1888419.16 6813522.97 210 – 220 Monitoring -18.82 Shallowest well MW1C 1888419.56 6813522.92 290 – 300 Monitoring -19.33 0.0064 MW2A 1887946.55 6812353.12 200 – 210 Monitoring -22.54 Shallowest well MW2B 1887945.27 6812352.87 265 – 275 Monitoring -22.91 0.0057 MW2C 1887946.21 6812353.24 320 – 340 Monitoring -22.92 0.0002 MW3A 1888224.36 6810988.02 200 – 210 Monitoring -24.56 Shallowest well MW3B 1888224.00 6810987.93 265 – 275 Monitoring -24.62 0.0009 MW3C 1888224.13 6810988.28 310 – 320 Monitoring -24.71 0.0020 MW4A 1887086.40 6810770.31 195 – 205 Monitoring -29.02 Shallowest well MW4B 1887086.44 6810770.72 251 – 261 Monitoring -29.06 0.0007 MW4C 1887086.10 6810770.56 310 – 320 Monitoring -28.99 -0.0012 OW-2 1886349.74 6910826.33 168 – 177 Monitoring -28.70 NA OW-3 1887127.52 6811602.60 177 – 187 Monitoring -26.54 NA SW-1 NA NA 156 – 400 Water supply NM NA SW-2 NA NA 254 - 295 Water supply NM NA
bgs – below ground surface msl – mean sea level NA – not available NM – not measured
The 12-inch diameter borings were drilled with mud rotary drilling equipment. The subsurface materials being penetrated by the drill were described by the on-site geologist using the drill cuttings brought to the surface by the drilling mud. Drilling logs and construction details are presented in the hydrogeological characterization report [Reference 2-20]. Samples of soil and rock above the water table were collected with split-spoon equipment at three different depths in the borings for MW1 and MW2.
The first boring was drilled into dense sandstone or siltstone at 400 feet bgs. The nature of the rocks penetrated below 320 feet bgs in that boring indicated that vertical migration of any contaminants would be slowed, if not stopped, by the condition of the rock. Subsequent borings

Rancho Seco License Termination Plan Revision 1 Chapter 2, Site Characterization May 2008
Page 2-27
were drilled to 300 to 340 feet bgs after penetrating the top of the same dense rock that would impede contaminant migration. After drilling of each boring, the construction of the three monitoring wells in the boring was determined by the on-site geologist in consultation with a California Certified Hydrogeologist. The chosen depth intervals of the screen for each well were separated by at least 35 feet. After the screen decision was made, the wells were constructed with clean, low-carbon steel casing and screen. Following construction of each well nest, each well in the nest was developed to assure groundwater would flow into the screen. All of the wells were developed and water flowed into the screen, with the exception of MW1A, the well with the shallowest well screen at location MW1. The shallowest well in each nest is labeled “A”; the “B” and “C” wells are successively deeper in the boring.
Seven months after construction, MW1A had not provided any water level information or groundwater samples. The well screen at 160 to 170 feet bgs has been above the groundwater level since the well was completed. During drilling, it was not possible to confirm that groundwater was present at 160 feet bgs because, when drilling with the mud rotary technique, water containing drilling mud is added to the boring during drilling. There was little loss of drilling mud while the drill penetrated through the 140 feet bgs to 170 feet bgs because the material was plastic clay; therefore, the penetrated material seemed to be water saturated. Previous work at the site and water level measurements in existing wells indicated that the groundwater surface would be approximately 140 to 150 feet bgs.
2.2.2 Site Geology and Hydrology
2.2.2.1 Geology
The Rancho Seco site is located within the Great Valley Geomorphic Province, which is a wide structural trough bounded by the Sierra Nevada on the east and the Coast Range on the west. The youngest alluvial deposits occur farthest west, near the City of Galt and Interstate 5. The deposits exposed at the surface are older as one moves east toward the Rancho Seco site.
The stratigraphy of the Rancho Seco site consists of the following deposits:
• Recent Alluvium consisting of stream deposited gravel, sand, and silt. This material is confined to present drainage courses and ranges in depth from 0 to 5 feet bgs.
• Older Alluvium consisting of old stream and terrace deposits of gravel, sand, and silt. This material covers the flood plains in the southwest portion of the site and deposits of well-rounded cobbles, pebbles and sand derived chiefly from pre-Cretaceous sediments on pediment surfaces. This category includes the equivalents of the Modesto and Riverbank Formations. The thickness on site is 0 to 10 feet.
• The Laguna Formation consists of sand, silt, and some gravel; may or may not contain clay. It is made up of poorly bedded materials of silicic volcanic origin. This formation occurs at the surface across much of the site; its bottom boundary has been encountered at depths of approximately 130 feet bgs.
• The Mehrten Formation consists of fluviatile sandstone, siltstone, and conglomerate composed primarily of andesitic detritus. Locally contains horizons of coarse andesitic agglomerate of mudflow origin. This formation is encountered at the surface west of the Industrial Area and has an approximate thickness of 225 feet beneath the site.
• The Valley Springs Formation consists of pumice and fine siliceous ash, with much greenish-gray clay and some vitreous tuff, glassy quartz sand and conglomerate. It is

Rancho Seco License Termination Plan Revision 1 Chapter 2, Site Characterization May 2008
Page 2-28
commonly well bedded. It derived largely from rhyolithic material thrown out from the high Sierra Nevada. This formation has no surface exposures on the site, and an estimated average thickness of 250 feet beneath the site.
• The Ione Formation is composed of clay, sand, sandstone and conglomerate. It may have a thickness of 200 to 400 feet beneath the site, and it is not exposed anywhere on the District property. Lying beneath the Valley Springs Formation, the Ione Formation is likely to be the deepest sedimentary deposit above the metamorphic basement rocks; however, its depth and thickness are not known because none of the site borings penetrated through the Valley Springs Formation. The approximate depth of the metamorphic basement rocks beneath the site is 2,000 feet bgs.
Borings MW2, MW3, MW4, OW2 and OW3 drilled at Rancho Seco have penetrated the Older Alluvium, Laguna Formation and part of the Mehrten Formation. Two borings, DH-23 drilled in 1967 and MW1 drilled in 2005, have penetrated the Older Alluvium, Laguna Formation, Mehrten Formation and probably hard green siltstone and claystone of the upper part of the Valley Springs formation.
No faults have been identified within 10 miles of Rancho Seco, and the only structure in the sedimentary rocks is identified by gentle westerly dips of one to three degrees caused by the gradual uplift of the Sierra Nevada relative to the basin receiving the sediments.
2.2.2.2 Hydrology
Runoff from the site drains into the seasonal No Name Creek, which is a tributary to Clay Creek, which empties into Hadselville Creek. Hadselville Creek is a tributary of Laguna Creek South, which flows into the Consumnes River, which joins the Mokelomne River upstream from its confluence with the San Joaquin River. Rancho Seco releases approximately 6,000 gpm of water into No Name Creek. This water comes from the Folsom-South Canal either directly or via the Rancho Seco Reservoir that is approximately one mile southeast of the Industrial Area. Without this flow, No Name Creek would have no flow during the dry months.
Recharge to the groundwater occurs primarily by the infiltration of surface water along the active channels of streams, such as the Cosumnes River, Dry Creek and Mokelumne River, and by deep percolation of applied irrigation water. Some recharge also occurs from the direct infiltration of precipitation; however, direct infiltration is limited by the relatively low (18-inch) annual rainfall, relatively high (50-inches or more) evaportransporation rate, the moderate to low permeability (0.07 to 0.08 inches per hour) of surface soil and the deep (greater than 140 bgs) water table.
Since the investigation of the Rancho Seco site began in the 1960s, no flooding or inundation from storm runoff has occurred within the site boundaries. The Industrial Area of the site would not be flooded during a 100-year storm event [Reference 2-21]. The topography of the site and the soil types promote runoff away from Industrial Area buildings. However, seasonal marshes and vernal pools develop west of the Industrial Area in shallow surface depressions during and after the December through March rainy season.
2.2.3 Hydrogeology
The Rancho Seco site is located within the Cosumnes Subbasin of the San Joaquin Valley Groundwater Basin. The subbasin consists of the unconsolidated and semi-consolidated sedimentary deposits that may hold groundwater between the Cosumnes River on the north and

Rancho Seco License Termination Plan Revision 1 Chapter 2, Site Characterization May 2008
Page 2-29
Mokelumne River on the south. All of the sedimentary deposits in the Cosumnes Subbasin and possibly the basement rocks if they are fractured, may contain groundwater. Eleven borings on the site have penetrated the groundwater; four of those borings were completed as water supply wells, and geologic information was not saved. Three observation borings, each to a depth of 200 feet bgs, one boring drilled to 602 feet bgs and four 2005 borings for monitoring well nests provide the geologic information about the aquifer.
Subsurface deposits beneath Rancho Seco are dominated by fine-grained deposits of clay and silt with interbedded thin sands and gravels to a depth of approximately 120 to 130 feet bgs; above that depth interval, deposits become more indurated with depth, such that some intervals can be considered claystone and siltstone. Beneath 130 feet, the deposits are siltstone and claystone with thin (10 feet or less), interbedded sandstone and conglomerate; this interval is mostly within the Mehrten Formation. At approximately 290 to 330 feet bgs in all of the deeper borings, drilling became very difficult as the drill penetrated gray to green well-indurated siltstones with thin sandstones and claystones. This change in drilling and lithology of deposits is interpreted as the top of the Valley Springs Formation.
The upper groundwater surface beneath the site now occurs at depths greater than 165 feet bgs (December 2005) in the sediments of the Mehrten Formation. Therefore, groundwater may be present from approximately 165 feet bgs in the Mehrten Formation to perhaps 2,000 feet bgs, where the Ione Formation is in contact with much denser rocks. The sand and gravel zones of these formations yield water readily to wells predominantly west of the facility in the Central Valley. The Mehrten Formation is known for yielding large volumes of water to wells. Beneath the site, however, the Mehrten Formation consists predominantly of siltstones and claystones that are likely to have lower hydraulic conductivity values (1 x 10⁻⁷ cm/sec to 1 x 10⁻⁴ cm/sec from permeability tests) than the typical Mehrten Formation, which is sand/sandstone dominated. The sediments of the Laguna Formation are above the water table and, therefore, do not produce groundwater to wells. However, the hydraulic conductivity range of samples collected in the unsaturated Laguna Formation is 2.8 x 10⁻⁷ cm/sec to 5.8 x 10⁻⁴ cm/sec. The Valley Springs and Ione Formations are considered small-yield aquifers because of low hydraulic conductivity values caused by claystone and siltstone layers [Reference 2-22].
Long-term hydrographs for 23 wells in the Cosumnes Subbasin indicate that water levels declined from the mid-1960s until approximately 1980, unless the wells were in the recharge area of the Cosumnes River, which is several miles north of the site. From 1980 until 1986, water levels in most wells recovered as much a 10 feet from pre-1980 levels. Water elevations again decreased approximately 10 to 15 feet during the drought years of 1987 to 1992 and recovered 15 to 20 feet from 1993 to 2003 [Reference 2-23].
2.2.4 Groundwater
2.2.4.1 Groundwater Movement
Groundwater levels in the four new well nests suggest that there is one aquifer between the water table and 300 feet bgs, that the horizontal gradient is southwesterly and vertical hydraulic gradient is upward. A potentiometric surface map, constructed with data collected in the monitoring wells on December 6, 2005, is shown in Figure 2-5. The contours denote a southwesterly gradient beneath Rancho Seco. The average hydraulic gradient calculated from potentiometric data for the wells is 0.0028 feet per foot. Only one potentiometric surface map was prepared because the data suggest that the horizontal gradients are similar in all depth

Rancho Seco License Termination Plan Revision 1 Chapter 2, Site Characterization May 2008
Page 2-30
intervals from 170 to 300 feet bgs. Vertical gradients were upward from the deepest screen interval (approximately 300 feet bgs) toward the shallower screen depths, except between MW4C and MW4B. However, the gradient is upward from MW4B to MW4A. Therefore, an upward gradient averages 0.0028 feet per foot among six pairs of wells. This vertical gradient value is essentially identical to the average horizontal gradient among the wells.
No pumping tests have been conducted at the site. Hydraulic conductivity values have been estimated from laboratory hydraulic conductivity tests and in situ packer permeability tests.
2.2.4.2 Groundwater Characterization Survey
Details of groundwater sampling and analyses will be provided in the Rancho Seco Groundwater Monitoring Report. This report will be issued upon the completion of sampling and analyses of one full year (four calendar quarters representing the annual four seasons) of groundwater monitoring. The following discussion is a summary of the groundwater sampling and analyses completed following installation of the new monitoring wells.
2.2.4.2.1 General Minerals Found in Groundwater
Groundwater samples were collected from 10 of the 12 monitoring wells following construction in 2005 and analyzed for a suite of analytes that characterize the naturally occurring constituents in groundwater that originate from the atmosphere and from the soluble anions and cations from soil and aquifer material. Sometimes referred to as “general minerals,” the analytes in the suite are used to determine differences between groundwater bodies that may be vertically separated. Near-surface groundwater may have a different geochemical composition than deeper groundwater because of constituents dissolved from soil and anthropological sources. In addition to the general mineral constituents, analyses were performed for the total boron because boric acid was added to primary coolant system water to serve as a neutron absorber.
In addition to the 10 samples from monitoring wells, a sample from the potable water supply well in the Industrial Area, SW-2; a sample from the site potable water supply well, SW-1, just east of the Industrial Area; and one sample from the potable water supply well at Rancho Seco Park (RSPW), approximately a mile southeast of the Industrial Area, were also analyzed for the suite of analytes. Results from the two wells located east of the Industrial Area are representative of “background conditions” because the groundwater moving through those wells has not been affected by any discharges from Rancho Seco activities. Groundwater at SW-1 and RSPW can be considered unaffected by any contaminates from the Industrial Area because groundwater has been flowing from northeast to southwest for at least 38 years.
Table 2-7 lists the results of the general minerals results for groundwater samples. It is readily evident that borate is not a contaminant in the samples analyzed because it was detected in only one sample, from MW2A, at a concentration equal to the reporting limit of 0.05 milligrams per liter (mg/L). Furthermore, the results are notable for the similarity of values among the wells sampled. The only readily identifiable differences in the table are the higher level of total dissolved solids, the presence of detectable concentrations of nitrate nitrogen, and pH 1.5 to 2.1 units lower in SW-1, SW-2 and RSPW than in most of the monitoring well samples.

Ran
cho
Seco
Lic
ense
Ter
min
atio
n Pl
an
R
evis
ion
1 C
hapt
er 2
, Site
Cha
ract
eriz
atio
n
May
200
8
Pa
ge 2
-31
T
able
2-7
G
ener
al M
iner
als R
esul
ts fr
om A
naly
ses o
f Gro
undw
ater
Wel
l Sam
ple
Alk
alin
ity,
Tot
al
mg/
L
Alk
alin
ity,
Bic
arbo
nate
m
g/L
Alk
alin
ity,
Car
bona
te
mg/
L
Chl
orid
e m
g/L
M
agne
sium
m
g/L
Nitr
ogen
, Tot
al
Nitr
ate-
N
mg/
L
Sulfa
te
mg/
L
Iron
m
g/L
MW
1C
86
57
29
7.1
2 <0
.05
<0.5
0 17
M
W2A
86
86
<5
14
.0
3 <0
.05
4.20
23
M
W2B
64
64
<5
9.
6 4
<0.0
5 1.
40
73
MW
2C
62
36
26
6.7
2 <0
.05
<0.0
5 36
M
W3A
49
45
<5
5.
6 2
<0.0
5 1.
10
203
MW
3B
51
40
11
5.2
<2
<0.0
5 <0
.50
5.3
MW
3C
58
51
7 5.
7 3
<0.0
5 <0
.05
6.4
MW
4A
53
42
11
5.0
<2
<0.0
5 <0
.05
38
MW
4B
49
42
7 4.
6 <2
<0
.05
<0.0
5 37
M
W4C
49
38
11
3.
7 2
<0.0
5 <0
.05
4.65
SW
-1
52
52
<5
4.0
3 1.
80
3.50
<0
.05
SW-2
55
55
<5
4.
1 3
1.80
4.
80
<0.0
5 R
SPW
65
65
<5
5.
8 5
0.64
1.
40
0.24
Q
uant
ifica
tion
Lim
it 5
5 5
1 2
0.05
0.
50
0.05
Meq
= m
illie
quiv
alen
ts
mg/
L =
mill
igra
ms p
er li
ter

Ran
cho
Seco
Lic
ense
Ter
min
atio
n Pl
an
R
evis
ion
1 C
hapt
er 2
, Site
Cha
ract
eriz
atio
n
May
200
8
Pa
ge 2
-32
Tab
le 2
-7 (C
ont.)
G
ener
al M
iner
als R
esul
ts fr
om A
naly
ses o
f Gro
undw
ater
Wel
l Sam
ple
Pota
ssiu
m
mg/
L
Bor
on-T
otal
m
g/L
C
alci
um
mg/
L
Har
dnes
s m
g/L
So
dium
m
g/L
Tot
al D
isso
lved
So
lids
mg/
L
pH
pH U
nits
Cat
ion/
Ani
on
Bal
ance
m
eq
MW
1C
3.86
<0
.05
5.9
24
34
126
9.5
2.04
/1.9
2 M
W2A
3.
34
0.05
4.
0 24
42
15
1 7.
6 2.
36/2
.20
MW
2B
3.46
<0
.05
4.7
28
26
101
8.9
1.78
/1.5
8 M
W2C
4.
03
<0.0
5 4.
7 20
24
88
9.
6 1.
55/1
.43
MW
3A
2.69
<0
.05
4.0
20
19
69
9 1.
26/1
.16
MW
3B
2.97
<0
.05
3.2
14
18
72
9.4
1.02
/1.1
7 M
W3C
3.
16
<0.0
5 4.
0 22
21
81
9.
2 1.
44/1
.32
MW
4A
2.41
<0
.05
3.2
16
20
70
9.3
1.09
/1.2
0 M
W4B
2.
50
<0.0
5 3.
2 16
18
71
9.
3 1.
01/1
.11
MW
4C
3.09
<0
.05
4.0
20
16
71
9.3
1.14
/1.0
8 SW
-1
3.90
<0
.05
3.2
20
22
168
7.7
1.46
/1.3
5 SW
-2
3.80
<0
.05
4.7
24
20
165
7.6
1.45
/1.4
4 R
SPW
3.
70
<0.0
5 6.
3 35
20
18
0 7.
4 1.
69/1
.54
Qua
ntifi
catio
n Li
mit
0.05
0.
05
3.0
5 5
10
0.1
NA
Meq
= m
illie
quiv
alen
ts
mg/
L =
mill
igra
ms p
er li
ter

Rancho Seco License Termination Plan Revision 1 Chapter 2, Site Characterization May 2008
Page 2-33
The similarity of most parameters among all monitoring well locations and all depths indicate that groundwater is not stratified with large differences in constituent concentrations vertically. Graphical techniques that show the similarity or difference in general mineral concentrations between waters were used to confirm that groundwater up hydraulic gradient from the Industrial Area, beneath the Industrial Area and down hydraulic gradient from the Industrial Area are the same. Piper and Stiff diagrams were prepared with concentrations of the major cations and anions occurring in groundwater; they are calcium, magnesium, potassium, sodium, bicarbonate, carbonate, chloride and sulfate concentrations. These Piper and Stiff diagrams are shown in Figures 2-6 and 2-7.
In the Piper diagram, each of the 13 well samples is represented by one dot on each of the three diagrams. For this diagram, concentrations of the major cations and anions are converted to milliequivalents and totaled. The location of dots representing wells is determined by the percentages of the total that each cation or anion (or a combination such as sodium and potassium) contributes. The close clustering of all the dots representing monitoring well samples as well as the three supply wells indicates that there is no great difference in the groundwater from one mile upgradient to 3,500 feet downgradient of the industrial area. Furthermore, groundwater from 300 feet bgs from the “C” depth monitoring wells is not distinguishable from the groundwater in the “A” and “B” depth wells.
Stiff diagrams use the same mlliequivalent per liter data. However, they are arrayed in a different plot. Stiff diagrams are made for rapid pattern recognition to classify a groundwater and determine similarities from location to location and shallow to greater depths. Figure 2-7 illustrates a series of Stiff diagram plots that further support the similarity of groundwater among all of the wells sampled. These diagram plots indicate that the groundwater beneath District property, including Rancho Seco is a sodium-bicarbonate type.
Two wells up hydraulic gradient from the Industrial Area (SW-1 and RSPW) tap groundwater that has the same general mineral constituents as groundwater beneath and down hydraulic gradient from the Industrial Area. Therefore, the two wells can be used as indicators of background quality to compare with any well that is suspected of being contaminated.
The general mineral constituents at 190 feet bgs in the groundwater beneath Rancho Seco are essentially the same as at 320 feet bgs. This condition and the upward hydraulic gradient from greater depth to shallower suggests that sampling of most of the “C” depth wells for contaminants will not be necessary because contamination is unlikely to migrate downward against the gradient.
2.2.4.2.2 Radiochemical Analyses of Groundwater Samples
The shallowest available well at each of the new monitoring well locations down hydraulic gradient from the Industrial Area were sampled (unfiltered) for radiochemical analysis during the third and fourth quarters of 2005. Monitoring well MW1A did not produce water during either of these sampling periods and MW1B became obstructed during the first sampling period. A new monitoring well MW1D has been constructed adjacent to the MW1 well nest with a screen interval of 200 to 220 feet bgs. This well will be used as the shallow location for future monitoring at the MW1 well nest location. Each of the groundwater samples was analyzed by General Engineering Laboratories (GEL) for 24 of the 26 site-specific radionuclides discussed in Section 6.3 of this LTP (Pu-242 was inadvertently omitted from the list of radionuclides for GEL analysis). Analytical results are provided in Table 2-8.

Rancho Seco License Termination Plan Revision 1 Chapter 2, Site Characterization May 2008
Page 2-34
Table 2-8 Groundwater Monitoring Radiochemical Results
3rd Quarter 2005 Results (pCi/L) 4th Quarter 2005 Results (pCi/L) Analyte MW1C MW2A MW3A MW4A MW1C MW2A MW3A MW4A
Alpha <1.14+00 4.53E+00 <1.38E+00 <1.18E+00 <1.13E+00 7.07E+00 <3.61E+00 <1.25E+00Beta 5.21E+00 8.02E+00 2.89E+00 2.24E+00 <3.71E+00 1.71E+01 <4.30E+00 <4.38E+00H-3 <2.57E+02 <2.62E+02 <2.58E+02 <2.53E+02 <3.59E+02 <3.59E+02 <3.62E+02 <3.65E+02C-14 <3.09E+01 <3.15E+01 <3.48E+01 <3.47E+01 <2.66E+01 <2.66E+01 <2.67E+01 <2.67E+01Na-22 <6.67E+00 <2.86E+00 <5.23E+00 <4.21E+00 <3.14E+00 <3.01E+00 <3.82E+00 <3.49E+00Fe-55 <8.20E+01 <8.05E+01 <7.94E+01 <7.86E+01 <5.66E+01 <5.02E+01 <5.07E+01 <5.89E+01Ni-59 <1.95E+01 <1.54E+01 <1.68E+01 <1.61E+01 <1.66E+01 <1.57E+01 <1.56E+01 <1.56E+01Co-60 <7.15E+00 <3.32E+00 <5.90E+00 <3.74E+00 <3.32E+00 <3.12E+00 <3.38E+00 <3.35E+00Ni-63 <2.18E+01 <1.24E+01 <2.44E+01 <2.69E+01 <2.51E+01 <2.89E+01 <2.67E+01 2.76E+01Sr-90 <1.24E+00 <1.37E+00 <1.43E+00 <1.05E+00 <1.27E+00 <1.03E+00 <9.64E-01 <9.55E-01Nb-94 <6.00E+00 <2.80E+00 <5.23E+00 <3.52E+00 <3.01E+00 <2.95E+00 <3.44E+00 <3.02E+00Tc-99 <3.01E+01 <3.01E+01 <2.98E+01 <3.05E+01 <7.06E+00 <2.01E+01 <2.23E+01 <2.10E+01
Ag-108m <6.93E+00 <2.96E+00 <6.23E+00 <3.39E+00 <2.95E+00 <3.18E+00 <4.13E+00 <3.53E+00Sb-125 <1.79E+01 <8.36E+00 <1.66E+01 <1.01E+01 <8.24E+00 <9.01E+00 <1.05E+01 <9.30E+00Cs-134 <7.35E+00 <3.35E+00 <6.04E+00 <4.45E+00 <3.30E+00 <3.26E+00 <3.87E+00 <3.67E+00Cs-137 <6.02E+00 <3.15E+00 <7.59E+00 <4.16E+00 <2.99E+00 <2.75E+00 <3.48E+00 <3.99E+00Pm-147 <7.53E+00 <7.63E+00 <6.77E+00 <7.12E+00 <7.06E+00 <8.64E+00 <7.83E+00 <7.82E+00Eu-152 <1.99E+01 <9.78E+00 <1.79E+01 <1.03E+01 <9.76E+00 <9.34E+00 <1.23E+01 <1.03E+01Eu-154 <1.85E+01 <7.93E+00 <1.45E+01 <1.17E+01 <8.72E+00 <8.40E+00 <1.07E+01 <9.72E+00Eu-155 <2.18E+01 <1.24E+01 <2.30E+01 <1.02E+01 <1.13E+01 <1.28E+01 <1.37E+01 <1.21E+01Np-237 <3.03E-01 <4.58E-01 <4.24E-01 <3.50E-01 <4.39E-01 <2.17E-01 <5.27E-01 <7.03E-01Pu-238 <4.98E-01 <4.33E-01 <3.57E-01 <3.89E-01 <2.24E-01 <8.37E-01 <1.05E+00 <8.56E-01
Pu-239/240 <4.32E-01 <3.06E-01 <3.35E-01 <2.33E-01 <5.51E-01 <8.36E-01 <6.21E-01 <6.91E-01
Pu-241 <9.26E+00 <1.24E+01 <1.17E+01 <1.11E+01 <1.22E+01 <5.79E+01 <1.07E+01 <9.75E+00Am-241 <4.50E-01 <3.14E-01 <3.53E-01 <3.59E-01 <3.28E-01 <2.72E-01 <4.32E-01 <3.10E-01Pu-242 NA NA NA NA NA NA NA NA Cm-244 <6.00E-01 <5.16E-01 <4.01E-01 <5.95E-01 <4.39E-01 <5.01E-01 <4.32E-01 <3.10E-01
NA – Not Analyzed
Note: “Less Than” numbers are the a posteriori calculated MDA value for the sample analysis. Detected concentration values are statistically positive at the 99.9% confidence level (greater than three times the one sigma uncertainty).
As can be seen from the data presented in Table 2-8, Ni-63 was identified in the 4th quarter 2005 MW3A sample with activity statistically greater than the a posteriori calculated MDA value for the sample analysis at the 99 percent confidence level. However, Ni-63 was not detected in the 3rd quarter 2005 sample with an MDA lower than the 4th quarter statistically positive identified value. Also, the reported value of 2.76E+01 pCi/L for Ni-63 was significantly greater than the MDA value of 4.38E+00 pCi/L for gross beta, which was not identified as having a statistically positive value (Ni-63 decays by beta emission and should therefore result in a positive gross beta analysis result).
The site-specific radionuclide omitted from analysis, Pu-242, has not been detected in contaminated soil samples; therefore, it is unlikely that it would be present in groundwater

Rancho Seco License Termination Plan Revision 1 Chapter 2, Site Characterization May 2008
Page 2-35
samples. Water samples had positive results identified two times for gross alpha activity and five times for gross beta activity. In each case of positive results identified, the concentrations were below the California Title 22 Division 4 Chapter 15 Article 5 maximum contaminant level concentrations of 15 pCi/L for gross alpha and 50 pCi/L for gross beta.
2.3 Pre-Characterization Scoping Surveys
2.3.1 Non-Industrial Area Surveys
A detailed survey of the Non-Industrial Area, encompassing both the liquid and gaseous effluent zone of influence as described in the DSAR and Technical Specifications, was performed by a contractor. This survey included the photovoltaic site and the site of the gas turbine plant recently declared commercial. Nuclide-specific data were collected using a fixed in situ portable gamma spectrometer as well as scan data collected using a vehicle-mounted array of 4 gamma spectrometers. The survey included over 80,000 gamma spectra and a 100% scan of 308,000 m2 of the Non-Industrial Area. The measurements collected for the 60 Survey Area Blocks (SABs) indicated no presence of contamination discernable from background. A summary of results was provided in the “Rancho Seco Non-Industrial Area Survey Project Final Report, Rev.2, June 26, 2001” [Reference 2-24].
Nuclide-specific data from the Subsurface Multispectral Contamination Monitor (SMCM) and in situ counts were reported in terms of a Minimum Detectable Concentration (MDC) if no activity in excess of background was detected. The in situ MDCs were calculated using the method of Currie (1968) and were stated to the 95% confidence level. (In situ MDCs were a factor of 10 lower than the soil DGGLs). The a posteriori MDCs for the SMCM were based on the standard deviation of all measurements collected within the survey block. Data were corrected for terrain height and self-shielding by the detectors and the support rig. The International Atomic Energy Agency (IAEA) spectral stripping coefficients were used to correct the data for the interferences from the naturally occurring radionuclides.
Soil sampling and analysis identified K-40 at a mean value of 6.89 pCi/g and Cs-137 at a mean value of 0.312 pCi/g in undisturbed soil and 0.037 pCi/g in disturbed soil consistent with fallout levels. No other plant-derived radionuclides were detected.
In reaching a conclusion that the residual activity in the Non-Industrial Area was not significantly different from background, the contractor performed a means test. In cases in which variability in background cannot be ignored, testing a null hypothesis that an area contains residual activity in excess of a release criteria (the typical MARSSIM null hypothesis) can result in unacceptable decision error rates. It was therefore preferable to test a null hypothesis that the area does not contain activity distinguishable from background. A description of the null hypothesis test conducted by the survey contractor is presented below.
2.3.1.1 Statistical Testing of Collected Data
The appropriate statistical test to use to demonstrate that two samples are not statistically distinguishable depends on knowledge about the true distributions of the population means being compared (even if nonparametric methods are to be employed) and the number of samples available. NUREG-1505, “A Nonparametric Statistical Methodology for the Design and Analysis of Final Status Decommissioning Surveys,” [Reference 2-25] describes a nonparametric method of demonstrating indistinguishability from background where the survey protocols described in MARSSIM are employed to compare an area of interest to a reference

Rancho Seco License Termination Plan Revision 1 Chapter 2, Site Characterization May 2008
Page 2-36
area. The method is essentially a three-part approach where one first determines if there is significant variability (relative to the applicable DCGLW) among the available reference areas. This is typically done using a nonparametric analysis of variance technique known as a Kruskal-Wallis test. If the Kruskal-Wallis test shows that there is variability among reference areas beyond that expected from statistical variability alone, the magnitude of this variability (quantified by the component of variance that is not accounted for by statistical variability) is determined. Comparisons between areas under consideration and the reference areas to determine if the area contains activity distinguishable from background are then performed using a Wilcoxon Rank Sum test, with the lower bound of the gray region (LBGR) set to the concentration above background that may be considered distinguishable. The null hypothesis being tested is that the difference between the median concentration in the survey area and that in the reference area is less than the LBGR.
While the method described in NUREG-1505 for demonstrating indistinguishability from background would result in lower decision error rates if the null hypothesis being tested was that the survey area contained distinguishable activity, it still relies on a survey modality where a relatively small number of measurements are made in the reference areas and the areas under consideration. Thus, this method is impractical as a means to compare the results from the Rancho Seco background characterization survey in that there was an enormous number of measurements (>80,000) made over a large area of the site. Statistical comparisons based on acquiring a few measurements in just a few areas do not make sense here.
Rather than rely on nonparametric analysis methods intended for small sample sizes, the Rancho Seco data were examined using a traditional parametric method of comparing sample means. Mean results from various SABs were compared to demonstrate that these results were statistically indistinguishable at levels equivalent to small fractions of their combined variability (precision). SABs selected for comparison were not chosen randomly, but were instead chosen based on their relative proximity to show that the results for SABs that were spatially close together were no different than those for SABs that would have shown distinguishability if they had been affected by plant operations. A simple parametric assessment could be used since the large amount of data allowed the assumption of normal (Gaussian) behavior to be verified.
SABs were compared by determining the difference between the two mean values of interest where the value of the t-statistic for the two data sets equaled the critical value for a given significance level and for the degrees of freedom for the two data sets combined. This is the equivalent of determining the additional dispersion (imprecision) that must be added to the difference of the two sample means so that they can no longer be statistically distinguished. This approach had to be used instead of a traditional t-test (where the null hypothesis is that the means are equal) since the large number of measurements in each SAB resulted in very small dispersions about each mean. As a result, all of the SAB means are statistically distinct since their associated standard deviations are so small. The general expression for computing the test value for the t-statistic is shown in Equation 2-1:
Tv =
2
22
1
21
21 ||
Ns
Ns
YY
+
−− δ
Equation 2-1

Rancho Seco License Termination Plan Revision 1 Chapter 2, Site Characterization May 2008
Page 2-37
where:
Tv = test value of the t-statistic for v degrees of freedom given by the sample variances and the number of measurements in each sample,
1Y = value of the first sample mean of interest,
2Y = value of the second sample mean of interest,
δ = additional difference (imprecision) between the two means,
S 1 = sample variance for the first sample mean of interest,
S 2 = sample variance for the second sample mean of interest,
N 1 = number of measurements in the first data set, and
N 2 = number of measurements in the second data set.
The expression for computing the additional imprecision that must be added to the difference in sample means is shown in Equation 2-2 below.
[ ]|| 212
22
1
21
, YYNs
Nst v −−+−= αδ
Equation 2-2 where:
vt ,α = percentile value for Student’s t-distribution for a significance level alpha and degrees of freedom v.
Degrees of freedom for the t-statistic were estimated assuming that the sample variances were not equal. This was a formality, however, since the large number of measurements made in each SAB made precise estimation of v unnecessary. With such large numbers of measurements, the t-distribution is equivalent to a normal distribution. All of the comparisons were performed at a significance level of 0.05, corresponding to a 95% confidence level. SABs were compared on the basis of the mean count rates for the Cs-137, K-40 and uranium windows. K-40 was chosen as a proxy for spatial variability of background since it has the highest count rates of the three primordial radionuclide windows and since the relative proportions of the three primordial constituents are reasonably constant over the site. Cs-137 was chosen as the best indicator of plant-related residual radioactivity, and the uranium window was used as an indicator of the variability in airborne radon concentrations. Both the spatial variability of the background and the temporal variability of airborne radon affect the Cs-137 window.
To provide a basis for assessing the effect of the temporal variability in airborne radon concentrations, a comparison was made between the two sets of survey results for SAB B1-3. This area was surveyed on two different occasions 8 days apart to confirm that there was not any significant variability in the overall survey method. Comparisons of the results from the

Rancho Seco License Termination Plan Revision 1 Chapter 2, Site Characterization May 2008
Page 2-38
two surveys are summarized in Table 2-9 below. Comparisons were made for all energy windows of interest.
Table 2-9 Effect of Temporal Variability
First Scan (12/4/2000) Second Scan (12/12/2000) Energy Window Mean
(cps) Variance
(cps) Mean (cps)
Variance (cps) Difference δ (cps)
Cs-137 14.54 1.66 13.11 1.59 -9.8% 1.34 Cs-134 7.85 0.55 6.98 0.55 -11.1% 0.82 Co-60 6.68 0.39 5.75 0.36 -13.9% 0.89 K-40 4.43 0.27 4.36 0.29 -1.7% 0.03
Uranium 1.30 0.03 0.84 0.02 -35.6% 0.45 Thorium 1.51 0.03 1.46 0.04 -3.9% 0.04
Gross 79.29 45.35 71.15 47.48 -10.3% 7.68 In Table 2-9 above, each pair of mean values is statistically distinct. The delta value is the additional difference in the means that would have to be added before they became statistically indistinguishable from other SABs. Note that the data used in these comparisons (gross count rates) differ. The data used in the comparison of SAB means were only corrected for the effect of the survey platform and for efficiency (normalized to Detector 1). The only other correction applied was application of the IAEA stripping coefficients to the energy windows for the three primordial series. Comparison of the SAB means is not as sensitive a technique as the other data analysis methods used since the ability to discern differences in two data sets is affected by the variance of both sets. Data analyses that consider the SABs individually thus provide better sensitivity. Such evaluations are affected by only the variability within a single SAB, rather than the combined effects of the variability within two blocks plus that across them. It should also be noted that since the comparisons performed in this section utilize gross rather than net data, the delta values should not be compared directly with the net pCi/g values. The delta values are intended to be compared relative to one another.
Comparing the results between the two surveys for SAB B1-3 showed a significant decrease in the apparent uranium concentration. The fact that this decrease is not seen for the other primordial radionuclide windows (K-40 and Th-232) indicated that this difference was due to a difference in the airborne radon concentration between the two surveys. The first survey was performed between approximately 9:00 AM and 10:00 AM on December 4, 2000 and the second survey was performed between approximately 2:00 PM and 3:00 PM on December 12, 2000. The different times of day for the two surveys are therefore consistent with the diurnal variability of radon concentrations, although there could be other contributing factors (e.g., rainfall).
The results for the Cs-137, Cs-134, Co-60 and gross count windows all showed the effect of the lower apparent uranium concentration, with the magnitude of the effect decreasing with decreasing energy. The K-40 window did not show the effect of the reduced downscatter continuum between the two surveys because the energy region had the IAEA stripping coefficient applied. Thus, the Cs-137, Cs-134, and Co-60 windows were sensitive to diurnal variability in airborne radon concentrations where the K-40 window was not. The K-40 and Th-232 windows were therefore good indicators to use to check for systematic bias between the surveys. Comparing the result for these two windows for the two surveys showed no

Rancho Seco License Termination Plan Revision 1 Chapter 2, Site Characterization May 2008
Page 2-39
appreciable difference vis-à-vis that which would reasonably be expected for field measurements.
The results of the comparison between the two surveys performed for SAB B1-3 can be used as a reference when comparing results between different SABs that were surveyed at different times. However, the comparison of the survey results for SAB B1-3 show this effect was small relative to significant concentrations of Cs-137.
A second approach used to assess at what point a difference in mean concentrations (characterized by the delta value) becomes large enough to suggest the presence of non-background radioactivity was to compare survey results for SABs that are spatially close together that should not have been impacted substantially by temporal variability in airborne radon concentration. This approach provided an indication of the expected variability between means from the different SABs that was due to spatial variability in background. Comparisons were made for SABs D3-1, D3-2, and D3-3 since these areas were adjacent to one another and were surveyed in chronological order on the afternoon of December 10, 2000. These comparisons are summarized in Table 2-10 below.
Table 2-10 Effect of Spatial Variability
SAB D3-1 SAB D3-2 SAB D3-3 Mean Variance Mean Variance Mean Variance Energy
Window (cps) (cps) (cps) (cps) (cps) (cps)
Cs-137 13.36 0.42 13.04 0.42 14.55 1.06 K-40 5.49 0.14 5.55 0.12 5.66 0.37
Uranium 0.91 0.03 0.94 0.02 0.96 0.03 Delta value for Cs-137 D3-1 vs D3-2 = 0.28 cps Delta value for Cs-137 D3-2 vs D3-3 = 1.45 cps
Delta value for Cs-137 D3-1 vs D3-3 = 1.13 cps
The comparison of SABs D3-1, D3-2, and D3-3 provides an idea of the magnitude of the spatial variability of SAB means for the Cs-137 window independent of the effect of differences in airborne radon concentration. The variability was seen to be on the same order as that from radon variability, and thus was also a small effect relative to significant concentrations of Cs-137.
Having compared SABs for the purpose of assessing the magnitude of the effects of spatial and temporal variability of background, three pairs of SABs were then selected for comparison on the basis of their potential for having been affected by plant operations. SABs were selected to see if any of the following distinctions could be made using Cs-137 data:
• higher concentration in the prevailing wind direction than in the cross-wind direction,
• higher concentration closer to the plant than farther away (in line with the prevailing wind), or
• higher concentration in low-lying areas than in higher elevation areas.
The 2 SABs selected for the prevailing wind cross-wind comparison were D1-4 (prevailing wind) and A1-2 (cross-wind). The SABs chosen for close to the plant were E2-4 (near) and

Rancho Seco License Termination Plan Revision 1 Chapter 2, Site Characterization May 2008
Page 2-40
F1-5 (far), and those chosen for higher elevation versus lower were E2-1 (high) and C1-3 (low). The Cs-137 window for these six SABs were summarized in Table 2-11 below.
Table 2-11 Gross Activity Variability Due to Plant Operations
SAB Number Mean (cps) Variance (cps) D1-4 13.95 1.67 A1-2 17.34 1.09 E2-4 12.56 0.70 F1-5 13.23 0.94 E2-1 13.94 0.50 C1-3 13.38 1.94
The delta values for the Cs-137 window for each pair of SABs are provided in Table 2-12.
Table 2-12 Cs-137 Variability Due to Plant Operations
Comparison Cs-137 Delta Value (cps) D1-4 vs A1-2 3.31 E2-4 vs F1-5 0.60 E2-1 vs C1-3 0.48
The comparison for the near versus far and the high versus low areas clearly did not suggest any evidence of plant-related radioactivity. The delta value for the prevailing wind versus cross-wind was somewhat higher than those observed in the comparison of SABs for the effect of spatial or temporal variability independently, but was consistent with a combined effect from these two phenomena.
Based on the previously described evaluation of the SAB data, a determination was made that the survey area outside the Industrial Area was Non-Impacted.
2.4 Site Characterization Survey Methods
2.4.1 Organization and Responsibilities
The site Radiation Protection Technicians, under the direction of the Decommissioning Evaluations Group (DEG) Radiological Engineers, performed the site characterization. The Decommissioning Surveys Program is set forth under Rancho Seco Procedure RSAP-1901, “Decommissioning Surveys Program,” [Reference 2-26]. This procedure provides the organization responsibilities and along with the Decommissioning Survey Implementing Procedures (DISP) provides the processes to be used in conducting decommissioning surveys that lead to the termination of the NRC Operating License for the Rancho Seco facility. The Manager, Plant Closure and Decommissioning is responsible to ensure that the Decommissioning Survey Program is supported and implemented by all Rancho Seco employees. The Dismantlement Superintendent (Radiological) reports to the Manager, Plant Closure and Decommissioning and is responsible for ensuring that all decommissioning survey activities are performed by qualified personnel in accordance with approved procedures and implemented in coordination with, and support of, ongoing decommissioning activities. The Dismantlement Superintendent (Operations) supplies the craft to support the Decommissioning

Rancho Seco License Termination Plan Revision 1 Chapter 2, Site Characterization May 2008
Page 2-41
Survey effort and coordinates activities with the Dismantlement Superintendent (Radiological). Responsibilities for all RSNG employees and DEG staff are found in RSAP 1901.
2.4.2 Characterization Data Categories
One of the objectives of the characterization surveys was to be able to classify survey areas. As shown in Tables 5-4A-E in Section 5.2.2 of this LTP, areas have been designated as: 1) Non-Impacted if no residual radioactivity was found during characterization surveys, 2) Class 1 if residual radioactivity was greater than the DCGL or would likely be present based upon historical information, 3) Class 2 if residual radioactivity was present but less than the DCGL, and 4) Class 3 if residual radioactivity was not present or present at a small fraction of the DCGL.
2.4.3 Characterization Survey Design
The DEG Radiological Engineers designed the characterization surveys based on the Site Characterization Data Quality Objectives (DQOs) (see Section 2.4.6). Instrumentation used was similar to that which will be used during FSS with similar MDCs. Gas proportional detectors were used for most of the surface measurements and scans. The detectors have a Mylar™ window which is sensitive to the average beta energy emitted from the radionuclide mixture found in the various media. Additionally, volumetric samples of soil and concrete were also collected and counted using HPGe detectors with MDCs well below the DCGLs. Pipe detectors employing NaI and CsI detectors were used for buried and embedded pipe surveys since typically 95% or more of the nuclide fraction consisted of Cs-137 and Co-60. NaI detectors were used to perform scans and direct measurements of soil, asphalt and some concrete areas. These surveys were used to identify regions of potentially contaminated soil and surfaces.
Following shutdown of Rancho Seco a series of scoping surveys were performed to gather additional information on the radiological status of systems within the plant and other surveys were performed to quantify known areas of contamination outside the power block buildings in the tank farm, barrel farm, and adjacent to the retention basins. With this basis of information about the conditions of systems, structures and soil at Rancho Seco, and considering that Rancho Seco was self-performing decommissioning, the decision was made to forego an extensive characterization of the site prior to beginning dismantlement activities. With a baseline of information available to support the initial decisions for dispositioning systems, dismantlement commenced. The actual dispositioning of systems occurred on a case-by-case basis, with additional data collected when necessary during dismantlement activities to support dispositioning decision making. This method of real-time waste management has proven to be extremely cost-effective, much more so at Rancho Seco than if an extensive characterization effort had been undertaken prior to beginning dismantlement.
The decision was also made to begin the characterization effort to support the license termination process (remediation and eventually Final Status Survey) when areas were more accessible and could be directly surveyed (after system removal). Remediation and dismantlement tasks are scheduled and reviewed by DEG personnel. Current and past radiological conditions that could affect the dismantlement or remediation processes are examined. Additionally, the area physical conditions that have or could have been affected radiologically are examined. Instructions and survey objectives are provided for adequate documentation of the characterization surveys and performance of dismantlement activities. The process data quality objectives include but are not limited to, instructions that delineate the

Rancho Seco License Termination Plan Revision 1 Chapter 2, Site Characterization May 2008
Page 2-42
types of surveys, samples and action levels for the tasks, and instructions and guidance for the remediation or dismantlement activities.
2.4.4 Instrument Selection, Use and Minimum Detectable Concentrations (MDCs)
Instrumentation used for characterization surveys were the same type that will be used for FSS. Count times and scan rates were the same as those that will be used during FSS thus ensuring adequate MDCs. Table 2-13 lists the types of instruments that were used for characterization surveys along with the MDCs achieved. Table 2-14 provides the vendor laboratory minimum detectable activity (MDA) values.
Table 2-13 Typical On-Site Characterization Detection Sensitivities*
Instruments and
Detectors Radiation
Background Count Time
(minutes)
Back- ground (cpm)
Instrument Efficiency
Count Time
(minutes)
Static MDC **
Scan MDC
** Model 43-68 Alpha 10 1 0.074 5.0 26 N/A
Model 43-68 Beta-Gamma 1 300 0.146 1.0 454 1,082
Model 44-116 Beta 1 300 0.162 1.0 413 1,063
Model 43-90 Alpha 10 3 0.077 5.0 39 N/A Model 43-
116 Beta-
Gamma 1 200 0.099 1.0 1,262 5,547
Model 43-51 Beta-Gamma 1 37 0.071 1.0 1,395 4,734
Model 43-37 Beta-Gamma 1 1,200 0.138 1.0 204 635
Model 44-9 Beta-Gamma 1 36 0.215 1.0 926 2,719
Model 44-40-2
Beta-Gamma 1 27 0.204 1.0 858 2,481
Model 44-10 Gamma 1 8,000 N/A 0.02 N/A 5.2 pCi/g
Model SPA-3 Gamma 1 8,000 N/A 0.02 N/A 5.2
pCi/g
HPGe Gamma Up to 60 N/A 0.40 relative 10-60 0.05 pCi/g
volumetric
0.15-0.30 pCi/g vol.
Canberra Inspector
1000 Gamma Up to 60 N/A 0.085
relative 1-60 N/A N/A
Beckman Liquid
Scintillation Beta 30 & 60 40 dpm 0.40 30 & 60 800 pCi/L N/A
Tennelec Low Bkg Counter
Alpha Beta
10 10
0.1 1.0
0.35 0.48 1-10 11
16 N/A N/A

Rancho Seco License Termination Plan Revision 1 Chapter 2, Site Characterization May 2008
Page 2-43
Table 2-13 Typical On-Site Characterization Detection Sensitivities*
Instruments and
Detectors Radiation
Background Count Time
(minutes)
Back- ground (cpm)
Instrument Efficiency
Count Time
(minutes)
Static MDC **
Scan MDC
** Pipe Detectors:
Model 44-159 Gamma 1 677 0.024 1 5,200 N/A
Model 44-157 Gamma 1 6,300 0.224 1 1,445 N/A
Model 44-162 Gamma 1 16,000 0.568 1 1,041 N/A
Model 1062000 Gamma 1 1,250 0.050 1 3,321 N/A
Model 43-98 Beta-Gamma 1 290 0.160 1 284 N/A
Model 43-111
Beta-Gamma 1 100 0.151 1 266 N/A
Model 43-94 Beta-Gamma 1 44 0.227 1 248 N/A
*See Chapter 5, Table 5-12 footnotes for additional clarification of detection sensitivities. Efficiencies for the Model 43-68B, 43-116, 44-116, 44-9, 44-40-2, 43-51 and 43-37 are total efficiencies for concrete. Efficiencies for the 43-68A, and 43-90 are total efficiencies using the published εs value from ISO 7503-1.
** In dpm/100 cm2, unless otherwise noted.

Rancho Seco License Termination Plan Revision 1 Chapter 2, Site Characterization May 2008
Page 2-44
Table 2-14
Vendor Laboratory Standard MDA Values
Test Technique Method Solid (pCi/g)
Water (pCi/L)
Gamma radionuclides Gamma Spectroscopy LANL EM-9 0.1 10
Alpha Gas Flow Proportional EPA 900.0 4.0 5.0 Beta Gas Flow Proportional EPA 900.0 10.0 5.0 H-3 Liquid Scintillation EPA 906.0 Mod 6.0 700 C-14 Liquid Scintillation EPA EERF C 2.0 50.0 Fe-55 Liquid Scintillation DOE RESL Fe-1 5.0 100.0
Ni-59 Low Energy Gamma Spectroscopy DOE RESL Ni-1 10.0 20.0
Ni-63 Liquid Scintillation DOE RESL Ni-1 4.0 50.0 Sr-90 Gas Flow Proportional EPA905.0 Mod 2.0 2.0
Tc-99m Liquid Scintillation DOE EML HASL 300 5.0 50.0 Pm-147 Liquid Scintillation EPA EERF PM-1-1 10 10 Np-237 Alpha Spectroscopy DOE EML HASL 0.5 1.0
Pu-238-240 Alpha Spectroscopy DOE EML HASL 300 0.5 1.0 Pu-241 Liquid Scintillation DOE EML HASL 300 15.0 15.0
Am-241 & 243 Alpha Spectroscopy DOE EML HASL 300 0.5 1.0 Pu-242 Alpha Spectroscopy DOE EML HASL 300 0.5 1.0
Cm-242-246 Alpha Spectroscopy DOE EML HASL 300 0.5 1.0
2.4.5 Quality Assurance
Instrumentation used for characterization surveys was calibrated using NIST-traceable sources of energies similar to those emitted by the nuclide fractions for the various media surveyed. Trained and qualified personnel using approved site procedures performed portable instrument calibration. Instrumentation was source checked before and after survey measurements were made. The instrumentation engineer, prior to accepting the data for characterization, evaluated instruments not passing a source check. Laboratory instruments were calibrated following the approved site chemistry procedures. (The lab instruments are source checked daily when used and the instruments are used as part of the inter-laboratory comparison program.) A fraction of volumetric samples were collected as duplicates for quality control purposes.
2.4.6 Data Quality Objectives
Data Quality Objectives (DQOs) were implemented for Characterization surveys in a similar manner as anticipated for Final Status Surveys as discussed in Section 5.3.1. However, the goal of characterization is contamination quantification and delineation of the nuclide suite, whereas the FSS goal is comparison of data against the Null Hypothesis.
Characterization surveys were designed to gather the appropriate data using the DQO process as outlined in MARSSIM, Appendix D. The seven steps in the DQO development process are:
1) State the problem,

Rancho Seco License Termination Plan Revision 1 Chapter 2, Site Characterization May 2008
Page 2-45
2) Identify the decision,
3) Identify inputs to the decision,
4) Define the study boundaries,
5) Develop a decision rule,
6) Specify limits on decision errors, and
7) Optimize the design for obtaining data.
The DQOs for site characterization included identifying the types and quantities of media to collect. Since the scenario used for dose modeling was the Industrial Worker Building Occupancy scenario, sample collection was concentrated on structure materials and surrounding soils. Building concrete was sampled by obtaining cores and volumetric samples. Soils were also sampled volumetrically. Enough measurements (typically 10 to 30 measurements per area or proposed survey unit) were obtained to achieve statistically significant results so that the mean and maximum activity as well as the sample standard deviation could be determined. Direct measurements and scans of concrete were also made using the same instruments and MDCs as those that will be used for FSS. The highest activity samples of each type of media were sent for hard-to-detect radionuclide analysis. Samples were also collected from the interior surfaces of both buried and embedded piping. The highest activity pipe samples were analyzed for hard-to-detect radionuclides.
2.4.7 Survey Findings And Results
Survey categories consist of surfaces and structures, environs (soil, sub-slab soil, subsurface soils, sediments and groundwater), embedded and buried piping. Several areas of the site were specifically targeted for detailed sampling and surveys. The areas were either known or suspected to have been contaminated by plant operations. The remainder of the site received general sampling and surveys to determine whether structures or soils were contaminated and to what extent. Appendix 2-B illustrates the survey areas and locations described in Chapter 5, Tables 5A-E. The legend figures in Appendix 2-B provide information regarding survey types, samples and locations (see Figure 2-32).
2.4.7.1 Surfaces and Structures
Surfaces and structures include building interiors and exteriors of the associated structures and if applicable, the exterior surfaces of systems or components because these surfaces have the same potential for residual levels of radioactive material as the building surfaces in which they are located. It is anticipated that no major components or systems will remain.
• Over 26,000 beta scan and direct measurements have been taken in both Impacted and Non-Impacted areas.
• Over 180 concrete samples were acquired from structure surfaces. These include both concrete cores and scabbled media.
• Approximately 2000 of the beta scans and direct measurements have been acquired from structure pads and asphalt surfaces including roadways. These surfaces represent surfaces in the power block and from ancillary areas.
• Eighty-seven concrete scabble samples were collected from the Auxiliary Building of which three were submitted for off-site vendor laboratory analysis.

Rancho Seco License Termination Plan Revision 1 Chapter 2, Site Characterization May 2008
Page 2-46
• Twenty-six scabble samples have been collected from the Spent Fuel Pool (SFP) floor and walls.
• Eleven concrete cores were obtained through the entire thickness (five feet) of the SFP walls to evaluate both the interior surface of the fuel pool walls and to determine if contaminants had penetrated any significant distance into the wall of the SFP. There was no indication of contaminant penetration along the body of the cores. Penetration of contamination along metal embeds in an interior wall separating the fuel storage area from the Upender area was noted (where leakage through the SFP liner had occurred). This wall will be removed as part of SFP remediation.
• Nineteen cores were collected from the Containment Building. Emphasis was placed on examination of cracks and seams in concrete surfaces. Results of these cores prompted a comprehensive mapping of the cracks in the Containment –27′ elevation and the collection of approximately 15 more cores. Additional scabble samples were collected from containment walls at various locations. The results of the sampling provided strong evidence that contamination penetrated deeply into some cracks associated with the concrete structure. The results of the characterization contributed significantly to the decision to remove the concrete from the Containment structure down to the liner plate.
• Five core samples were acquired from different elevations of the Containment Building Reactor Bioshield. These samples provided the concrete activation assessment and showed concrete activation to a depth of 32-35 inches at the reactor core centerline (-2′6″ Elevation). In addition, rebar associated with this core was analyzed to provide the activation components associated with metal. Once the reactor vessel is removed the region directly beneath the reactor vessel will be sampled to determine the activation depth of the concrete and associated rebar beneath the liner plate that may require remediation. The region beneath the vessel comprises an area of approximately 10.5 m2. Additional information regarding activated concrete is provided in Section 2.5.1.2.
• Five concrete scabble samples were collected from the Turbine Building including the Condenser pit floor and walls.
With the exception of Bioshield concrete and rebar, samples submitted to the vendor laboratory were analyzed for the entire suite of 26 radionuclides. The radionuclide suite is presented in Table 6-1 of Chapter 6. The Bioshield Concrete and rebar acquired from the mid-core region (-2’6” Elevation) were analyzed for radionuclides expected to be found in activated media. These radionuclides include: H-3, C-14, Fe-55, Co-60, Ni-63, Cs-134, Eu-152, Eu-154 and Eu-155. Of the radionuclides listed in Chapter 6, Table 6-1 the following were not included in the analysis of activated concrete and rebar: Sr-90, Tc-99 Pm-147, Np-237, Pu-238 through Pu-242, Am-241 and Cm-244. The latter radionuclides are not concrete and rebar activation products but could be found on external surfaces of activated concrete and are addressed using the radionuclide mix for structures and surfaces provided in Section 2.5.1.
The results of this detailed sampling and analysis were reported in DTBD-05-015 “Rancho Seco Nuclear Generating Station Structure Nuclide Fraction and DCGLs,” [Reference 2-27] and formed the basis for the structure nuclide fraction and εs determination.

Rancho Seco License Termination Plan Revision 1 Chapter 2, Site Characterization May 2008
Page 2-47
2.4.7.2 Environs
Land areas were surveyed and sampled to detect the presence and extent of soil contamination. In 2000 and 2001 Shonka Research Associates, Inc. was contracted to survey Non-Industrial areas of the site. The results of these surveys were discussed in Section 2.3.1. In addition to those surveys the category includes:
• Over 3,000 gamma scan and direct measurements acquired in impacted and non-impacted areas.
• Over 600 soil samples collected, a majority of these in support of remediation and characterization. Table 2-15 below presents a range of concentrations observed relative to general site locations. Figures 2-8 to 2-13 present locations where soil samples have been collected. Sediment samples from the effluent outfall region are provided in Table 2-3 of Section 2.1.5.7.2 and their locations are noted in Figure 2-11.
The concentrations provided in Table 2-15 present gross concentrations in pCi/g observed using onsite gamma spectroscopy. The onsite soil gamma-emitting nuclide mixture consists primarily of Cs-137, Cs-134 and Co-60 of which the averaged Cs-137 concentration is greater than 90 percent of the mixture. The results of the detailed soil sampling and analysis were reported in DTBD-05-014, “RSNGS Surface Soil Nuclide Fractions and DCGL” [Reference 2-28] and formed the basis for the soil nuclide fractions. The sample locations in Table 2-15 where vendor laboratory analysis was performed were reported in DTBD-05-014 and are also presented in Section 2.5.5, Table 2-25 of this chapter.
Table 2-15 Specific Soil Contamination Investigation Locations
Location Concentration (pCi/g)
Vendor Lab Analysis
Spent Fuel Cooler Pad 5-1100 Yes Tank Farm 18-120 Yes Spent Fuel Pool Diesel Generator Room Gap 50-1200 Yes
Plant Effluent Water Course <1.0-23 Yes RHUT Tank Area 20-100 No Old Bechtel Bldg pad <0.5 No Locations outside the power block <1.0 No
Groundwater analysis results from the site monitoring wells were provided in Section 2.2.4.2.2.
2.4.7.3 Buried and Embedded Piping
Buried and embedded piping was classified as Impacted or Non-Impacted based on knowledge of the system (process knowledge), collection and analysis of samples and direct measurements on the accessible interior of piping expected to remain.
• Eighteen samples from the interior of Turbine Building embedded drain piping and sumps were collected. Five samples of RHUT piping were collected. The samples

Rancho Seco License Termination Plan Revision 1 Chapter 2, Site Characterization May 2008
Page 2-48
represent the Turbine drain system and RHUT piping. Two sample composites representing the highest contamination levels were submitted for vendor analysis.
• Nineteen samples from the interiors of Auxiliary Building drain piping were collected. Several samples each were collected from the Auxiliary Building drain piping representing the Acid Drain System, Radwaste Drain System and the East and West Decay Heat Pump Room Sumps. These four systems comprise the embedded piping systems in the Auxiliary Building.
• Thirteen samples were collected from embedded piping associated with the SFP. These samples well represent all piping associated with Spent Fuel Building systems.
• Four samples were collected from the Containment Building drains and systems. The reactor building drains represent a very small fraction of the total embedded piping. The bulk of the Containment Building piping will be removed when concrete is removed to the liner plate.
A majority of RHUT piping adjacent to the RHUT tanks has been removed as part of site remediation. Results of the sample analysis for buried and embedded piping were used to establish buried and embedded piping nuclide fractions as reported in DTBD-05-009 “Embedded Piping Scenario and DCGL Determination Basis” [Reference 2-29].
2.5 Summary of Initial Characterization Survey (ICS) Results
2.5.1 Impacted Structures and Surfaces
The mean direct beta contamination values as measured by gas flow proportional detectors for the Reactor, Auxiliary, Fuel and Turbine Buildings are provided below.
Reactor Building
• -27’ Elevation 1.50E+06 dpm/100 cm2
• Grade Level 2.00E+05 dpm/100 cm2
• +40’ Elevation 5.10E+04 dpm/100 cm2
• +60’ Elevation 2.00E+04 dpm/100 cm2
Auxiliary Building
• -47’ Elevation 3.20E+05 dpm/100 cm2
• -29’ Elevation 5.40E+05 dpm/100 cm2
• -20’ Elevation 2.50E+05 dpm/100 cm2
• Grade Level 3.70E+05 dpm/100 cm2
• +20’ Elevation 8.50E+04 dpm/100 cm2
• +40’ Elevation 3.30E+03 dpm/100 cm2
Fuel Building
• Spent Fuel Pool Floor 1.70E+07 dpm/100 cm2

Rancho Seco License Termination Plan Revision 1 Chapter 2, Site Characterization May 2008
Page 2-49
• +40’ Elevation 5.90E+03 dpm/100 cm2
Turbine Building
• -7’ Elevation 3.10E+03 dpm/100 cm2
• Grade Level 2.30E+03 dpm/100 cm2
• Mezzanine 1.60E+03 dpm/100 cm2
• +40’ Elevation 2.8E0+03 dpm/100 cm2
The mean, maximum and standard deviation of surface activity for each of the structures are provided in Tables 5-4A through 5-4E in Chapter 5 of this LTP.
Additionally, seventy-five volumetric samples representing contaminated structure surfaces were examined and used to identify the radionuclide constituents and to determine the gross beta DCGL for structures. Eight of these samples were submitted for radionuclide analysis by a vendor laboratory. The samples were analyzed for the radionuclide suite presented in Chapter 6, Table 6-1. The eight samples represent the highest activity samples available from each principal building (Turbine, Fuel, Auxiliary and Reactor Buildings) and subsequently the greatest chance of establishing the ratios of the hard to detect radionuclides including the TRU’s that are usually present at very low levels in comparison to the site’s principal and easily detected nuclides, Co-60 and Cs-137. DTBD-05-015, “Rancho Seco Nuclear Generating Station Structure Nuclide Fraction and DCGLs,” [Reference 2-26] describes the process for examination of the samples submitted for vendor analysis and the determination of the nuclide fraction for site structures. The following hard to detect radionuclides were reported as positive results by the vendor laboratory: H-3, C-14, Fe-55, Ni-59, Ni-63, Sr-90, Tc-99, Pu-238, Pu-239, Pu-240, Pu-241 and Am-241. Of these radionuclides, H-3, C-14, Fe-55, Ni-59, Ni-63 and Tc-99 were removed from the mixture based on their small dose contribution to the building occupant. Hard to detect analyses of concrete samples showed that the nuclide fraction was dominated by Cs-137 and Co-60 (90% or more of the individual sample nuclide fractions) with the remainder being the hard to detect radionuclides. The concrete nuclide fractions for the site structures other than “special areas” is shown in Table 2-16 below.
Table 2-16 Concrete Structure Nuclide Fraction
Radionuclide Fraction Co-60 2.07E-2 Sr-90 8.35E-2
Cs-134 3.29E-4 Cs-137 8.39E-1 Pu-238 1.17E-3 Pu-239 3.73E-4 Pu-240 3.73E-4 Pu-241 5.33E-2 Am-241 1.05E-3

Rancho Seco License Termination Plan Revision 1 Chapter 2, Site Characterization May 2008
Page 2-50
The gross beta DCGL for surfaces and structures is 4.30E+04 dpm/100 cm2. The basis for this value is presented in DTBD-05-015. Figures 2-14 to 2-21 present the locations of 75 volumetric concrete samples that were used to determine and support the nuclide fractions, εs determination and DCGLww for concrete structures.
Site structures determined to have levels of residual radioactivity below the DCGLs are provided in Table 2-17 below.
Table 2-17 Site Structures Below the DCGL
Interior Surfaces (dpm/100 cm2)
Exterior Surfaces (dpm/100 cm2)
Survey Area ID Survey Area Mean
Direct β Maximum Direct β
Mean Direct β
Maximum Direct β
501001 Receiving Warehouse 1.73E+03 2.39E+03 1.21E+03 1.36E+03 501002 Hazmat Warehouse 1.93E+03 2.64E+03 1.47E+03 1.83E+03 804001 PAP Building 2.01E+03 3.15E+03 2.14E+03 2.78E+03 805001 Admin. Building 1.90E+03 2.73E+03 2.02E+03 4.39E+03 806001 E/W Spray Ponds N/A N/A 3.06E+03 3.58E+03 808001 E/W Cool TWR Basins N/A N/A 4.95E+03 6.29E+03 809001 Sewer Plant 1.89E+03 2.17E+03 1.90E+03 2.17E+03 812000 Spent Fuel Building +40′ 5.94E+03 1.94E+04 N/A N/A 812000 Spent Fuel Building
Exterior N/A N/A 1.94E+03 5.00E+03
812000 Spent Fuel Building Roof N/A N/A 1.73E+03 2.23E+03 813000 Auxiliary Building +40′ 3.288E+03 2.78E+04 N/A N/A 813000 Auxiliary Building Roof N/A N/A 1.98E+03 2.25E+03 813000 Auxiliary Building
Exterior N/A N/A 1.90E+03 2.99E+03
814000 T & R Building 1.68E+03 2.53E+03 1.87E+03 3.00E+03 815000 Nucl Svc Elect Bldg. 1.64E+03 2.13E=03 1.91E+03 2.67E+03 816000 Cent Alarm Stn Bldg. 2.07E+03 3.33E+03 2.33E+03 2.79E+03 817000 TDI Diesel Gen Bldg. 2.34E+03 4.07E+03 1.86E+03 2.26E+03 821000 Water Treatment Bldg. 2.34E+03 2.90E+03 2.97E+03 3.82E+03 822000 Chlorine Bldg. 8.28E+02 1.72E+03 1.52E+03 3.83E+03 823000 Intake Pump Structure 2.60E+02 1.38E+03 N/A N/A 824000 PCW Intake N/A N/A 3.94E+03 5.18E+03 826000 Turbine Building Grade 2.31E+03 6.99E+03 N/A N/A 826000 Turbine Building Mezz 1.57E+03 2.63E+03 N/A N/A 826000 Turbine Building +40′ 2.84E+03 3.62E+03. 1.98E+03 1.03E+04 831000 Microwave Bldg. 1.57E+03 6.34E+03 2.88E+03 1.32E+04 833000 Warehouse B 6.35E+02 3.72E+03 3.75E+03 3.48E+04 840000 Warehouse A 1.94E+03 3.4E+03 2.31E+03 3.84E+03 842000 Warehouse C 2.21E+03 2.47E+03 N/A N/A 851000 Switchyard Control Bldg. 1.66E+03 2.38E+03 1.40E+03 1.84E+03 852000 Machine Shop 1.97E+03 2.41E+03 2.09E+03 2.62E+03 856000 Secondary Alarm Station 3.00E+02 2.64E+02 2.93E+02 9.2E+03

Rancho Seco License Termination Plan Revision 1 Chapter 2, Site Characterization May 2008
Page 2-51
2.5.1.1 Special Areas
Special Areas are defined as areas of the site that have significantly different nuclide ratios, which require separate DCGLs. Examination of the nuclide fractions associated with the Reactor, Auxiliary, Turbine and Fuel Buildings revealed several areas where Co-60 dominated the radionuclide mixture and resulted in a DCGL of 1.61E+04 dpm/100 cm2 based primarily on the predominate Co-60 ratio. DTBD-05-015 presents the technical approach used to determine the Co-60 dominant areas and the associated nuclide fraction to be applied. The locations are provided in Table 2-18. To define Special Area boundaries for FSS additional samples for known or suspect areas will be collected and the results used to define other Special Areas as FSS progresses. The evaluation methodology may also include the use of in-situ gamma spectroscopy systems. The findings including the Special Area boundaries will be documented in each survey package. Sample locations 10, 14-16, 18, 26 and 28 depict the Special Area sample locations described in Table 2-18. The identified Special Areas consist of four survey areas; the East Decay Heat Cooler Room, Seal Return Cooler Room, Crud Tank Pump Room and the Miscellaneous Waste Filter Room.
Table 2-18 Special Area Locations
Sample Code
Location Description
Co-60 Nuclide Fraction*
Cs-137 Nuclide Fraction*
SB8130690 SC03A
East Decay Heat Cooler Room (10) 0.806 0.195
SB8130640 SC02A
Seal Return Cooler Room (14) 0.881 0.119
SB8130660 SC02 Crud Tank Room (15) 0.868 0.132
SB8130670 SC01
Crud Tank Pump Room (16) 0.866 0.134
SB8130670 SC02
Crud Tank Pump Room (18) 0.775 0.226
SB8130350 SC02
Miscellaneous Waste Filter Room (26) 0.788 0.212
SB8130350 SC04
Miscellaneous Waste Filter Room (28) 0.794 0.206
*Co-60 and Cs-137 nuclide fractions have been normalized, see DTBD-05-015. **The numbers in parenthesis are the sample locations found in Figure 2-14.
2.5.1.2 Activated Concrete
Analysis of all the concrete cores and scabble samples collected in the Containment Building showed that only those cores acquired from the Reactor Bioshield have regions where the observed radionuclides were activation products found in concrete (e.g. Eu-152, Eu-154 and Eu-155). Although containment concrete will be removed down to the Containment Building liner plate it is prudent to document the general characterization results of activated concrete at Rancho Seco. Six cores were collected from the Bioshield. The cores were collected from different elevations and locations. The core locations were:

Rancho Seco License Termination Plan Revision 1 Chapter 2, Site Characterization May 2008
Page 2-52
• +5′ Elevation on the east side of the Bioshield and was at the top of the reactor core,
• -2′ 5″ Elevation on the east side of the Bioshield. This location was at the mid-core level of the reactor vessel,
• -2′ 6″ Elevation on the south side of the Bioshield. This location was at the mid-core level of the reactor vessel,
• -10′ Elevation on the east side of the Bioshield and was at the bottom of the reactor core,
• -15′ Elevation on the east side of the Bioshield and just above the reactor pedestal base, and
• -19′ elevation on the south side of the Bioshield. This location was below the pedestal base and into the open area of the base beneath the reactor vessel.
Each core was carefully surveyed over its length. The measurement results at two-inch intervals were noted and used to plot the general activation profile of the interior of the Bioshield. The core from the -2′ 6″ elevation was not included because the activation depth is essentially the same as that noted for the -2′ 5″ elevation. Figure 2-22 presents the activated core locations that were used to characterize activated concrete at Rancho Seco. Figure 2-23 illustrates the activation depth associated with each core at the respective elevations.
Figure 2-24 plots the Eu-152 concentration for the -2′ 5″ elevation mid-core region illustrating that the mid-core activation depth was 32 to 35 inches. The observed depth of activation for Bioshield concrete was consistent with the activation depth observed at two other nuclear plants of similar capacity that have recently undergone decommissioning.
Table 2-19 presents the activated nuclide fractions results following vendor laboratory analysis for the -2′ 6″ elevation. The sample represents concrete acquired from the initial 2-inch interior face of the Bioshield and rebar acquired at a six-inch depth from the same core. With the exception of Eu-155, only radionuclides that resulted in positive values were noted. The concentrations in Table 2-19 reflect the collection date of November 25, 2003.
Table 2-19 Activated Nuclide Fractions For Bioshield Concrete and Rebar
Rx Bioshield Core -2′ 6″ El. 11/25/03
Rx Bioshield Core Rebar -2′ 6″ El. 11/25/03
Nuclide Concentration (pCi/g)
Nuclide Fraction
Concentration (pCi/g)
Nuclide Fraction
H-3 1.780E+04 5.332E-01 -- -- C-14 2.840E+01 8.508E-04 3.900E+01 2.450E-04 Fe-55 2.090E+03 6.261E-02 1.150E+05 7.223E-01 Co-60 3.370E+03 1.010E-01 4.180E+04 2.625E-01 Ni-63 2.030E+02 6.081E-03 2.270E+03 1.426E-02
Eu-152 9.210E+03 2.759E-01 3.280E+01 2.060E-04 Eu-154 6.720E+02 2.013E-02 3.460E+01 2.173E-04 Eu-155 <8.200E+00 <2.456E-04 <3.170E+01 <1.991E-04
Totals 3.338E+04 1.000E+00 1.592E+05 1.000E+00

Rancho Seco License Termination Plan Revision 1 Chapter 2, Site Characterization May 2008
Page 2-53
The only region of the Containment that is anticipated to contain activated concrete and rebar following removal of concrete down to the Containment liner plate is the area directly beneath the Reactor Vessel. This region is approximately 3.7 meters in diameter and represents a 10.5 m2 area on the –27′ elevation. The region is illustrated in Figure 2-22. Once the Reactor Vessel is removed this region will be examined as part of on going site characterization. The DCGL for any activated concrete and rebar in this area will be determined using the Bulk Material Single Nuclide DCGLs found in Table 6-10 in Chapter 6 of this LTP.
Selected areas of the Containment liner plate and underlying concrete that remain following concrete remediation may be examined by direct analysis using in-situ gamma spectroscopy and as necessary, physical sampling to insure that no significant activation of concrete or liner material above the activated concrete and metal DCGL remains. This examination would focus on areas where the neutron fluence would have been highest given conditions for “line-of-sight” regions and other mechanisms or structural conditions (pipe penetrations) where neutron activation could have occurred. The findings would be documented as part of continued site characterization.
2.5.2 Non-Impacted Structures and Surfaces
Based both on the HSA and survey measurements performed on the structures outside of the radiologically Restricted Area no Industrial Area structures have been classified as Non-Impacted.
2.5.3 Impacted Plant Systems
All plant systems that were impacted with the exception of buried and embedded piping, have or will be removed prior to FSS. Section 2.1.5.6.1 provides a list of secondary plant systems dismantled in the power block. Sections 3.2.2, 3.2.3 and 3.3 of this LTP discuss system and large component removal. No impacted systems are anticipated to remain in the Containment, Fuel, Turbine or Auxiliary Buildings. Embedded and Buried piping systems are noted in Sections 2.5.3.1 and 2.5.3.2 below. The principle gamma emitters used for both buried and embedded piping are Co-60 and Cs-137 with nuclide fractions of 0.161 and 0.802 respectively. Figures 2-25 to 2-30 show the major embedded piping systems and sample collection locations.
2.5.3.1 Embedded Piping
Table 2-20 shows the nuclide fractions for embedded piping. The embedded drain piping was contaminated internally to levels of 1.00E+05 dpm/100 cm2 in the Turbine Building and 2.11E+08 dpm/100 cm2 in the Auxiliary Building. The exposure pathway for embedded piping is direct gamma exposure. The radionuclides provided in Table 2-20 depict the nuclide fractions derived in DTBD-05-009; “Embedded Piping Scenario and DCGL Determination Basis,” [Reference 2-29] however, only the Co-60 and Cs-137 fractions impacted the dose model for piping. The technical basis for embedded piping is found in DTBD-05-009. The DCGL for embedded piping is 1.00E+05 dpm/100 cm2.

Rancho Seco License Termination Plan Revision 1 Chapter 2, Site Characterization May 2008
Page 2-54
Table 2-20 Embedded Pipe Gamma-Emitting Nuclide Fractions
Radionuclide Nuclide Fraction Co-60 1.61E-01 Nb-94 4.96E-03
Ag-108m 1.49E-02 Sb-125 6.09E-03 Cs-134 6.45E-04 Cs-137 8.02E-01 Eu-154 3.94E-03 Eu-155 5.90E-03
A decision has been made to grout embedded and buried piping that is greater than 2.5 inches in diameter when the residual activity exceeds the NRC Screening Levels as presented in Table 5.19 of NUREG-5512 Volume 3, “Residual Radioactivity Contamination From Decommissioning Parameter Analysis” [Reference 2-30] for a Pcrit of 0.90. An evaluation of the piping sample radionuclides resulted in a Grouting Level of 2.10E+04 dpm/100 cm2. Grouting piping that is less than or equal to 2.5 inches in diameter results in a reduction of only 1.0 percent of the annual dose limit (See DTBD-05-009 and DTBD-05-013 for additional information). Grouting piping that exceeds the grouting level is evaluated on a case by case basis depending on the level and extent of the activity and the piping diameter.
The grouting conditions are: • >30% of the residual activity is >21,000 dpm/100 cm2
• The residual activity is plant derived
• The cost is ALARA
• For Pipe >15 inches in diameter just the ends of the piping may be grouted.
Two systems associated with the Spent Fuel Pool piping were noted to contain concentrations of Co-60 that were much higher than the averaged fractions. These locations included the 16 inch Decay Heat piping which passed through the North SFP wall (~five linear feet) and the 2.5 inch SFP Nozzle Return piping (~181.0 linear feet). The grout level for these two locations will be based on their respective values of 7.60E+03 and 8.80E+03 dpm/100 cm2 as provided in DTBD-05-009. Characterization results for embedded piping systems are presented in Table 2-21.

Rancho Seco License Termination Plan Revision 1 Chapter 2, Site Characterization May 2008
Page 2-55
Table 2-21 Embedded Piping Systems
Interior dpm/100cm2 Survey Area I.D. Survey Area
Mean Maximum 899007 Turbine Clean Drain System Piping 5.62E+04 6.80E+05 899042 Radwaste System Piping 4.97E+07 2.11E+08 899044 Spent Fuel Pool Cooling System Piping 5.19E+06 1.65E+07 899052 Acid Waste System Piping 2.45E+06 7.46E+07 899011 Containment Emergency Sump 18” lines See below*
*Physical samples acquired from the sump lines resulted in the system being classified as a Class 1 survey unit. Due to the high levels of loose contamination present a decision was made to forgo internal surveys until the loose contamination levels were reduced
Figure 2-25 to 2-30 illustrate the drain systems noted in Table 2-21 as well as the sample locations used to determine the nuclide fractions and DCGL for embedded piping.
2.5.3.2 Buried Piping
The nuclide fractions for buried piping are presented in Table 2-22. The DCGL for buried piping is 1.00E+05 dpm/100 cm2. The DCGL for buried piping results in a soil concentration that is below the surface soil DCGL as discussed in Section 2.5.5 of this LTP. The principal pathway for buried piping is direct exposure. The scenario and calculations are provided in DTBD-05-013, “Buried Piping Scenario and DCGL Determination Basis,” [Reference 2-31].
Table 2-22 Buried Piping Nuclide Fractions and Ratio To Cs-137
Radionuclide Nuclide Fraction Ratio to Cs-137 C-14 3.47E-03 2.78E-02 N-63 8.52E-01 6.83E+00 Co-60 1.82E-02 1.46E-01 Cs-137 1.25E-01 1.00E+00 Eu-152 9.40E-04 7.54E-03 Pu-238 4.74E-04 3.80E-03 Pu-239 1.46E-04 1.17E-03 Pu-240 1.46E-04 1.17E-03 Am-241 2.10E-04 1.68E-03 Pu-242 2.48E-04 1.99E-03
As stated in Section 2.5.3.1 the principle gamma-emitting radionuclides in all piping systems at Rancho Seco are Co-60 and Cs-137. Their normalized nuclide fractions in all piping are 0.167 and 0.833. Table 2-23 presents characterization results for buried piping systems. The Polisher Sump sample results were also used to characterize buried piping.

Rancho Seco License Termination Plan Revision 1 Chapter 2, Site Characterization May 2008
Page 2-56
Table 2-23 Buried Piping Systems
Interior dpm/100 cm2 Survey Area I. D. Survey Area
Mean Maximum 899002 Auxiliary Feedwater System 3.68E+02 6.34E+02 899005 Clean Drain System, Storm Drain Non-Discharge 1.96E+02 3.80E+02 899006 Component Cooling Water System Piping 7.80E+02 1.05E+04 899009 Clean Drain System, Storm Drain Liquid Discharge 2.59E+03 3.16E+03 899011 Decay Heat System Piping 4.80E+05 3.41E+06 899028 Main Condenser Makeup 5.94E+02 3.54E+03 899029 Main Circulation Water System Piping 4.75E+02 6.14E+02 899032 Nitrogen Gas System Piping 1.91E+04 3.32E+04 899043 Service Air System Piping -5.00E+00 1.74E+03 899047 Service Water System Piping 1.87E+02 2.70E+03 899050 Waste Gas System Piping 5.28E+02 3.67E+03 899051 Carbon Dioxide System Piping 8.59E+03 2.37E+04
2.5.4 Non-Impacted Plant Systems
Table 2-24 also shows the Non-Impacted systems. Those include the Diesel Fuel Oil System, the Fire Protection Systems, the Nuclear Service Raw Water System, Site Reservoir System and the Instrument Air System,. No residual activity was detected in the sewage system and it too was classified as Non-Impacted.
Table 2-24 Non-Impacted Systems
Internal dpm/100 cm2 Survey Area I.D. Survey Area
Mean Maximum 899008 Clean Drain System Piping, Sewer 6.00E+00 1.00E+01 899010 Diesel Fuel Oil System -8.89E+03 1.86E+02 899017 Fire Protection Water System Piping 3.50E+01 1.15E+03 899025 Instrument Air System Piping -5.37E+03 1.52E+03 899034 Nuclear Service Raw Water System Piping 2.80E+01 4.13E+02 899045 Site Reservoir System 6.00E+00 4.41E+02
2.5.5 Environs Impacted and Non-Impacted
Impacted soil regions are listed in Table 5-4A in Chapter 5 of this LTP and include the mean and maximum soil concentrations for Cs-137. Table 2-25 provides additional characterization information that includes the Plant Effluent Water Course with a maximum Cs-137 activity of 48.2 pCi/g observed in 2002. Tank Farm soil with a maximum concentration of 149 pCi/g Cs-137 and RHUT piping areas A, B, and C with up to 31.1 pCi/g Cs-137. Additional radionuclide concentrations are noted in Table 2-25 for the Spent Fuel Pool Cooler Pad, Spent Fuel Building and North Diesel Generator Room gap, the Effluent Water Course, and the Tank Farm. Figures 2-8 to 2-11 and Figure 2-31 present the sample locations for the soil samples listed in Table 2-25.

Rancho Seco License Termination Plan Revision 1 Chapter 2, Site Characterization May 2008
Page 2-57
Table 2-25 Impacted Soil Area Characterization Results*
Soil Activity (pCi/g) Survey Area I.D. Survey Area
Co-60 Cs-137 SC1000040
DS01A Plant Effluent Water Course <2.60E-01 1.9E+01
SA8100000 DS01A Tank Farm 1.30E+00 9.67E+01
SA810000 DS02A Tank Farm 3.55E+00 8.30E+00
SC8100010 DS08A1 Spent Fuel Pool Cooler Pad 6.41E+00 9.41E+02
SA8260150 DS20A
Spent Fuel Pool Building/Diesel Generator Room Gap 2.95E-01 6.69E+02
SC8120070 DS01A1
Subsoil Beneath Spent Fuel Building Footprint <2.48E-02 1.04E+00
*Based on Vendor Laboratory Results, (decayed to 7/1/08)
DTBD-05-014 “RSNGS Surface Soil Nuclide Fractions and DCGL”, provides the methodology used to establish the soil DCGL for the Rancho Seco site. The Cs-137 surrogate DCGL is 51.2 pCi/g. The soil nuclide fraction, including the hard-to-detect radionuclides, is provided in Table 2-26. This nuclide fraction applies to all site soils.
Table 2-26 Soil Nuclide Fractions
Radionuclide Nuclide Fractions C-14 2.86E-02
Co-60 6.55E-03 Ni-63 1.70E-01 Sr-90 1.37E-02
Cs-134 1.87E-03 Cs-137 7.80E-01
Soil remediation activities were performed for the Spent Fuel Cooler Pad region and were concurrent with removal of buried piping in the same region. Soil was remediated in isolated locations to a depth of 2.5 meters. The most significant concentrations were found at the soil surface and in all cases decreased with soil depth. Following soil remediation and prior to filling the excavated area, soil samples were collected in the attendance of an NRC representative. The samples were analyzed on site and custody of the samples was then provided the to NRC representative. The samples were shipped to the Oak Ridge Institute for Science and Education (ORISE) where confirmatory analysis was performed. Table 2-27 provides the comparison results of the sample analysis from the NRC Inspection Letter [Reference 2-32]. The sample locations noted in Table 2-27 are presented in Figure 2-8.
The results of both analyses show that the residual concentrations of Cs-137 and Co-60 were well below the DCGL proposed at the time of sampling and the DCGL provided in this LTP.

Rancho Seco License Termination Plan Revision 1 Chapter 2, Site Characterization May 2008
Page 2-58
Table 2-27 Spent Fuel Cooler Pad Residual Soil Concentrations
Comparison To NRC/ORISE Results
Licensee’s Sample Results (pCi/g)
ORISE Sample Results (pCi/g) Grid
Location Cs-137 Co-60 Cs-137 Co-60
B-5 3.19 ± 0.27 0.14 ± 0.05 4.45 ± 0.23 0.12 ± 0.03 C-1 0.24 ±0.07 ND* 0.23 ± 0.03 0.01 ± 0.02
E-4/F-4 2.21 ± 0.20 ND* 2.47 ± 0.13 0.07 ± 0.02 J-1 0.07 ± 0.03 ND* 0.05 ± 0.02 0.00 ± 0.02
L-5/M-5 0.24 ± 0.05 ND* 0.32 ± 0.04 0.03 ± 0.02 *ND: Not Detected
Sample results for the site soil principle radionuclides (Co-60 and Cs-137) from the soils beneath the Spent Fuel Pool are found in Table 2-28. Figure 2-31 presents the locations from which the samples in Table 2-28 were acquired. Sample locations for Spent Fuel Pool subsoil that were submitted for vendor laboratory analysis are shown in Figure 2-31.
On October 27 and October 28, 2004 an NRC representative observed site characterization sampling beneath the spent fuel pool floor. Thirteen of 15 planned borings through the concrete in the spent fuel pool floor had been completed. In each hole, split spoon samples were taken at the concrete/soil interface and at one-meter intervals down to a depth of 7 meters below the surface of the spent fuel pool floor. Samples were collected from the same ground stratum regardless of the variations in spent fuel pool floor thickness. Soil samples from the first four borings were split with the NRC. All four samples were extracted from the first meter of soil below the spent fuel pool floor. Preliminary analysis results by on site gamma spectroscopy analysis indicated no radioactivity levels above background. The NRC’s portion of the split samples was sent to ORISE. ORISE analyzed the samples for C-14 and H-3 using the liquid scintillation method and for Co-60 and Cs-137 using gamma spectroscopy.
Table 2-28 ORISE Analysis Results For Spent Fuel Pool Soil
Radionuclide Average MDC (pCi/g)
Average Results (pCi/g)
DCGL1 pCi/g
H-3 5.60E+00 3.39E+01 1.04E+06 C-14 3.20E+00 7.55E+00 1.94E+05
Co-60 3.00E-02 1.75 E-02 1.22E+01 Cs-137 2.00E-02 2.75E-01 5.42E+01
1DCGL values proposed at the time the samples were collected
The analyses indicated the observed averaged Co-60 concentrations were below the MDC and all other radionuclides were below the DCGL proposed at the time of sampling and the DCGL provided in this LTP [Reference 2-33].
Other soil and miscellaneous pavement areas are noted in Table 5-4C in Chapter 5 of this LTP. Figures 2-34, and 2-44 through 2-65 of Appendix 2-B illustrate the location of direct

Rancho Seco License Termination Plan Revision 1 Chapter 2, Site Characterization May 2008
Page 2-59
measurements and soil samples collected in these areas. Non-impacted soil areas were designated in Table 5-4A in Chapter 5.
2.5.6 Ventilation Ducts and Drains
Ventilation duct work and system components were removed. Remaining system drain piping was surveyed and the results are reported in Table 5-2E in Chapter 5.
2.5.7 Paved Areas
Paved areas within the Industrial Area were surveyed using gas-flow proportional detectors. Surveys resulted in a mean of 870 dpm/100 cm2 and a maximum of 1,944 dpm/100 cm2 except for the Turbine North Laydown Area which, following an instrument alarm investigation resulted in the discovery of a small area of contamination ranging to 43 pCi/g. Paved access roads and connecting parking lots were also surveyed in a similar manner since they were the transport routes for radioactive material entering and leaving the site. Table 5-4C in Chapter 5 presents the classification results for paved areas. The sample and survey locations in paved areas are found in Appendix 2-B Figures.
2.5.8 Components
Contaminated components have been removed. The results for buried and embedded pipe are shown in Table 5-4E in Chapter 5 and previously discussed in Sections 2.5.3.1 and 2.5.3.2. Any non-pipe Components remaining after dismantlement will be surveyed to “unconditional release” limits.
2.5.9 Surface and Groundwater
The results of the water sampling were reported in the Hydrogeological Report and discussed in Section 2.2.4.2.2. Water samples continue to be collected from Rancho Seco Lake that is 1.3 miles southeast of the Rancho Seco Site (up gradient). The surface water results are included in the Annual Environmental Report.
2.5.10 Background
There have been several site studies undertaken over the years that provide soil data from which to determine residual global fallout activity. The first report of soil activity was made in 1984 in NUREG/CR-4286, which cited Cs-137 values in soil within 4 to 10 miles of Rancho Seco as having a mean value of 0.41 pCi/g. In 1986, Lawrence Livermore Lab reported the results of a soil sampling study in which the mean value was 0.665 pCi/g. In 2001, Shonka conducted a detailed study of the soil inside and outside the Industrial Area which showed a mean value of 0.312 + 0.131 pCi/g for undisturbed soil (viz., the grassland outside the Industrial Area) and 0.037 + 0.014 pCi/g for the disturbed soil within or adjacent to the Industrial Area. Shonka also reported the result of 58 in situ gamma spectroscopy measurements as <0.37 + 0.03 pCi/g for the undisturbed soils.
Adjusting the reported data for radioactive decay to 2008 results in current background values of 0.236 pCi/g for the NUREG/CR-4286 data and 0.408 pCi/g for the LLNL data. Both of these values bound the 2001 Shonka data for undisturbed soils.

Rancho Seco License Termination Plan Revision 1 Chapter 2, Site Characterization May 2008
Page 2-60
Soil samples collected and analyzed during site characterization within or adjacent to the Industrial Area (disturbed soil) showed a mean Cs-137 activity of 0.06 + 0.04 pCi/g.
For purposes of decommissioning, background Cs-137 activities in soil should be considered to be 0.312 + 0.131 pCi/g for undisturbed soil and 0.06 + 0.04 pCi/g for disturbed soil.
Because of the relatively large DCGLs, neither background subtraction nor use of background reference areas are expected to be applied during FSS.
2.5.11 Waste Volumes and Activities
Chapter 3 of this LTP and Section 6.8 of the HSA present the waste volumes and activities.
2.6 Continuing Characterization
As previously stated in Section 1.5.2 of this LTP, characterization data will be collected as necessary throughout the project. Results of future characterization sample analyses will be evaluated to determine the impact, if any, on the radionuclide identities, nuclide fractions and the classification of structures, soils and other site media.
2.7 Summary
2.7.1 Impact Of Characterization Data On Decontamination and Decommissioning
The characterization data collected and analyzed to date (as shown in Tables 5-4A through 5-4E and Figures 2-66 – 2-141) are of sufficient quantity and quality to provide the basis for the initial classification of survey areas, for planning remediation activities, for estimation of radiological waste types and volumes, and for the development of DCGLs. However, characterization is an ongoing process that will continue as necessary during decommissioning.

Ran
cho
Seco
Lic
ense
Ter
min
atio
n Pl
an
R
evis
ion
1 C
hapt
er 2
, Site
Cha
ract
eriz
atio
n
May
200
8
Pa
ge 2
-61

Ran
cho
Seco
Lic
ense
Ter
min
atio
n Pl
an
R
evis
ion
1 C
hapt
er 2
, Site
Cha
ract
eriz
atio
n
May
200
8
Pa
ge 2
-62

Ran
cho
Seco
Lic
ense
Ter
min
atio
n Pl
an
R
evis
ion
1 C
hapt
er 2
, Site
Cha
ract
eriz
atio
n
May
200
8
Pa
ge 2
-63

Ran
cho
Seco
Lic
ense
Ter
min
atio
n Pl
an
R
evis
ion
1 C
hapt
er 2
, Site
Cha
ract
eriz
atio
n
May
200
8
Pa
ge 2
-64
Fi
gure
2-4
L
ocat
ions
of B
orin
gs D
rille
d an
d Sa
mpl
ed a
t Ran
cho
Seco

Ran
cho
Seco
Lic
ense
Ter
min
atio
n Pl
an
R
evis
ion
1 C
hapt
er 2
, Site
Cha
ract
eriz
atio
n
May
200
8
Pa
ge 2
-65
Fi
gure
2-5
Po
tent
iom
etri
c Su
rfac
e M
ap fo
r G
roun
dwat
er B
enea
th R
anch
o Se
co, D
ecem
ber
2005

Rancho Seco License Termination Plan Revision 1 Chapter 2, Site Characterization May 2008
Page 2-66
Figure 2-6 Piper Diagram for Groundwater Concentrations Beneath Rancho Seco
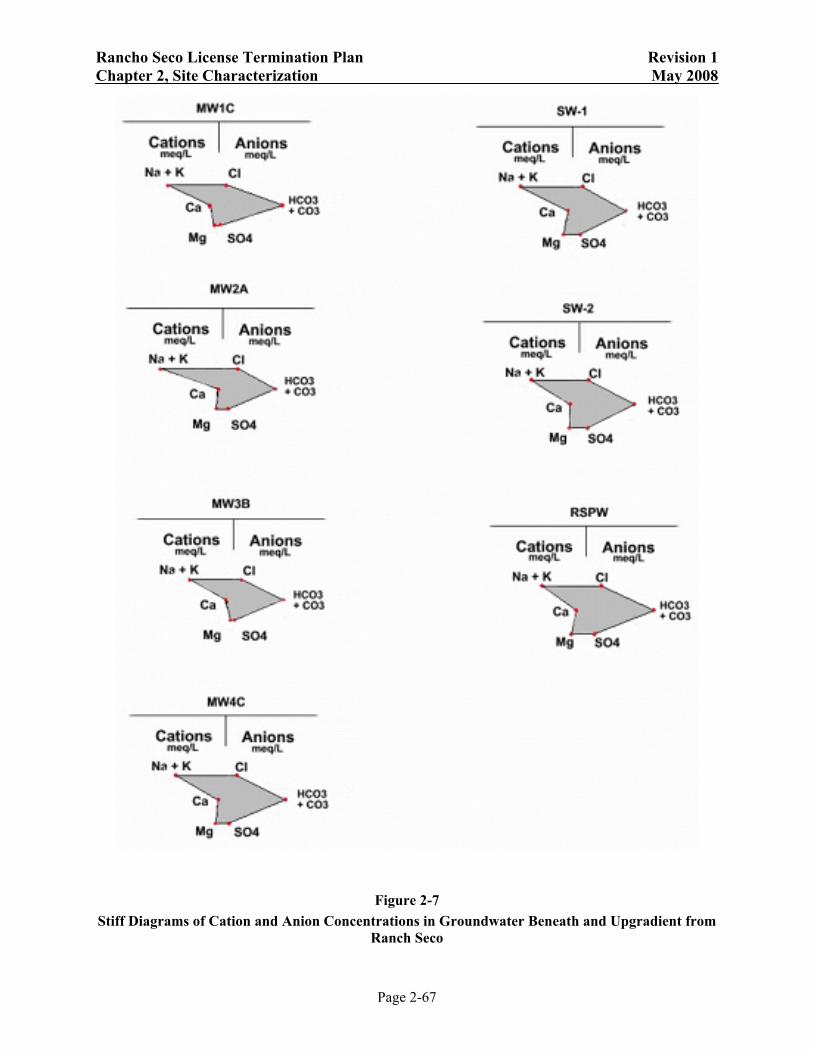
Rancho Seco License Termination Plan Revision 1 Chapter 2, Site Characterization May 2008
Page 2-67
Figure 2-7 Stiff Diagrams of Cation and Anion Concentrations in Groundwater Beneath and Upgradient from
Ranch Seco

Ran
cho
Seco
Lic
ense
Ter
min
atio
n Pl
an
R
evis
ion
1 C
hapt
er 2
, Site
Cha
ract
eriz
atio
n
May
200
8
Page
2-6
8

Ran
cho
Seco
Lic
ense
Ter
min
atio
n Pl
an
R
evis
ion
1 C
hapt
er 2
, Site
Cha
ract
eriz
atio
n
May
200
8
Page
2-6
9

Ran
cho
Seco
Lic
ense
Ter
min
atio
n Pl
an
R
evis
ion
1 C
hapt
er 2
, Site
Cha
ract
eriz
atio
n
May
200
8
Page
2-7
0

Ran
cho
Seco
Lic
ense
Ter
min
atio
n Pl
an
R
evis
ion
1 C
hapt
er 2
, Site
Cha
ract
eriz
atio
n
May
200
8
Page
2-7
1
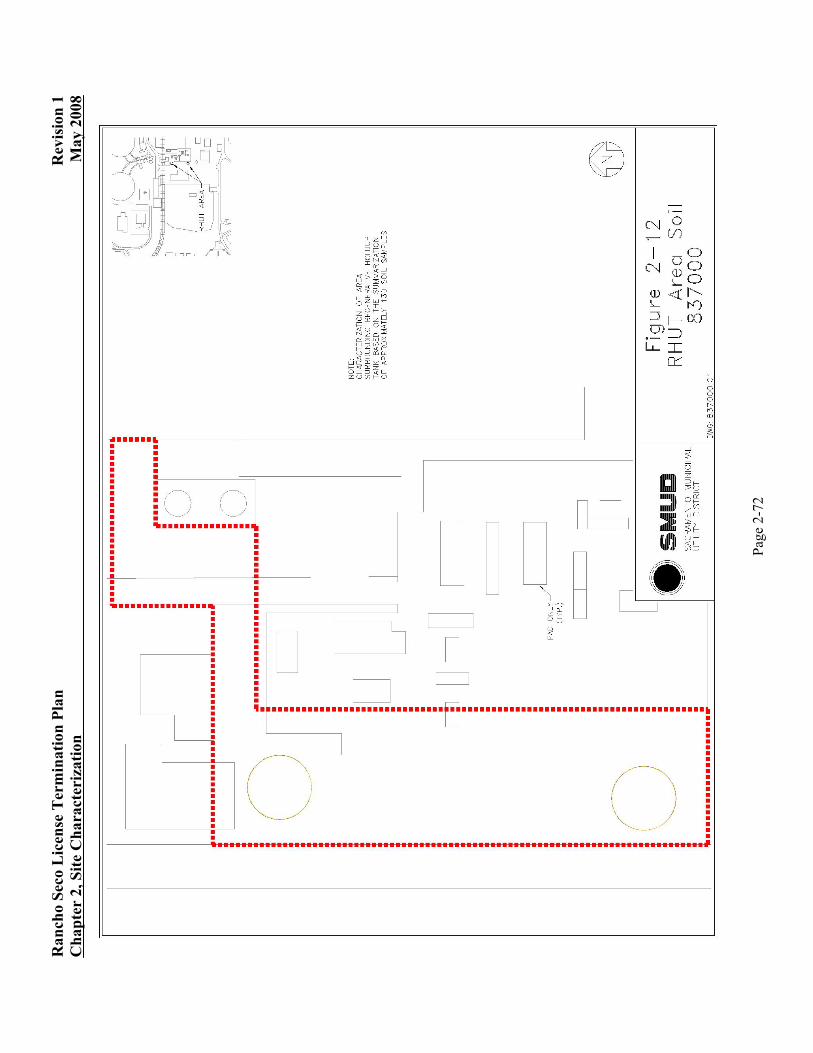
Ran
cho
Seco
Lic
ense
Ter
min
atio
n Pl
an
R
evis
ion
1 C
hapt
er 2
, Site
Cha
ract
eriz
atio
n
May
200
8
Page
2-7
2

Ran
cho
Seco
Lic
ense
Ter
min
atio
n Pl
an
R
evis
ion
1 C
hapt
er 2
, Site
Cha
ract
eriz
atio
n
May
200
8
Page
2-7
3

Ran
cho
Seco
Lic
ense
Ter
min
atio
n Pl
an
R
evis
ion
1 C
hapt
er 2
, Site
Cha
ract
eriz
atio
n
May
200
8
Page
2-7
4

Ran
cho
Seco
Lic
ense
Ter
min
atio
n Pl
an
R
evis
ion
1 C
hapt
er 2
, Site
Cha
ract
eriz
atio
n
May
200
8
Page
2-7
5

Ran
cho
Seco
Lic
ense
Ter
min
atio
n Pl
an
R
evis
ion
1 C
hapt
er 2
, Site
Cha
ract
eriz
atio
n
May
200
8
Page
2-7
6

Ran
cho
Seco
Lic
ense
Ter
min
atio
n Pl
an
R
evis
ion
1 C
hapt
er 2
, Site
Cha
ract
eriz
atio
n
May
200
8
Page
2-7
7

Ran
cho
Seco
Lic
ense
Ter
min
atio
n Pl
an
R
evis
ion
1 C
hapt
er 2
, Site
Cha
ract
eriz
atio
n
May
200
8
Page
2-7
8

Ran
cho
Seco
Lic
ense
Ter
min
atio
n Pl
an
R
evis
ion
1 C
hapt
er 2
, Site
Cha
ract
eriz
atio
n
May
200
8
Page
2-7
9

Ran
cho
Seco
Lic
ense
Ter
min
atio
n Pl
an
R
evis
ion
1 C
hapt
er 2
, Site
Cha
ract
eriz
atio
n
May
200
8
Page
2-8
0

Ran
cho
Seco
Lic
ense
Ter
min
atio
n Pl
an
R
evis
ion
1 C
hapt
er 2
, Site
Cha
ract
eriz
atio
n
May
200
8
Page
2-8
1

Ran
cho
Seco
Lic
ense
Ter
min
atio
n Pl
an
R
evis
ion
1 C
hapt
er 2
, Site
Cha
ract
eriz
atio
n
May
200
8
Page
2-8
2

Ran
cho
Seco
Lic
ense
Ter
min
atio
n Pl
an
R
evis
ion
1 C
hapt
er 2
, Site
Cha
ract
eriz
atio
n
May
200
8
Page
2-8
3
Figu
re 2
-23
Act
ivat
ion
Dep
th A
ssoc
iate
d w
ith E
ach
Cor
e at
the
Res
pect
ive
Ele
vatio
ns
Figu
re 2
-24
Eu-
152
Con
cent
ratio
n fo
r th
e M
id-C
ore
Reg
ion

Ran
cho
Seco
Lic
ense
Ter
min
atio
n Pl
an
R
evis
ion
1 C
hapt
er 2
, Site
Cha
ract
eriz
atio
n
May
200
8
Page
2-8
4

Ran
cho
Seco
Lic
ense
Ter
min
atio
n Pl
an
R
evis
ion
1 C
hapt
er 2
, Site
Cha
ract
eriz
atio
n
May
200
8
Page
2-8
5
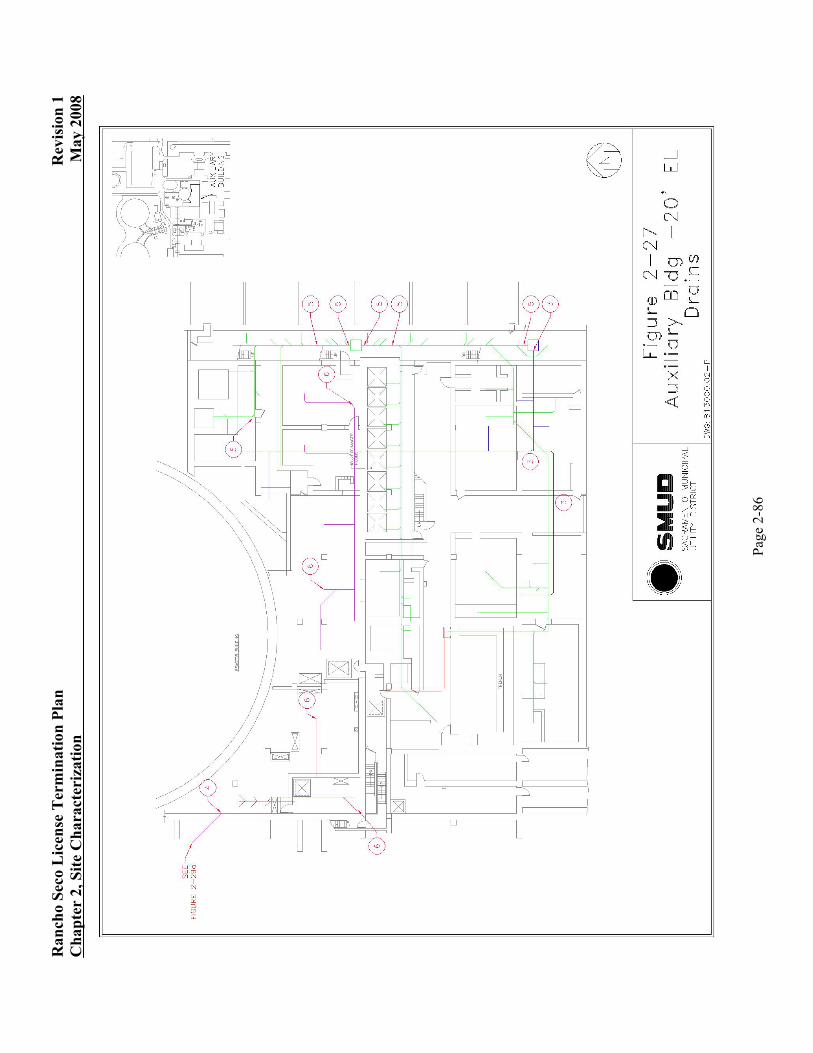
Ran
cho
Seco
Lic
ense
Ter
min
atio
n Pl
an
R
evis
ion
1 C
hapt
er 2
, Site
Cha
ract
eriz
atio
n
May
200
8
Page
2-8
6

Ran
cho
Seco
Lic
ense
Ter
min
atio
n Pl
an
R
evis
ion
1 C
hapt
er 2
, Site
Cha
ract
eriz
atio
n
May
200
8
Page
2-8
7

Ran
cho
Seco
Lic
ense
Ter
min
atio
n Pl
an
R
evis
ion
1 C
hapt
er 2
, Site
Cha
ract
eriz
atio
n
May
200
8
Page
2-8
8

Ran
cho
Seco
Lic
ense
Ter
min
atio
n Pl
an
R
evis
ion
1 C
hapt
er 2
, Site
Cha
ract
eriz
atio
n
May
200
8
Page
2-8
9

Ran
cho
Seco
Lic
ense
Ter
min
atio
n Pl
an
R
evis
ion
1 C
hapt
er 2
, Site
Cha
ract
eriz
atio
n
May
200
8
Page
2-9
0

Ran
cho
Seco
Lic
ense
Ter
min
atio
n Pl
an
R
evis
ion
1 C
hapt
er 2
, Site
Cha
ract
eriz
atio
n
May
200
8
Page
2-9
1

Rancho Seco License Termination Plan Revision 1 Chapter 2, Site Characterization May 2008
Page 2-92
2.8 References
2-1 U.S. Nuclear Regulatory Commission NUREG–1575, Revision 1, “Multi-Agency Radiation Survey and Site Investigation Manual (MARSSIM),” August 2000
2-2 U.S. Nuclear Regulatory Commission NUREG/CR-2082 – “Monitoring for Compliance with Decommissioning Termination Survey Criteria”
2-3 U.S. Nuclear Regulatory Commission draft Regulatory Guide DG-1005, “Standard Format and Content for Decommissioning Plans for Nuclear Reactors”
2-4 “Sacramento Municipal Utility District, Rancho Seco Nuclear Generating Station, Unit No. 1, Final Safety Analysis Report”
2-5 “Sacramento Municipal Utility District, Rancho Seco Nuclear Generating Station, Unit No. 1, Updated Final Safety Analysis Report”
2-6 Sacramento Municipal Utility District, “Geotechnical Investigation for Proposed Evaporation Ponds,” ERPT-C0104, Rev.1, 1989
2-7 Sacramento Municipal Utility District, “Final Engineering Report Assessment of Spent Fuel Liner Leakage,” ERPT-M0221, Rev.0, 1990
2-8 Sacramento Municipal Utility District, “Rancho Seco Independent Spent Fuel Storage Installation Final Safety Analysis Report,” Volumes I, II, and III
2-9 Bechtel Corporation, “Construction Report for Rancho Seco Nuclear Generating Station Unit No. 1,” January 15, 1976
2-10 ‘Sacramento Municipal Utility District, Rancho Seco Facility, Defueled Safety Analysis Report”
2-11 ‘U.S. Nuclear Regulatory Commission Safety Evaluation by the Directorate of Licensing, US Atomic Energy Commission, in the matter of Sacramento Municipal Utility District, Rancho Seco Nuclear Generating Station, Unit 1, Docket 50-312’
2-12 Sacramento Municipal Utility District, “Rancho Seco Nuclear Generating Station Proposed Decommissioning Plan” (PDP), May 20, 1991
2-13 Sacramento Municipal Utility District, “Plan for Ultimate Disposition of the Facility” (PUDF), July 1990
2-14 U.S. Nuclear Regulatory Commission NUREG-0586, “Final Generic Environmental Impact Statement on Decommissioning of Nuclear Facilities (FGEIS),” August 1988
2-15 U.S. Nuclear Regulatory Commission NUREG/CR-4286, “Evaluation of Radioactive Liquid Effluent Releases From the Rancho Seco Nuclear Power Plant,” March 1986
2-16 Lawrence Livermore National Laboratory Report UCID 20963, Part II, “Environmental Radiological Studies Conducted During 1986 in the Vicinity of the Rancho Seco Nuclear Generating Station,” 1987

Rancho Seco License Termination Plan Revision 1 Chapter 2, Site Characterization May 2008
Page 2-93
2-17 Sacramento Municipal Utility District, “Rancho Seco Nuclear Generating Station, Historical Site Assessment,” March 2004
2-18 Sacramento Municipal Utility District, “Supplement to Rancho Seco Environmental Report - Post Operating License Stage,” May 20, 1991
2-19 Rancho Seco Nuclear Generating Station, Unit No. 1, Updated Final Safety Analysis Report
2-20 URS Corporation, “Hydrogeological Characterization of the Rancho Seco Nuclear Generating Station,” March 2006
2-21 Federal Emergency Management Agency (FEMA), Flood Insurance Rate Maps 500 and 525, Sacramento County, 1980
2-22 Page, R., 1986, “Geology of the Fresh Ground-Water Basin of the Central Valley, California with Texture Maps and Sections,” U.S.G.S. Professional Paper 1401-C, p 54
2-23 California Department of Water Resources, “San Joaquin Valley Groundwater Basin, Cosumnes Subbasin,” Bulletin 118, p. 5, 2004
2-24 Shonka Research Associates, Inc., “Rancho Seco Non-Industrial Area Survey Project,” Final Report, Revision 2, June 26, 2001
2-25 U.S. Nuclear Regulatory Commission NUREG-1505, Revision 1, “A Nonparametric Statistical Methodology for the Design and Analysis of Final Status Decommissioning Surveys,” June 1998 draft
2-26 Rancho Seco Procedure Manual, RASP-1901, Revision 0, “Decommissioning Surveys Program,” July 30, 2001
2-27 Rancho Seco Decommissioning Technical Basis Document DTBD-05-015, Revision 0, “Rancho Seco Nuclear Generating Station Structure Nuclide Fraction and DCGLs”
2-28 Rancho Seco Decommissioning Technical Basis Document DTBD-05-014, Revision 0, “RSNGS Surface Soil Nuclide Fractions and DCGL”
2-29 Rancho Seco Decommissioning Technical Basis Document DTBD-05-009, Revision 0, “Embedded Piping Scenario and DCGL Determination Basis”
2-30 U.S. Nuclear Regulatory Commission NUREG/CR-5512 V3, “Residual Radioactivity Contamination From Decommissioning Parameter Analysis” Draft October, 1999
2-31 Rancho Seco Decommissioning Technical Basis Document DTBD-05-013, Revision 0, “Buried Piping Scenario and DCGL Determination Basis”
2-32 NRC Inspection Report 050-00312/04-003, Correspondence U.S. NRC Region IV, Arlington Texas, October 14, 2005
2-33 NRC Inspection Report 050-0031204; 072-00011/04-004; Analytical Results For Soil Samples, Correspondence U.S. NRC Region IV, Arlington, Texas, January 24, 2005

Rancho Seco License Termination Plan Revision 1 Chapter 2, Site Characterization May 2008 Appendix 2-A, Miscellaneous Historical Construction Photographs
Page 2-94
December 27, 1968 – Clay access road and Clay East road intersection

Rancho Seco License Termination Plan Revision 1 Chapter 2, Site Characterization May 2008 Appendix 2-A, Miscellaneous Historical Construction Photographs
Page 2-95
March 10, 1969 – Site Preparation, looking south at rough grading in turbine and reactor area

Rancho Seco License Termination Plan Revision 1 Chapter 2, Site Characterization May 2008 Appendix 2-A, Miscellaneous Historical Construction Photographs
Page 2-96
March 10, 1969 – Site Preparation, looking north at first rough grading cut into the turbine area

Rancho Seco License Termination Plan Revision 1 Chapter 2, Site Characterization May 2008 Appendix 2-A, Miscellaneous Historical Construction Photographs
Page 2-97
April 4, 1969 – Site Preparation, looking north along the east edge of the reactor containment structure

Rancho Seco License Termination Plan Revision 1 Chapter 2, Site Characterization May 2008 Appendix 2-A, Miscellaneous Historical Construction Photographs
Page 2-98
May 1, 1969 – Site Preparation, Twin Cities access road looking north

Rancho Seco License Termination Plan Revision 1 Chapter 2, Site Characterization May 2008 Appendix 2-A, Miscellaneous Historical Construction Photographs
Page 2-99
September 9, 1969 – forming for the fill concrete under the tendon access gallery floor slab

Rancho Seco License Termination Plan Revision 1 Chapter 2, Site Characterization May 2008 Appendix 2-A, Miscellaneous Historical Construction Photographs
Page 2-100
November 11, 1969 – a view of the shop and warehouse construction taken from the tower crane

Rancho Seco License Termination Plan Revision 1 Chapter 2, Site Characterization May 2008 Appendix 2-A, Miscellaneous Historical Construction Photographs
Page 2-101
February 9, 1970 – installing floor liner plate on reactor building floor slab

Rancho Seco License Termination Plan Revision 1 Chapter 2, Site Characterization May 2008 Appendix 2-A, Miscellaneous Historical Construction Photographs
Page 2-102
March 20, 1970 – a view looking north of the auxiliary building sub-basement slab

Rancho Seco License Termination Plan Revision 1 Chapter 2, Site Characterization May 2008 Appendix 2-A, Miscellaneous Historical Construction Photographs
Page 2-103
March 20, 1970 – overall view of the containment structure with cooling tower No. 1 in background

Rancho Seco License Termination Plan Revision 1 Chapter 2, Site Characterization May 2008 Appendix 2-A, Miscellaneous Historical Construction Photographs
Page 2-104
April 23, 1970 – reinforcing steel and tendon sheathing for the first lift of the containment wall

Rancho Seco License Termination Plan Revision 1 Chapter 2, Site Characterization May 2008 Appendix 2-A, Miscellaneous Historical Construction Photographs
Page 2-105
April 23, 1970 – overall view looking northeast

Rancho Seco License Termination Plan Revision 1 Chapter 2, Site Characterization May 2008 Appendix 2-A, Miscellaneous Historical Construction Photographs
Page 2-106
April 24, 1970 – 108” diameter circulating water pipe forming and reinforcement for concrete encasements

Rancho Seco License Termination Plan Revision 1 Chapter 2, Site Characterization May 2008 Appendix 2-A, Miscellaneous Historical Construction Photographs
Page 2-107
May 28, 1970 – looking west at the auxiliary building subbasement wall with the turbine building in the background

Rancho Seco License Termination Plan Revision 1 Chapter 2, Site Characterization May 2008 Appendix 2-A, Miscellaneous Historical Construction Photographs
Page 2-108
May 28, 1970 – view looking south at the turbine building with the reactor and auxiliary buildings on the extreme left

Rancho Seco License Termination Plan Revision 1 Chapter 2, Site Characterization May 2008 Appendix 2-A, Miscellaneous Historical Construction Photographs
Page 2-109
May 28, 1970 – view looking south at the turbine and reactor buildings

Rancho Seco License Termination Plan Revision 1 Chapter 2, Site Characterization May 2008 Appendix 2-A, Miscellaneous Historical Construction Photographs
Page 2-110
July 17, 1970 – auxiliary building showing reinforcing being placed

Rancho Seco License Termination Plan Revision 1 Chapter 2, Site Characterization May 2008 Appendix 2-A, Miscellaneous Historical Construction Photographs
Page 2-111
This page intentionally left blank

Ran
cho
Seco
Lic
ense
Ter
min
atio
n Pl
an
R
evis
ion
1 C
hapt
er 2
, Site
Cha
ract
eriz
atio
n
May
200
8 A
ppen
dix
2-B
, Site
and
Str
uctu
re D
raw
ings
With
Sam
ple
and
Surv
ey L
ocat
ions
Page
2-1
12

Ran
cho
Seco
Lic
ense
Ter
min
atio
n Pl
an
R
evis
ion
1 C
hapt
er 2
, Site
Cha
ract
eriz
atio
n
May
200
8 A
ppen
dix
2-B
, Site
and
Str
uctu
re D
raw
ings
With
Sam
ple
and
Surv
ey L
ocat
ions
Page
2-1
13

Ran
cho
Seco
Lic
ense
Ter
min
atio
n Pl
an
R
evis
ion
1 C
hapt
er 2
, Site
Cha
ract
eriz
atio
n
May
200
8 A
ppen
dix
2-B
, Site
and
Str
uctu
re D
raw
ings
With
Sam
ple
and
Surv
ey L
ocat
ions
Page
2-1
14

Ran
cho
Seco
Lic
ense
Ter
min
atio
n Pl
an
R
evis
ion
1 C
hapt
er 2
, Site
Cha
ract
eriz
atio
n
May
200
8 A
ppen
dix
2-B
, Site
and
Str
uctu
re D
raw
ings
With
Sam
ple
and
Surv
ey L
ocat
ions
Page
2-1
15

Ran
cho
Seco
Lic
ense
Ter
min
atio
n Pl
an
R
evis
ion
1 C
hapt
er 2
, Site
Cha
ract
eriz
atio
n
May
200
8 A
ppen
dix
2-B
, Site
and
Str
uctu
re D
raw
ings
With
Sam
ple
and
Surv
ey L
ocat
ions
Page
2-1
16

Ran
cho
Seco
Lic
ense
Ter
min
atio
n Pl
an
R
evis
ion
1 C
hapt
er 2
, Site
Cha
ract
eriz
atio
n
May
200
8 A
ppen
dix
2-B
, Site
and
Str
uctu
re D
raw
ings
With
Sam
ple
and
Surv
ey L
ocat
ions
Page
2-1
17

Ran
cho
Seco
Lic
ense
Ter
min
atio
n Pl
an
R
evis
ion
1 C
hapt
er 2
, Site
Cha
ract
eriz
atio
n
May
200
8 A
ppen
dix
2-B
, Site
and
Str
uctu
re D
raw
ings
With
Sam
ple
and
Surv
ey L
ocat
ions
Page
2-1
18

Ran
cho
Seco
Lic
ense
Ter
min
atio
n Pl
an
R
evis
ion
1 C
hapt
er 2
, Site
Cha
ract
eriz
atio
n
May
200
8 A
ppen
dix
2-B
, Site
and
Str
uctu
re D
raw
ings
With
Sam
ple
and
Surv
ey L
ocat
ions
Page
2-1
19

Ran
cho
Seco
Lic
ense
Ter
min
atio
n Pl
an
R
evis
ion
1 C
hapt
er 2
, Site
Cha
ract
eriz
atio
n
May
200
8 A
ppen
dix
2-B
, Site
and
Str
uctu
re D
raw
ings
With
Sam
ple
and
Surv
ey L
ocat
ions
Page
2-1
20

Ran
cho
Seco
Lic
ense
Ter
min
atio
n Pl
an
R
evis
ion
1 C
hapt
er 2
, Site
Cha
ract
eriz
atio
n
May
200
8 A
ppen
dix
2-B
, Site
and
Str
uctu
re D
raw
ings
With
Sam
ple
and
Surv
ey L
ocat
ions
Page
2-1
21

Ran
cho
Seco
Lic
ense
Ter
min
atio
n Pl
an
R
evis
ion
1 C
hapt
er 2
, Site
Cha
ract
eriz
atio
n
May
200
8 A
ppen
dix
2-B
, Site
and
Str
uctu
re D
raw
ings
With
Sam
ple
and
Surv
ey L
ocat
ions
Page
2-1
22

Ran
cho
Seco
Lic
ense
Ter
min
atio
n Pl
an
R
evis
ion
1 C
hapt
er 2
, Site
Cha
ract
eriz
atio
n
May
200
8 A
ppen
dix
2-B
, Site
and
Str
uctu
re D
raw
ings
With
Sam
ple
and
Surv
ey L
ocat
ions
Page
2-1
23

Ran
cho
Seco
Lic
ense
Ter
min
atio
n Pl
an
R
evis
ion
1 C
hapt
er 2
, Site
Cha
ract
eriz
atio
n
May
200
8 A
ppen
dix
2-B
, Site
and
Str
uctu
re D
raw
ings
With
Sam
ple
and
Surv
ey L
ocat
ions
Page
2-1
24

Ran
cho
Seco
Lic
ense
Ter
min
atio
n Pl
an
R
evis
ion
1 C
hapt
er 2
, Site
Cha
ract
eriz
atio
n
May
200
8 A
ppen
dix
2-B
, Site
and
Str
uctu
re D
raw
ings
With
Sam
ple
and
Surv
ey L
ocat
ions
Page
2-1
25

Ran
cho
Seco
Lic
ense
Ter
min
atio
n Pl
an
R
evis
ion
1 C
hapt
er 2
, Site
Cha
ract
eriz
atio
n
May
200
8 A
ppen
dix
2-B
, Site
and
Str
uctu
re D
raw
ings
With
Sam
ple
and
Surv
ey L
ocat
ions
Page
2-1
26

Ran
cho
Seco
Lic
ense
Ter
min
atio
n Pl
an
R
evis
ion
1 C
hapt
er 2
, Site
Cha
ract
eriz
atio
n
May
200
8 A
ppen
dix
2-B
, Site
and
Str
uctu
re D
raw
ings
With
Sam
ple
and
Surv
ey L
ocat
ions
Page
2-1
27

Ran
cho
Seco
Lic
ense
Ter
min
atio
n Pl
an
R
evis
ion
1 C
hapt
er 2
, Site
Cha
ract
eriz
atio
n
May
200
8 A
ppen
dix
2-B
, Site
and
Str
uctu
re D
raw
ings
With
Sam
ple
and
Surv
ey L
ocat
ions
Page
2-1
28

Ran
cho
Seco
Lic
ense
Ter
min
atio
n Pl
an
R
evis
ion
1 C
hapt
er 2
, Site
Cha
ract
eriz
atio
n
May
200
8 A
ppen
dix
2-B
, Site
and
Str
uctu
re D
raw
ings
With
Sam
ple
and
Surv
ey L
ocat
ions
Page
2-1
29

Ran
cho
Seco
Lic
ense
Ter
min
atio
n Pl
an
R
evis
ion
1 C
hapt
er 2
, Site
Cha
ract
eriz
atio
n
May
200
8 A
ppen
dix
2-B
, Site
and
Str
uctu
re D
raw
ings
With
Sam
ple
and
Surv
ey L
ocat
ions
Page
2-1
30

Ran
cho
Seco
Lic
ense
Ter
min
atio
n Pl
an
R
evis
ion
1 C
hapt
er 2
, Site
Cha
ract
eriz
atio
n
May
200
8 A
ppen
dix
2-B
, Site
and
Str
uctu
re D
raw
ings
With
Sam
ple
and
Surv
ey L
ocat
ions
Page
2-1
31

Ran
cho
Seco
Lic
ense
Ter
min
atio
n Pl
an
R
evis
ion
1 C
hapt
er 2
, Site
Cha
ract
eriz
atio
n
May
200
8 A
ppen
dix
2-B
, Site
and
Str
uctu
re D
raw
ings
With
Sam
ple
and
Surv
ey L
ocat
ions
Page
2-1
32

Ran
cho
Seco
Lic
ense
Ter
min
atio
n Pl
an
R
evis
ion
1 C
hapt
er 2
, Site
Cha
ract
eriz
atio
n
May
200
8 A
ppen
dix
2-B
, Site
and
Str
uctu
re D
raw
ings
With
Sam
ple
and
Surv
ey L
ocat
ions
Page
2-1
33

Ran
cho
Seco
Lic
ense
Ter
min
atio
n Pl
an
R
evis
ion
1 C
hapt
er 2
, Site
Cha
ract
eriz
atio
n
May
200
8 A
ppen
dix
2-B
, Site
and
Str
uctu
re D
raw
ings
With
Sam
ple
and
Surv
ey L
ocat
ions
Page
2-1
34

Ran
cho
Seco
Lic
ense
Ter
min
atio
n Pl
an
R
evis
ion
1 C
hapt
er 2
, Site
Cha
ract
eriz
atio
n
May
200
8 A
ppen
dix
2-B
, Site
and
Str
uctu
re D
raw
ings
With
Sam
ple
and
Surv
ey L
ocat
ions
Page
2-1
35

Ran
cho
Seco
Lic
ense
Ter
min
atio
n Pl
an
R
evis
ion
1 C
hapt
er 2
, Site
Cha
ract
eriz
atio
n
May
200
8 A
ppen
dix
2-B
, Site
and
Str
uctu
re D
raw
ings
With
Sam
ple
and
Surv
ey L
ocat
ions
Page
2-1
36

Ran
cho
Seco
Lic
ense
Ter
min
atio
n Pl
an
R
evis
ion
1 C
hapt
er 2
, Site
Cha
ract
eriz
atio
n
May
200
8 A
ppen
dix
2-B
, Site
and
Str
uctu
re D
raw
ings
With
Sam
ple
and
Surv
ey L
ocat
ions
Page
2-1
37

Ran
cho
Seco
Lic
ense
Ter
min
atio
n Pl
an
R
evis
ion
1 C
hapt
er 2
, Site
Cha
ract
eriz
atio
n
May
200
8 A
ppen
dix
2-B
, Site
and
Str
uctu
re D
raw
ings
With
Sam
ple
and
Surv
ey L
ocat
ions
Page
2-1
38
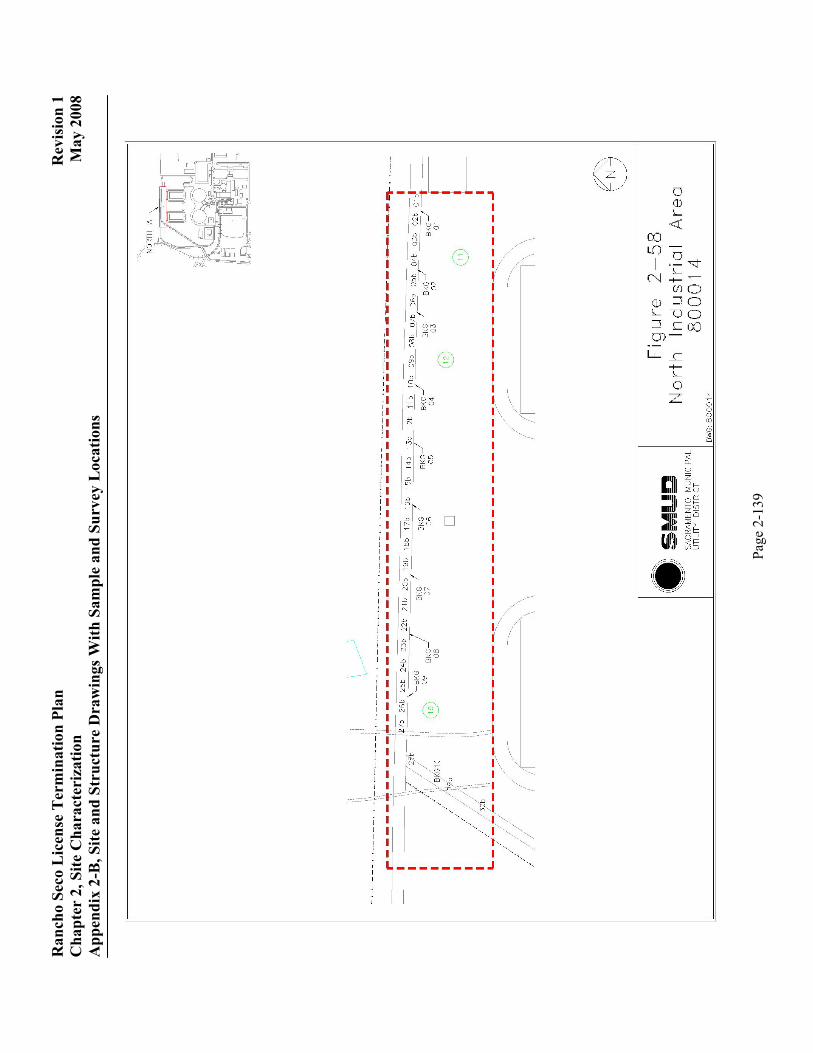
Ran
cho
Seco
Lic
ense
Ter
min
atio
n Pl
an
R
evis
ion
1 C
hapt
er 2
, Site
Cha
ract
eriz
atio
n
May
200
8 A
ppen
dix
2-B
, Site
and
Str
uctu
re D
raw
ings
With
Sam
ple
and
Surv
ey L
ocat
ions
Page
2-1
39

Ran
cho
Seco
Lic
ense
Ter
min
atio
n Pl
an
R
evis
ion
1 C
hapt
er 2
, Site
Cha
ract
eriz
atio
n
May
200
8 A
ppen
dix
2-B
, Site
and
Str
uctu
re D
raw
ings
With
Sam
ple
and
Surv
ey L
ocat
ions
Page
2-1
40

Ran
cho
Seco
Lic
ense
Ter
min
atio
n Pl
an
R
evis
ion
1 C
hapt
er 2
, Site
Cha
ract
eriz
atio
n
May
200
8 A
ppen
dix
2-B
, Site
and
Str
uctu
re D
raw
ings
With
Sam
ple
and
Surv
ey L
ocat
ions
Page
2-1
41

Ran
cho
Seco
Lic
ense
Ter
min
atio
n Pl
an
R
evis
ion
1 C
hapt
er 2
, Site
Cha
ract
eriz
atio
n
May
200
8 A
ppen
dix
2-B
, Site
and
Str
uctu
re D
raw
ings
With
Sam
ple
and
Surv
ey L
ocat
ions
Page
2-1
42

Ran
cho
Seco
Lic
ense
Ter
min
atio
n Pl
an
R
evis
ion
1 C
hapt
er 2
, Site
Cha
ract
eriz
atio
n
May
200
8 A
ppen
dix
2-B
, Site
and
Str
uctu
re D
raw
ings
With
Sam
ple
and
Surv
ey L
ocat
ions
Page
2-1
43

Ran
cho
Seco
Lic
ense
Ter
min
atio
n Pl
an
R
evis
ion
1 C
hapt
er 2
, Site
Cha
ract
eriz
atio
n
May
200
8 A
ppen
dix
2-B
, Site
and
Str
uctu
re D
raw
ings
With
Sam
ple
and
Surv
ey L
ocat
ions
Page
2-1
44

Ran
cho
Seco
Lic
ense
Ter
min
atio
n Pl
an
R
evis
ion
1 C
hapt
er 2
, Site
Cha
ract
eriz
atio
n
May
200
8 A
ppen
dix
2-B
, Site
and
Str
uctu
re D
raw
ings
With
Sam
ple
and
Surv
ey L
ocat
ions
Page
2-1
45

Ran
cho
Seco
Lic
ense
Ter
min
atio
n Pl
an
R
evis
ion
1 C
hapt
er 2
, Site
Cha
ract
eriz
atio
n
May
200
8 A
ppen
dix
2-B
, Site
and
Str
uctu
re D
raw
ings
With
Sam
ple
and
Surv
ey L
ocat
ions
Page
2-1
46

Ran
cho
Seco
Lic
ense
Ter
min
atio
n Pl
an
R
evis
ion
1 C
hapt
er 2
, Site
Cha
ract
eriz
atio
n
May
200
8 A
ppen
dix
2-B
, Site
and
Str
uctu
re D
raw
ings
With
Sam
ple
and
Surv
ey L
ocat
ions
Page
2-1
47

Ran
cho
Seco
Lic
ense
Ter
min
atio
n Pl
an
R
evis
ion
1 C
hapt
er 2
, Site
Cha
ract
eriz
atio
n
May
200
8 A
ppen
dix
2-B
, Site
and
Str
uctu
re D
raw
ings
With
Sam
ple
and
Surv
ey L
ocat
ions
Page
2-1
48

Ran
cho
Seco
Lic
ense
Ter
min
atio
n Pl
an
R
evis
ion
1 C
hapt
er 2
, Site
Cha
ract
eriz
atio
n
May
200
8 A
ppen
dix
2-B
, Site
and
Str
uctu
re D
raw
ings
With
Sam
ple
and
Surv
ey L
ocat
ions
Page
2-1
49

Ran
cho
Seco
Lic
ense
Ter
min
atio
n Pl
an
R
evis
ion
1 C
hapt
er 2
, Site
Cha
ract
eriz
atio
n
May
200
8 A
ppen
dix
2-B
, Site
and
Str
uctu
re D
raw
ings
With
Sam
ple
and
Surv
ey L
ocat
ions
Page
2-1
50

Ran
cho
Seco
Lic
ense
Ter
min
atio
n Pl
an
R
evis
ion
1 C
hapt
er 2
, Site
Cha
ract
eriz
atio
n
May
200
8 A
ppen
dix
2-B
, Site
and
Str
uctu
re D
raw
ings
With
Sam
ple
and
Surv
ey L
ocat
ions
Page
2-1
51

Ran
cho
Seco
Lic
ense
Ter
min
atio
n Pl
an
R
evis
ion
1 C
hapt
er 2
, Site
Cha
ract
eriz
atio
n
May
200
8 A
ppen
dix
2-B
, Site
and
Str
uctu
re D
raw
ings
With
Sam
ple
and
Surv
ey L
ocat
ions
Page
2-1
52

Ran
cho
Seco
Lic
ense
Ter
min
atio
n Pl
an
R
evis
ion
1 C
hapt
er 2
, Site
Cha
ract
eriz
atio
n
May
200
8 A
ppen
dix
2-B
, Site
and
Str
uctu
re D
raw
ings
With
Sam
ple
and
Surv
ey L
ocat
ions
Page
2-1
53

Ran
cho
Seco
Lic
ense
Ter
min
atio
n Pl
an
R
evis
ion
1 C
hapt
er 2
, Site
Cha
ract
eriz
atio
n
May
200
8 A
ppen
dix
2-B
, Site
and
Str
uctu
re D
raw
ings
With
Sam
ple
and
Surv
ey L
ocat
ions
Page
2-1
54

Ran
cho
Seco
Lic
ense
Ter
min
atio
n Pl
an
R
evis
ion
1 C
hapt
er 2
, Site
Cha
ract
eriz
atio
n
May
200
8 A
ppen
dix
2-B
, Site
and
Str
uctu
re D
raw
ings
With
Sam
ple
and
Surv
ey L
ocat
ions
Page
2-1
55

Ran
cho
Seco
Lic
ense
Ter
min
atio
n Pl
an
R
evis
ion
1 C
hapt
er 2
, Site
Cha
ract
eriz
atio
n
May
200
8 A
ppen
dix
2-B
, Site
and
Str
uctu
re D
raw
ings
With
Sam
ple
and
Surv
ey L
ocat
ions
Page
2-1
56

Ran
cho
Seco
Lic
ense
Ter
min
atio
n Pl
an
R
evis
ion
1 C
hapt
er 2
, Site
Cha
ract
eriz
atio
n
May
200
8 A
ppen
dix
2-B
, Site
and
Str
uctu
re D
raw
ings
With
Sam
ple
and
Surv
ey L
ocat
ions
Page
2-1
57

Ran
cho
Seco
Lic
ense
Ter
min
atio
n Pl
an
R
evis
ion
1 C
hapt
er 2
, Site
Cha
ract
eriz
atio
n
May
200
8 A
ppen
dix
2-B
, Site
and
Str
uctu
re D
raw
ings
With
Sam
ple
and
Surv
ey L
ocat
ions
Page
2-1
58

Ran
cho
Seco
Lic
ense
Ter
min
atio
n Pl
an
R
evis
ion
1 C
hapt
er 2
, Site
Cha
ract
eriz
atio
n
May
200
8 A
ppen
dix
2-B
, Site
and
Str
uctu
re D
raw
ings
With
Sam
ple
and
Surv
ey L
ocat
ions
Page
2-1
59

Ran
cho
Seco
Lic
ense
Ter
min
atio
n Pl
an
R
evis
ion
1 C
hapt
er 2
, Site
Cha
ract
eriz
atio
n
May
200
8 A
ppen
dix
2-B
, Site
and
Str
uctu
re D
raw
ings
With
Sam
ple
and
Surv
ey L
ocat
ions
Page
2-1
60

Ran
cho
Seco
Lic
ense
Ter
min
atio
n Pl
an
R
evis
ion
1 C
hapt
er 2
, Site
Cha
ract
eriz
atio
n
May
200
8 A
ppen
dix
2-B
, Site
and
Str
uctu
re D
raw
ings
With
Sam
ple
and
Surv
ey L
ocat
ions
Page
2-1
61

Ran
cho
Seco
Lic
ense
Ter
min
atio
n Pl
an
R
evis
ion
1 C
hapt
er 2
, Site
Cha
ract
eriz
atio
n
May
200
8 A
ppen
dix
2-B
, Site
and
Str
uctu
re D
raw
ings
With
Sam
ple
and
Surv
ey L
ocat
ions
Page
2-1
62

Ran
cho
Seco
Lic
ense
Ter
min
atio
n Pl
an
R
evis
ion
1 C
hapt
er 2
, Site
Cha
ract
eriz
atio
n
May
200
8 A
ppen
dix
2-B
, Site
and
Str
uctu
re D
raw
ings
With
Sam
ple
and
Surv
ey L
ocat
ions
Page
2-1
63

Ran
cho
Seco
Lic
ense
Ter
min
atio
n Pl
an
R
evis
ion
1 C
hapt
er 2
, Site
Cha
ract
eriz
atio
n
May
200
8 A
ppen
dix
2-B
, Site
and
Str
uctu
re D
raw
ings
With
Sam
ple
and
Surv
ey L
ocat
ions
Page
2-1
64

Ran
cho
Seco
Lic
ense
Ter
min
atio
n Pl
an
R
evis
ion
1 C
hapt
er 2
, Site
Cha
ract
eriz
atio
n
May
200
8 A
ppen
dix
2-B
, Site
and
Str
uctu
re D
raw
ings
With
Sam
ple
and
Surv
ey L
ocat
ions
Page
2-1
65

Ran
cho
Seco
Lic
ense
Ter
min
atio
n Pl
an
R
evis
ion
1 C
hapt
er 2
, Site
Cha
ract
eriz
atio
n
May
200
8 A
ppen
dix
2-B
, Site
and
Str
uctu
re D
raw
ings
With
Sam
ple
and
Surv
ey L
ocat
ions
Page
2-1
66

Ran
cho
Seco
Lic
ense
Ter
min
atio
n Pl
an
R
evis
ion
1 C
hapt
er 2
, Site
Cha
ract
eriz
atio
n
May
200
8 A
ppen
dix
2-B
, Site
and
Str
uctu
re D
raw
ings
With
Sam
ple
and
Surv
ey L
ocat
ions
Page
2-1
67

Ran
cho
Seco
Lic
ense
Ter
min
atio
n Pl
an
R
evis
ion
1 C
hapt
er 2
, Site
Cha
ract
eriz
atio
n
May
200
8 A
ppen
dix
2-B
, Site
and
Str
uctu
re D
raw
ings
With
Sam
ple
and
Surv
ey L
ocat
ions
Page
2-1
68

Ran
cho
Seco
Lic
ense
Ter
min
atio
n Pl
an
R
evis
ion
1 C
hapt
er 2
, Site
Cha
ract
eriz
atio
n
May
200
8 A
ppen
dix
2-B
, Site
and
Str
uctu
re D
raw
ings
With
Sam
ple
and
Surv
ey L
ocat
ions
Page
2-1
69

Ran
cho
Seco
Lic
ense
Ter
min
atio
n Pl
an
R
evis
ion
1 C
hapt
er 2
, Site
Cha
ract
eriz
atio
n
May
200
8 A
ppen
dix
2-B
, Site
and
Str
uctu
re D
raw
ings
With
Sam
ple
and
Surv
ey L
ocat
ions
Page
2-1
70

Ran
cho
Seco
Lic
ense
Ter
min
atio
n Pl
an
R
evis
ion
1 C
hapt
er 2
, Site
Cha
ract
eriz
atio
n
May
200
8 A
ppen
dix
2-B
, Site
and
Str
uctu
re D
raw
ings
With
Sam
ple
and
Surv
ey L
ocat
ions
Page
2-1
71

Ran
cho
Seco
Lic
ense
Ter
min
atio
n Pl
an
R
evis
ion
1 C
hapt
er 2
, Site
Cha
ract
eriz
atio
n
May
200
8 A
ppen
dix
2-B
, Site
and
Str
uctu
re D
raw
ings
With
Sam
ple
and
Surv
ey L
ocat
ions
Page
2-1
72

Ran
cho
Seco
Lic
ense
Ter
min
atio
n Pl
an
R
evis
ion
1 C
hapt
er 2
, Site
Cha
ract
eriz
atio
n
May
200
8 A
ppen
dix
2-B
, Site
and
Str
uctu
re D
raw
ings
With
Sam
ple
and
Surv
ey L
ocat
ions
Page
2-1
73

Ran
cho
Seco
Lic
ense
Ter
min
atio
n Pl
an
R
evis
ion
1 C
hapt
er 2
, Site
Cha
ract
eriz
atio
n
May
200
8 A
ppen
dix
2-B
, Site
and
Str
uctu
re D
raw
ings
With
Sam
ple
and
Surv
ey L
ocat
ions
Page
2-1
74

Ran
cho
Seco
Lic
ense
Ter
min
atio
n Pl
an
R
evis
ion
1 C
hapt
er 2
, Site
Cha
ract
eriz
atio
n
May
200
8 A
ppen
dix
2-B
, Site
and
Str
uctu
re D
raw
ings
With
Sam
ple
and
Surv
ey L
ocat
ions
Page
2-1
75

Ran
cho
Seco
Lic
ense
Ter
min
atio
n Pl
an
R
evis
ion
1 C
hapt
er 2
, Site
Cha
ract
eriz
atio
n
May
200
8 A
ppen
dix
2-B
, Site
and
Str
uctu
re D
raw
ings
With
Sam
ple
and
Surv
ey L
ocat
ions
Page
2-1
76

Ran
cho
Seco
Lic
ense
Ter
min
atio
n Pl
an
R
evis
ion
1 C
hapt
er 2
, Site
Cha
ract
eriz
atio
n
May
200
8 A
ppen
dix
2-B
, Site
and
Str
uctu
re D
raw
ings
With
Sam
ple
and
Surv
ey L
ocat
ions
Page
2-1
77

Ran
cho
Seco
Lic
ense
Ter
min
atio
n Pl
an
R
evis
ion
1 C
hapt
er 2
, Site
Cha
ract
eriz
atio
n
May
200
8 A
ppen
dix
2-B
, Site
and
Str
uctu
re D
raw
ings
With
Sam
ple
and
Surv
ey L
ocat
ions
Page
2-1
78

Ran
cho
Seco
Lic
ense
Ter
min
atio
n Pl
an
R
evis
ion
1 C
hapt
er 2
, Site
Cha
ract
eriz
atio
n
May
200
8 A
ppen
dix
2-B
, Site
and
Str
uctu
re D
raw
ings
With
Sam
ple
and
Surv
ey L
ocat
ions
Page
2-1
79

Ran
cho
Seco
Lic
ense
Ter
min
atio
n Pl
an
R
evis
ion
1 C
hapt
er 2
, Site
Cha
ract
eriz
atio
n
May
200
8 A
ppen
dix
2-B
, Site
and
Str
uctu
re D
raw
ings
With
Sam
ple
and
Surv
ey L
ocat
ions
Page
2-1
80

Ran
cho
Seco
Lic
ense
Ter
min
atio
n Pl
an
R
evis
ion
1 C
hapt
er 2
, Site
Cha
ract
eriz
atio
n
May
200
8 A
ppen
dix
2-B
, Site
and
Str
uctu
re D
raw
ings
With
Sam
ple
and
Surv
ey L
ocat
ions
Page
2-1
81

Ran
cho
Seco
Lic
ense
Ter
min
atio
n Pl
an
R
evis
ion
1 C
hapt
er 2
, Site
Cha
ract
eriz
atio
n
May
200
8 A
ppen
dix
2-B
, Site
and
Str
uctu
re D
raw
ings
With
Sam
ple
and
Surv
ey L
ocat
ions
Page
2-1
82

Ran
cho
Seco
Lic
ense
Ter
min
atio
n Pl
an
R
evis
ion
1 C
hapt
er 2
, Site
Cha
ract
eriz
atio
n
May
200
8 A
ppen
dix
2-B
, Site
and
Str
uctu
re D
raw
ings
With
Sam
ple
and
Surv
ey L
ocat
ions
Page
2-1
83

Ran
cho
Seco
Lic
ense
Ter
min
atio
n Pl
an
R
evis
ion
1 C
hapt
er 2
, Site
Cha
ract
eriz
atio
n
May
200
8 A
ppen
dix
2-B
, Site
and
Str
uctu
re D
raw
ings
With
Sam
ple
and
Surv
ey L
ocat
ions
Page
2-1
84

Ran
cho
Seco
Lic
ense
Ter
min
atio
n Pl
an
R
evis
ion
1 C
hapt
er 2
, Site
Cha
ract
eriz
atio
n
May
200
8 A
ppen
dix
2-B
, Site
and
Str
uctu
re D
raw
ings
With
Sam
ple
and
Surv
ey L
ocat
ions
Page
2-1
85

Ran
cho
Seco
Lic
ense
Ter
min
atio
n Pl
an
R
evis
ion
1 C
hapt
er 2
, Site
Cha
ract
eriz
atio
n
May
200
8 A
ppen
dix
2-B
, Site
and
Str
uctu
re D
raw
ings
With
Sam
ple
and
Surv
ey L
ocat
ions
Page
2-1
86

Ran
cho
Seco
Lic
ense
Ter
min
atio
n Pl
an
R
evis
ion
1 C
hapt
er 2
, Site
Cha
ract
eriz
atio
n
May
200
8 A
ppen
dix
2-B
, Site
and
Str
uctu
re D
raw
ings
With
Sam
ple
and
Surv
ey L
ocat
ions
Page
2-1
87

Ran
cho
Seco
Lic
ense
Ter
min
atio
n Pl
an
R
evis
ion
1 C
hapt
er 2
, Site
Cha
ract
eriz
atio
n
May
200
8 A
ppen
dix
2-B
, Site
and
Str
uctu
re D
raw
ings
With
Sam
ple
and
Surv
ey L
ocat
ions
Page
2-1
88

Ran
cho
Seco
Lic
ense
Ter
min
atio
n Pl
an
R
evis
ion
1 C
hapt
er 2
, Site
Cha
ract
eriz
atio
n
May
200
8 A
ppen
dix
2-B
, Site
and
Str
uctu
re D
raw
ings
With
Sam
ple
and
Surv
ey L
ocat
ions
Page
2-1
89

Ran
cho
Seco
Lic
ense
Ter
min
atio
n Pl
an
R
evis
ion
1 C
hapt
er 2
, Site
Cha
ract
eriz
atio
n
May
200
8 A
ppen
dix
2-B
, Site
and
Str
uctu
re D
raw
ings
With
Sam
ple
and
Surv
ey L
ocat
ions
Page
2-1
90

Ran
cho
Seco
Lic
ense
Ter
min
atio
n Pl
an
R
evis
ion
1 C
hapt
er 2
, Site
Cha
ract
eriz
atio
n
May
200
8 A
ppen
dix
2-B
, Site
and
Str
uctu
re D
raw
ings
With
Sam
ple
and
Surv
ey L
ocat
ions
Page
2-1
91

Ran
cho
Seco
Lic
ense
Ter
min
atio
n Pl
an
R
evis
ion
1 C
hapt
er 2
, Site
Cha
ract
eriz
atio
n
May
200
8 A
ppen
dix
2-B
, Site
and
Str
uctu
re D
raw
ings
With
Sam
ple
and
Surv
ey L
ocat
ions
Page
2-1
92

Ran
cho
Seco
Lic
ense
Ter
min
atio
n Pl
an
R
evis
ion
1 C
hapt
er 2
, Site
Cha
ract
eriz
atio
n
May
200
8 A
ppen
dix
2-B
, Site
and
Str
uctu
re D
raw
ings
With
Sam
ple
and
Surv
ey L
ocat
ions
Page
2-1
93

Ran
cho
Seco
Lic
ense
Ter
min
atio
n Pl
an
R
evis
ion
1 C
hapt
er 2
, Site
Cha
ract
eriz
atio
n
May
200
8 A
ppen
dix
2-B
, Site
and
Str
uctu
re D
raw
ings
With
Sam
ple
and
Surv
ey L
ocat
ions
Page
2-1
94

Ran
cho
Seco
Lic
ense
Ter
min
atio
n Pl
an
R
evis
ion
1 C
hapt
er 2
, Site
Cha
ract
eriz
atio
n
May
200
8 A
ppen
dix
2-B
, Site
and
Str
uctu
re D
raw
ings
With
Sam
ple
and
Surv
ey L
ocat
ions
Page
2-1
95

Ran
cho
Seco
Lic
ense
Ter
min
atio
n Pl
an
R
evis
ion
1 C
hapt
er 2
, Site
Cha
ract
eriz
atio
n
May
200
8 A
ppen
dix
2-B
, Site
and
Str
uctu
re D
raw
ings
With
Sam
ple
and
Surv
ey L
ocat
ions
Page
2-1
96

Ran
cho
Seco
Lic
ense
Ter
min
atio
n Pl
an
R
evis
ion
1 C
hapt
er 2
, Site
Cha
ract
eriz
atio
n
May
200
8 A
ppen
dix
2-B
, Site
and
Str
uctu
re D
raw
ings
With
Sam
ple
and
Surv
ey L
ocat
ions
Page
2-1
97

Ran
cho
Seco
Lic
ense
Ter
min
atio
n Pl
an
R
evis
ion
1 C
hapt
er 2
, Site
Cha
ract
eriz
atio
n
May
200
8 A
ppen
dix
2-B
, Site
and
Str
uctu
re D
raw
ings
With
Sam
ple
and
Surv
ey L
ocat
ions
Page
2-1
98

Ran
cho
Seco
Lic
ense
Ter
min
atio
n Pl
an
R
evis
ion
1 C
hapt
er 2
, Site
Cha
ract
eriz
atio
n
May
200
8 A
ppen
dix
2-B
, Site
and
Str
uctu
re D
raw
ings
With
Sam
ple
and
Surv
ey L
ocat
ions
Page
2-1
99

Ran
cho
Seco
Lic
ense
Ter
min
atio
n Pl
an
R
evis
ion
1 C
hapt
er 2
, Site
Cha
ract
eriz
atio
n
May
200
8 A
ppen
dix
2-B
, Site
and
Str
uctu
re D
raw
ings
With
Sam
ple
and
Surv
ey L
ocat
ions
Page
2-2
00

Ran
cho
Seco
Lic
ense
Ter
min
atio
n Pl
an
R
evis
ion
1 C
hapt
er 2
, Site
Cha
ract
eriz
atio
n
May
200
8 A
ppen
dix
2-B
, Site
and
Str
uctu
re D
raw
ings
With
Sam
ple
and
Surv
ey L
ocat
ions
Page
2-2
01

Ran
cho
Seco
Lic
ense
Ter
min
atio
n Pl
an
R
evis
ion
1 C
hapt
er 2
, Site
Cha
ract
eriz
atio
n
May
200
8 A
ppen
dix
2-B
, Site
and
Str
uctu
re D
raw
ings
With
Sam
ple
and
Surv
ey L
ocat
ions
Page
2-2
02

Ran
cho
Seco
Lic
ense
Ter
min
atio
n Pl
an
R
evis
ion
1 C
hapt
er 2
, Site
Cha
ract
eriz
atio
n
May
200
8 A
ppen
dix
2-B
, Site
and
Str
uctu
re D
raw
ings
With
Sam
ple
and
Surv
ey L
ocat
ions
Page
2-2
03

Ran
cho
Seco
Lic
ense
Ter
min
atio
n Pl
an
R
evis
ion
1 C
hapt
er 2
, Site
Cha
ract
eriz
atio
n
May
200
8 A
ppen
dix
2-B
, Site
and
Str
uctu
re D
raw
ings
With
Sam
ple
and
Surv
ey L
ocat
ions
Page
2-2
04

Ran
cho
Seco
Lic
ense
Ter
min
atio
n Pl
an
R
evis
ion
1 C
hapt
er 2
, Site
Cha
ract
eriz
atio
n
May
200
8 A
ppen
dix
2-B
, Site
and
Str
uctu
re D
raw
ings
With
Sam
ple
and
Surv
ey L
ocat
ions
Page
2-2
05

Ran
cho
Seco
Lic
ense
Ter
min
atio
n Pl
an
R
evis
ion
1 C
hapt
er 2
, Site
Cha
ract
eriz
atio
n
May
200
8 A
ppen
dix
2-B
, Site
and
Str
uctu
re D
raw
ings
With
Sam
ple
and
Surv
ey L
ocat
ions
Page
2-2
06

Ran
cho
Seco
Lic
ense
Ter
min
atio
n Pl
an
R
evis
ion
1 C
hapt
er 2
, Site
Cha
ract
eriz
atio
n
May
200
8 A
ppen
dix
2-B
, Site
and
Str
uctu
re D
raw
ings
With
Sam
ple
and
Surv
ey L
ocat
ions
Page
2-2
07
Ran
cho
Seco
Lic
ense
Ter
min
atio
n Pl
an
R
evis
ion
1 C
hapt
er 2
, Site
Cha
ract
eriz
atio
n
May
200
8 A
ppen
dix
2-B
, Site
and
Str
uctu
re D
raw
ings
With
Sam
ple
and
Surv
ey L
ocat
ions
Page
2-2
08

Ran
cho
Seco
Lic
ense
Ter
min
atio
n Pl
an
R
evis
ion
1 C
hapt
er 2
, Site
Cha
ract
eriz
atio
n
May
200
8 A
ppen
dix
2-B
, Site
and
Str
uctu
re D
raw
ings
With
Sam
ple
and
Surv
ey L
ocat
ions
Page
2-2
09

Ran
cho
Seco
Lic
ense
Ter
min
atio
n Pl
an
R
evis
ion
1 C
hapt
er 2
, Site
Cha
ract
eriz
atio
n
May
200
8 A
ppen
dix
2-B
, Site
and
Str
uctu
re D
raw
ings
With
Sam
ple
and
Surv
ey L
ocat
ions
Page
2-2
10

Ran
cho
Seco
Lic
ense
Ter
min
atio
n Pl
an
R
evis
ion
1 C
hapt
er 2
, Site
Cha
ract
eriz
atio
n
May
200
8 A
ppen
dix
2-B
, Site
and
Str
uctu
re D
raw
ings
With
Sam
ple
and
Surv
ey L
ocat
ions
Page
2-2
11

Ran
cho
Seco
Lic
ense
Ter
min
atio
n Pl
an
R
evis
ion
1 C
hapt
er 2
, Site
Cha
ract
eriz
atio
n
May
200
8 A
ppen
dix
2-B
, Site
and
Str
uctu
re D
raw
ings
With
Sam
ple
and
Surv
ey L
ocat
ions
Page
2-2
12

Ran
cho
Seco
Lic
ense
Ter
min
atio
n Pl
an
R
evis
ion
1 C
hapt
er 2
, Site
Cha
ract
eriz
atio
n
May
200
8 A
ppen
dix
2-B
, Site
and
Str
uctu
re D
raw
ings
With
Sam
ple
and
Surv
ey L
ocat
ions
Page
2-2
13

Ran
cho
Seco
Lic
ense
Ter
min
atio
n Pl
an
R
evis
ion
1 C
hapt
er 2
, Site
Cha
ract
eriz
atio
n
May
200
8 A
ppen
dix
2-B
, Site
and
Str
uctu
re D
raw
ings
With
Sam
ple
and
Surv
ey L
ocat
ions
Page
2-2
14

Ran
cho
Seco
Lic
ense
Ter
min
atio
n Pl
an
R
evis
ion
1 C
hapt
er 2
, Site
Cha
ract
eriz
atio
n
May
200
8 A
ppen
dix
2-B
, Site
and
Str
uctu
re D
raw
ings
With
Sam
ple
and
Surv
ey L
ocat
ions
Page
2-2
15

Ran
cho
Seco
Lic
ense
Ter
min
atio
n Pl
an
R
evis
ion
1 C
hapt
er 2
, Site
Cha
ract
eriz
atio
n
May
200
8 A
ppen
dix
2-B
, Site
and
Str
uctu
re D
raw
ings
With
Sam
ple
and
Surv
ey L
ocat
ions
Page
2-2
16

Ran
cho
Seco
Lic
ense
Ter
min
atio
n Pl
an
R
evis
ion
1 C
hapt
er 2
, Site
Cha
ract
eriz
atio
n
May
200
8 A
ppen
dix
2-B
, Site
and
Str
uctu
re D
raw
ings
With
Sam
ple
and
Surv
ey L
ocat
ions
Page
2-2
17

Ran
cho
Seco
Lic
ense
Ter
min
atio
n Pl
an
R
evis
ion
1 C
hapt
er 2
, Site
Cha
ract
eriz
atio
n
May
200
8 A
ppen
dix
2-B
, Site
and
Str
uctu
re D
raw
ings
With
Sam
ple
and
Surv
ey L
ocat
ions
Page
2-2
18

Ran
cho
Seco
Lic
ense
Ter
min
atio
n Pl
an
R
evis
ion
1 C
hapt
er 2
, Site
Cha
ract
eriz
atio
n
May
200
8 A
ppen
dix
2-B
, Site
and
Str
uctu
re D
raw
ings
With
Sam
ple
and
Surv
ey L
ocat
ions
Page
2-2
19

Ran
cho
Seco
Lic
ense
Ter
min
atio
n Pl
an
R
evis
ion
1 C
hapt
er 2
, Site
Cha
ract
eriz
atio
n
May
200
8 A
ppen
dix
2-B
, Site
and
Str
uctu
re D
raw
ings
With
Sam
ple
and
Surv
ey L
ocat
ions
Page
2-2
20

Ran
cho
Seco
Lic
ense
Ter
min
atio
n Pl
an
R
evis
ion
1 C
hapt
er 2
, Site
Cha
ract
eriz
atio
n
May
200
8 A
ppen
dix
2-B
, Site
and
Str
uctu
re D
raw
ings
With
Sam
ple
and
Surv
ey L
ocat
ions
Page
2-2
21