1
Racial/EthnicandIncomeDisparitiesforFamilyMealsinaPopulation‐BasedCohortofTwo‐YearOldChildren
By
Adiba M. Ali
A THESIS
Presented to the Department of Public Health and Preventative Medicine and the Oregon Health & Science University
School of Medicine in partial fulfillment of
the requirements for the degree of
Master of Public Health
May 2013

2
CertificationofApproval

3
TableofContentsRacial/Ethnic and Income Disparities for Family Meals in a Population‐Based Cohort of Two‐Year Old Children ......................................................................................................................... 1
Certification of Approval .............................................................................................................. 2
List of Tables ..................................................................................... Error! Bookmark not defined.
List of Abbreviations ........................................................................................................................ 6
Abstract ............................................................................................................................................ 7
Introduction ..................................................................................................................................... 9
Early Childhood Development ..................................................................................................... 9
Family Cohesion and Psychosocial Health ................................................................................. 10
Behavioral and Mental Health ................................................................................................... 10
Obesity ....................................................................................................................................... 11
Barriers to family meals ............................................................................................................. 12
Socioeconomic Disparities ......................................................................................................... 12
Significance ................................................................................................................................ 12
Methods ......................................................................................................................................... 14
Overview of PRAMS ................................................................................................................... 14
Human Subjects Protection ....................................................................................................... 15
Data Management ..................................................................................................................... 16
Variable Coding .......................................................................................................................... 16
Outcome Variable .................................................................................................................. 16
Predictor Variables ................................................................................................................. 17
Post‐hoc Power Analysis ............................................................................................................ 20
Statistical Analysis ...................................................................................................................... 20
Descriptive Statistics .................................................................................................................. 20
Univariate Analysis ..................................................................................................................... 21
Confounding Assessment ........................................................................................................... 21

4
Multivariate Analysis .................................................................................................................. 22
Multi‐Collinearity ....................................................................................................................... 23
Interactions ................................................................................................................................ 23
Results ............................................................................................................................................ 25
PRAMS‐2 Response Rate ............................................................................................................ 25
Family Meals Prevalence in Oregon ........................................................................................... 26
Univariate Analysis ..................................................................................................................... 27
Confounding Assessment ........................................................................................................... 31
Multivariate Analysis .................................................................................................................. 34
Sidebar: Selected Sub‐analyses .................................................................................................. 37
Maternal Employment ........................................................................................................... 37
Marital Status ......................................................................................................................... 39
Family Meals in Married Households .................................................................................... 42
Discussion ...................................................................................................................................... 45
Summary of Findings.................................................................................................................. 45
Comparison with Previous Findings ........................................................................................... 45
Family Meals Prevalence ....................................................................................................... 45
Race/Ethnicity ........................................................................................................................ 47
Socioeconomic Disparities ..................................................................................................... 50
Understanding the Disparities ............................................................................................... 55
Family Meals in the Popular Literature ..................................... Error! Bookmark not defined.
Strengths and Limitations .......................................................................................................... 56
Public Health Implications ......................................................................................................... 58
Future Research ......................................................................................................................... 59
5
TableofFiguresTable 1. Variable coding for outcome, primary predictors, and additional covariates, as derived from 2006‐2007 PRAMS‐2 or birth certificate files. ................................................................. 18
Table 2. Combined 2004 – 2005 PRAMS‐2 response rates ....................................................... 25
Table 3. Family Meals Categorizations and Frequency Distributions (PRAMS‐2) .................... 26
Table 4. Poverty status classification ..................................................................................... 28
Table 5. Univariate analysis of family meal frequency by demographic characteristics ......... 29
Table 6. Confounding Assessment on Family Meals and Race/Ethnicity ................................. 32
Table 7. Confounding Assessment on Family Meals and Poverty Status ................................. 33
Table 8. Multivariate analysis of family meal frequency by demographic characteristics ....... 36
Table 9. Sub‐analyses of Maternal Employment Status Categorizations ................................. 38
Table 10. Alternate analyses of marital status, derived from the birth certificate & PRAMS‐2 41
Table 11. Family Meals Sub‐analysis Restricted to Married Households ................................. 44
6
ListofAbbreviationsAI/AN American Indian / Alaska Native
CI Confidence Interval
CSHCN Children with Special Health Care Needs
FPL Federal Poverty Level
GOF Goodness‐of‐Fit
NH Non‐Hispanic
OR Odds Ratio
PI Pacific Islander
WIC Special Supplementary Nutrition Program for Women, Infants, and Children
7
AbstractBackground: Sharing family meals together is an important component of the family
environment that can influence early childhood development and protect against negative
health outcomes such as obesity, depression, and substance abuse. Routinely shared mealtime
can improve life‐style related health behaviors and enhance family cohesion. Previous research
on family meals has primarily been limited to Caucasian families with adolescents. While
socioeconomic disparities have been shown for adverse health outcomes, there is little research
exploring the demographic characteristics associated with sharing family meals. This study
estimates the prevalence of sharing family meals among Oregon families with two‐year old
children, and tests the hypothesis that race/ethnicity and poverty status are associated with
family meal frequency.
Methods: The Oregon Pregnancy Risk Assessment Monitoring System (PRAMS) is a population‐
based survey on experiences before, during and after pregnancy; PRAMS‐2 is a follow‐up survey
conducted when the child reaches 2 years of age. This study analyzes the PRAMS‐2 survey
responses of women who had live births in 2004 and 2005. The PRAMS‐2 survey asked, “Does
your family eat meals together?” Mothers who reported “always” or “usually” having family
meals were compared with those who reported “sometimes” or “never.” A multivariate logistic
regression model was developed using weighted survey techniques to evaluate the associations
between those who reported “always or usually” having family meals and multiple independent
variables.
Results: Of the 1,911 respondents to the 2007‐2008 PRAMS‐2 survey, 87.8% reported always or
usually having family meals together. In a multivariate model, race/ethnicity, poverty status,
and birth order were significantly associated with family meal frequency, after adjusting for

8
marital status, maternal age, and maternal employment. Compared to Non‐Hispanic (NH)
Whites, NH Blacks (adjusted odds ratio (ORa): 0.46; 95% confidence interval (CI): 0.27, 0.81),
Hispanics (ORa: 0.42; 95% CI: 0.26, 0.70), and NH Asians (ORa: 0.50; 95% CI: 0.31, 0.81) were less
likely to report always or usually having family meals. Mothers with a household income at or
above 100% of the Federal Poverty Level (ORa: 1.80; 95% CI: 1.02, 3.15), and more than one
child (ORa: 1.60; 95% CI: 1.02, 2.52) were more likely to report always or usually having family
meals together.
Discussion & Conclusions: Racial/ethnic and income disparities are highlighted among families
reporting eating meals together. Employment and marital status were not significant in the final
model but trends of increasing family meals were observed with having full‐time employment
and being married. These findings may reflect socioeconomic patterns of financial stress and
unstable home environments since racial/ethnic minorities may share similar economic
constraints. The stratified sampling design is a major strength of this study, allowing for
population‐based estimates. However, the analysis is limited due to the lack of precision in the
PRAMS‐2 survey question measuring family meal frequency, potentially contributing residual
confounding. This study explores the demographics characteristics of families with two‐year old
children who share meals together, and identifies disparities during early childhood that may
eventually influence adolescent health. These findings can guide public health policy and family‐
based interventions to help maintain a healthy family environment. Educational campaigns to
encourage family meals and address barriers may be targeted to high‐risk populations. Future
research is needed to quantify family meals frequency with precision, and further identify risk
factors and consequences of family routines.

9
IntroductionSharing a meal together with one’s family is an activity that has been cited for its numerous
benefits on a family’s development, health, and well being. Family meals have been linked with
outcomes such as reduced risk of obesity, depression, substance abuse. Studies have also linked
family meals with enhanced language development skills and academic achievement. Family
mealtime routines are increasingly attracting attention for its role as a protective factor for
diverse health‐related outcomes, ranging from the level of an individual child’s physical and
psychosocial well‐being, to the healthy functioning of a family 1.
EarlyChildhoodDevelopment
Families are social systems, and represent a key component in the social environment and
material setting for child development 2. The practice of family feeding can be considered a
routine social practice, since eating is embedded in social relations, and is an activity central to
family life. The routine family meal not only influences the development of eating patterns and
food preferences during early childhood, but as a component of the family environment, it plays
a vital role in a child’s physical and cognitive development. The early years of life are a critical
time to develop lifestyle, family and food preferences 3. Mealtime offers a natural opportunity
for parental influence 4. Routinely established shared family meals can provide repeated
exposure to proper mealtime behavior and healthy eating habits 3. Having a regular amount of
time dedicated to family meals can help children develop specific habits such as regular
healthful meal, or limited television viewing time. 5
10
FamilyCohesionandPsychosocialHealth
The family mealtime uniquely offers a regular window of focused time in which members of a
family can gather together. The benefits of the shared family meal, as reported in a survey by
parents of 10 year old children, include time for conversation, feeling of togetherness, shared
nutrition, and ceremony 6. In the same survey, parents also described challenges to family
meals such as meal planning, food preparation, and clean‐up. The combination of these
benefits and challenges provides an opportunity for family members to connect with each other,
as well as share responsibilities.
The protective effects of family meals on psychosocial and behavioral health have been
described to be mediated by family cohesion and communication 7. Recent studies have
emphasized that the extent of parental engagement with their children influences the effects of
family dinners 4. Learning is vital in the development of a child’s eating behavior, and parents
can serve as important role models in this process 8. Higher family functioning, as measured by
communication, closeness, problem solving ability, and behavioral control, was found to be
associated with more frequent family meals 9. Communication and cohesion within the family,
as well as the quality of the family meal environment, as determined by the presence of
competing activities and distractions, together can have an influence the protective effects of
shared mealtime.
BehavioralandMentalHealth
Many studies have shown that family meals are associated with better family cohesion, as well
as a reduction of behavioral problems. Among adolescents, additional mental health benefits of
family meals have been demonstrated, such as decreased depression and substance abuse 10.
Adolescents who reported being happy or being able to communicate with family have been

11
linked with lower risk of substance abuse 11. A combination of family connectedness, positive
family relationships, psychological health, and regular family meals have been shown to be
protective against eating disorders among adolescents 12.
Obesity
In addition to psychosocial health effects, family meals have also been shown to be protective
against obesity and weight‐related health, and disordered eating patterns 13. Family meals are
associated with beneficial effects on nutritional intake, and inversely related to childhood
obesity rates. Youth who eat with their families have reported more healthful diets 10. Family
functioning was shown to be associated with weight, dietary intake, and less sedentary
behavior, as well as being protective for adolescent weight and weight‐related health behaviors
9. Family meals have been shown to improve children’s life‐style related health behaviors. Such
behaviors include healthier dietary habits, with less consumption of soft drinks and more fruit
consumption.
Routine household activities may be promising behavioral targets for counseling. Studies
have shown that regular practices such as decreased screen time and increased sleep duration
are associated with more frequent family meals 14. These three household routines – family
meals, sleep, & screen time – together have been associated with a 40% reduction in obesity
among pre‐school aged children 15.
It is important to note that it is not simply the activity itself that promotes health at the
dinner table, but the family environment as well. The emotional climate created by the family
during meals can influence how young children become overweight 16. These aspects of the
family environment are of utmost concern, especially since early childhood obesity is a strong
predictor of adult obesity risk 8.
Comment [DP1]: do you want to specify the direction of the relationship s? you do say that family function ing (good functioning) is protective for adolescent weight (what does this mean—not being overweight or obese?) and weight‐related health behaviors. What about dietary intake—what is the direction—intake of healthful foods more likely with good functioning? Good functioning more likely with lower weight?...
12
Barrierstofamilymeals
Qualitative studies have identified several barriers that families face in conducting family meals.
Such barriers include child behavioral issues, developmental challenges, scheduling, and support
from the father/husband figure 17. Many families experience added strains in juggling shift jobs
and added transportation time between home and work. A focus group study highlighted some
of the major challenges that single mothers encounter in maintaining family routines. Child
behavior and mother’s fatigue were major barriers to maintaining activities such as bedtimes
and mealtimes at the same time everyday 18.
SocioeconomicDisparities
Most of the research on family meals in the current literature has been limited to Caucasian
populations 10. Few studies have examined racial/ethnic disparities and family meals 19. There is
substantial evidence demonstrating racial disparities in obesity rates. The relationship between
family food behavior and adolescent obesity may be affected by cultural / socioeconomic
differences 20. Such disparities have been demonstrated among pre‐school aged children 21.
Studies have also shown that low socioeconomic status, low education, and single‐parent‐
headed households are associated with substance misuse among school children 11.
Racial/ethnic disparities in health and health care are being investigated, however, studies of
disparities in children are rare, and less is known about racial/ethnic disparities among younger
children 22.
Significance
The role of family meals on early childhood development, and its protective effects against
adverse health outcomes, highlights the importance of protective factors during early childhood.
Comment [DP2]: What kind of behavior?
13
Family based intervention efforts early in life, such as routine family meals, have been
recommended by the surgeon general and the institute of medicine 2321. Family meals have
been associated with healthy psychosocial development, good nutritional habits, early
childhood, lower obesity rates, and reduced behavioral and mental health disorders. Assessing
potential disparities and barriers associated with maintaining routine family meals is critical in
order to implement effective interventions strategies to promote family meals. There is
evidence of racial/ethnic and income disparities in childhood obesity, as well as youth mental
and behavioral health outcomes. However, there is little evidence‐based research exploring the
risk factors for infrequent family meals. This study seeks to evaluate the associations between
family meal frequency and socioeconomic factors such as race/ethnicity, poverty status, and a
range of maternal characteristics, from a population‐based cohort of Oregon mothers with two‐
year old children. Specifically, the PRAMS‐2 survey will be used to assess the prevalence of
family meal frequency in Oregon, and evaluate the associations between family meal frequency
and socioeconomic factors. The specific aims of this study are:
1. Estimate the prevalence of frequent family meals among families with two‐year olds in
Oregon.
2. Evaluate the association between family meal frequency and race/ethnicity, poverty
status, and additional maternal demographic characteristics.
3. Develop a multivariate model to test the hypothesis that race/ethnicity and poverty
status are associated with family meal frequency.
Comment [DP3]: ?

14
MethodsOverviewofPRAMS
The Pregnancy Risk Assessment Monitoring System (PRAMS) is a population based surveillance
system designed to monitor selected maternal behaviors and experiences. The Centers for
Disease Control and Prevention (CDC) have run the PRAMS program since 1987, and Oregon
PRAMS began surveying in 1998. The Office of Family Health of the Oregon Department of
Human Services uses the data collection and analysis to support program development,
program evaluation, and policy‐making. Eligible PRAMS participants include Oregon resident
women who recently gave birth. PRAMS data are linked with the birth certificate registry,
providing additional demographic data. Beginning in 2004, cohorts of women were re‐
interviewed when their child was 2 years old in the follow‐up PRAMS‐2 survey. This study will
analyze PRAMS‐2 responses of women who had live births in 2004 and 2005, and were re‐
interviewed for the PRAMS‐2 survey in 2006 and 2007. Detailed methodology of PRAMS has
been previously described 24. The sampling design and weighting schemes will be briefly
described here.
The PRAMS surveillance system selects subjects every month from a sampling frame of
eligible birth certificates. The sampling frame includes Oregon women who gave birth within 2
to 6 months of the selection date, and a stratified random sample of women are selected for
interviewing. Women of racial/ethnic minorities (Hispanic, American Indian/Alaska Native,
Asian/Pacific Islander, and African American) are oversampled in order to obtain a sufficient
sample size for meaningful analysis of health issues related to race/ethnicity. Sampling rates are
based on derived population proportions. The survey is mailed to the selected subjects, and
15
those who don’t respond receive a second mailed survey and telephone calls to complete an
interview.
The survey responses are weighted before analysis in order to make the sample
representative of the population of Oregon women. Three weighting factors are applied to the
survey analysis: over‐sampling, non‐response, and non‐coverage. The over‐sampling
adjustment accounts for the design, and is the reciprocal of the sampling proportion. The non‐
response adjustment accounts for any potential selection bias among respondents. A regression
analysis is performed to determine which demographic characteristics are associated with non‐
respondents. The non‐response weight assumes that those who did not respond would have
provided answers that are similar to those respondents who shared their demographic
characteristics. Finally, the non‐coverage adjustment accounts for the possible exclusion of
eligible birth certificates or inclusion of ineligible birth certificates from the sampling frame. The
total list of birth certificates issued that year is compared with those that were included in the
sampling frame. The final weight is the product of these three weights, and is applied to the
entire dataset for all analyses.
HumanSubjectsProtection
This study is a secondary data analysis using de‐identified data. A data‐use request was granted
by the Oregon Public Health Division, Center for Health Statistics Researchers’ Review
Committee. Permission to access PRAMS 2004‐2005 and corresponding PRAMS‐2 datasets was
granted. The Oregon PRAMS database confidentiality guidelines were assessed and the PRAMS
data sharing agreement was signed. The study protocol was submitted to the OHSU
Institutional Review Board for determination (IRB00007704). The IRB determined that the

16
proposed activity is not human subject research because it “does not meet the definition of
human subject per 45 CFR 46.102(f).”
DataManagement
Oregon Public Health Division maintains responsibility for data collection, cleaning, and
management. Upon submission of the PRAMS data sharing agreement, the complete database
containing merged and de‐identified data was obtained, along with the corresponding data
dictionaries and original surveys. The database comprises three merged datasets in STATA
format, including the 2004‐2005 PRAMS survey responses, the corresponding data from the
Oregon Birth Certificate files, and the subsequent 2006‐2007 PRAMS‐2 survey responses.
Identifiable data, including names, dates, addresses, county of residence, and actual birth
weights, were removed from the file. The final weights for analysis were already computed and
included in the provided database.
VariableCoding
The variables analyzed for this study were derived from the PRAMS‐2 dataset and the birth
certificate registry. The outcome variable of interest, the primary predictors, and additional
covariates considered for the analysis are described in detail below.
OutcomeVariableThe outcome variable of interest is “Family Meals Frequency”, as measured by the question in
PRAMS‐2, “Does your family eat meals together?” There were four possible responses including
“always,” “usually,” “sometimes,” or “never.” A literature review on family meal frequency was
performed to determine the optimal categorization of the PRAMS‐2 family meal variable. Most
studies found associations between diverse health outcomes and sharing meals at least 4 times
per week. Other studies restricted analyses to sharing meals 5 to 7 days per week. Some studies
17
asked about the number of meals per week, and analyzed the number of meals as a continuous
variable in a multiple linear regression model. Since most studies in the literature did not restrict
analysis to “every day” or “always”, the decision was made to dichotomize the PRAMS‐2 family
meals responses into “always or usually” and “sometimes or never.” There were 1,911
completed PRAMS‐2 surveys, and 36 respondents answered either “don’t know” or did not
answer the question. The remaining 1875 respondents were included for analysis.
PredictorVariablesThis study evaluates family meal frequency with two primary predictors: race/ethnicity and
poverty status. Race/ethnicity data is collected from the birth certificate files, and is analyzed as
five categories: Non‐Hispanic (NH) White, Hispanic, NH Black, NH American Indian/Alaska Native
(AI/AN), NH Asian/Pacific Islander (PI). Poverty status is derived from responses to the annual
household income question in the PRAMS‐2 survey and the poverty guidelines issued in the
annual Federal Register by the Department of Health and Human Services 25‐27. In this analysis,
poverty status is reported as a percentage of the federal poverty level (FPL), as computed using
the 2006‐2007 poverty guidelines.
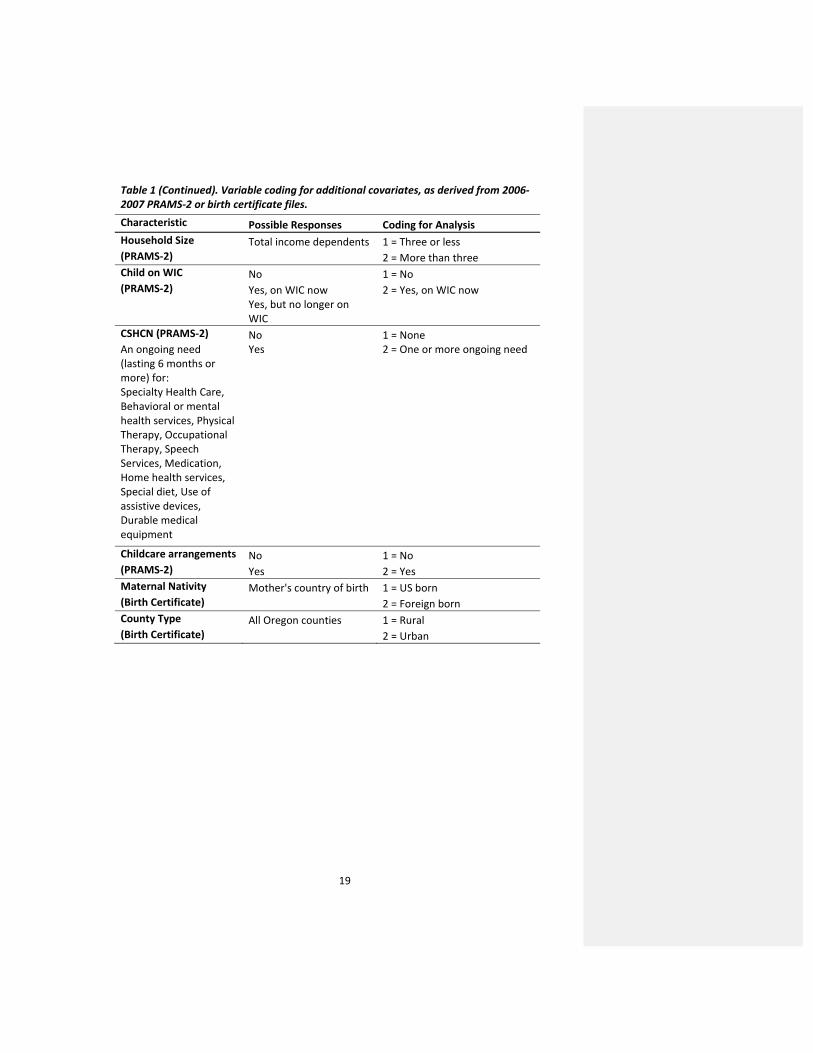
Several additional predictor variables were considered in the analysis of family meal
frequency. These variables include maternal age, education, marital status, employment status,
nativity, household size, birth order, county type, having childcare arrangements, having a
special needs child, and whether the child has ever been enrolled in the Special Supplemental
Nutrition Program for Women, Infants, and Children (WIC). These characteristics were selected
based on scientific relevance in the literature, and were derived from either the 2006‐2007
PRAMS‐2 survey or the birth certificate files. Each of these variables is described in detail in
Table 1.

18
Table 1. Variable coding for outcome, primary predictors, and additional covariates, as derived from 2006‐2007 PRAMS‐2 or birth certificate files. Characteristic Possible Responses Coding for Analysis Family Meals Frequency Always 1 = Always or Usually (PRAMS‐2) Usually 2 = Sometimes or Never Sometimes Never Maternal Race/Ethnicity
Race: White, Black, Indian, Chinese, Japanese, Hawaiian, Filipino, Other Asian or Pacific Islander Ethnicity: Non‐Hispanic, Mexican, Puerto Rican, Cuban, Central or South American, Other Hispanic
1 = Non‐Hispanic (NH) White (Birth Certificate) 2 = Hispanic 3 = NH Black 4 = NH American Indian /
Alaska Native 5 = NH Asian / Pacific
Islander Poverty Status Less than $10,000 1 = Less than 100% FPL (PRAMS‐2) $10,000 to $14,999 2 = 100% FPL or higher $15,000 to $19,999 $20,000 to $24,999 $25,000 to $29,999 $30,000 to $34,999 $35,000 to $49,999 $50,000 or more Maternal Age Date of birth 1 = younger than 25 years (PRAMS‐2) 2 = 25 to 34 years 3 = older than 34 years Maternal Education Less than 12th grade 1 = Less than 12 grade (PRAMS‐2) 12th grade or GED 2 = 12th grade More than 12th grade 3 = More than 12th grade Marital Status Never Married 1 = Married (PRAMS‐2) Married 2 = Not Married Widowed Divorced Separated Birth Order Number of live births living 1 = one (Birth Certificate) 2 = more than one Maternal Employment Yes, full time 1 = Full time or part time Status Yes, Part time 2 = Unemployed (PRAMS‐2) No, but I am looking for
work No, I am not looking for
work
19
Table 1 (Continued). Variable coding for additional covariates, as derived from 2006‐2007 PRAMS‐2 or birth certificate files. Characteristic Possible Responses Coding for Analysis Household Size Total income dependents 1 = Three or less (PRAMS‐2) 2 = More than three Child on WIC No 1 = No (PRAMS‐2) Yes, on WIC now 2 = Yes, on WIC now Yes, but no longer on
WIC CSHCN (PRAMS‐2) No 1 = None An ongoing need (lasting 6 months or more) for:
Yes 2 = One or more ongoing need
Specialty Health Care, Behavioral or mental health services, Physical Therapy, Occupational Therapy, Speech Services, Medication, Home health services, Special diet, Use of assistive devices, Durable medical equipment
Childcare arrangements No 1 = No (PRAMS‐2) Yes 2 = Yes Maternal Nativity Mother's country of birth 1 = US born (Birth Certificate) 2 = Foreign born County Type All Oregon counties 1 = Rural (Birth Certificate) 2 = Urban
20
Post‐hocPowerAnalysis
A crude post‐hoc power analysis was performed in order to determine the smallest odds ratio
that can be detected in order to achieve a power of 0.80 at an alpha level of 0.05. The power
analysis software, G*Power 3.1 was used for this calculation 28. Assuming normal distribution of
the predictor variables, a sample of 1,875 family meal responses has 80% power to detect a
minimum odds ratio of 1.23.
StatisticalAnalysis
The objectives of this study are to estimate the prevalence of frequent family meals and test the
hypotheses that race/ethnicity and poverty status are associated with family meal frequency.
Data from the 2006 & 2007 PRAMS‐2 cohort are combined and used for this analysis. All
analyses are weighted for over‐sampling, non‐response, and non‐coverage using STATA 11.1.
DescriptiveStatistics
Descriptive statistics were computed for each variable considered for analysis, including the
outcome variable, primary predictors, and additional covariates. The prevalence estimate of
family meals frequency in Oregon was computed using the weighted percentages of “always or
usually” having family meals. The frequency distribution of each variable was examined in each
of the possible responses described in Table 1. One‐way tabulations were used to examine the
number of unweighted observations and weighted percentages for each category of the
variables. Based on these distributions, and evidence cited in the literature, the variable coding
most appropriate for this analysis was determined.
Comment [DP4]: What do you mean by post‐hoc here?
Comment [DP5]: Most if not all of your predictors are categorical not continuous—so it doesn’t make sense to assume normality. We should do another (simpler) calculation based on the main categorical predictors.
Comment [DP6]: Not sure what this sentence means.
21
UnivariateAnalysis
The relationship between family meal frequency and each of the primary predictors and
covariates considered in this study was examined using weighted two‐way tabulations. The
unweighted number of observations in each cell was reviewed to verify that cell counts were
sufficient for further analysis. The weighted percentage of always or usually having family meals
was computed for each level of the predictor variables, and the chi‐squared test statistics were
evaluated for each pair. Simple logistic regression models were built to further characterize the
univariate associations between the dichotomous family meal frequency variable and each
predictor variable. The weighted bivariate odds ratio for each predictor was computed for each
simple model. The strength of the statistical association of each univariate model, combined
with the clinical importance of each characteristic, was carefully assessed for inclusion into a
multivariate logistic regression model. Covariates with no independent associations with family
meal frequency, and weak evidence of what? cited in the literature, were excluded from
consideration of the multivariate model.
ConfoundingAssessment
The primary predictors for family meal frequency evaluated in this study are race/ethnicity and
poverty status. In order to identify confounding factors of the relationship between family meal
frequency and each of the primary predictors, the associations between each potential
confounder and primary predictor were examined in detail. Covariates were considered for
confounding assessment if they were independently associated with family meal frequency in
the simple logistic regression model, and significantly associated with either of the two primary
predictors as demonstrated by the strength of chi‐squared test statistics. Covariates that lie on
the causal pathway between the primary predictor and family meal frequency were excluded
Comment [DP7]: Just checking that you meant ‘and’ here not ‘or’?
22
from the assessment. Each potential confounder was added separately to the simple logistic
regression models of either race/ethnicity on family meals or poverty status on family meals.
The point estimates of each simple model were compared with the model including the
potential confounder. Covariates that affected any of the levels of the primary relationships by
more than 10% were considered confounders.
MultivariateAnalysis
The multivariate model developed for this study tested the hypothesis that race/ethnicity and
poverty status are significantly associated with family meal frequency. The model building
procedure was manually implemented, since the automated step‐wise STATA functions are not
applicable to weighted survey data. A backwards stepwise regression approach was adopted to
ensure that potentially important characteristics are not prematurely excluded from the model.
Variables incorporated into the initial multivariable modeling step were selected based on
scientific relevance, and results of the univariate and confounding analyses. Subsequently,
variables were eliminated from the model in an iterative process.
Decisions to add or remove variables from the model were based on several criteria,
including the significance of each variable, as well as the overall model. In addition, model
assessment tools were employed to evaluate the overall fit of each iterative model. For this
study, the Goodness‐of‐Fit (GOF) test served as the primary model assessment tool. A non‐
significant GOF statistic indicated that the model prediction does not significantly differ from the
observed 29. There are several other assessment tools that are not applicable to this study, such
as the pseudo‐R‐squared, and the AIC/BIC (Akaike/Bayesian information criterion). These
criteria are based on maximum likelihood estimation, which assumes that observations are

23
independently and identically distributed. This assumption is not met in the case of weighted
survey data since sampling weights and strata are specified with survey estimators.
Multi‐Collinearity
Multi‐collinearity was evaluated with the variance inflation factor (VIF) for each predictor
variable considered for the model to identify characteristics too strongly correlated with each
other. Since the post‐estimation command “estat vif” is not applicable for survey data, the VIF
was computed manually as the inverse of the tolerance (1‐R‐squared) for each set of predictors.
Linear regressions were run separately, with each predictor set as the “dependent” variable, and
the remaining predictor variables set as the “independent” variable. The VIF values for each
predictor were compared to determine the extent to which each predictor variable’s effect was
independent of the other predictors considered for the model. Variables that demonstrated
relatively high multi‐collinearity were subsequently removed from the model.
Interactions
Interactions between the two primary predictors, race/ethnicity and poverty status were tested
in the multivariate model. This particular interaction test was selected because many studies in
the literature examining the socioeconomic disparities of health outcomes related to individual
behavior and family structure have cited statistical interactions between race/ethnicity and
income 30‐33. The interaction was evaluated in the full model, and entered as a multiplicative
term. The overall significance of the interaction term was tested at the 0.05 alpha level, and
considered for inclusion into the final model.
The final multivariate model developed for this study includes carefully selected predictor
variables that contribute to the overall fit and significance of the model, while offering a
parsimonious yet meaningful interpretation of family meals.
Comment [DP8]: Maximum likelihood does not assume observations are independent.. I do’t know what the issues are with survey data,. Perhaps just delete tehse two sentecnes.
Comment [DP9]: Somewhat vague, so want to make sure that the decisions are clearly described in results section.

24

25
ResultsPRAMS‐2ResponseRate
This study analyzed data from the 2004‐2005 Oregon PRAMS birth year cohort. Over the course
of two years, 5,620 mothers were sampled for the initial PRAMS survey, and 3,883 women
responded back to PRAMS. This cohort was followed in time and re‐sampled two years later for
the PRAMS‐2 survey. Of the original 2004‐2005 birth cohort, 1,911 women responded in 2006‐
2007 to the PRAMS‐2 survey. The PRAMS‐2 weighted response rate is computed as the ratio
between the weighted number of PRAMS‐2 respondents and the total weighted number of
women who were sampled in the original PRAMS survey, as outlined in Table 2 below. This
yields a combined 2004‐2005 PRAMS‐2 response rate of 43.5%.
Table 2. Combined 2004 – 2005 PRAMS‐2 response rates
Weighted Response Rates 2004 Birth Year
Cohort 2005 Birth Year Cohort
Combined 2004 & 2005 Birth Year Cohort
Total PRAMS sample 2,814 2,806 5,620
Total PRAMS‐2 sample (PRAMS participants) 1,968 1,915 3,883
PRAMS‐2 Respondents 865 1,046 1,911
Weighted PRAMS denominator 43,641 43,815 87,456
Weighted PRAMS‐2 respondents
17,131 20,888 38,019
Weighted Response 17,131/43,641
39.3%
20,888/43,815
47.7%
38,019/87,456
43.5%
�

26
FamilyMealsPrevalenceinOregon
The frequency distribution of the outcome variable, family meal frequency is shown below in
Table 3. Of the 1,911 women who responded to the 2006‐2007 PRAMS‐2 survey, 1,875 women
answered the question “Does your family eat meals together?” Based on evidence available in
the literature, the decision was made to dichotomize family meal frequency to compare the
demographic characteristics of mothers who reported “always” or “usually” having family
meals, versus “sometimes” or “never” having family meals. Among families with two‐year old
children in Oregon in 2006 and 2007, an estimated 87.8% of mothers reported always or usually
having family meals together.
Table 3. Family Meals Categorizations and Frequency Distributions (PRAMS‐2)
Category na %b Category na %b
Always 852 45.1% Always or Usually 1596 87.8%Usually 744 41.5%
Sometimes 272 11.6%
Never 7 0.5%
Sometimes or Never 279 12.2%Don't
Know 17 0.3%
Missing 19 1.1%
Total 1911 100.0% Total 1875 100.0% a Unweighted number of respondents; b Weighted percentage
27
UnivariateAnalysis
The primary predictors, maternal race/ethnicity, and poverty status, were initially evaluated for
their associations with family meals. In the univariate analysis, both maternal race/ethnicity (p <
0.001) and poverty status (p = 0.002) were significantly associated with always or usually having
family meals. The maternal race/ethnicity analysis revealed that compared to Non‐Hispanic
Whites, Hispanics, NH Blacks, NH American Indian/Alaska Native, NH Asian/Pacific Islanders
were significantly less likely to report always or usually having family meals together.
The frequency distribution for poverty status was assessed in order determined the most
relevant and appropriate analysis levels. Initially, five levels of poverty status were considered:
less than 50% FPL, 50‐99% FPL, 100‐199% FPL, 200‐299% FPL, and 300% FPL or more. The family
meals prevalence estimates and family meals univariate associations for each of these five levels
were carefully examined. The observed prevalence estimates indicated a divergence of the
outcome at 100% FPL. Therefore, the decision was made to collapse this variable into two
categories: Less than 100% FPL versus 100% FPL or more. This classification scheme revealed
that compared to families living below the federal poverty level, those living at or above 100% of
the federal poverty level are significantly more likely to report always or usually having family
meals together (Table 4).

28
Table 4. Poverty status classification Poverty Status
Classifications na Always‐Usually Family Mealsb
Unadjusted OR (95 % CI)
Poverty Status (5 levels) Less than 50% FPL 253 81.8% Referent 50 to 99% FPL 246 80.1% 0.90 (0.48, 1.68) 100 to 199% FPL 394 89.6% 1.92 (1.02, 3.61) 200 to 299% FPL 467 90.8% 2.19 (1.18, 4.03) 300% FPL or higher 368 92.1% 2.58 (1.34, 4.95) Poverty Status (2 Levels)* Less than 100% FPL 504 81.2% Referent 100% FPL or higher 1229 90.7% 2.27 (1.50, 3.44)
a Unweighted number of respondents; b Weighted percentage of those reporting always or usually having family meals, excluding those who did not respond or responded that they did not know *Categorization used in the multivariate model
Several additional characteristics were evaluated for their univariate associations with family
meals. Covariates significantly associated with family meals at an alpha level of 0.05 include
maternal education, marital status, birth order, currently being on WIC, and maternal nativity.
The univariate association between maternal employment status and family meals was
significant at an alpha level of 0.25. Covariates that were not associated with family meals
include maternal age, household size, having a child with special health care needs, having
childcare arrangements, and county type.
Comment [DP10]: Why pick 0.25? Could just report pvalue.

29
Table 5. Univariate analysis of family meal frequency by demographic characteristics
Characteristic na Always‐Usually Family Mealsb Unadjusted OR (95 % CI)
Total 1,875 87.8% ‐‐ Maternal Race/Ethnicity Adjusted Wald Test ‐‐ ‐‐ p = 0.0001 NH White 823 90.6% Referent Hispanic 359 79.7% 0.41 (0.27, 0.61) NH Black 187 78.0% 0.37 (0.23, 0.59) NH AI/AN 217 85.1% 0.59 (0.36, 0.97) NH Asian/PI 283 83.7% 0.53 (0.34, 0.84) Other/Missing 6 ‐‐ ‐‐ Poverty Status Adjusted Wald Test ‐‐ ‐‐ p = 0.0001 Less than 100% FPL 504 81.2% Referent 100% FPL or higher 1229 90.7% 2.27 (1.50, 3.44) Don't Know/Missing 142 ‐‐ ‐‐ Maternal Age Adjusted Wald Test ‐‐ ‐‐ p = 0.6491 Less than 25 years 349 85.7% Referent 25 to 34 years 991 88.5% 1.26 (0.75, 2.11) 34 years or older 535 88.3% 1.25 (0.72, 2.21) Maternal Education Adjusted Wald Test ‐‐ ‐‐ p = 0.0007 Less than 12 grade 270 79.6% Referent 12 grade 410 85.8% 1.56 (0.9, 2.68) Higher than 12 grade 1187 90.4% 2.4 (1.5, 3.8) Don't Know/Missing 8 ‐‐ ‐‐ Marital Status Adjusted Wald Test ‐‐ ‐‐ p = 0.0102 Married 1387 89.4% Referent Not Married 482 82.9% 0.58 (0.38, 0.88) missing 6 ‐‐ ‐‐ Maternal Employment Status Adjusted Wald Test ‐‐ ‐‐ p = 0.1782 Full time or part time 1033 86.5% Referent Unemployed 830 89.3% 1.31 (0.88, 1.94) Don't Know/Missing 12 ‐‐ ‐‐
Comment [DP11]: What do you mean by adjusted wald test in the table (have both adjusted and unadjusted analyses in various tables)?
30
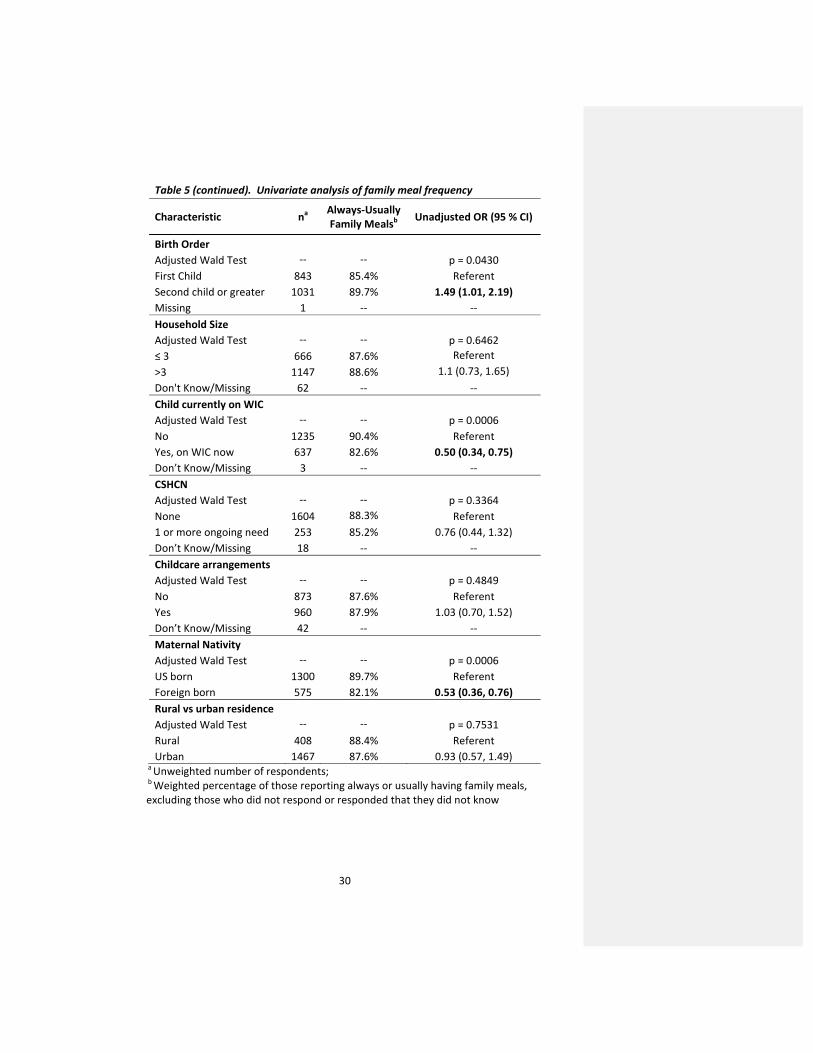
Table 5 (continued). Univariate analysis of family meal frequency
Characteristic na Always‐Usually Family Mealsb Unadjusted OR (95 % CI)
Birth Order Adjusted Wald Test ‐‐ ‐‐ p = 0.0430 First Child 843 85.4% Referent Second child or greater 1031 89.7% 1.49 (1.01, 2.19) Missing 1 ‐‐ ‐‐ Household Size Adjusted Wald Test ‐‐ ‐‐ p = 0.6462 ≤ 3 666 87.6% Referent >3 1147 88.6% 1.1 (0.73, 1.65) Don't Know/Missing 62 ‐‐ ‐‐ Child currently on WIC Adjusted Wald Test ‐‐ ‐‐ p = 0.0006 No 1235 90.4% Referent Yes, on WIC now 637 82.6% 0.50 (0.34, 0.75) Don’t Know/Missing 3 ‐‐ ‐‐ CSHCN Adjusted Wald Test ‐‐ ‐‐ p = 0.3364 None 1604 88.3% Referent 1 or more ongoing need 253 85.2% 0.76 (0.44, 1.32) Don’t Know/Missing 18 ‐‐ ‐‐ Childcare arrangements Adjusted Wald Test ‐‐ ‐‐ p = 0.4849 No 873 87.6% Referent Yes 960 87.9% 1.03 (0.70, 1.52) Don’t Know/Missing 42 ‐‐ ‐‐ Maternal Nativity Adjusted Wald Test ‐‐ ‐‐ p = 0.0006 US born 1300 89.7% Referent Foreign born 575 82.1% 0.53 (0.36, 0.76) Rural vs urban residence Adjusted Wald Test ‐‐ ‐‐ p = 0.7531 Rural 408 88.4% Referent Urban 1467 87.6% 0.93 (0.57, 1.49)
a Unweighted number of respondents; b Weighted percentage of those reporting always or usually having family meals, excluding those who did not respond or responded that they did not know

31
ConfoundingAssessment
Potential confounders of the relationship between family meal frequency and the primary
predictors, race/ethnicity and poverty status, were assessed separately. Covariates included in
the assessment were associated with both the outcome (family meals) and the primary
predictor (either race/ethnicity or poverty status), and did not lie on the causal pathway. For
each assessment, the univariate logistic regression model of family meals and each primary
predictor was compared with the models including each additional covariate.
The univariate model of race/ethnicity on family meals was compared separately with five
additional models including the covariates: maternal education, marital status, birth order,
being on WIC, and maternal nativity. The associations of at least one race/ethnicity group and
family meals changed by more than 10% when maternal education, marital status, or having a
child on WIC was added to the univariate model.
The associations of one or more poverty level with family meals changed by 10% or more
when maternal education, marital status, or maternal nativity were added to the univariate
model. Birth order was not associated with poverty status; therefore it was not included in the
analysis. Having a child currently on WIC was not evaluated as a confounder of poverty status as
it is likely to lie on the causal pathway since these two variables are very closely related.
The results of the confounding assessment were incorporated into the multivariate model
building process to account for any potential systematic error in the final predictive model. The
changes observed with each potential confounder are summarized below in Table 6 (for
race/ethnicity) and Table 7 (for poverty status).

32
Table 6. Confounding Assessment on Family Meals and Race/Ethnicity Family Meals Model on Race/ Ethnicity + Potential Confounder OR (95% CI) p‐value % change OR
Simple Model: Race/Ethnicity NH White Referent ‐‐ ‐‐ Hispanic 0.41 (0.27, 0.61) <0.001 Referent NH Black 0.37 (0.23, 0.59) <0.001 Referent NH AI/AN 0.59 (0.36, 0.97) 0.038 Referent NH Asian/PI 0.53 (0.34, 0.84) 0.007 Referent Model 1: Race/Ethnicity + Education NH White Referent ‐‐ ‐‐ Hispanic 0.49 (0.31, 0.79) 0.003 20% NH Black 0.38 (0.24, 0.62) <0.001 3% NH AI/AN 0.62 (0.37, 1.03) 0.064 5% NH Asian/PI 0.52 (0.33, 0.83) 0.006 ‐2% Model 2: Race/Ethnicity + Marital Status NH White Referent ‐‐ ‐‐ Hispanic 0.43 (0.29, 0.67) <0.001 5% NH Black 0.43 (0.26, 0.74) 0.002 16% NH AI/AN 0.66 (0.39, 1.11) 0.114 12% NH Asian/PI 0.51 (0.32, 0.81) 0.004 ‐4% Model 3: Race/Ethnicity + Birth Order NH White Referent ‐‐ ‐‐ Hispanic 0.39 (0.26, 0.59) <0.001 ‐5% NH Black 0.36 (0.22, 0.59) <0.001 ‐3% NH AI/AN 0.59(0.36, 0.97) 0.037 0% NH Asian/PI 0.52 (0.33, 0.83) 0.006 ‐2% Model 4: Race/Ethnicity + Child on WIC NH White Referent ‐‐ ‐‐ Hispanic 0.50 (0.31, 0.80) 0.004 22% NH Black 0.40 (0.24, 0.66) <0.001 8% NH AI/AN 0.63 (0.38, 1.06) 0.081 7% NH Asian/PI 0.52 (0.33, 0.82) 0.005 ‐2% Model 5: Race/Ethnicity + Maternal Nativity NH White Referent ‐‐ ‐‐ Hispanic 0.44 (0.28, 0.70) 0.001 7% NH Black 0.37 (0.23, 0.60) <0.001 0% NH AI/AN 0.58 (0.35, 0.97) 0.036 ‐2% NH Asian/PI 0.58 (0.35, 0.95) 0.03 9%

33
Table 7. Confounding Assessment on Family Meals and Poverty Status Family Meals Model on Poverty Status + Potential Confounder OR (95% CI) p‐
value % change
OR Simple Model: Poverty Status Less than 100% FPL Referent ‐‐ ‐‐ 100% FPL or higher 2.27 (1.50, 3.44) 0.0001 Referent Model 1: Poverty Status + Education Less than 100% FPL Referent ‐‐ ‐‐ 100% FPL or higher 1.91 (1.15, 3.17) 0.0120 ‐16% Model 2: Poverty Status + Marital Status Less than 100% FPL Referent ‐‐ ‐‐ 100% FPL or higher 1.90 (1.17, 3.09) 0.0100 ‐16% Model 3: Poverty Status + Maternal Nativity Less than 100% FPL Referent ‐‐ ‐‐ 100% FPL or higher 2.01 (1.30, 3.09) 0.0016 ‐11%
�

34
MultivariateAnalysis
A backwards model building approach was adopted during the initial stage of the multivariate
analysis. All scientifically relevant variables described in Table 1 of the Methods section were
considered as candidates for the full model. The primary predictors, race/ethnicity and poverty
status, remained in the multivariate model regardless of the statistical criteria, since the specific
aims of this study are to test these two particular associations. Of the additional covariates,
household size, having a child with special health care needs, having childcare arrangements,
and county type were excluded from further analysis since the univariate associations with
family meals were not significant at an alpha level of 0.25. Although maternal age did not meet
the 0.25 level of significance with family meals, it remained as a candidate for inclusion in the
full model, since age is an important demographic variable routinely adjusted for in
epidemiological research.
In the first iteration of the model building process, the primary predictors, race/ethnicity and
poverty status, along with the remaining seven covariates, maternal age, education, marital
status, birth order, employment status, maternal nativity, and whether the child was currently
on WIC, were entered into the model. Although the overall model was significant, the
goodness‐of‐fit test revealed a lack of fit. Each covariate was carefully re‐examined for its
adjusted association with family meals and potential multi‐collinearity. Maternal nativity,
education, and having a child on WIC demonstrated weak adjusted associations with family
meals and had relatively high variation inflation factors (VIF). A sub‐analysis of maternal nativity
with race/ethnicity revealed a strong correlation, with over 90% of Whites being US born, and
almost 80% of Hispanics and Asian/Pacific Islanders being foreign born. Similarly, maternal
education and being on WIC was significantly associated with both race/ethnicity and poverty
status, as expected. Based on these evaluations, the decision was made to remove the variables

35
education, nativity, and WIC from the model. The resulting multivariate model was
characterized by an overall significance and a good model fit.
The full model was subsequently tested for an interaction between the two primary
predictors, race/ethnicity and poverty status. The multiplicative term was entered into the
multivariate model, however, the adjusted Wald test revealed that the overall term is not
statistically significant at the 0.05 alpha level (p = 0.5721). Therefore, the interaction term was
not considered for inclusion in the final model.
The final model developed for family meal frequency in this study includes race/ethnicity,
poverty status, age, marital status, birth order, and maternal employment. Race/ethnicity
remains the strongest demographic predictor of family meal frequency (p‐value = 0.0044).
Compared to NH Whites, Hispanics (adjusted OR (ORa): 0.42; 95% Confidence interval (CI): 0.26,
0.70), NH Blacks (ORa: 0.46; 95% CI: 0.27, 0.81), and NH Asians/Pacific Islanders (ORa: 0.50; 95%
CI: 0.31, 0.81), were about half as likely to report always or usually having family meals together.
Poverty status is also significantly associated with family meals in the final model (p = 0.0415).
That is, those living at 100% of the federal poverty level or higher more likely to report sharing
family meals than those living below 100% of the federal poverty level (ORa: 1.80; 95% CI: 1.02,
3.15).
Among the additional covariates included in the final model, only birth order remains
significant (p = 0.0407). Mothers with more than one child were more likely to report always or
usually having family meals (ORa: 1.60; 95% CI: 1.02, 2.52). Maternal age, marital status, and
maternal employment status were not significant in the final model, but were kept in the final
model as they are often cited in literature as important characteristics related to family routines
and health disparities. The results of the final model are presented below in Table 8.
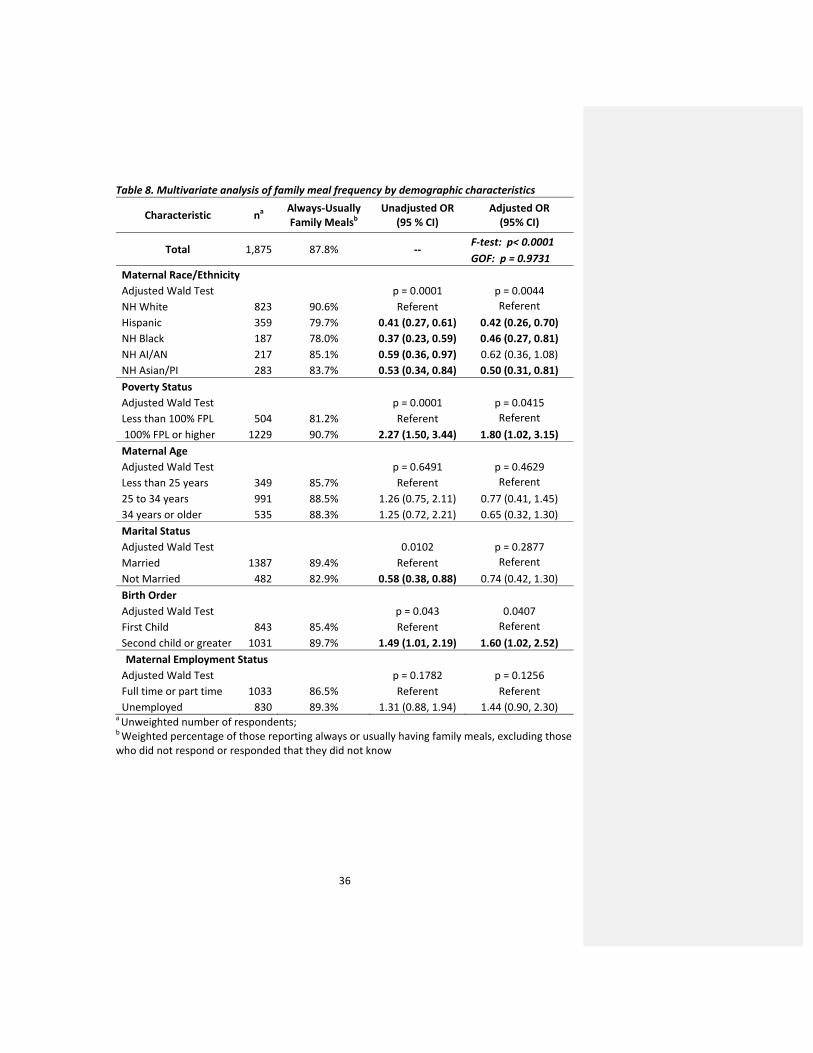
36
Table 8. Multivariate analysis of family meal frequency by demographic characteristics
Characteristic na Always‐Usually Family Mealsb
Unadjusted OR (95 % CI)
Adjusted OR (95% CI)
Total 1,875 87.8% ‐‐ F‐test: p< 0.0001 GOF: p = 0.9731
Maternal Race/Ethnicity Adjusted Wald Test p = 0.0001 p = 0.0044 NH White 823 90.6% Referent Referent Hispanic 359 79.7% 0.41 (0.27, 0.61) 0.42 (0.26, 0.70) NH Black 187 78.0% 0.37 (0.23, 0.59) 0.46 (0.27, 0.81) NH AI/AN 217 85.1% 0.59 (0.36, 0.97) 0.62 (0.36, 1.08) NH Asian/PI 283 83.7% 0.53 (0.34, 0.84) 0.50 (0.31, 0.81) Poverty Status Adjusted Wald Test p = 0.0001 p = 0.0415 Less than 100% FPL 504 81.2% Referent Referent 100% FPL or higher 1229 90.7% 2.27 (1.50, 3.44) 1.80 (1.02, 3.15) Maternal Age Adjusted Wald Test p = 0.6491 p = 0.4629 Less than 25 years 349 85.7% Referent Referent 25 to 34 years 991 88.5% 1.26 (0.75, 2.11) 0.77 (0.41, 1.45) 34 years or older 535 88.3% 1.25 (0.72, 2.21) 0.65 (0.32, 1.30) Marital Status Adjusted Wald Test 0.0102 p = 0.2877 Married 1387 89.4% Referent Referent Not Married 482 82.9% 0.58 (0.38, 0.88) 0.74 (0.42, 1.30) Birth Order Adjusted Wald Test p = 0.043 0.0407 First Child 843 85.4% Referent Referent Second child or greater 1031 89.7% 1.49 (1.01, 2.19) 1.60 (1.02, 2.52) Maternal Employment Status Adjusted Wald Test p = 0.1782 p = 0.1256 Full time or part time 1033 86.5% Referent Referent Unemployed 830 89.3% 1.31 (0.88, 1.94) 1.44 (0.90, 2.30)
a Unweighted number of respondents; b Weighted percentage of those reporting always or usually having family meals, excluding those who did not respond or responded that they did not know

37
Sidebar:SelectedSub‐analyses
A sub‐analysis of selected variables in the final model was done in order to better understand
the associations observed in the final multivariate model. Although maternal employment and
marital status are important predictors of family routines as cited in the literature, these
characteristics were not significant in final model presented in this study. In order to better
understand the observed associations, and potentially identify forms of residual confounding,
these variables were re‐examined. These sub‐analyses are described in detail below.
MaternalEmployment
As described in the variable coding table above, maternal employment status was derived from
the PRAMS‐2 survey question, “Are you employed?” to which mothers responded with one of
the following responses: “Yes, full time”, “Yes, part time”, “No, but I am looking for work”, or
“No, I am not looking for work.” For the purposes of this study, the employment variable was
dichotomized such that mothers who were unemployed were compared with those who were
working either full time or part time. Although maternal employment status was not significant
in the final model presented in this study, the categorizations were further explored to better
understand how the constructs of employment status may influence family meal frequency.
When the maternal employment variable is analyzed with four categories as presented in the
original survey, it is interesting to note the frequency distribution of always or usually having
family meals. Mothers who are unemployed and are not looking for work most frequently
reported having family meals (90.7%), while mothers who are not employed but looking for
work have the lowest prevalence of always usually having family meals (84.8%). These trends
may reflect the economic stability, financial stress, and the ability to maintain family routines.
Although the observed frequency distribution of the four maternal employment status
categories with respect to family meal frequency appears informative, the full multivariate

38
model did not demonstrate a good fit upon model assessment. The categorizations were
reconsidered and examined as three categories: (1) Employed full time or part time, (2) Not
employed but looking for work, and (3) Not employed and not looking for work. The simple
model of family meals with the three category design of maternal employment status revealed
an unadjusted odds ratio close to significance, however, the multivariate model again revealed a
lack of fit. Therefore, the simple dichotomized categorization of the maternal employment
status variable was incorporated into the final multivariate model. These evaluations are
summarized below in Table 9.
Table 9. Sub‐analyses of Maternal Employment Status Categorizations
Maternal Employment Status (PRAMS‐2) n* Always‐Usually
Family Meals Unadjusted OR
(95 % CI) Adjusted OR (95% CI)
Total 1,875 87.8% ‐‐ ‐‐ 4 categories Adjusted Wald Test ‐‐ ‐‐ p = 0.1839 p = 0.3470 Yes, full time 581 87.5% Referent Referent Yes, part time 452 85.3% 0.83 (0.50, 1.38) 0.77 (0.44, 1.37) No, but looking for work 215 84.8% 0.79 (0.43, 1.46) 1.17 (0.57, 2.40) No, not looking for work 615 90.7% 1.39 (0.83, 2.33) 1.30 (0.70, 2.41) Don't know/Missing 12 ‐‐ ‐‐ ‐‐ 3 categories Adjusted Wald Test ‐‐ ‐‐ p = 0.1158 p = 0.3109 Yes, full time or part time 1033 86.5% Referent Referent No, but looking for work 215 84.8% 0.87 (0.50, 1.51) 1.33 (0.70, 2.54) No, not looking for work 615 90.7% 1.52 (0.93, 2.40) 1.48 (0.87, 2.52) Don't know/Missing 12 ‐‐ ‐‐ ‐‐ 2 categories* Adjusted Wald Test ‐‐ ‐‐ p = 0.1782 p = 0.1256 Yes, full time or part time 1033 86.5% Referent Referent Not employed 830 89.3% 1.31 (0.88, 1.93) 1.44 (0.90, 2.30) Don't know/Missing 12 ‐‐ ‐‐ ‐‐ a Unweighted number of respondents; b Weighted percentage of those reporting always or usually having family meals, excluding those who did not respond or responded that they did not know *Categorization used in the multivariate model

39
MaritalStatusThe marital status variable included in the final model for this study was derived from the
PRAMS‐2 survey, and was analyzed as a dichotomous variable. Although single parenthood and
unstable home environments have been cited in the literature as important predictors of
maintaining household routines and family meals, the marital status variable was not significant
in the final multivariate model of this study. Marital status data was collected both in the
PRAMS‐2 survey and the birth certificate registry. The PRAMS‐2 survey also inquired about the
mothers’ living situation by asking, “Are you living with….?” in which the mother could check all
that apply among the following responses: “(1) Your spouse or partner, (2) Other adult (not
spouse or partner), or (3) No other adults(s)”. Each of these sources of partner‐related data was
assessed individually in an attempt to better understand the observed results and to examine
alternative approaches to analyzing the relationship between marital status and family meal
frequency (results summarized in Table 10 below).
The marital status data derived from the birth certificate registry may be analyzed in two
different ways: either simply dichotomized as “Married” or “Not Married”, or with further
categorization of the “Not Married” group based on whether or not the father’s name was
entered into the birth certificate registry. The additional sub‐group considering the father’s
presence during the birth of the child was incorporated for potential insight into the stability of
the home and father’s role in parenting. Compared to married mothers, those who are
unmarried and have the father’s name on the birth certificate were less likely to report always
or usually having family meals. In contrast, unmarried mothers who did not have the father’s
name on the baby’s birth certificate reported family meals frequency patterns similar to married
couples (90.1%).
40
Analysis of the PRAMS‐2 “Living with…” question also revealed interesting results with
respect to family meal frequency. Mothers who reported living with a spouse or partner
reported similar family meal frequency trends as those mothers not living with any other adult
(88.4% and 87.2% reported always or usually having family meals, respectively). However, upon
stratification by marital status, family meals are less frequently reported by unmarried mothers
living with a partner (81.9%) or non‐partner “other adult” (78.7%), compared with married
mothers (89.4%). Interestingly, these results do not indicate that mothers living with “no other
adult” (presumably single parents) necessarily report family meal frequencies that are different
from married households (although contrary to findings in the literature).
These alternative analyses of marital status (summarized in Table 10 below) consistently
reveal less frequent family meals among unmarried households in which the father may have a
presence, and among unmarried mothers living with another adult who is not reported as a
spouse or partner. Such households may comprise unstable relationships and struggle with
managing the family environment. It is possible that an unmarried mother living with another
adult not considered a spouse or partner may be challenged with social and financial distress,
and face barriers in managing childcare and family routines.

41
Table 10. Alternate analyses of marital status, derived from the birth certificate & PRAMS‐2
Characteristic na Always‐Usually Family Mealsb
Unadjusted OR (95 % CI)
Adjusted OR (95% CI)
Total 1,875 87.8% ‐‐ ‐‐ Marital Status (BC) Adjusted Wald Test ‐‐ ‐‐ p = 0.001 p = 0.1182 Married 1350 90.1% Referent Referent Not Married 525 82.4% 0.51 (0.34, 0.77) 0.70 (0.40, 1.11) Marital Status (BC) Adjusted Wald Test ‐‐ ‐‐ p = 0.0011 p = 0.0842 Married 1350 90.1% Referent Referent Not married, Father's name on BC 402 80.1% 0.44 (0.29, 0.68) 0.60 (0.35, 1.01) Not married, Father's name NOT on BC 123 90.1% 0.99 (0.49, 2.04) 1.22 (0.58, 2.60) Marital Status (PRAMS‐2)* Adjusted Wald Test ‐‐ ‐‐ p = 0.010 p = 0.2877 Married 1387 89.4% Referent Referent Not Married 482 82.9% 0.58 (0.38, 0.88) 0.74 (0.42, 1.30) Missing 6 ‐‐ ‐‐ ‐‐ Living with…. (PRAMS‐2) Adjusted Wald Test ‐‐ ‐‐ p = 0.1244 p = 0.2735 Spouse or partner 1570 88.4% Referent Referent Other adult 108 77.9% 0.46 (0.22, 0.97) 0.61 (0.25, 1.50) No other adult 191 87.2% 0.89 (0.48, 1.68) 1.38 (0.67, 2.84) Missing 6 ‐‐ ‐‐ ‐‐ Living with… & Marital Status (combined from PRAMS‐2) Adjusted Wald Test p = 0.0458 p = 0.3209 Married 1387 89.4% Referent Referent
Not Married & Lives with partner
203 81.9% 0.54 (0.30, 0.95) 0.64 (0.32, 1.31)
Not married & Lives with other adult
105 78.7% 0.44 (0.20, 0.94) 0.52 (0.21, 1.33)
Not married & Lives with no other adult
174 86.7% 0.77 (0.41, 1.48) 1.13 (0.53, 2.40)
Missing 6 ‐‐ ‐‐ ‐‐ a Unweighted number of respondents; b Weighted percentage of those reporting always or usually having family meals, excluding those who did not respond or responded that they did not know *Categorization used in the multivariate model

42
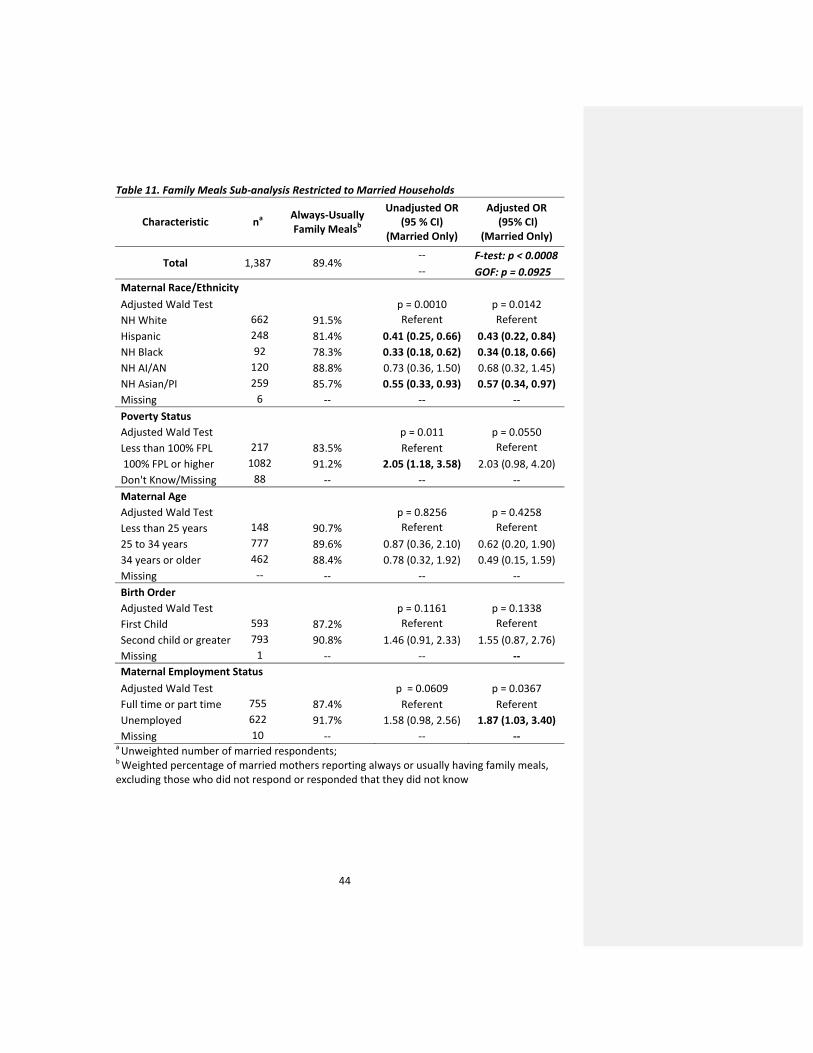
FamilyMealsinMarriedHouseholdsSingle parenthood has been well cited in the literature as a barrier to maintaining family
routines, and the analysis of the various sources of marital status data in this study
demonstrates similar trends. Although the multivariate regression model presented in this
study indicates that race/ethnicity remains the strongest demographic predictor of always or
usually having family meals, an alternative sub‐analysis was considered to better understand
how socioeconomic factors influence family routines among the sub‐population of married
households. The multivariate logistic regression model was re‐visited to determine whether
race/ethnicity or poverty status is a stronger predictor of family meals in the subset of mothers
in the sample who reported being married.
The multivariate model run for the sub‐population of married mothers shows that
race/ethnicity remains a significant demographic predictor of family meals (p = 0.0142),
however, this relationship is not as strong as the initial result observed in the full, unrestricted
analysis (full model p = 0.0044; See Table 8). Poverty status demonstrates strong associative
trends (p = 0.0550) among married mothers, with higher family meal frequency reported among
those living at or above the federal poverty level.
Interestingly, maternal employment status is significantly associated with family meal
frequency in the restricted analysis among married households (p = 0.0367), while the observed
association in the full, unrestricted model was not statistically significant (full model p = 0.1256;
See Table 7). Compared to married mothers who are working either full time or part time,
unemployed married mothers are more likely to report always or usually having family meals
together (ORa: 1.87; 95% CI: 1.03, 3.40). This is likely because more than 80% of married
mothers who are unemployed reported that they are not looking for work, possibly indicating
financial stability. In contrast, more than half of unmarried mothers who are unemployed
Comment [DP12]: Could this be an issue of power‐most OR’s are similar.
43
reported that they are still looking for work. These results indicate that the combined influence
of race/ethnicity, poverty status, maternal employment status, and marital status, plays an
important role in family meal frequency, and, more generally, family organization and stability.
The results of the model restricted to married households are summarized in Table 11 below.
44
Table 11. Family Meals Sub‐analysis Restricted to Married Households
Characteristic na Always‐Usually Family Mealsb
Unadjusted OR (95 % CI)
(Married Only)
Adjusted OR (95% CI)
(Married Only)
Total 1,387 89.4% ‐‐ F‐test: p < 0.0008 ‐‐ GOF: p = 0.0925
Maternal Race/Ethnicity Adjusted Wald Test p = 0.0010 p = 0.0142 NH White 662 91.5% Referent Referent Hispanic 248 81.4% 0.41 (0.25, 0.66) 0.43 (0.22, 0.84) NH Black 92 78.3% 0.33 (0.18, 0.62) 0.34 (0.18, 0.66) NH AI/AN 120 88.8% 0.73 (0.36, 1.50) 0.68 (0.32, 1.45) NH Asian/PI 259 85.7% 0.55 (0.33, 0.93) 0.57 (0.34, 0.97) Missing 6 ‐‐ ‐‐ ‐‐ Poverty Status Adjusted Wald Test p = 0.011 p = 0.0550 Less than 100% FPL 217 83.5% Referent Referent 100% FPL or higher 1082 91.2% 2.05 (1.18, 3.58) 2.03 (0.98, 4.20) Don't Know/Missing 88 ‐‐ ‐‐ ‐‐ Maternal Age Adjusted Wald Test p = 0.8256 p = 0.4258 Less than 25 years 148 90.7% Referent Referent 25 to 34 years 777 89.6% 0.87 (0.36, 2.10) 0.62 (0.20, 1.90) 34 years or older 462 88.4% 0.78 (0.32, 1.92) 0.49 (0.15, 1.59) Missing ‐‐ ‐‐ ‐‐ ‐‐ Birth Order Adjusted Wald Test p = 0.1161 p = 0.1338 First Child 593 87.2% Referent Referent Second child or greater 793 90.8% 1.46 (0.91, 2.33) 1.55 (0.87, 2.76) Missing 1 ‐‐ ‐‐ ‐‐ Maternal Employment Status Adjusted Wald Test p = 0.0609 p = 0.0367 Full time or part time 755 87.4% Referent Referent Unemployed 622 91.7% 1.58 (0.98, 2.56) 1.87 (1.03, 3.40) Missing 10 ‐‐ ‐‐ ‐‐
a Unweighted number of married respondents; b Weighted percentage of married mothers reporting always or usually having family meals, excluding those who did not respond or responded that they did not know
45
DiscussionSummaryofFindings
This study reports the prevalence of family meal frequency among families with two‐year old
children in Oregon, and investigates the role of race/ethnicity and poverty status, along with
several other socioeconomic characteristics, on sharing family meals together. Among the
cohort of women who had live births in 2004 and 2005, 87.5% of those mothers of two‐year old
children reported always or usually sharing family meals together. A multivariate analysis
revealed significant associations between family meals and race/ethnicity, poverty status, and
birth order. Further sub‐analyses of employment status and marital status demonstrated
weaker associations with family meals among those with unstable home environments and
financial stress.
ComparisonwithPreviousFindings
FamilyMealsPrevalence
In this study, 87.8% Oregon mothers reported “always or usually” having family meals together.
Since this analysis is restricted to families with two‐year old children, it was expected that the
prevalence estimate would be relatively high. Although only a few studies have examined
family meal frequency among children as young as two years of age, most studies report a
decrease in family meal frequency with increasing age groups 34. On average, more than half
the families surveyed nationally report sharing meals 3 to 5 times a week 35. The Child Trends
analysis of the 2007 National Survey of Children’s Health reported national and state data on
frequency of family meals. Among Oregon families with young children from birth to 5 years of
age, 66.1% shared meals 6‐7 per week, 19.7% shared meals 4‐5 days per week, while 14.2%
shared meals 3 or fewer days per week 36. In a cross‐sectional study among 3 to 5 year old
Comment [DP13]: A lot more than ½? , little more than ½?

46
children, 57% of families reported eating together 7 days a week 37. In another study examining
the prevalence of household routines among 4 year old children from the Early Childhood
Longitudinal Study, Birth Cohort, 56.6% of mothers reported having a family dinner 6 or 7
evenings per week 15.
Most other studies measuring family meals frequency are focused on families with
adolescents, and generally report less frequent meals, as compared with families with younger
children. Child Trends analyses report only 39.6% of adolescents sharing family meals 6‐7 days
per week, 29.7% sharing meals 4‐5 days per week, and 30.7% sharing meals 3 or fewer days per
week 34. In a nationally representative survey, the Center on Addiction and Substance Abuse at
Columbia University found that 58% of teens report having dinner with their families at least
five times a week 38.
The 87.8% prevalence of family meal frequency reported in this study is higher than most
other reports. Compared with other published studies on family meals, this study cohort
represents families with children of the youngest age group. As younger children are dependent
on the family for feeding, a higher rate of family meal frequency was expected. However, it is
important to note that the prevalence estimates may not be comparable across all studies since
there is variability in the definition of family meals and frequency measurement. Many studies
have measured family meal frequency by specific number of days per week, while other studies
are less defined. Since the survey question in this study asked whether families ate together
“always, usually, sometimes, or never”, it is possible that individual interpretation of this
question varies widely across the study sample, representing potential information bias (See
Strengths and Limitations).
47
Race/Ethnicity
In this analysis, non‐Hispanic Blacks, Hispanics, and non‐Hispanic Asians/Pacific Islanders
were significantly less likely to report always or usually having family meals together, compared
with non‐Hispanic Whites. Several other studies have identified racial and ethnic disparities
with respect to family meals. In a nationwide sample of parents of young children age 35
months to 4 years, NH Blacks (ORa: 4.4; 95% CI: 1.9, 10.1) and Hispanics (ORa: 3.4; 95% CI: 1.3,
8.9) had greater odds of never eating lunch or dinner with their family, compared to NH Whites
22. In a study among 4 year old children, NH Blacks and Hispanics had lower odds of reporting
eating dinner as a family more than 5 times per week, compared with NH Whites 15. In a study
examining trends in family meal frequency over a 10 year period, the mean number of family
meal per week reported by Asian adolescents were shown to have significantly decreased 39.
Several other studies on family meal frequency have shown contrasting trends with respect
to racial/ethnic disparities. A Child Trends analysis reports that Hispanic adolescents (49%) are
more likely than NH White (36%) and NH Black (36%) adolescents to eat meals 6 to 7 days a
week together with their families 34. In a population based cross sectional study among
adolescents, Asian American youth reported the highest mean frequency of family meals in a
week (5.3) 40.
These contrasting trends are notable, since it is likely that these variations are attributable to
the diverse acculturation experiences among different minority populations. For example, the
Project EAT survey, based in the Minneapolis/St. Paul metropolitan area of Minnesota, sampled
adolescents from diverse racial/ethnic and socioeconomic backgrounds 39. Their analysis
revealed decreasing family meal frequencies specifically among the Asian adolescents in the
study sample. However, the authors caution against extrapolating these findings to other Asian
populations, especially since a majority of the Asian adolescents in their study population were

48
of one particular Asian ethnic group (Hmong). Their study findings on the Asian population
specifically reflect the experiences of the Hmong community, as it is likely that this
subpopulation in this area share similar socioeconomic characteristics. As such, it is important
to consider the specific backgrounds of the broadly categorized racial/ethnic groups across
different geographic regions in order to gain a better understanding of the observed findings.
Nativity
In this study, differences in family meal frequency by maternal nativity were examined. In
the univariate analysis, foreign born mothers had lower odds of always or usually having family
meals, compared with U.S. born mothers (unadjusted OR: 0.53; 95% CI: 0.36, 0.76; see Table 5
above). Although maternal nativity was significant in the univariate analysis, it was excluded
from the final multivariate model since it was too closely related to race/ethnicity. However, it
is interesting to note that 78% of the Hispanic mothers in this study sample were foreign born,
and over 90% of those foreign born Hispanic mothers were from Mexico. The trend among the
Hispanic group in this study population is in contrast to the findings by the national Child Trends
findings (cited above). Considering the unique profiles and shared contextual factors of the
Hispanic population in Oregon may provide insight into the disparities observed.
Other findings in the literature regarding maternal nativity and family meals are primarily
focused on families with adolescents. A cross sectional study among parents of adolescent girls
in Minnesota found that parents of foreign born girls reported having more frequent meals 41. A
Child Trends analysis reports that foreign born adolescents are more likely than native born
adolescents with foreign born parents to eat family meals together regularly 34. This is especially
interesting in comparison with the current thesis analysis, since this study reports lower family
meal frequency among foreign born mothers with native born children. These trends appear to
highlight the importance of supporting healthy acculturation among immigrant families with
Comment [DP14]: Im not sure what you mean here‐are you suggesting that the Asian population you studied is similar to the Hmong? If so, did you want to say—and it is likely (rather than as it is likely)? It is really the phrase beginning with ‘as it is likely’ that I’m having trouble understanding (perhaps just dense).
49
U.S. born young children and adolescents. It is possible that the low family meal frequencies
reported among immigrant families may be attributable to how one’s original cultural values
and eating patterns evolve in U.S. society 39. Considered a proxy for acculturation, nativity may
indicate how immigrant cultural patterns adapt in new environments, but may also indicate
limited accessibility to resources, and changes in education and economic opportunities 42.
Exploring these factors may better explain the heterogeneities observed within racial/ethnic
groups nationwide.
The racial/ethnic disparities in family meal frequency observed in this study may imply
differences in cultural practice and value. However, race and ethnicity are social constructs that
are characterized by constantly evolving concepts, including genetics, physiology, culture,
socioeconomic status, and environment 43. It is important to be cautious about explanations
based on race/ethnicity and culture. There is a wide range of subcategories within each
racial/ethnic group, each with unique experiences and social practices that may define
behavioral patterns. For example, the construct of race in the U.S. is linked with a past history of
disadvantage and discrimination, while the construct of culture may represent adaptation to
limited options or the prevailing economic conditions 43.
Family meals represent a routine social practice, therefore it is important to connect social
context with family feeding practices. Theoretical approaches to understanding population
eating patterns emphasize the consideration of “social relations”, as comprised of social
structures such as class, race, and gender 2. The unique eating patterns among different groups
of people may reflect and be influenced by the configurations of social relations. As such, it is
important to explore the combination of these social structures in order to better understand
the strong racial/ethnic disparities observed in this study. The discussion below explores the
relationship of family meal patterns with poverty status, employment, and family structure.

50
SocioeconomicDisparities
There are racial/ethnic differences in wealth across levels of income and education, and it is the
combination of race/ethnicity and economic resources that define childhood experience of
socioeconomic status 43. In addition to race/ethnicity, both poverty status and maternal
education were significantly associated with family meal frequency in the univariate models in
this study. Consistent trends were observed for both characteristics, with increasing family meal
frequency among those with higher income and educational attainment (See Table 4 & 5). Since
maternal education was too closely related to poverty status, it was excluded from the final
multivariate model to prevent multi‐collinearity. Poverty status remained significant in the
adjusted model. Compared with mothers who reported living below the poverty line, those
living at or above 100% of the federal poverty level were about twice as likely to report always
or usually having family meals together (See Table 8).
Strong associations between family meal frequency and socioeconomic status have been
observed in several studies. Decreasing family meal frequency has been reported among youth
from low socioeconomic backgrounds, determined by parental education level and economic
stress (as measured by parental employment status, and family eligibility for public assistance,
and free or reduced‐cost school meals) 39. In a cross‐sectional study among children between 3
and 10 years of age, those with the lowest family incomes were observed to have the worst
feeding practices 44. Conversely, Child Trends analyses reports that adolescents living below the
poverty level are more likely to eat meals six or seven days (51%) a week together as a family
than those living between 100% and 200% of the federal poverty level (42%), and those above
200% of the federal poverty level (36%) 34. Child Trends also reported similar trends with
parental education. That is, that children and adolescents whose parents have less than a high
51
school degree are more likely to eat meals six or seven days a week, than those with parents
who have more education 34.
Many studies have identified socioeconomic disparities in family meal frequency, food choice
patterns, and nutrition 2, 39, 45. Decreases in family meal frequency were observed among
populations most vulnerable to poor nutrition and other developmental risk factors 39. Studies
examining how social structure is linked with food and health have demonstrated that meal
patterns and lay knowledge of food/health involved in decision making around feeding children
differs among social classes 2.
MaternalEmployment
Exploring socioeconomic factors associated with family meals revealed much literature on the
recent economic and employments trends in the United States. In this thesis analysis, the
relationship between maternal employment status and family meal frequency was evaluated
(See Table 9). Although employment status was not significant in the final multivariate model, it
was included nonetheless, since it is an important variable that is commonly cited in the
literature. Among the families sampled in this Oregon population, mothers who were
unemployed but still looking for work, employed part‐time, or employed full‐time, reported less
frequent family meals than mothers who were unemployed and not looking for work.
Interestingly, a population based cross‐sectional study among adolescents found higher family
meal frequency associated with mothers who were either not employed or employed part‐time
40. It is possible that this trend reflects the challenges of maintaining routine family meals
among less financially stable households, and/or households with mothers who face time
constraints.
Many other studies have also demonstrated associations between family structure, maternal
employment, and family meals. The analysis of two nationally representative time diary

52
collections (National Survey of Parents, and Family Interaction, Social Capital and Time Use
Study) demonstrated that employed mothers eat meals less often with children, compared with
their non‐employed counterparts 46. In a cross sectional analysis among parents and 11 year old
children, less healthy eating was associated with working (part‐ or full‐time) mothers, compared
with full‐time homemakers 45. Analyses from the Study of Early Child Care and Youth
Development (by the National Institutes of Child Health and Human Development)
demonstrated positive? associations between maternal employment and children’s body mass
index (BMI), as well as implications of mothers’ nonstandard work schedules (working
evenings/nights, weekends, or an irregular shift) 47.
The concept of “time poverty” may address the observed family meal patterns and eating
trends associated with socioeconomic status, poverty, and employment. Since family eating
habits have shifted with the growth of the service economy and increasing women in the labor
force, lower‐income households have been faced with more difficult choices43. It is understood
from the socio‐ ecological perspective that behavior can be affected by individual and
interpersonal characteristics, as well as factors at the organizational, community, and policy
levels. Family behaviors can be affected by stressors both inside and outside of the household,
including factors associated with employment. A study measuring “work‐to‐family spillover”
scores examines the effect of participation in work on family roles, as it contributes to negative
coping behaviors upon integrate work and family demands 48. Overtime or part‐time work
hours (compared with full‐time work) was associated with high work‐to‐family spillover scores.
The study highlights factors such as job strain, shift work, multiple jobs as limiting workers’
ability to participate in family meals. The combination of conflicting work and family roles have
been linked with poor health outcomes, and fewer meals prepared and eaten at home48.
Comment [DP15]: What implications do you mean here?
Comment [DP16]: ?

53
MaritalStatusandFamilyMeals
This thesis analysis also considered the role of marital status on family meal frequency.
Although marital status was not significant in the final model developed in this study (See Table
8), it was kept in the model as it is an important family characteristic that influences the home
environment. Many studies have illustrated the challenges faced in single‐parent households in
maintaining household routines. Family instability, as defined as children’s exposure to
repeated changes in parents’ union status, has negative consequences on youth behavior and
academic performance 49. Compared to two‐parent families, single parent families have been
shown to be less likely to have daily routines for meals for their young children 18. A focus group
study among single mothers with young children 3 to 5 years old explored the experiences and
perspectives related to establishing and maintaining daily household routines 18. Time
constraints, fatigue, and lack of family support are a few specific challenges women faced in
their efforts to accomplish routines. Television viewing was described as interfering with
sharing meals together. The absence of predictable household routines, such as family meals,
combined with family instability, is characteristic of a disorganized home environment, which
places children at risk for further physical problems. It is possible that such underlying
conditions of an unmarried household may explain the observed trends in family meal
frequency.
The sub‐analysis of the marital status variable from the various data sources utilized in this
study illustrates the trends of family meal frequency and family instability (See Table 10). In
general, married mothers reported more family meals than unmarried mothers. According to
the sub‐analysis of unmarried mothers from the birth certificate files, family meal frequency
tends to be to lower among unmarried mothers who reported the father’s name on the birth
certificate, when compared with their unmarried counterparts who did not report the father’s

54
name. In another sub‐analysis of the PRAMS‐2 survey question asking about with whom the
mother is living, unmarried mothers who reported living with a partner or other adult had lower
family meal frequency compared to married mothers. These trends seem to indicate that the
role of marital status on family meal frequency is probably explained by the quality of household
organization as determined by family structure and function.
These observed trends are especially interesting upon review of the theoretical perspectives
of “family structure” and “family functioning”. The family structure perspective states that two‐
parent households facilitate a better environment for youth well‐being compared with single‐
parent homes 50. However, the family functioning perspective suggests that children may be
better off in a cohesive single‐parent home than in a conflictive two‐parent home 50. In the
current study sample, unmarried mothers living with no other adult reported similar rates of
family meals as married mothers. These sub‐samples may be representative of more “cohesive”
households with higher quality of family functioning, as compared with those of unmarried
mothers living with a partner or other adult.
In the restricted analysis of family meal frequency among married households only,
employment status was found to be a stronger predictor of family meals, when compared with
the full model (See Table 11 & Table 8). This finding appears consistent with previous studies
that cite maternal employment as significantly impacting the management of daily routines in
dual‐parent households. Higher levels of “work‐life stress”, related to constraints faced at home
because of job‐related demands, have been associated with lower frequency of family meals
among dual‐parent households with employed mothers 51. In the current economic climate,
parents may experience greater pressures to maintain employment and devote more time to
work. The subsequent stress of balancing the needs of work and home may directly influence
the frequency of sharing family meals.

55
UnderstandingtheDisparities
The socioeconomic disparities observed in this study highlight the diverse constraints that
challenge the maintenance of routine family meals. The barriers faced by families of lower
socioeconomic status may related to work and time stressors such as having multiple part‐time
jobs, or changes in workplace demands that allow for less flexibility in time schedules 6, 48. It is
possible that specific housing conditions may also influence family routines, such as having
smaller living spaces that are not conducive to shared eating 39. It would be important to assess
the employment and living conditions of the Oregon study population to better understand the
challenges experienced by local families of minority racial/ethnic backgrounds and/or lower
socioeconomic status.
Comment [DP17]: ?
56
StrengthsandLimitations
An important strength of this study is the complex sampling design and weighting technique
utilized for the PRAMS and PRAMS‐2 survey data. The oversampling and weighting technique
creates a sample that is representative of the Oregon population of recent mothers.
Oversampling for minority racial/ethnic groups allows for analysis of within Oregon sub‐
populations with sufficient statistical power. The dataset is linked to birth certificate files, which
provides additional family characteristics and demographic data that are useful especially for
investigating socioeconomic disparities.
Limitations of this study are related to the design of the family meals question, and the
definition of the outcome variable, family meal frequency. The survey question measuring
family meals asks, “Does your family eat meals together?” in which mothers could answer either
(1) Always, (2) Usually, (3) Sometimes, or (4) Never. Some studies have measured frequency
very precisely as number of days or meals per week, while others have measured frequency
with more vague responses, such as “some days” or “most days” 5. In comparison to other
studies in the literature, the PRAMS‐2 measurement specificity of family meal frequency is
moderate in precision.
As a self‐reported measure, the responses are subject to interpretation by each respondent,
but it is likely that the bias is uniform throughout the sample of mothers. The study sample is
restricted to families with two‐year children who are likely to be accompanied by a family during
meals, creating a bias towards reporting more frequent family meals. Therefore it is likely that
the family meals prevalence reported in this study is an overestimate. However, the model
developed in this study considers birth order to address potential distortions of the family meal
frequency associations that could be attributable to having older children and bigger families.
Comment [DP18]: of the family meal prevalence in Oregon families generally?

57
The survey question does not specifically define a family meal, with respect to attending
members of the “family” sharing the meal, the environment or setting of the meal, or external
factors such as simultaneously ongoing activities during the meal. Some studies have qualified
family meals if “other family members, some family members, or one of the parents” sat at the
table together to share a meal 5. It is possible that extended family members living with and/or
providing care for the child are underreported if they are also actively involved with preparing
and sharing the family meals. Whether family meals are prepared and/or consumed in or
outside the home is not clearly defined, and may increase measurement variability. Some
family meal surveys in the literature adjusted for ongoing activities such as television viewing
during the meal, since it could disrupt communication between family members. It is important
to note that this study does not account for such environmental factors that could counteract
the potential protective effects of sharing the family meal.

58
PublicHealthImplicationsAlthough this study is restricted to families with two‐year old children, early childhood
experiences related to socioeconomic position can have a cumulative and generational effect on
health status throughout the life cycle. Disparities in home routines such as family meals have
the potential to impede healthy development and future school success. This study identifies
racial/ethnic and income disparities with family meal frequency and can inform strategic
interventions to reduce or eliminate such disparities. The study result offers the opportunity to
promote family meals through campaigns targeting at‐risk populations. Previous educational
programs, such as “Mealtime is Family Time” have been well‐received by low income audiences
52. Primary care providers can implement routine, brief but focused discussions on the risky and
protective factors associated with family meals. Providers may employ motivational
interviewing techniques to engage parents and understand barriers faced by individual families.
The discussion could include environmental factors such as television viewing during meal, and
describe national family meal trends. Since family home routines can be established early in life,
it is important to counsel parents of toddlers about family meals and promote self‐regulation.
As family meals represent a relatively simple intervention for families to adopt, pediatricians
could easily make recommendations during well child care visits.
It would be important to design realistic interventions and focus messages to address the
needs of families undergoing time and budget constraints. Community based programs could
focus messages to families most vulnerable, and plan educational outlets such as classes that
provide time/budget management and meal preparation skills 39. Collaborative efforts between
families, community and state leaders, and pediatric health care providers can enhance the
effectiveness of targeted interventions.

59
FutureResearch
Future research on family meals should be assessed more comprehensively with multiple
questions about the mealtime environment. The comprehensive approach should measure the
quality of the meal and environment, and may measure other characteristics of the family meal,
including the length of the meal, the nutritional quality of the meal, and whether television
viewing is occurring during the meal. Other characteristics of the meal including the location (at
or away from the home, at a table, etc) and the relationship with other participating members
of the meal are also important to measure in future research to evaluate the quality and
protectiveness of routine meals.
Future survey questions measuring family meals should address the lack of specificity in
measuring? the frequency of family meals through direct observations or validated
questionnaires. Having more precise measurements of family meal frequency could improve
the accuracy of findings with respect to disparities as well as improve our understanding of the
protective nature of family meals.
This study identified racial/ethnic disparities in the Oregon cohort of mothers, but it will be
important to further explore disparities across diverse immigrant populations, as well as across
various geographic regions. Exploring the trends of socioeconomic disparities may help
elucidate particular barriers and challenges experienced by diverse at‐risk populations.
Future research may also examine the evolution of family meals over time. It would be
interesting to examine the types of food served, the family members who are eating together,
and specific parameters of the meal itself, such as length and conversations during the meal.
Evaluating the specific characteristics and barriers of modern family meals will help inform
interventions to reach the vulnerable subpopulations struggling with maintaining home
routines.
Comment [DP19]: Can’t do this with survey questions, though. Or am I minunderstanding this sentence

60
References
1. Anderson SE, Must A, Curtin C, Bandini LG. Meals in our household: Reliability and initial validation of a questionnaire to assess child mealtime behaviors and family mealtime environments. J Acad Nutr Diet 2012 Feb;112(2):276‐84.
2. Delormier T, Frohlich KL, Potvin L. Food and eating as social practice‐‐understanding eating patterns as social phenomena and implications for public health. Sociol Health Illn 2009 Mar;31(2):215‐28.
3. O'Connell ML, Henderson KE, Luedicke J, Schwartz MB. Repeated exposure in a natural setting: A preschool intervention to increase vegetable consumption. J Acad Nutr Diet 2012 Feb;112(2):230‐4.
4. Meier A, Musick K. Is the family dinner overrated? The New York Times. 2012 June 29, 2012;.
5. Valdes J, Rodriguez‐Artalejo F, Aguilar L, Jaen‐Casquero MB, Royo‐Bordonada MA. Frequency of family meals and childhood overweight: A systematic review. Pediatr Obes 2013 Feb;8(1):e1‐e13.
6. Fulkerson JA, Kubik MY, Rydell S, Boutelle KN, Garwick A, Story M, Neumark‐Sztainer D, Dudovitz B. Focus groups with working parents of school‐aged children: What's needed to improve family meals? J Nutr Educ Behav 2011 May‐Jun;43(3):189‐93.
7. Fiese BH, Foley KP, Spagnola M. Routine and ritual elements in family mealtimes: Contexts for child well‐being and family identity. New Dir Child Adolesc Dev 2006 Spring;(111)(111):67‐89.
8. Kral TV, Rauh EM. Eating behaviors of children in the context of their family environment. Physiol Behav 2010 Jul 14;100(5):567‐73.
9. Berge JM, Wall M, Larson N, Loth KA, Neumark‐Sztainer D. Family functioning: Associations with weight status, eating behaviors, and physical activity in adolescents. J Adolesc Health 2012 Aug 29.
10. Fulkerson JA, Kubik MY, Story M, Lytle L, Arcan C. Are there nutritional and other benefits associated with family meals among at‐risk youth? J Adolesc Health 2009 Oct;45(4):389‐95.
11. Farmer S, Hanratty B. The relationship between subjective wellbeing, low income and substance use among schoolchildren in the north west of england: A cross‐sectional study. J Public Health (Oxf) 2012 Dec;34(4):512‐22.
12. Neumark‐Sztainer D, Wall M, Story M, Sherwood NE. Five‐year longitudinal predictive factors for disordered eating in a population‐based sample of overweight adolescents: Implications for prevention and treatment. Int J Eat Disord 2009 Nov;42(7):664‐72.
61
13. Neumark‐Sztainer D, Wall M, Story M, Fulkerson JA. Are family meal patterns associated with disordered eating behaviors among adolescents? J Adolesc Health 2004 Nov;35(5):350‐9.
14. Ray C, Roos E. Family characteristics predicting favourable changes in 10 and 11‐year‐old children's lifestyle‐related health behaviours during an 18‐month follow‐up. Appetite 2011 Oct 25.
15. Anderson SE, Whitaker RC. Household routines and obesity in US preschool‐aged children. Pediatrics 2010 Mar;125(3):420‐8.
16. Hughes SO, Power TG, Papaioannou MA, Cross MB, Nicklas TA, Hall SK, Shewchuk RM. Emotional climate, feeding practices, and feeding styles: An observational analysis of the dinner meal in head start families. Int J Behav Nutr Phys Act 2011 Jun 10;8:60.
17. Quick BL, Fiese BH, Anderson B, Koester BD, Marlin DW. A formative evaluation of shared family mealtime for parents of toddlers and young children. Health Commun 2011 Oct;26(7):656‐66.
18. Koulouglioti C, Cole R, Moskow M. Single mothers' views of young children's everyday routines: A focus group study. J Community Health Nurs 2011 Jul;28(3):144‐55.
19. Rollins BY, Belue RZ, Francis LA. The beneficial effect of family meals on obesity differs by race, sex, and household education: The national survey of children's health, 2003‐2004. J Am Diet Assoc 2010 Sep;110(9):1335‐9.
20. Babajafari S, Marks GC, Mamun AA, O'Callaghan MJ, Najman JM. Family food behaviours and adolescents' overweight status: A mother‐offspring link study. Iran Red Crescent Med J 2011 Nov;13(11):783‐94.
21. Anderson SE, Whitaker RC. Prevalence of obesity among US preschool children in different racial and ethnic groups. Arch Pediatr Adolesc Med 2009 Apr;163(4):344‐8.
22. Flores G, Tomany‐Korman SC, Olson L. Does disadvantage start at home? racial and ethnic disparities in health‐related early childhood home routines and safety practices. Arch Pediatr Adolesc Med 2005 Feb;159(2):158‐65.
23. Birch LL, Davison KK. Family environmental factors influencing the developing behavioral controls of food intake and childhood overweight. Pediatr Clin North Am 2001 Aug;48(4):893‐907.
24. Department of Human Services, Health Services. Oregon PRAMS first year report, 1998‐99. Portland, OR: Office of Family Health; 2000.
25. Department of Health and Human Services. Annual update of the HHS poverty guidelines. Federal Register January 24, 2006;71(15):3848‐3849.

62
26. Department of Health and Human Services. Annual update of the HHS poverty guidelines. Federal Register 2007;72(15):3147‐3148.
27. Department of Health and Human Services. Annual update of the HHS poverty guidelines. Federal Register 2008;73(15):3971‐3971.
28. Faul F, Erdfelder E, Buchner A, Lang A‐. Statistical power analyses using G*Power 3.1: Tests for correlation and regression analyses. Behavior Research Methods 2009;41:1149‐1160.
29. Archer KJ, Lemeshow S. Goodness‐of‐fit test for a logistic regression model fitted using survey sample data. Stata Journal 2006;6(1):97‐105.
30. Bandiera FC, Pereira DB, Arif AA, Dodge B, Asal N. Race/ethnicity, income, chronic asthma, and mental health: A cross‐sectional study using the behavioral risk factor surveillance system. Psychosom Med 2008 Jan;70(1):77‐84.
31. Blum RW, Beuhring T, Shew ML, Bearinger LH, Sieving RE, Resnick MD. The effects of race/ethnicity, income, and family structure on adolescent risk behaviors. Am J Public Health 2000 Dec;90(12):1879‐84.
32. Thorpe RJ,Jr, Kasper JD, Szanton SL, Frick KD, Fried LP, Simonsick EM. Relationship of race and poverty to lower extremity function and decline: Findings from the women's health and aging study. Soc Sci Med 2008 Feb;66(4):811‐21.
33. Crouch JL, Hanson RF, Saunders BE, Kilpatrick DG, Resnick HS. Income, race/ethnicity, and exposure to violence in youth: Results from the national survey of adolescents. J Community Psychol 2000;28(6):625‐41.
34. Child Trends Data Bank. Family meals: Indicators on children and youth. National Survey of Children's Health; 2012.
35. Fiese BH, Scwartz M. Reclaiming the family table: Mealtimes and child health and wellbeing. Social Policy Report 2008;XXII(IV):3‐18.
36. Murphey D. The more we eat together: State data on frequency of family meals. Child Trends; 2012.
37. Wyse R, Campbell E, Nathan N, Wolfenden L. Associations between characteristics of the home food environment and fruit and vegetable intake in preschool children: A cross‐sectional study. BMC Public Health 2011 Dec 16;11:938,2458‐11‐938.
38. CASA. The importance of family dinners VII. The National Center on Addiction and Substance Abuse at Columbia University; 2011.
39. Neumark‐Sztainer D, Wall M, Fulkerson JA, Larson N. Changes in the frequency of family meals from 1999 to 2010 in the homes of adolescents: Trends by sociodemographic characteristics. J Adolesc Health 2013 Feb;52(2):201‐6.

63
40. Neumark‐Sztainer D, Hannan PJ, Story M, Croll J, Perry C. Family meal patterns: Associations with sociodemographic characteristics and improved dietary intake among adolescents. J Am Diet Assoc 2003 Mar;103(3):317‐22.
41. Bauer KW, Neumark‐Sztainer D, Fulkerson JA, Story M. Adolescent girls' weight‐related family environments, minnesota. Prev Chronic Dis 2011 May;8(3):A68.
42. Sharkey JR, Johnson CM, Dean WR. Nativity is associated with sugar‐sweetened beverage and fast‐food meal consumption among mexican‐origin women in texas border colonias. Nutr J 2011 Sep 30;10:101,2891‐10‐101.
43. Caprio S, Daniels SR, Drewnowski A, Kaufman FR, Palinkas LA, Rosenbloom AL, Schwimmer JB. Influence of race, ethnicity, and culture on childhood obesity: Implications for prevention and treatment: A consensus statement of shaping america's health and the obesity society. Diabetes Care 2008 Nov;31(11):2211‐21.
44. Hendy HM, Williams KE. Mother's feeding practices for children 3‐10 years of age and their associations with child demographics. Appetite 2012 Apr;58(2):710‐6.
45. Sweeting H, West P. Dietary habits and children's family lives. J Hum Nutr Diet 2005 Apr;18(2):93‐7.
46. Bianchi SM. “What gives” when mothers are employed? parental time allocation in dual earner and single earner two‐parent families. Department of Sociology and Maryland Population Research Center (MPRC); 2006.
47. Morrissey TW, Dunifon RE, Kalil A. Maternal employment, work schedules, and children's body mass index. Child Dev 2011 Jan‐Feb;82(1):66‐81.
48. Devine CM, Stoddard AM, Barbeau EM, Naishadham D, Sorensen G. Work‐to‐family spillover and fruit and vegetable consumption among construction laborers. Am J Health Promot 2007 Jan‐Feb;21(3):175‐82.
49. Fomby P, Mollborn S, Sennott CA. Race/Ethnic differences in effects of family instability on adolescents' risk behavior. J Marriage Fam 2010 Apr;72(2):234‐53.
50. Mandara J, Murray CB. Effects of parental marital status, income, and family functioning on african american adolescent self‐esteem. J Fam Psychol 2000 Sep;14(3):475‐90.
51. Bauer KW, Hearst MO, Escoto K, Berge JM, Neumark‐Sztainer D. Parental employment and work‐family stress: Associations with family food environments. Soc Sci Med 2012 Aug;75(3):496‐504.
52. Lohse B, Rifkin R, Arnold K, Least C. A digital program informs low‐income caregivers of preschool‐age children about family meals. J Nutr Educ Behav 2012 May‐Jun;44(3):256‐61.
ohd2\Ali Family Meals thesis 2013‐05‐09_DP.doc