Quarter 4 Performance Report 2012/13Presentation to the Portfolio Committee on Economic Development
11 June 2013
1
The Annual Performance Plan of the EDD reflects its strategic outcome-orientated goal of creating decent work and inclusive growth opportunities:
by integrating its work around other outcomes (particularly on infrastructure)
to ensure participatory, coherent and coordinated economic policy, planning and dialogue for the benefit for all South Africans.
EDD has performed well against the predetermined fourth quarterly targets of the 2012/13 APP. The overall quarterly performance is summarised in the next slide.
Introduction
2
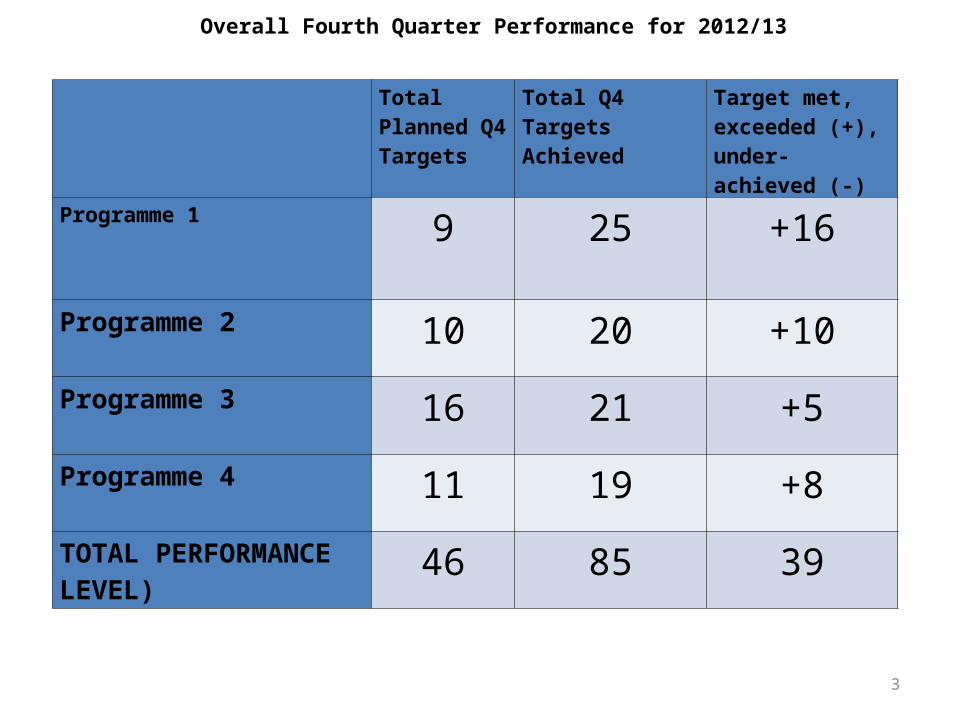
Total Planned Q4 Targets
Total Q4 Targets Achieved
Target met, exceeded (+), under-achieved (-)
Programme 1 9 25 +16
Programme 2 10 20 +10
Programme 3 16 21 +5
Programme 4 11 19 +8
TOTAL PERFORMANCE LEVEL)
46 85 39
Overall Fourth Quarter Performance for 2012/13
3
Quarter 4 Report – will be discussed in the following format:
Programme 1 Performance ReportProgramme 1 Expenditure ReportProgramme 2 Performance ReportProgramme 2 Expenditure Report Programme 3 Performance ReportProgramme 3 Expenditure Report Programme 4 Performance ReportProgramme 4 Expenditure Report
4
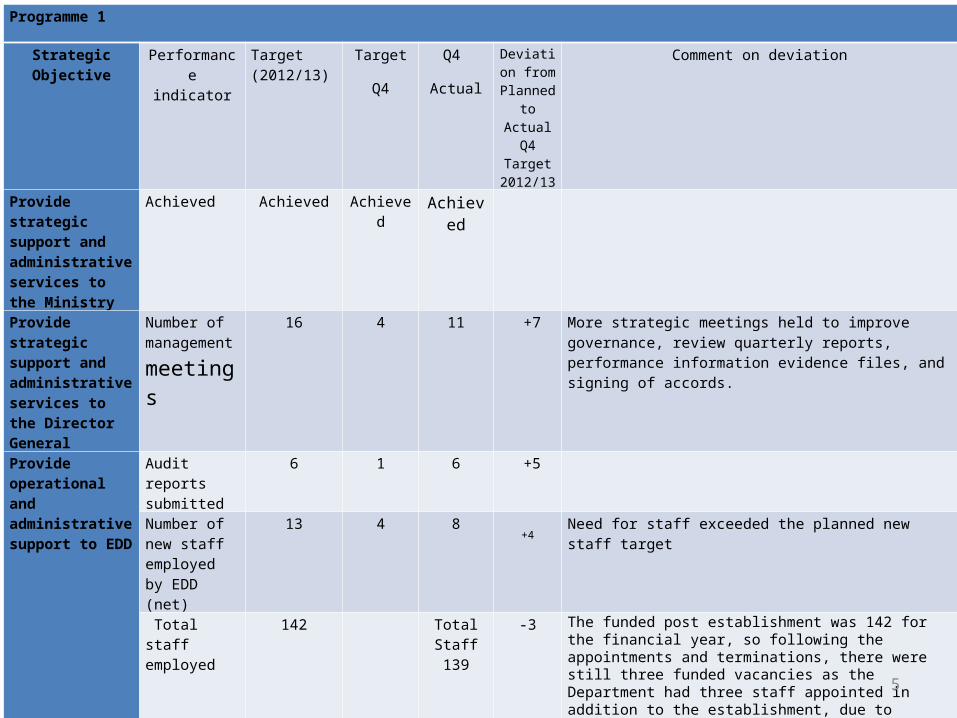
Programme 1
Strategic Objective Performance indicator
Target (2012/13)
Target
Q4
Q4
Actual
Deviation from
Planned to Actual Q4 Target 2012/13
Comment on deviation
Provide strategic support and administrative services to the Ministry
Achieved Achieved Achieved Achieved
Provide strategic support and administrative services to the Director General
Number of management
meetings
16 4 11 +7 More strategic meetings held to improve governance, review quarterly reports, performance information evidence files, and signing of accords.
Provide operational and administrative support to EDD
Audit reports submitted
6 1 6 +5
Number of new staff employed by EDD (net)
13
4 8
+4Need for staff exceeded the planned new staff target
Total staff employed
142 Total Staff 139
-3 The funded post establishment was 142 for the financial year, so following the appointments and terminations, there were still three funded vacancies as the Department had three staff appointed in addition to the establishment, due to unavailability of posts at the required levels. Of the appointments made, eight staff members assumed duties during April 2013.
Projected expenditure (R thousand)
Initial budgetR672 732
Adjusted Budget R696518
R152 482 R178 457 -R25 975 Expenditure was exceeded because of additional new projects.
Align per project and GFS. 5

PROGRAMME 2: ECONOMIC POLICY DEVELOPMENT
Strategic Objective
Performance indicator Target (2012/13)
Target
Q4
Q4
Actual
Deviation from
Planned to Actual Q4
Target 2012/13
Comment on deviation
Co-ordinate and monitor the implementation of the New Growth Path
Regular survey of public sector (with DPME)
2 - 1 +1 A survey was conducted on employment in construction activities financed by the state
Impact of state actions on employment assessed through modeling
1 1 2 +1 Additional work done on the impact of trade with Africa on employment (including a modeling exercise)
RIA process reviewed to ensure alignment with NGP
1 - -
Workshops held on assessing employment impact of the state
2 - 2 +2 A training workshop was held with Gauteng Provincial government on 12 February 2013 highlighting the impact of all government departments, provinces and agencies on employment. A similar workshop was held in the Western Cape, which also discussed the Socio-Economic Impact Assessment System Guidelines
6

Programme 2
Strategic Objective
Performance indicator Target (2012/13)
Target
Q4
Q4
Actual
Deviation from Planned to Actual
Q4 Target 2012/13
Comment on deviation
SA Development Index approved and then monitored
1 - 1 +1 A pilot SA Development Index was approved and is now monitored in its test phase.
Outcome 4 outcomes reviewed regularly
4 1 1 0
Annual in-depth analysis of trends in employment, inequality and growth
1 - 1 +1 Provided a detailed presentation to the Cabinet Lekgotla to evaluate progress on NGP targets with key action plans to improve outcomes achievement.
EDD Conference held with high-level inputs
1 1 - - This conference was held in Q1
Develop and implement inclusive growth strategies
Sector methodologies developed and applied
2 1 2 +1
Competition Act amended and regularly reviewed
1 - 1 +1 The competition Amendment Act was reviewed, so that S6 be brought into effect.
Other policy interventions identified and appropriate amendments proposed
1 1 3 +2 Additional interventions were required by the Ministry based on developments in infrastructure, industrial development and industrial relations.
Policy platforms 4 1 1 0
7
Strategic Objective Performance indicator Target (2012/13)
Target
Q4
Q4
Actual
Deviation from Planned to Actual
Q4 Target 2012/13
Comment on deviation
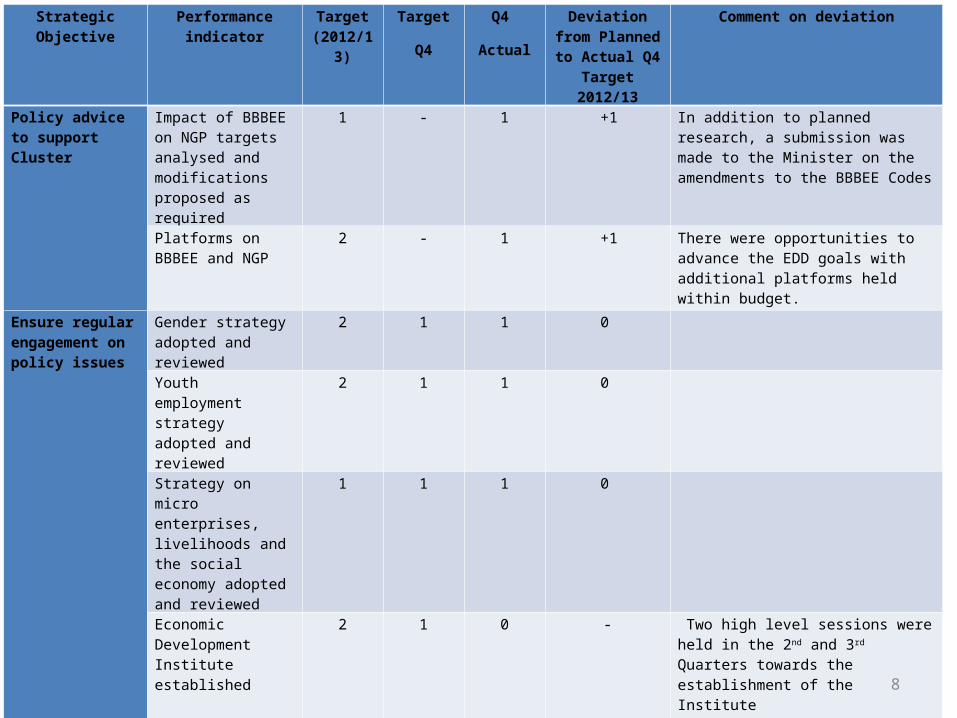
Policy advice to support Cluster
Impact of BBBEE on NGP targets analysed and modifications proposed as required
1 - 1 +1 In addition to planned research, a submission was made to the Minister on the amendments to the BBBEE Codes
Platforms on BBBEE and NGP
2 - 1 +1 There were opportunities to advance the EDD goals with additional platforms held within budget.
Ensure regular engagement on policy issues
Gender strategy adopted and reviewed
2 1 1 0
Youth employment strategy adopted and reviewed
2 1 1 0
Strategy on micro enterprises, livelihoods and the social economy adopted and reviewed
1 1 1 0
Economic Development Institute established
2 1 0 - Two high level sessions were held in the 2nd and 3rd Quarters towards the establishment of the Institute
8
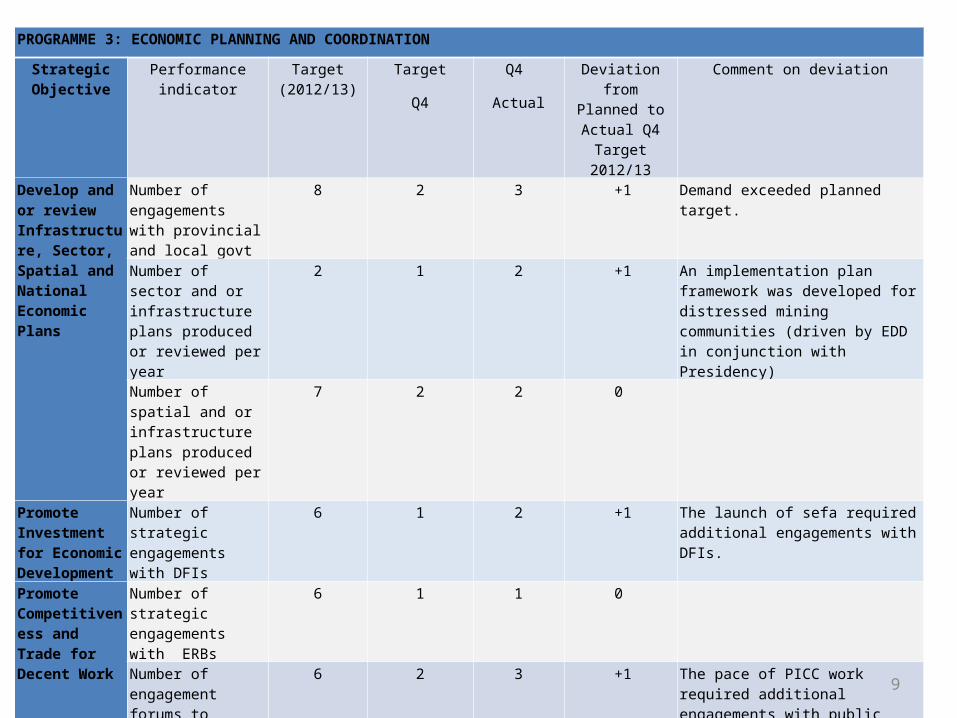
PROGRAMME 3: ECONOMIC PLANNING AND COORDINATION
Strategic Objective
Performance indicator Target (2012/13)
Target
Q4
Q4
Actual
Deviation from Planned to
Actual Q4 Target 2012/13
Comment on deviation
Develop and or review Infrastructure, Sector, Spatial and National Economic Plans
Number of engagements with provincial and local govt
8 2 3 +1 Demand exceeded planned target.
Number of sector and or infrastructure plans produced or reviewed per year
2 1 2 +1 An implementation plan framework was developed for distressed mining communities (driven by EDD in conjunction with Presidency)
Number of spatial and or infrastructure plans produced or reviewed per year
7 2 2 0
Promote Investment for Economic Development
Number of strategic engagements with DFIs
6 1 2 +1 The launch of sefa required additional engagements with DFIs.
Promote Competitiveness and Trade for Decent Work
Number of strategic engagements with ERBs
6 1 1 0
Number of engagement forums to foster alignment of SOEs and PICC’s investment decisions with that of the state
6 2 3 +1 The pace of PICC work required additional engagements with public entities.
9
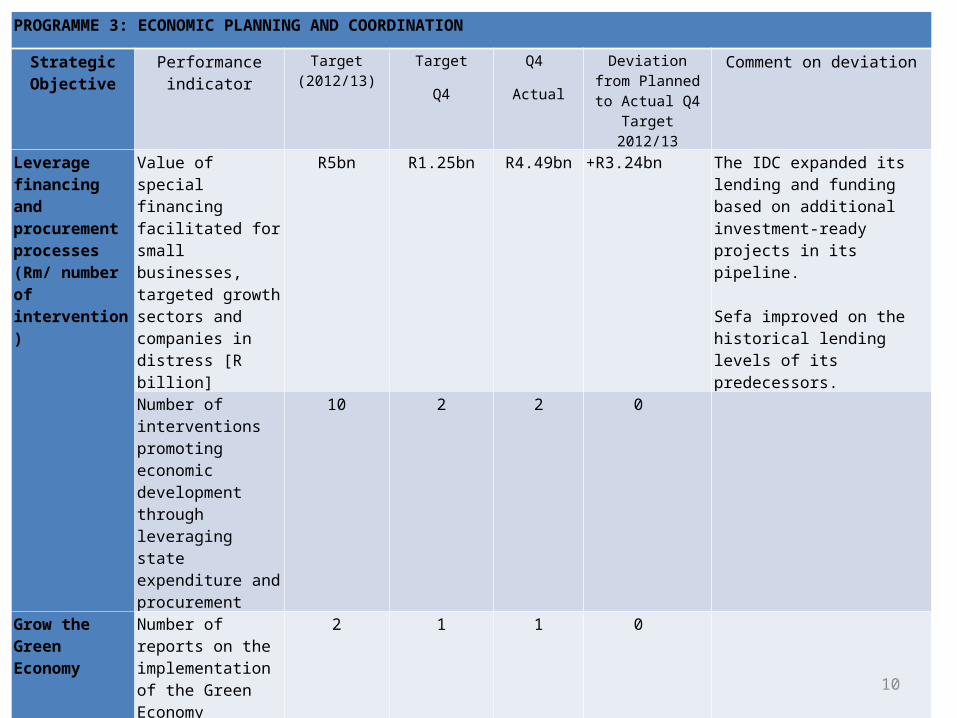
PROGRAMME 3: ECONOMIC PLANNING AND COORDINATION
Strategic Objective
Performance indicator
Target (2012/13)
Target
Q4
Q4
Actual
Deviation from Planned to Actual
Q4 Target 2012/13
Comment on deviation
Leverage financing and procurement processes (Rm/ number of intervention)
Value of special financing facilitated for small businesses, targeted growth sectors and companies in distress [R billion]
R5bn R1.25bn R4.49bn
+R3.24bn The IDC expanded its lending and funding based on additional investment-ready projects in its pipeline. Sefa improved on the historical lending levels of its predecessors.
Number of interventions promoting economic development through leveraging state expenditure and procurement
10 2 2 0
Grow the Green Economy
Number of reports on the implementation of the Green Economy Strategy
2 1 1 0
Number of interventions to grow the green economy
10 3 4 +1 The growing commitment to the green economy enabled EDD to exceed this target
10

PROGRAMME 4: ECONOMIC DEVELOPMENT AND DIALOGUEStrategic Objective Performance indicator Target
(2012/13)
Target
Q4
Q4
Actual
Deviation from Planned to Actual Q4
Target 2012/13
Comment on deviation
National Social Dialogue and Strategic Frameworks
Number of social dialogue and capacity building engagements held
10 3 6 +3 Success with the Accords increased the demand for capacity building.
Sectoral and Workplace Dialogue
Number of economic development agreements (sectoral, workplace and national) facilitated with social partners per year
2 - 1 +1 More agreements were signed due to progress on the implementation of the Local procurement Accord
Number of interventions to save or create new jobs
4 1 2 +1 Opportunities to save jobs exceeded the original target.
Number of reports on the implementation of the framework agreements and social pacts
4 1 1 0
Capacity Building for Economic Development
Number of Economic Advisory Panel meetings
1 1 - - A Ministerial Economic Advisory Panel meeting was held in Q1
Number of knowledge networks 4 1 1 0
Number of capacity building engagements (for organised labour and other social partners)
10 3 4 +1 Demand for capacity-building exceeded the original target.
Productivity, Entrepreneurship and Innovation
National/sectoral engagements on productivity
4 1 4 +3 4 value chain competitiveness workshops were held
Research reports on productivity 1 - - -
Productivity Month - October 1 - - - 11
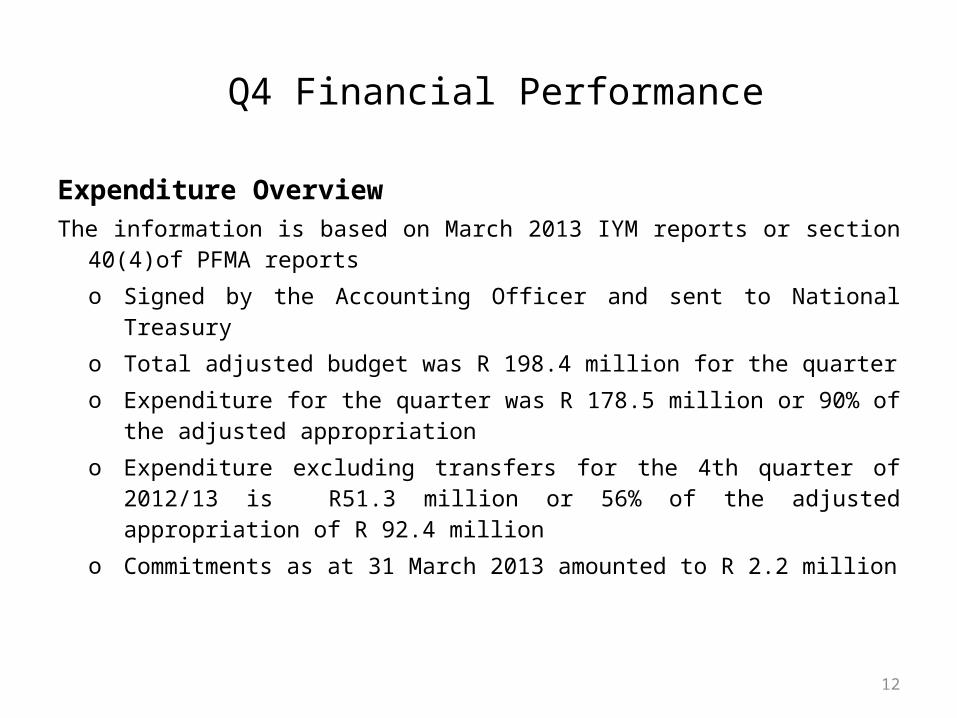
Q4 Financial Performance
Expenditure OverviewThe information is based on March 2013 IYM reports or section 40(4)of PFMA
reportso Signed by the Accounting Officer and sent to National Treasuryo Total adjusted budget was R 198.4 million for the quartero Expenditure for the quarter was R 178.5 million or 90% of the
adjusted appropriationo Expenditure excluding transfers for the 4th quarter of 2012/13 is
R51.3 million or 56% of the adjusted appropriation of R 92.4 milliono Commitments as at 31 March 2013 amounted to R 2.2 million
12
Q4 Financial Performance
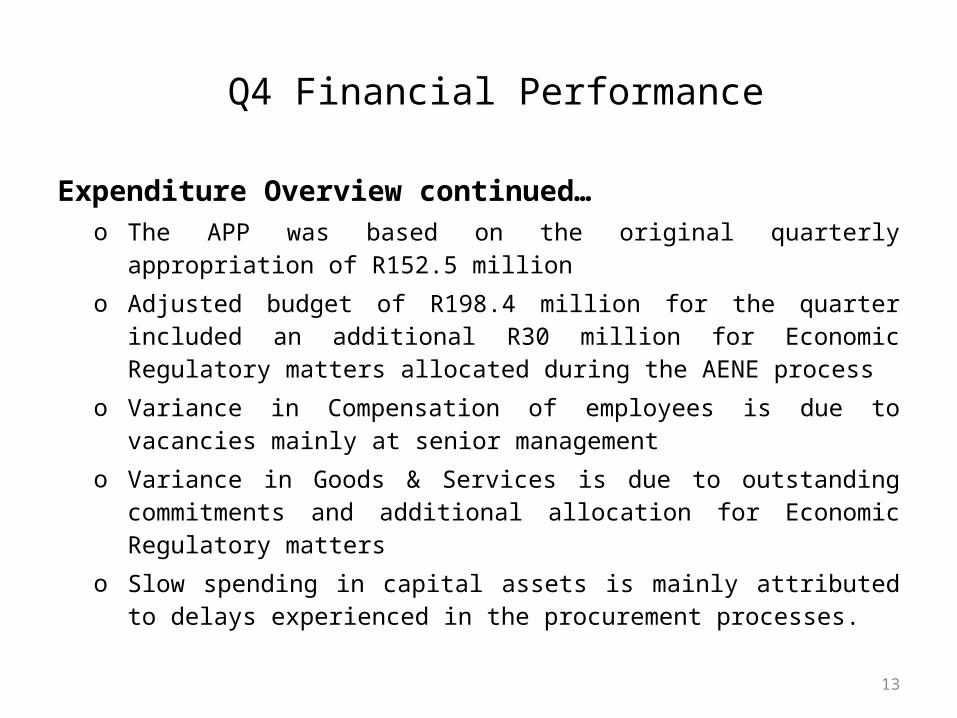
Expenditure Overview continued…o The APP was based on the original quarterly appropriation of R152.5
milliono Adjusted budget of R198.4 million for the quarter included an
additional R30 million for Economic Regulatory matters allocated during the AENE process
o Variance in Compensation of employees is due to vacancies mainly at senior management
o Variance in Goods & Services is due to outstanding commitments and additional allocation for Economic Regulatory matters
o Slow spending in capital assets is mainly attributed to delays experienced in the procurement processes.
13

Financial Performance per programme
14
Financial Performance per program
Adjusted Appropriation for
Quarter 4
Actual expenditure
Variance Spent
R'000 R'000 R'000 %
Administration 25,866 16,486 9,380 64%
Economic Policy Development 5,023 2,013 3,010 40%
Economic Planning and Coordination 163,070 157,435 5,635 97%
Economic Development and Dialogue 4,402 2,522 1,880 57%
Total inc Transfers 198,361 178,456 19,905 90%Total excl Transfers 92,388 51,296 41,092 56%
Programme
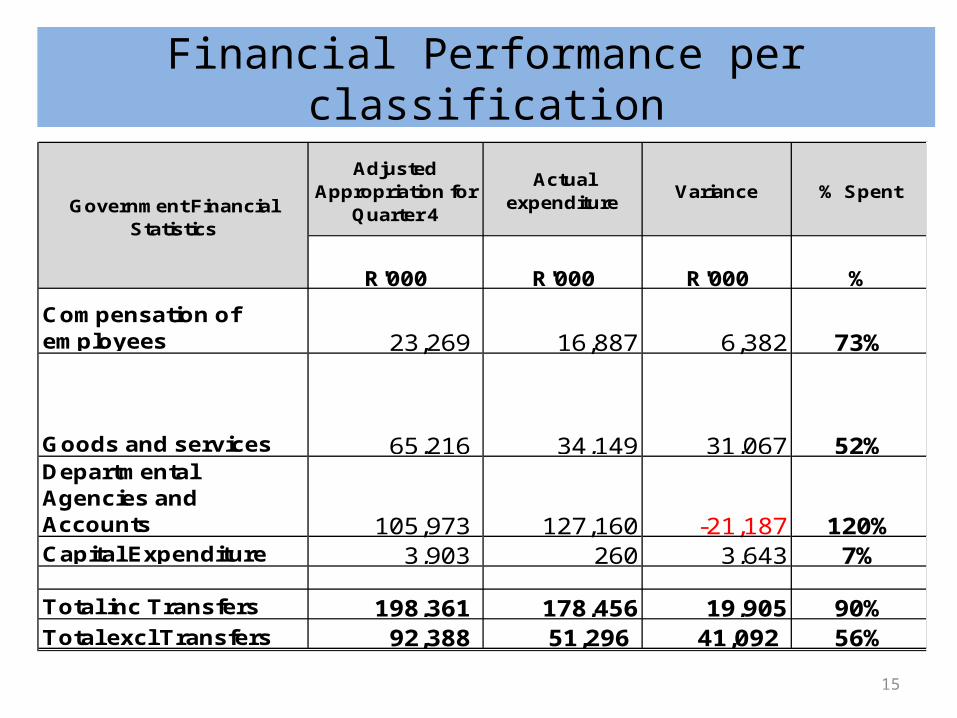
Financial Performance per classification
15
Adjusted Appropriation for
Quarter 4
Actual expenditure
Variance % Spent
R'000 R'000 R'000 %
Compensation of employees 23,269 16,887 6,382 73%
Goods and services 65,216 34,149 31,067 52%Departmental Agencies and Accounts 105,973 127,160 -21,187 120%Capital Expenditure 3,903 260 3,643 7%
Total inc Transfers 198,361 178,456 19,905 90%Total excl Transfers 92,388 51,296 41,092 56%
Government Financial Statistics
Financial Performance
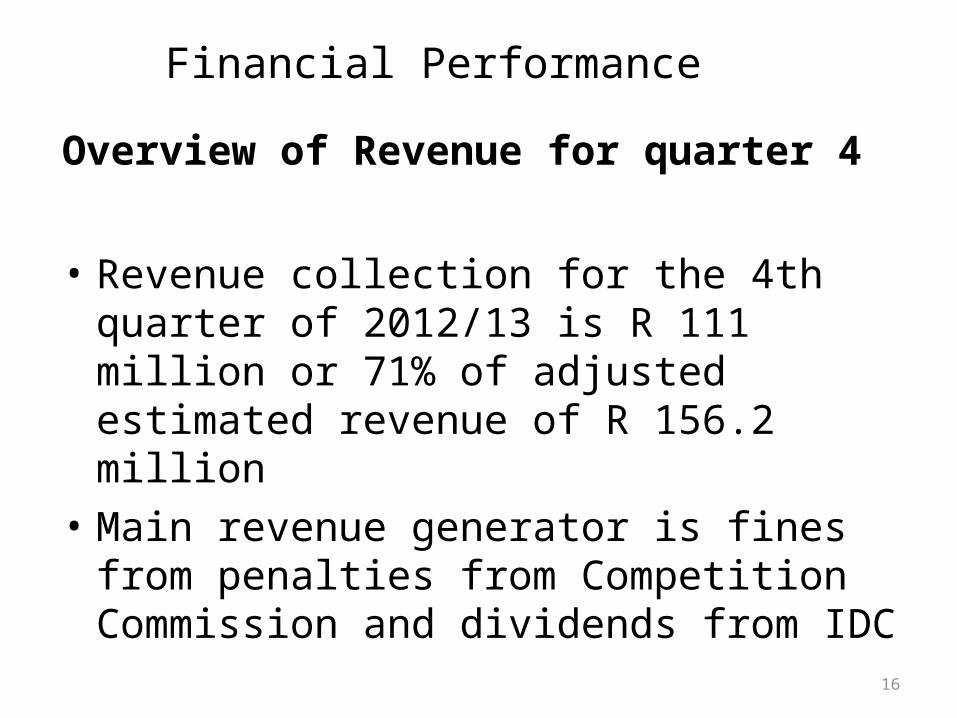
Overview of Revenue for quarter 4
• Revenue collection for the 4th quarter of 2012/13 is R 111 million or 71% of adjusted estimated revenue of R 156.2 million
• Main revenue generator is fines from penalties from Competition Commission and dividends from IDC
16
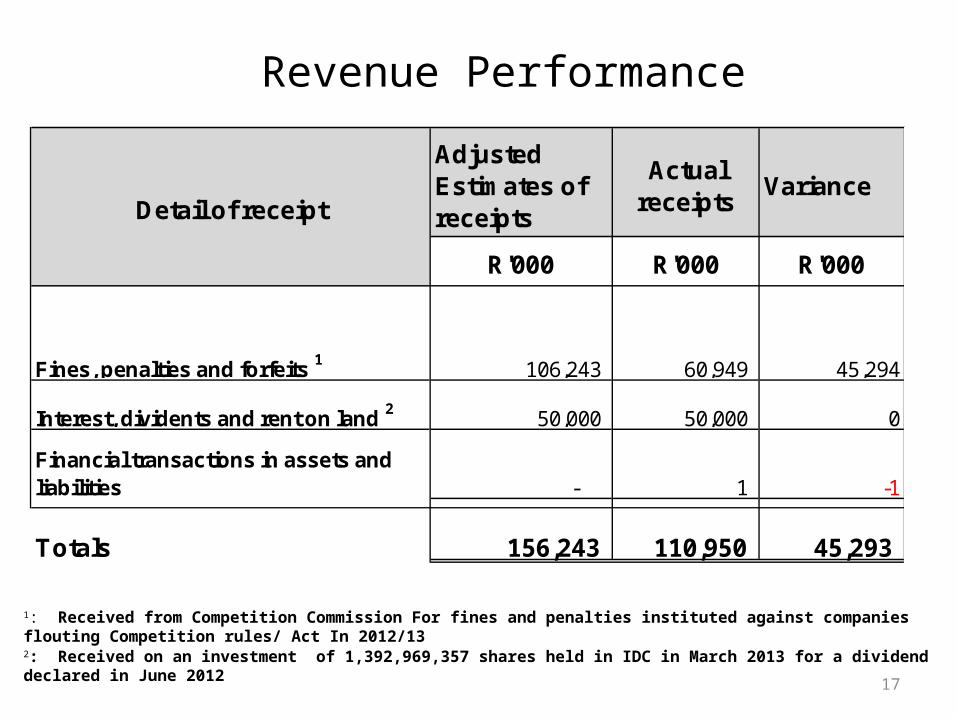
Revenue Performance
17
1: Received from Competition Commission For fines and penalties instituted against companies flouting Competition rules/ Act In 2012/13
2: Received on an investment of 1,392,969,357 shares held in IDC in March 2013 for a dividend declared in June 2012
Adjusted Estimates of receipts
Actual receipts
Variance
R'000 R'000 R'000
Fines, penalties and forfeits 1 106,243 60,949 45,294
Interest, dividents and rent on land 2 50,000 50,000 0
Financial transactions in assets and liabilities - 1 -1
Totals 156,243 110,950 45,293
Detail of receipt

.
Siyabonga
18