Quantification of the expected changes in annual maximum daily precipitation quantiles under climate change in the
Iberian Peninsula
CARLOS GARIJO & LUIS MEDIERO
U N I V E R S I D A D P O L I T É C N I C A D E M A D R I D , S PA I N
D E PA R T M E N T O F C I V I L E N G I N E E R I N G : H Y D R A U L I C S , E N E R G Y A N D E N V I R O N M E N T,

INTRODUCTION
Quantification of the expected changes in annual maximum daily precipitation quantiles under climate change in the Iberian Peninsula
Garijo, C. and Mediero, L. ; Universidad Politécnica de Madrid.
INTRODUCTION || BASE DATA || METHODOLOGY || RESULTS || DISS & CONCLUSIONS
INTRODUCTION

INTRODUCTION
· Local adaptation policies to climate
change require the possible evolution
of extreme precipitation due to its
importance in, for example, flood risk
or infrastructure systems safety.
Ebro river, 2015
·The procedure to evaluate how the climate will behave in the future is the
use of Global Climate Models (GCM) via Regional Climate Models (RCM).
·This study offers a new approach to study the effect of climate change, and
specially to add conclusive results, statistically based, of the change of
maximum precipitation in the Iberian Peninsula in the future under RCP 4.5
and RCP 8.5.
Quantification of the expected changes in annual maximum daily precipitation quantiles under climate change in the Iberian Peninsula
Garijo, C. and Mediero, L. ; Universidad Politécnica de Madrid.
INTRODUCTION || BASE DATA || METHODOLOGY || RESULTS || DISS & CONCLUSIONS

CASE OF STUDY
BASE DATA
Quantification of the expected changes in annual maximum daily precipitation quantiles under climate change in the Iberian Peninsula
Garijo, C. and Mediero, L. ; Universidad Politécnica de Madrid.
INTRODUCTION || BASE DATA || METHODOLOGY || RESULTS || DISS & CONCLUSIONS

INTRODUCTION
·Data used in this study comes from the EURO-CORDEX project, as is
the only region that includes the entire Iberian Peninsula.
· A total of 12 models from the EURO-CORDEX project have been
selected, with a spatial resolution of 0.11°and daily frequency outputs.
Nº Acronym MCG MCR
Simulation
periods (Control/
Future)
1 ICH-CCL ICHEC-EC-EARTH CCLM4-8-17 1951-2005/ 2006-2100
2 MPI-CCL MPI-ESM-LR CCLM4-8-17 1951-2005/ 2006-2100
3 MOH-RAC MOHC-HadGEM2-ES RACMO22E 1951-2005/ 2006-2099
4 CNR-CCL CNRM-CM5 CCLM4-8-17 1951-2005/ 2006-2100
5 ICH-RAC ICHEC-EC-EARTH RACMO22E 1951-2005/ 2006-2100
6 MOH-CCL MOHC-HadGEM2-ES CCLM4-8-17 1951-2005/ 2006-2099
7 IPS-WRF IPSL-CM5A-MR WRF331F 1951-2005/ 2006-2100
8 IPS-RCA IPSL-CM5A-MR RCA4 1971-2005/ 2006-2100
9 MOH-RCA MOHC-HadGEM2-ES RCA4 1971-2005/ 2006-2099
10 ICH-RCA ICHEC-EC-EARTH RCA4 1971-2005/ 2006-2100
11 CNR-RCA CNRM-CM5 RCA4 1971-2005/ 2006-2100
12 MPI-RCA MPI-ESM-LR RCA4 1971-2005/ 2006-2100
Quantification of the expected changes in annual maximum daily precipitation quantiles under climate change in the Iberian Peninsula
Garijo, C. and Mediero, L. ; Universidad Politécnica de Madrid.
INTRODUCTION || BASE DATA || METHODOLOGY || RESULTS || DISS & CONCLUSIONS

METHODOLOGY
METHODOLOGY
INTRODUCTION || BASE DATA || METHODOLOGY || RESULTS || DISS & CONCLUSIONS
Quantification of the expected changes in annual maximum daily precipitation quantiles under climate change in the Iberian Peninsula
Garijo, C. and Mediero, L. ; Universidad Politécnica de Madrid.

INTRODUCTION
Quantification of the expected changes in annual maximum daily precipitation quantiles under climate change in the Iberian Peninsula
Garijo, C. and Mediero, L. ; Universidad Politécnica de Madrid.
INTRODUCTION || BASE DATA || METHODOLOGY || RESULTS || DISS & CONCLUSIONS
Annual daily maximum series (AMS).
Three future periods: 2011-40, 2041-70 and 2071-95.
RCP 4.5 and RCP 8.5
Seven return periods (2, 5, 10, 50, 100, 500 and 1000 years)
GEV distribution function through L-moments.
Relative differences between control and future periods
Percentiles 50 (median), 68 & 90, show the general change trend.
1. General remarks
INTRODUCTION
INTRODUCTION || BASE DATA || METHODOLOGY || RESULTS || DISS & CONCLUSIONS
Quantification of the expected changes in annual maximum daily precipitation quantiles under climate change in the Iberian Peninsula
Garijo, C. and Mediero, L. ; Universidad Politécnica de Madrid.
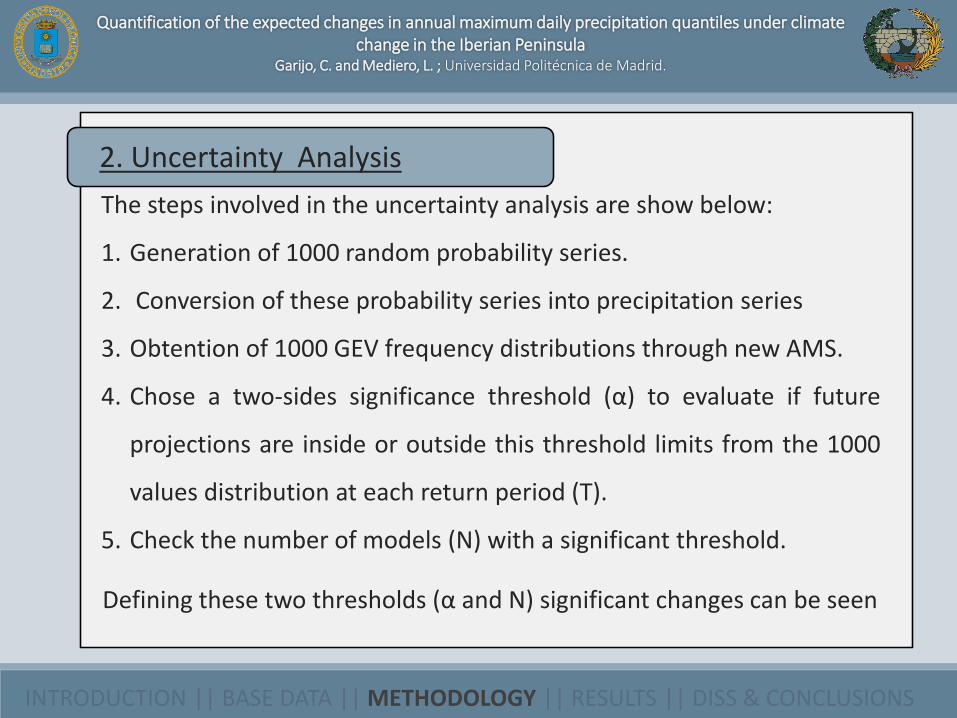
2. Uncertainty Analysis
The steps involved in the uncertainty analysis are show below:
1. Generation of 1000 random probability series.
2. Conversion of these probability series into precipitation series
3. Obtention of 1000 GEV frequency distributions through new AMS.
4. Chose a two-sides significance threshold (α) to evaluate if future
projections are inside or outside this threshold limits from the 1000
values distribution at each return period (T).
5. Check the number of models (N) with a significant threshold.
Defining these two thresholds (α and N) significant changes can be seen

INTRODUCTION
PrecipitationControl
GEVc (u,α,k)
1000x25 randomseries
GEV1000 (u,α,k)
Precipitation1000x25
Precip (T) 1000
RCP 4.5 and 8.5
T[2, 10, 100, 500, 1000]
Perc (α/1- α) (T)
FuturePrecipitation
GEVfut (u,α,k) Precip (T) fut
YESNO
INTRODUCTION || BASE DATA || METHODOLOGY || RESULTS || DISS & CONCLUSIONS
Quantification of the expected changes in annual maximum daily precipitation quantiles under climate change in the Iberian Peninsula
Garijo, C. and Mediero, L. ; Universidad Politécnica de Madrid.
2. Uncertainty Analysis

RESULTS
RESULTS
INTRODUCTION || BASE DATA || METHODOLOGY || RESULTS || DISS & CONCLUSIONS
Quantification of the expected changes in annual maximum daily precipitation quantiles under climate change in the Iberian Peninsula
Garijo, C. and Mediero, L. ; Universidad Politécnica de Madrid.

INTRODUCTION
Quantification of the expected changes in annual maximum daily precipitation quantiles under climate change in the Iberian Peninsula
Garijo, C. and Mediero, L. ; Universidad Politécnica de Madrid.
INTRODUCTION || BASE DATA || METHODOLOGY || RESULTS || DISS & CONCLUSIONS
Pre
cip
itat
ion
(mm
)
Control
Tr (years)
Tips for interpretation of the following figures:
RESULTS-SEASON 85
INTRODUCTION || BASE DATA || METHODOLOGY || RESULTS || DISS & CONCLUSIONS
Quantification of the expected changes in annual maximum daily precipitation quantiles under climate change in the Iberian Peninsula
Garijo, C. and Mediero, L. ; Universidad Politécnica de Madrid.
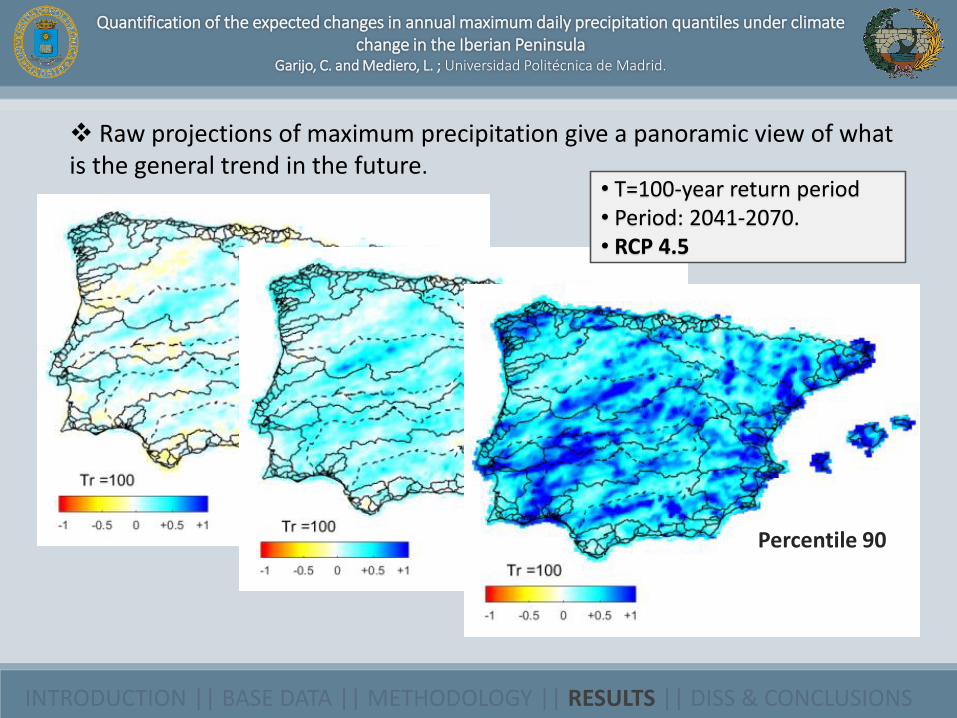
Percentile 50
Percentile 68
Percentile 90
Raw projections of maximum precipitation give a panoramic view of what is the general trend in the future.
• T=100-year return period• Period: 2041-2070.• RCP 4.5

RESULTS-SEASON 85
INTRODUCTION || BASE DATA || METHODOLOGY || RESULTS || DISS & CONCLUSIONS
Quantification of the expected changes in annual maximum daily precipitation quantiles under climate change in the Iberian Peninsula
Garijo, C. and Mediero, L. ; Universidad Politécnica de Madrid.
Percentile 50
Percentile 68
Percentile 90
Raw projections of maximum precipitation give a panoramic view of what is the general trend in the future.
• T=100-year return period• Period: 2041-2070.• RCP 8.5
RESULTS-SEASON 85
INTRODUCTION || BASE DATA || METHODOLOGY || RESULTS || DISS & CONCLUSIONS
Quantification of the expected changes in annual maximum daily precipitation quantiles under climate change in the Iberian Peninsula
Garijo, C. and Mediero, L. ; Universidad Politécnica de Madrid.
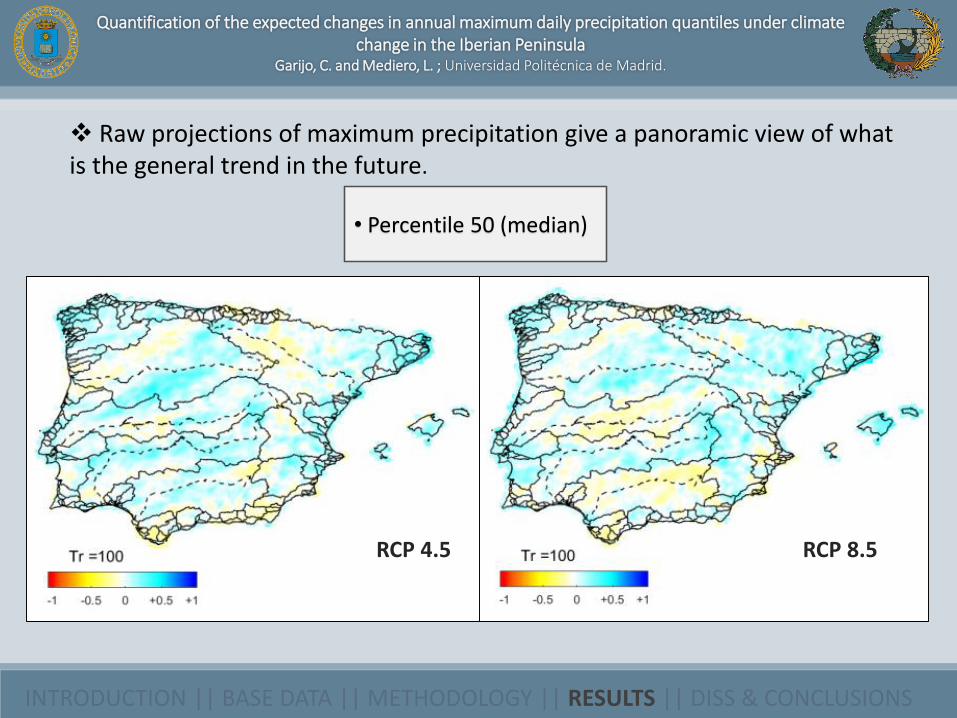
RCP 8.5
Raw projections of maximum precipitation give a panoramic view of what is the general trend in the future.
• Percentile 50 (median)
RCP 4.5

RESULTS-SEASON 85
INTRODUCTION || BASE DATA || METHODOLOGY || RESULTS || DISS & CONCLUSIONS
Quantification of the expected changes in annual maximum daily precipitation quantiles under climate change in the Iberian Peninsula
Garijo, C. and Mediero, L. ; Universidad Politécnica de Madrid.
Searching for appropriate significance threshold, two-sides significant limits (here represented as on-side limit; α) were plotted vs the average percentage of cells per model with change. The minimum number of models with change per cell threshold (N) was also plotted (coloured lines).

RESULTS-SEASON 85
INTRODUCTION || BASE DATA || METHODOLOGY || RESULTS || DISS & CONCLUSIONS
Quantification of the expected changes in annual maximum daily precipitation quantiles under climate change in the Iberian Peninsula
Garijo, C. and Mediero, L. ; Universidad Politécnica de Madrid.
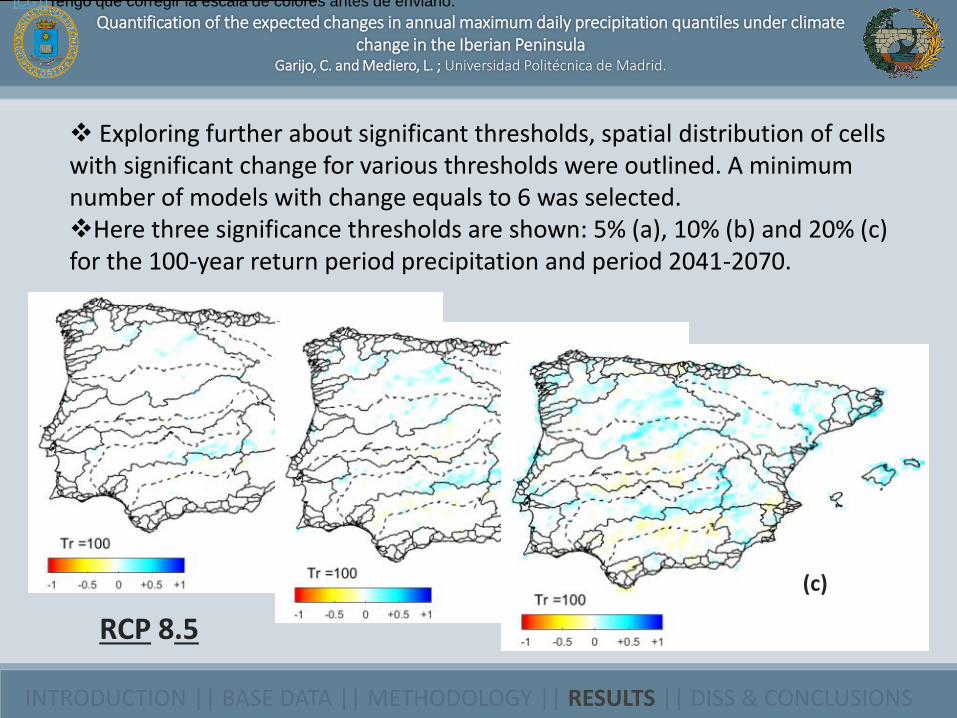
Exploring further about significant thresholds, spatial distribution of cells with significant change for various thresholds were outlined. A minimum number of models with change equals to 6 was selected. Here three significance thresholds are shown: 5% (a), 10% (b) and 20% (c) for the 100-year return period precipitation and period 2041-2070.
(a)(b)
[CG1]Tengo que corregir la escala de colores antes de enviarlo.
(c)
RCP 4.5
RESULTS-SEASON 85
INTRODUCTION || BASE DATA || METHODOLOGY || RESULTS || DISS & CONCLUSIONS
Quantification of the expected changes in annual maximum daily precipitation quantiles under climate change in the Iberian Peninsula
Garijo, C. and Mediero, L. ; Universidad Politécnica de Madrid.
Exploring further about significant thresholds, spatial distribution of cells with significant change for various thresholds were outlined. A minimum number of models with change equals to 6 was selected. Here three significance thresholds are shown: 5% (a), 10% (b) and 20% (c) for the 100-year return period precipitation and period 2041-2070.
(a)(b)
[CG1]Tengo que corregir la escala de colores antes de enviarlo.
(c)
RCP 8.5
RESULTS
DISCUSSION & CONCLUSIONS
Quantification of the expected changes in annual maximum daily precipitation quantiles under climate change in the Iberian Peninsula
Garijo, C. and Mediero, L. ; Universidad Politécnica de Madrid.
INTRODUCTION || BASE DATA || METHODOLOGY || RESULTS || DISS & CONCLUSIONS

CONCLUSIONS
MAIN CONCLUSIONS
• Results show the difficulty in selecting a threshold, both for
significance values and minimum number of models, as both scenarios
behave in a similar way.
• The minimum number of models threshold used in this study were
the half (six models), as it is a common practice.
• The choice of the significance threshold depends on the scientific
rigor required. With a threshold of 5% some areas can be identified,
but most of the changes come from a single cell with change, known
as the ‘island effect’ problem.
Quantification of the expected changes in annual maximum daily precipitation quantiles under climate change in the Iberian Peninsula
Garijo, C. and Mediero, L. ; Universidad Politécnica de Madrid.
INTRODUCTION || BASE DATA || METHODOLOGY || RESULTS || DISS & CONCLUSIONS

CONCLUSIONS
MAIN CONCLUSIONS
• Regarding results obtained for 100-year return period precipitation
in future period 2041-2070:
• Positive changes in both scenarios are the upper part of
Guadiana river basin, the central part of Duoro river basin and
some specific areas of the Mediterranean coast.
• Negative changes can be found in RCP 8.5 in the Tagus river
basin and southest Spain.
• This last trend partialy agree with findings in other studies,
nevertheless, here many more areas with positive change were found.
Quantification of the expected changes in annual maximum daily precipitation quantiles under climate change in the Iberian Peninsula
Garijo, C. and Mediero, L. ; Universidad Politécnica de Madrid.
INTRODUCTION || BASE DATA || METHODOLOGY || RESULTS || DISS & CONCLUSIONS
FINAL
THANK YOU FOR YOUR ATTENTION
Quantification of the expected changes in annual maximum daily precipitation quantiles under climate change in the Iberian Peninsula
Garijo, C. and Mediero, L. ; Universidad Politécnica de Madrid.
INTRODUCTION || BASE DATA || METHODOLOGY || RESULTS || DISS & CONCLUSIONS