Project no.: 613912
Project acronym: TRAFOON
Project title: Traditional Food Network to improve the transfer of knowledge for innovation
Instrument:
FP7-KBBE COORDINATION AND SUPPORT ACTION
(SUPPORTING ACTION)
Activity 2.2: Fork to Farm: Food (including seafood), health and well being
Topic KBBE.2013.2.3-02: Network for the transfer of knowledge on traditional foods to SMEs
Deliverable Report
US Market Study
Actual submission date: September 2016
Start date of project: November 1st 2013 Duration: 3 years

Organisation name of lead contractor for this deliverable: SPI (Partner 22)
Project co-funded by the European Commission within the Seventh Framework Programme (2007-2013)
Dissemination Level
PU Public x
PP Restricted to other programme participants (including the Commission Services)
RE Restricted to a group specified by the consortium (including the Commission Services)
CO Confidential, only for members of the consortium (including the Commission Services)

US Market Overview| SPI
3
1. Statement
Deliverable completed
2. Use and Verification of Deliverable in TRAFOON
US Market Overview| SPI
4
Table of Contents
1. Introduction .......................................................................................................................................... 5
2. Trade overview ..................................................................................................................................... 6
3. Product Market Review ........................................................................................................................ 8
3.1. Foods Made from Freshwater Fish ............................................................................................. 8
3.2. Traditional Foods Made of Grains ............................................................................................. 17
3.3. Traditional Foods Made of Fruits and Olives ............................................................................ 25
3.4. Traditional Foods Made of Vegetables and Mushrooms .......................................................... 31
4. Observations & Conclusions ............................................................................................................... 37

US Market Overview| SPI
5
1. Introduction
In the European Union, Small and Medium Sized Enterprises (SMEs) in the food sector are increasingly
under pressure due to the opening of markets, an increasing demand of standardized and price
competitive food products by the consumers, the rising importance of large retailers, and the challenges
of conforming to governmental regulations. These pressures put at risk many traditional foods as well as
traditional processing techniques still available today. SMEs using locally sourced raw materials and
century-old recipes and processing methods are a cornerstone of the cultural identity of European
regions. In the urban centres, groups of consumers are increasingly demanding traditional, local and/or
organic food productions, as food scandals and the dispute on GMO undermine public confidence in
industrial food producing systems. To economically survive and to partake in these modern consumer
markets, SMEs producing traditional foods must extend their skills, both in terms of business
development and production techniques, to comply with existing European regulations and to promote
the aspects of their products related to nutrition and health.
To support these traditional SMEs, the TRAFOON project has set sail in November 2013 to establish a
knowledge transfer network with a focus on food products made of grains, fish, fruits, vegetables and
mushrooms to support traditional food producing SMEs. The current report consists of a detailed
overview of the US market on the following food product sectors:
Foods made from freshwater fish;
Traditional foods made of grains;
Traditional foods made of fruits and olives;
Traditional foods made of vegetables and mushrooms.

US Market Overview| SPI
6
2. Trade overview
The United States (US) has been running consistent trade deficits over the last five decades due to high
imports of computer and electronic products, oil and gas, transportation equipment, and apparel
manufacturing products. Despite the trade deficits, in the food sector the US trade balance has been
positive since 2006. Nevertheless, this positive balance has been decreasing over the last years,
indicating that US demand for food products is growing. In 2015, the food trade balance was
approximately +4.7 billion dollars, a trade surplus about three times lower than in 2013. This drop in the
US food trade surplus was primarily a consequence of the increase of the trade surplus of meat products
(+$15.0bn to +$8.5bn), grain and oilseed milling products (+$5.0bn to +$3.5bn) and dairy products
(+$4.4bn to +$2.6bn); and the decrease of the trade deficits of fruit & vegetables preserves ( -$2.3bn to -
$3.0bn), bakery & tortilla (-$1.9bn to -$2.4bn), and sugar & confectionary goods (-$3.8bn to -$4.3bn).
Contrarily to the US world trade balance of food, the US trade balance of food products with the EU has
been in deficit over more than one decade. Between 2013 and 2015, the food trade deficit with the EU
increased 51% (-$3.1bn to -$4.7bn), as a result of a two-fold increase in the trade deficit of preserved
fruit and vegetables (-$346m to -$716m), and a 30% increase in the trade deficit of dairy products (-
$1.0bn to -$1.3bn). Food imports from the EU to the US ($8.7bn, Figure 1) mostly consist in imports of
grain and oilseed milling products (20%), dairy products (16%), preserved fruit and vegetables (15%),
sugar and confectionary products (11%) and bakery and tortilla products (10%); whereas the majority of
food exports from the US to the EU ($4.0bn) correspond to exports of grain and oilseed milling products
(28%), meat products (16%) and preserved fruit and vegetables (16%).

US Market Overview| SPI
7
19%
17%
16%15%
12%
8%
5%5% 2%
US food imports from all countries
Meat products
Grain & oilseed milling products
Preserved fruits and vegetables
Nesoi food products
Sugar and confectionary products
Bakery & tortilla products
Dairy products
Seafood products
Other food products
20%
16%
15%15%
11%
10%
7%2%3%
US food imports from the EU
Grain & oilseed milling products
Dairy products
Preserved fruit and vegetables
Nesoi food products
Sugar & confectionary products
Bakery & tortilla products
Meat products
Seafood products
Other food products
Figure 1 – US food imports from all countries and from the EU

US Market Overview| SPI
8
3. Product Market Review
3.1. Foods Made from Freshwater Fish
3.1.1. Import/export trends 2013-2015
The US seafood trade deficit reached $14.3 billion in 2014, making it one of the country’s largest
commodity trade deficits. Although both seafood imports and exports have been growing over the past
decade, imports have grown at a quicker rate compared to exports. The rate of growth of seafood
imports increased from approximately 3.4% over the 2005-2009 period to approximately 9.3% over the
2010-2015 period. Currently, the US is the second largest importer of seafood in the world1, but only
about 4% of seafood imports are from the European Union (2015).
The US trade balance of fresh or chilled fish with the world has been in deficit over the last years.
Between 2013 and 2015, the trade deficit has increased 30% (-$1.0bn to -$1.3bn), mostly due to a 70%
decrease in exports of fresh or chilled fish. The most pronounced decrease was seen for the exports of
fresh or chilled salmon, since these have decreased from $66m in 2013 to $33m in 2015. Likewise, the
US trade balance of fresh fish (cold or chilled) with the EU has also been in deficit over the last years (-
$90m in 2015). The balance has not changed significantly from 2013 to 2015, but some trends are
observed for the imports and exports of some fish species. Between 2013 and 2015, imports of fresh
salmon from the EU to the US, which account for 60% of all fresh fish imports, decreased by 20% ($75m
to $60m); whereas imports of fresh and chilled trout fish more than doubled ($1.7m to $4.0m). In terms
of exports, exports of fresh rays and skates decreased by almost half ($4.7m to $2.6m), and in contrast,
exports of fresh salmon increased more than four times ($0.7m to $2.9m).
Contrarily to the US trade balances of fresh or chilled fish, both US trade balances of frozen fish with the
world and the EU have been positive over the last few years (+$1.4bn and +$216m in 2015,
respectively). Several trends in the imports of frozen fish from the EU to the US are observed. Between
2013 and 2015, imports of frozen tooth fish, accounting for nearly 50% of all imports of frozen fish from
the EU, almost doubled (from $5.3 to $10.2) and imports of frozen swordfish, representing about 14% of
frozen fish imports from the EU, have grown almost four times ($0.8m to $3.0m). In opposition, imports
of frozen sole dropped more than three times over the same period ($8.2m to $2.5m). In terms of
exports, a positive trend is observed for the exports of sockeye salmon from US to EU; these more than
doubled from 2013 to 2015 ($98m to $202m).
1 https://www.islandsbanki.is/library/Skrar/Seafood-Reports/International_Seafood_Report_low.pdf
US Market Overview| SPI
9
The US trade balance of fish fillets with the world has been in deficit over the past decade (-$3.9bn), as
imports have been about four times superior to exports ($5.0bn versus $1.2bn). In opposition, the US
trade balance of fish fillets with the EU has been positive over the past years (+$355m) because imports
have been about four times lower than exports ($101m versus $456). Imports of fish fillets from EU to
US have grown by 20% between 2013 and 2015, as imports of fresh or chilled salmon fillets,
representing around 60% of these imports, expanded 40% ($45m to $63m) over this period. Despite
only accounting for 4% of fish fillets from EU, imports of tuna fillets have also grown more than four
times: from $0.9m in 2013 to $3.9m in 2015. In contrast, imports of cod fillets from EU decreased by
almost half between 2013 and 2015 ($5.9m to $3.1m). Most exports of fish fillets from US to EU which
mostly consist in exports of Alaska Pollock fillets ($307 out of $456m) did not vary significantly over the
last years.
Both US trade balances of dried or salted fish with the world and the EU have been in deficit and
continuously decreasing over the past years. The US trade deficit of dried or salted fish with the world
has increased from -$233m in 2013 to -$267m in 2015 and the US trade deficit of dried or salted fish
with the EU has increased from -$55m in 2013 to -$76m in 2015. The 38% increase in the trade deficit of
dried or salted fish with the EU was mostly because imports increased by 28% ($65m to $81m) and
exports decreased by nearly half ($9.9m to $4.7m). This 28% growth in imports between 2013 and 2015
was mostly because smoked salmon imports, representing more than 95% of imports of dried or salted
fish from the EU, expanded by 28%; whereas the pronounced decrease in exports was mostly due to the
three-fold decrease in dried or smoked fish liver and roe exports, which account for more than half of
the dried or salted fish exports to the EU.
The US trade balance of prepared or preserved fish with the world has been negative over the past
decade (-$1.1bn in 2015). In 2015, imports totalled $1.5bn, a value more than three times higher than
exports. Within imports, a positive trend is observed for prepared or preserved eels. Imports of
prepared or preserved eels to the US more than doubled from 2013 to 2015 ($26m to $59m). Contrarily
to the US trade balance of prepared or preserved fish with the world, the US trade balance of prepared
or preserved fish with the EU has been positive over the past years ($14m). In 2015, the exports were
slightly higher than imports ($90.6m versus $76.6m in 2015). Some trends in the imports and exports of
some categories of prepared or preserved fish are observed. From 2013 to 2015, imports of prepared or
preserved sardines, accounting for 36% of total imports from the EU to the US, dropped by 23%; while
exports of prepared or preserved anchovies representing about 12% of total imports from the US to the
EU have grown 20%. On the other hand, exports of caviar or caviar substitutes from fish eggs to the US
expanded by 80% over the same period of time ($9.3m to $16.1).

US Market Overview| SPI
10
3.1.2. Market Potential Barriers and Opportunities
The US is experiencing an increasing demand for fish, mostly due to three factors. The first factor is a
change in consumer behaviour. US consumers are eating more fish because there is a growing interest
for healthy lifestyles which emphasize the importance of choosing seafood as a protein source during
meals2. The second factor is the change of the US consumer demographics. Since low-income
householders (under $10,000) are typically less likely to consume high amounts of fish3, the
improvement per capita disposable income over the last decade has resulted in an increase of fish
consumption4. The third factor is the fish domestic supply. Currently, US seafood supply can only meet
about 10% of its demand, and this supply has been decreasing over the time5. One of the main reasons
underlying the decrease in the seafood supply is the temperature increase of the Pacific Ocean seawater
which makes the plankton a less efficient energy source for fish. According to National Oceanic and
Atmospheric Administration (NOAA), the catch numbers of Alaskan Pollock, the number one fished
seafood in the US, declined by about 40% over the last 4 years due to the temperature increase of the
seawater 6
.
Accompanying the high and increasing US demand for fish, companies are great in number with widely
varying business models across the US industry. In the crowded market of seafood, strong branding and
marketing have been the main differentiators, whether it is a vertically integrated company or a market-
facing company7. Since there is a market pressure for companies to reduce their products price due to
the severe competition, the required branding and marketing support needs to be balanced with a
reduction of production costs. As a result, the biggest challenge fish companies are currently facing is
the need of a reduction of costs without compromising quality and reliability of their products8.
Apart from the referred market barriers, there are also some legal requirements for the importation of
fish. The importation of fish is regulated by three federal government agencies: Food and Drug
Administration (FDA), the National Marine Fisheries Service (NMFS) and the Fish and Wildlife Service
2 The new U.S. Dietary Guidelines include a recommendation to choose seafood as the protein choice in meals:
"Shifts are needed within the protein foods group to increase seafood intake. (…) Strategies to increase the variety of protein foods include incorporating seafood as the protein foods choice in meals twice per week in place of meat, poultry, or eggs." https://health.gov/dietaryguidelines/2015/guidelines/chapter-2/a-closer-look-at-current-intakes-and-recommended-shifts/#food-groups 3 http://www5.agr.gc.ca/resources/prod/Internet-Internet/MISB-DGSIM/ATS-SEA/PDF/6096-eng.pdf
4 http://www.ibisworld.com/industry/default.aspx?indid=1044
5 http://www.thefishsite.com/fishnews/25541/new-report-highlights-trends-insights-in-the-us-seafood-industry/
6 https://www.qsrmagazine.com/reports/sea-change
7 http://seafoodbusiness.epubxp.com/i/300651-may-2014/22
8 http://www.trimarinegroup.com/solutions/brands.html

US Market Overview| SPI
11
(FWS)9. The FDA, aiming at protecting and promoting public health, is responsible for ensuring that the
nation’s fish supply, both domestic and imported, is safe, sanitary, wholesome, and honestly labelled10
.
The NMFS, which manages the nation's living marine resources and their habitat, has the NOAA Seafood
Inspection Program which provides international inspection services to foreign processors and importers
to assist industry in meeting U.S. regulations and requirements11
. Finally, the FWS, dedicated to the
management of fish, wildlife, and natural habitats, restricts the quantity of caviar imported to US12
.
3.1.3. Market Trends
In the US, fish is estimated to make only a tenth of overall protein purchase. However, the growth in fish
consumption over the last years (see section 3.1.1) presents an opportunity for industry to target new
consumers. Currently, the most significant segment of fish consumers consist in households with an
annual income between $20,000 and $60,000, although single-person households and households of
three to four people also represent important consumer segments. The Americans who live in the
Southern or Western US have a higher preference for fish compared to other regions and consumers
who are aged 55 and over also consume higher amounts of fish compared to the younger consumers.
Almost all US consumers (97%) eat fish at home (rather than carried from home and eaten elsewhere)
and primarily as a main dish (90%) and during dinner (77%). Fish is mainly consumed on weekdays and,
during the week, Friday is the most popular day for the consumption of fish. US consumers also eat
more often fish during winter and spring than during other seasons13
.
In order to adapt to the consumer behaviour, fish companies have invested significantly in the
development of new products. Between January 2008 and November 2011, one third of all fish launches
consisted in completely new products, mostly as a response to new consumer trends. Currently, US
consumers are primarily looking for fish products which are healthy and convenient. Since US
consumers see fish as a healthy alternative to other proteins. They also look for fish products which
have healthy attributes such as organic, no additives, no preservatives, no antibiotics/hormones and
low, no, or reduced sodium. In addition, because US consumers spend the least amount of time cooking,
compared to others in the world, they look for fish which can be easily prepared and consumed. US
consumers prefer fish packages which are resalable, “ready-to-cook” or that contain on-package recipe
9 https://help.cbp.gov/app/answers/detail/a_id/204/~/regulations-for-importing-seafood
10 http://www.fda.gov/Food/PopularTopics/ucm341987.htm
11 http://www.seafood.nmfs.noaa.gov/program_services/program_services.html
12 https://help.cbp.gov/app/answers/detail/a_id/204/~/regulations-for-importing-seafood
13 http://www5.agr.gc.ca/resources/prod/Internet-Internet/MISB-DGSIM/ATS-SEA/PDF/6096-eng.pdf

US Market Overview| SPI
12
ideas14,15
. Apart from the fish attributes, US consumers are also concerned about healthy stocks and
sustainability when it comes to their fish choices. According to a 2012 Mintel survey, almost all US
consumers (86%) are concerned about the stock status of the seafood they consume and more than half
of them would like to see information about sustainability on packaging16
.
3.1.4. Sample Key Market Stakeholders
The top fish companies in terms of US sales develop and provide products to US consumers taking into
account their latest needs and preferences, as well as by considering the global sustainability of the
stocks. Table 1 indicates some innovative products that have been recently launched by some of these
companies, as well as their initiatives to promote fish sustainability.
14
http://www.preparedfoods.com/articles/115138-top-seafood-trends-in-2015 15
http://www.technavio.com/report/global-food-fish-and-seafood-market 16
http://wwf.panda.org/wwf_news/?217632/Seafood-consumption-trends-in-the-US-and-the-Coral-Triangle-connection

US Market Overview| SPI
13
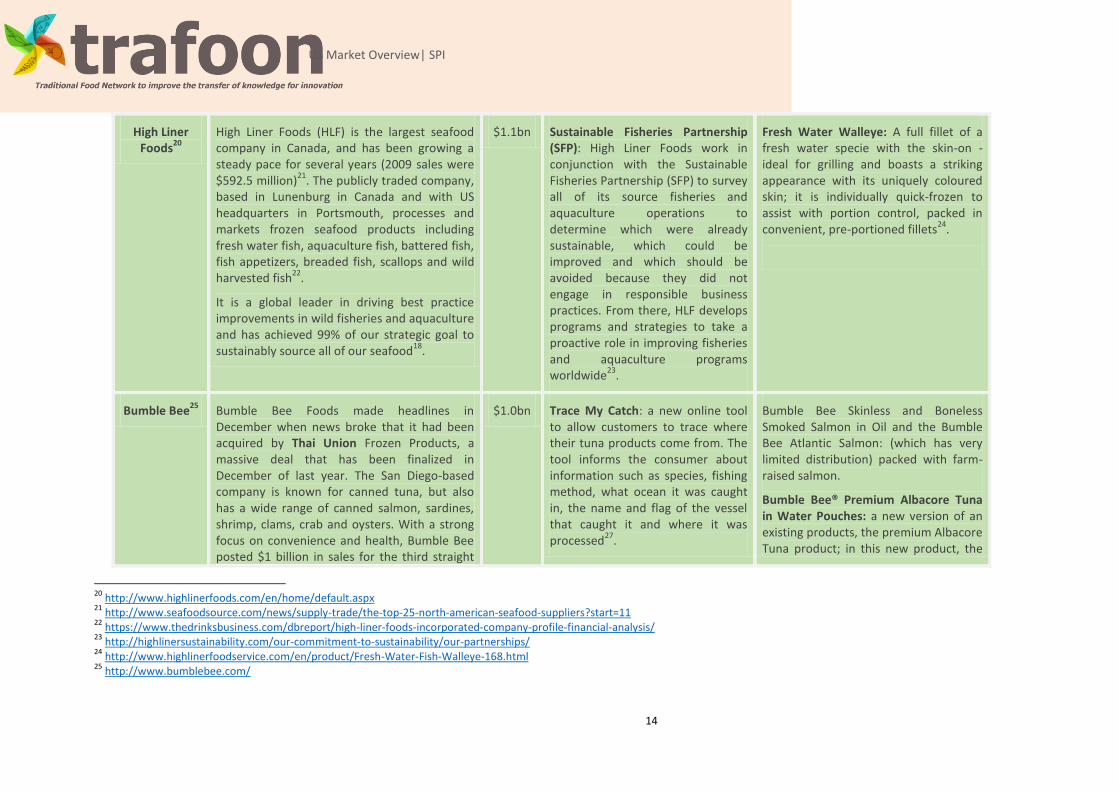
Table 1 – Sustainability initiatives and recent launches of some US seafood fresh water fish companies
Supplier name Supplier Profile
North America Sales in 2015
17
Sustainability programs Recent launches
Tri Marine International
17
Tri Marine International is one of the world’s leading raw material suppliers for the tuna industry. Based in Bellevue, Wash., Tri Marine owns several freshwater tuna fisheries and supplies leading tuna brands worldwide, operating its own 14 purse seiners among other vessels and carrier ships, as well as processing plants at strategic sites like San Pedro, Calif.; Port Louis, Mauritius; the Solomon Islands; the Marshall Islands; Ningbo, China; Barranquilla, Colombia; and Manta, Ecuador.
$1.3bn Responsibly caught products: Tri Marine’s own brand, Ocean Naturals, uses only these sources for their premium, responsibly caught products. Rated by Monterey Bay Aquarium’s Seafood Watch Green or Yellow, and/or certified to the Marine Stewardship Council’s (MSC) standards for sustainable seafood
18 .
Ultra Low Temperature (ULT) yellowfin tuna: the new ULT tuna is caught both by long-line vessels in the Solomon Islands and by hand line in small fisheries in North Sulawesi, Indonesia. The long-line tuna is immediately frozen on the vessel and stored at minus 76 degrees Fahrenheit. The process of freezing and defrosting was developed after 10 years of research. The process reproduces the traditional Japanese method for thawing sashimi tuna on a commercial scale. The result is an artisan-quality product with important health benefits. Freezing tuna at ultra low temperatures suspends bacterial actions, kills parasites and drastically reduces the risk of histamine. Tri Marine thawing technology ensures the freshest-tasting tuna by preserving its natural colour and texture without the use of any chemical preservatives or enhancers
19.
17
http://www.trimarinegroup.com/ 18
http://www.trimarinegroup.com/activities/sustainability.html#_SUB_2 19
https://www.linkedin.com/pulse/tri-marine-returns-seafood-expo-north-america-after-nearly-orsini
US Market Overview| SPI
14
High Liner Foods
20
High Liner Foods (HLF) is the largest seafood company in Canada, and has been growing a steady pace for several years (2009 sales were $592.5 million)
21. The publicly traded company,
based in Lunenburg in Canada and with US headquarters in Portsmouth, processes and markets frozen seafood products including fresh water fish, aquaculture fish, battered fish, fish appetizers, breaded fish, scallops and wild harvested fish
22.
It is a global leader in driving best practice improvements in wild fisheries and aquaculture and has achieved 99% of our strategic goal to sustainably source all of our seafood
18.
$1.1bn Sustainable Fisheries Partnership (SFP): High Liner Foods work in conjunction with the Sustainable Fisheries Partnership (SFP) to survey all of its source fisheries and aquaculture operations to determine which were already sustainable, which could be improved and which should be avoided because they did not engage in responsible business practices. From there, HLF develops programs and strategies to take a proactive role in improving fisheries and aquaculture programs worldwide
23.
Fresh Water Walleye: A full fillet of a fresh water specie with the skin-on - ideal for grilling and boasts a striking appearance with its uniquely coloured skin; it is individually quick-frozen to assist with portion control, packed in convenient, pre-portioned fillets
24.
Bumble Bee25
Bumble Bee Foods made headlines in December when news broke that it had been acquired by Thai Union Frozen Products, a massive deal that has been finalized in December of last year. The San Diego-based company is known for canned tuna, but also has a wide range of canned salmon, sardines, shrimp, clams, crab and oysters. With a strong focus on convenience and health, Bumble Bee posted $1 billion in sales for the third straight
$1.0bn Trace My Catch: a new online tool to allow customers to trace where their tuna products come from. The tool informs the consumer about information such as species, fishing method, what ocean it was caught in, the name and flag of the vessel that caught it and where it was processed
27.
Bumble Bee Skinless and Boneless Smoked Salmon in Oil and the Bumble Bee Atlantic Salmon: (which has very limited distribution) packed with farm-raised salmon.
Bumble Bee® Premium Albacore Tuna in Water Pouches: a new version of an existing products, the premium Albacore Tuna product; in this new product, the
20
http://www.highlinerfoods.com/en/home/default.aspx 21
http://www.seafoodsource.com/news/supply-trade/the-top-25-north-american-seafood-suppliers?start=11 22
https://www.thedrinksbusiness.com/dbreport/high-liner-foods-incorporated-company-profile-financial-analysis/ 23
http://highlinersustainability.com/our-commitment-to-sustainability/our-partnerships/ 24
http://www.highlinerfoodservice.com/en/product/Fresh-Water-Fish-Walleye-168.html 25
http://www.bumblebee.com/

US Market Overview| SPI
15
year and, despite undulating raw material prices worldwide, its sales have never declined over the past decade. The Company also acquired Anova Food in late 2013
26.
premium Albacore Tuna is in a convenient vacuum-sealed pouch with a tear-open strip to facilitate the preparation of sandwiches, salads and seafood recipes. It has been developed to be an on-the-go ingredient for Summer meals
28.
Nippon Suisan USA
29
Nippon Suisan USA (Nissui) has a diverse seafood portfolio that includes Gorton’s and F.W. Bryce (Gloucester, Mass.), King & Prince Seafood (Brunswick, Ga.), Unisea (Redmond, Wash.) and Glacier Fish Co. (Seattle).
Nissui also owns numerous companies around the world, including Salmones Antártica SA
30, a
company of fish farming established in April of 1979 for the purpose of salmon farming under the name Domsea Pesquera Chile Limitada. Today, the Company uses seamless aquaculture system that starts with the production of feed for fish farming, goes on to the culturing of nursery fish, the raising of juvenile fish in freshwater, and farming of the fish in seawater. Using these aquaculture methods, the Company has become a five-star brand,
$860m ISO14001 certification: Nissui promotes the acquisition of ISO14001 certification, which is the international standard for environmental management. As of the end of July 2014, a total of 63 locations (offices, domestic consolidated subsidiaries, and Group companies combined) had acquired ISO14001 certification
32.
Smoked freshwater salmon: Nissui will launch a line of smoked salmon. The salmon will come from the Salmones Antártica, a freshwater fish farm owned by Nippon Suisan
33.
27
http://www.bumblebee.com/tracemycatch/ 26
http://www.seafoodsource.com/news/supply-trade/the-top-25-north-american-seafood-suppliers?start=11 28
http://www.bumblebee.com/products/tuna/bumble-bee-premium-albacore-tuna-in-water-pouch/ 29
http://www.nissui.co.jp/english/index.html 30
http://www.salmonesantartica.cl/

US Market Overview| SPI
16
producing safe salmon and trout of superb quality that it sells all over the world
31.
32
http://www.nissui.co.jp/english/social/environment/management.html 33
http://www.intrafish.com/news/613236/nippon-suisan-launches-new-smoked-salmon-brand-through-chilean-affiliate 31
http://www.nissui.co.jp/english/business/network/world.html

US Market Overview| SPI
17
3.2. Traditional Foods Made of Grains
3.2.1. Import/export trends 2013-2015
Both US trade balances of cereal grains with the world and the EU have been in deficit over the past
decade. In 2015, the cereal grains’ deficit with the world was equal to -$1.9bn, while the cereal grains’
deficit with the EU corresponded to -$624m. In both cases, the observed deficit is mostly a consequence
of the high imports of bread, pastry, cakes, biscuits and other baker’s wares (in 2015: $4bn from world
to the US and $642m from the EU to the US).
The US trade balance of cereal grains with the EU has been in deficit over the last 5 years. Between 2013
and 2015, this deficit almost doubled (-$5.0m to -$11.9m), as cereal grains imports from the EU to the
US have significantly increased over this period ($6.5m to $14.1m). The US deficit of cereals grains with
the world also doubled from 2013 (-$49m) to 2015 (-$110m). This deficit increase was not only due to a
growth in the imports of cereal grains from the world to the US ($167m to $197m), but also a result of a
drop in exports of cereal grains from the US to the world ($118m to $83m).
The US trade balance of cereal groats with the EU has been in deficit over more than one decade
because exports of cereal groats from the US to the EU have been very low ($213,000 in 2015). In
opposition with the US deficit of cereal groats with the world which more than doubled between 2013
and 2015 (-$32m to -$79m), the US deficit of cereal groats with the EU has only increased by 30% over
the same period (-$10m to -$13m).
Despite still having a deficit in 2013 (-$0.9m), the US trade balance of cereal flours with the EU is now
positive ($1.4m in 2015). This change is mostly because cereal flours exports from the US to the EU have
been increasing at a quicker growth rate compared to cereal flours imports from the EU to the US. From
2013 to 2015, cereal flours imports from the EU to the US almost doubled ($2.6m) to 2015 ($4.3m),
whereas US exports of cereal flours to the EU expanded almost four times ($1.6m to $5.7m). The US
trade balance of cereal flours with the world is also positive. In 2015, this trade balance was equal to
+$5.8m, as cereal flours exports from the US to world were slightly higher ($89m) than cereal flours
imports from the world to the US ($83m).
The US trade balance of foods prepared by swell cereals (FSC) with the EU have been in deficit (-$33m in
2015) over the past decade, as imports have been about 3 times higher than exports ($45m versus
$12m in 2015). In contrast, the US trade balance of FSC with the world has been positive over the same
period. Just between 2013 and 2015, this trade balance almost doubled (+$130m to +$215m) mostly
because imports from the world to the US decreased by 8% ($583m to $539m).

US Market Overview| SPI
18
Both US trade balances of bread, pastry, cakes, biscuits and other baker’s wares (BCBO) with the world
and with the EU have been in deficit over the past decade (-$2.0bn and -$568m, respectively). In the
case of the US trade with the world, the deficit of BCBO has increased by 43% between 2013 and 2015 (-
$1.4bn to -$2.0bn). This deficit increase has been mostly a consequence of an expansion of BCBO
imports from the world to the US over this period of time ($3.4bn in 2013 to $4.0bn in 2015).
3.2.2. Market Potential Barriers and Opportunities
The US Grain Industry has an important production potential, even when evaluated on a global scale.
The US is currently the world’s largest wheat, corn and sorghum exporter. The country is estimated to
export annually: 55-60 million tons of wheat, 35-40 million tons of corn and 3-4 million tons of sorghum.
According to a study titled “American Flour Milling” by John C. Miller, the former Chairman and CEO of
the North American Millers’ Association, there are 170 mills belonging to 45 companies with a daily 80
thousand-ton capacity. When the milling companies are evaluated in terms of capacity, 40% have daily
processing capacity over 454 tons, 26% between 228 and 453 tons, 19% between 46 and 227 tons, 6%
between 19 and 45 tons and 14% under 18 tons.
Although the US is the world’s largest exporter of some grain categories, the US grain market still
present an opportunity for companies from both developed and developing countries. This is because
most grains produced in the US become either animal feed or processed into sweeteners, corn oil, and
industrial products like ethanol fuel. In addition, since almost all grains produced in the US are
genetically modified, the US relies in the importation of non-GMO grains in order to respond to the high
and growing demand of non-GMO grains among consumers (details in section 3.2.3)34
.
In the US, the grain market is greatly influenced by the fluctuation in the price of grain commodities.
There are four factors influencing the price level of grain commodities that deserve particular attention
(Table 2). The first corresponds to the weather changes. The grains’ price rises due to shortfalls, which
are often a result of natural disasters such as the El Nino tornadoes. The second consists in the GMO
farming. Although the demand for GMO grain products has been decreasing in the US due to its
unhealthy perception, GMO seeds in farming are still popular among US farmers due to the more
competitive yields. Since the introduction of GMO seeds in the US farming, price of GMO grain
commodities have been dropping as a consequence of the pronounced increase of grains supply35
. The
third corresponds to the strength of the US dollar. The strength of the US dollar against other
34
https://munchies.vice.com/en/articles/the-us-is-the-worlds-largest-producer-of-corn-so-why-are-we-importing-more 35
https://www.geneticliteracyproject.org/2015/02/04/money-talks-some-farmers-go-non-gmo-because-of-price-premiums-not-rejection-of-biotech/

US Market Overview| SPI
19
currencies, particularly against emerging market currencies, greatly influences the grain price in the US.
As the US dollar currency gains strength compared to other currencies, grains get more expensive in a
global scale36
. The fourth factor is the increasing use of grains in the production of industrial bioethanol.
In the US, bioethanol production, mostly from corn, increased from 6.2 billion litters in 2000 to 50 billion
litters in 2010. This application of grain commodities causes a rise in the price of grain commodities, as a
result of the increased demand of grains for bioethanol production37
.
Table 2 – Factors determining the price of grain commondities in the US.
Factor Consequence Effect in price
Natural disasters Decrease in supply Increase
GMO farming Increase in supply Decrease
Strength of US dollar currency - Increase
Bioethanol production Increase in demand Increase
There are no particular legal barriers to export grain products to the US, besides the standard US
requirements for imported food. Similar to other food imports, companies intending to import grain
products should be “responsible for ensuring that the products are safe, sanitary, and labelled according
to US requirements”. Imported food products are subject to FDA inspection when offered for import at
US ports of entry. The FDA may detain shipments of products offered for import if the shipments are
found not to be in compliance with US requirements38
.
3.2.3. Market Trends
The US consumption of grains increased between the 70’s and the 90’s due to the rising population and
incomes. However, the switch from low-fat diets to low-carbohydrate diets (such as the Dr. Atkins Diet
Revolution and the South Beach Diet) at the beginning of the 21st
century led to a drop in the US
consumption of grains. For example, the US wheat consumption has increased from 110 pounds per
person in 1970 to 147 pounds per person in 1998, but it has dropped to 134 pounds per person in
201239
.
The 2005 Dietary Guidelines for Americans recommend “the consumption of 6 equivalents (oz-eq) of
grains per day with whole grains accounting for at least half of this amount (for those on a 2000-calorie-
36
http://www.ft.com/cms/s/0/cf841d5c-58d3-11e6-9f70-badea1b336d4.html#axzz4JaSW3Edf 37
http://pubs.acs.org/doi/pdf/10.1021/bk-2011-1089.ch001 38
http://www.fda.gov/Food/GuidanceRegulation/ImportsExports/Importing/ 39
http://scitechconnect.elsevier.com/wp-content/uploads/2015/12/Consumer-Trends-in-Grain-Consumption-1.pdf

US Market Overview| SPI
20
per-day diet)”. However, it is believed that US consumers are eating on average about two more grain
servings than recommended (8.1 oz-eq of grains per person per day versus the 6 recommended) and
that only 10% of these servings consist in whole grains31
. Despite the misalignment between the
recommended consumption and the actual consumption of whole grains, the US still represents the
world’s largest market of whole grain and high fibre foods due to its large population and high GDP. A
growing demand for whole grain foods has been particularly observed among people with sensitive
digestive system, as these foods are low in glycaemic levels, have lower calories and a higher nutritional
value40
.
There are other trends observed in the consumption of grain foods among US consumers. The first
corresponds to the decreasing consumption of bread over the past few years, which is mostly a
consequence of the unhealthy perception consumers have in regards to bread, as well as a result of the
consumer switch to easy to carry and easy to prepare foods. The consumption of one bread category,
the whole grain bread, has been however growing since 2006 as a result of its perceived high nutritive
level, good taste and uniqueness. In opposition with the decreased consumption of bread, pasta
consumption has continued to be popular among US consumers over the past decade. The main reasons
for its continuing popularity are its low price, quick time of preparation and multiple applications. Like in
the case of bread, there has been also an increasing demand for the wholegrain category. Although
wholegrain pasta is still only holding about 7% share of the dry pasta market, whose market has an
annual growth rate of about 16%. Wholegrain pasta consumers explain their preference by its high
nutritive level, good taste and appealing appearance and texture41
.
In the particular case of baker wares, such as pastry cakes and biscuits, US consumers are no longer
looking for the “no words” in the package label, as “reduced”, “low”, “free” or “aren´t”. Currently, the
consumer perception of health has been switched from focusing on what the food is missing (e.g.
“reduced fat”, “low calories” and “sugar-free”) to what the food itself is (e.g. “non-GMO”, “clean label”,
“simple” and “wholesome ingredients”). As a result of this consumer switch, transparency, clean label
and adventurous but not artificial flavours are the major bakery trends in the US market42
.
Besides the growing demand for the wholegrain bread, pasta and bakery with a clean label and
wholesome ingredients, an increasing demand for gluten-free specialty has also been observed among
40
http://www.nutraceuticalsworld.com/contents/view_breaking-news/2014-09-25/whole-grain-high-fiber-foods-market-to-reach-295-billion-by-2020 41
http://www.uswheat.org/meetingsEvents.nsf/8a606fec2e9cb09f8525763900652ea9/b4b96c17b78ef7b985257a4b0061e917/$FILE/Aportando%20Valor%20Agregado%20a%20sus%20Productos%20-%20Mike%20Veal.pdf
42
http://www.world-grain.com/articles/news_home/World_Grain_News/2016/06/Trends_to_watch_in_the_baked_f.aspx?ID={032353F8-25FD-4E25-A6B3-32360F738B29}

US Market Overview| SPI
21
US consumers. Although the demand is expected to continue growing in the future for those diagnosed
with Celiac Disease, it is uncertain how demand of gluten-free grain products will evolve for those who
are following for diet or health reasons. Although US consumers are in general seeking more convenient
ways to include grains in their diet (e.g. by buying ready-to-eat pasta, ready-to-eat rice and pizza
crusts)43
, this particular group of US consumers (with celiac disease) looks for convenient gluten-free
solutions, such as frozen meals and ready-to-eat-meals, that have a good taste and are affordable44
.
3.2.4. Sample Key Market Stakeholders
Besides the continuing interest in providing cereal foods which are easy to prepare and consume, US
grain companies have been focused in the development of speciality products with a growing demand,
such as the whole grain, non-GMO and gluten-free foods. Table 3 indicates recent launches by some of
these companies.
43
http://www2.ca.uky.edu/agcomm/pubs/ip/ip58b/ip58b.htm 44
http://www.uswheat.org/meetingsEvents.nsf/8a606fec2e9cb09f8525763900652ea9/b4b96c17b78ef7b985257a4b0061e917/$FILE/Aportando%20Valor%20Agregado%20a%20sus%20Productos%20-%20Mike%20Veal.pdf

US Market Overview| SPI
22
Table 3 – Some snacks and meals containing grains recently launched in the US
Company45
name
Company Profile Annual Sales Recent launches
Ardent Mills Ardent Mills is a recent company, born from two industry pioneers, ConAgra Mills and Horizon Mills, which themselves were jointly ventures of Cargill and CHS. The company, based in Denver, state of Colorado, offers the industry’s broadest range of flours, mixes, blends and specialty products, customized to meet its customer needs and backed by unrivalled technical support, customer service and the supply assurance of a coast-to-coast network. Ardent Mills’ operations and services are supported by more than 40 flour mills and bakery-mix facilities along with a specialty bakery and Mobile Innovation Center, all located in the U.S., Canada and Puerto Rico
46.
ConAgra Mills: $9bn (2015)
47
Horizon Mills: $2.5bn
(2012)48
Sustagrain: Snack foods developed to satisfy consumers who are asking for healthier options that do not compromise the snacking experience. Sustagrain, made of highest-fibre whole grains, delivers a host of fibre and whole grain benefits, even in extruded snacks. Sustagrain has over 3 times the dietary fibre of oats and corn flour, and at least 10 times the fibre of brown rice. This proprietary variety of barley has a balanced blend of insoluble and soluble fibres, with the highest level of beta-glucan and the lowest glycemic index of any grain. Truly a superfood, all-natural Sustagrain promotes sustained energy, satiety and digestive and heart health. It is available in flour and flakes, making it the perfect addition to extruded snacks, chips, cereals, crackers and more
49.
Archer Daniels Midland
The Archer Daniels Midland (ADM) Company is an American global food processing and commodities trading corporation, headquartered in Chicago, Illinois. The company is one of the largest agricultural processors in the world. It serves as a vital link between farmers and consumers. The take crops and process them to make food ingredients, animal feed ingredients, renewable fuels
$63bn (2011) Confectionery Moulding Starch product line: a new line of starches that offers food-grade moulding capabilities to confectionery and gum customers. The Confectionary Moulding Starch products are starch-based with added mineral or high-stability vegetable oil to allow the product to accept and hold impressions. Advantages for customers include high food-grade quality, decreased drying times and an ability to accept high-
45
http://www.independent.co.uk/news/uk/home-news/the-big-five-companies-that-control-the-worlds-grain-trade-8462266.html 46
Adapted from: http://www.ardentmills.com/ 47
http://www.bakingbusiness.com/articles/news_home/Business/2015/11/Ardent_Mills_stake_to_stay_wit.aspx?ID=%7B1D4F6287-9114-4B58-AAEF-1321E847947E%7D 48
http://finance.yahoo.com/news/conagra-forms-co-ardent-mills-173835375.html 49
http://www.ardentmills.com/sustagrain.html

US Market Overview| SPI
23
and naturally derived alternatives to industrial chemicals
50.
quality implantation including shapes and letters. They are also non-GMO
51.
Bunge Bunge is a leading agribusiness and food company with integrated operations that circle the globe, stretching from the farm field to the retail shelf. It operates a global network of facilities, including grain elevators, oilseed processing plants and port terminals that are located in the world's largest agricultural production regions, in areas of fast-growing food consumption and close to major transportation systems. These industrial facilities are complemented by marketing and trading offices, as well as joint venture operations, on six continents
52. In the
US, the Company sells dry milled corn ingredients, including conventional, whole grain, and fibre-enhanced corn meals and flours, and corn fibres. It also sells milled conventional and whole grain Calrose medium grain rice.
$58bn (2014)
53
Non-GMO corn product line: A genetically modified (GMO) free product line developed to meet the request of customers for more non-GMO products. To ensure Bunge will be offering milled corn products that may be labelled as non-MO, Bunge has certified its operation to ensure products will be operating within Non-GMO Project verified standards. An initiative dating back to 2007, products approved under the standard first appeared on supermarket shelves in 2010
54.
The General Mills
55
General Mills is a manufacturer and marketer of branded consumer foods sold through retail stores. The Company is a supplier of branded and unbranded food products to the North American foodservice and commercial baking industries. The Company offers a range of food products with a focus on categories, including ready-to-eat cereal; convenient meals, including meal kits, ethnic meals, pizza, soup, side dish mixes, frozen breakfast and frozen
$10bn (US, 2015)
$4.6bn (international,
2015)
Guten-free Cheerios: The gluten-free Cheerios will continue to include oats, which are gluten-free but must be handled properly to avoid mixing in with gluten-containing grains such as wheat. The gluten-free Cheerios meet the Food and Drug Administration’s rule for gluten-free labelling, according to General Mills. Only Multi-grain Cheerios needed reformulation. Sorghum and millet, both gluten-free, replaced wheat and barley. According to the Company CEO, the launch of these
50
Adapted from: http://www.adm.com/en-US/company/Pages/default.aspx 51
http://www.foodbev.com/news/adm-creates-new-line-of-starches-for-confectionery-companies/ 52
Adapted from: http://www.bunge.com/About-Bunge 53
http://www.petromax.biz/bunge/ 54
http://www.foodbusinessnews.net/articles/news_home/Supplier-Innovations/2016/05/Bunge_launches_nonGMO_corn_pro.aspx?ID=%7B28DA4A79-61B0-4533-9710-0E1350B4D3A9%7D 55
https://www.generalmills.com/en/Company/Businesses

US Market Overview| SPI
24
entrees; snacks, including grain, fruit and savoury snacks, nutrition bars and frozen hot snacks; yogurt, and super-premium ice cream. The Company's other product categories include baking mixes and ingredients, and refrigerated and frozen dough. The Company's products are marketed under various brands, which include Annie's, Betty Crocker, Bisquick, Bugles, Cascadian Farm, Cheerios, Food Should Taste Good, Golden Grahams, Haagen-Dazs, Nature Valley, Oatmeal Crisp, Old El Paso, Pillsbury, and Yoplait
56.
products represents “a first step in a broad investment plan designed to renovate the basic portfolio of Cheerios for today’s wellness oriented consumer
57.”
56
Taken from: http://www.reuters.com/finance/stocks/companyProfile?symbol=GIS.N 57
http://www.bakingbusiness.com/articles/news_home/New_Products/2015/02/Coming_soon_to_retail_shelves.aspx?ID=%7BC9D86198-AFAE-40AC-9392-D9EA2B1335AB%7D

US Market Overview| SPI
25
3.3. Traditional Foods Made of Fruits and Olives
3.3.1. Import/export trends 2013-2015
Overall, there has been a growing US trade deficit in fresh and processed fruits over the last decade, as
fruit imports have been increasing at a higher rate than fruit exports. However, the trade balance of
fruits with the EU has been positive across almost all fruit categories because fruit exports from the US
to the EU have been much higher than fruit imports from the EU to the US.
The US trade balance of fresh or dried fruits with the EU has been positive over more than one decade,
as exports of fresh or dried fruits from the US to the EU have been more than ten times that of imports
of fresh or dried fruits from the EU to the US ($3.1bn versus $244m in 2015). Almost all fresh or dried
fruits exports from the US to the EU consist in exports of fresh or dried nuts ($2.8bn out of $3.1bn in
2015), whereas the most significant fraction of edible fruits imports from the EU to the US corresponds
to imports of fresh or dried nuts (38% in 2015) and fresh or dried citrus fruits (9% in 2015). Likewise, the
US trade balance of fresh or dried fruits with the world has been positive since the beginning of the 21st
century. However, some fluctuations of this trade balance are observed. The US trade balance of fresh
or dried with the world increased from +$855m in 2009 to +$3.34bn in 2013, but it has then dropped to
+$438m in 2015. This drop is mostly because imports of fresh or dried fruits have expanded by 25%
between 2013 and 2015 ($11.2bn in 2013 to $14.0bn in 2015). Among the imports of all types of fresh
or dried fruits from the world to the US, the more pronounced growth from 2013 to 2015 (between 25%
and 35%) is observed for the imports of fresh or dried dates, figs, pineapples, coconuts, Brazil nuts and
cashew nuts.
The US trade balance of preserved fruits58
with the EU has been also positive over more than one
decade. In 2015, this trade surplus was equal to +$56m because exports of preserved fruits from the US
to the EU were slightly higher than imports of preserved fruits from the EU to the US ($334m versus
$278m). More than 98% of preserved fruits exports from the US to the EU consist in exports of fruits
preserved in a liquid not made of vinegar or sugar; although, more than half of imports of preserved
fruits from the EU to the US also consist in imports of fruits preserved in a liquid not made of vinegar or
sugar. A significant part of the preserved fruits imports correspond to imports of jams, fruit jellies and
marmalades (28% in 2015) and imports of fruits preserved in vinegar (18%). Both imports of jams and
fruits preserved in a liquid not made of vinegar or sugar have expanded about 30% from 2013 to 2015.
In opposition with the US trade balance of preserved fruits with the EU, the US trade balance of
58
Preserved fruits include fruits preserved in vinegar, fruits preserved in sugar, fruits preserved in other preservant rather than vinegar and sugar and fruit jams/jellies.

US Market Overview| SPI
26
preserved fruits with the world has been in deficit over the past decade (-$1.3bn in 2015). Similarly to
the preserved fruits trading from the EU to the US, both imports of preserved fruits from the world to
the US and exports of preserved fruits from the US to the world primarily consist in imports of fruits
preserved in a liquid not made of vinegar or sugar (about 80% in 2015).
Although the US trade balance of fruit juices with the EU was positive over the past decade, the trade
surplus has been continuously decreasing since 2011, as a result of the increasing imports of fruit juices
from the EU to the US ($72m in 2013 to $161m in 2015) and the decreasing exports of fruit juices from
the US to the EU ($179m in 2013 to $128m in 2015). The 2-fold increase in fruit juices imports from the
EU to the US between 2013 and 2015 is mostly because imports of apple juice increased about four
times ($21m to $76m); whereas the 30% decrease in fruit juices exports from the US to the EU over the
same period is mostly a consequence of the pronounced drop in exports of frozen orange juice ($79m to
$46m) and cranberry juice ($52m to $39m). Contrary to the US trade balance of fruit juices with the EU,
the US trade balance of fruit juices with the world has been negative over the past decade (-$695m) and
did not vary much over the past 5 years (between 2011 and 2015). However, some trends are observed
for the imports of juices of some fruits from the world to the US. Over the past 3 years (since 2013), a
positive trend is observed in imports of orange and citrus juices, and in opposition, a negative trend is
observed in imports of grape and apple juices.
3.3.2. Market Potential Barriers and Opportunities
Although fruit consumption is low and has been continuously decreasing in the US over the past decade
(more details in section 3.3.3), the US has a trade deficit of fruits as fruit imports are significantly higher
than fruit exports (more details in section 3.3.1). The high imports of fruits to the US can be attributed
to a number of factors shaping the current competitive market conditions, including:
the relatively open domestic import regime and lower average import tariffs, with products
from most leading suppliers entering the US duty free or at preferential duty rates;
the increased competition from low-cost or government-subsidized production;
the continued non-tariff trade barriers to US exports in some countries, such as the import and
inspection requirements, technical product standards, and sanitary and phytosanitary
requirements;
the opportunities for counter-seasonal supplies, partly driven by increased domestic and year-
round demand for fruits; and

US Market Overview| SPI
27
the increased US overseas investment and diversification in market sourcing by US
companies59
.
3.3.3. Market Trends
In the US, fruit consumption decreased 6% from 2011 to 2016, primarily due to a 14% drop in the
consumption of fruit juice. Indeed, if fruit juice (representing about one third of fruit consumption) is
excluded from the fruit total, there was only a 2% drop in fruit consumption over the past 5 years. The
overall drop in fruit consumption is driven by double digit declines among adults who are 45 and older,
particularly among 65 and older adults who have been eating less fruit “as is”, particularly bananas;
whereas the decreasing popularity of fruit juice among US consumers is mostly driven by the ongoing
interest in consuming low-carbohydrate foods and the increasing competitive set of beverages available
to consumers, such as the flavoured waters. Interestingly, fruit juice is believed to be complementary
and not competitive with fruit, since several studies have demonstrated that fruit juice drinkers have
higher intakes of whole fruit compared to non-fruit juice drinkers60
.
Although almost all US age and life stage groups are consuming less fruit, some segments have been
increasing their intakes of fruit between 2009 and 2015, particularly: children who have been
consuming more fruit “as is”, especially more berries, bananas, apples and oranges; adults ages 18-44
who have been eating more fruit at breakfast, particularly berries and bananas; traditional families or
working women households who have been consuming more fruit “as is”; African Americans and
Hispanics; those in the west north central, mountain, and pacific coastal regions; and households with
annual incomes of either $20,000-$40,000 or of $60,000 or more57
.
Despite the overall decrease in fruit consumption, there has been a growth in the consumption of fruit
as a snack, particularly during the morning. This seems to be a consequence of the increasing habit of
snacking among US consumers, in 1990 72% of consumers said they to try to avoid snacking entirely,
compared to only 39% in 2014. Among all fruits, US consumers prefer to eat berries and bananas as a
snack because of their versatility for consumption “as is”, as a topping for cereal or yogurt, or as an
ingredient to a smoothie or hot cereal57
. Even though bananas and berries are together with apples the
country’s most popular fruits, there has been an increasing interest in tropical fruits, such as mango,
coconut and pineapple61,62
.
59
https://www.fas.org/sgp/crs/misc/RL34468.pdf 60
http://www.pbhfoundation.org/pdfs/about/res/pbh_res/State_of_the_Plate_2015_WEB_Bookmarked.pdf 61
http://nrn.com/food-trends/top-5-fruit-and-vegetable-trends-2015#slide-0-field_images-130141 62
http://www.foodnavigator-usa.com/Markets/How-mango-hit-the-mainstream-Trend-mapping-with-fruit

US Market Overview| SPI
28
Almost all fruit (90%) consumed in the US is sourced from or prepared at home. The low percentage pf
the consumption of away-from-home fruit is mostly likely due to the low supply on the marketplace.
Many US consumers eat at fast food establishments and coffee shops and most of these establishments
do not offer fruit in their menus63
.
Fruit consumption, excluding juice, is expected to grow by 9% over the next 5 years, primarily due to the
aging of the population. The consumption of fruit snacking is expected to continue growing, but in its
pure form, without preservative or additives64
. According to Johnathan Brownbill, North America sales
director for Paradise Fruits: “The demand for pure fruit is becoming higher and higher and we found it
necessary to come to the marketplace with our pure fruits because the impure fruits on the
marketplace, we feel, don’t represent value for money and quality that the general public deserves.
They have got filters, additive; they have got fortifications in some way, shape or form that we do not
agree with”65
.
3.3.4. Sample Key Market Stakeholders
The largest US companies manufacturing and selling fruit-based foods are focused in the development
of fruit-based foods which have no additives and are convenient to store and consume. Table 4 indicates
some of these products.
63
http://www.pbhfoundation.org/pdfs/about/res/pbh_res/State_of_the_Plate_2015_WEB_Bookmarked.pdf 64
http://www.foodnavigator-usa.com/Manufacturers/Explosive-growth-for-That-s-It-bars-as-snackers-seek-simplicity 65
http://www.bakeryandsnacks.com/Markets/Fruit-snacking-Future-trends-and-challenges

US Market Overview| SPI
29
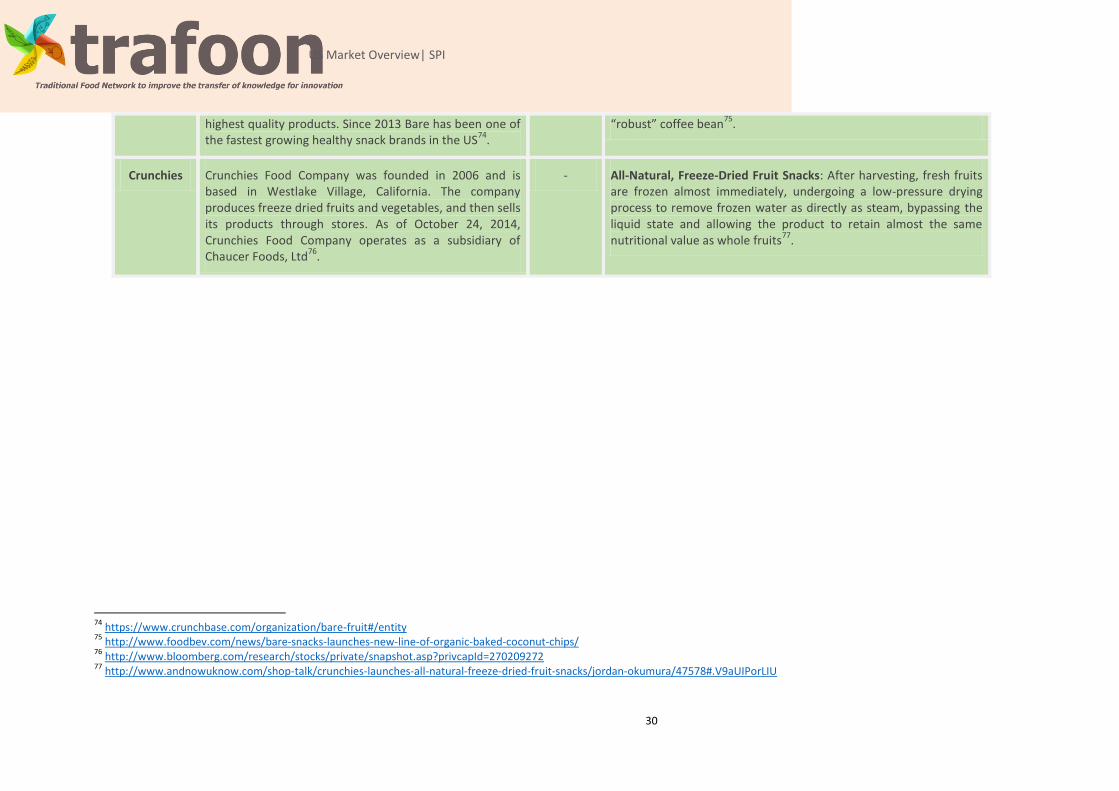
Table 4 - Some fruit-based products recently launched in the US
Company66
name
Company Profile Annual
revenue Recent launches
Dole Dole is a multinational company headquartered in Westlake Village, California. It is the world's largest producer and marketer of fresh fruit and vegetables
67.
$7.2bn (2011)
Mixations fruit snacks: line of four varieties: apple-strawberry sauce with diced apple, pineapple-mango sauce with pineapple pieces, peach-apple sauce with pineapple pieces and apple-raspberry sauce with diced apple. The range features non-GMO fruit, no high fructose corn syrup and is free from artificial flavours and gluten.
68
Peeled snacks
Peeled snacks is a health food snack company in the US offering organic dried fruits. Based in Gowanus, the company was founded in 2004 by Noha Waibsnaider, who also co-founded the Global Social Venture Competition
69.
$4.8m (2013)
Much-Ado-About-Mango: Gently dried mango without any added sugar, preservative or fillers provided in a multi-serving resalable pouch
70.
That´s It That’s It is a food processing company based in Scottsdale, in the state of Arizona. It was founded in 2010 to provide products that can improve, protect and restore the body
71.
$4.4m72
Zesty fruit bars: consist in three bars with 100% real fruit – apple, pear and ginger; and apple, mango and chilli – in an on-the-go package
73.
Bare Bare Snacks (Bare Foods Co.), originally known as Bare Fruit, was founded by Eric Strandberg. Bare has been providing healthy snacks for more than ten years. As the leading apple chip brand Bare takes pride in offering the
$3.8m Organic Coconut chips: coconut chips made using Bare’s proprietary slow-baking process that results in a crunchy texture using simple ingredients. They are available in three individual flavours: “savoury-sweet” toasted coconut, “refreshingly zingy” sweet ginger and
66
http://www.independent.co.uk/news/uk/home-news/the-big-five-companies-that-control-the-worlds-grain-trade-8462266.html 67
http://www.dole.com/ 68
http://www.just-food.com/news/dole-launches-mixations-fruit-snacks-in-us_id134163.aspx 69
http://peeledsnacks.com/ 70
http://peeledsnacks.com/snack/much-ado-about-mango/ 71
http://www.thatsitfruit.com/ 72
https://www.owler.com/iaApp/868815/that-s-it-company-profile 73
http://www.bakeryandsnacks.com/Markets/That-s-It-expands-line-up-with-Zesty-flavors-and-new-Bites-format
US Market Overview| SPI
30
highest quality products. Since 2013 Bare has been one of the fastest growing healthy snack brands in the US
74.
“robust” coffee bean75
.
Crunchies Crunchies Food Company was founded in 2006 and is based in Westlake Village, California. The company produces freeze dried fruits and vegetables, and then sells its products through stores. As of October 24, 2014, Crunchies Food Company operates as a subsidiary of Chaucer Foods, Ltd
76.
- All-Natural, Freeze-Dried Fruit Snacks: After harvesting, fresh fruits are frozen almost immediately, undergoing a low-pressure drying process to remove frozen water as directly as steam, bypassing the liquid state and allowing the product to retain almost the same nutritional value as whole fruits
77.
74
https://www.crunchbase.com/organization/bare-fruit#/entity 75
http://www.foodbev.com/news/bare-snacks-launches-new-line-of-organic-baked-coconut-chips/ 76
http://www.bloomberg.com/research/stocks/private/snapshot.asp?privcapId=270209272 77
http://www.andnowuknow.com/shop-talk/crunchies-launches-all-natural-freeze-dried-fruit-snacks/jordan-okumura/47578#.V9aUIPorLIU
US Market Overview| SPI
31
3.4. Traditional Foods Made of Vegetables and Mushrooms
3.4.1. Import/export trends 2013-2015
The US trade balance of edible vegetables with the EU has been positive over the past decade. In 2015,
it was equal to +$83m, since the trade deficit of edible vegetables78
(frozen: -$75m; fresh or chilled: -
$57m; temporarily preserved: -$18m) was offset by the trade surplus of edible leguminous vegetables
(+$140m) and vegetable roots, such as cassava, arrowroot, salep, Jerusalem artichokes and sweet
potatoes (+$94m). In opposition, the US trade balance of edible vegetables with the world has been
negative over more than one decade (-$4.3bn in 2015) because imports of edible vegetables ($8.7bn in
2015) have been about twice the exports of edible vegetables ($4.4bn in 2015). The most significant
fraction of imports of edible vegetables consist in imports of fresh or chilled vegetables (all except roots)
and tomatoes; in 2015, these respectively represented about one third and one fifth of all the imports of
edible vegetables from the world to the US.
The US trade balance of prepared or preserved (PP) vegetables and mushrooms with the EU has been
negative over more than one decade (-$454m) because imports of PP vegetables and mushrooms from
the EU to the US have been about four times higher than exports of PP vegetables and mushrooms from
the US to the EU ($574m versus $120m). Imports of PP vegetables and mushrooms from the EU to the
US primarily consist in imports of non-frozen vegetables (excluding tomatoes, 77%) and mushrooms
(15%); whereas almost all the PP vegetable and mushrooms exports from the US to the EU
corresponded to imports of prepared or preserved tomatoes (86%). Contrarily to the US trade balance
of PP vegetables and mushrooms with the EU, the US trade balance of PP vegetables with the world has
been positive over the past decade. In 2015, it was equal to +$200m, since exports of PP vegetables and
mushrooms from the US to the world ($2.3bn) were slightly higher than imports of PP vegetables and
mushrooms from the world to the US ($2.1bn).
3.4.2. Market Potential Barriers and Opportunities
Although the consumption of vegetables has been dropping over the past 5 years (details in section
3.4.3), the US trade balance of vegetables has remained a deficit over this period (details in section
3.4.1) due to the high imports of vegetables. The high level of vegetables imports to the US, mostly from
Mexico, South America and China, are explained by several factors shaping the current US market79
.
78
All excepting tomatoes and vegetable roots. 79
The same factors responsible for the high imports of fruit, indicated in section 3.3.2.
US Market Overview| SPI
32
The US domestic supply of vegetables primarily derives from the production of vegetables in the state of
California due to its climate and fertile soil. No other state, or even a combination of states, produces as
much vegetables as California: 99% of artichokes, 95% of celery, 95% of garlic, 89% of cauliflower, 71%
of spinach, and 69% of carrots are currently being produced in the state of California80
. Because almost
all vegetables are grown in California, minor problems with the distribution chain can cause ripple
effects in the vegetables supply throughout the country81
. In 2006, for example, an E. coli
contamination in pre-cut spinach shipped from California, which caused food poisoning outbreaks in 26
states, significantly diminished the US supply of spinach over that particular year82
.
As a result of the growing interest in organic vegetables (see details in section 3.4.3), there is a
consumer shift from the consumption of industrially-produced vegetables to the consumption of organic
vegetables sold at farmers markets and organic producers. Although the “organic” business is often as
mechanized and industrialized as the “conventional” branch of the business in the US, there are some
artisanal growers in every US state and region78
.
3.4.3. Market Trends
In the US, consumption of vegetables has been dropping over the past 5 years (1 fewer eating a week
per capita) mostly due to the decreasing popularity of vegetables at the dinner table. US consumers are
eating less vegetables as a side dish during dinner because they are seeking more convenient meals in
the evening; as a result, they are eating fewer side dishes, including vegetables, as well as eating them
less often83
.
Over the past 5 years, the consumption of vegetables have particularly declined among certain groups
of US consumers, namely: consumers with incomes lower than $20k; 1-2 member households without
children present; females over 65; Asian and African American consumers; retired female or household
head; and consumers living in the east and west south central and mid-Atlantic US regions. Although
there has been a decline in the consumption of vegetables among females over 65, this age group is still
the unique demographic segment in the US that consumes more vegetables than the average of
consumers77
.
Most vegetables are sourced from or prepared at home (82%) and commonly not consumed “as is”. US
consumers often add rich dressings and croutons (flavoured fried bread cubes) to vegetables and, in
80
http://www.slate.com/articles/health_and_science/explainer/2013/07/california_grows_all_of_our_fruits_and_vegetables_what_would_we_eat_without.html 81
http://www.lifeintheusa.com/food/vegetables.htm 82
https://www.cdc.gov/nceh/ehs/docs/investigation_of_an_e_coli_outbreak_associated_with_dole_pre-packaged_spinach.pdf 83
http://www.pbhfoundation.org/pdfs/about/res/pbh_res/State_of_the_Plate_2015_WEB_Bookmarked.pdf

US Market Overview| SPI
33
most cases, the ready-to-eat vegetables they buy come pre-flavoured in rich sauces84
. Potato is still the
country most popular vegetable, followed by lettuce, onions, tomatoes, carrots and corn. There has
been a growing consumption of broccoli (+2%), whereas leaf salads (-9%), green beans (-4%), corn (-4%),
onions (-3%) and mixed vegetables (-3%) have been less consumed since 200977
.
Although traditionally US consumers seek convenience and taste in vegetables, there has been a
growing interest in vegetables which are organic and locally produced. US consumers are looking more
for vegetables which are raised without artificial pesticides or fertilizers, as well as for vegetables that
are locally grown. The increasing popularity of locally produced vegetables is not only because
consumers aim to support the local community, but also a consequence of their increasing appreciation
for food seasonality85
.
Over the next 5 years, consumption of vegetables is estimated to grow 8% in the US. If the 4%
anticipated growth due to the expansion of the total US population is subtracted, the growth in fresh
vegetables is then expected to be only 4% (per capita). Similarly to the consumption of fruits, this
increasing consumption of vegetables is a consequence of the aging of the US population. Although US
consumers of 50 and over are now consuming fewer vegetables than their counterparts 10 years ago,
US consumers under 40 are consuming more vegetables than their counterparts 10 years ago77
.
3.4.4. Sample Key Market Stakeholders
The largest US companies manufacturing and selling vegetables in terms of sales develop their products
taking in consideration the three main characteristics US consumers seek in vegetables: convenience,
taste and organic production. Table 5 indicates some of their recent launches.
84
http://www.lifeintheusa.com/food/vegetables.htm 85
http://nrn.com/food-trends/top-5-fruit-and-vegetable-trends-2015#slide-0-field_images-130141

US Market Overview| SPI
34
Table 5 – Some snacks and meals containing vegetables recently launched in the US
Company name
Company Profile Annual
revenue Recent launches
The Green Giant
86
First founded in 1903 as the Minnesota Valley Canning Company (MVCC), the Green Giant Company, as it was later known, became one of the largest producers of canned corn and peas in the United States. From its base in Le Sueur, the company developed new ways of growing, manufacturing, and marketing canned vegetables. Its mascot, the Jolly Green Giant, can be found in grocery stores around the United States
87. In November 2015, it was
acquired by B&G Foods88
.
$550m Veggie Tots: The kid-friendly alternative to potato tots and French fries, they are filled with vegetables such as cauliflower or broccoli instead of potatoes.
Riced Veggies: Made from 100% vegetables and with no sauce or seasoning, these veggie alternatives to traditional rice have 70% to 85% fewer calories per serving than the leading brand of prepared white rice. The available varieties are: cauliflower, cauliflower & broccoli, cauliflower & sweet potato and cauliflower medley.
Mashed Cauliflower: An alternative to the typical potato side dish. Each half‑cup serving contains one full serving of cauliflower and 40% to 45% fewer calories than the leading brand of prepared mashed potatoes. The available varieties are: original with olive oil & sea Salt, cheddar & bacon, and garlic & herb.
Roasted Veggies: Offering the taste of roasted vegetables without the hassle of roasting and cleaning up. These items contain no sauce or seasoning. Simply heat and pair with your favourite entrée. The available varieties are: corn, Brussels sprouts, broccoli, cauliflower, and carrots
89.
86
http://www.greengiant.com/ 87
http://www.mnopedia.org/thing/green-giant-company 88
http://www.businesswire.com/news/home/20151102006500/en/BG%C2%A0Foods-Completes-Acquisition-Iconic-Green-Giant%C2%AE-Brand 89
http://www.prnewswire.com/news-releases/green-giant-returns-with-a-purpose----to-help-america-swap-in-more-veggies-300323000.html

US Market Overview| SPI
35
Eastbound Farm
Earthbound Farm is a farm located near San Juan Bautista, in the state of California. It is the largest producer of organic salads in the US. It was also the first company to produce prewashed, packaged salad greens on an industrial scale. It is a subsidiary of the WhiteWave company.
$460m (2012)
90
New products include new cooking vegetable blends, slaw blends and flavourful salad blends
91, such as:
Americana blend, Organic crunchy slaws: Crunchy shreds of organic red and green cabbage and sweet carrots, ready to make a super slaw or add fresh texture to dishes hot and cold
92.
Organic Flavour Blends, Sweet Kale: Crisp, tender organic butter lettuce and organic earthy baby kale with balanced flavours and a bit of crunch
93.
Mann Packing
Mann Packing Company, formerly known as H.W. Mann, was founded in 1939 and is based in Salinas, in the state of California. The Company provides fresh-cut and commodity vegetables for retail, wholesale, and foodservice marketplaces. The Company offers its products through national and local foodservice distributors in North America
94.
$100-500m
95
Mann’s Culinary Cuts: a line of fresh cut vegetables cut into distinctive shapes. The veggies are washed and ready-to-eat and versatile enough for multiple uses such as side dishes, stir-fry’s, appetizers, desserts and casseroles. These convenient vegetables are uniquely cut and are all natural, preservative-free and gluten-free. Each package contains four to five, 1-cup servings and can be prepared in four minutes or less in the microwave, sautéed, steamed or on the stovetop. Detailed cooking instructions are included in each package
96.
Beyond meat
97
Beyond Meat is located in Manhattan Beach, state of California, and was founded in 2009. It produces faux-chicken and faux-beef products from plant proteins and meat-free plant-based food products. Some of Beyond Meat's
$20m94
Beyond Meat Burger: a 100% vegan, GMO, soy, and gluten-free patties primarily comprised of pea protein. The burger is being sold as double or single, dressed in standard burger attire, with the addition of Ninja Squirrel Sriracha and an optional cheese slice care of crowd-favourite “Chao” by Field Roast
99
90
http://www.thepacker.com/fruit-vegetable-news/Earthbound-Farm-may-be-sold-206465931.html 91
http://www.foodbusinessnews.net/articles/news_home/Business_News/2016/02/WhiteWave_in_the_sweet_spot.aspx?ID=%7B3E348654-AB23-4ECF-8C06-EBD17CAE0BE3%7D&cck=1 92
http://www.earthboundfarm.com/products/salads/americana-blend 93
https://www.freshdirect.com/pdp.jsp?productId=veg_pid_2302033&catId=cut_veg 94
http://www.bloomberg.com/Research/stocks/private/snapshot.asp?privcapId=4044594 95
http://www.manta.com/c/mr5z6w3/mann-packing-co 96
http://www.freshplaza.com/article/154758/Fresh-cut-vegetable-line-gets-bigger 97
http://beyondmeat.com/products

US Market Overview| SPI
36
investors include Kleiner Perkins, Obvious Ventures and DNS Capital
98.
Tozer Seeds Tozer Seeds is a company based in the UK that develops and breeds vegetable products and seeds in the agriculture industry. The Company provides a wide range of seeds suited for different climates and growing regimes. Tozer offers trial programs and sells seeds online
100.
- Tozer Seeds has an exclusive agreement with six US producers to grow and market its kale and Brussels sprouts hybrid known as ‘kalettes’, and believes it will ‘take off quickly’ with consumers. The six companies are 4Earth Farms, Classic Salads, Mann Packing, Ocean Mist Farms, Southern Specialties and WP Rawl. As part of the agreement, Johnny’s Select Seeds will also sell the seeds to small farmers and home growers.
Kalettes: a non-genetically-modified vegetable, originated from a cross between kale and Brussels sprouts, which took 15 years to be produced. Its development has been inspired from the desire to create a kale type vegetable that was versatile, easy to prepare and looked great. Kalettes, like many dark leafy greens, are very high in vitamin C and vitamin K.
101
99
http://www.ecorazzi.com/2016/07/15/whole-foods-launches-a-100-vegan-burger-bar-with-beyond-meat/#sthash.TKXNRysI.dpuf 98
https://www.owler.com/iaApp/poll/53d935c5e4b01f165b948bec/beyond-meat/what-is-beyond-meats-annual-revenue-.htm 100
http://www.bloomberg.com/profiles/companies/1815946Z:LN-tozer-seeds-ltd 101
http://time.com/3618395/kalettes-new-vegetable-healthy/
US Market Overview| SPI
37
4. Observations & Conclusions
The US trade deficit in regard to food with the EU has been increasing over the past 5 years, mostly
due to an expansion in imports of fruit and vegetables from the EU to the US. Indeed, although the
consumption of fruit and vegetables is low among US consumers, imports of fruit and vegetables
from the EU to the US are high. There are several factors underlying the high imports of fruit and
vegetables, not only from the EU, but from other regions of the world. These include the low
average import tariffs and the absence of some inspection requirements for fruits and vegetables
coming from some regions, including the EU.
Even though the US is the world’s largest exporter of some grains categories, the US grain market
still presents an opportunity for EU companies. This is mainly because most grains produced in the
US become either animal feed or processed into sweeteners, corn oil and industrial products.
Although fish demand is high in the US, fish companies are also great in number with widely
varying business models. In the US fish market, the main differentiators are the branding and
marketing. Since there is a market pressure to reduce the price of the fish products due to the
crowded market, fish companies need to reduce the costs of production to compensate the high
spending in branding and marketing.
Due to the increasing interest in more healthy lifestyles, US consumers are seeking more healthy
food. As a result, there has been a growing demand for healthy fish meals, whole grain food, fruit
“as is” and organic vegetables. Overall, the consumption of vegetables and fruit is expected to
grow in the next decade, as a result of the aging of the US consumers between 40 and 50 years old
who are currently eating more fruit and vegetable than their counterparts one decade ago.
US consumers are also increasingly interested in knowing how the food they eat is produced. They
are concerned about the sustainability of the fish supply, as well as interested in knowing if
pesticides and herbicides have been used in the production of the grains, fruit and vegetables they
eat. In the US, consumers now prefer to eat fish of which supply is sustainable and to consume
non-GMO grains, as well as organic fruit and vegetables.