Professor Zoe Radnor
Professor of Operations Management
Cardiff Business School
Plus Local Government, Fire and Rescue Services………

• It is early days for Lean development and implementation in Higher Education.
• There is still a lot of opportunity for improvement and a lot to be learnt from the experience of other public service organisations.
• There is fragmented uptake of Lean making it difficult to identify some ‘outstanding’ examples of Lean implementation.
• Some of the early adopters are showing real signs of engagement and embedment.
• There was limited understanding of the key principles of Lean and how they should be driving the improvements.
• Lean appears to be driven by mainly administrative and support staff, who can see the benefits.
• There is a focus on project based activities around one or two processes.

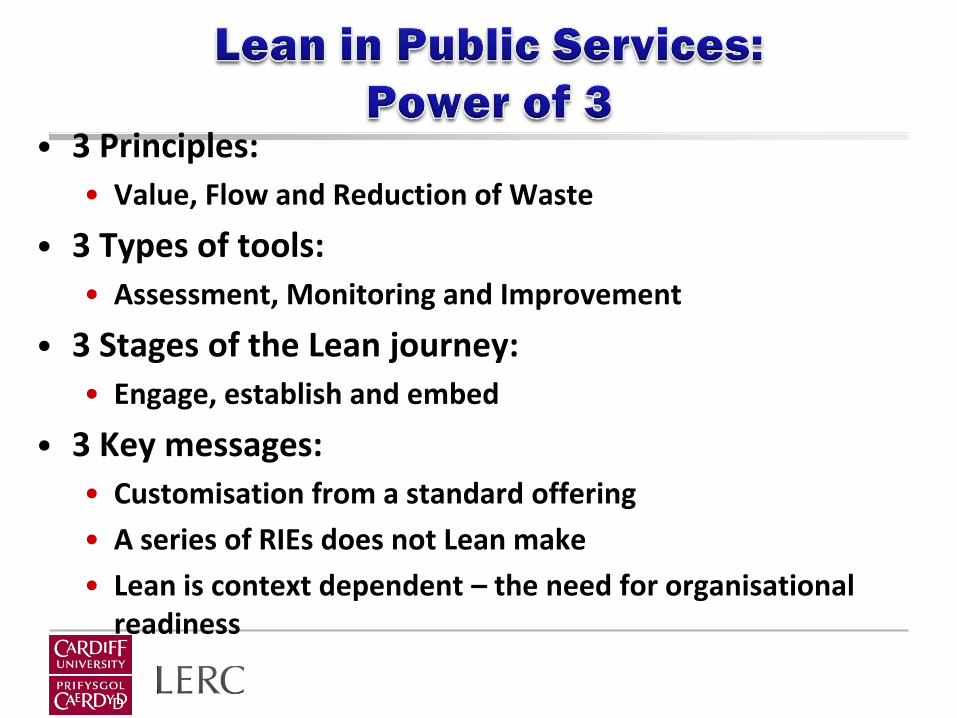
• 3 Principles:
• Value, Flow and Reduction of Waste
• 3 Types of tools:
• Assessment, Monitoring and Improvement
• 3 Stages of the Lean journey:
• Engage, establish and embed


• Processing time • Waiting time
• E2 Collection from post room
• Pre-log checks
• Log/batch
• Waiting to be captured
• E1 capture
• E1 code
• Overnight data back-up
• 2nd day actions
• Refilling
• Total lead time
• Activities • Physical location
– Post Room
– E2 section
– In shelf on the
floor
– E1 section
– Cabinet
• 10 min
• 1.5 min
• 0.5 min
• 14 days
• 8 min
• 4 min
• 1 day
• 0.7 min
• 0.5 min
• 15.4 days
• 0.5 min*
• 0.5 min*
• 1 hour
• 1 hour• Waiting to be sorted
• Post sorted into SA
• Returns sorted into SA floors
• Returns wait for collection
Time to process an SA return
Returnprocessed
Document
arrives
The SA processing lead time for documents received during January was 15.4 days, of
which 14 minutes was spent processing (0.05%)

Flow: Understanding and Managing Demand
Types and Patterns
Treatment
by nurse
Patient
arrives
Patient is
triaged
Patient is
booked in
Patient is
seen by
doctor
WA
IT
WA
IT
WA
IT
WA
IT
WA
IT
Patient is
discharged
by doctor
Patient
arrives
Patient is
booked in
Patient is seen, treated
and given advice by
doctor or nurse practi-
tioner and discharged

Waiting - Post delivered by
Royal Mail did not always
arrive at 7:45 am
7 Motion - In post room the
operator moved from desk
to scales to measure a
single item of post
6 Rework - Post transferred
between offices; Frequent
redirection due to mis-
sorting
5 Inventory – 15+ days of
work on shelves
Transport - Post moved
500 metres before any
value-added work was
performed
Over-production - 60% of
computer generated post
printed in the post room
was discarded
4 Over-processing -
Sorting post in 21
categories when 4/5
were enough
2
3
1
Reduction of Waste

• Assessment: – To assess the processes at organisational level e.g. value
stream mapping, process mapping
• Monitoring: – To measure and monitor the impact of the processes and
their improvement e.g. control charts, visual management, benchmarking, work place audits
– Measures in terms of quality, time, costs, satisfaction levels
• Improvement: – Tools implemented and used to support and improve
processes e.g. RIEs, 5S, structured problem solving

From
Current State
to
Future State

Team Board
Monitoring: Visual Management
Team Communications Hub
Resource Planning

SHITSUKE Standardise
SEIKETSU Sustain
SEISO Sweep and Shine
SEITON Set in order
SEIRI Sort

These are some of the Problem Solving tools
that are available, but there are many more
3 C’s Document
Brainstorming
Kipling
SMART
Open Questions
5 Why's
Timing Plan
Fishbone Diagram
Web Chart
Like & Must
Check Sheet
Action Plan
Pareto Analysis
Interviewing
3 C’s Document
Brainstorming
Kipling
SMART
Open Questions
5 Why's
Timing Plan
Fishbone Diagram
Web Chart
Like & Must
Check Sheet
Action Plan
Pareto Analysis
Interviewing
WHAT DO WE WANT
TO IMPROVE AND
WHERE DO WE WANT
TO BE?
2 2 -- CausesCausesWHAT'S STOPPING US
FROM ACHIEVING OUR
DESIRED STATE?
3 3 -- OptionsOptionsWHAT CHOICES DO
WE HAVE ?
6 6 -- ResultsResultsHOW GOOD WAS
THE SOLUTION ?
5 5 -- ImplementationImplementationWHAT IS OUR
ACTION PLAN ?
4 4 -- SolutionsSolutionsWHICH IS THE BEST
WAY TO SOLVE OUR
PROBLEM ?
11 -- ProblemProblemWHAT DO WE WANT
TO IMPROVE AND
WHERE DO WE WANT
TO BE?
2 2 -- CausesCausesWHAT'S STOPPING US
FROM ACHIEVING OUR
DESIRED STATE?
3 3 -- OptionsOptionsWHAT CHOICES DO
WE HAVE ?
6 6 -- ResultsResultsHOW GOOD WAS
THE SOLUTION ?
5 5 -- ImplementationImplementationWHAT IS OUR
ACTION PLAN ?
4 4 -- SolutionsSolutionsWHICH IS THE BEST
WAY TO SOLVE OUR
PROBLEM ?
11 -- ProblemProblem
Version
Originator
Date
Implementation completed
Status
2.1
Project Office
Causes identified Countermeasures identified Implementation started
Concern
Team
Resp Date DueCause Countermeasure
17-Sep-06Problem Solving - 3Cs
This is the basic method of Problem Solving used by teams to address
day-to-day issues affecting performance. The process has 3 steps:
Concern:
Define the Problem clearly – doing this is essential, as it will help
to ensure that you don’t try to put the whole world right in one go.
Cause
Think carefully – try to get to the “ROOT CAUSE” of the problems,
rather than just dealing with the symptoms.
Countermeasures
Try to fix the problem once and for all, but if that’s not possible,
then do everything you can to mitigate the impact on the customer.
Improvement: Structured and systematic use of problem-solving
Day-to-day problem solving: 3Cs document
More challenging problems: Structured Approach
• 3 Principles:
• Value, Flow and Reduction of Waste
• 3 Types of tools:
• Assessment, Monitoring and Improvement
• 3 Stages of the Lean journey:
• Engage, establish and embed
• 3 Key messages:
• Customisation from a standard offering
• A series of RIEs does not Lean make
• Lean is context dependent – the need for organisational readiness

Vis
ual M
anagem
ent:
M
anaged b
y t
he fro
nt
line
staff
Regula
r Str
uct
ure
d
Pro
ble
m S
olv
ing
Work
pla
ce A
udits
Leaders
hip
Challe
ngin
g:
Go, See a
nd D
o
Develo
pin
g L
oca
l/ I
nte
rnal
Cham
pio
ns
and F
aci
litato
rs
Whole system view
Embedded continuous improvement behaviours
Stable robust efficient and effective processes
Monitoring o
f end t
o e
nd
Serv
ices/
Pro
cess
es:
Q
ualit
y, C
ost
and D
eliv
ery
Identify
ing a
nd m
anagin
g
variation a
nd d
em
and
Rapid
Im
pro
vem
ent
Events
: Pro
cess
Mappin
g a
nd 5
„s
Training and Development
Steering Group and Project Team
Understand Demand
Create Value
Process View
Link to Strategy
Strong committed Leadership
Communication Co-
Production

“To become a Lean school, the top management needs to be on board and drive it. This is not an add-on. It‟s about getting the entire operation of the school adopt Lean philosophy and practice on a continuous basis.” Dean of English Business School
“I‟d like to think that it [lean] is now the lens through which we run the hospital. I can‟t think of a day when I‟m not dealing with issues, when I‟m not thinking about it in lean terms; whether that‟s the challenges we‟ve got of hitting the A&E target or money we need to save or mortality rate” Chief Executive of a English Hospital
Driven by Department Heads or Lean enthusiasts
Go and See, Go and Do, Lead by example, Leading in a Lean Environment

“Sometimes we forget there is a customer at the other end. I think Lean has highlighted that. Sometimes we are in danger of forgetting that the paper we are dealing with, actually represents the customer.” “We think we understand what customers want but we really don‟t know. We haven‟t asked them. We think they want a faster service. We have improved the turnaround of resulting and post etc., so we assume they are more satisfied, but we don‟t really know for sure”
Emotional Mapping, Enacting rather than defining value

Islands of Optimisation at Department, Business Unit or Ward level
Policy Deployment, Balanced Scorecard, Benefits Realisation

“We are better able to plan resources to meet workload. Work is broken down into specific tasks and resources are moved across to
make sure we can manage all the tasks”
Capacity not Demand Led, variable seen as the
work not the staff
Runners, repeaters and Strangers; Capacity Planning for the Short and Medium Term;
Systems Thinking

Presentation Title
“The understanding of process here has changed, especially for those who attended the Lean event. They were able to see how the work linked together across the court. But the other staff need to attend more Lean events to get a
better understanding”
Task focused driven by performance measures
End to end customer journey mapping, measures focused on outcomes, link to policy
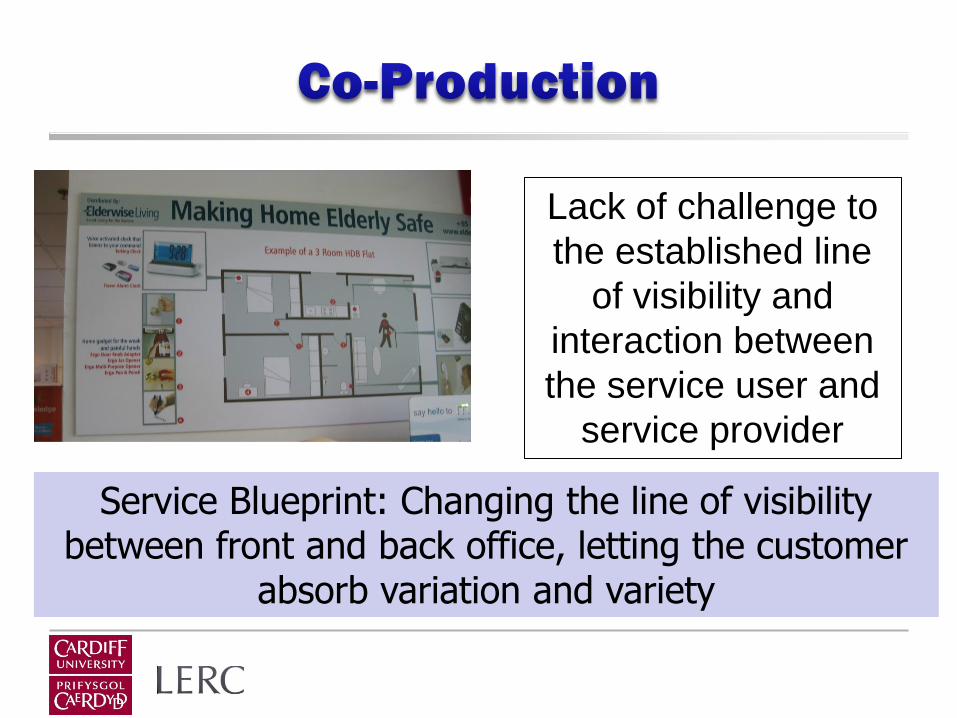
Lack of challenge to
the established line
of visibility and
interaction between
the service user and
service provider
Service Blueprint: Changing the line of visibility between front and back office, letting the customer
absorb variation and variety

“The majority of staff like TIBs because they know what's going on. Managers have all the information about the skills that their teams have, but it's only by making them visible that staff realise they need further training”
Powerful use of visual management for internal
management but lack of change regarding
external communication
Service Blueprint: Changing the line of visibility between front and back office, letting the customer
absorb variation and variety

Leadership capability, understanding and sustainability
Developing meaningful strategies
Creating value rather than defining customers
Creating measures and metrics that manage power and policy (across processes)
Redefining the line of visibility (between the front and back office)
Communicating changes internally and externally
Truly understanding and managing demand patterns and types in the short, medium and long term.

Continuous Improvement
People Development
Leadership
Communication
Value
Organisation Development
Demand Management
Strategy Process
Co-Production