- 1 -Any redistribution of this information is strictly prohibited.
Copyright © 2016 EMIS, all rights reserved.
Produced by:
Any redistribution of this information is strictly prohibited.
Copyright © 2016 EMIS, all rights reserved.
Pharmaceuticals & Cosmetics
SectorPoland
January 2016
PL_3254_0013_Jan’2016_MP-NY
- 2 -Any redistribution of this information is strictly prohibited.
Copyright © 2016 EMIS, all rights reserved.
Table of Contents
I. Sector Overview
1. Sector Highlights
2. Economic Importance
3. Healthcare Spending – Historical and Forecast
4. Disease Profile
5. Healthcare Resources
6. Health Perceptions and Spendings
7. Ageing Society
II. Pharmaceuticals
1. Pharmaceutical Sector Highlights
2. Pharmaceutical Market
3. Production and Investments
4. Pharmaceutical Manufacturers
5. Pharmaceutical Segments
6. Prescription vs OTC
7. Exports and Imports
8. Dietary Supplements
9. Pharmacies
10.Medicine and Supplements Use
11.Forecast
III.Cosmetics
1. Cosmetic Sector Highlights
2. Cosmetics Market Production
3. Cosmetics Market Indicators
4. Main Cosmetics Segments
5. Main Cosmetics Segments Market Shares
6. Sales
7. Exports & Imports
8. Forecast
IV.Main Players
1. M&A Activity
2. Top Ten Sector Companies
3. Pelion Healthcare Group
4. Pelion Healthcare Group (cont’d)
5. Neuca
6. Neuca (cont’d)
7. Farmacol
8. Farmacol (cont’d)
9. Glaxosmithkline
10.Rossmann
- 3 -Any redistribution of this information is strictly prohibited.
Copyright © 2016 EMIS, all rights reserved.
I. Sector Overview
- 4 -Any redistribution of this information is strictly prohibited.
Copyright © 2016 EMIS, all rights reserved.
Sector Highlights
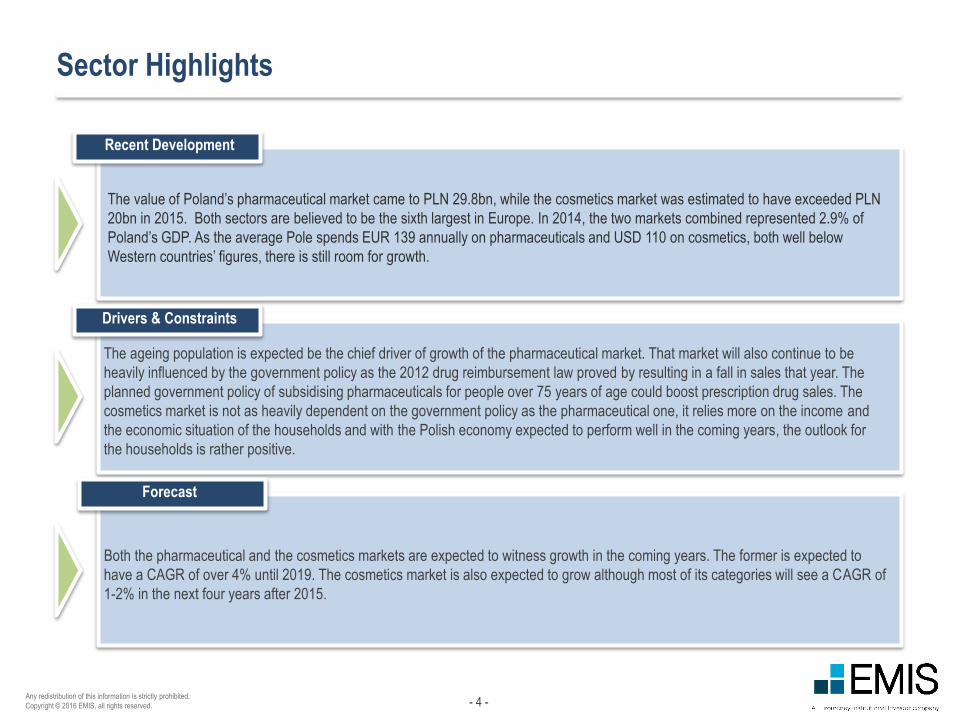
Both the pharmaceutical and the cosmetics markets are expected to witness growth in the coming years. The former is expected to
have a CAGR of over 4% until 2019. The cosmetics market is also expected to grow although most of its categories will see a CAGR of
1-2% in the next four years after 2015.
The ageing population is expected be the chief driver of growth of the pharmaceutical market. That market will also continue to be
heavily influenced by the government policy as the 2012 drug reimbursement law proved by resulting in a fall in sales that year. The
planned government policy of subsidising pharmaceuticals for people over 75 years of age could boost prescription drug sales. The
cosmetics market is not as heavily dependent on the government policy as the pharmaceutical one, it relies more on the income and
the economic situation of the households and with the Polish economy expected to perform well in the coming years, the outlook for
the households is rather positive.
The value of Poland’s pharmaceutical market came to PLN 29.8bn, while the cosmetics market was estimated to have exceeded PLN
20bn in 2015. Both sectors are believed to be the sixth largest in Europe. In 2014, the two markets combined represented 2.9% of
Poland’s GDP. As the average Pole spends EUR 139 annually on pharmaceuticals and USD 110 on cosmetics, both well below
Western countries’ figures, there is still room for growth.
Recent Development
Drivers & Constraints
Forecast
- 5 -Any redistribution of this information is strictly prohibited.
Copyright © 2016 EMIS, all rights reserved.
Source:
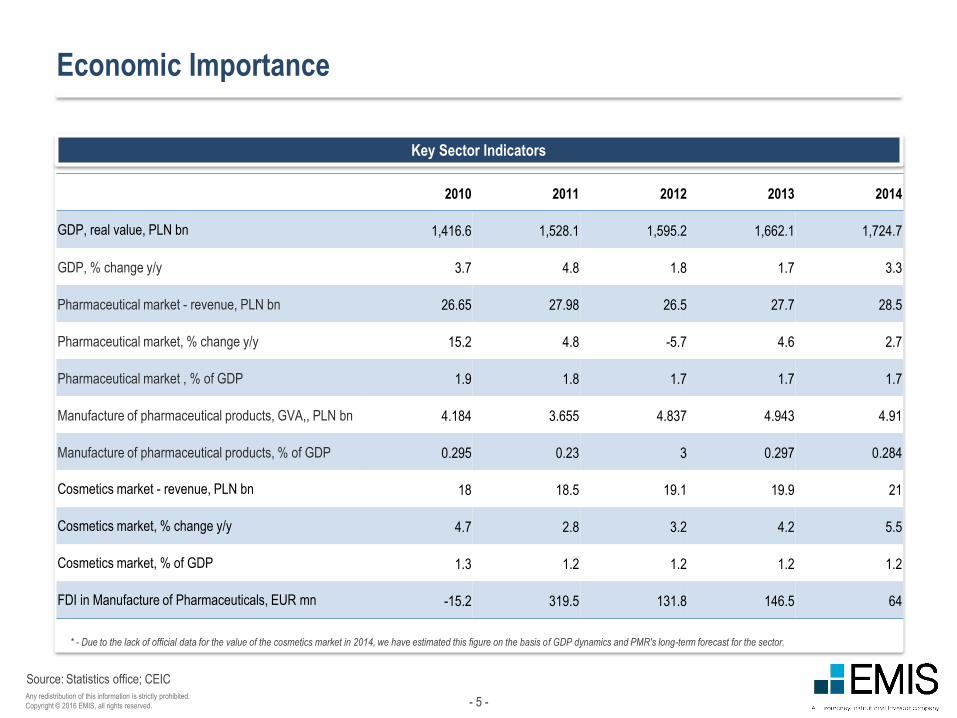
Economic Importance
Key Sector Indicators
Statistics office; CEIC
* - Due to the lack of official data for the value of the cosmetics market in 2014, we have estimated this figure on the basis of GDP dynamics and PMR's long-term forecast for the sector.
2010 2011 2012 2013 2014
GDP, real value, PLN bn 1,416.6 1,528.1 1,595.2 1,662.1 1,724.7
GDP, % change y/y 3.7 4.8 1.8 1.7 3.3
Pharmaceutical market - revenue, PLN bn 26.65 27.98 26.5 27.7 28.5
Pharmaceutical market, % change y/y 15.2 4.8 -5.7 4.6 2.7
Pharmaceutical market , % of GDP 1.9 1.8 1.7 1.7 1.7
Manufacture of pharmaceutical products, GVA,, PLN bn 4.184 3.655 4.837 4.943 4.91
Manufacture of pharmaceutical products, % of GDP 0.295 0.23 3 0.297 0.284
Cosmetics market - revenue, PLN bn 18 18.5 19.1 19.9 21
Cosmetics market, % change y/y 4.7 2.8 3.2 4.2 5.5
Cosmetics market, % of GDP 1.3 1.2 1.2 1.2 1.2
FDI in Manufacture of Pharmaceuticals, EUR mn -15.2 319.5 131.8 146.5 64

- 6 -Any redistribution of this information is strictly prohibited.
Copyright © 2016 EMIS, all rights reserved.
Comments
Source:
Healthcare Spending – Historical and Forecast
According to the latest OECD calculations, Poland’s total expenditure on health in 2013 came to 6.4% of its GDP, the third lowest among the
countries surveyed (only Mexico and Turkey had lower figures). By comparison, regional peers Czech Republic and Hungary spent 7.1% and
7.4% respectively of their GDP on healthcare. In Germany and France the figure was around 11%. Also, Poland lags behind other countries in
terms of government expenditure on healthcare, which represented 4.5% of the GDP in 2013, according to the latest available data.
Health spending (PLN bn) Health spending forecast (PLN bn)
BMI Research
80.134 84.423 89.627 95.319 101.510
35.67837.652
39.93042.483
45.353
115.811 122.074 129.556 137.803 146.854
0
20
40
60
80
100
120
140
160
2015e 2016f 2017f 2018f 2019f
Private
Government
Total
73.8 74.6 75.8 77.5
30.7 32.7 33.2 34.0
104.5 107.3 109.0 111.5
0
20
40
60
80
100
120
2011 2012 2013 2014
Private
Government
Total
- 7 -Any redistribution of this information is strictly prohibited.
Copyright © 2016 EMIS, all rights reserved.
Source:
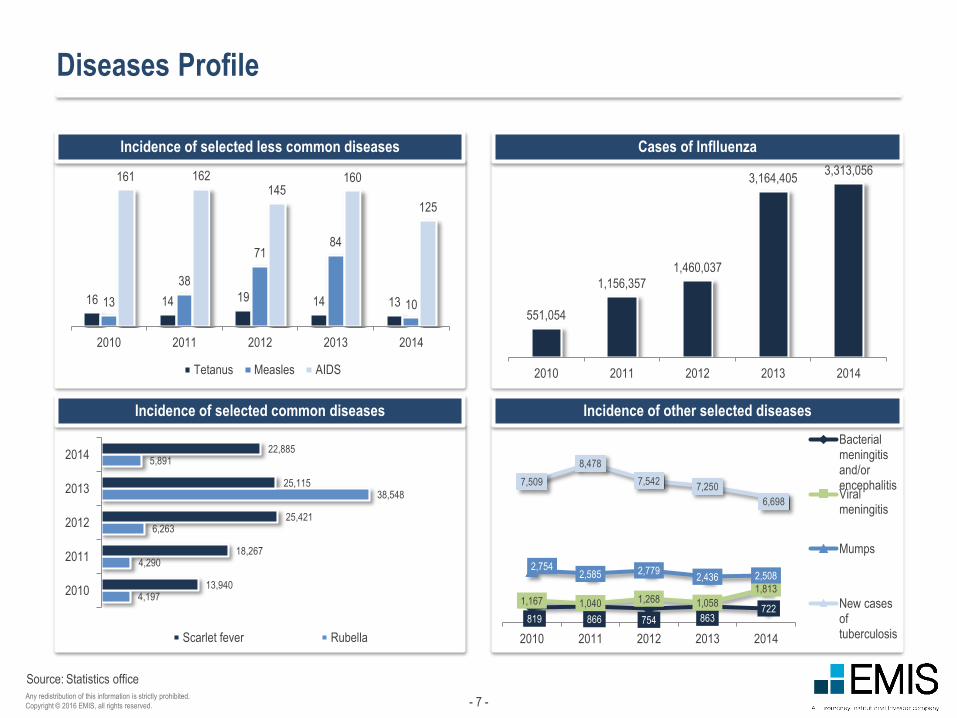
Diseases Profile
Incidence of selected less common diseases
Incidence of selected common diseases
Cases of Inflluenza
Incidence of other selected diseases
Statistics office
16 14 19 14 1313
38
7184
10
161 162145
160
125
2010 2011 2012 2013 2014
Tetanus Measles AIDS
4,197
4,290
6,263
38,548
5,891
13,940
18,267
25,421
25,115
22,885
2010
2011
2012
2013
2014
Scarlet fever Rubella
551,054
1,156,357
1,460,037
3,164,4053,313,056
2010 2011 2012 2013 2014
819 866 754 863722
1,167 1,040 1,268 1,058
1,813
2,7542,585 2,779
2,436 2,508
7,509
8,478
7,5427,250
6,698
2010 2011 2012 2013 2014
Bacterialmeningitisand/orencephalitisViralmeningitis
Mumps
New casesoftuberculosis
- 8 -Any redistribution of this information is strictly prohibited.
Copyright © 2016 EMIS, all rights reserved.
Source:
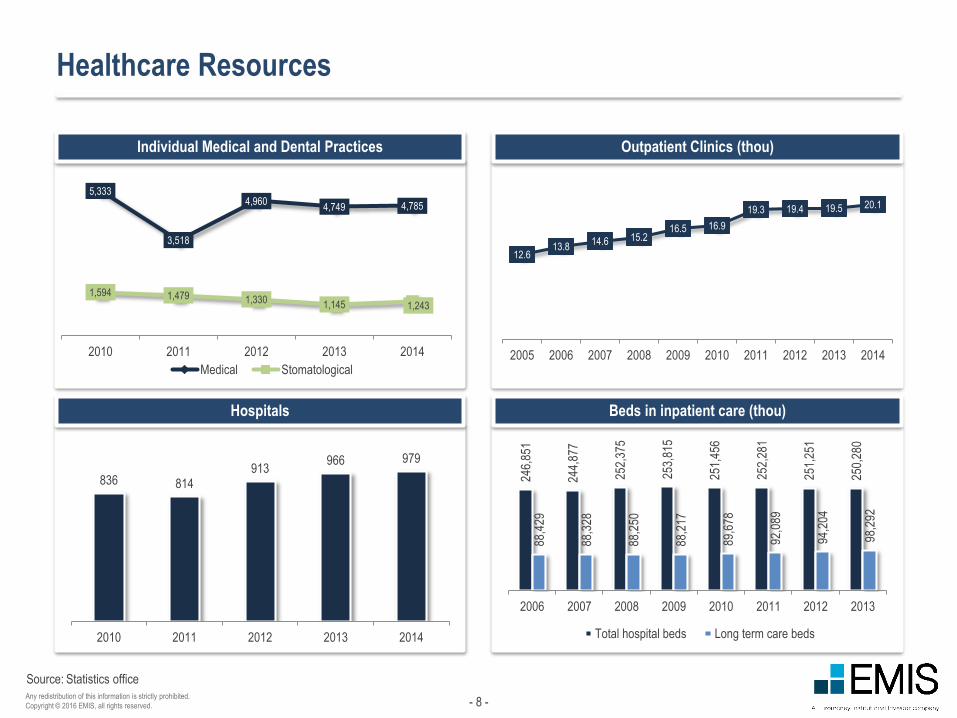
Healthcare Resources
Individual Medical and Dental Practices
Hospitals
Outpatient Clinics (thou)
Beds in inpatient care (thou)
Statistics office
12.613.8
14.6 15.216.5 16.9
19.3 19.4 19.5 20.1
2005 2006 2007 2008 2009 2010 2011 2012 2013 2014
246,
851
244,
877
252,
375
253,
815
251,
456
252,
281
251,
251
250,
280
88,4
29
88,3
28
88,2
50
88,2
17
89,6
78
92,0
89
94,2
04
98,2
92
2006 2007 2008 2009 2010 2011 2012 2013
Total hospital beds Long term care beds
836 814913
966 979
2010 2011 2012 2013 2014
5,333
3,518
4,9604,749 4,785
1,594 1,479 1,330 1,145 1,243
2010 2011 2012 2013 2014
Medical Stomatological
- 9 -Any redistribution of this information is strictly prohibited.
Copyright © 2016 EMIS, all rights reserved.
Source:
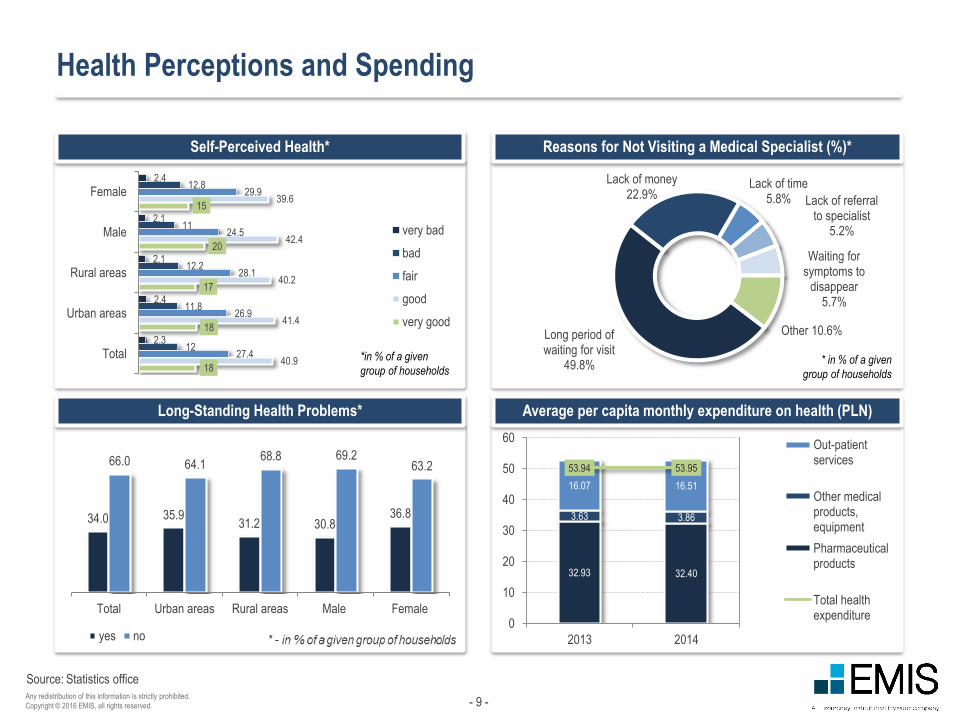
Health Perceptions and Spending
Self-Perceived Health*
Long-Standing Health Problems*
Reasons for Not Visiting a Medical Specialist (%)*
Average per capita monthly expenditure on health (PLN)
Statistics office
18
18
17
20
15
40.9
41.4
40.2
42.4
39.6
27.4
26.9
28.1
24.5
29.9
12
11.8
12.2
11
12.8
2.3
2.4
2.1
2.1
2.4
Total
Urban areas
Rural areas
Male
Female
very bad
bad
fair
good
very good
*in % of a given
group of households
34.0 35.931.2 30.8
36.8
66.0 64.168.8 69.2
63.2
Total Urban areas Rural areas Male Female
yes no
Long period of waiting for visit
49.8%
Lack of money22.9%
Lack of time5.8% Lack of referral
to specialist5.2%
Waiting for symptoms to
disappear5.7%
Other 10.6%
* in % of a given
group of households
32.93 32.40
3.63 3.86
16.07 16.51
53.94 53.95
0
10
20
30
40
50
60
2013 2014
Out-patientservices
Other medicalproducts,equipment
Pharmaceuticalproducts
Total healthexpenditure
- 10 -Any redistribution of this information is strictly prohibited.
Copyright © 2016 EMIS, all rights reserved.
Source:
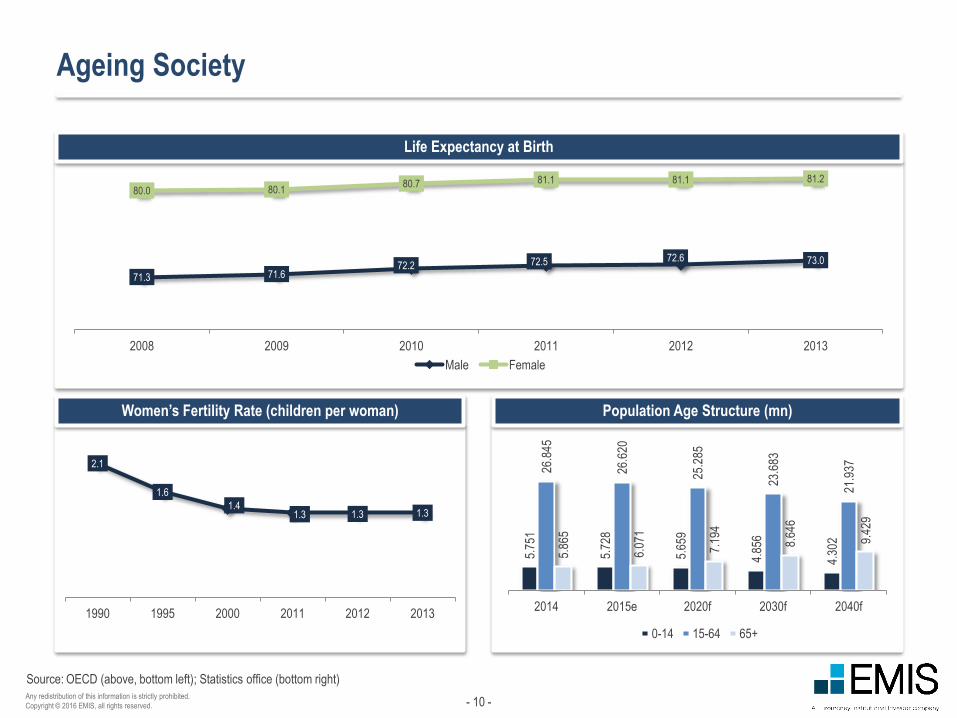
Ageing Society
Women’s Fertility Rate (children per woman)
Life Expectancy at Birth
Population Age Structure (mn)
OECD (above, bottom left); Statistics office (bottom right)
2.1
1.6
1.41.3 1.3 1.3
1990 1995 2000 2011 2012 2013
5.75
1
5.72
8
5.65
9
4.85
6
4.30
2
26.8
45
26.6
20
25.2
85
23.6
83
21.9
37
5.86
5
6.07
1
7.19
4
8.64
6
9.42
9
2014 2015e 2020f 2030f 2040f
0-14 15-64 65+
71.3 71.672.2 72.5 72.6 73.0
80.0 80.180.7 81.1 81.1 81.2
2008 2009 2010 2011 2012 2013
Male Female
- 11 -Any redistribution of this information is strictly prohibited.
Copyright © 2016 EMIS, all rights reserved.
II. Pharmaceuticals
- 12 -Any redistribution of this information is strictly prohibited.
Copyright © 2016 EMIS, all rights reserved.
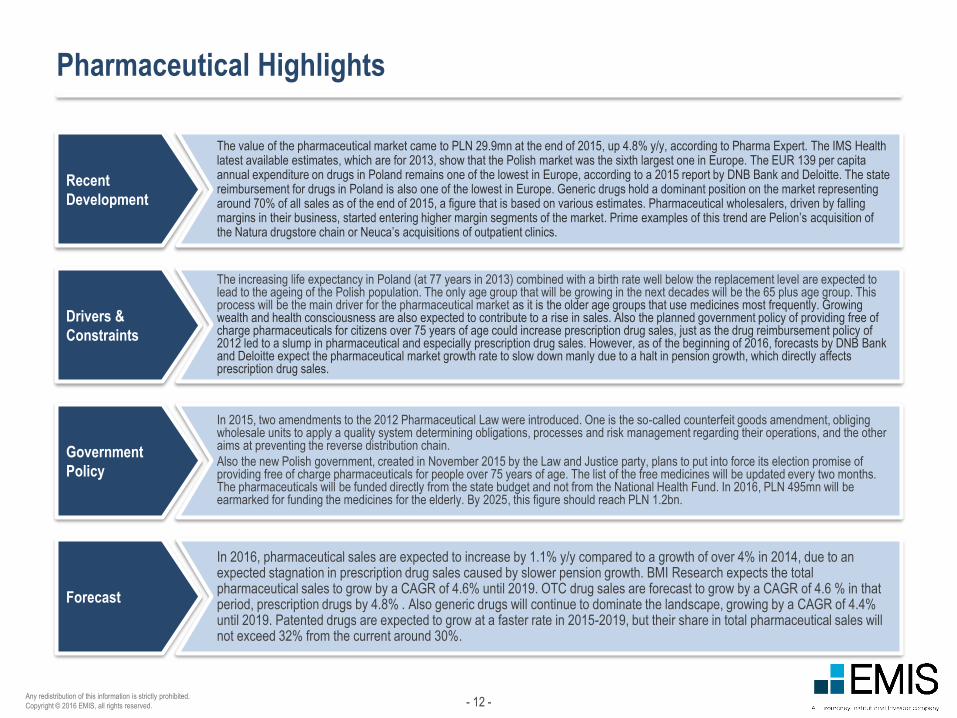
Pharmaceutical Highlights
Recent
Development
The value of the pharmaceutical market came to PLN 29.9mn at the end of 2015, up 4.8% y/y, according to Pharma Expert. The IMS Health latest available estimates, which are for 2013, show that the Polish market was the sixth largest one in Europe. The EUR 139 per capita annual expenditure on drugs in Poland remains one of the lowest in Europe, according to a 2015 report by DNB Bank and Deloitte. The state reimbursement for drugs in Poland is also one of the lowest in Europe. Generic drugs hold a dominant position on the market representingaround 70% of all sales as of the end of 2015, a figure that is based on various estimates. Pharmaceutical wholesalers, driven by falling margins in their business, started entering higher margin segments of the market. Prime examples of this trend are Pelion’s acquisition of the Natura drugstore chain or Neuca’s acquisitions of outpatient clinics.
Drivers &
Constraints
The increasing life expectancy in Poland (at 77 years in 2013) combined with a birth rate well below the replacement level are expected to lead to the ageing of the Polish population. The only age group that will be growing in the next decades will be the 65 plus age group. This process will be the main driver for the pharmaceutical market as it is the older age groups that use medicines most frequently. Growing wealth and health consciousness are also expected to contribute to a rise in sales. Also the planned government policy of providing free of charge pharmaceuticals for citizens over 75 years of age could increase prescription drug sales, just as the drug reimbursement policy of 2012 led to a slump in pharmaceutical and especially prescription drug sales. However, as of the beginning of 2016, forecasts by DNB Bank and Deloitte expect the pharmaceutical market growth rate to slow down manly due to a halt in pension growth, which directly affects prescription drug sales.
Government
Policy
In 2015, two amendments to the 2012 Pharmaceutical Law were introduced. One is the so-called counterfeit goods amendment, obliging wholesale units to apply a quality system determining obligations, processes and risk management regarding their operations, and the other aims at preventing the reverse distribution chain.
Also the new Polish government, created in November 2015 by the Law and Justice party, plans to put into force its election promise of providing free of charge pharmaceuticals for people over 75 years of age. The list of the free medicines will be updated every two months. The pharmaceuticals will be funded directly from the state budget and not from the National Health Fund. In 2016, PLN 495mn will be earmarked for funding the medicines for the elderly. By 2025, this figure should reach PLN 1.2bn.
Forecast
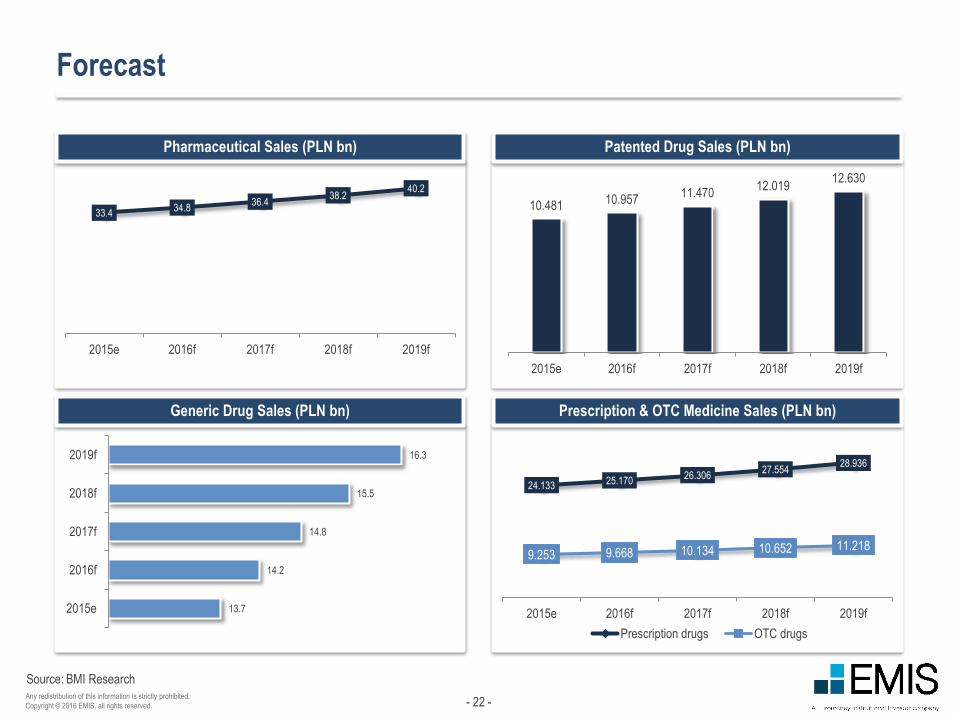
In 2016, pharmaceutical sales are expected to increase by 1.1% y/y compared to a growth of over 4% in 2014, due to an expected stagnation in prescription drug sales caused by slower pension growth. BMI Research expects the total pharmaceutical sales to grow by a CAGR of 4.6% until 2019. OTC drug sales are forecast to grow by a CAGR of 4.6 % in that period, prescription drugs by 4.8% . Also generic drugs will continue to dominate the landscape, growing by a CAGR of 4.4% until 2019. Patented drugs are expected to grow at a faster rate in 2015-2019, but their share in total pharmaceutical sales will not exceed 32% from the current around 30%.
- 13 -Any redistribution of this information is strictly prohibited.
Copyright © 2016 EMIS, all rights reserved.
Comments
Source:
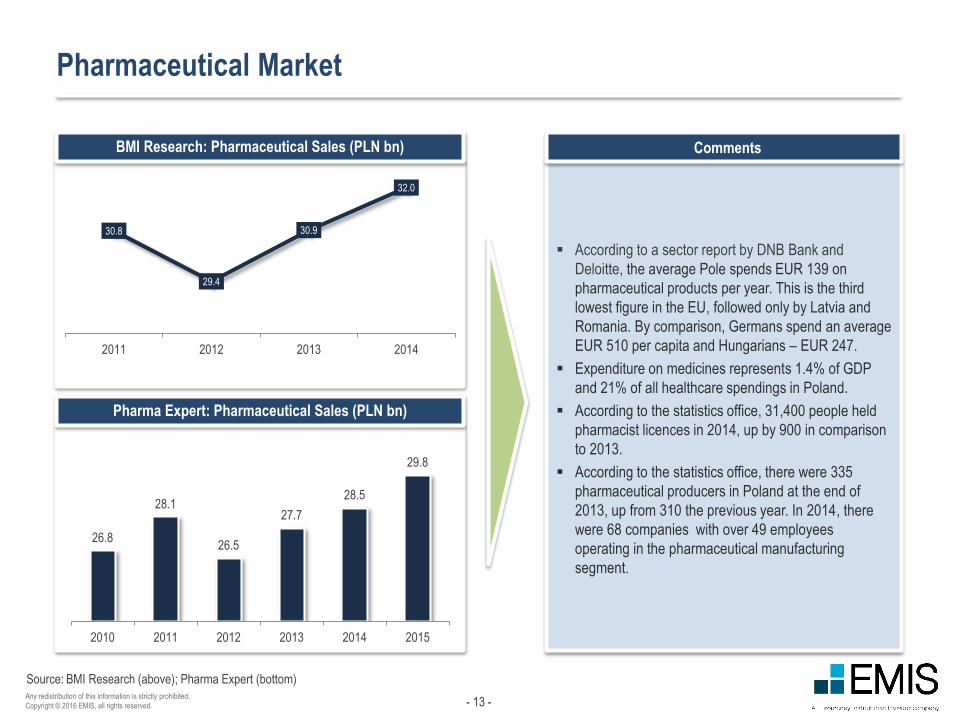
Pharmaceutical Market
BMI Research: Pharmaceutical Sales (PLN bn)
Pharma Expert: Pharmaceutical Sales (PLN bn)
According to a sector report by DNB Bank and
Deloitte, the average Pole spends EUR 139 on
pharmaceutical products per year. This is the third
lowest figure in the EU, followed only by Latvia and
Romania. By comparison, Germans spend an average
EUR 510 per capita and Hungarians – EUR 247.
Expenditure on medicines represents 1.4% of GDP
and 21% of all healthcare spendings in Poland.
According to the statistics office, 31,400 people held
pharmacist licences in 2014, up by 900 in comparison
to 2013.
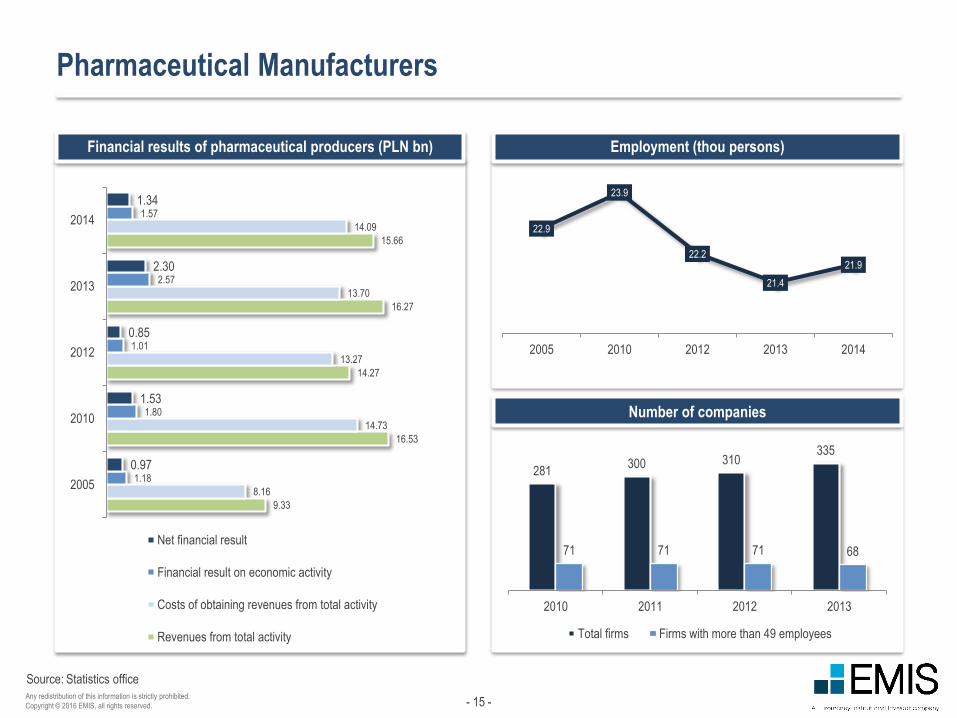
According to the statistics office, there were 335
pharmaceutical producers in Poland at the end of
2013, up from 310 the previous year. In 2014, there
were 68 companies with over 49 employees
operating in the pharmaceutical manufacturing
segment.
BMI Research (above); Pharma Expert (bottom)
30.8
29.4
30.9
32.0
2011 2012 2013 2014
26.8
28.1
26.5
27.7
28.5
29.8
2010 2011 2012 2013 2014 2015
- 14 -Any redistribution of this information is strictly prohibited.
Copyright © 2016 EMIS, all rights reserved.
Comments
Source:
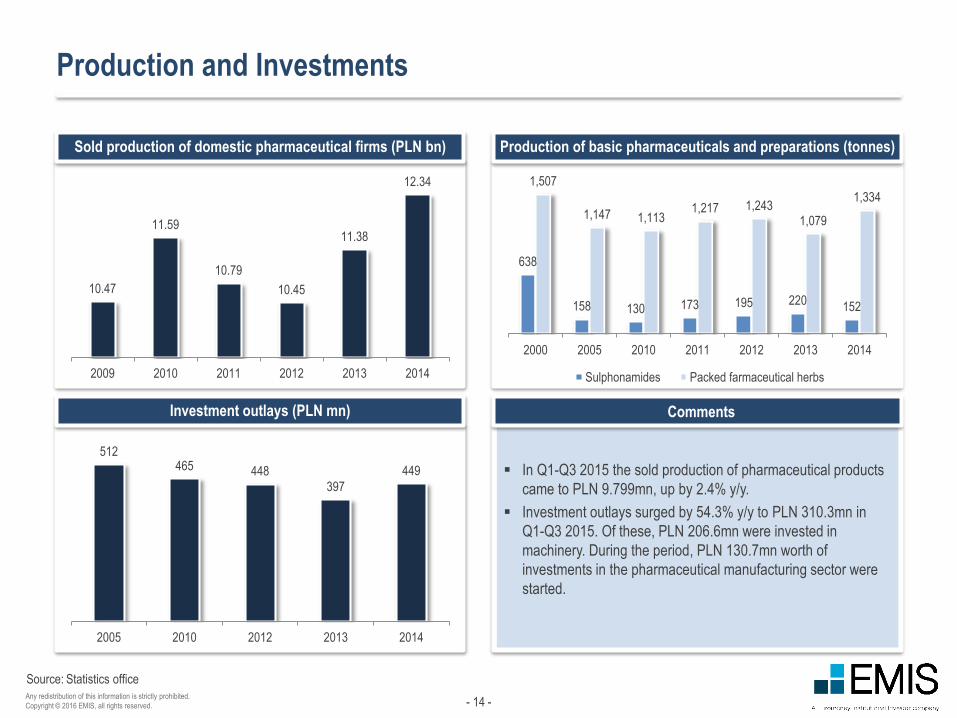
Production and Investments
Sold production of domestic pharmaceutical firms (PLN bn)
Investment outlays (PLN mn)
Production of basic pharmaceuticals and preparations (tonnes)
Statistics office
In Q1-Q3 2015 the sold production of pharmaceutical products
came to PLN 9.799mn, up by 2.4% y/y.
Investment outlays surged by 54.3% y/y to PLN 310.3mn in
Q1-Q3 2015. Of these, PLN 206.6mn were invested in
machinery. During the period, PLN 130.7mn worth of
investments in the pharmaceutical manufacturing sector were
started.
10.47
11.59
10.79
10.45
11.38
12.34
2009 2010 2011 2012 2013 2014
638
158 130 173 195 220152
1,507
1,147 1,1131,217 1,243
1,079
1,334
2000 2005 2010 2011 2012 2013 2014
Sulphonamides Packed farmaceutical herbs
512465 448
397
449
2005 2010 2012 2013 2014
- 15 -Any redistribution of this information is strictly prohibited.
Copyright © 2016 EMIS, all rights reserved.
Source:
Pharmaceutical Manufacturers
Employment (thou persons)
Number of companies
Financial results of pharmaceutical producers (PLN bn)
Statistics office
9.33
16.53
14.27
16.27
15.66
8.16
14.73
13.27
13.70
14.09
1.18
1.80
1.01
2.57
1.57
0.97
1.53
0.85
2.30
1.34
2005
2010
2012
2013
2014
Net financial result
Financial result on economic activity
Costs of obtaining revenues from total activity
Revenues from total activity
22.9
23.9
22.2
21.4
21.9
2005 2010 2012 2013 2014
281300 310
335
71 71 71 68
2010 2011 2012 2013
Total firms Firms with more than 49 employees
- 16 -Any redistribution of this information is strictly prohibited.
Copyright © 2016 EMIS, all rights reserved.
Comments
Source:
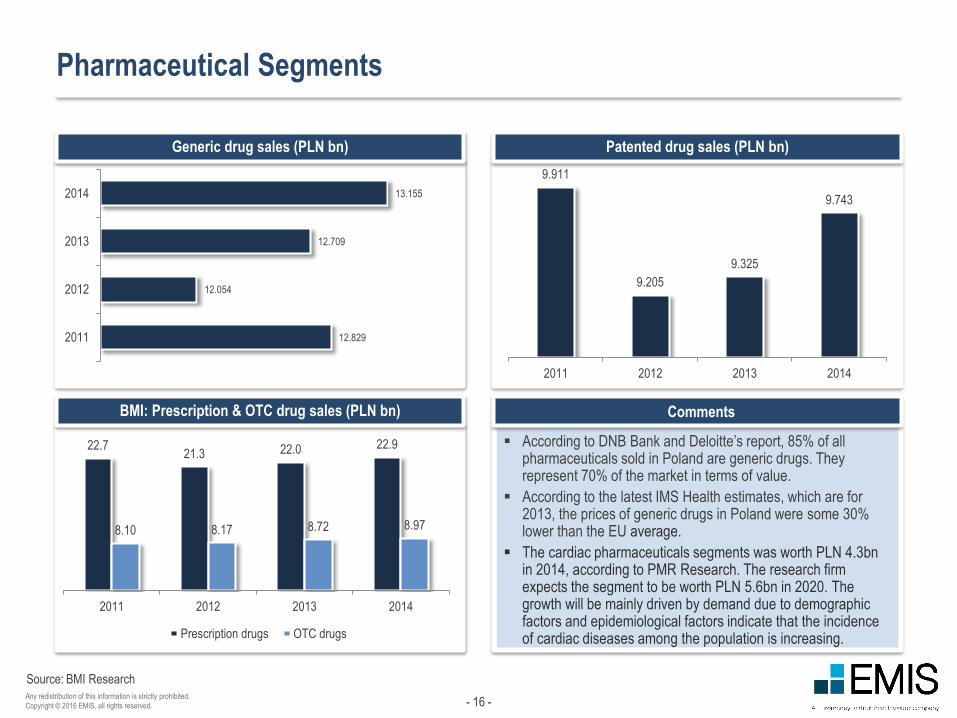
Pharmaceutical Segments
Generic drug sales (PLN bn)
BMI: Prescription & OTC drug sales (PLN bn)
Patented drug sales (PLN bn)
BMI Research
According to DNB Bank and Deloitte’s report, 85% of all pharmaceuticals sold in Poland are generic drugs. They represent 70% of the market in terms of value.
According to the latest IMS Health estimates, which are for 2013, the prices of generic drugs in Poland were some 30% lower than the EU average.
The cardiac pharmaceuticals segments was worth PLN 4.3bn in 2014, according to PMR Research. The research firm expects the segment to be worth PLN 5.6bn in 2020. The growth will be mainly driven by demand due to demographic factors and epidemiological factors indicate that the incidence of cardiac diseases among the population is increasing.
12.829
12.054
12.709
13.155
2011
2012
2013
2014
9.911
9.205
9.325
9.743
2011 2012 2013 2014
22.721.3 22.0 22.9
8.10 8.17 8.72 8.97
2011 2012 2013 2014
Prescription drugs OTC drugs
- 17 -Any redistribution of this information is strictly prohibited.
Copyright © 2016 EMIS, all rights reserved.
Comments
Source:
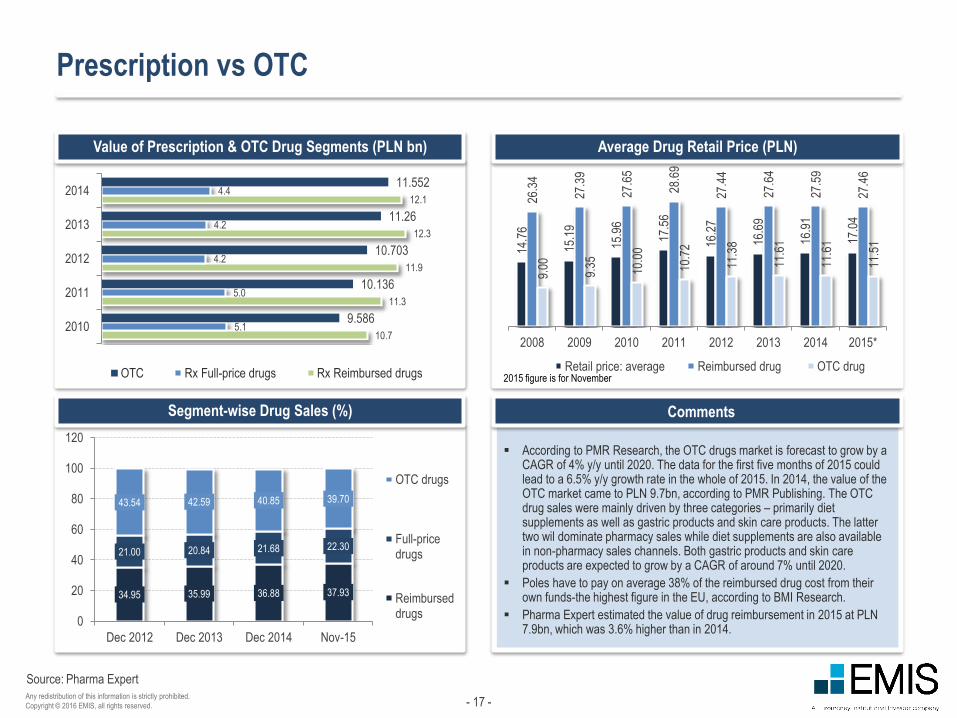
Prescription vs OTC
Value of Prescription & OTC Drug Segments (PLN bn)
Segment-wise Drug Sales (%)
Average Drug Retail Price (PLN)
Pharma Expert
According to PMR Research, the OTC drugs market is forecast to grow by a CAGR of 4% y/y until 2020. The data for the first five months of 2015 could lead to a 6.5% y/y growth rate in the whole of 2015. In 2014, the value of the OTC market came to PLN 9.7bn, according to PMR Publishing. The OTC drug sales were mainly driven by three categories – primarily diet supplements as well as gastric products and skin care products. The latter two wil dominate pharmacy sales while diet supplements are also available in non-pharmacy sales channels. Both gastric products and skin care products are expected to grow by a CAGR of around 7% until 2020.
Poles have to pay on average 38% of the reimbursed drug cost from their own funds-the highest figure in the EU, according to BMI Research.
Pharma Expert estimated the value of drug reimbursement in 2015 at PLN 7.9bn, which was 3.6% higher than in 2014.
10.7
11.3
11.9
12.3
12.1
5.1
5.0
4.2
4.2
4.4
9.586
10.136
10.703
11.26
11.552
2010
2011
2012
2013
2014
OTC Rx Full-price drugs Rx Reimbursed drugs
34.95 35.99 36.88 37.93
21.00 20.84 21.68 22.30
43.54 42.59 40.85 39.70
0
20
40
60
80
100
120
Dec 2012 Dec 2013 Dec 2014 Nov-15
OTC drugs
Full-pricedrugs
Reimburseddrugs
14.7
6
15.1
9
15.9
6
17.5
6
16.2
7
16.6
9
16.9
1
17.0
4
26.3
4
27.3
9
27.6
5
28.6
9
27.4
4
27.6
4
27.5
9
27.4
6
9.00
9.35
10.0
0
10.7
2
11.3
8
11.6
1
11.6
1
11.5
1
2008 2009 2010 2011 2012 2013 2014 2015*
Retail price: average Reimbursed drug OTC drug2015 figure is for November
- 18 -Any redistribution of this information is strictly prohibited.
Copyright © 2016 EMIS, all rights reserved.
Comments
Source:
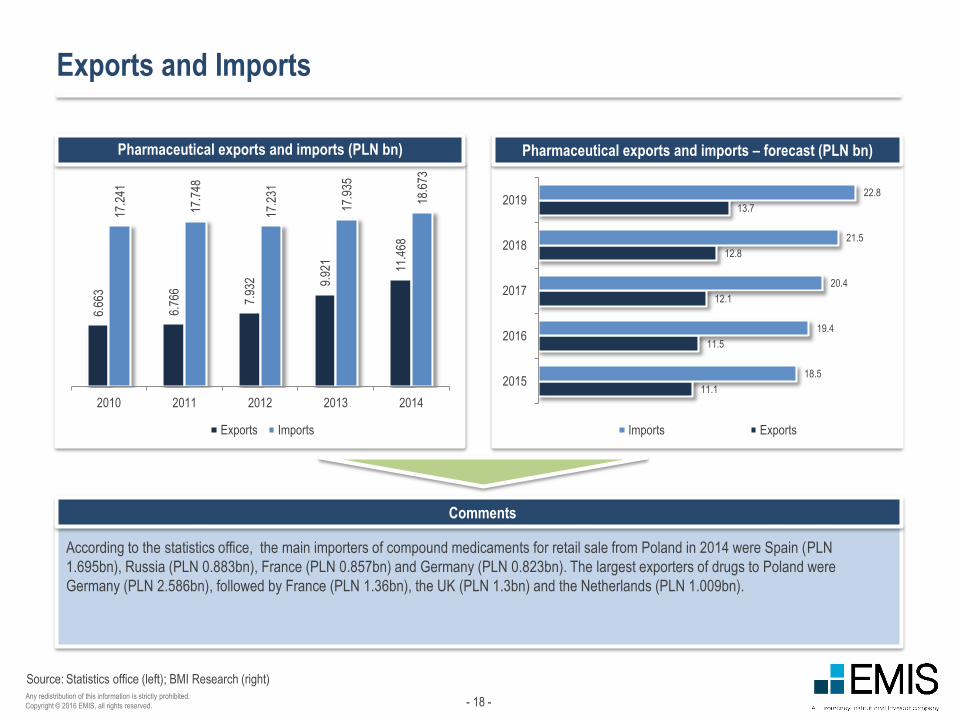
Exports and Imports
According to the statistics office, the main importers of compound medicaments for retail sale from Poland in 2014 were Spain (PLN
1.695bn), Russia (PLN 0.883bn), France (PLN 0.857bn) and Germany (PLN 0.823bn). The largest exporters of drugs to Poland were
Germany (PLN 2.586bn), followed by France (PLN 1.36bn), the UK (PLN 1.3bn) and the Netherlands (PLN 1.009bn).
Pharmaceutical exports and imports (PLN bn) Pharmaceutical exports and imports – forecast (PLN bn)
Statistics office (left); BMI Research (right)
6.66
3
6.76
6
7.93
2 9.92
1
11.4
68
17.2
41
17.7
48
17.2
31
17.9
35
18.6
73
2010 2011 2012 2013 2014
Exports Imports
11.1
11.5
12.1
12.8
13.7
18.5
19.4
20.4
21.5
22.8
2015
2016
2017
2018
2019
Imports Exports
- 19 -Any redistribution of this information is strictly prohibited.
Copyright © 2016 EMIS, all rights reserved.
Comments
Source:
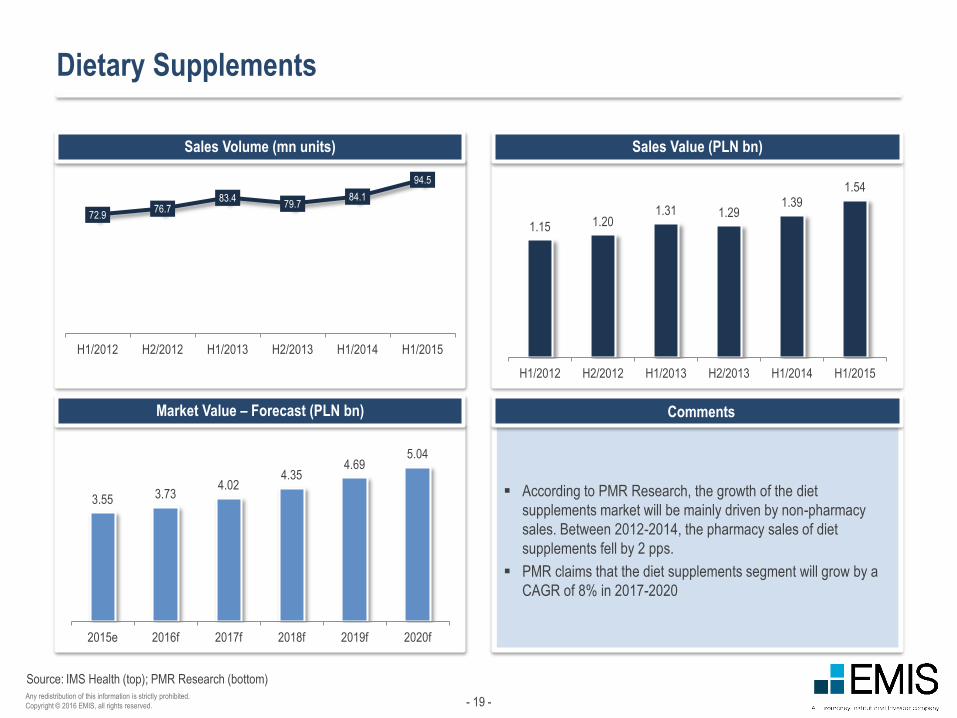
Dietary Supplements
Sales Volume (mn units)
Market Value – Forecast (PLN bn)
Sales Value (PLN bn)
IMS Health (top); PMR Research (bottom)
According to PMR Research, the growth of the diet
supplements market will be mainly driven by non-pharmacy
sales. Between 2012-2014, the pharmacy sales of diet
supplements fell by 2 pps.
PMR claims that the diet supplements segment will grow by a
CAGR of 8% in 2017-2020
72.976.7
83.479.7
84.1
94.5
H1/2012 H2/2012 H1/2013 H2/2013 H1/2014 H1/2015
1.15 1.201.31 1.29
1.391.54
H1/2012 H2/2012 H1/2013 H2/2013 H1/2014 H1/2015
3.55 3.734.02
4.354.69
5.04
2015e 2016f 2017f 2018f 2019f 2020f
- 20 -Any redistribution of this information is strictly prohibited.
Copyright © 2016 EMIS, all rights reserved.
Comments
Source:
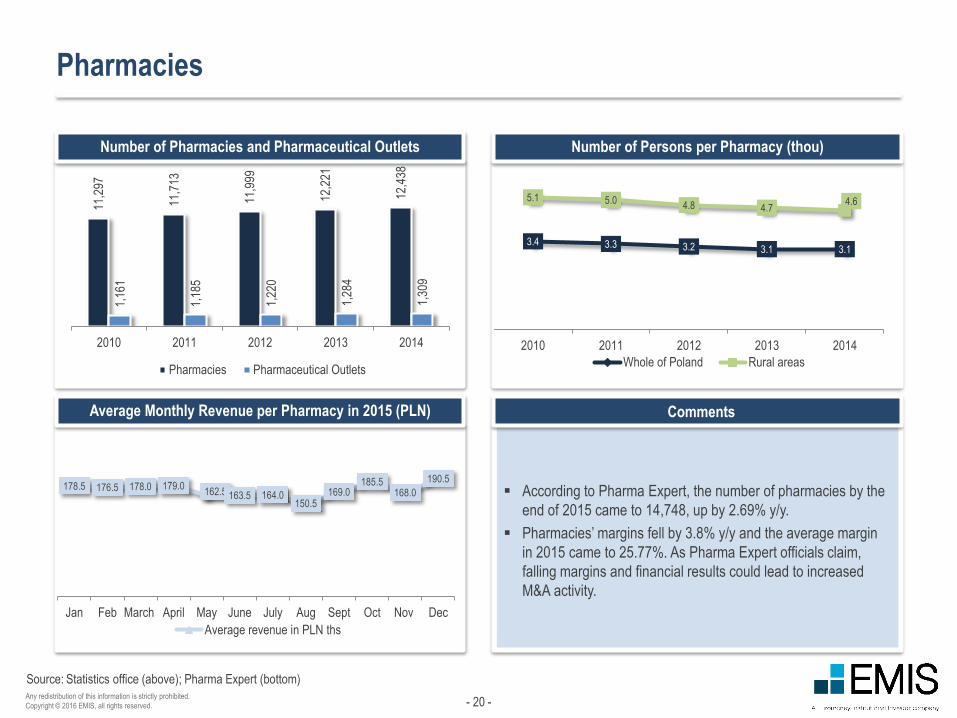
Pharmacies
Number of Pharmacies and Pharmaceutical Outlets
Average Monthly Revenue per Pharmacy in 2015 (PLN)
Number of Persons per Pharmacy (thou)
Statistics office (above); Pharma Expert (bottom)
According to Pharma Expert, the number of pharmacies by the
end of 2015 came to 14,748, up by 2.69% y/y.
Pharmacies’ margins fell by 3.8% y/y and the average margin
in 2015 came to 25.77%. As Pharma Expert officials claim,
falling margins and financial results could lead to increased
M&A activity.
11,2
97
11,7
13
11,9
99
12,2
21
12,4
38
1,16
1
1,18
5
1,22
0
1,28
4
1,30
9
2010 2011 2012 2013 2014
Pharmacies Pharmaceutical Outlets
3.4 3.3 3.2 3.1 3.1
5.1 5.04.8 4.7
4.6
2010 2011 2012 2013 2014
Whole of Poland Rural areas
178.5 176.5 178.0 179.0162.5 163.5 164.0
150.5169.0
185.5168.0
190.5
Jan Feb March April May June July Aug Sept Oct Nov Dec
Average revenue in PLN ths
- 21 -Any redistribution of this information is strictly prohibited.
Copyright © 2016 EMIS, all rights reserved.
Source:
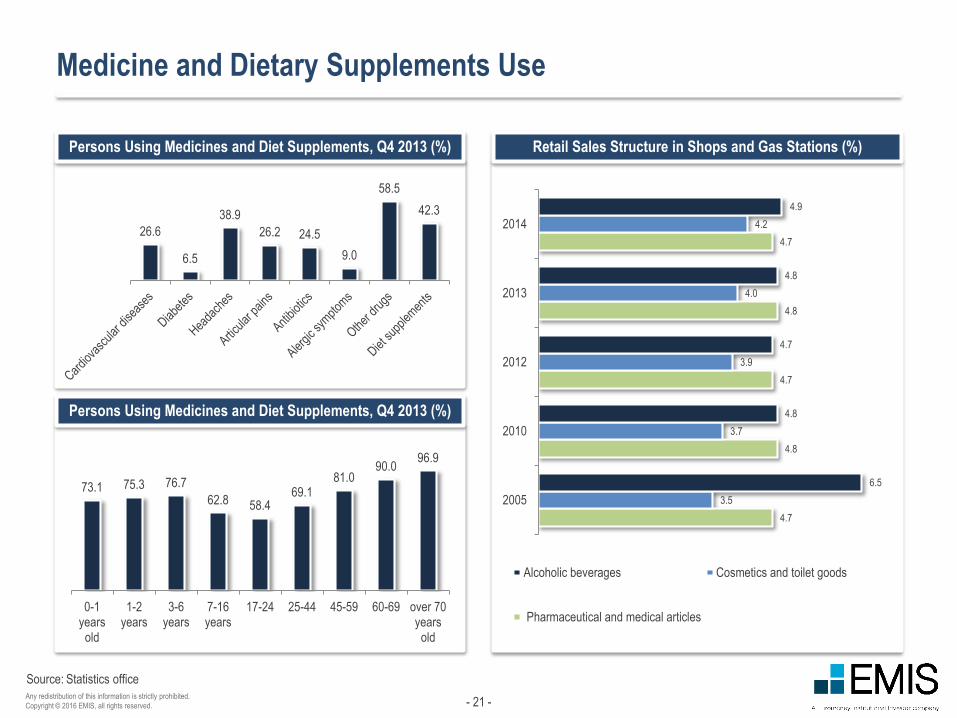
Medicine and Dietary Supplements Use
Persons Using Medicines and Diet Supplements, Q4 2013 (%)
Persons Using Medicines and Diet Supplements, Q4 2013 (%)
Retail Sales Structure in Shops and Gas Stations (%)
Statistics office
4.7
4.8
4.7
4.8
4.7
3.5
3.7
3.9
4.0
4.2
6.5
4.8
4.7
4.8
4.9
2005
2010
2012
2013
2014
Alcoholic beverages Cosmetics and toilet goods
Pharmaceutical and medical articles
26.6
6.5
38.9
26.2 24.5
9.0
58.5
42.3
73.1 75.3 76.7
62.8 58.469.1
81.090.0
96.9
0-1years
old
1-2years
3-6years
7-16years
17-24 25-44 45-59 60-69 over 70years
old
- 22 -Any redistribution of this information is strictly prohibited.
Copyright © 2016 EMIS, all rights reserved.
Source:
Forecast
Pharmaceutical Sales (PLN bn)
Generic Drug Sales (PLN bn)
Patented Drug Sales (PLN bn)
Prescription & OTC Medicine Sales (PLN bn)
BMI Research
33.434.8
36.438.2
40.2
2015e 2016f 2017f 2018f 2019f
13.7
14.2
14.8
15.5
16.3
2015e
2016f
2017f
2018f
2019f
24.133 25.17026.306
27.55428.936
9.253 9.668 10.134 10.652 11.218
2015e 2016f 2017f 2018f 2019f
Prescription drugs OTC drugs
10.481 10.95711.470
12.01912.630
2015e 2016f 2017f 2018f 2019f
- 23 -Any redistribution of this information is strictly prohibited.
Copyright © 2016 EMIS, all rights reserved.
III. Cosmetics
- 24 -Any redistribution of this information is strictly prohibited.
Copyright © 2016 EMIS, all rights reserved.
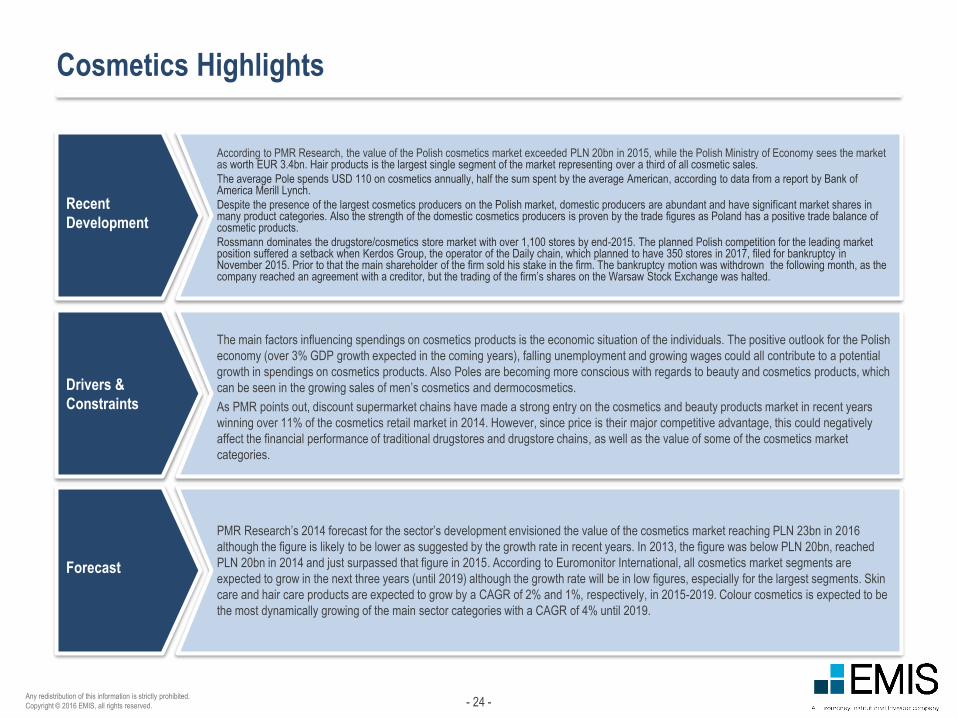
Cosmetics Highlights
Recent
Development
According to PMR Research, the value of the Polish cosmetics market exceeded PLN 20bn in 2015, while the Polish Ministry of Economy sees the market as worth EUR 3.4bn. Hair products is the largest single segment of the market representing over a third of all cosmetic sales.
The average Pole spends USD 110 on cosmetics annually, half the sum spent by the average American, according to data from a report by Bank of America Merill Lynch.
Despite the presence of the largest cosmetics producers on the Polish market, domestic producers are abundant and have significant market shares in many product categories. Also the strength of the domestic cosmetics producers is proven by the trade figures as Poland has a positive trade balance of cosmetic products.
Rossmann dominates the drugstore/cosmetics store market with over 1,100 stores by end-2015. The planned Polish competition for the leading market position suffered a setback when Kerdos Group, the operator of the Daily chain, which planned to have 350 stores in 2017, filed for bankruptcy in November 2015. Prior to that the main shareholder of the firm sold his stake in the firm. The bankruptcy motion was withdrown the following month, as the company reached an agreement with a creditor, but the trading of the firm’s shares on the Warsaw Stock Exchange was halted.
Drivers &
Constraints
The main factors influencing spendings on cosmetics products is the economic situation of the individuals. The positive outlook for the Polish
economy (over 3% GDP growth expected in the coming years), falling unemployment and growing wages could all contribute to a potential
growth in spendings on cosmetics products. Also Poles are becoming more conscious with regards to beauty and cosmetics products, which
can be seen in the growing sales of men’s cosmetics and dermocosmetics.
As PMR points out, discount supermarket chains have made a strong entry on the cosmetics and beauty products market in recent years
winning over 11% of the cosmetics retail market in 2014. However, since price is their major competitive advantage, this could negatively
affect the financial performance of traditional drugstores and drugstore chains, as well as the value of some of the cosmetics market
categories.
Forecast
PMR Research’s 2014 forecast for the sector’s development envisioned the value of the cosmetics market reaching PLN 23bn in 2016
although the figure is likely to be lower as suggested by the growth rate in recent years. In 2013, the figure was below PLN 20bn, reached
PLN 20bn in 2014 and just surpassed that figure in 2015. According to Euromonitor International, all cosmetics market segments are
expected to grow in the next three years (until 2019) although the growth rate will be in low figures, especially for the largest segments. Skin
care and hair care products are expected to grow by a CAGR of 2% and 1%, respectively, in 2015-2019. Colour cosmetics is expected to be
the most dynamically growing of the main sector categories with a CAGR of 4% until 2019.
- 25 -Any redistribution of this information is strictly prohibited.
Copyright © 2016 EMIS, all rights reserved.
Comments
Source:
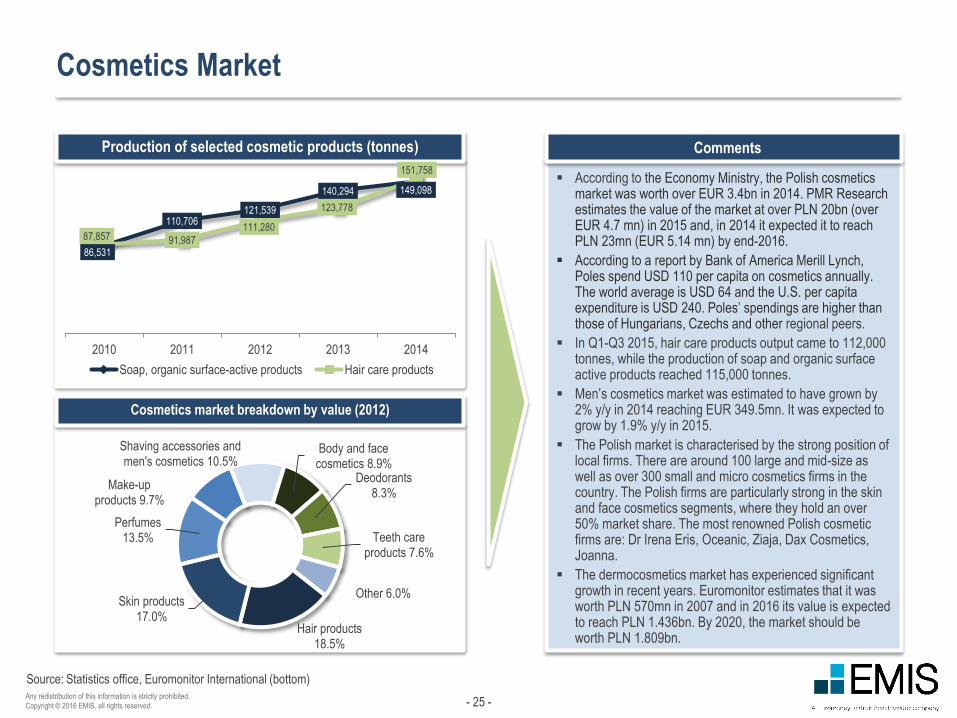
Cosmetics Market
Production of selected cosmetic products (tonnes)
Cosmetics market breakdown by value (2012)
According to the Economy Ministry, the Polish cosmetics market was worth over EUR 3.4bn in 2014. PMR Research estimates the value of the market at over PLN 20bn (over EUR 4.7 mn) in 2015 and, in 2014 it expected it to reach PLN 23mn (EUR 5.14 mn) by end-2016.
According to a report by Bank of America Merill Lynch, Poles spend USD 110 per capita on cosmetics annually. The world average is USD 64 and the U.S. per capita expenditure is USD 240. Poles’ spendings are higher than those of Hungarians, Czechs and other regional peers.
In Q1-Q3 2015, hair care products output came to 112,000 tonnes, while the production of soap and organic surface active products reached 115,000 tonnes.
Men’s cosmetics market was estimated to have grown by 2% y/y in 2014 reaching EUR 349.5mn. It was expected to grow by 1.9% y/y in 2015.
The Polish market is characterised by the strong position of local firms. There are around 100 large and mid-size as well as over 300 small and micro cosmetics firms in the country. The Polish firms are particularly strong in the skin and face cosmetics segments, where they hold an over 50% market share. The most renowned Polish cosmetic firms are: Dr Irena Eris, Oceanic, Ziaja, Dax Cosmetics, Joanna.
The dermocosmetics market has experienced significant growth in recent years. Euromonitor estimates that it was worth PLN 570mn in 2007 and in 2016 its value is expected to reach PLN 1.436bn. By 2020, the market should be worth PLN 1.809bn.
Statistics office, Euromonitor International (bottom)
86,531
110,706121,539
140,294 149,098
87,857 91,987
111,280
123,778
151,758
2010 2011 2012 2013 2014
Soap, organic surface-active products Hair care products
Hair products18.5%
Skin products 17.0%
Perfumes13.5%
Make-up products 9.7%
Shaving accessories and men's cosmetics 10.5%
Body and face cosmetics 8.9%
Deodorants8.3%
Teeth care products 7.6%
Other 6.0%
- 26 -Any redistribution of this information is strictly prohibited.
Copyright © 2016 EMIS, all rights reserved.
Comments
Source:
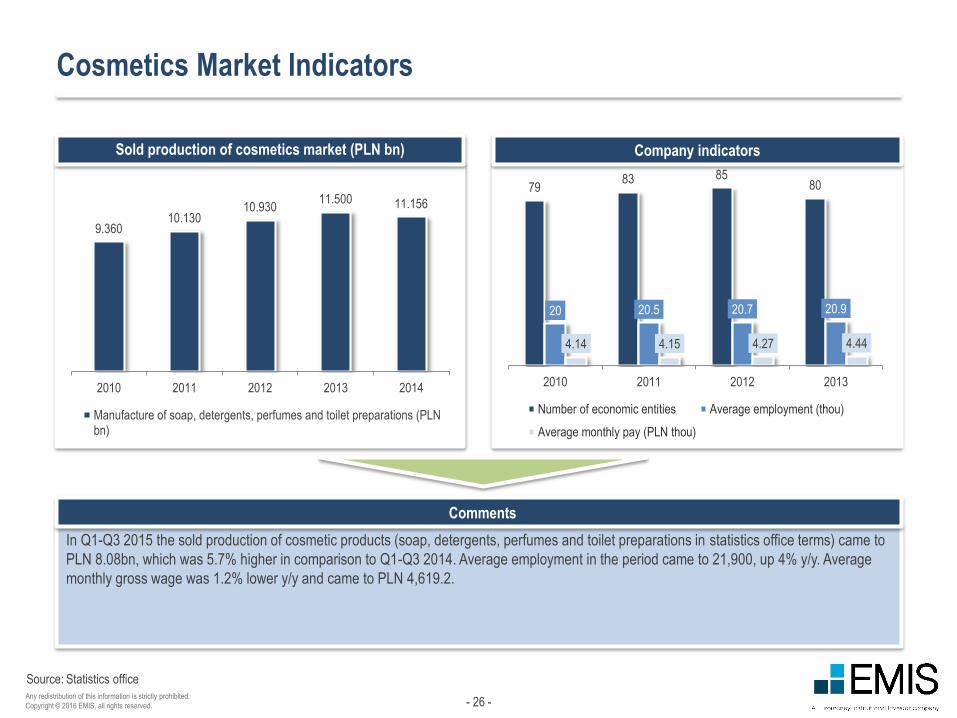
Cosmetics Market Indicators
In Q1-Q3 2015 the sold production of cosmetic products (soap, detergents, perfumes and toilet preparations in statistics office terms) came to
PLN 8.08bn, which was 5.7% higher in comparison to Q1-Q3 2014. Average employment in the period came to 21,900, up 4% y/y. Average
monthly gross wage was 1.2% lower y/y and came to PLN 4,619.2.
Sold production of cosmetics market (PLN bn) Company indicators
Statistics office
7983 85
80
20 20.5 20.7 20.9
4.14 4.15 4.27 4.44
2010 2011 2012 2013
Number of economic entities Average employment (thou)
Average monthly pay (PLN thou)
9.36010.130
10.93011.500 11.156
2010 2011 2012 2013 2014
Manufacture of soap, detergents, perfumes and toilet preparations (PLNbn)
- 27 -Any redistribution of this information is strictly prohibited.
Copyright © 2016 EMIS, all rights reserved.
Source:
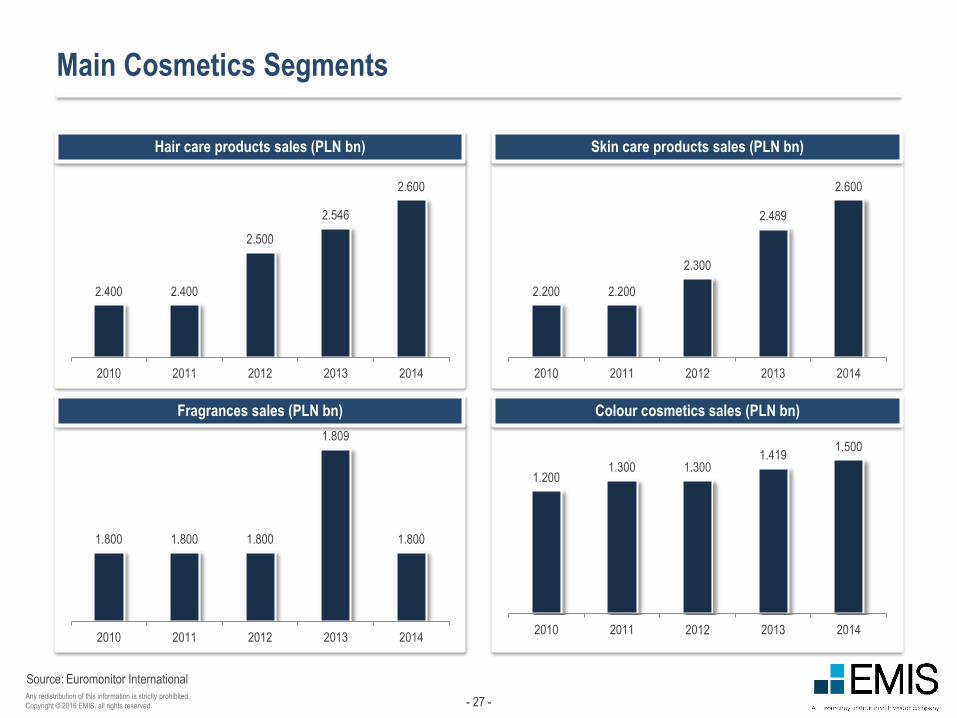
Main Cosmetics Segments
Hair care products sales (PLN bn)
Fragrances sales (PLN bn)
Skin care products sales (PLN bn)
Colour cosmetics sales (PLN bn)
Euromonitor International
2.200 2.200
2.300
2.489
2.600
2010 2011 2012 2013 2014
2.400 2.400
2.500
2.546
2.600
2010 2011 2012 2013 2014
1.800 1.800 1.800
1.809
1.800
2010 2011 2012 2013 2014
1.2001.300 1.300
1.4191.500
2010 2011 2012 2013 2014
- 28 -Any redistribution of this information is strictly prohibited.
Copyright © 2016 EMIS, all rights reserved.
Source:
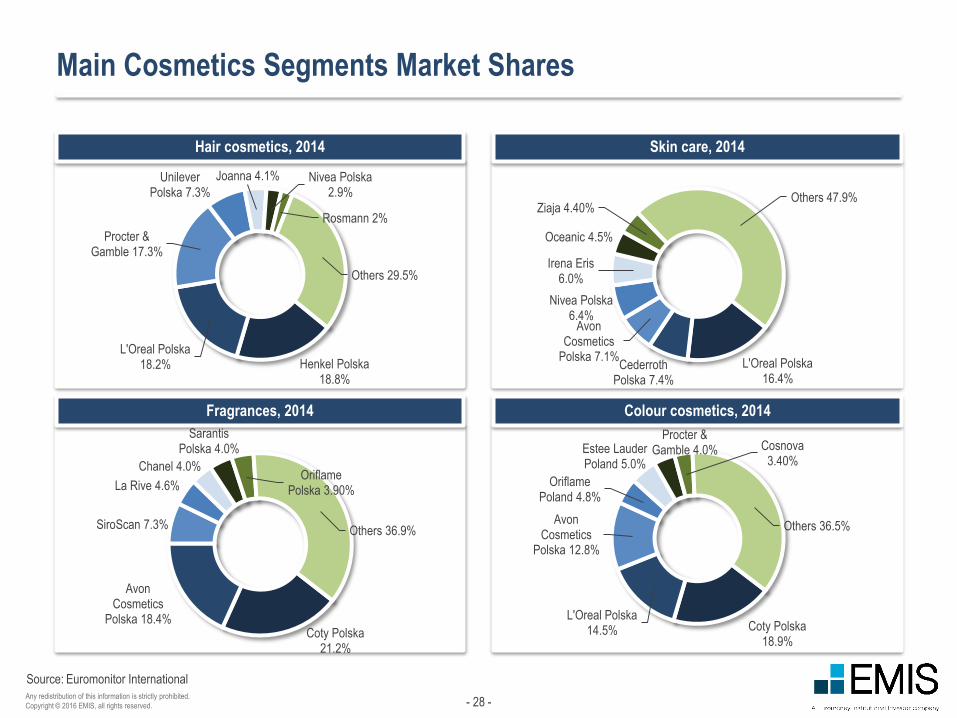
Main Cosmetics Segments Market Shares
Hair cosmetics, 2014
Fragrances, 2014
Skin care, 2014
Colour cosmetics, 2014
Euromonitor International
Henkel Polska18.8%
L'Oreal Polska18.2%
Procter & Gamble 17.3%
Unilever Polska 7.3%
Joanna 4.1% Nivea Polska2.9%
Rosmann 2%
Others 29.5%
L'Oreal Polska16.4%
Cederroth Polska 7.4%
Avon Cosmetics
Polska 7.1%
Nivea Polska6.4%
Irena Eris6.0%
Oceanic 4.5%
Ziaja 4.40%Others 47.9%
Coty Polska21.2%
Avon Cosmetics
Polska 18.4%
SiroScan 7.3%
La Rive 4.6%
Chanel 4.0%
Sarantis Polska 4.0%
Oriflame Polska 3.90%
Others 36.9%
Coty Polska18.9%
L'Oreal Polska14.5%
Avon Cosmetics
Polska 12.8%
Oriflame Poland 4.8%
Estee Lauder Poland 5.0%
Procter & Gamble 4.0% Cosnova
3.40%
Others 36.5%
- 29 -Any redistribution of this information is strictly prohibited.
Copyright © 2016 EMIS, all rights reserved.
Comments
Source:
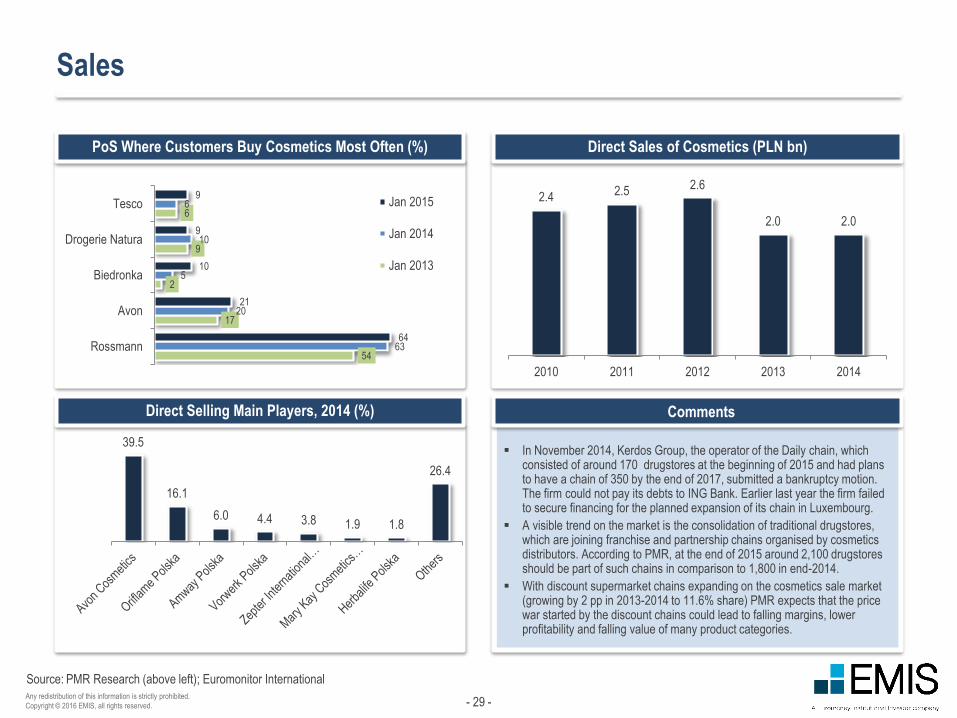
Sales
PoS Where Customers Buy Cosmetics Most Often (%)
Direct Selling Main Players, 2014 (%)
Direct Sales of Cosmetics (PLN bn)
PMR Research (above left); Euromonitor International
In November 2014, Kerdos Group, the operator of the Daily chain, which consisted of around 170 drugstores at the beginning of 2015 and had plans to have a chain of 350 by the end of 2017, submitted a bankruptcy motion. The firm could not pay its debts to ING Bank. Earlier last year the firm failed to secure financing for the planned expansion of its chain in Luxembourg.
A visible trend on the market is the consolidation of traditional drugstores, which are joining franchise and partnership chains organised by cosmetics distributors. According to PMR, at the end of 2015 around 2,100 drugstores should be part of such chains in comparison to 1,800 in end-2014.
With discount supermarket chains expanding on the cosmetics sale market (growing by 2 pp in 2013-2014 to 11.6% share) PMR expects that the price war started by the discount chains could lead to falling margins, lower profitability and falling value of many product categories.
2.4 2.5 2.6
2.0 2.0
2010 2011 2012 2013 2014
39.5
16.1
6.0 4.4 3.8 1.9 1.8
26.4
54
17
2
9
6
63
20
5
10
6
64
21
10
9
9
Rossmann
Avon
Biedronka
Drogerie Natura
Tesco Jan 2015
Jan 2014
Jan 2013
- 30 -Any redistribution of this information is strictly prohibited.
Copyright © 2016 EMIS, all rights reserved.
Comments
Source:
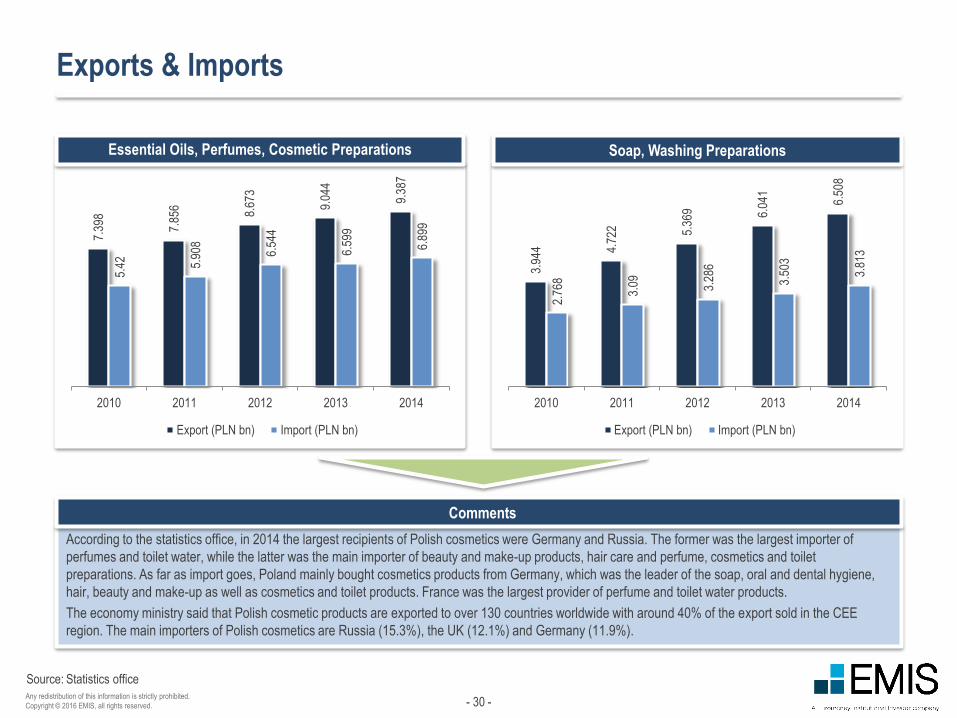
Exports & Imports
According to the statistics office, in 2014 the largest recipients of Polish cosmetics were Germany and Russia. The former was the largest importer of
perfumes and toilet water, while the latter was the main importer of beauty and make-up products, hair care and perfume, cosmetics and toilet
preparations. As far as import goes, Poland mainly bought cosmetics products from Germany, which was the leader of the soap, oral and dental hygiene,
hair, beauty and make-up as well as cosmetics and toilet products. France was the largest provider of perfume and toilet water products.
The economy ministry said that Polish cosmetic products are exported to over 130 countries worldwide with around 40% of the export sold in the CEE
region. The main importers of Polish cosmetics are Russia (15.3%), the UK (12.1%) and Germany (11.9%).
Essential Oils, Perfumes, Cosmetic Preparations Soap, Washing Preparations
Statistics office
7.39
8
7.85
6 8.67
3
9.04
4
9.38
7
5.42 5.
908
6.54
4
6.59
9
6.89
9
2010 2011 2012 2013 2014
Export (PLN bn) Import (PLN bn)
3.94
4 4.72
2 5.36
9 6.04
1
6.50
8
2.76
8
3.09 3.28
6
3.50
3
3.81
3
2010 2011 2012 2013 2014
Export (PLN bn) Import (PLN bn)
- 31 -Any redistribution of this information is strictly prohibited.
Copyright © 2016 EMIS, all rights reserved.
Source:
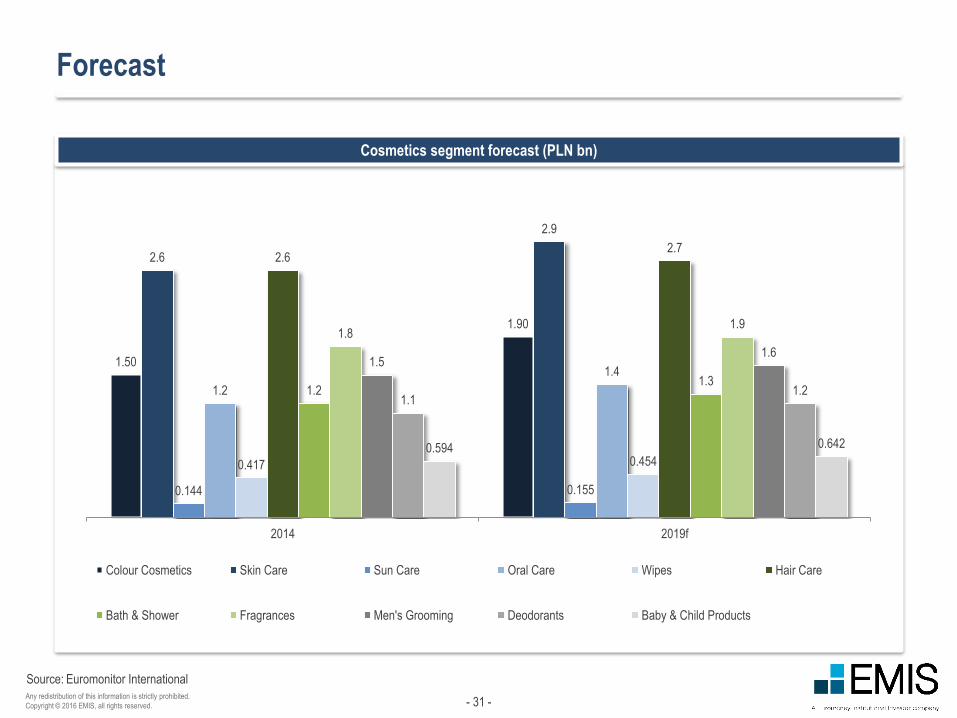
Forecast
Cosmetics segment forecast (PLN bn)
Euromonitor International
1.50
1.90
2.6
2.9
0.144 0.155
1.2
1.4
0.417 0.454
2.62.7
1.21.3
1.81.9
1.51.6
1.11.2
0.594 0.642
2014 2019f
Colour Cosmetics Skin Care Sun Care Oral Care Wipes Hair Care
Bath & Shower Fragrances Men's Grooming Deodorants Baby & Child Products
- 32 -Any redistribution of this information is strictly prohibited.
Copyright © 2016 EMIS, all rights reserved.
IV. Main Players
- 33 -Any redistribution of this information is strictly prohibited.
Copyright © 2016 EMIS, all rights reserved.
Source:
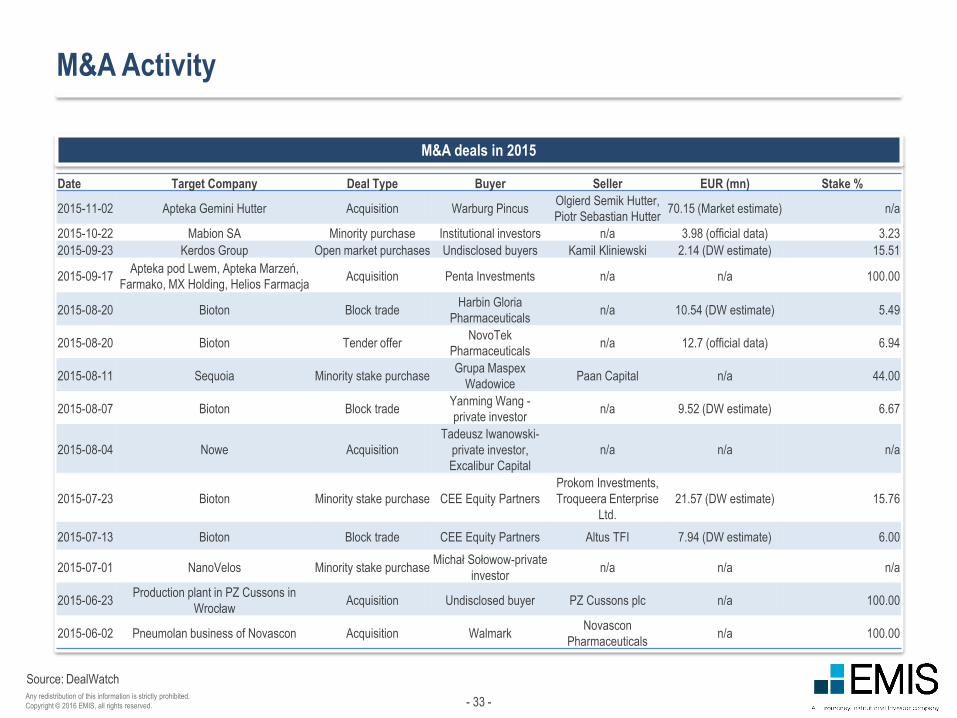
M&A Activity
M&A deals in 2015
DealWatch
Date Target Company Deal Type Buyer Seller EUR (mn) Stake %
2015-11-02 Apteka Gemini Hutter Acquisition Warburg PincusOlgierd Semik Hutter,
Piotr Sebastian Hutter70.15 (Market estimate) n/a
2015-10-22 Mabion SA Minority purchase Institutional investors n/a 3.98 (official data) 3.23
2015-09-23 Kerdos Group Open market purchases Undisclosed buyers Kamil Kliniewski 2.14 (DW estimate) 15.51
2015-09-17Apteka pod Lwem, Apteka Marzeń,
Farmako, MX Holding, Helios FarmacjaAcquisition Penta Investments n/a n/a 100.00
2015-08-20 Bioton Block tradeHarbin Gloria
Pharmaceuticalsn/a 10.54 (DW estimate) 5.49
2015-08-20 Bioton Tender offerNovoTek
Pharmaceuticalsn/a 12.7 (official data) 6.94
2015-08-11 Sequoia Minority stake purchaseGrupa Maspex
WadowicePaan Capital n/a 44.00
2015-08-07 Bioton Block tradeYanming Wang -
private investorn/a 9.52 (DW estimate) 6.67
2015-08-04 Nowe Acquisition
Tadeusz Iwanowski-
private investor,
Excalibur Capital
n/a n/a n/a
2015-07-23 Bioton Minority stake purchase CEE Equity Partners
Prokom Investments,
Troqueera Enterprise
Ltd.
21.57 (DW estimate) 15.76
2015-07-13 Bioton Block trade CEE Equity Partners Altus TFI 7.94 (DW estimate) 6.00
2015-07-01 NanoVelos Minority stake purchaseMichał Sołowow-private
investorn/a n/a n/a
2015-06-23Production plant in PZ Cussons in
WrocławAcquisition Undisclosed buyer PZ Cussons plc n/a 100.00
2015-06-02 Pneumolan business of Novascon Acquisition WalmarkNovascon
Pharmaceuticalsn/a 100.00
- 34 -Any redistribution of this information is strictly prohibited.
Copyright © 2016 EMIS, all rights reserved.
Source:
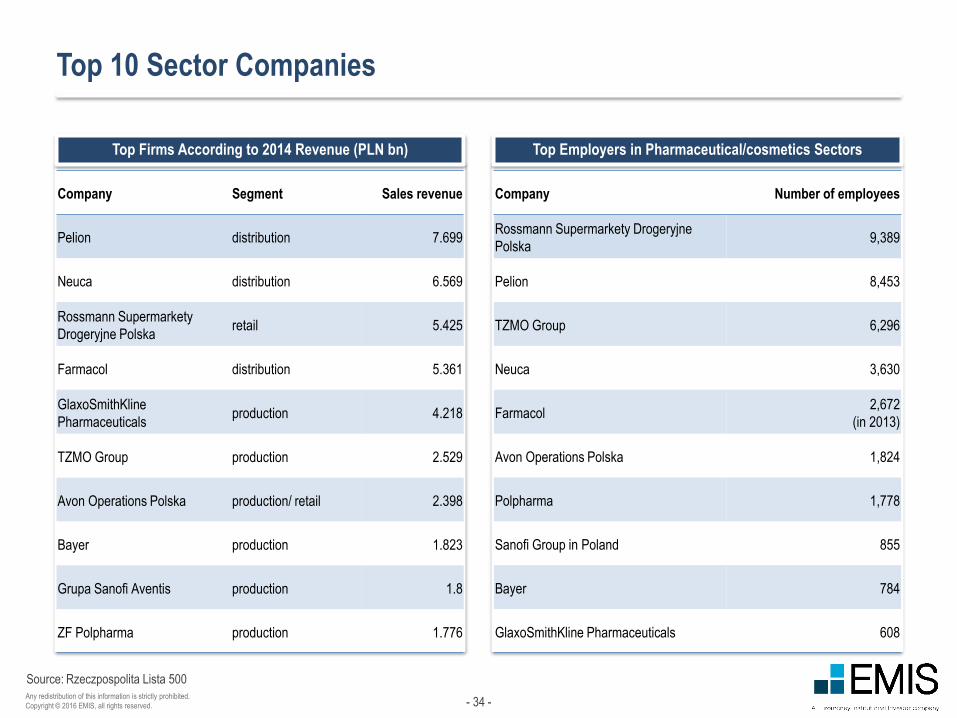
Top 10 Sector Companies
Top Firms According to 2014 Revenue (PLN bn) Top Employers in Pharmaceutical/cosmetics Sectors
Rzeczpospolita Lista 500
Company Number of employees
Rossmann Supermarkety Drogeryjne
Polska9,389
Pelion 8,453
TZMO Group 6,296
Neuca 3,630
Farmacol2,672
(in 2013)
Avon Operations Polska 1,824
Polpharma 1,778
Sanofi Group in Poland 855
Bayer 784
GlaxoSmithKline Pharmaceuticals 608
Company Segment Sales revenue
Pelion distribution 7.699
Neuca distribution 6.569
Rossmann Supermarkety
Drogeryjne Polskaretail 5.425
Farmacol distribution 5.361
GlaxoSmithKline
Pharmaceuticalsproduction 4.218
TZMO Group production 2.529
Avon Operations Polska production/ retail 2.398
Bayer production 1.823
Grupa Sanofi Aventis production 1.8
ZF Polpharma production 1.776
- 35 -Any redistribution of this information is strictly prohibited.
Copyright © 2016 EMIS, all rights reserved.
Highlights
Source:
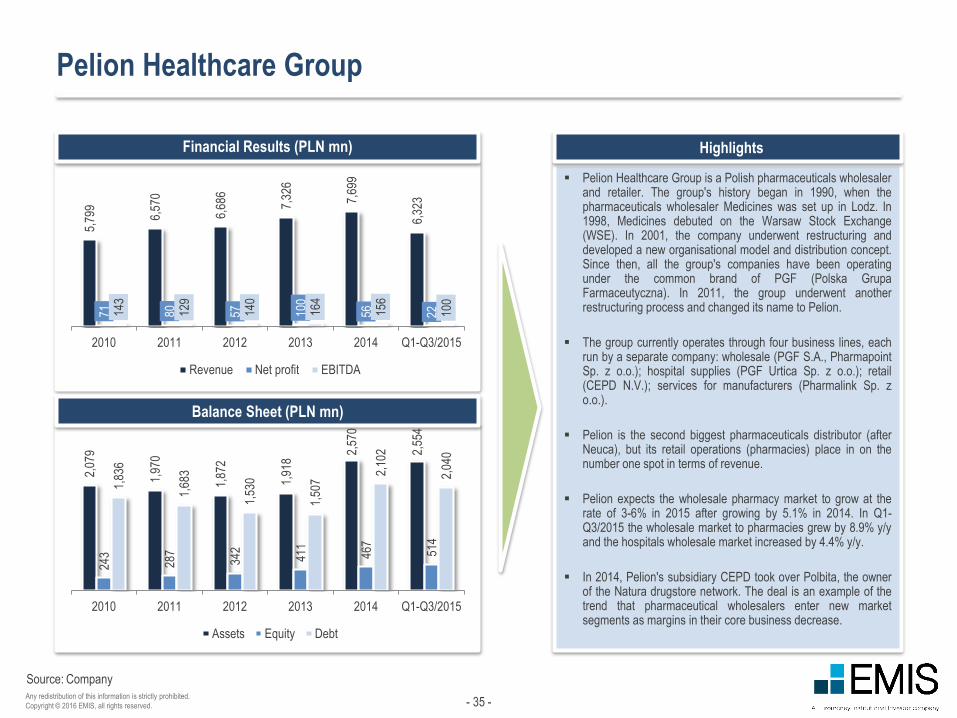
Pelion Healthcare Group
Financial Results (PLN mn)
Pelion Healthcare Group is a Polish pharmaceuticals wholesalerand retailer. The group's history began in 1990, when thepharmaceuticals wholesaler Medicines was set up in Lodz. In1998, Medicines debuted on the Warsaw Stock Exchange(WSE). In 2001, the company underwent restructuring anddeveloped a new organisational model and distribution concept.Since then, all the group's companies have been operatingunder the common brand of PGF (Polska GrupaFarmaceutyczna). In 2011, the group underwent anotherrestructuring process and changed its name to Pelion.
The group currently operates through four business lines, eachrun by a separate company: wholesale (PGF S.A., PharmapointSp. z o.o.); hospital supplies (PGF Urtica Sp. z o.o.); retail(CEPD N.V.); services for manufacturers (Pharmalink Sp. zo.o.).
Pelion is the second biggest pharmaceuticals distributor (afterNeuca), but its retail operations (pharmacies) place in on thenumber one spot in terms of revenue.
Pelion expects the wholesale pharmacy market to grow at therate of 3-6% in 2015 after growing by 5.1% in 2014. In Q1-Q3/2015 the wholesale market to pharmacies grew by 8.9% y/yand the hospitals wholesale market increased by 4.4% y/y.
In 2014, Pelion's subsidiary CEPD took over Polbita, the ownerof the Natura drugstore network. The deal is an example of thetrend that pharmaceutical wholesalers enter new marketsegments as margins in their core business decrease.
Balance Sheet (PLN mn)
Company
5,79
9
6,57
0
6,68
6
7,32
6
7,69
9
6,32
3
71 80 57 100
56 22143
129
140
164
156
100
2010 2011 2012 2013 2014 Q1-Q3/2015
Revenue Net profit EBITDA
2,07
9
1,97
0
1,87
2
1,91
8
2,57
0
2,55
4
243
287
342
411
467
514
1,83
6
1,68
3
1,53
0
1,50
7
2,10
2
2,04
0
2010 2011 2012 2013 2014 Q1-Q3/2015
Assets Equity Debt
- 36 -Any redistribution of this information is strictly prohibited.
Copyright © 2016 EMIS, all rights reserved.
Source:
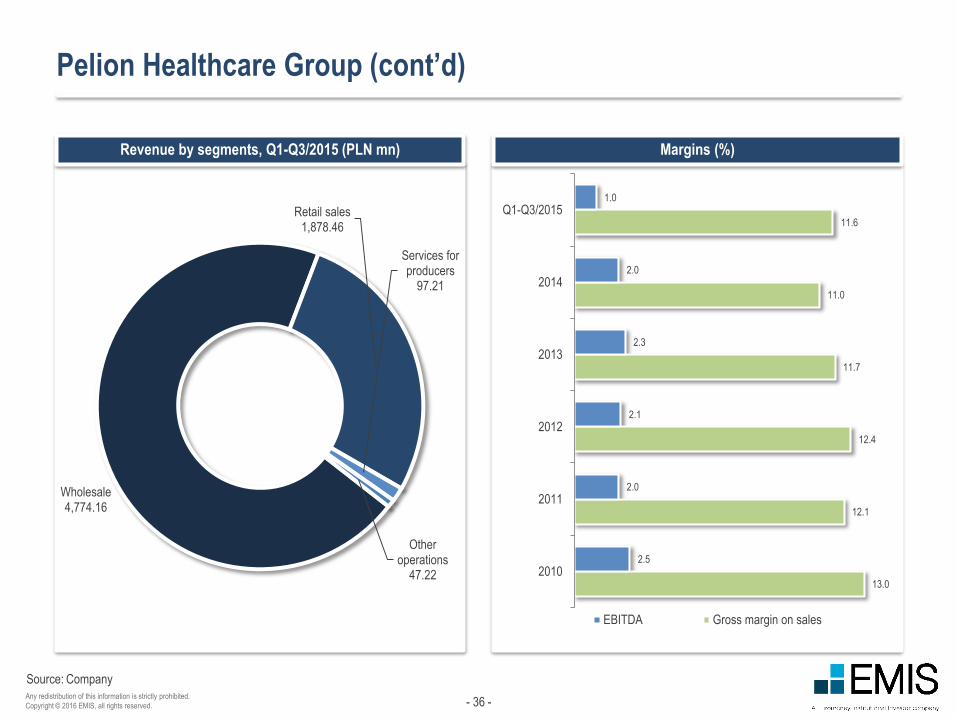
Pelion Healthcare Group (cont’d)
Revenue by segments, Q1-Q3/2015 (PLN mn) Margins (%)
Company
13.0
12.1
12.4
11.7
11.0
11.6
2.5
2.0
2.1
2.3
2.0
1.0
2010
2011
2012
2013
2014
Q1-Q3/2015
EBITDA Gross margin on sales
Wholesale4,774.16
Retail sales1,878.46
Services for producers
97.21
Other operations
47.22
- 37 -Any redistribution of this information is strictly prohibited.
Copyright © 2016 EMIS, all rights reserved.
Highlights
Source:
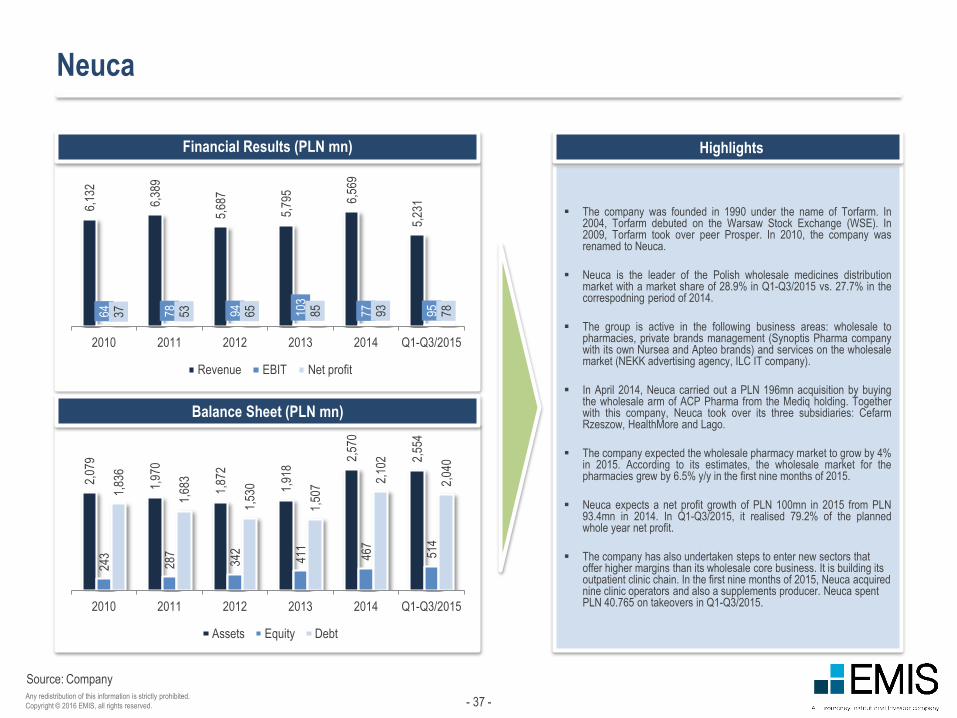
Neuca
Financial Results (PLN mn)
The company was founded in 1990 under the name of Torfarm. In2004, Torfarm debuted on the Warsaw Stock Exchange (WSE). In2009, Torfarm took over peer Prosper. In 2010, the company wasrenamed to Neuca.
Neuca is the leader of the Polish wholesale medicines distributionmarket with a market share of 28.9% in Q1-Q3/2015 vs. 27.7% in thecorrespodning period of 2014.
The group is active in the following business areas: wholesale topharmacies, private brands management (Synoptis Pharma companywith its own Nursea and Apteo brands) and services on the wholesalemarket (NEKK advertising agency, ILC IT company).
In April 2014, Neuca carried out a PLN 196mn acquisition by buyingthe wholesale arm of ACP Pharma from the Mediq holding. Togetherwith this company, Neuca took over its three subsidiaries: CefarmRzeszow, HealthMore and Lago.
The company expected the wholesale pharmacy market to grow by 4%in 2015. According to its estimates, the wholesale market for thepharmacies grew by 6.5% y/y in the first nine months of 2015.
Neuca expects a net profit growth of PLN 100mn in 2015 from PLN93.4mn in 2014. In Q1-Q3/2015, it realised 79.2% of the plannedwhole year net profit.
The company has also undertaken steps to enter new sectors that offer higher margins than its wholesale core business. It is building its outpatient clinic chain. In the first nine months of 2015, Neuca acquired nine clinic operators and also a supplements producer. Neuca spent PLN 40.765 on takeovers in Q1-Q3/2015.
Balance Sheet (PLN mn)
Company
6,13
2
6,38
9
5,68
7
5,79
5
6,56
9
5,23
1
64 78 94 103
77 9537 53 65 85 93 78
2010 2011 2012 2013 2014 Q1-Q3/2015
Revenue EBIT Net profit
2,07
9
1,97
0
1,87
2
1,91
8
2,57
0
2,55
4
243
287
342
411
467
514
1,83
6
1,68
3
1,53
0
1,50
7
2,10
2
2,04
0
2010 2011 2012 2013 2014 Q1-Q3/2015
Assets Equity Debt
- 38 -Any redistribution of this information is strictly prohibited.
Copyright © 2016 EMIS, all rights reserved.
Source:
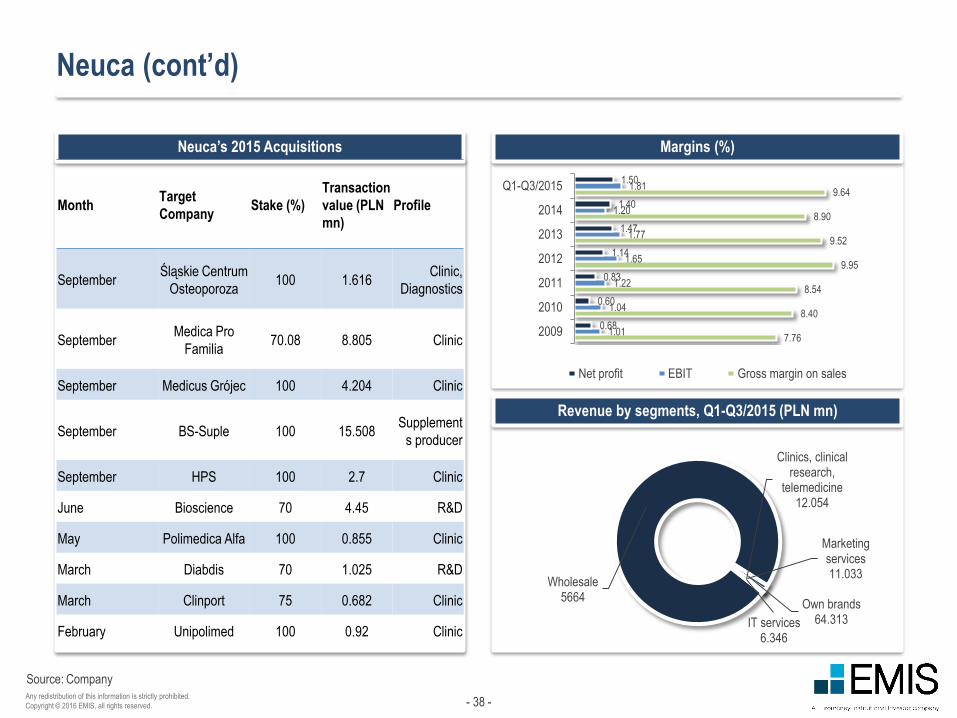
Neuca (cont’d)
Margins (%)
Revenue by segments, Q1-Q3/2015 (PLN mn)
Neuca’s 2015 Acquisitions
Company
7.76
8.40
8.54
9.95
9.52
8.90
9.64
1.01
1.04
1.22
1.65
1.77
1.20
1.81
0.68
0.60
0.83
1.14
1.47
1.40
1.50
2009
2010
2011
2012
2013
2014
Q1-Q3/2015
Net profit EBIT Gross margin on sales
Wholesale5664
Own brands64.313
Marketing services11.033
IT services6.346
Clinics, clinical research,
telemedicine12.054
MonthTarget
CompanyStake (%)
Transaction
value (PLN
mn)
Profile
SeptemberŚląskie Centrum
Osteoporoza100 1.616
Clinic,
Diagnostics
SeptemberMedica Pro
Familia70.08 8.805 Clinic
September Medicus Grójec 100 4.204 Clinic
September BS-Suple 100 15.508Supplement
s producer
September HPS 100 2.7 Clinic
June Bioscience 70 4.45 R&D
May Polimedica Alfa 100 0.855 Clinic
March Diabdis 70 1.025 R&D
March Clinport 75 0.682 Clinic
February Unipolimed 100 0.92 Clinic
- 39 -Any redistribution of this information is strictly prohibited.
Copyright © 2016 EMIS, all rights reserved.
Highlights
Source:
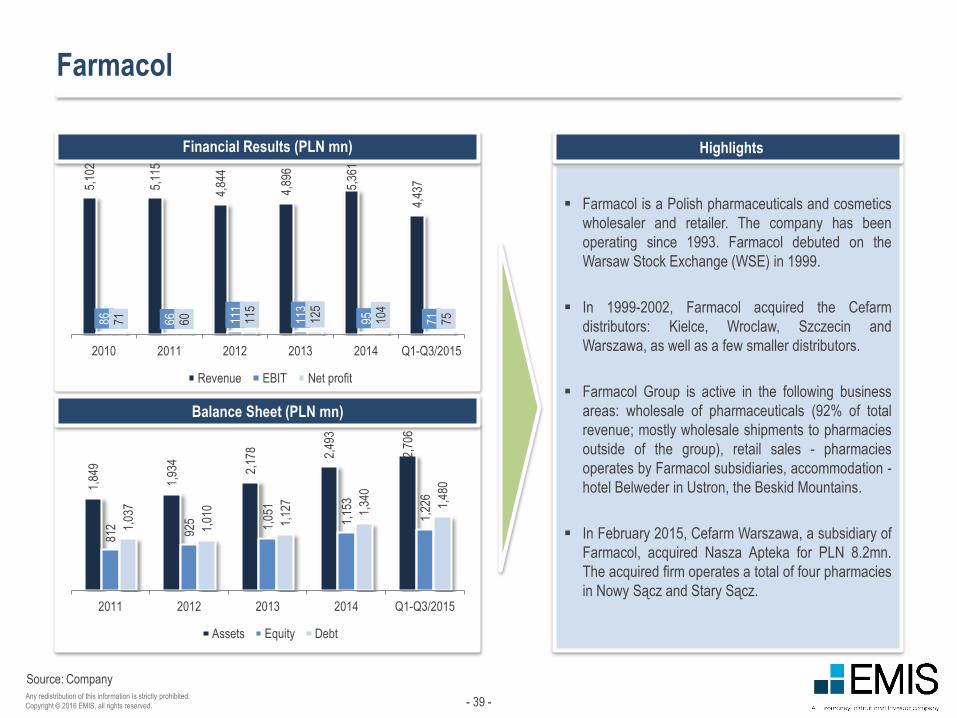
Farmacol
Financial Results (PLN mn)
Farmacol is a Polish pharmaceuticals and cosmetics
wholesaler and retailer. The company has been
operating since 1993. Farmacol debuted on the
Warsaw Stock Exchange (WSE) in 1999.
In 1999-2002, Farmacol acquired the Cefarm
distributors: Kielce, Wroclaw, Szczecin and
Warszawa, as well as a few smaller distributors.
Farmacol Group is active in the following business
areas: wholesale of pharmaceuticals (92% of total
revenue; mostly wholesale shipments to pharmacies
outside of the group), retail sales - pharmacies
operates by Farmacol subsidiaries, accommodation -
hotel Belweder in Ustron, the Beskid Mountains.
In February 2015, Cefarm Warszawa, a subsidiary of
Farmacol, acquired Nasza Apteka for PLN 8.2mn.
The acquired firm operates a total of four pharmacies
in Nowy Sącz and Stary Sącz.
Balance Sheet (PLN mn)
Company
5,10
2
5,11
5
4,84
4
4,89
6
5,36
1
4,43
7
86 66 111
113
95 7171 60 115
125
104
75
2010 2011 2012 2013 2014 Q1-Q3/2015
Revenue EBIT Net profit
1,84
9
1,93
4
2,17
8 2,49
3
2,70
6
812
925 1,05
1
1,15
3
1,22
6
1,03
7
1,01
0
1,12
7
1,34
0
1,48
0
2011 2012 2013 2014 Q1-Q3/2015
Assets Equity Debt
- 40 -Any redistribution of this information is strictly prohibited.
Copyright © 2016 EMIS, all rights reserved.
Source:
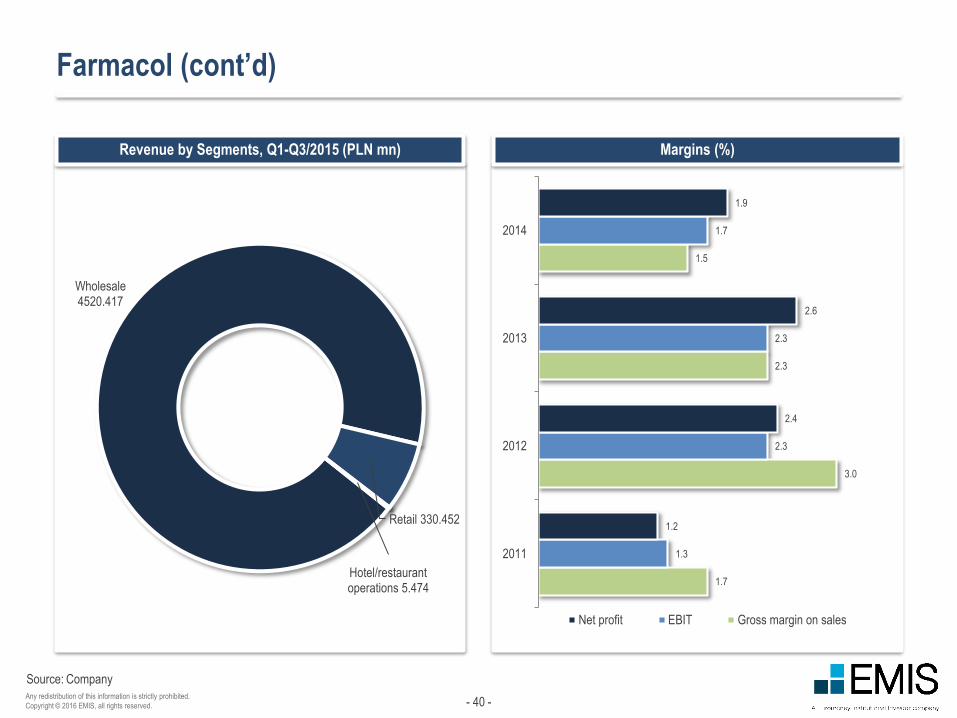
Farmacol (cont’d)
Revenue by Segments, Q1-Q3/2015 (PLN mn) Margins (%)
Company
1.7
3.0
2.3
1.5
1.3
2.3
2.3
1.7
1.2
2.4
2.6
1.9
2011
2012
2013
2014
Net profit EBIT Gross margin on sales
Wholesale4520.417
Retail 330.452
Hotel/restaurant operations 5.474
- 41 -Any redistribution of this information is strictly prohibited.
Copyright © 2016 EMIS, all rights reserved.
Highlights
Source:
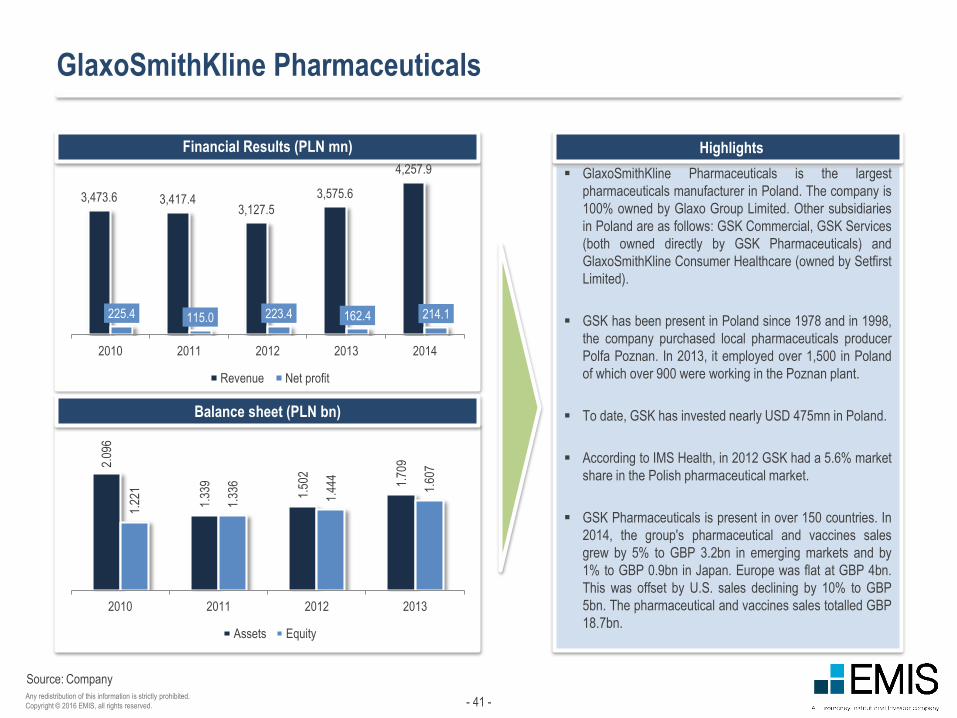
GlaxoSmithKline Pharmaceuticals
Financial Results (PLN mn)
GlaxoSmithKline Pharmaceuticals is the largest
pharmaceuticals manufacturer in Poland. The company is
100% owned by Glaxo Group Limited. Other subsidiaries
in Poland are as follows: GSK Commercial, GSK Services
(both owned directly by GSK Pharmaceuticals) and
GlaxoSmithKline Consumer Healthcare (owned by Setfirst
Limited).
GSK has been present in Poland since 1978 and in 1998,
the company purchased local pharmaceuticals producer
Polfa Poznan. In 2013, it employed over 1,500 in Poland
of which over 900 were working in the Poznan plant.
To date, GSK has invested nearly USD 475mn in Poland.
According to IMS Health, in 2012 GSK had a 5.6% market
share in the Polish pharmaceutical market.
GSK Pharmaceuticals is present in over 150 countries. In
2014, the group's pharmaceutical and vaccines sales
grew by 5% to GBP 3.2bn in emerging markets and by
1% to GBP 0.9bn in Japan. Europe was flat at GBP 4bn.
This was offset by U.S. sales declining by 10% to GBP
5bn. The pharmaceutical and vaccines sales totalled GBP
18.7bn.
Balance sheet (PLN bn)
Company
3,473.6 3,417.43,127.5
3,575.6
4,257.9
225.4 115.0 223.4 162.4 214.1
2010 2011 2012 2013 2014
Revenue Net profit
2.09
6
1.33
9
1.50
2
1.70
9
1.22
1
1.33
6
1.44
4
1.60
7
2010 2011 2012 2013
Assets Equity
- 42 -Any redistribution of this information is strictly prohibited.
Copyright © 2016 EMIS, all rights reserved.
Highlights
Source:
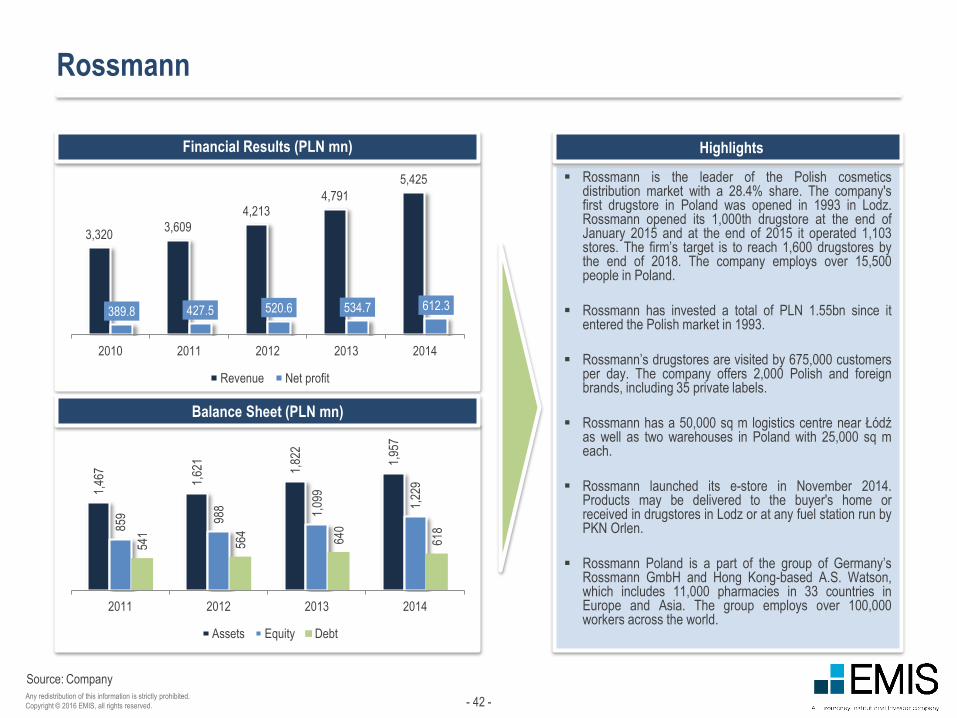
Rossmann
Financial Results (PLN mn)
Rossmann is the leader of the Polish cosmeticsdistribution market with a 28.4% share. The company'sfirst drugstore in Poland was opened in 1993 in Lodz.Rossmann opened its 1,000th drugstore at the end ofJanuary 2015 and at the end of 2015 it operated 1,103stores. The firm’s target is to reach 1,600 drugstores bythe end of 2018. The company employs over 15,500people in Poland.
Rossmann has invested a total of PLN 1.55bn since itentered the Polish market in 1993.
Rossmann’s drugstores are visited by 675,000 customersper day. The company offers 2,000 Polish and foreignbrands, including 35 private labels.
Rossmann has a 50,000 sq m logistics centre near Łódźas well as two warehouses in Poland with 25,000 sq meach.
Rossmann launched its e-store in November 2014.Products may be delivered to the buyer's home orreceived in drugstores in Lodz or at any fuel station run byPKN Orlen.
Rossmann Poland is a part of the group of Germany’sRossmann GmbH and Hong Kong-based A.S. Watson,which includes 11,000 pharmacies in 33 countries inEurope and Asia. The group employs over 100,000workers across the world.
Balance Sheet (PLN mn)
Company
3,3203,609
4,2134,791
5,425
389.8 427.5 520.6 534.7 612.3
2010 2011 2012 2013 2014
Revenue Net profit
1,46
7
1,62
1
1,82
2
1,95
7
859 98
8 1,09
9
1,22
9
541
564
640
618
2011 2012 2013 2014
Assets Equity Debt
- 43 -Any redistribution of this information is strictly prohibited.
Copyright © 2016 EMIS, all rights reserved.
Contact:
Corporate Headquarters
6-8 Bouverie Street
London EC4Y 8DD
UK
Voice: +44 20 7779 8100
Fax: +44 20 7779 8224
Americas Headquarters
225 Park Avenue South
New York, New York 10003
US
Voice: +1 212 610 2900
Fax: +1 212 610 2950
Asia Headquarters
Eucharistic Congress Bldg. No. III
4th Floor, 5 Convent Street
Mumbai 400 001
India
Voice: +91 22 22881123
Fax: +91 22 22881137
Disclaimer:
The material is based on sources which we believe are reliable, but no warranty, either expressed or implied, is provided in relation to the accuracy or completeness
of the information. The views expressed are our best judgment as of the date of issue and are subject to change without notice. EMIS and Euromoney Institutional
Investor PLC take no responsibility for decisions made on the basis of these opinions.
Any redistribution of this information is strictly prohibited. Copyright © 2016 EMIS, all rights reserved. A Euromoney Institutional Investor company.
About EMIS Insight
EMIS Insight is a unit of EMIS that produces proprietary strategic research and analysis. The service features market overviews, industry trend analysis, legislation
and profiles of the leading sector companies provided by locally-based analysts.
About EMIS
Founded in 1994, EMIS (formerly known as ISI Emerging Markets) was acquired by Euromoney Institutional Investor PLC in 1999. EMIS works from over 15 offices
around the world to deliver electronic information products, by subscription, to institutional customers globally. EMIS provides hard-to-get information covering more
than 100 emerging markets. Its flagship products are EMIS Intelligence and EMIS Professional.
EMIS clients include top investment banks, corporations, law firms, consultants, investment and insurance companies, universities and libraries, multilateral
organisations, and others.