llOPEN ACCESS
iScience
Article
Prion-derived tetrapeptide stabilizes thermolabileinsulin via conformational trapping
Meghomukta
Mukherjee,
Debajyoti Das, Jit
Sarkar, ..., Samit
Chattopadhyay,
Subhrangsu
Chatterjee, Partha
Chakrabarti
[email protected] (S.C.)
[email protected] (P.C.)
HighlightsPrion-derived consensus
tetrapeptide motif V(X)YR
protracts insulin
fibrillation
IS1 (VYYR) preserves
bioactive insulin under
varying physicochemical
perturbations
IS1 serves as nontoxic,
cell-impermeable peptide
excipient for insulin
IS1 conformationally traps
dimeric insulin during
fibrillation
Mukherjee et al., iScience 24,102573June 25, 2021 ª 2021 TheAuthors.
https://doi.org/10.1016/
j.isci.2021.102573
llOPEN ACCESS
iScience
Article
Prion-derived tetrapeptide stabilizes thermolabileinsulin via conformational trapping
Meghomukta Mukherjee,1,6 Debajyoti Das,2,6 Jit Sarkar,2,3,7 Nilanjan Banerjee,1,7 Jagannath Jana,1
Jyotsna Bhat,1 Jithender Reddy G,4 Jagadeesh Bharatam,4 Samit Chattopadhyay,5,8 Subhrangsu Chatterjee,1,*
and Partha Chakrabarti2,3,9,*
1Department of Biophysics,Bose Institute, Kolkata, India
2Division of Cell Biology andPhysiology, CSIR-IndianInstitute of Chemical Biology,4 Raja SC Mullick Road,Kolkata 700032, India
3Academy of Innovative andScientific Research,Ghaziabad 201002, India
4Centre for NMR andStructural Chemistry,CSIR-Indian Institute ofChemical Technology, UppalRoad, Tarnaka, Hyderabad,India
5Division of Cancer Biology &Inflammatory Disorder,CSIR-Indian Institute ofChemical Biology, Kolkata,India
6These author contributedequally
7These author contributedequally
8Present address:Department of BiologicalSciences, BITS-Pilani, KK BirlaGoa Campus, NH 17B BypassRoad, Zuarinagar, Goa403726, India
9Lead contact
*Correspondence:[email protected],[email protected](S.C.),[email protected](P.C.)
https://doi.org/10.1016/j.isci.2021.102573
SUMMARY
Unfolding followed by fibrillation of insulin even in the presence of various excip-ients grappled with restricted clinical application. Thus, there is an unmet needfor better thermostable, nontoxic molecules to preserve bioactive insulin undervarying physiochemical perturbations. In search of cross-amyloid inhibitors,prion-derived tetrapeptide library screening reveals a consensus V(X)YR motiffor potential inhibition of insulin fibrillation. A tetrapeptide VYYR, isosequentialto the b2-strand of prion, effectively suppresses heat- and storage-induced insu-lin fibrillation and maintains insulin in a thermostable bioactive form conferringadequate glycemic control in mousemodels of diabetes and impedes insulin amy-loidoma formation. Besides elucidating the critical insulin-IS1 interaction (R4 ofIS1 to the N24 insulin B-chain) by nuclear magnetic resonance spectroscopy, wefurther demonstrated non-canonical dimer-mediated conformational trappingmechanism for insulin stabilization. In this study, structural characterization andpreclinical validation introduce a class of tetrapeptide toward developing ther-mostable therapeutically relevant insulin formulations.
INTRODUCTION
Availability of injectable insulin formulation has been a breakthrough in diabetes management in achieving
long-term glycemic control and preventing complications (Baram et al., 2018; Heller et al., 2007; Moroder
and Musiol, 2017; Owens et al., 2001; Xiong et al., 2019; Zaykov et al., 2016); it still, however, suffers from
certain disadvantages including temperature-sensitive fibrillation in solution and development of subcu-
taneous tumor-like mass designated as ‘‘amyloidoma’’ at the site of injection (Hua andWeiss, 2004; Ivanova
et al., 2009; Nilsson, 2016; Woods et al., 2012; Yumlu et al., 2009). Worldwide efforts were thus made to
develop thermostable insulin either by making recombinant insulin species with mutations or stabilizing
native insulin with salts, Zn2+ ions, and small molecules such as meta-cresol (Frankær et al., 2017; Gong
et al., 2014; Han et al., 2017; Kachooei et al., 2014; Lee et al., 2014; Patel et al., 2018; Saithong et al.,
2018; Wang et al., 2011; Zheng and Lazo, 2018). However, small molecules are found to be toxic in long-
term usage and are inefficient in optimally preventing fibrillation (Teska et al., 2014; Weber et al., 2015).
Thus, the unmet need for better nontoxic insulin stabilizers is highly warranted and nonimmunogenic pep-
tides as stabilizers would have no or very low toxicity (Banerjee et al., 2013; Neddenriep et al., 2012; Wu,
2019). To date, an array of peptide-based stabilizers was designed and validated through in silico or bio-
physical investigations, but the exploration of their therapeutic potential in in vitro, in cellulo, and in vivo
preclinical models is mostly lacking (Das and Bhattacharyya, 2017; Mishra et al., 2013; Ratha et al., 2016;
Seidler et al., 2018; Wallin et al., 2018). Recent advances suggest screening and designing of cross-amyloid
inhibitors can either protracts amyloid self-assembly or inhibit potential cross-seeding of interacting amy-
loidogenic proteins (Armiento et al., 2020).
In the search for endogenous peptide motifs that could potentially hinder insulin fibrillation and stabilize
insulin in its stable conformation, we looked at misfolded human prion conformers because of its colocal-
ization at insulin-secreting pancreatic b-cells while having a converse functional association with glucose
homeostasis (Amselgruber et al., 2006; Ashok and Singh, 2018). Three conserved tetrapeptide motifs
(RYYR/VYYR/AYY(D/Q)) found in PrPc and the conformation-selective surface exposure of ‘‘YYR’’ associ-
ated with the b-sheet structure in misfolded PrPSc prompted us to consider these peptide motifs as the
iScience 24, 102573, June 25, 2021 ª 2021 The Authors.This is an open access article under the CC BY-NC-ND license (http://creativecommons.org/licenses/by-nc-nd/4.0/).
1
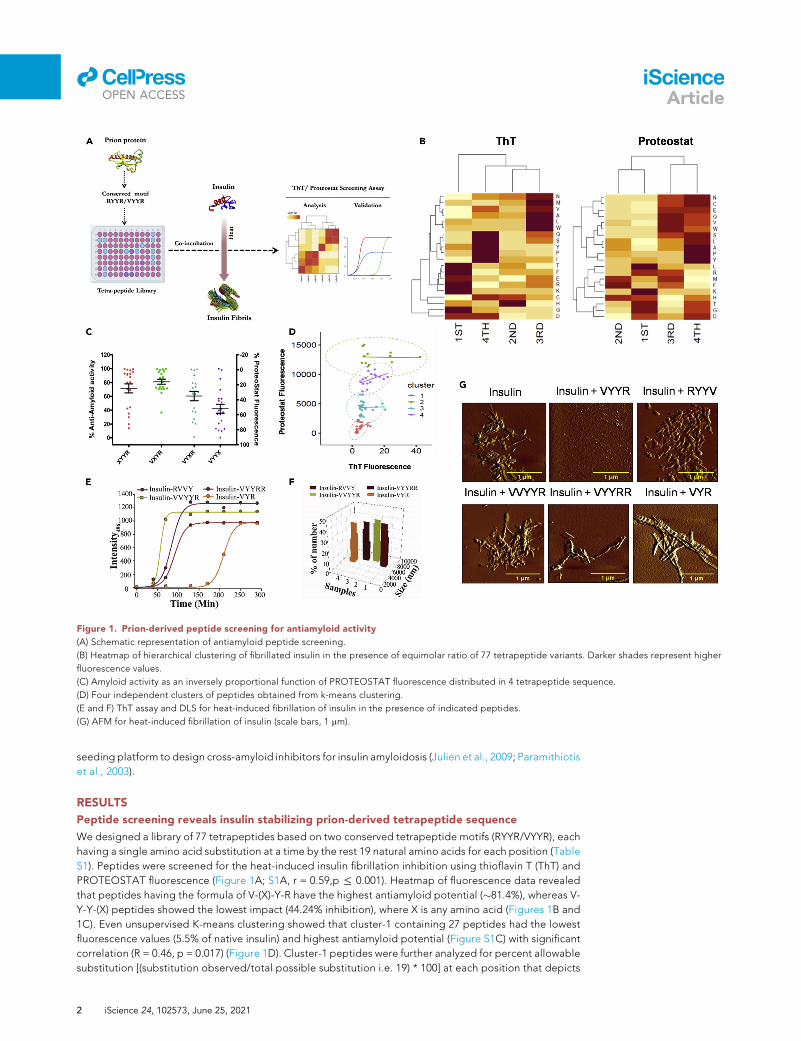
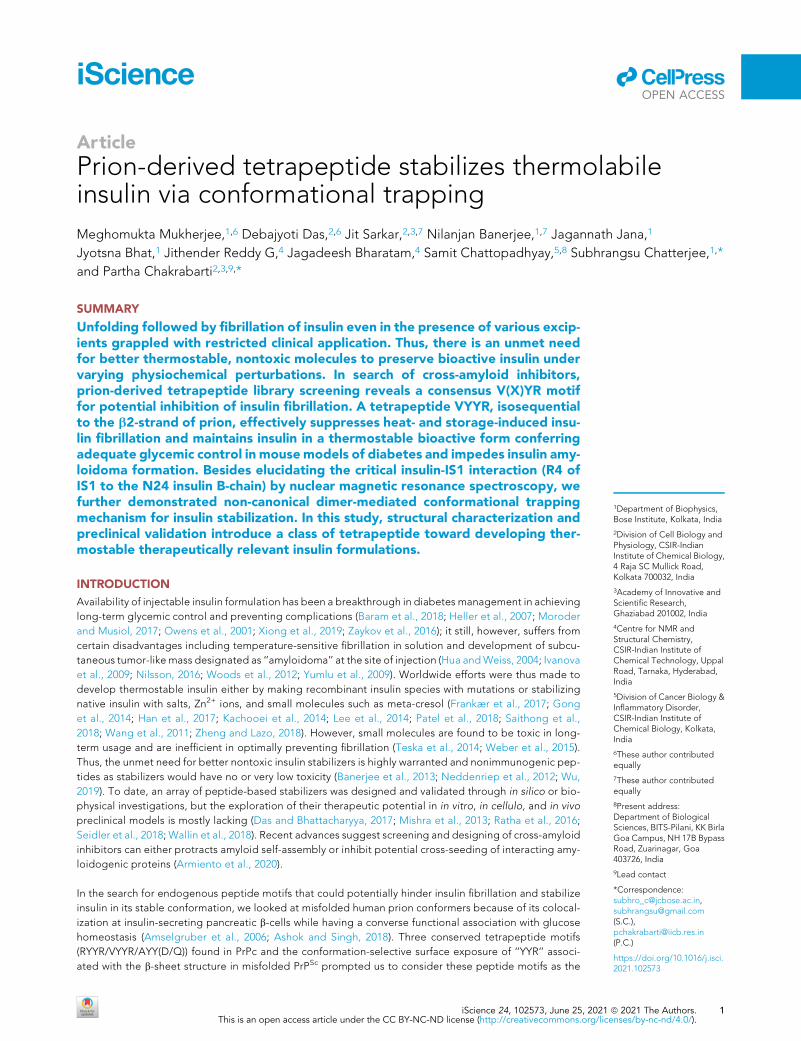
Figure 1. Prion-derived peptide screening for antiamyloid activity
(A) Schematic representation of antiamyloid peptide screening.
(B) Heatmap of hierarchical clustering of fibrillated insulin in the presence of equimolar ratio of 77 tetrapeptide variants. Darker shades represent higher
fluorescence values.
(C) Amyloid activity as an inversely proportional function of PROTEOSTAT fluorescence distributed in 4 tetrapeptide sequence.
(D) Four independent clusters of peptides obtained from k-means clustering.
(E and F) ThT assay and DLS for heat-induced fibrillation of insulin in the presence of indicated peptides.
(G) AFM for heat-induced fibrillation of insulin (scale bars, 1 mm).
llOPEN ACCESS
iScienceArticle
seeding platform to design cross-amyloid inhibitors for insulin amyloidosis (Julien et al., 2009; Paramithiotis
et al., 2003).
RESULTS
Peptide screening reveals insulin stabilizing prion-derived tetrapeptide sequence
We designed a library of 77 tetrapeptides based on two conserved tetrapeptide motifs (RYYR/VYYR), each
having a single amino acid substitution at a time by the rest 19 natural amino acids for each position (Table
S1). Peptides were screened for the heat-induced insulin fibrillation inhibition using thioflavin T (ThT) and
PROTEOSTAT fluorescence (Figure 1A; S1A, r = 0.59,p % 0.001). Heatmap of fluorescence data revealed
that peptides having the formula of V-(X)-Y-R have the highest antiamyloid potential (�81.4%), whereas V-
Y-Y-(X) peptides showed the lowest impact (44.24% inhibition), where X is any amino acid (Figures 1B and
1C). Even unsupervised K-means clustering showed that cluster-1 containing 27 peptides had the lowest
fluorescence values (5.5% of native insulin) and highest antiamyloid potential (Figure S1C) with significant
correlation (R = 0.46, p = 0.017) (Figure 1D). Cluster-1 peptides were further analyzed for percent allowable
substitution [(substitution observed/total possible substitution i.e. 19) * 100] at each position that depicts
2 iScience 24, 102573, June 25, 2021

llOPEN ACCESS
iScienceArticle
marked conservation of amino acids at the third and fourth positions by allowing only 21.05% and 15.5%
substitutions, respectively, making the Y(3)-R(4) sequence indispensable for the anti-fibrillating property.
We thereby propose a generalized tetrapeptide sequence V-(X)-Y-R that would potently prevent insulin
fibrillation.
To test the position-dependent importance of the core Y-Y sequence, we used five peptides (V-Y-Y-R, V-P-
P-R, V-Y-P-R, V-P-Y-R, and V-T-T-R) for heat-induced insulin fibrillation assay. Only V-Y-Y-R showed signif-
icant antiamyloid activity and preserved insulin’s glucose-lowering capacity during an insulin tolerance test
(ITT) in mice (Figures S2A–S2D). We further designed variant peptides by adding amino acid at N- and
C-terminal of VYYR (VVYYR and VYYRR), deleting one tyrosine from the core sequence (VYR) and reversing
the sequence to RYYV. VVYYR, VYYRR, and RVVY did not inhibit insulin fibrillation as confirmed by atomic
force microscopy (AFM) studies and corroborating these results with corresponding ThT and dynamic light
scattering (DLS) data, whereas VYR showed modest inhibitory effects than the rest of the peptide variants
as depicted by the ThT assay (Figures 1E–1G). Altogether, these results prompted us to select V-Y-Y-R (now
termed IS1) as a candidate for insulin stabilization and further validate its therapeutic potential in preclinical
mice models and commercial insulin formulations.
IS1 protects insulin from both heat- and storage-induced fibrillation
The kinetics of heat-induced insulin fibrillation with varying molar ratios of insulin:IS1 by revealing dose-
dependent inhibition insulin fibrillation maximally at the equimolar concentration is shown by ThT
fluorescence and AFM (Figure 2A). The interaction of insulin and IS1 determined by isothermal titration
calorimetry (ITC) by fitting the titration curve in the one-site binding model (Figure S3A) was thermodynam-
ically favorable (DG = �4.8 kcal.mol�1, DH = �18.73kcal.mol�1, DS = �46.5 kcal.mol�1; KA = 3.46 3
10�3M�1). IS1 remarkably restored the hydrodynamic radius of insulin monomers, otherwise which was
increased to 1000 nm at 150 min of heating (Figure 2B). Circular dichroism (CD) spectroscopy showed grad-
ually decay in dual negative ellipticities at 208 nm and 222 nm, which indicates the loss of a-helical confor-
mation for native insulin owing to heat-induced fibrillation, whereas the presence of IS1 retained its con-
formations even after 5 h (Figure 2C and Table S2). To test its therapeutic relevance, we have tested its
antiamyloid potential in commercial human insulin formulation (Actrapid) both in the presence and
absence of commercial excipients for heat-induced and storage-induced (37�C, 30 days) fibrillation.
AFM data showed that IS1 inhibits Actrapid fibrillation by trapping insulin in lower molecular weight olig-
omeric conformations, which was further corroborated with ThT and DLS data (Figure 2D, 2E, S3B, and
S3C).
IS1 maintains insulin in a thermostable bioactive conformation
To find whether IS1 confers insulin stabilization in physiologically active conformers, we performed an ITT in
mice. IS1-treated bovine insulin followed similar glucose-lowering kinetics to that of native insulin during
the ITT even after heat-induced fibrillation induction, while fibrillated insulin revealed amarked impairment
in glucose-lowering potential (Figure 3A). Next, we developed two independent disease mouse models,
streptozotocin-induced type 1 diabetes and high-fat-diet-fed type 2 diabetes. Expectedly, the addition
of IS1 significantly restored the glucose-lowering activity of insulin, effects that were comparable with
native insulin in both the disease models (Figures 3B and 3C). IS1 also preserves the bioactivity of Actrapid
even after 37�C storage for 30 days as depicted by ITT (Figure 3D). For further affirmation, we investigated
the induction of prototypical signaling cascade for the IS1-insulin complex. We observed a marked induc-
tion of Akt phosphorylation in IS1-treated insulin compared with that of fibrillated insulin both in cultured
hepatocytes (Figure S3D) and in the mouse liver (Figure 3E). Insulin-derived amyloidosis is defined as a sub-
cutaneous amyloid mass at the site of insulin injections owing to intrinsic fibrillation of commercial insulin
owing to long-term storage. To this end, we carried out amyloidoma formation assay (Figure 3F) where
repeated subcutaneous injection of fibrillated insulin forms a mass of extracellular amyloid fibrils in mice.
IS1 has limited cytotoxicity with no membrane permeability
Toward further characterization of IS1 peptide, we checked for its membrane permeability using fluores-
cein isothiocyanate (FITC)-labeled IS1 in HepG2 cells. FITC fluorescence was observed in the extracellular
space even after 24 h of incubation, whereas FITC-SLRP (Jana et al., 2018), a cell-penetrating tetrapeptide,
was detected intracellularly (Figure 4A). The spatial distribution (FITC) IS1-insulin complex showed
preferential accumulation on the cell membrane suggesting its receptor binding potential (Figure 4B).
Cytotoxicity has often been implicated in short peptides even for the cell-impermeable peptides. Both
iScience 24, 102573, June 25, 2021 3

Figure 2. IS1 prevents intrinsic fibrillation of insulin
(A) ThT assay of insulin fibrillation with increasing concentrations of IS1(VYYR). Inset: AFM images of heat-induced fibrillation of insulin in the presence of IS1
(scale bars, 1 mm).
(B) DLS analysis as a function of incubation time of insulin (left panel) and IS1-insulin complex (right panel).
(C) CD spectra of insulin in the absence (left panel) and the presence (right panel) of IS1.
(D) AFM images of heat-induced and storage-induced fibrillation of Actrapid with IS1 in the presence and absence of excipients (scale bars, 1 mm).
(E) ThT and DLS assay for storage-induced fibrillation of Actrapid and Actrapid-IS1 in the presence and absence of commercial excipients. All experiments
were performed in triplicates, and values are presented as mean G SEM.
llOPEN ACCESS
iScienceArticle
dose-dependent and time-course cytotoxicity assays showed limited cytotoxicity of IS1 toward HepG2
cells using live-dead and MTT assays (Figures 4C–4E). Consistently, IS1 leads to only �0.5% hemolysis
compared with 1% Triton X-100 (Figure 4F).
Nuclear magnetic resonance spectroscopy reveals the structure and dynamics of IS1 and
insulin interaction
For structural characterization and deciphering atomic level interaction of the insulin-IS1 complex, we per-
formed a series of nuclear magnetic resonance (NMR) spectroscopy experiments. One-dimensional STD
NMR experiment showed that aromatic protons of tyrosine Y2 (2.6 H), Y3(2.6 H); side chain of arginine
R4 QD; and the b-proton of tyrosine Y2 Hb1 and Y3 Hb2 interacting with insulin which was also found to
be interacting with Actrapid (Figures S4A–S4D). To reveal the atomic-level dynamics of free IS1 and IS1-in-
sulin complex, one-dimensional longitudinal (R1 = 1/T1) and transverse relaxation (R2 = 1/T2) experiments
were performed. We observed a significant decrease in longitudinal relaxation rate (R1) for the IS1-insulin
complex compared with free IS1 for all amide protons. Similarly, the transverse relaxation rates (R2) for all
the residues of IS1 were increased in the presence of insulin stating spin-spin energy exchange in the
4 iScience 24, 102573, June 25, 2021
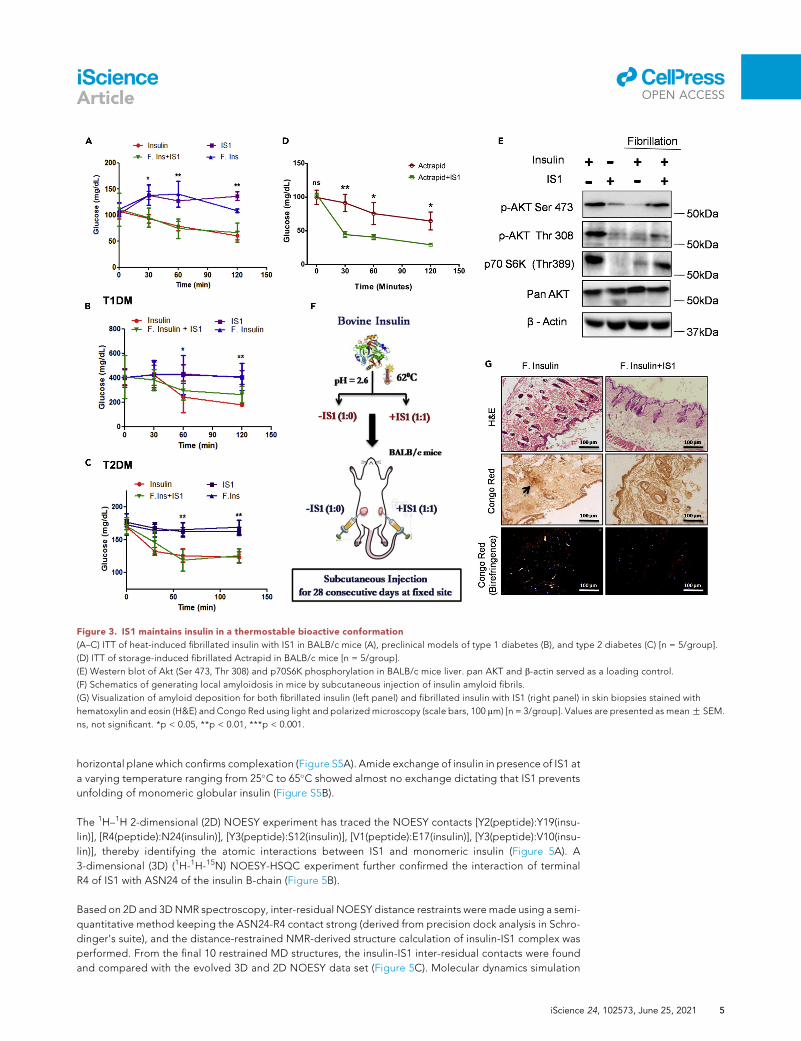
Figure 3. IS1 maintains insulin in a thermostable bioactive conformation
(A–C) ITT of heat-induced fibrillated insulin with IS1 in BALB/c mice (A), preclinical models of type 1 diabetes (B), and type 2 diabetes (C) [n = 5/group].
(D) ITT of storage-induced fibrillated Actrapid in BALB/c mice [n = 5/group].
(E) Western blot of Akt (Ser 473, Thr 308) and p70S6K phosphorylation in BALB/c mice liver. pan AKT and b-actin served as a loading control.
(F) Schematics of generating local amyloidosis in mice by subcutaneous injection of insulin amyloid fibrils.
(G) Visualization of amyloid deposition for both fibrillated insulin (left panel) and fibrillated insulin with IS1 (right panel) in skin biopsies stained with
hematoxylin and eosin (H&E) and Congo Red using light and polarized microscopy (scale bars, 100 mm) [n = 3/group]. Values are presented as meanG SEM.
ns, not significant. *p < 0.05, **p < 0.01, ***p < 0.001.
llOPEN ACCESS
iScienceArticle
horizontal plane which confirms complexation (Figure S5A). Amide exchange of insulin in presence of IS1 at
a varying temperature ranging from 25�C to 65�C showed almost no exchange dictating that IS1 prevents
unfolding of monomeric globular insulin (Figure S5B).
The 1H–1H 2-dimensional (2D) NOESY experiment has traced the NOESY contacts [Y2(peptide):Y19(insu-
lin)], [R4(peptide):N24(insulin)], [Y3(peptide):S12(insulin)], [V1(peptide):E17(insulin)], [Y3(peptide):V10(insu-
lin)], thereby identifying the atomic interactions between IS1 and monomeric insulin (Figure 5A). A
3-dimensional (3D) (1H-1H-15N) NOESY-HSQC experiment further confirmed the interaction of terminal
R4 of IS1 with ASN24 of the insulin B-chain (Figure 5B).
Based on 2D and 3DNMR spectroscopy, inter-residual NOESY distance restraints were made using a semi-
quantitative method keeping the ASN24-R4 contact strong (derived from precision dock analysis in Schro-
dinger’s suite), and the distance-restrained NMR-derived structure calculation of insulin-IS1 complex was
performed. From the final 10 restrained MD structures, the insulin-IS1 inter-residual contacts were found
and compared with the evolved 3D and 2D NOESY data set (Figure 5C). Molecular dynamics simulation
iScience 24, 102573, June 25, 2021 5
Figure 4. IS1 serves as a potent nontoxic membrane-impermeable stabilizer for insulin
(A) Confocal microscopy images showing time-dependent cell membrane permeability using FITC-tagged tetrapeptide SLRP and IS1 (VYYR), respectively,
at 10 mM concentration for 24 h in HepG2 cell line (scale bars, 20 mm).
(B) Representative confocal images showing localization of FITC-IS1 independently and in the presence of native bovine insulin heated at 62�C for 3 h,
treated in HepG2 cells (scale bars, 20 mm). Inset represents a 5X digitally magnified image of respective samples (scale bars, 10 mm).
(C) Dose-dependent live/dead cell viability assay showing live cells stained with Calcein-AM (green) and dead cells with EthD-1 (red) treated for 12 h with
both SLRP and IS1 in HepG2 cells (scale bars, 100 mm).
(D) Live/Dead cell viability assay of HepG2 cells in the presence of both IS1 and SLRP independently at 10 mM concentration for 24 h in HepG2 cell line
(upper panel: scale bars 100 mm; lower panel: scale bars 20 mm).
(E) Top: quantification of percent dead cells at each concentration of respective tetrapeptide IS1 and SLRP treatment. Quantified using threshold and
analyze particle function using Fiji (ImageJ) software (5 fields for each concentration of samples). Bottom: MTT assay showing the percent of viable cells at
each concentration of respective tetrapeptide IS1 and SLRP treatment.
(F) Hemolytic assay results in negligible hemolysis compared with 1% Triton X-100. Values are presented as mean G SEM. ns, not significant. *p < 0.05,
**p < 0.01, ***p < 0.001.
llOPEN ACCESS
iScienceArticle
for free insulin and IS1-insulin complex has revealed the interactions between Y2 (peptide) and E34 (B-chain
of insulin), V1 (peptide), and H26 (B-chain of insulin), Y3 (peptide), and Q25. The R4 of V-Y-Y-R forms a triad
H-bond network among Val10 (A chain of insulin) and Asn24 (B chain of insulin) (Figure 5D i-v). The adaptive
Poisson-Boltzmann surface area (APBS) was calculated for the insulin-IS1 complex. The blue and red sur-
faces designate positive and negative electronic charge surfaces in APBS, respectively (Figure S5D i-iii).
Previous studies suggested that B-chain N-terminal residues (Phe22-Gly29) of insulin are critical for
dimer-dimer interactions that essentially induce R6 hexameric conformation in the presence of Zn+
and phenolic excipients. The exchange of Asn24 for lysine affects monomerhexamer equilibria that allow
6 iScience 24, 102573, June 25, 2021

Figure 5. NMR spectroscopy and restrained molecular simulation model of the insulin-IS1 complex
(A) 2D NOESY NMR peak of IS1 interacting with insulin and forming cross-peaks.
(B) 3D 15N-HSQC-NOESY spectrum of insulin in presence of IS1.
(C) The ensemble structure of restrained simulation of insulin-IS1 of the last 10 ps.
(D,i-v) Residue specific atomic interactions depicting a triad hydrogen bond network; molecular simulation showing the interactions between Y2 (peptide)
and E34 (B-chain of insulin), V1 (peptide) and H26 (B-chain of insulin), Y3 (peptide) and Q25.
llOPEN ACCESS
iScienceArticle
dimerization but predominantly prevent conformational transition toward R6 hexamers, even in the pres-
ence of zinc. But, protein engineering studies revealed that the removal or exchange of amino acids at B-
chain C-terminus (Tyr47-Thr51) drastically impairs the self-association of the insulin monomers (dimeriza-
tion). Interestingly, short-acting insulin glulisine bearing mutation at N24 and N50 favors monomeric
structure and is less amenable to fibrillation (Becker, 2007; Woods et al., 2012). Moreover, the N-terminal
of B chain is necessary for lateral aggregation so that the protofibrils can form fibrils (Jimenez et al.,
2002). Atomic traces from NMR and simulation studies of the IS1-insulin complex suggest that the bind-
ing of IS1 restricts insulin from having sufficient degrees of freedom to misfold under biophysical pertur-
bations while restricting conformational transitions by forming IS1(R4)-(V10-N24)INS triad hydrogen bond
network.
Dimer stability is crucial for IS1-mediated insulin stabilization
To investigate the mechanism of IS1-mediated insulin stabilization under physicochemical perturbations,
size exclusion chromatography was performed for fibrillated human insulin in the presence and absence of
IS1, while native insulin serves as a control. A broad peak was observed within the void volume for heat-
induced human insulin-depicting heterogeneous populations of large fibrillar aggregates, whereas native
insulin elutes at 118.5 mL. Interestingly, heat-induced insulin in the presence of IS1 showed 4 independent
iScience 24, 102573, June 25, 2021 7
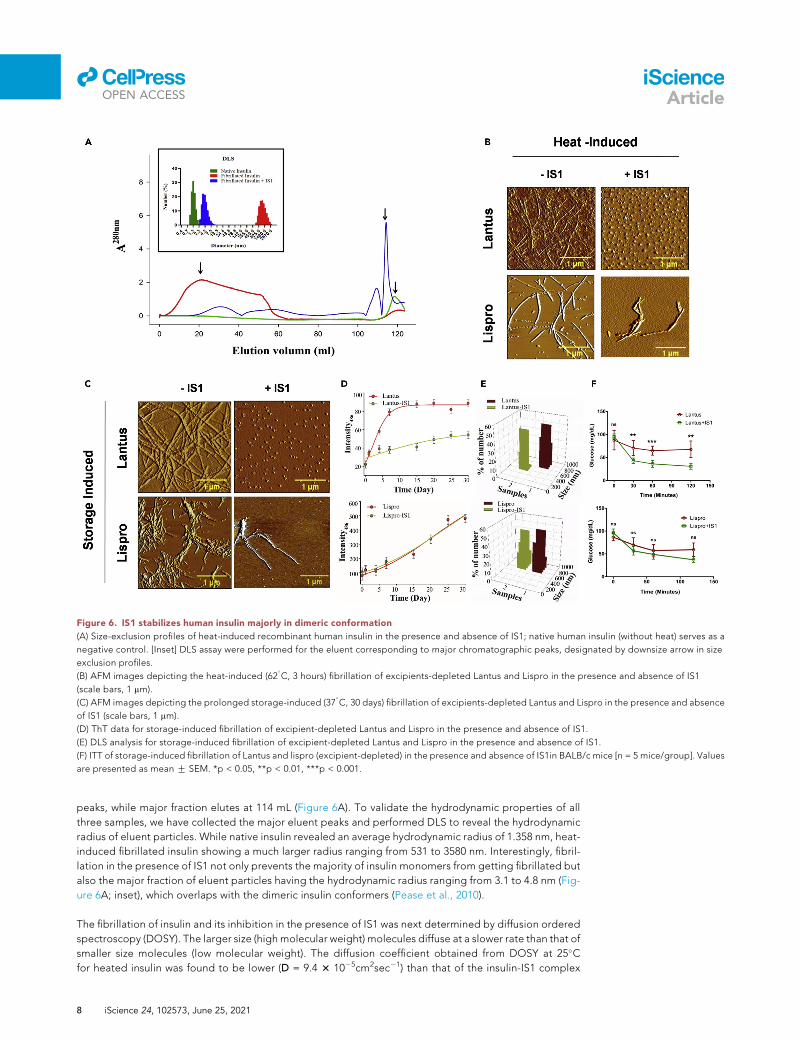
Figure 6. IS1 stabilizes human insulin majorly in dimeric conformation
(A) Size-exclusion profiles of heat-induced recombinant human insulin in the presence and absence of IS1; native human insulin (without heat) serves as a
negative control. [Inset] DLS assay were performed for the eluent corresponding to major chromatographic peaks, designated by downsize arrow in size
exclusion profiles.
(B) AFM images depicting the heat-induced (62�C, 3 hours) fibrillation of excipients-depleted Lantus and Lispro in the presence and absence of IS1
(scale bars, 1 mm).
(C) AFM images depicting the prolonged storage-induced (37�C, 30 days) fibrillation of excipients-depleted Lantus and Lispro in the presence and absence
of IS1 (scale bars, 1 mm).
(D) ThT data for storage-induced fibrillation of excipient-depleted Lantus and Lispro in the presence and absence of IS1.
(E) DLS analysis for storage-induced fibrillation of excipient-depleted Lantus and Lispro in the presence and absence of IS1.
(F) ITT of storage-induced fibrillation of Lantus and lispro (excipient-depleted) in the presence and absence of IS1in BALB/c mice [n = 5 mice/group]. Values
are presented as mean G SEM. *p < 0.05, **p < 0.01, ***p < 0.001.
llOPEN ACCESS
iScienceArticle
peaks, while major fraction elutes at 114 mL (Figure 6A). To validate the hydrodynamic properties of all
three samples, we have collected the major eluent peaks and performed DLS to reveal the hydrodynamic
radius of eluent particles. While native insulin revealed an average hydrodynamic radius of 1.358 nm, heat-
induced fibrillated insulin showing a much larger radius ranging from 531 to 3580 nm. Interestingly, fibril-
lation in the presence of IS1 not only prevents the majority of insulin monomers from getting fibrillated but
also the major fraction of eluent particles having the hydrodynamic radius ranging from 3.1 to 4.8 nm (Fig-
ure 6A; inset), which overlaps with the dimeric insulin conformers (Pease et al., 2010).
The fibrillation of insulin and its inhibition in the presence of IS1 was next determined by diffusion ordered
spectroscopy (DOSY). The larger size (high molecular weight) molecules diffuse at a slower rate than that of
smaller size molecules (low molecular weight). The diffusion coefficient obtained from DOSY at 25�Cfor heated insulin was found to be lower (D = 9.4 3 10�5cm2sec�1) than that of the insulin-IS1 complex
8 iScience 24, 102573, June 25, 2021
llOPEN ACCESS
iScienceArticle
(D = 2.2 3 10�4 cm2sec�1). Besides, the molecular weight of insulin without treatment of IS1 after 4 h incu-
bation at 62�C was approximately 57.0 kDa, supposedly the soluble oligomeric insulin and the insulin-IS1
complex showed much lesser molecular weight approaching 10 kDa representing dimeric insulin
conformer (Tables S4A and S4B). These data indicate that the free-insulin undergoes heat-induced oligo-
merization and conformational switch before its fibrillation, while IS1 protracts insulin oligomerization and
hence later aggregation events.
These results prompted us to hypothesize the existence of an IS1-mediated conformation trap between
stable hexamer and partially unfolded monomers toward fibrillation. To this end, we have checked the
antiamyloid potential of IS1 for two commercially available insulin analogs, Lantus (long-acting) and Lis-
pro (fast-acting). These two analogs were strategically developed majorly to favor hexameric and mono-
meric conformation, respectively (Figure S6). We removed the existing commercial excipients from both
the formulations (Figure S7) for avoiding excipient-induced conformational bias. Interestingly, IS1 signif-
icantly protracts fibrillation of Lantus by forming a smaller oligomeric complex in both the storage- and
heat-induced condition as depicted by AFM, ThT, and DLS data, whereas it fails to do so for Lispro (Fig-
ures 6B–6E). ITT for both Lantus and Lispro in storage-induced fibrillation conditions showed no
glucose-lowering potential for Lispro while markedly preserving the physiological role for Lantus
(Figure 6F).
We observed a similar trend in the presence of commercial excipients for both Lantus and Lispro (Figures
S8 and S9). The one-dimensional STD NMR experiment validated that aromatic protons of tyrosine Y2
Hb2, Y3Ha, Y3 side chain protons, R4 Ha, and V1 Ha of IS1 interacting with Lantus, while no significantly
interacting protons were observed with Lispro (Figure S10A). Even prototypical insulin signaling in
HepG2 cells suggests IS1-mediated insulin stabilization leads to biologically active conformers for
Actrapid and Lantus but not for Lispro (Figure S10B). Lispro was strategically developed by switching po-
sitions of 49Pro-50Lys to 49Lys-50Pro, which greatly reduces its dimerization potential, making it predom-
inantly monomeric fast-acting insulin analog. Hence, dimerization is a crucial determining factor for the
antiamyloid potential of IS1, thereby failing to preserve Lispro from physicochemical perturbation-
induced fibrillation.
DISCUSSION
The current advocacy of intensive insulin therapy regimens in patients with diabetes is met with several clin-
ical problems – insulin is proamyloidogenic and forms insoluble aggregates resulting in excess insulin
requirement; amyloidoma formation at the site of repeated insulin injection; gradual loss of excipients
and deposition of fibrils in the catheter system of insulin pumps; and temperature-sensitive insulin fibrilla-
tion entails storage and maintenance of cold chain. Even mild agitation of insulin during its storage and
transport has been reported to denature the protein through fibrillation, resulting in its inactivation. These
issues thereby call for a more stable form of formulations that would cater to the increasing global demand.
Taking cues from the conformation-selective surface exposure of ‘‘YYR’’ motif associated with the b-sheet
structure in misfolded prion protein PrPSc, we discovered a consensus amino acid sequence VXYR as a
potent inhibitor for both purified and commercial insulin formulations. Specifically, the endogenous prion
sequence VXYR (termed here IS1), a plasma-membrane-impermeable, nontoxic tetrapeptide showed
remarkable protraction of insulin fibrillation on heating and during prolonged storage, maintained hypo-
glycemic effects in vivo, and prevented subcutaneous amyloidoma formation. These effects weremediated
via direct binding of IS1 to insulin monomer through a triad hydrogen bond network that leads to nonca-
nonical dimer-mediated conformational ‘‘trapping’’ of insulin.
Toward development of insulin formulations with lower amyloidogenicity, newer excipients as well as
chemically modified insulin moieties are being reported. Recent studies depicted generation of ther-
mostable insulin by adding polysialic acid and proline-based homopolymer at specific amino acid
residues (Ghosh et al., 2020; Kabotso et al., 2020). Aromatic small molecules such as resveratrol and
rosmarinic acid were shown to enhance the biophysical stability of native insulin while preserving its
physiological activity by stabilizing the hexameric form or preventing dimer dissociation, thereby re-
stricting the thermal unfolding of monomers (Pathak et al., 2020; Zheng and Lazo, 2018). In the present
study, we have identified IS1 or VYYR, isosequential to the b-2 strand of human PrPC, as one small
endogenous tetrapeptide motif that prevents both heat- and storage-induced insulin fibrillation both
iScience 24, 102573, June 25, 2021 9

llOPEN ACCESS
iScienceArticle
in vitro and in vivo and described a noncanonical molecular mechanism for inhibiting insulin fibrillation.
Peptide screening assay further highlights the position-specific sequence conservation of IS1 in preser-
ving its antiamyloid potential with a consensus amino acid sequence V-X-Y-R having a potent antiamy-
loid activity.
Mechanistically, IS1 predominantly binds to the N-terminal of B chain of insulin, forming a triad
hydrogen bond network (R4 (peptide)-V10(insulin)-N24(insulin)). Interestingly, short-acting insulin gluli-
sine bearing mutation at N24 and N50 favors monomeric structure and is less amenable to fibrillation
(Becker, 2007; Woods et al., 2012; Zhou et al., 2016). Direct interaction of IS1 to N24 may thus confer
its conformational stability. The residues from 31 to 41 of B chain form the hydrophobic core in insulin
fibril, while residues of 13–18 of A chain are susceptible to conversion from a-helix to beta strands
when misfolded. Moreover, the N-terminal of B chain is necessary for lateral aggregation so that
the protofibrils can form fibrils (Jimenez et al., 2002). STD NMR deciphered Y2 (2.6 H), Y3 (2.6 H),
Y2 (Hb1), and Y3 (Hb2) protons of IS1 interact with insulin monomer. Insulin in solution confers bioac-
tive monomer to zinc-coordinated less-active hexameric forms transitioning through intermediated
dimeric states. While monomeric forms are more susceptible to fibrillate, hexamers are somewhat im-
mune to fibrillation. DLS data of the size-exclusion chromatography profile suggested that the binding
of IS1 to insulin preferentially ‘‘trap’’ insulin in the dimeric conformation (Figure 6A), which not only
limits the degrees of freedom to misfold under biophysical perturbations but allows the release of
active monomers as needed.
IS1-stabilized insulin showed glucose-lowering ability and signaling potential that were comparable with
native insulin. Experiments in type 1 and type 2 diabetes mellitus mice models and different commercially
available insulin formulations in the presence and absence of excipients for both heat- and prolonged stor-
age-induced insulin fibrillation further suggests its therapeutic potential. Peptide solubility holds the major
concern restricting the potential use in commercial formulations. We find IS1 is highly soluble in citrate
phosphate buffer (pH 2.6) up to 10 mM concentration (the maximum concentration that we have checked)
and in distilled water. Moreover, the tetrapeptide is soluble in various commercial insulin formulations
(Actrapid, pH 7; Lispro, pH 7–7.8; and Lantus, pH 4) both in the presence and absence of variable salts
and nonpolar excipients for at least 1 mM concentration. IS1 is cell-impermeable and nontoxic and has pre-
viously been shown to be nonimmunogenic (Caughey, 2003; Paramithiotis et al., 2003; Taschuk et al., 2014),
further attributing to its future potential as a thermostable insulin stabilizer.
Limitations of the study
The present study has few potential limitations which we believe could create future research opportu-
nities. Although we have generated compelling NMR data for elucidating mechanistic underpinnings of
IS1’s antiamyloid potential, it still remains incomplete. X-ray crystallography of the IS1-insulin complex
would better clarify the molecular mechanism. Moreover, cellular toxicity data are preliminary and further
in vivo studies including pharmacokinetic and pharmacodynamic profiles would be required for possible
future development of therapeutics.
Resource availability
Lead contact
Further information and requests for resources and reagents should be directed to and will be fulfilled by
the lead contact: Partha Chakrabarti (Email: [email protected]).
Materials availability
This study did not generate new unique reagents.
Data and code availability
The accession number of the NMR derived structure is available with IDs i.e. PDB ID 7ELJ, BMRB ID 36417.
SUPPLEMENTAL INFORMATION
Supplemental information can be found online at https://doi.org/10.1016/j.isci.2021.102573.
10 iScience 24, 102573, June 25, 2021

llOPEN ACCESS
iScienceArticle
ACKNOWLEDGMENTS
SC is thankful to the Bose Institute’s NMR facility of 700 MHz Bruker. SC thanks Prof. Uday Bandyopadhyay
for his generous support and DST, Govt of India for funding. We would also like to thank Dr. Surajit Ghosh
for providing FITC-SLRP peptide. We thank T. Muruganandan for his help with AFM experiments at IICB.
SC is thankful to Bose Institute’s intramural fund. PC acknowledges intramural funding from CSIR-IICB.
AUTHOR CONTRIBUTIONS
SC initiated the research and designed the prion derived peptide. PC (IICB) and SC (BI) conceived the idea
to proceed with peptide screening. Biophysical experiments such as all the fibrillation assays, ITC, DLS, and
CD spectroscopy were designed, analyzed by SC, MM, and executed by MM. Some peptides were synthe-
sized by MM. Peptide screening was performed by DD andMM, whereas analyzed by DD, JS, and PC. NMR
data acquisition and analysis were performed by MM, NB, JRG and SC. NMR derived structure calculations
were performed by NB and SC in AMBER 14.0. Size-exclusion chromatography coupled with DLS experi-
ments were performed by NB and analyzed by NB and SC. All the in-cellulo and in vivo assays were per-
formed by DD and analyzed by DD and PC. AFM data execution was performed by DD and analyzed by
DD and PC. 3D NMR data execution was performed by JB and analyzed by MM, NB. The manuscript
was written by DD, MM, SC, and PC.
DECLARATION OF INTERESTS
There is no conflict of interest.
Received: October 19, 2020
Revised: March 8, 2021
Accepted: May 18, 2021
Published: June 25, 2021
REFERENCES
Amselgruber, W.M., Buttnerbuttner, A.M.,Schlegel, A.T., Schweiger, M., and Pfaff, A.E.(2006). The normal cellular prion protein (PrPc) isstrongly expressed in bovine endocrine pancreas.Histochem. Cell Biol. 125, 441–448.Armiento, V., Hille, K., Naltsas, D., Lin, J.S.,Barron, A.E., and Kapurniotu, A. (2020). Thehuman host-defense peptide cathelicidin LL-37 isa nanomolar inhibitor of amyloid self-assembly ofislet amyloid polypeptide (IAPP). Angew. Chem.Int. Ed. 59, 12837–12841.
Ashok, A., and Singh, N. (2018). Prion proteinmodulates glucose homeostasis by alteringintracellular iron. OPEN 8, 6556.
Banerjee, V., Kar, R.K., Datta, A., Parthasarathi, K.,Chatterjee, S., Das, K.P., and Bhunia, A. (2013).Use of a small peptide fragment as an inhibitor ofinsulin fibrillation process: a study by high and lowresolution spectroscopy. PLoS One 8, e72318.
Baram, M., Gilead, S., Gazit, E., and Miller, Y.(2018). Mechanistic perspective and functionalactivity of insulin in amylin aggregation. Chem.Sci. 9, 4244–4252.
Becker, R.H.A. (2007). Insulin glulisinecomplementing basal insulins: a review ofstructure and activity. Diabetes Technol. Ther. 9,109–121.
Caughey, B. (2003). Probing for prions:recognizing misfolded PrP. Nat. Med. 9, 819–820.
Das, S., and Bhattacharyya, D. (2017).Destabilization of human insulin fibrils bypeptides of fruit bromelain derived from Ananascomosus (pineapple). J. Cell. Biochem. 118,4881–4896.
Frankær, C.G., Sønderby, P., Bang, M.B., Mateiu,R.V., Groenning, M., Bukrinski, J., and Harris, P.(2017). Insulin fibrillation: the influence andcoordination of Zn 2+. J. Struct. Biol. 199, 27–38.
Ghosh, P., Bera, A., Ghosh, A., Bhadury, P., andDe, P. (2020). Side-chain proline-based polymersas effective inhibitors for in vitro aggregation ofinsulin3, 8th (ACS Applied Bio Materials),pp. 5407–5419.
Gong, H., He, Z., Peng, A., Zhang, X., Cheng, B.,Sun, Y., Zheng, L., and Huang, K. (2014). Effects ofseveral quinones on insulin aggregation. Sci. Rep.4, 1–8.
Han, X., Park, J., Wu, W., Malagon, A., Wang, L.,Vargas, E., Wikramanayake, A., Houk, K.N., andLeblanc, R.M. (2017). A resorcinarene forinhibition of Ab fibrillation. Chem. Sci. 8, 2003–2009.
Heller, S., Kozlovski, P., and Kurtzhals, P. (2007).Insulin’s 85th anniversary-An enduring medicalmiracle. Diabetes Res. Clin. Pract. 78, 149–158.
Hua, Q.X., and Weiss, M.A. (2004). Mechanism ofinsulin fibrillation: the structure of insulin underamyloidogenic conditions resembles a protein-folding intermediate. J. Biol. Chem. 279, 21449–21460.
Ivanova, M.I., Sievers, S.A., Sawaya, M.R., Wall,J.S., and Eisenberg, D. (2009). Molecular basis forinsulin fibril assembly. Proc. Natl. Acad. Sci. U. S.A. 106, 18990–18995.
Jana, B., Mondal, P., Saha, A., Adak, A., Das, G.,Mohapatra, S., Kurkute, P., and Ghosh, S. (2018).Designed tetrapeptide interacts with tubulin andmicrotubule. Langmuir 34, 1123–1132.
Jimenez, J.L., Nettleton, E.J., Bouchard, M.,Robinson, C.V., Dobson, C.M., and Saibil, H.R.(2002). The protofilament structure of insulinamyloid fibrils. Proc. Natl. Acad. Sci. U. S. A. 99,9196–9201.
Julien, O., Chatterjee, S., Thiessen, A., Graether,S.P., and Sykes, B.D. (2009). Differential stability ofthe bovine prion protein upon urea unfolding.Protein Sci. 18, 2172–2182.
Kabotso, D.E.K., Smiley, D.,Mayer, J.P., Gelfanov,V.M., Perez-Tilve, D., Dimarchi, R.D., Pohl, N.L.B.,and Liu, F. (2020). Addition of sialic acid to insulinconfers superior physical properties andbioequivalence. Cite This J.Med. Chem. 63, 6143.
Kachooei, E., Moosavi-Movahedi, A.A.,Khodagholi, F., Mozaffarian, F., Sadeghi, P., Hadi-Alijanvand, H., Ghasemi, A., Saboury, A.A.,Farhadi, M., and Sheibani, N. (2014). Inhibitionstudy on insulin fibrillation and cytotoxicity bypaclitaxel. J. Biochem. 155, 361–373.
Lee, H.H., Choi, T.S., Lee, S.J.C., Lee, J.W., Park,J., Ko, Y.H., Kim, W.J., Kim, K., and Kim, H.I.(2014). Supramolecular inhibition of amyloid
iScience 24, 102573, June 25, 2021 11
llOPEN ACCESS
iScienceArticle
fibrillation by cucurbit[7]uril. Angew. Chemie - Int.Ed. 53, 7461–7465.
Mishra, N.K., Joshi, K.B., and Verma, S. (2013).Inhibition of human and bovine insulin fibrilformation by designed peptide conjugates. Mol.Pharm. 10, 3903–3912.
Moroder, L., and Musiol, H.J. (2017). Insulin—from its discovery to the industrial synthesis ofmodern insulin analogues. Angew. Chem. - Int.Ed. 56, 10656–10669.
Neddenriep, B., Calciano, A., Conti, D., Sauve, E.,Paterson, M., Bruno, E., and Moffet, A.D. (2012).Short peptides as inhibitors of amyloidaggregation. Open Biotechnol. J. 5, 39–46.
Nilsson, M.R. (2016). Insulin amyloid at injectionsites of patients with diabetes. Amyloid 23,139–147.
Owens, D.R., Zinman, B., and Bolli, G.B. (2001).Insulins today and beyond. Lancet 358,739–746.
Paramithiotis, E., Pinard, M., Lawton, T.,LaBoissiere, S., Leathers, V.L., Zou, W.Q., Estey,L.A., Lamontagne, J., Lehto, M.T., Kondejewski,L.H., et al. (2003). A prion protein epitopeselective for the pathologically misfoldedconformation. Nat. Med. 9, 893–899.
Patel, P., Parmar, K., and Das, M. (2018). Inhibitionof insulin amyloid fibrillation by Morin hydrate.Int. J. Biol. Macromol. 108, 225–239.
Pathak, B.K., Das, D., Bhakta, S., Chakrabarti, P.,and Sengupta, J. (2020). Resveratrol as a nontoxicexcipient stabilizes insulin in a bioactivehexameric form. J. Comput. Aided. Mol. Des. 34,915–927.
Pease, L.F., Iii, Sorci, M., Guha, S., Tsai, D.-H.,Zachariah, M.R., Tarlov, M.J., and Belfort, G.(2010). Probing the nucleus model for oligomer
12 iScience 24, 102573, June 25, 2021
formation during insulin amyloid fibrillogenesis.Biophys J. 99, 3979–3985.
Ratha, B.N., Ghosh, A., Brender, J.R., Gayen, N.,Ilyas, H., Neeraja, C., Das, K.P., Mandal, A.K., andBhunia, A. (2016). Inhibition of insulin amyloidfibrillation by a novel amphipathic heptapeptide:mechanistic details studied by spectroscopy incombination with microscopy. J. Biol. Chem. 291,23545–23556.
Saithong, T., Thilavech, T., and Adisakwattana, S.(2018). Cyanidin-3-rutinoside reduces insulinfibrillation and attenuates insulin fibrils-inducedoxidative hemolysis of human erythrocytes. Int. J.Biol. Macromol. 113, 259–268.
Seidler, P.M., Boyer, D.R., Rodriguez, J.A.,Sawaya, M.R., Cascio, D., Murray, K., Gonen, T.,and Eisenberg, D.S. (2018). Structure-basedinhibitors of tau aggregation. Nat. Chem. 10,170–176.
Taschuk, R., Marciniuk, K., Maattanen, P.,Madampage, C., Hedlin, P., Potter, A., Lee, J.,Cashman, N.R., Griebel, P., andNapper, S. (2014).Safety, specificity and immunogenicity of a PrPSc-specific prion vaccine based on the YYR diseasespecific epitope. Prion 8, 51–59.
Teska, B.M., Alarcon, J., Pettis, R.J., Randolph,T.W., and Carpenter, J.F. (2014). Effects of phenoland meta-cresol depletion on insulin analogstability at physiological temperature. J. Pharm.Sci. 103, 2255–2267.
Wallin, C., Hiruma, Y., Warmlander, S.K.T.S.,Huvent, I., Jarvet, J., Abrahams, J.P., Graslund, A.,Lippens, G., and Luo, J. (2018). The neuronal tauprotein blocks in vitro fibrillation of the amyloid-b(Ab) peptide at the oligomeric stage. J. Am.Chem. Soc. 140, 8138–8146.
Wang, J.B., Wang, Y.M., and Zeng, C.M. (2011).Quercetin inhibits amyloid fibrillation of bovineinsulin and destabilizes preformed fibrils.Biochem. Biophys. Res. Commun. 415, 675–679.
Weber, C., Kammerer, D., Streit, B., and Licht,A.H. (2015). Phenolic excipients of insulinformulations induce cell death, pro-inflammatorysignaling and MCP-1 release. Toxicol. Rep. 2,194–202.
Woods, R.J., Alarco�n, J., McVey, E., and Pettis,R.J. (2012). Intrinsic fibrillation of fast-actinginsulin analogs. J. Diabetes Sci. Technol. 6,265–276.
Wu, L.C. (2019). Regulatory Considerations forPeptide Therapeutics. Peptide Therapeutics:Strategy and Tactics for Chemistry,Manufacturing, and Controls (Royal Society ofChemistry), pp. 1–30.
Xiong, X., Blakely, A., Karra, P., Vandenberg,M.A., Ghabash, G., Whitby, F., Zhang, Y.W.,Webber, M.J., Holland, W.L., Hill, C.P., and Chou,D.H.C. (2019). Novel four-disulfide insulin analogwith high aggregation stability and potency.Chem. Sci. 11, 195–200.
Yumlu, S., Barany, R., Eriksson, M., and Rocken, C.(2009). Localized insulin-derived amyloidosis inpatients with diabetes mellitus: a case report.Hum. Pathol. 40, 1655–1660.
Zaykov, A.N., Mayer, J.P., and Dimarchi, R.D.(2016). Pursuit of a perfect insulin. Nat. Rev. DrugDiscov. 15, 425–439.
Zheng, Q., and Lazo, N.D. (2018). Mechanisticstudies of the inhibition of insulin fibril formationby rosmarinic acid. J. Phys. Chem. B 122, 2323–2331.
Zhou, C., Qi, W., Lewis, E.N., and Carpenter,J.F. (2016). Characterization of sizes ofaggregates of insulin analogs and theconformations of the constituent proteinmolecules: a concomitant dynamic lightscattering and Raman spectroscopy study.J. Pharm. Sci. 105, 551–558.

iScience, Volume 24
Supplemental information
Prion-derived tetrapeptide stabilizes thermolabile
insulin via conformational trapping
Meghomukta Mukherjee, Debajyoti Das, Jit Sarkar, Nilanjan Banerjee, JagannathJana, Jyotsna Bhat, Jithender Reddy G, Jagadeesh Bharatam, SamitChattopadhyay, Subhrangsu Chatterjee, and Partha Chakrabarti

Figure S1. Related to Figure 1
Figure S1:
(A) Scatter plot showing 2D-distribution of ThT (x-axis) and PROTEOSTAT (y-axis)
fluorescence from heat-induced bovine insulin fibrillation in the presence of 77
peptide variants (including IS1). (B) Scree plot obtained from kmeans clustering of
ThT and PROTEOSTAT values of heat-induced bovine insulin fibrillation in the
presence of 77 peptide variants (including IS1). The within-group sum of square (y-
axis) plotted against number of clusters (x-axis). (C) Dot plot of 77 peptides
(including IS1) distributed in 4 independent clusters (x-axis) obtained from kmeans
clustering plotted against % Anti-amyloid potential (left y-axis) and % ThT/
PROTEOSTAT fluorescence (right y-axis); Bovine insulin with no heat served as the
negative control, bovine insulin heated with no peptide served as positive control. (D)
Percent allowed substitution of cluster-1 peptides plotted against amino acid
substitution position. (E) Graphical representation of the anti-amyloid peptide
screening for insulin, explaining the results obtained from kmeans clustering. All
experiments were done in triplicates and Values are presented as mean SEM. *P <
0.05, **P < 0.01, ***P < 0.001.

Figure S2, Related to Figure 1
Figure S2:
(A) ThT assay performed for heat-induced insulin fibrillation in the presence and
absence of VPYR, VYPR, VPPR, VTTR and VYYR. (B,C) ThT-assay and DLS of
heat-induced insulin fibrillation in the presence of VPYR, VYPR, VPPR and VTTR.
The insulin and peptides ratio was (1:1) with a concentration of 350mM. All the
samples were heat incubated at 62˚C for 400mins. All the samples were prepared at
50mM citrate-phosphate buffer with a pH of 2.6. (D) Insulin Tolerance Test (ITT) of
fibrillated bovine insulin in the presence of different peptides [n = 5 mice/ group].

Figure S3, Related to Figure 2
Figure S3:
(A) ITC graph describing the binding affinity of IS1 towards insulin. insulin and IS1
concentration used to obtain the ITC graph were 80uM and 2.4mM respectively. The
experiment was carried out at 25˚C. (B) Contour plot (2D-kernel density estimation)
of commercial insulin fibrils (Actrapid) both in the presence and absence of IS1 (5
fields/sample; 16 measurements/field) for heat and storage-induced fibrillation. (C)
Time-dependent ThT-assay of heat-induced fibrillation of Actrapid (with excipients) in
the presence and absence of IS1. (D) Western blot showing Akt (Ser 473)
phosphorylation of Citrate Phosphate Buffer, IS1, native Insulin, native insulin with
IS1, and fibrillated insulin both in the presence and absence of IS1 in HepG2 cell
line; β-actin served as the loading control.

Figure S4, Related to Figure 5
Figure S4:
(A) Comparative study of STD NMR of reference, IS1-insulin complex, and IS1. IS1
and insulin ratio was 100:1. The proton of IS1 interacting with insulin was marked
‘red star’ sign and the protons which are not interacting marked as ‘red cross’ sign.
(B) NMR-restrained molecular simulated ensemble structure model of insulin in
binding with IS1. (C) Comparative study of STD NMR of reference, reverse IS1
(RYYV)-insulin complex, and RYYV. RYYV and insulin ratio was 100:1. (D)
Comparative study of STD NMR of reference, IS1- Actrapid complex, and IS1. IS1
and Actrapid ratio was 100:1.

Figure S5, Related to Figure 5
Figure S5:
(A) Residue-wise relaxation of freshly prepared IS1 in presence of insulin.
Longitudinal relaxation (R1) and transverse relaxation (R2) are plotted for each
residue of IS1.(B) A temperature-dependent 1D-H NMR of insulin in the presence
and absence of IS1 respectively.(C) Overlay the spectrum of 2D-NOESY of insulin
and insulin-IS1 complex. (D) (i-iii), surface-charge distribution of IS1-insulin
interaction. (i) The red surface shows the A chain and Sky Blue surface shows B
chain of Insulin (ii) APBS surface of Insulin-IS1 complex (red-APBS negative charge
surface, blue-positive charge surface) (iii) APBS surface of Insulin-IS1 complex with
transparency (red-APBS negative charge surface, blue-positive charge surface, IS1
in ball and stick model).

Figure S6, Related to Figure 5
Figure S6:
Schematics explaining the IS1-mediated stabilization pathway for hexameric
(Lantus) and monomeric (Lispro) insulin analogs.

Figure S7, Related to Figure 6
Figure S7:
HPLC chromatogram showing peaks for m-cresol for three insulin analogs (Actrapid,
Lantus and Lispro) with and without excipients.

Figure S8, Related to Figure 6
Figure S8:
(A) Atomic force microscopy images showing heat-induced (620C, 3 h) fibrillation of
conformation-selective commercial insulin analogs (Lantus and Lispro) with
excipients both in the presence and absence of IS1 (scale bars, 1 µm). (B) Time-
dependent ThT-assay of commercial insulin with excipients, Lantus and Lispro in
presence and absence of IS1. All the samples were heat incubated at 62˚C for 8 h.
The IS1 and commercial insulin molar ratio were (1:1).

Figure S9, Related to Figure 6
Figure S9:
(A) Atomic force microscopy images showing storage-induced (370C, 30 days)
fibrillation of excipients containing commercial insulin analogs (Lantus, and Lispro)
both in the presence and absence of IS1 (scale bars, 1 µm). (B) Time-dependent
ThT-assay of conformation-selective commercial insulin analogs (Lantus and Lispro)
with excipients in the presence or absence of IS1. (C) DLS analysis of conformation-
selective commercial insulin (Lantus and Lispro) in presence and absence of IS1. All
the samples were kept at 37˚C for 30 days. The IS1 and commercial insulin ratio
were (1:1). The data points were collected at different days of incubation.

Figure S10, Related to Figure 6
Figure S10:
(A) Comparative study of STD NMR of reference, IS1- commercial insulin complex,
and IS1. IS1 and commercial insulin ratio was 100:1. (i) IS1 in presence of Lantus
and (ii) IS1 in presence of Lispro. All were prepared in citrate phosphate buffer pH
2.6. Proton of IS1 interacting with insulin were marked ‘red star’ sign and those
proton which are not interacting marked as ‘red cross’ sign. (B) Western blot
showing Akt (Ser 473, Thr 308) and p70S6K phosphorylation of excipients-removed
commercial insulin analogs (Actrapid, Lantus and Lispro) in the presence of absence
of IS1 under storage-induced fibrillation condition (370C, 30 days) in HepG2 cell line;
pan AKT and β-actin served as the loading control.

Table S1. Peptide sequences used in screening, Related to Figure 1
Serial No.
PeptideSequence
1 YYVR
2 AYYR
3 CYYR
4 DYYR
5 EYYR
6 FYYR
7 GYYR
8 HYYR
9 IYYR
10 KYYR
11 LYYR
12 MYYR
13 NYYR
14 PYYR
15 QYYR
16 RYYR
17 SYYR
18 TYYR
19 YYYR
20 WYYR
21 VYYA
22 VYYC
23 VYYD
24 VYYE
25 VYYF
26 VYYG
27 VYYH
28 VYYI
29 VYYK
30 VYYL
31 VYYM
32 VYYN
33 VYYP
34 VYYQ
35 VYYV
36 VYYS
37 VYYT
38 VYYY
39 VYYW
40 VYAR
41 VYCR
42 VYDR
43 VYER
44 VYFR
45 VYGR
46 VYHR
47 VYIR
48 VYKR
49 VYLR
50 VYMR
51 VYNR
52 VYPR
53 VYQR
54 VYVR
55 VYSR
56 VYTR
57 VYRR
58 VYWR
59 VAYR
60 VCYR
61 VDYR
62 VEYR
63 VFYR
64 VGYR
65 VHYR
66 VIYR
67 VKYR
68 VLYR
69 VMYR
70 VNYR
71 VPYR
72 VQYR
73 VVYR
74 VSYR
75 VTYR
76 VRYR
77 VWYR
78 VYYR

Table S2. CD deconvoluted data from CDNN software, Related to Figure 2
Free -Insulin % of α-helix
% of β-sheets
Random coils
Insulin, 0 min 53.9 21.5 20.5
Insulin, 300 min 21.8 35.5 40.7
IS1-Insulin
IS1-insulin, 0 min 66 18.5 16.5
IS1-insulin, 300 min 60.2 20.9 16.2
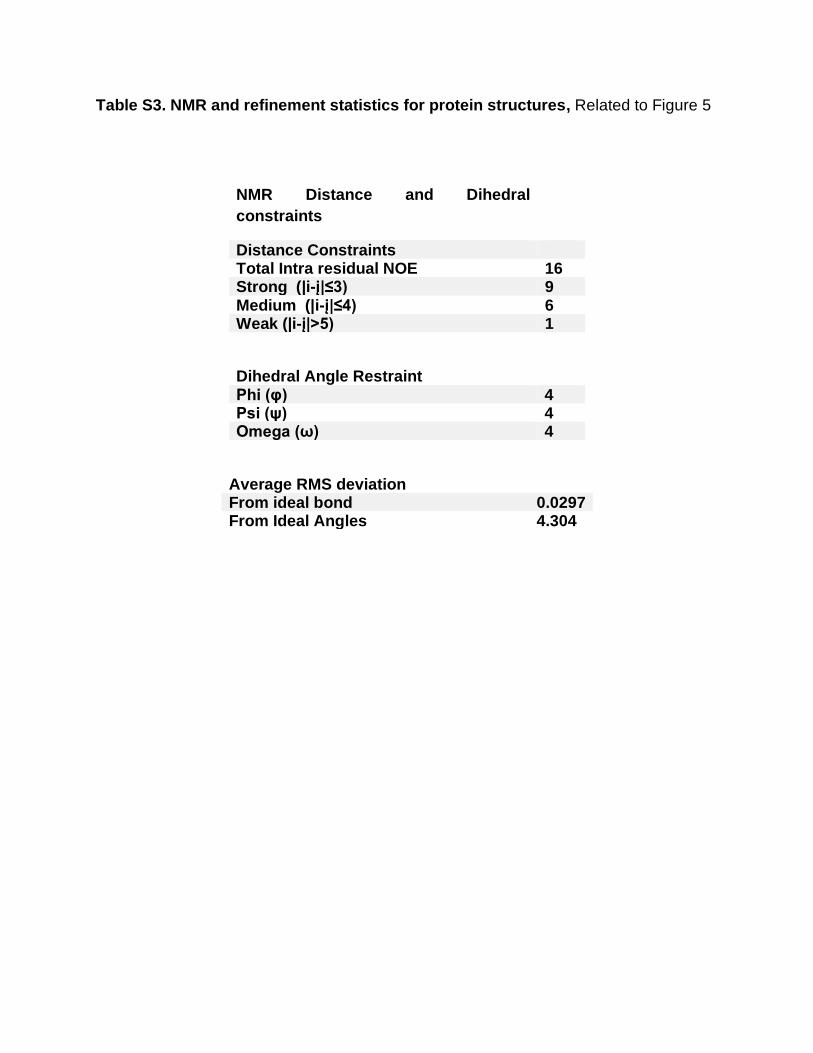
Table S3. NMR and refinement statistics for protein structures, Related to Figure 5
NMR Distance and Dihedral
constraints
Distance Constraints Total Intra residual NOE 16 Strong (|i-į|≤3) 9 Medium (|i-į|≤4) 6 Weak (|i-į|>5) 1
Dihedral Angle Restraint Phi (φ) 4 Psi (ψ) 4 Omega (ω) 4
Average RMS deviation From ideal bond 0.0297 From Ideal Angles 4.304

Table S4. Molecular weight Calculation from Dosy NMR spectroscopy, Related to
Figure 5
A
IS1-Insulin complex Oligomeric Insulin
Diffusion co-efficient (d2 IS1- insulin) = 2.2×10⁻⁴
Diffusion co-efficient (d2 free insulin) = 9.4×10⁻⁵
Molecular weight = 10kD Molecular weight = 57kD
B
Calculation of molecular weight of IS1-insulin
Calculation of molecular weight of oligomeric insulin
Logd1/d2=1/3 logmw2/mw1
Log1.12×10-3/2.2×10-4=1/3 logmw2/82.03
Mw2=10kD
Logd1/d2=1/3 logmw2/mw1
Log1.12×10-3/9.45×10-5=1/3 logmw2/82.03
Mw2=57kD
TRANSPARENT METHODS
Protein and peptide
Bovine insulin (I6634) and Thioflavin T were purchased from Sigma Aldrich. Peptides
were chemically synthesized from Aapptech 90 peptide synthesizers whereas peptide
array of 77 variant peptides of IS1were purchased from Genscript. Commercial insulin
analogs (Actrapid, Lantus and Lispro) were purchased from a local pharmacy.
Insulin stock preparation
Bovine insulin concentration was measured by UV-Vis spectroscopy at 280 nm. The
extinction coefficient of insulin was considered as 0.91(mg/ml)-1.cm-1.1mM working
stock for the peptides and bovine insulin in citrate-phosphate (CP) buffer (pH 2.6) were
prepared. Human Actrapid (Novo Nordisk India Pvt Ltd, Bagsværd, Denmark), Insulin
Lantus (Deutschland GmbH, Germany) and Insulin Lispro (HumalogTM, Lilly,
Indianapolis) had greater than 1 year of shelf life remaining at the time of use and were
stored at the manufacturers’ recommended storage conditions. Insulin formulation
buffers were exchanged for CP buffer (pH 2.6) using desalting spin columns for
excipients removal. Desalting spin columns (Zeba 7K MWCO, Pierce, Rockford, IL)
were pre-equilibrated by washing with three column volumes of CP buffer. Insulin
analogs were loaded onto the columns (2.2 ml insulin per column) followed by a spin
elution for 3 min at 1500 g. Eluted insulin was collected and pooled to prepare
commercial insulin excipient removed stocks. Insulin stock concentration was
determined using both Bradford assay and absorbance at 277.5 nm using the extinction
coefficient of 0.9521 ml/mg-1/cm-1. The final concentration of each insulin analogs was
adjusted to 350 µM for most studies except as indicated. Buffer exchange on all the
fresh analog samples was performed immediately prior to initiation of all fibrillation
studies, and no buffer-exchanged samples were also used for fibrillation assay in the
presence and absence of IS1 respectively. Examination of post-column eluates of the
analog formulations was performed on representative samples using reversed-phase
high-performance liquid chromatography (HPLC).

Fibrillation assay
Bovine insulin concentration was adjusted to 350 µM in CP buffer (pH 2.6) and insulin:
IS1 equimolar complex was incubated at 620 C hot water bath in a sealed
microcentrifuge tube for a required time period to induce insulin fibril formation.
Thioflavin-T (ThT) assay
ThT concentration was measured by UV-Vis spectroscopy at 420 nm. The extinction
coefficient of ThT was considered as 36000 M-1.cm-1. ThT was dissolved in distilled
water in a concentration of 2mM and the final concentration was 20µM. ThT assay of
insulin was performed using the Hitachi spectrophotometer (F-700 FL) at 62˚C. An
aliquot of insulin from the stock solution and ThT was added to it and the fluorescence
was measured (excitation at 440 nm and emission at 480 nm). Slit for the entire
experiment was kept as 2.5. CP buffer’s spectrum was substituted from the final
spectrum of the insulin. Each spectrum was the average of three replications.
Peptide Screening
A custom-designed peptide library of 77 peptides based on IS1 was purchased from
Genscript (USA). We have performed fibrillation assay of bovine insulin in the presence
and absence of all 77 peptide variants under identical Physico-chemical conditions (
350µM, pH 2.6, 620C). We have used both ThT and PROTEOSTAT assay for
determining the fibrillation inhibition potential. The above experiment was replicated
thrice and Statistical analysis was performed in RStudio (Version 1.1.447). K-means
clustering was done on fluorescence intensities for Proteostat and ThT for all the
peptides using the kmeans function. Hierarchical clustering was done on 77 peptides for
Proteostat and ThT separately based on the position of the amino-acid substitution for
all the 20 amino-acids using hclust function and the dendrogram was plotted in the form
of a heatmap using heatmap function. Clusters obtained were plotted for their intensities
using ggplot2 package in R.
Circular Dichroism (CD)
Secondary structural change of insulin over time was analyzed using (Jasco 815
spectrometer). The scanning wavelength was from 195nm to 260nm at room
temperature with scan speed at 100nm s-1 and bandwidth as 1nm. The results of each
spectrum were the average of 3 independent scans. Spectra obtained from the buffer
were subtracted from the spectra of bovine insulin. All the spectra were acquired at
different time intervals.
Atomic Force Microscopy (AFM)
The aggregate insulin suspensions were diluted 300 times using freshly filtered Milli-Q
water, and5l of the sample was deposited onto freshly cleaved MUSCOVITE MICA-V1
( Electron Microscopy Sciences) and dried under mild vacuum for 15-20 min. AAC
mode AFM was performed using a Pico plus 5500 ILM AFM (Agilent Technologies,
USA) with a piezo scanner maximum range of 9m. Microfabricated silicon cantilevers
of 225m in length with a nominal spring force constant of 21-98 N/m were used
(Nanosensors, USA). The cantilever oscillation frequency was tuned into resonance
frequency. The cantilever resonance frequency was 150-300 kHz. The images (256 by
256 pixels) were captured with a scan size of between 0.1 and 8 m at the scan speed
rate of 0.5lines/S. Images were processed by flattening using Pico view1.1 version
software (Agilent Technologies, USA). Image correction has been done through Pico
Image Advanced version software (Agilent Technologies, USA). Height and width
measurement has also been done in Pico view 1.1 version software for approximately
80 data points from 5 independent fields for each sample.2-dimensional kernel density
estimation was done for height and width of insulin fibrils with and without the IS1 for all
3 different types of insulin (Actrapid, Lantus and Lispro) and the results were displayed
with contours over the scatter plots using MASS and ggplot2 package in R.
Dynamic Light Scattering (DLS)
DLS studies were performed on Malvern nano dynamic light scattering equipment. The
insulin sample was taken at a concentration of 350µM in the presence and absence of
IS1 for analysis. All the samples were filtered through micro-filter containing a pore size

of 0.2µM. The Measured size was presented as the average value of 36 runs. Dynamics
7.10.0.10 software was used for data analysis.
Gel filtration chromatography coupled with Dynamic Light Scattering
Recombinant Human Insulin (Sigma) adjusted to 350 M in CP Buffer (pH 2.6), and
Insulin: IS1 equimolar complex was incubated at 620 C in a prewarmed water bath in a
sealed microcentrifuge tube for 4 h to induce insulin fibrillation. Native human insulin
served as a negative control. The sample was centrifuged and loaded on
HiLoadSuperdex 75pg Column (GE healthcare). Steep selectivity curves of this column
give resolving power for proteins in the molecular weight range~ 3000 to 70000 Dalton.
Loading was followed by the elution at the flow rate of 1ml/min and a pressure of 0.3
Pa. The eluent corresponding to the major chromatographic peak was collected and
then run on Malvern nano dynamic light scattering instrument to get the idea of the
eluent size. Dynamics 7.10.0.10 software was used for data analysis.
Isothermal calorimetric titration (ITC)
ITC experiment was carried out in 250C in VP ITC Micro Calorimeter equipment. The
insulin solution was taken in the cell and IS1 was taken in the syringe. The experiment
was performed in water (pH 2.6). After the equilibration was reached, then only the
titration was started. This titration of insulin with IS1 was total of 14 injections at 180 s
time intervals with 3µl IS1 per injection. All the raw data was analyzed in origin software.
The data were fitted in the ‘one site binding’ model.
NMR- T1 and T2 relaxation, STD NMR, and DOSY NMR
All spectra of NMR experiments were recorded using a Bruker AVANCE III 500 MHz
spectrometer equipped with a 5mm SMART probe at 298K. Data acquisition and
processing were performed using Topspin 3.1 software. All NMR samples were
prepared in 50mM citrate phosphate buffer for insulin and H2O for peptides, containing
10% D2O and using TSP as an internal standard (0.0 ppm). By performing Diffusion
Order NMR spectroscopy (DOSY), the hydrodynamic radius and molecular weight of
free insulin and IS1-insulin complex were determined. 1 mM Sodium acetate was added
into the solution of free insulin and IS1-insulin complex as an internal reference. Total
24 one-dimensional 1H NMR spectra were recorded with increasing gradient strength
from 5% to 95% for both cases (free and complex insulin) using Bruker Pulse program
“stebpgp1s191d” (a diffusion measurement using stimulated echo) having a spectral
width of 20 ppm and 128 scans with 4 dummy scans. The intensity decay of 1H signals
from insulin was plotted using equation
I(g) = Ae(-dg2)
where I, g, and d represent the intensity of the peak, gradient strength, and decay rates,
respectively. The hydrodynamic radius was measured using the equation
Rh = dref/dRhref
where Rh is the hydrodynamic radius of insulin (free or complex), dref is the decay rate of
reference, and d is the decay rate of insulin (free or complex). Rh (ref) was taken to be 2.3
Å. The molecular weight of free insulin and IS1-insulin complex were taken from the
equation
log(d1/d2) = (1/3) log(MW2/MW1)
To perform saturation transfer difference (STD) NMR experiments, insulin and IS1 were
prepared in a buffer containing 99.9% D2O. The pH was adjusted to 2.6. The STD-NMR
spectra of insulin: IS1 (1:100) were acquired with 3 K scans and selective saturation of
insulin resonances either at 20.5 or at 7.3 ppm (reference spectra were at 40 ppm)
using a series of 40 Gaussian-shaped pulses (49 ms, 1 ms delay between pulses). The
free peptide, VR4 do not show any STD effects saturating at the same frequency as the
IS1-insulin complex. Data were processed using the TOPSPIN program suite. Atomic-
level dynamics were obtained from one dimensional longitudinal (T1) and transverse
(T2) relaxation experiments. T1 experiments were performed using previously reported
protocols with different inversion recovery delays ranging from 0 to 3 s. The T2
measurements were achieved from CPMG sequence and the delays ranging from 0 to
0.7 s.

The 2D-1H,1H plane of 3D- 15N- edited NOESY HSQC, 2D-1H,15N –HSQC, and 2D-
1H,1H -NOESY spectra of NMR experiments were recorded using a Bruker AVANCE III
700 MHz spectrometer equipped with a 5mm Cryogenically cooled Quadruple-
resonance probe at 283K. Data acquisition and processing were performed using
Topspin 3.1 software. All NMR samples were prepared in 50 mM citrate phosphate
buffer for insulin and IS1, containing 10% D2O. Insulin and IS1 were taken in 1:1 ratio
with 500 M concentration each. Noesy mixing time was 100 ms.
Docking and Simulation
The co-ordinate file of the X-ray Crystallographic structure of insulin (PDB ID:2ZP6),
was downloaded from RSCB PDB site and further processed in PyMOL. Structure of
IS1 was deduced by NMR and solved using CYANA. Insulin and IS1 were docked in
HDOCK server, a protein-protein based docking server based on a hybrid algorithm of
template-based modeling and ab initio free docking and structures were prepared using
protein preparation wizard module of schrodinger. The ligand (IS1) was first minimised
using MacroModel, and the minimised output structure was processed using protein
preparation wizard with default parameters in it. Next in BioLuminate the Peptide
docking module was used for docking. The binding site was specified by selecting the
centroid of residues derived from 2D and 3D NMR. IS1 was specified from project table
selected entry and 100 ligand poses were saved. The best pose among all were
selected and further refined in AMBER. First AMBER parameter/topology files were
developed and then NMR restraint files were generated using protocols as mentioned in
AMBER tutorials. Finally, molecular dynamics simulation of the structure was performed
for 20 ps in AMBER14 using General Amber Force Field (GAFF) which uses simple
harmonic function and ff14SB force-field for parameterization of peptide-insulin
complex.
Cell lysis and Immunoblotting
Cells were rinsed with ice-cold PBS and total cellular protein was prepared with lysis
buffer containing 50 mM Tris-HCl (pH 7.4), 100 mM NaCl, 1 mM EDTA, 1 mM EGTA and
1% Triton X-100 with protease and phosphatase inhibitor cocktail both from (Millipore,

Billierica, MA, USA). The soluble fractions of cell lysates were isolated by centrifugation
at 15000g for 15 minutes at 40 C. Protein samples (40 μg/lane) were resolved by 10%
SDS-PAGE and transferred to Immobilon-P membranes (Millipore, Billierica, MA, USA)
by wet transfer (Trans-Blot, Bio-Rad) at 90V for 3 h. For immunodetection membrane
was blocked with 5% non-fat milk in PBS with 0.1% Tween 20 for 1 h followed by
incubation with specific primary antibody (1:1000 dilution) at 40 C overnight and with
horseradish peroxidase-labeled secondary antibodies (1:1000 dilution) for 1h at room
temperature. Signals were detected by chemiluminescence using LuminataClassico
Western HRP substrate (Millipore, Billierica, MA, USA) and scanned using a
ChemiDocMP System (Bio-Rad Laboratories, Hercules, CA). Primary antibodies used:
Anti--Actin, Anti-Akt (Pan), Anti- phospho-Akt (SER 473), Anti- phospho-Akt (Thr 308),
Anti-phospho-p70 S6 Kinase (Thr 389). All the antibodies were purchased from Cell
Signaling Technology (Boston, MA, USA).
Animal Study
Experiments with animals were performed under the approved Institutional Animal
Ethics Committee (Approved by CPCSEA, India) protocol. 6-8 weeks old wild-type male
BALB/c and C57BL/6 mice were kept at ambient temperature (22 ± 1°C) with 12:12 h
light-dark cycles and fed with standard chow diet (4.3% lipid and 70% carbohydrate)
and high-fat diet (45% kcal fat, MP Biomedical) for respective experiments. In order to
study insulin signaling in vivo, BALB/c mice (n=5/group) fasted for 6 h and a single dose
intraperitoneal insulin injection (1 U/kg of body weight) were administered. The same
dose of fibrillated insulin and fibrillated insulin + IS1 were administered to the respective
group of animals. An equal amount of IS1 was also administered as a negative control.
30 minutes post-injection, all the animals were sacrificed, livers were dissected and
homogenized in lysis buffer. In order to generate a type 1 diabetic preclinical model,
following fasting for 6 h, a single intraperitoneal injection of 180 mg/ kg Streptozotocin
(STZ) was administered to BALB/c mice. STZ was reconstituted in Na-Citrate buffer (pH
4.5) immediately before injection to avoid degradation. All mice were tested for weight
loss and hyperglycemia at 4 weeks post-injection. For generating type 2 diabetes
model, weight and age-matched male C57BL/6 mice were fed with a high-fat diet for 16

weeks. We have tested for gradual weight gain and hyperglycemia at each 4 weeks
interval up to 16 weeks. BALB/c and C57BL/6 mice were fasted for 6 h and fasting
blood glucose was measured using a calibrated glucometer by taking one drop of blood
from the tail tip cut. Intraperitoneal injection of insulin (0.5 U/kg of body weight ) was
given to each mouse with 27 G needle and blood samples were taken from the initial tail
cut at 30, 60 and 120 minutes after intraperitoneal insulin injection. Insulin Tolerance
Test (ITT) has been replicated in five mice per group.8 weeks old BALB/c mice were
taken for generating subcutaneous amyloidoma (n=3/group). Each animal was
administered subcutaneously with 1µg of fibrillated insulin and fibrillated insulin + IS1
daily at the left and right flank in the ventral side of the body for 28 consecutive days.
The injection volume was 103.3 µl for both the samples. All groups received a normal
diet during the experimental period. After 28 days, the biopsies were collected from both
spots of each animal and tissue sections were embedded in paraffin and processed for
hematoxylin and eosin (H&E) as well as congo red staining. Both light microscopy and
polarized images were taken with Leica DFC450c camera using LAS EZ software
(v.4.6).
Live Dead Assay
HepG2 cells harvested in DMEM and 0.5 ml of 0.4% Trypan Blue solution (w/v) was
added to the suspension of cells. 50µl of Trypan Blue-cell suspension mixture was
placed on the hemocytometer for counting. Cells in all the chambers were counted and
five replicate readings were taken. Approximately 2.5 × 10⁵ cells were counted and
plated in each well. The next day, cells were treated with variable doses (10, 20, 40 and
80 μM) of IS1 and SLRP peptides under serum-starved conditions. After 16 h of
treatment, cell viability for respective treatments was assessed using the Live/Dead
viability kit (Invitrogen, Renfrew). Images were captured with the confocal microscope
FluoView (FV10i; Olympus, Tokyo, Japan). We have also studied the cytotoxic potential
of both IS1 and SLRP for 24 hours using 10 μM concentration. Percent viable and dead
cells (Number of dead cells per field / total number of cells per field) * 100) were
calculated from 5 independent fields per group using threshold and analyze particle

function by applying both red (PI) and green (FITC) channel independently using image
J (Fiji) software.
Cytotoxicity assay
Approximately105 HepG2 cells/100 μl of medium per well in 96 well polystyrene plates
following Trypan Blue exclusion. Cells were treated with IS1 and SLRP with varying
concentrations of 10, 20, 40 and 80 μM for 24 h. Cell viability was determined with the
addition of 10 μl of 5 mg/ml MTT to each well. After incubation for 4 hrs at 37 °C, the
medium was aspirated from each well and 100 μl of DMSO was added per well. Plates
were agitated at 25 °C for 10 min and absorbance was recorded at 590 nm by a multi-
well plate reader (Biotek-Epoch; Biotech Instruments). Cells were treated with citrate-
phosphate buffer and no test samples but MTT served as the positive control. Cells
without MTT served as blank. Percent viability [ % viability = ((Abssample – Absblank) /
(Abscontrol – Absblank)) * 100 ] has been calculated using three replicate values for each
concentrations.
Hemolytic Assay
5ml fresh blood was collected from volunteer in EDTA containing vial, centrifuged at
6000rpm for 10min. The cell pellet was resuspended in 1ml 1X PBS and washed
3times. Finally 50l of the peptide in PBS and 50µl cell suspension were mixed and
incubated at 37˚C for 1h with continuous shaking at 200rpm. Samples were centrifuged
at 6000 rpm for 10 min and supernatant were collected for spectroscopic measurements
at 540 nm. 1% Triton X100 serves as a positive control. The percentage of hemolysis
was calculated.
Statistics
Statistical values are presented as the mean ± SD. A two-tailed Student’s t-test was
used to calculate the p-values. Pearson’s correlation coefficient ‘r’ has been calculated
to explore the association between variables .p<0.05 was considered as significant.