iMaths 7 Preview
© Chris Linthorne, Firefly Education 2012 1
PreviewAn investigation-based approach to numeracy
Everything you need to:plan |teach | investigate | assess www.imaths.com.au
2 iMaths 7 Preview © Chris Linthorne, Firefly Education 2012
Plan | Teach | Investigate | Assess
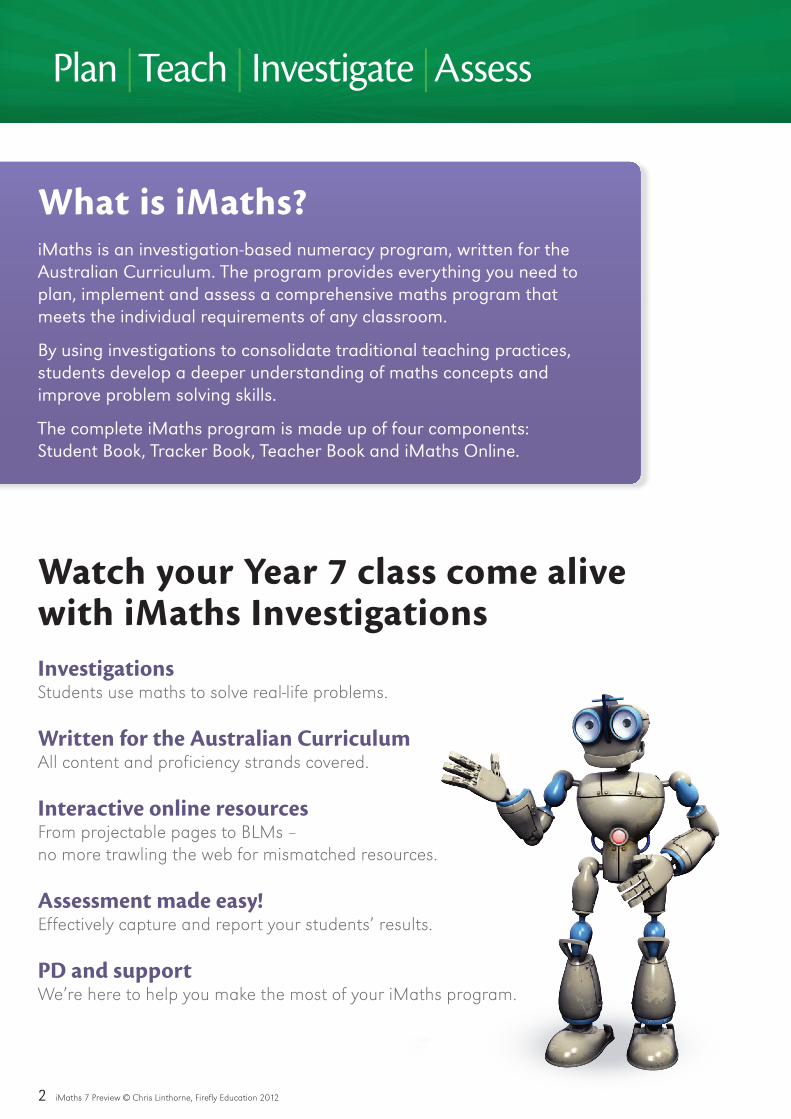
Watch your Year 7 class come alive with iMaths InvestigationsInvestigations Students use maths to solve real-life problems.
Written for the Australian Curriculum All content and proficiency strands covered.
Interactive online resources From projectable pages to BLMs – no more trawling the web for mismatched resources.
Assessment made easy! Effectively capture and report your students’ results.
PD and support We’re here to help you make the most of your iMaths program.
What is iMaths?iMaths is an investigation-based numeracy program, written for the Australian Curriculum. The program provides everything you need to plan, implement and assess a comprehensive maths program that meets the individual requirements of any classroom.
By using investigations to consolidate traditional teaching practices, students develop a deeper understanding of maths concepts and improve problem solving skills.
The complete iMaths program is made up of four components: Student Book, Tracker Book, Teacher Book and iMaths Online.

iMaths 7 Preview © Chris Linthorne, Firefly Education 2012 3
Everything you need toplan, teach, investigate and assess
Student BookEngage students in learning with:
Teacher BookAll the tools teachers need, including:
Student Tracker BookCapture and report students’ results with:
iMaths OnlineMake your classroom interactive with:
imathskids.com.au.

4 iMaths 7 Preview © Chris Linthorne, Firefly Education 2012
Plan | Teach | Investigate | Assess
The iMaths 7 program has been carefully designed to cover all of the content and proficiency strands of the Australian Curriculum in a structured, linear fashion.
or create one that suits the unique needs of your class.
Sem
este
r 1
TERM 1
Investigation, Topics and Problem Solving Tasks
NA1 Positive and negative integers
NA2 Add and subtract integers
Problem solving task 1: Positives and negatives
NA3
NA4
NA5
NA6
SP1
SP2
SP3 Histograms
SP4 Stem and leaf plots
SP5 Average – the mean
SP6 Mean, median and mode
SP7 Mean vs median
INVESTIGATION 1: How mean are you?
NA7
NA8
Problem solving task 2: What’s your speed?
NA9 Best buys
Problem solving task 3: Cheaper by the dozens
Term assessment
TERM 2
Investigation, Topics and Problem Solving Tasks
MG1
MG2 Angles and parallel lines
Problem solving task 4: What’s your angle?
MG3 Area of composite rectangles
MG4 Volume of rectangular prisms
MG5 Volume of composite prisms
MG6
MG7
NA10
INVESTIGATION 2: YouCube houses
MG8 Classify quadrilaterals
Problem solving task 5: Quadrilateral quiz
Term assessment
Sem
este
r 2
TERM 3
Investigation, Topics and Problem Solving Tasks
MG9
MG10
Problem solving task 6: Lost in translation
NA11 Line graphs
NA12 Patterns and general rules
NA13 General trends
NA14
NA15 Ordered pairs
NA16 Factor trees
INVESTIGATION 3: Sand Boxes
NA17
NA18 Square roots
NA19
Problem solving task 7:
NA20 Order of operations
NA21 Backtracking
Problem solving task 8: Back order
Term assessment
TERM 4
Investigation, Topics and Problem Solving Tasks
MG11 Area of triangles
MG12 Area of combination shapes
MG13 Classify triangles
Problem solving task 9:
NA22 Equivalent fractions
NA23
NA24 Fraction addition
NA25 Fraction subtraction
NA26 Multiply fractions
NA27
NA28
SP8 Probability
SP9 Judgments
INVESTIGATION 4: It’s a toss-up!
NA29 Balancing equations
NA30 Equations solve problems
Problem solving task 10: Balancing act
Term assessment

iMaths 7 Preview © Chris Linthorne, Firefly Education 2012 5
The iMaths 7 program is linear
sequenced to fit together in a graduated program that promotes deeper understanding of maths concepts.the transition to high school.
Maths Topics are taught as discrete, scaffolded
content strands of the Australian Curriculum are covered.
Problem Solving Tasks apply
immediately precede them.
Investigations, of which there is one per term, consolidate and apply the knowledge of
SP7 Mean vs median
1 Calculate the mean and median before and after two new girls join the survey group in c and d.
a Find the average (mean) weekly allowance of the seven children.
b Find the average (median) weekly allowance of the seven children.
c Two new girls joined the group. They have a weekly allowance of $100 each. Calculate the average (mean) of the new group of nine children.
d Find the average (median) weekly allowance of the new group of nine children.
2 Do you think the mean or the median more accurately represents the average weekly allowance of the new group of nine children? Explain your choice.
The mean and the median are two ways of finding a central value to represent the average of a set of data values. Sometimes the set of values contains outliers, certain values that are much higher or lower than the others.
$15 $5 $8 $12$10 $10 $10
32 iMaths 7 Student Book ISBN 978 1 74135 229 0
ChallengeThree mean spellers: A 10-word spelling test was given to three students. The mean of their scores was 7 out of 10.What were the students’ three scores? List as many possible answers as you can.
5 Range is the difference between the largest data value and smallest data value.
a What is the range of weekly allowance of the seven children?
b What is the range of weekly allowance after the two new girls joined the survey group?
6 a What is the range of scores in your spelling test above?
b What happens to the range if you disregard the outliers?
Spelling TestName Score/1001.2.3.4.5.6.7.8.9.10.
Imagine a 100-word spelling test has just been marked. Create a set of test scores for ten of your classmates. Include a few ‘outliers’ then calculate the mean and the median to see the effect of the outliers.
a Mean b Median
4
3 The average value of houses for a particular suburb or city is often reported as the ‘median house price’. Explain why you think the median is chosen rather than the mean.
ISBN 978 1 74135 229 0 iMaths 7 Student Book 33
Problem solving
Explain your calculations and reasoning.
Tricky trianglesPlace the positive and negative numbers in the triangle so that each side totals 1. Use each number once only.
TopicsBefore doing the Problem Solving Task you need to know…NA1 Positive and negative integersNA2 Add and subtract integers
10 iMaths 7 Student Book ISBN 978 1 74135 229 0
Problem solving strategies1 Guess and check
Explain your calculations and reasoning.
Criss crossesHang the numbers –4 to 4 on the cross so that the horizontal line totals 2 and the vertical line totals 2. Use each number once only. The number 4 has been hung for you.
Place the numbers below in the triangle so that each side totals –3. Use each number once only.
Extension task
4
–4 –3 –2 –1 0 1 2 3 4
ISBN 978 1 74135 229 0 iMaths 7 Student Book 11
NA1 Positive and negative integers
0
1 Label this number line from –10 to +10.
a –9 or +9 b –7 or +3 c +1 or –10
d +2 or –5 e –4 or 0
2 Circle the number with greater value in each pair.
a –1 to –6 b –8 to 0 c +5 to –5
d 0 to +7 e +4 to –10
3 Use the number line above to work out the difference between each pair.
4 On a cold winter day, the following temperatures were recorded in some capital cities of Europe. Label the thermometer with the ten capital city temperatures.
Edinburgh -12
Bern 8
London -5
Rome 15
Dublin -9
Madrid 21
Brussels 0Berlin -3
Paris 2 Prague 5
30°
20°
10°
0°
–10°
–20°
Madrid
Integers are whole numbers. They include positive and negative numbers and zero. On a number line, the numbers to the right of zero are called positive numbers and their opposites to the left of zero are called negative numbers. Zero is neither positive nor negative.
6 iMaths 7 Student Book ISBN 978 1 74135 229 0
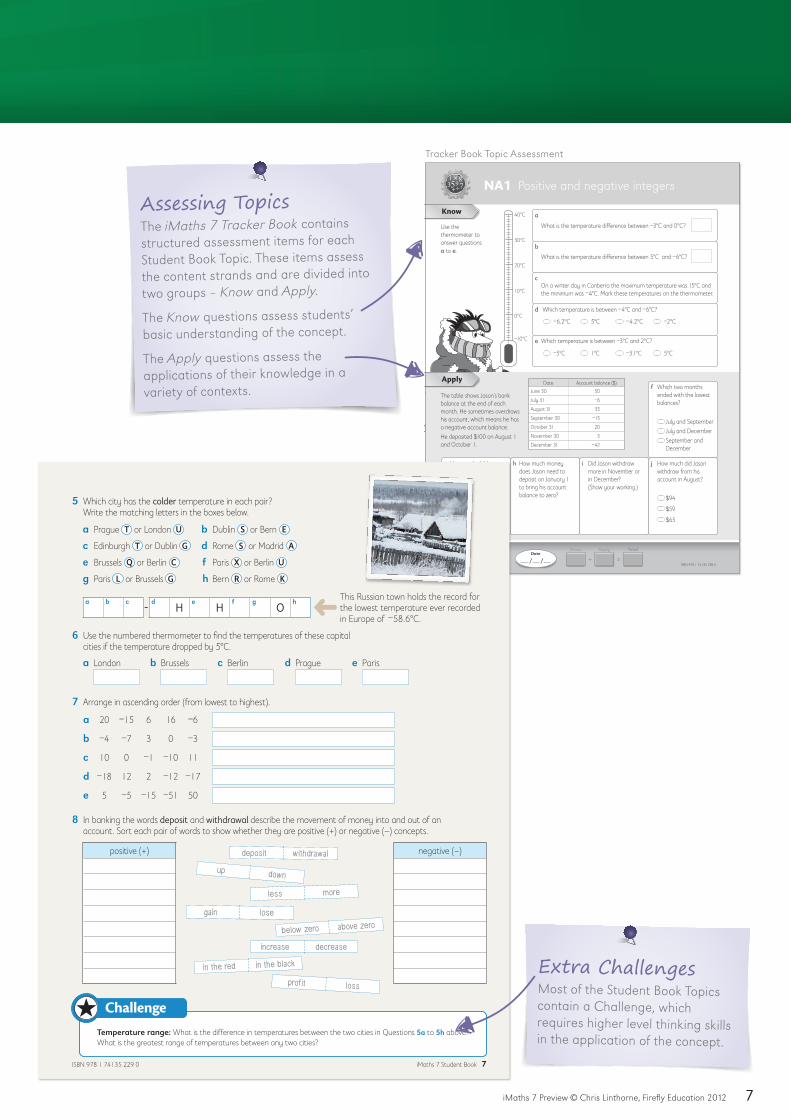
ChallengeTemperature range: What is the difference in temperatures between the two cities in Questions 5a to 5h above? What is the greatest range of temperatures between any two cities?
5 Which city has the colder temperature in each pair? Write the matching letters in the boxes below.
a Prague T or London U
c Edinburgh T or Dublin G
e Brussels Q or Berlin C
g Paris L or Brussels G
b Dublin S or Bern E
d Rome S or Madrid A
f Paris X or Berlin U
h Bern R or Rome K
6 Use the numbered thermometer to find the temperatures of these capital cities if the temperature dropped by 5°C.
a London b Brussels c Berlin d Prague e Paris
7 Arrange in ascending order (from lowest to highest).
a 20 –15 6 16 –6
b –4 –7 3 0 –3
c 10 0 –1 –10 11
d –18 12 2 –12 –17
e 5 –5 –15 –51 50
8 In banking the words deposit and withdrawal describe the movement of money into and out of an account. Sort each pair of words to show whether they are positive (+) or negative (–) concepts.
positive (+) negative (–)
gain lose
in the red in the black
profit loss
deposit withdrawal up down
less more
increase decrease
below zero above zero
This Russian town holds the record for the lowest temperature ever recorded in Europe of –58.6°C.
a b c - dH
eH
f gO
h
ISBN 978 1 74135 229 0 iMaths 7 Student Book 7
Assessment.
learn the maths concepts necessary to complete the
TERM 1
Investigation, Topics and Problem Solving Tasks
NA1 Positive and negative integers NA2 Add and subtract integersProblem solving task 1: Positives and negativesNA3NA4NA5NA6SP1SP2 SP3 HistogramsSP4 Stem and leaf plotsSP5 Average – the meanSP6 Mean, median and modeSP7 Mean vs medianINVESTIGATION 1: How mean are you? NA7NA8Problem solving task 2: What’s your speed? NA9 Best buysProblem solving task 3: Cheaper by the dozensTerm assessment

6 iMaths 7 Preview © Chris Linthorne, Firefly Education 2012
Plan | Teach | Investigate | Assess
NA1 Positive and negative integers
0
1 Label this number line from –10 to +10.
a –9 or +9 b –7 or +3 c +1 or –10
d +2 or –5 e –4 or 0
2 Circle the number with greater value in each pair.
a –1 to –6 b –8 to 0 c +5 to –5
d 0 to +7 e +4 to –10
3 Use the number line above to work out the difference between each pair.
4 On a cold winter day, the following temperatures were recorded in some capital cities of Europe. Label the thermometer with the ten capital city temperatures.
Edinburgh -12
Bern 8
London -5
Rome 15
Dublin -9
Madrid 21
Brussels 0Berlin -3
Paris 2 Prague 5
30°
20°
10°
0°
–10°
–20°
Madrid
Integers are whole numbers. They include positive and negative numbers and zero. On a number line, the numbers to the right of zero are called positive numbers and their opposites to the left of zero are called negative numbers. Zero is neither positive nor negative.
6 iMaths 7 Student Book ISBN 978 1 74135 229 0
The iMaths 7 Topics comprehensively address the three content strands of the Australian Curriculum – Number and Algebra, Measurement and Geometry, and Statistics and Probability.
allows students to progressively develop their
that understanding, and how it is applied.
NA1 Positive and negative integers and its
Student Book
Need help teaching the Topics?
Teacher Book iMaths 7 Teacher Book
Answers to all Student Book activities are provided in the
also given for Problem Solving
Book activities.
iMaths Online has projectable versions of all
compatible with digital projectors and electronic whiteboards.
which can be projected for scaffolded teaching sessions.
Australian Curriculum covered!
iMaths 7 Preview © Chris Linthorne, Firefly Education 2012 7
Know
/ /Date
Know
+
Apply
=
Total
Apply
NA1 Positive and negative integers
The table shows Jason’s bank balance at the end of each month. He sometimes overdraws his account, which means he has a negative account balance.He deposited $100 on August 1 and October 1.
Date Account balance ($)June 30 50
July 31 –6
August 31 35
September 30 –15
October 31 20
November 30 5
December 31 –42
f Which two months ended with the lowest balances?
July and September July and December September and
December
j How much did Jason withdraw from his account in August?
$94
$59
$65
i Did Jason withdraw more in November or in December? (Show your working.)
h How much money does Jason need to deposit on January 1 to bring his account balance to zero?
g How much did Jason withdraw from his account in July?
$56
$4
$44
a
What is the temperature difference between –3°C and 0°C?
b
What is the temperature difference between 5°C and –6°C?
d Which temperature is between –4°C and –6°C?
c On a winter day in Canberra the maximum temperature was 15°C and
the minimum was –4°C. Mark these temperatures on the thermometer.
e Which temperature is between –3°C and 2°C?
–6.2°C
–5°C
–4.2°C
–3.1°C
5°C
1°C
–2°C
5°C
Use the thermometer to answer questions a to e.
40°C
30°C
20°C
10°C
–10°C
0°C
12 iMaths 7 Tracker Book ISBN 978 1 74135 230 6
ChallengeTemperature range: What is the difference in temperatures between the two cities in Questions 5a to 5h above? What is the greatest range of temperatures between any two cities?
5 Which city has the colder temperature in each pair? Write the matching letters in the boxes below.
a Prague T or London U
c Edinburgh T or Dublin G
e Brussels Q or Berlin C
g Paris L or Brussels G
b Dublin S or Bern E
d Rome S or Madrid A
f Paris X or Berlin U
h Bern R or Rome K
6 Use the numbered thermometer to find the temperatures of these capital cities if the temperature dropped by 5°C.
a London b Brussels c Berlin d Prague e Paris
7 Arrange in ascending order (from lowest to highest).
a 20 –15 6 16 –6
b –4 –7 3 0 –3
c 10 0 –1 –10 11
d –18 12 2 –12 –17
e 5 –5 –15 –51 50
8 In banking the words deposit and withdrawal describe the movement of money into and out of an account. Sort each pair of words to show whether they are positive (+) or negative (–) concepts.
positive (+) negative (–)
gain lose
in the red in the black
profit loss
deposit withdrawal up down
less more
increase decrease
below zero above zero
This Russian town holds the record for the lowest temperature ever recorded in Europe of –58.6°C.
a b c - dH
eH
f gO
h
ISBN 978 1 74135 229 0 iMaths 7 Student Book 7
Extra Challenges contain a Challenge, which requires higher level thinking skills in the application of the concept.
Assessing Topics iMaths 7 Tracker Book contains
structured assessment items for each
the content strands and are divided into
two groups – Know and Apply.
Know questions assess students’ basic understanding of the concept.
Apply questions assess the applications of their knowledge in a

8 iMaths 7 Preview © Chris Linthorne, Firefly Education 2012
Plan | Teach | Investigate | Assess
Developing the problem solving performance of students is a major objective of the Australian Curriculum: Mathematics. The ability to solve problems involves the application of previously acquired mathematical skills and processes in new or unfamiliar contexts.
iMaths 7 contains 10 which require students to use strategies
to solve tasks that apply the knowledge taught in the preceding
Problem solving
Explain your calculations and reasoning.
Tricky trianglesPlace the positive and negative numbers in the triangle so that each side totals 1. Use each number once only.
TopicsBefore doing the Problem Solving Task you need to know…NA1 Positive and negative integersNA2 Add and subtract integers
10 iMaths 7 Student Book ISBN 978 1 74135 229 0
The iMaths problem solving strategies1 Guess and check
2 Make a table or chart When confronted with a problem that contains a lot of information or data, the best way to see the information more clearly is to sort the information by drawing a table or chart.
3 Draw a picture or diagram
a visual representation.
Teaching strategies
classroom, enabling whole-class discussions about the appropriate strategies to use.
You’ll find the answers to the
Working! working space for students to

iMaths 7 Preview © Chris Linthorne, Firefly Education 2012 9
Problem solving strategies1 Guess and check
Explain your calculations and reasoning.
Criss crossesHang the numbers –4 to 4 on the cross so that the horizontal line totals 2 and the vertical line totals 2. Use each number once only. The number 4 has been hung for you.
Place the numbers below in the triangle so that each side totals –3. Use each number once only.
Extension task
4
–4 –3 –2 –1 0 1 2 3 4
ISBN 978 1 74135 229 0 iMaths 7 Student Book 11
4 Act out the problem solved by using people and objects, making the problem real or concrete.
5 Find a pattern or use a rule
logical problem solving skills.
6 Check for relevant or irrelevant information
of the information, and placed in a table.
7 Find smaller parts of a large problem
manageable parts.
8 Make an organised list By placing the information in an organised list, all possibilities can be listed and no information will be left out.
9 Solve a simpler problem An easy way to solve these problems with large and
into smaller or simpler ones.
10 Work backwards
the information and systematically working back to solve the problem.
Extension Task
challenge fast finishers.
10 iMaths 7 Preview © Chris Linthorne, Firefly Education 2012
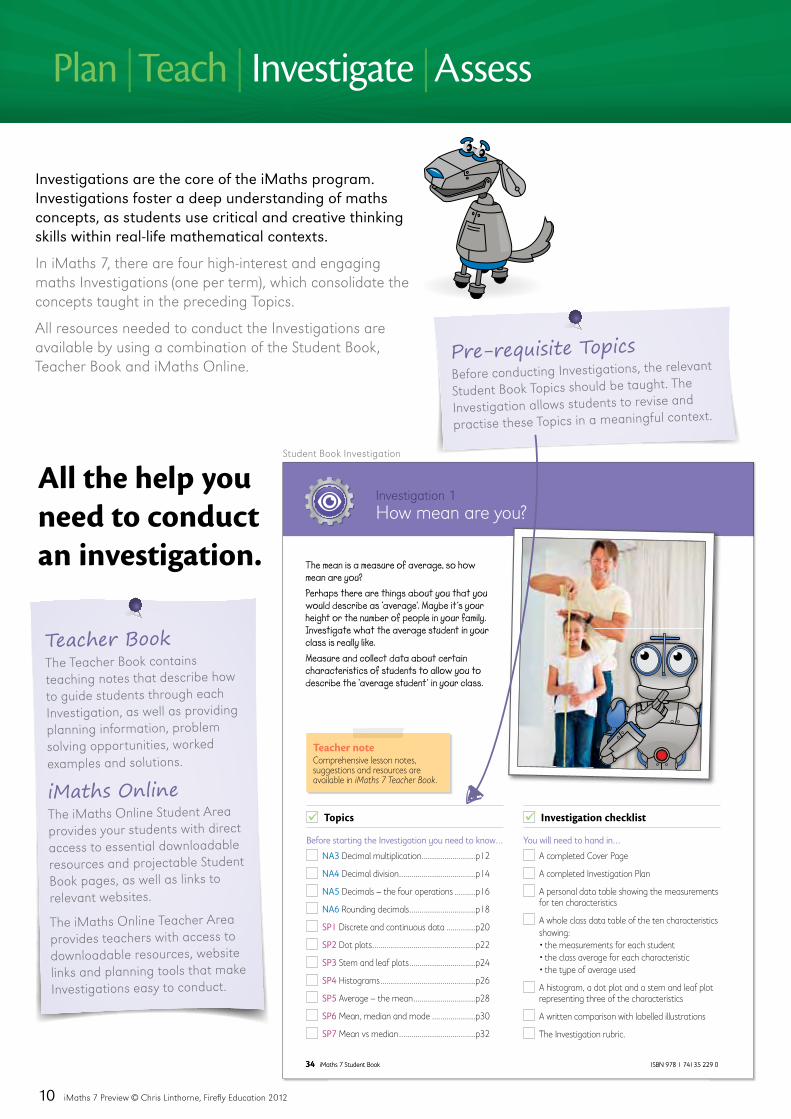
How mean are you?
Topics
Before starting the Investigation you need to know…
NA3 Decimal multiplication ..........................p12
NA4 Decimal division .....................................p14
NA5 Decimals – the four operations ..........p16
NA6 Rounding decimals ................................p18
SP1 Discrete and continuous data ..............p20
SP2 Dot plots ..................................................p22
SP3 Stem and leaf plots ................................p24
SP4 Histograms ..............................................p26
SP5 Average – the mean ..............................p28
SP6 Mean, median and mode .....................p30
SP7 Mean vs median .....................................p32
Investigation checklist
You will need to hand in…
A completed Cover Page
A completed Investigation Plan
A personal data table showing the measurements for ten characteristics
A whole class data table of the ten characteristics showing:
e used
A histogram, a dot plot and a stem and leaf plot representing three of the characteristics
A written comparison with labelled illustrations
The Investigation rubric.
The mean is a measure of average, so how mean are you?Perhaps there are things about you that you would describe as ‘average’. Maybe it’s your height or the number of people in your family. Investigate what the average student in your class is really like. Measure and collect data about certain characteristics of students to allow you to describe the ‘average student‘ in your class.
Teacher noteComprehensive lesson notes, suggestions and resources are available in iMaths 7 Teacher Book.
34 iMaths 7 Student Book ISBN 978 1 74135 229 034 iMaths 7 Student Book ISBN 978 1 74135 229 0
Investigations are the core of the iMaths program. Investigations foster a deep understanding of maths concepts, as students use critical and creative thinking skills within real-life mathematical contexts.
concepts taught in the preceding
available by using a combination of the Student Book,
Plan | Teach | Investigate | Assess
All the help you need to conduct an investigation.
Teacher Book teaching notes that describe how to guide students through each
planning information, problem solving opportunities, worked
iMaths Online provides your students with direct access to essential downloadable resources and projectable Student Book pages, as well as links to relevant websites.
provides teachers with access to downloadable resources, website links and planning tools that make
Pre-requisite Topics

iMaths 7 Preview © Chris Linthorne, Firefly Education 2012 11
Reasoning and reporting6 How mean are you? Create a table to show which characteristics you share with
the ‘average’ student and which characteristics are different. Use all ten characteristics and their measurements.
Use your table to help you write a comparison of yourself with the ‘average’ student. Use some of the compare and contrast linking words from the list below.
Comparison linking words:same, similarly, like, as well as, in the same way, similar to.
Contrast linking words:on the other hand, unlike, but, whereas, however, yet, while, different from.
Illustrate your comparison by creating two labelled drawings, one of yourself, the other of the ‘average’ student.
List some of the ways your investigation could have been improved.
The profiles of five students have been usedto create the characteristics of the ‘average’ student. Unfortunately the data in their profiles has gone missing!Your task is to create original data by providing possible profiles of the five students.Use Tear-out 1 on page 149 to see the characteristics of the ‘average’ student.
Inquiry
ISBN 978 1 74135 229 0
iMaths 7 Student Book 149
Tear-out 1Investigation 1: How mean are you?
Height:
Hair:
Family:
Heart rate:
Shoe size:
Height:
Hair:
Family:
Heart rate:
Shoe size:
Height:
Hair:
Family:
Heart rate:
Shoe size:
Height:
Hair:
Family:
Heart rate:
Shoe size:
Height:
Hair:
Family:
Heart rate:
Shoe size:
family size(mean)3.8
resting heart rate(median)78 bpm
shoe size(median)
6
height(mean)
155 cm
hair(mode)brown
The ‘average’ student
ISBN 978 1 74135 229 0 iMaths 7 Student Book 37
29
Rubric
Overall rating
Teacher comments
Investigation 1
Investigation 1 How mean are you?Step Ability to... A B C D E
Profi
cie
ncy
stra
nds
Und
erst
andi
ng, F
luen
cy a
nd P
robl
em S
olvi
ng
Measure 10 characteristics and record the results in a Personal data table. Identify the data as continuous or discrete.
Accurately measured and recorded all 10 personal characteristics. Used the correct units of measurement for all results. Made no errors when identifying data as discrete or continuous.
Accurately measured and recorded nearly all of the 10 personal characteristics. Needed prompting to use the appropriate units of measurement and to correctly identify data as discrete or continuous.
Made some errors with accuracy and using the correct units of measurement, when measuring and recording the 10 personal characteristics. Needed help to identify data as discrete or continuous.
Needed teacher guidance toaccurately measure and record the 10 personal characteristics using the correct units of measurement. Sought teacher help to identify data as continuous or discrete.
Was unable to use the measuring instruments accurately and record the information required. Did not understand the difference between continuous and discrete data.
Complete a Class data table or spreadsheet.
The data table had an appropriate title. The column and row headings were clear and informative. Entered all data accurately.
Needed prompting to create a workable data table with appropriately labelled columns and rows. Was able to identify and correct any errors made when recording data.
Needed help to design a data table with the appropriate title and labels for the columns and rows. With help, was able to correct any errors made when recording data.
Drew a simple table with columns and rows. Needed teacher guidance to complete the table.
Was unable to create a suitable table and record the information accurately.
Select the appropriate type of average (mean, median or mode) to fi nd the ‘average’ of each of the 10 characteristics.
The most appropriate and relevant type of average (mean, median or mode) was independently selected. All calculations were error free.
With prompting chose the most appropriate and relevant type of average (mean, median or mode). Made very few errors in calculations.
In most cases, chose a suitable type of average (mean, median or mode). Some errors in calculations.
The mean, median or mode appeared to be randomly selected. Calculations contained many errors.
An appropriate mean, median or mode was selected only with extensive teacher support. Was unable to complete any calculations.
Use a histogram, dot plot or stem and leaf plot to appropriately represent the types of data.
Chose the most appropriate graph to display each data set. Each graph followed the correct mathematical rules and clearly and accurately represented all data. Intervals were correct.
Displayed each of the 4 data sets using the appropriate graph types. Needed prompting to calculate the intervals correctly. The graphs represented all the data.
With help, was able to choose the appropriate type of graph to display the 4 class data sets. Needed assistance to calculate the intervals correctly.
Needed teacher guidance to determine the correct method for displaying the data. Needed help to complete the graphs.
Was unable to determine the correct method for displaying the data. Could not understand how to represent the data using a graph.
Reas
onin
g
Use the data collected to write a comparison of yourself with the ‘average’ student.
Used all the data to write a clear, detailed and comprehensive comparison. Made mention of degrees of similarity and difference.
Used most of the data to write a comprehensive comparison. Showed some recognition of degrees of similarity and difference.
Wrote a simple comparison using some of the data.
The comparison was very basic and made only haphazard use of the data collected.
The comparison barely refl ected the data. Made many errors when interpreting the data.
List some ways the Investigation could have been improved.
Identifi ed some improvements. Was able to explain in detail how these would improve the Investigation results.
Identifi ed some improvements. Was able to give an explanation as to how these would improve the Investigation.
Identifi ed some improvements. Was unable to identify any improvements of signifi cance to the Investigation.
Did not identify any improvements.
Inquiry
requiring higher-order thinking
challenge for students.
Explicit Investigations to four pages in the iMaths 7 Student Book to give students all the help they need while they investigate.
Assessing Investigations
students’ proficiency in understanding, fluency, problem solving and reasoning.
understand the criteria by which they will
be assessed and enable self-improvement.
parents informed of their child’s progress.
Family:
Heart rate:
Shoe size:
Height:
Hair:
Family:
Your task is to create original data by providing possible profiles of the five students. on page 149 to see the characteristics of the ‘average’ student.
Family:
Heart rate:
Your task is to create original data by providing possible profiles of the five students. on page 149 to see the characteristics of the ‘average’ student.
MaterialsBLM 1.1 Investigation 1: How mean are you?
Class data table
Name
average
type of average
BLM 1.1 Data table
Calculator
Tape measure
Measuring cups and jugs
Stopwatch
Trundle wheel
Ruler
Scales
Computer
Investigation Overview
1 Carefully read through the Investigation.
2 Make sure you understand the meanings of these words:
average discrete data
mean continuous data
median quantify
mode characteristics
3 Complete the Investigation Plan at imathskids.com.au.
4 Discuss the Investigation Plan with your teacher.
5 Read and discuss the rubric.
6 Identify which steps of the Investigation the criteria in the rubric are describing.
Getting started1 Discrete or continuous? In groups, brainstorm the characteristics of your
classmates that you think are suitable to measure or quantify. Make a list of your favourites.
When you measure people’s characteristics, the results can be classified as discrete or continuous data.
Decide which of your classmates’ characteristics will have measurements that are discrete data, and which will be continuous data.
Record your decisions in a table and share them with the class.
Now, as a class, choose ten of these characteristics to measure. You will also need to agree on the best unit of measurement for each characteristic.
Hint: Make sure you choose some characteristics with measurements that are discrete and some that are continuous.
Go to imathskids.com.au – the Investigation 1 area contains the Investigation Plan, Cover Page, websites and BLMs that you need to complete this Investigation.
Your list could include height, armspan, handspan, length of foot, perimeter of foot, perimeter of head, area of hand, volume of mouth, lung capacity, hair colour, eye colour, etc.
Other choices could include number of hours you sleep per day, resting heart rate, age in years and months, family size, number of brothers, sisters or pets, distance from home to school… use your imagination!
ISBN 978 1 74135 229 0 iMaths 7 Student Book 35
iMaths 7 Student Book 149
Family:
Heart rate:
Shoe size:
Height:
Hair:
Family:
Heart rate:
Shoe size:
Your task is to create original data by providing possible profiles of the five students. on page 149 to see the characteristics of the ‘average’ student.
iMaths 7 Student Book 37