Kinepolis GroupResults Half 1 2015
Analyst & Press Meeting27 August 2015

Business Review Half 1 2015CEO, Mr Eddy Duquenne
2

Key financials€m H1 2015 H1 2014* Better / (Worse)
Visitors (‘000) 9.799 8.827 11,0%
Revenue 130,2 115,1 13,1%
EBITDA 34,8 29,9 16,1%
REBITDA 35,8 30,9 16,0%
REBITDA Margin 27,5% 26,8%
EBIT 23,6 20,2 16,8%
REBIT 24,7 20,8 18,9%
REBIT Margin 19,0% 18,1%
Profit 14,4 13,0 10,7%
Current Profit 15,1 13,4 13,1%
EPS (in €) 0,54 0,49 10,2%
Free Cash Flow 9,3 11,6 (19,2)%
€m 30 Jun 2015 31 Dec 2014 Better / (Worse)
Net Financial Debt (NFD) 153,7 118,6 (35,1) €m
27 augustus 2015
€ 3,66/Vis € 3,50/Vis
3
* H1 2014 restated due to the application of IFRIC 21 as from 1 January 2015

Highlights
27 augustus 2015 4
Revenue growth and further cost efficiency of existing business (excluding 2014 expansion)
Strong contribution to revenue and REBITDA of companies acquiredin 2014
Revenue +13,1% and REBITDA +16,0% with 11% more visitors
Higher interest charges due to prefinancing future expansion

Major events H1 2015 results reflect strategic pillars set out in 2008
Best Marketer Best Cinema Operator Best Property Manager
Further development and implementation of strategy in 2015
Further steps in expansion strategy April 2015: Acquisition cinema building Enschede (the Netherlands) July 2015: Acquisition French cinema Mégaroyal July 2015: Agreement in principle on takeover Utopia Group (13 cinemas in 4
countries: 4 in Belgium, 3 in Luxembourg, 5 in the Netherlands and 1 in France)
27 augustus 2015 5
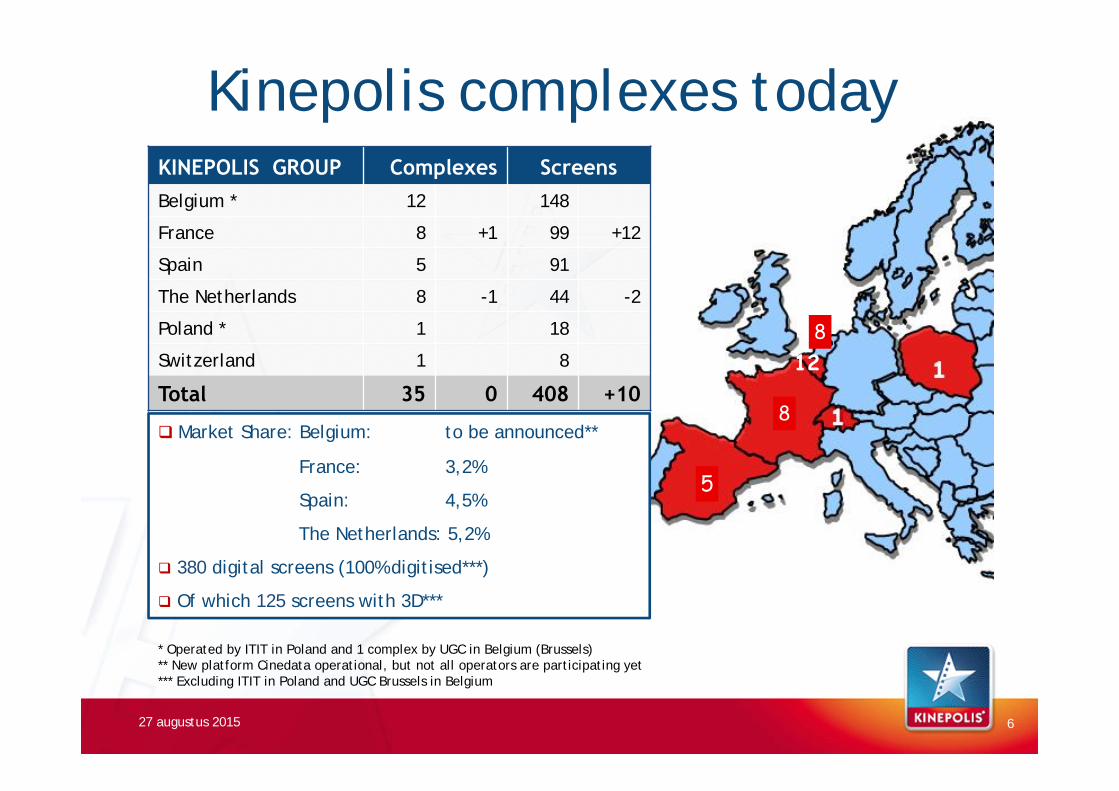
Market Share: Belgium: to be announced**
France: 3,2%
Spain: 4,5%
The Netherlands: 5,2%
380 digital screens (100% digitised***)
Of which 125 screens with 3D***
Kinepolis complexes today
27 augustus 2015
12
* Operated by ITIT in Poland and 1 complex by UGC in Belgium (Brussels) ** New platform Cinedata operational, but not all operators are participating yet*** Excluding ITIT in Poland and UGC Brussels in Belgium
6
8
5
8
KINEPOLIS GROUP Complexes ScreensBelgium * 12 148
France 8 +1 99 +12
Spain 5 91
The Netherlands 8 -1 44 -2
Poland * 1 18
Switzerland 1 8
Total 35 0 408 +10
27 augustus 2015 7
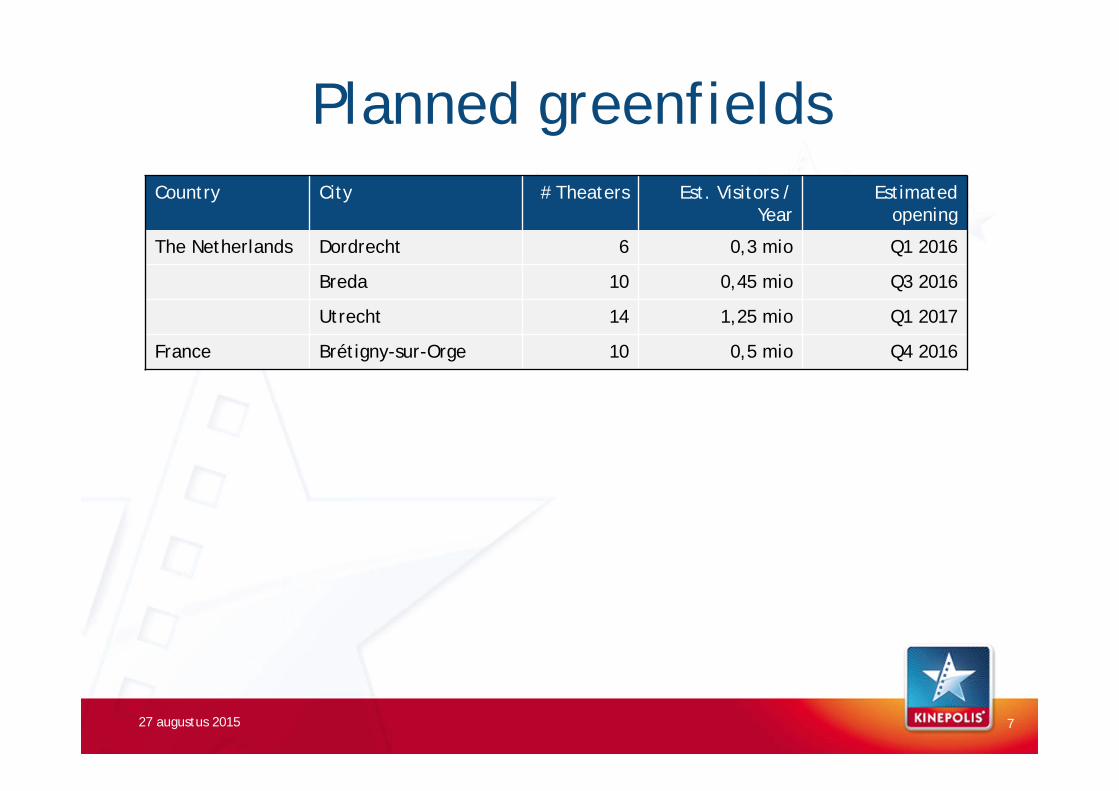
Country City # Theaters Est. Visitors / Year
Estimatedopening
The Netherlands Dordrecht 6 0,3 mio Q1 2016
Breda 10 0,45 mio Q3 2016
Utrecht 14 1,25 mio Q1 2017
France Brétigny-sur-Orge 10 0,5 mio Q4 2016
Planned greenfields

Belgium60,3%France
25,7%
Spain 12,3%
SwitzerlandPoland1,7%
Belgium54,1%
France22,8%
Spain13,9%
The Netherlands
7,4%
SwitzerlandPoland1,8%
Revenue by country
27 augustus 2015
€ 130,2 m
H1 2015H1 2014
€ 115,1 m
8

9
Visitors & MoviesVisitors (000’s) H1 2015 % of Tot H1 2014 % of Tot % Δ YoYBelgium 4.048 41,3% 4.166 47,2% (2,8)%
France 3.015 30,8% 3.064 34,7% (1,6)%
Spain 1.933 19,7% 1.536 17,4% 25,8%
The Netherlands 734 7,5% 0,0 0,0% -
Switzerland 69 0,7% 61 0,7% 13,1%
Total 9.799 100% 8.827 100% 11,0%
27 augustus 2015
Top 5 Movies H1 2015 3D Visitors (000’s)
1. Fast and Furious 7 700
2. Fifty Shades of Grey 635
3. Jurassic World ✓ 586
4. Avengers: Age of Ultron ✓ 494
5. American Sniper 331
Top 5 2.747Weight Top 5 28,0%
Top 5 Movies H1 2014 3D Visitors (000’s)1. Qu’est-ce qu’on a fait au Bon
Dieu?356
2. The Wolf of Wall Street 327
3. Supercondriaque 299
4. Ocho Apellidos Vascos 298
5. Rio 2 ✓ 296
Top 5 1.576Weight Top 5 17,9%
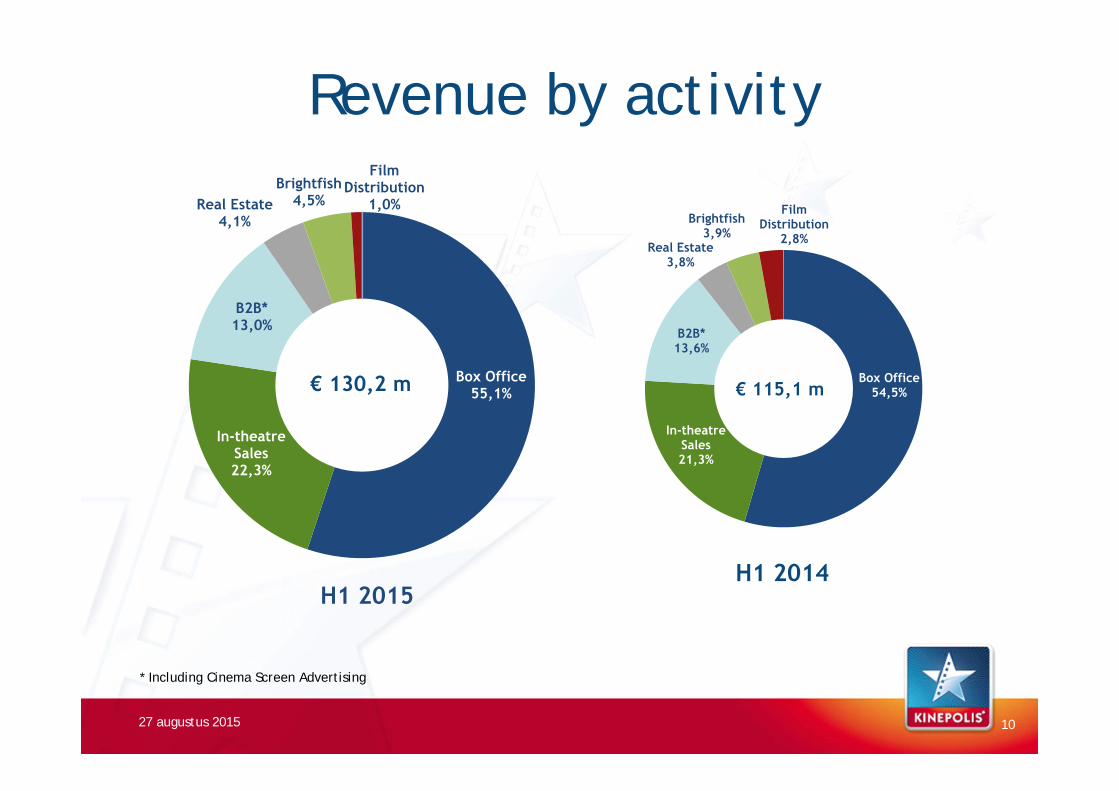
Box Office54,5%
In-theatre Sales21,3%
B2B*13,6%
Real Estate3,8%
Brightfish3,9%
Film Distribution
2,8%
Box Office55,1%
In-theatre Sales22,3%
B2B*13,0%
Real Estate4,1%
Brightfish4,5%
Film Distribution
1,0%
Revenue by activity
27 augustus 2015
€ 130,2 m
H1 2015H1 2014
€ 115,1 m
10
* Including Cinema Screen Advertising

Ratios
27,0% 27,4% 27,9%26,8% 27,5%
17,8%18,9% 19,1%
18,1% 19,0%
10%
15%
20%
25%
30%
35%
2011H1
2012H1
2013H1
2014H1*
2015H1
REBIT & REBITDA
REBITDA Margin REBIT Margin
19,8%21,8%
22,9%
20,9% 20,7%
5%
10%
15%
20%
25%
30%
2011 2012 2013 2014 2015H1*
ROCE
0,57
0,83 0,84
1,13
1,47
0,20
0,60
1,00
1,40
1,80
2011 2012 2013 2014 2015H1
Gearing
27 augustus 2015 11
*: 12 months rolling* H1 2014 restated due to the applicationof IFRIC 21 as from 1 January 2015

27 augustus 2015
€m 31 Jun 2015 31 Dec 2014 Better/(Worse) % Better/(Worse)
Net Financial Debt (NFD) 153,7 118,6 (35,1) (29,6)%
Leverage ratio*: NFD / EBITDA 2,0 1,7
0,0
0,5
1,0
1,5
2,0
2,5
3,0
3,5
€ 0
€ 20
€ 40
€ 60
€ 80
€ 100
€ 120
€ 140
€ 160
€ 180
YE 09 YE 10 YE 11 YE 12 YE 13 H1 14 YE 14 H1 15
Net Financial Debt EBITDA (12M rolling) NFD/EBITDA
3,50 X
* Not Clubdeal definition
12
€m
Net Financial Debt Evolution

Line-up Half 2 2015
27 augustus 2015 13
2D 3D
Major sequels • Mission Impossible – Rogue Nation (Q3)• Ted 2 (Q3) • The Maze Runner: The Scorch Trials (Q3)• The Fantastic Four (Q3) • Spectre (James Bond) (Q4)
• Minions (Q3)• Terminator Genysis (Q3)• The Hunger Games: Mockingjay – Part 2 (Q4)• Star Wars: Episode VII – The Force Awakens (Q4)
New titles • The Martian (Q4)• In the Heart of the Sea (Q4)
• Ant-Man (Q3)• Everest (Q3)• The Good Dinosaur (Q4)
Local • FC De Kampioenen 2 (BE VL, Q4)• Wat Mannen Willen (BE VL, Q4)• Safety First (BE VL, Q4)• Les profs 2 (FR, Q3)• Babysitting 2 (FR, Q4)• Belle et Sébastien: l’Aventure Continue (FR, Q4)• Les nouvelles aventures d’Aladin (FR, Q4)• Asesinos Inocentes (ES, Q3) • Regressión (ES, Q4)• Ja, ik wil (NL, Q4)• Mannenharten 2 (NL, Q4)
• Altrapa la bandera (ES, Q3)
Alternative content • Opera, Ballet • Art: Exhibition on Screen (BE, FR, ES)• E-Sports at the Cinema (BE/FR, Q3)

Financial Review Half 1 2015CFO, Mr Nicolas De Clercq
14

27 augustus 2015
Change in accounting treatment Levies (property taxes) (IFRIC 21)
€m H1 2015 H1 2014As restated
Adjustments H1 2014As previously
reported
Revenue 130,2 115,1 115,1
REBITDA 35,8 30,9 (0,5) 31,4
REBITDA Margin 27,5% 26,8% 27,3%
REBIT 24,7 20,8 (0,5) 21,3
REBIT Margin 19,0% 18,1% 18,5%
Profit 14,4 13,0 (0,3) 13,3
Current Profit 15,1 13,4 (0,3) 13,7
EPS (in €) 0,54 0,49 (0,01) 0,50
15
16
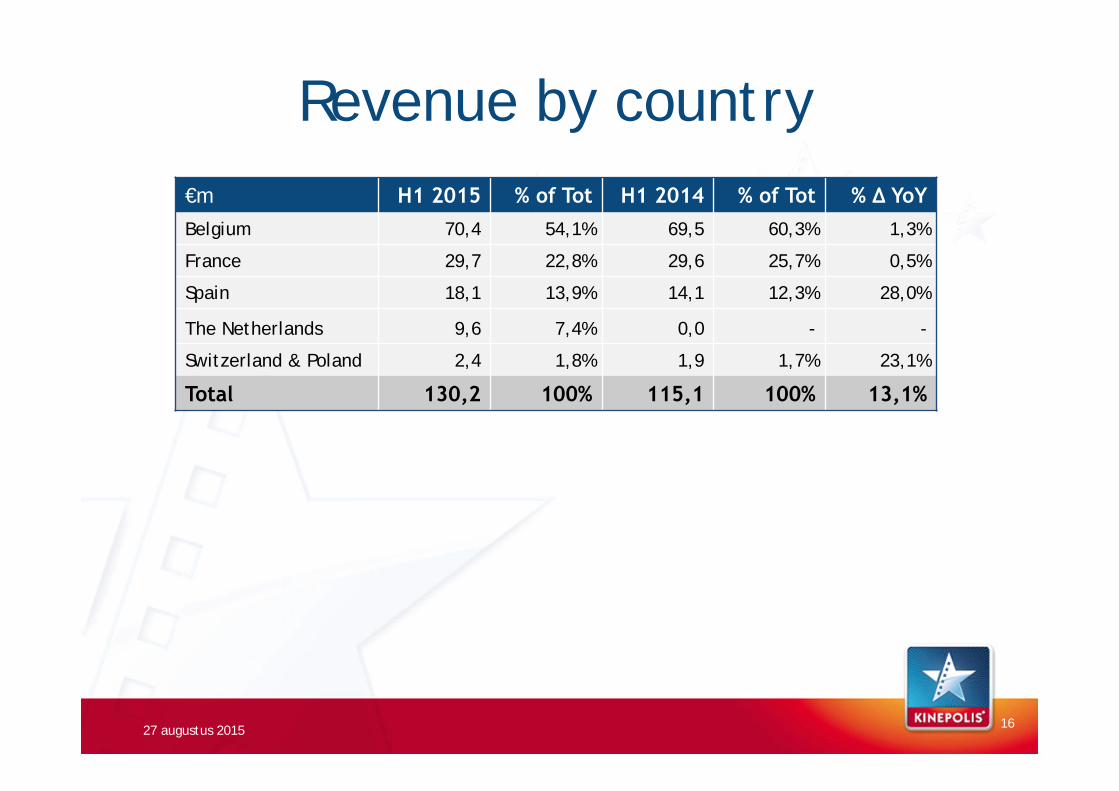
Revenue by country
27 augustus 2015
€m H1 2015 % of Tot H1 2014 % of Tot % Δ YoYBelgium 70,4 54,1% 69,5 60,3% 1,3%
France 29,7 22,8% 29,6 25,7% 0,5%
Spain 18,1 13,9% 14,1 12,3% 28,0%
The Netherlands 9,6 7,4% 0,0 - -
Switzerland & Poland 2,4 1,8% 1,9 1,7% 23,1%
Total 130,2 100% 115,1 100% 13,1%
17
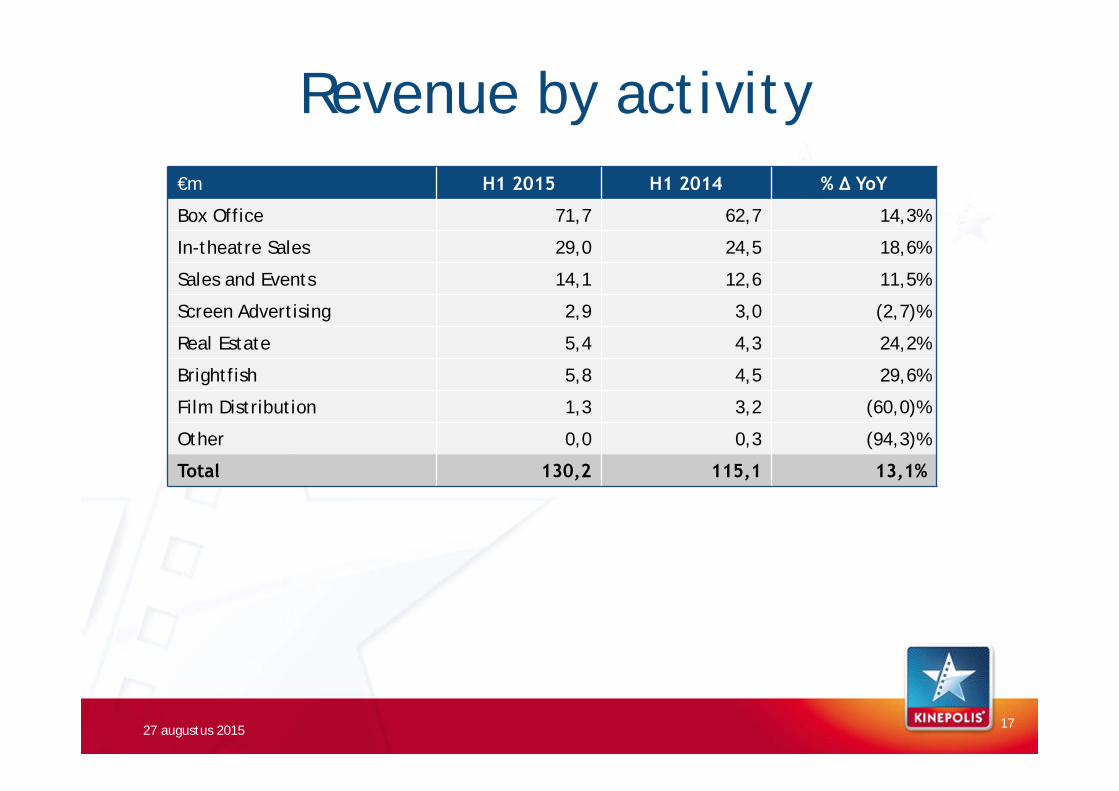
€m H1 2015 H1 2014 % Δ YoY
Box Office 71,7 62,7 14,3%
In-theatre Sales 29,0 24,5 18,6%
Sales and Events 14,1 12,6 11,5%
Screen Advertising 2,9 3,0 (2,7)%
Real Estate 5,4 4,3 24,2%
Brightfish 5,8 4,5 29,6%
Film Distribution 1,3 3,2 (60,0)%
Other 0,0 0,3 (94,3)%
Total 130,2 115,1 13,1%
Revenue by activity
27 augustus 2015

Cinema Revenue
27 augustus 2015 18
58
60
62
64
66
68
70
72
74
H1 2014 H1 2015
Box Office71,7
€m
62,7
22
23
24
25
26
27
28
29
30
H1 2014 H1 2015
In-theatre Sales29,0
€m
24,5 +18,6%+14,3%
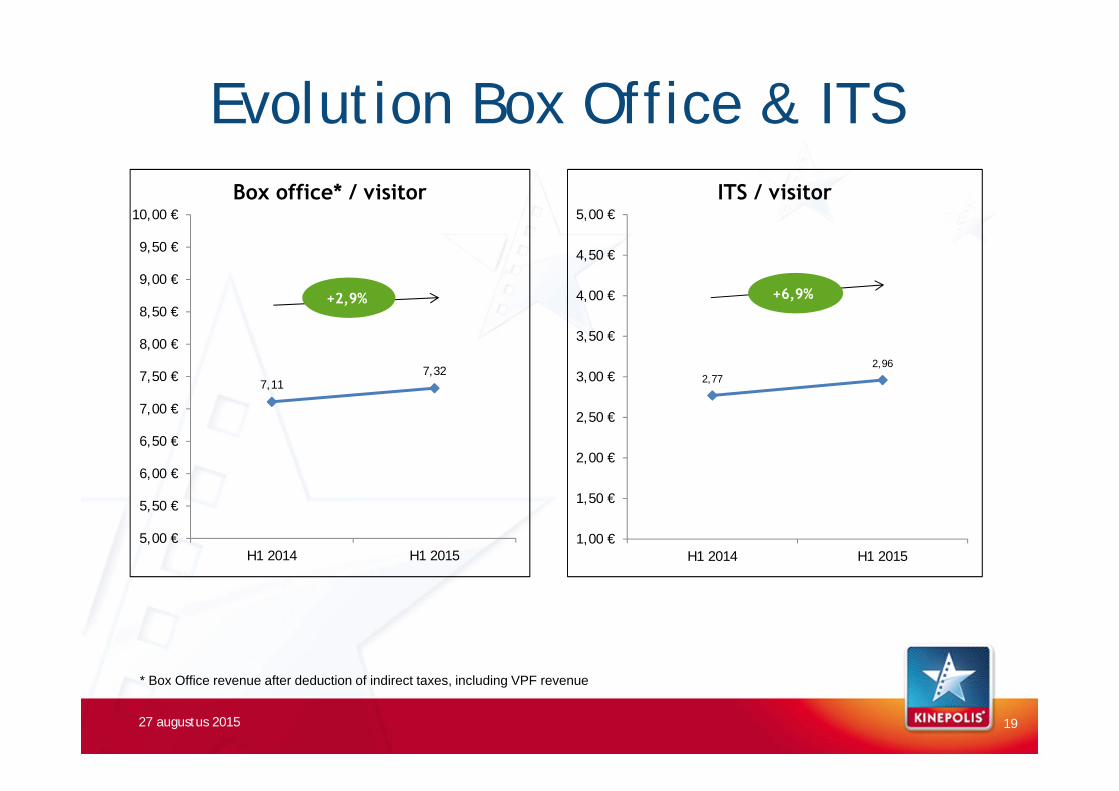
2,772,96
1,00 €
1,50 €
2,00 €
2,50 €
3,00 €
3,50 €
4,00 €
4,50 €
5,00 €
H1 2014 H1 2015
ITS / visitor
+6,9%
7,117,32
5,00 €
5,50 €
6,00 €
6,50 €
7,00 €
7,50 €
8,00 €
8,50 €
9,00 €
9,50 €
10,00 €
H1 2014 H1 2015
Box office* / visitor
+2,9%
Evolution Box Office & ITS
27 augustus 2015 19
* Box Office revenue after deduction of indirect taxes, including VPF revenue

B2B Revenue
27 augustus 2015 20
2
4
6
8
10
12
14
16
H1 2014 H1 2015
Sales & Events*
14,1
€m
12,6
0
1
2
3
4
H1 2014 H1 2015
Screen Advertising*
2,9
€m
3,0 -2,7%+11,5%
* Excluding Brightfish * Excluding Brightfish

0
1
2
3
4
5
6
H1 2014 H1 2015
€m
Real Estate at flat FX
27 augustus 2015 21
4,3 +23,8% 5,4
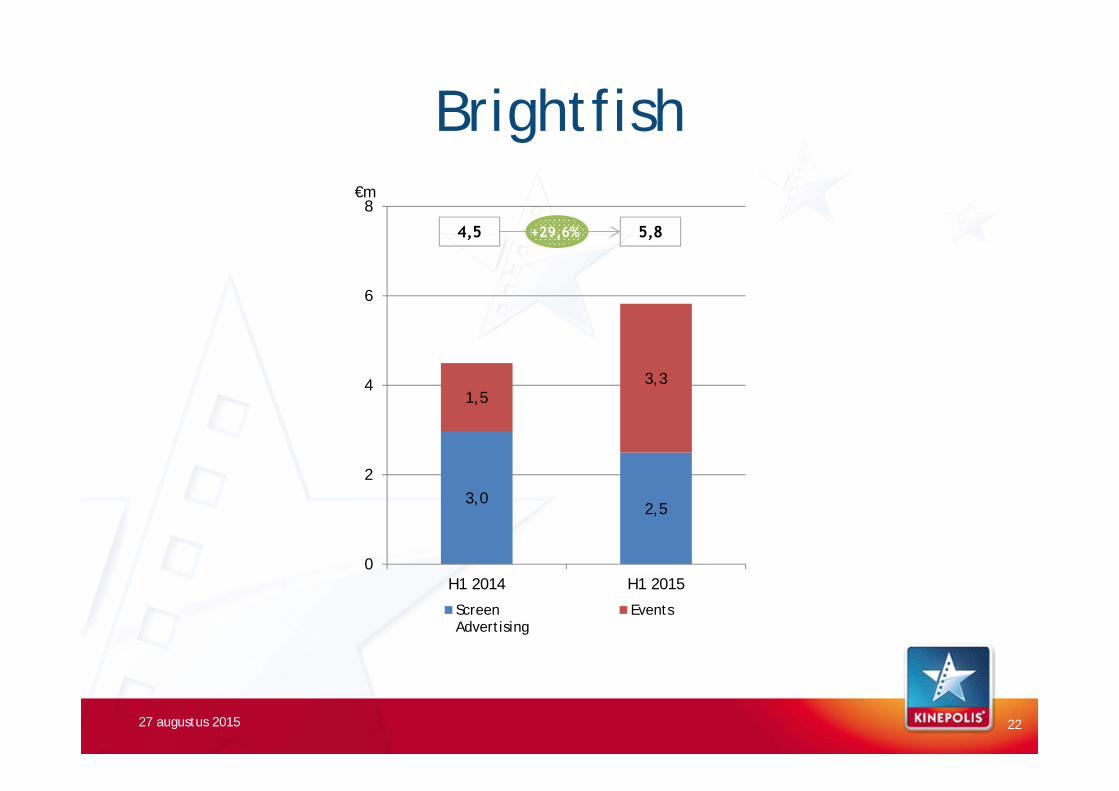
3,0 2,5
1,5 3,3
0
2
4
6
8
H1 2014 H1 2015
ScreenAdvertising
Events
€m
Brightfish
27 augustus 2015 22
4,5 5,8+29,6%
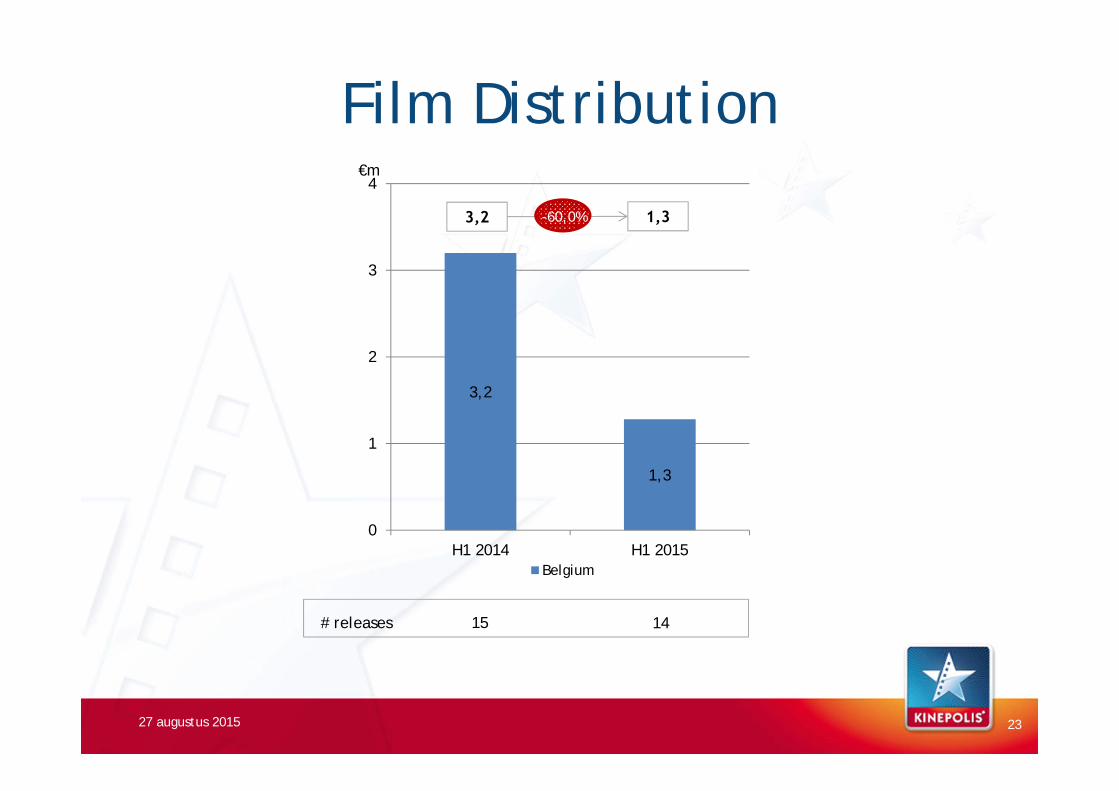
3,2
1,3
0
1
2
3
4
H1 2014 H1 2015Belgium
€m
Film Distribution
27 augustus 2015 23
3,2 1,3
# releases 1415
-60,0%

Operating Costs€m H1 2015 H1 2014 % Better / (Worse)
Marketing & Selling Expenses (6,6) (6,3) (5,2)%
Administrative Expenses (9,0) (7,7) (17,1)%
Other Operating Income/(Costs) 0,4 0,1 161,8%
Total Operating Costs (15,2) (13,8) (10,3)%Non-Current (0,7) (0,4)
Current Operating Costs (14,5) (13,4) (8,2)%
27 augustus 2015 24

5,24
5,69
3,353,69
1,842,10
2,40
3,50 3,66
0,00 €
1,00 €
2,00 €
3,00 €
4,00 €
5,00 €
6,00 €
7,00 €
H1 2014* H1 2015
Belgium** FranceSpain The Netherlands
+4,5%
Evolution REBITDA per Visitor
27 augustus 2015 25
** Excluding corporate entities, KFD, Brightfish revenue
* H1 and H2 2014 restated due to the application of IFRIC 21 as from 1 January 2015

REBITDA by Country
27 augustus 2015
€m H1 2015 % of Total H1 2014* % of Total % Better/(Worse)
Belgium 18,1 50,5% 17,2 55,8% 5,0%
France 11,1 31,0% 10,3 33,2% 8,3%
Spain 4,1 11,4% 2,8 9,1% 44,3%
The Netherlands 1,8 4,9% 0,0 0,0% -
Switzerland & Poland 0,7 2,2% 0,6 1,9% 34,9%
TOTAL 35,8 100,0% 30,9 100,0% 16,0%
26
* H1 2014 restated due to the application of IFRIC 21 as from 1 January 2015

26,8%
29,6%
34,3%
37,2%
27,5%
32,6%
36,9%
38,1%
Total
Switz.& Poland
** TheNetherlands
** Spain
France
Belgium
H1 2015 H1 2014*
28,4%
REBITDA marginexcl. Corporate entities, KFD, Brightfish
27 augustus 2015
* H1 2014 restated due to the application of IFRIC 21 as from 1 January 2015
** REBITDAR (i.e. REBITDA excluding rent for Valencia, Plaza Mar 2 and Alcobendas in Spain and for Dutch complexes) Impact rent added back indicated with dotted lines
27
28,8%32,1%
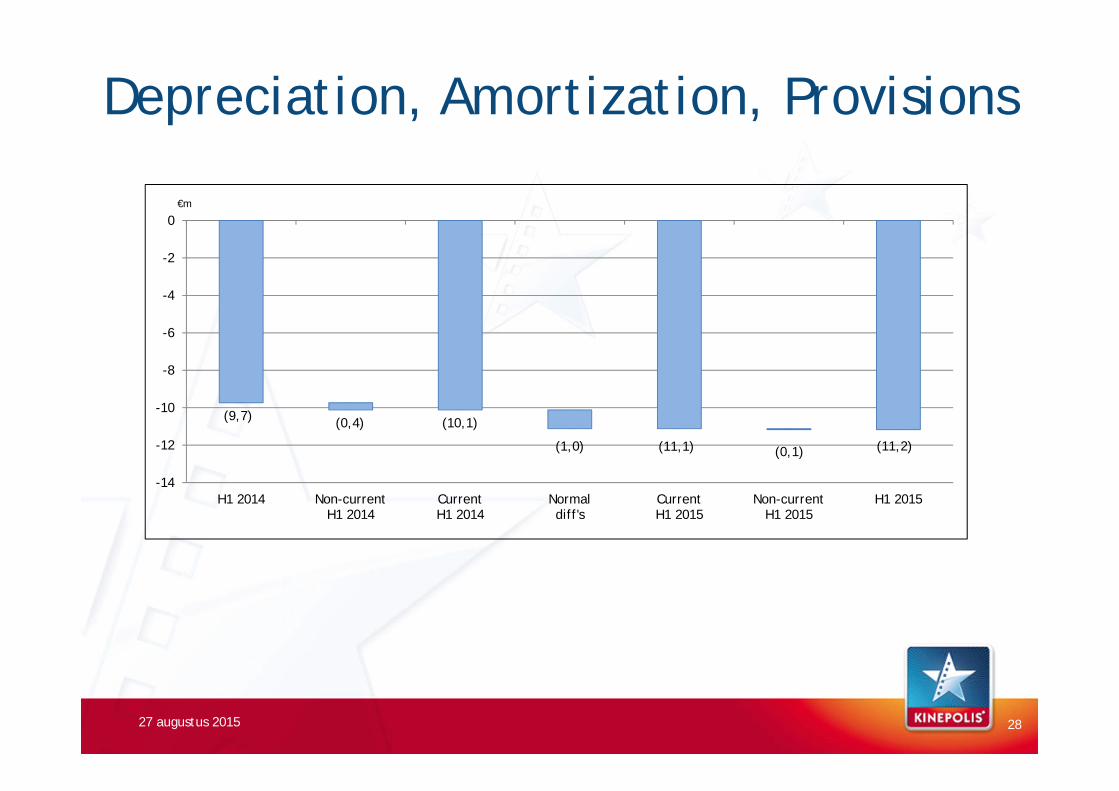
Depreciation, Amortization, Provisions
27 augustus 2015 28
€m
(9,7) (0,4) (10,1)
(1,0) (11,1) (0,1) (11,2)
-14
-12
-10
-8
-6
-4
-2
0
H1 2014 Non-currentH1 2014
CurrentH1 2014
Normaldiff's
CurrentH1 2015
Non-currentH1 2015
H1 2015

REBITDA to Net Result
27 augustus 2015 29
35,8
(11,1)
24,7
(4,1)
(5,5)(0,7)
14,4
0
5
10
15
20
25
30
35
40
REBITDA CurrentDepr,
Amort,Prov
REBIT Currentfinancial
result
Currenttaxes
Non-currentitems
Result H1 2015
€m
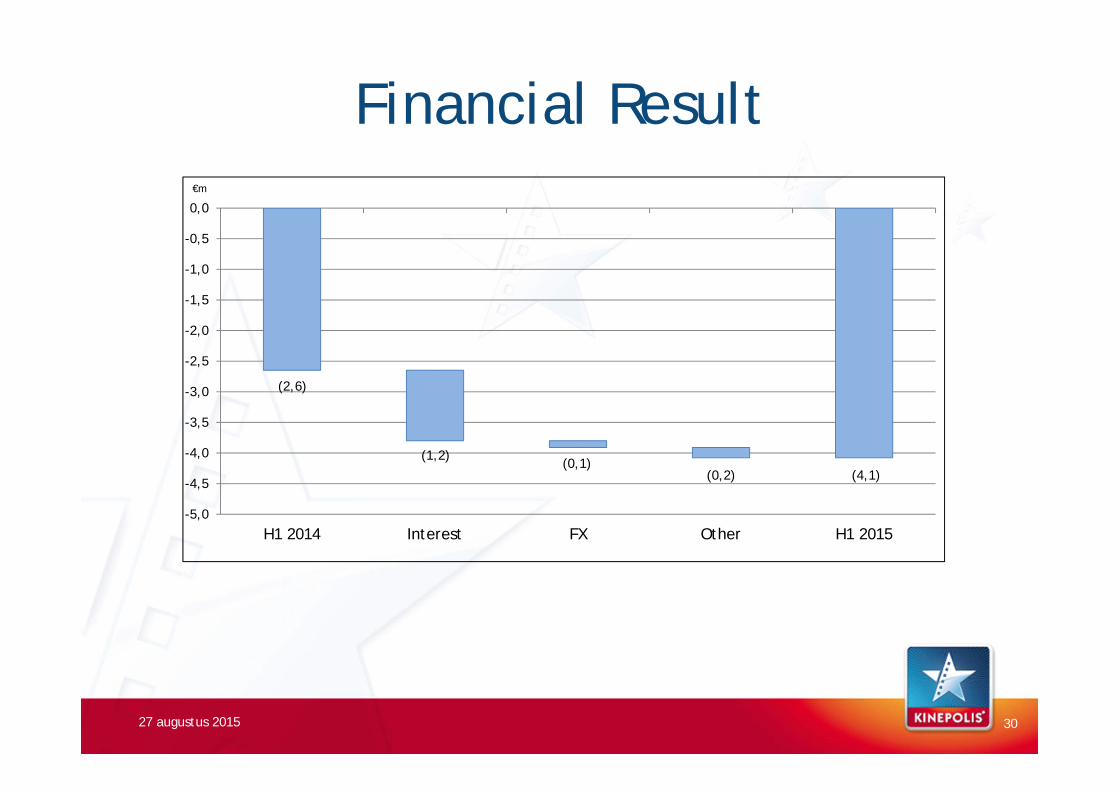
Financial Result
27 augustus 2015 30
(2,6)
(1,2)(0,1)
(0,2) (4,1)
-5,0
-4,5
-4,0
-3,5
-3,0
-2,5
-2,0
-1,5
-1,0
-0,5
0,0
H1 2014 Interest FX Other H1 2015
€m
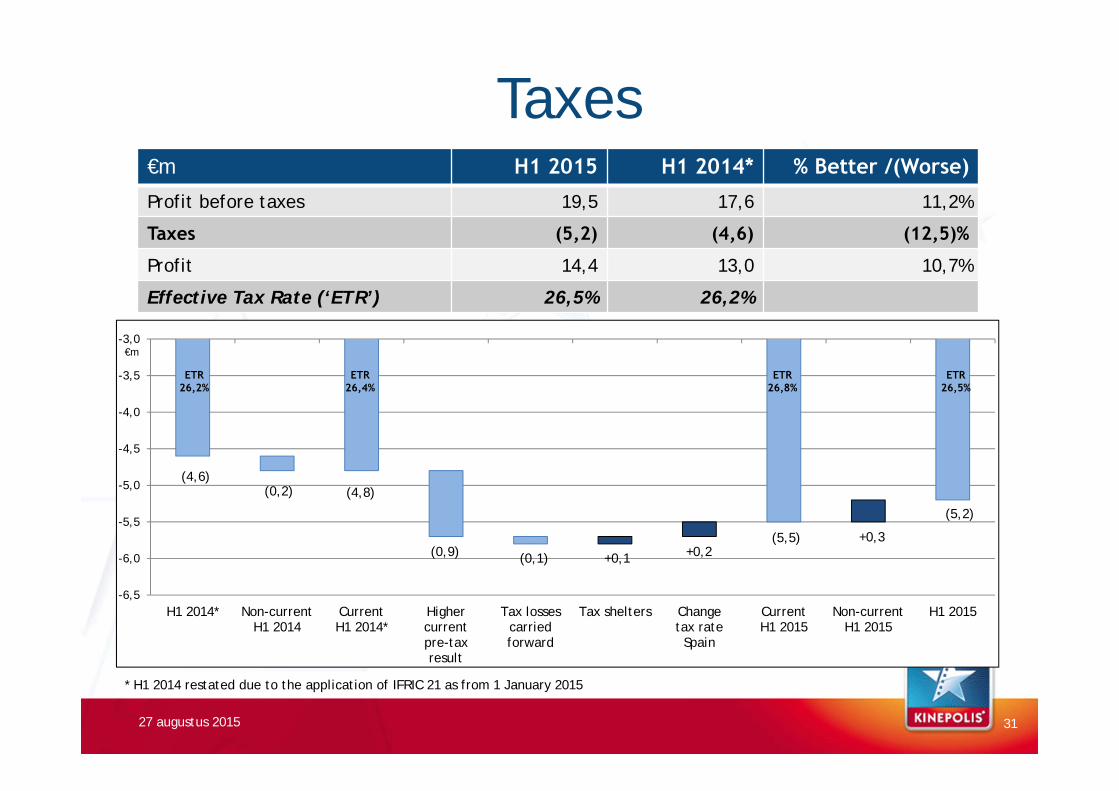
Taxes€m H1 2015 H1 2014* % Better /(Worse)
Profit before taxes 19,5 17,6 11,2%
Taxes (5,2) (4,6) (12,5)%
Profit 14,4 13,0 10,7%
Effective Tax Rate (‘ETR’) 26,5% 26,2%
27 augustus 2015 31
(4,6)(4,8)
+0,3
(0,2)
(0,9) (0,1) +0,1 +0,2(5,5)
(5,2)
-6,5
-6,0
-5,5
-5,0
-4,5
-4,0
-3,5
-3,0
H1 2014* Non-currentH1 2014
CurrentH1 2014*
Highercurrentpre-taxresult
Tax lossescarriedforward
Tax shelters Changetax rateSpain
CurrentH1 2015
Non-currentH1 2015
H1 2015
€m
ETR26,2%
ETR26,4%
ETR26,5%
ETR26,8%
* H1 2014 restated due to the application of IFRIC 21 as from 1 January 2015

Free Cash Flow H1: 2015 vs 2014
27 augustus 2015 32
11,6 +0,3 11,9
+5,1 (5,3)
(3,6)
+1,4 (0,2) 9,3
4
6
8
10
12
14
16
18
20
FCFH1 2014*
WorkingCapital (one-
timers)
Current FCF EBITDA Income TaxPaid
WorkingCapital
Capex -Maintenance
InterestPaid
FCFH1 2015
€m
* H1 2014 restated due to the application of IFRIC 21 as from 1 January 2015

10%3,0 €m
11%3,5 €m
79%25,1 €m
52%4,4 €m
35%3,1 €m
13%1,1 €m
0%
20%
40%
60%
80%
100%
Maintenance Internal Expansion External Expansion
H1 2015 H1 2014
27 augustus 2015
€m H1 2015 H1 2014
Belgium 3,6 4,2
France 1,2 1,4
Spain 1,5 1,8
The Netherlands 0,2 0,0
Other 0,0 0,1
Maintenance & Internal Expansion 6,5 7,5
External Expansion 25,1 1,1
TOTAL 31,6 8,6
33
Investments

Net Financial Debt Evolution
27 augustus 2015
€m 30 Jun 2015 31 Dec 2014 Better/(Worse) % Better/(Worse)
Net Financial Debt (NFD) 153,7 118,6 (35,1) (29,6)%
Leverage ratio*: NFD / EBITDA 2,0 1,7
34
(118,6) +34,1
(8,1)(9,5)
(31,6) (4,1) +0,2 +7,0(23,0) (153,7)
-180
-160
-140
-120
-100
-80
-60
-40
-20
0
NFDYE 2014
EBITDA +other
financialresult
Taxespaid
Workingcapital
Investments Interestpaid
Disposalproceeds
fixedassets
Treasuryshares
Dividends NFDH1 2015
€m
* Not clubdeal definition
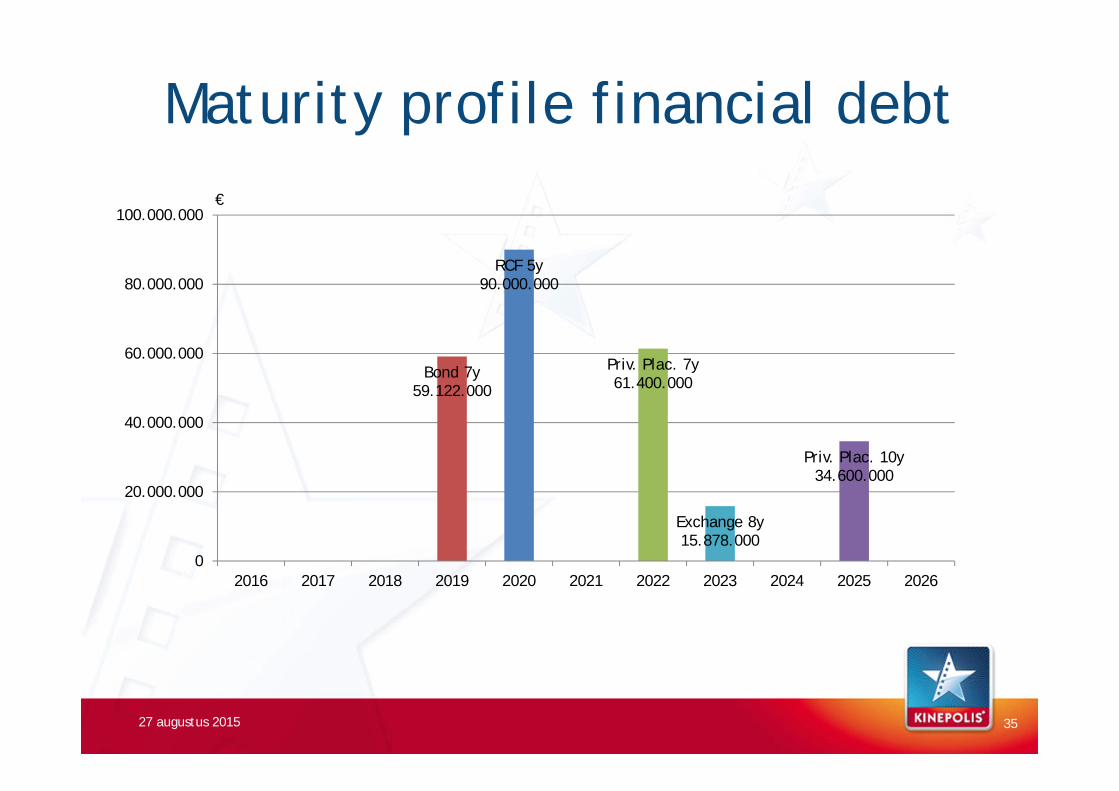
Maturity profile financial debt
27 augustus 2015 35
RCF 5y90.000.000
Bond 7y59.122.000
Priv. Plac. 7y61.400.000
Priv. Plac. 10y34.600.000
Exchange 8y15.878.000
0
20.000.000
40.000.000
60.000.000
80.000.000
100.000.000
2016 2017 2018 2019 2020 2021 2022 2023 2024 2025 2026
€

Balance sheet€m 30 Jun
2015% of Total
31 Dec2014
% of Total
€m 30 Jun2015
% of Total
31 Dec2014
% of Total
Intangible assets 4,5 1% 4,0 1% Equity 104,7 28% 104,7 30%
Goodwill 35,9 10% 36,1 10% LT financial debt 179,9 48% 91,5 26%
Land & buildings 218,0 58% 197,1 57% Provisions(1) 2,6 1% 2,5 1%
Other fixed assets 51,2 14% 50,9 15% Deferred taxes 15,4 4% 15,9 5%
Deferred taxes 1,2 0% 1,3 0% Other payables 8,0 2% 7,3 2%
Other receivables 12,9 3% 12,7 4% Derivatives 0,0 0% 0,0 0%
Non-current assets 323,7 86% 302,1 87% Non-current liabilities 205,9 55% 117,2 34%
Assets held for sale 0,0 0% 0,0 0% ST financial debt 3,6 1% 44,6 13%
Working capital 23,0 6% 27,5 8% Provisions 0,6 0% 0,6 0%
Current taxes 0,3 0% 0,1 0% Working capital 56,8 15% 72,3 21%
Financial assets 0,5 0% 0,4 0% Current taxes 5,3 1% 7,7 2%
Cash & cash equivalents 29,4 8% 17,0 5% Derivatives 0,0 0% 0,0 0%
Current assets 53,2 14% 45,0 13% Current liabilities 66,3 17% 125,2 36%
Assets 376,9 100% 347,1 100% Equity & Liabilities 376,9 100% 347,1 100%
27 augustus 2015 36
(1): Including employee benefits liabilities
*: Gearing ratio: Net Financial Debt / Equity**: Current ratio: Current Assets / Current Liabilities***: Solvency ratio: Total Equity / Total Equity & Liabilities****: ROCE: Current operating profit / Capital employed
30 Jun2015
31 Dec2014
Gearing ratio* 1,47 1,13
Current ratio** 0,80 0,36
Solvency ratio*** 27,8% 30,2%
ROCE***** 20,7% 20,9%

Shareholders26/08/2015 23/02/2015
# Shares % # Shares %
Total shares outstanding 27.365.197 100 % 27.365.197 100 %
27 augustus 2015
* Resulting from transparency notices received
Other* # Shares % # Shares %Axa SA 1.523.555 5,57% 1.523.555 5,57%
BNP Paribas Investment Partners SA 1.406.080 5,14% 1.406.080 5,14%
Refence Shareholders & Free Float # Shares % # Shares %Kinohold Bis and Mr. Joost Bert 13.254.590 48,44% 12.908.050 47,17%
Treasury shares (Own shares) 269.221 0,98% 1.553.591 5,68%
Free Float 13.841.386 50,58% 12.903.556 47,15%
37

Financial Calendar
27 augustus 2015
Tuesday 17/11/2015 Business update Q3 2015
Thursday 18/02/2016 Analyst and Press Meeting FY 2015
Wednesday 11/05/2016 Business update Q1 2016
Wednesday 11/05/2016 Annual Shareholders’ Meeting
38

AnnexesFinancial Statements
Results H1 2015
39

Consolidated Income Statement€m H1 2015 H1 2014* % Better /
(Worse)Revenue 130,2 115,1 13,1%
Cost of sales (91,4) (81,1) (12,6)%
Gross profit 38,8 34,0 14,2%
Gross profit % 29,8% 29,6%
Marketing & selling expenses (6,6) (6,3) (5,2)%
Administrative expenses (9,0) (7,7) (17,1)%
Other operating income and expenses 0,4 0,1 161,8%
EBIT 23,6 20,2 16,8%
EBIT % 18,1% 17,6%
Financial result (4,1) (2,6) (54,0)%
Profit before tax 19,5 17,6 11,2%
Income tax expense (5,1) (4,6) (12,5)%
Profit 14,4 13,0 10,7%
Profit % 11,0% 11,3%
EBITDA 34,8 30,0 16,1%
EBITDA % 26,7% 26,0%
27 augustus 2015 40
* H1 2014 restated due to the application of IFRIC 21 as from 1 January 2015

Consolidated Balance Sheet (1)€m 30/06/2015 31/12/2014 % Better /
(Worse)Intangible assets 4,5 4,0 11,1%
Goodwill 35,9 36,1 (0,6)%
Property, plant & equipment 236,7 215,4 9,9%
Investment property 32,5 32,6 (0,5)%
Deferred tax assets 1,2 1,3 (5,2)%
Other receivables 12,9 12,7 2,2%
Other financial assets 0,0 0,0 0,0%
Total non-current assets 323,7 302,1 7,2%
Inventories 3,6 3,6 (2,3)%
Trade & other receivables 19,8 24,3 (18,4)%
Current income taxes 0,3 0,1 587,5%
Cash & cash equivalents 29,4 17,0 73,0%
Derivatives 0,1 0,0 144,4%
Assets held for sale 0,0 0,0 0,0%
Total current assets 53,2 45,0 18,1%
TOTAL ASSETS 376,9 347,1 8,6%
27 augustus 2015 41

Consolidated Balance Sheet (2)€m 30/06/2015 31/12/2014 % Better /
(Worse)Capital & share premium 20,1 20,1 0,0%
Consolidated reserves 84,9 86,3 (1,7)%
Translation differences (0,3) (1,7) 83,8%
Equity attributable to equity holders of the parents 104,7 104,7 (0,1)%
Non-controlling interests 0,0 0,0 0,0%
Total equity 104,7 104,7 (0,1)%
Interest bearing loans & borrowings 179,9 91,5 96,7%
Provisions & employee benefits 2,6 2,5 3,8%
Deferred tax liabilities 15,4 15,9 (2,6)%
Other payables 8,0 7,3 7,9%
Total non-current liabilities 205,9 117,2 75,7%
Interest bearing loans & borrowings & bank overdrafts 3,6 44,6 (92,0)%
Trade & other payables 56,8 72,3 (22,1)%
Provisions & employee benefits 0,6 0,6 (7,9)%
Derivatives 0,0 0,0 0,0%
Current income tax liabilities 5,3 7,7 (31,1)%
Total current liabilities 66,3 125,2 (47,0)%
TOTAL EQUITY & LIABILITIES 376,9 347,1 8,6%
27 augustus 2015 42
27 augustus 2015
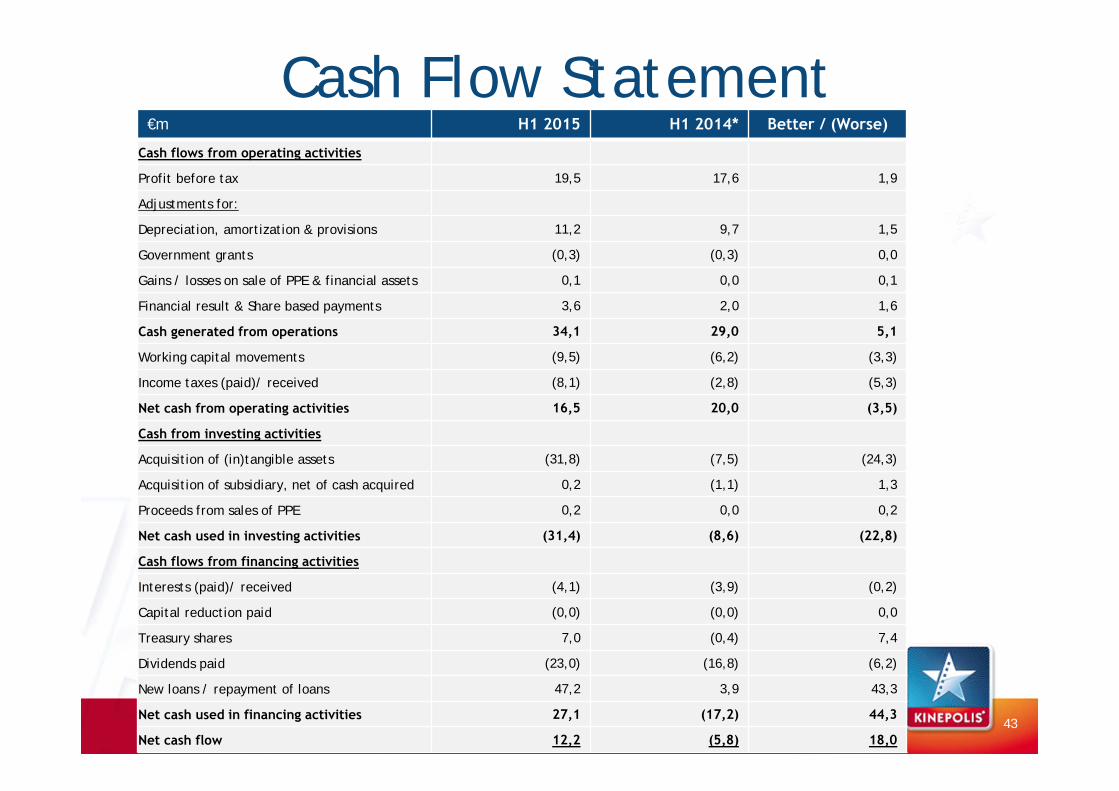
Cash Flow Statement€m H1 2015 H1 2014* Better / (Worse)
Cash flows from operating activities
Profit before tax 19,5 17,6 1,9
Adjustments for:
Depreciation, amortization & provisions 11,2 9,7 1,5
Government grants (0,3) (0,3) 0,0
Gains / losses on sale of PPE & financial assets 0,1 0,0 0,1
Financial result & Share based payments 3,6 2,0 1,6
Cash generated from operations 34,1 29,0 5,1
Working capital movements (9,5) (6,2) (3,3)
Income taxes (paid)/ received (8,1) (2,8) (5,3)
Net cash from operating activities 16,5 20,0 (3,5)
Cash from investing activities
Acquisition of (in)tangible assets (31,8) (7,5) (24,3)
Acquisition of subsidiary, net of cash acquired 0,2 (1,1) 1,3
Proceeds from sales of PPE 0,2 0,0 0,2
Net cash used in investing activities (31,4) (8,6) (22,8)
Cash flows from financing activities
Interests (paid)/ received (4,1) (3,9) (0,2)
Capital reduction paid (0,0) (0,0) 0,0
Treasury shares 7,0 (0,4) 7,4
Dividends paid (23,0) (16,8) (6,2)
New loans / repayment of loans 47,2 3,9 43,3
Net cash used in financing activities 27,1 (17,2) 44,3
Net cash flow 12,2 (5,8) 18,043

Free Cash Flow€m H1 2015 H1 2014* Better /
(Worse)Cash Flow before WC movements & tax paid 34,1 29,0 5,1
Income taxes paid (8,1) (2,8) (5,3)
Working capital (9,5) (6,2) (3,3)
Capital exp – maintenance (3,1) (4,5) 1,4
Interest paid (4,1) (3,9) (0,2)
Free cash flow 9,3 11,6 (2,3)
Capital exp - digitalization, expansion, remodeling (28,7) (3,0) (25,7)
Proceeds from of PPE 0,2 0,0 0,2
Capital reduction paid (0,0) (0,0) 0,0
Acquisition of subsidiary, net of cash acquired 0,2 (1,1) 1,3
Treasury shares 7,0 (0,4) 7,4
Dividend payments (23,0) (16,8) (6,2)
CF after expansion exp, dividends & treasury shares
(35,0) (9,7) (25,3)
27 augustus 2015 44
* H1 2014 restated due to the application of IFRIC 21 as from 1 January 2015