Sensitivity: General
Preparing for Technological Change in the Infrastructure Sector
Prepared for New Zealand
Infrastructure Commission, Te
Waihanga
Prepared by Beca Limited &
Polis Consulting Group Ltd
31 May 2021
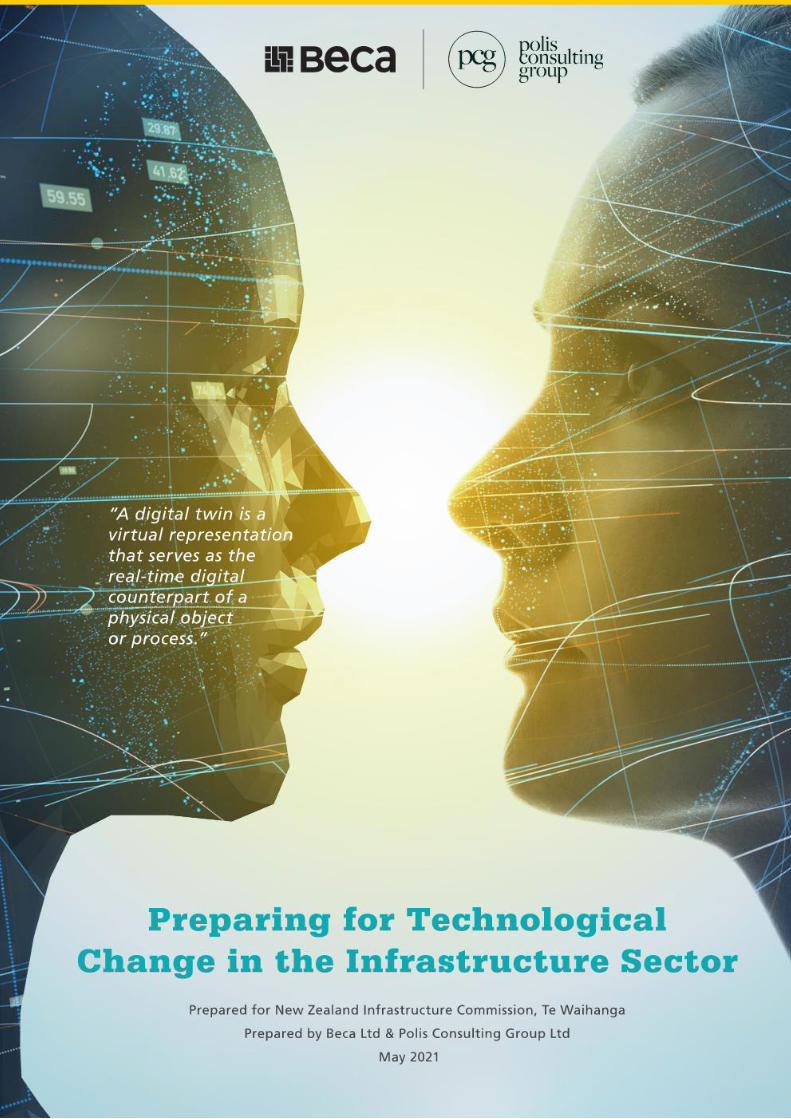
“A digital twin is a virtual
representation that serves as the
real-time digital counterpart of a
physical object or process.”

| Preparing for Technological Change in the Infrastructure Sector |
Preparing for Technological Change in the Infrastructure Sector | 3821960-1147589789-62 | 31/05/2021 | i
Te Kaiwhakatere / Te Ao Māori Navigator:
John Blyth (Beca)
Authors:
Kieran Brown (Polis Consulting Group)
David Cunliffe (Polis Consulting Group)
Matt Ensor (Beca)
Jerry Khoo (Beca)
Acknowledgements:
The project team would like to acknowledge the contributions of more than fifty sector experts who gave their
time to provide insights that were very relevant to the development of the project recommendations.
Document Acceptance
Role Name Signed Date
Te Kaiwhakatere J Blyth
31st May 2021
Author K Brown
31st May 2021
Author D Cunliffe
31st May 2021
Author M Ensor
31st May 2021
Author J Khoo
31st May 2021
on behalf of Beca Limited in association with Polis Consulting Group Ltd

| |
Preparing for Technological Change in the Infrastructure Sector | 3821960-1147589789-62 | 31/05/2021 | ii
Table of Contents
Table of Contents ........................................................................................................................................ ii
1 Preparing for technological change in the infrastructure sector ............................ 5
Executive Summary ......................................................................................................................... 5
Introduction ...................................................................................................................................... 9
Te Ao Māori ................................................................................................................................... 10
Preparing for Technological Change: A Mission-Led Approach.................................................... 13
The Character of Infrastructure...................................................................................................... 15
Research methodology .................................................................................................................. 16
2 Global technological scanning and sensing ........................................................... 19
30-year horizon for technological change: dealing with deep uncertainty ..................................... 19
International policy and regulatory scanning ................................................................................. 21
Global scanning of incremental and disruptive technologies ........................................................ 31
Barriers to Technology Adoption ................................................................................................... 34
Case studies .................................................................................................................................. 35
3 Infrastructure technological performance and needs ............................................ 38
Infrastructure sector technological performance ........................................................................... 38
A low-carbon New Zealand by 2050 .............................................................................................. 48
4 Direct and indirect impact analysis ......................................................................... 53
Direct impacts on infrastructure ..................................................................................................... 53
Four well-beings analysis .............................................................................................................. 59
Indirect impacts on infrastructure .................................................................................................. 60
5 Policy and regulatory considerations: preparing for technological change ........ 63
Policy and regulatory implications ................................................................................................. 63
Managing dynamism and uncertainty in a digital age ................................................................... 64
Public policy and wellbeing ............................................................................................................ 66
National system-level direction ...................................................................................................... 68
Mission-led policy to address challenges in the infrastructure sector ........................................... 69
Digital Strategy .............................................................................................................................. 73
Digital regulation ............................................................................................................................ 75
Digital citizenship ........................................................................................................................... 77
Ownership of data .......................................................................................................................... 79
Procurement .................................................................................................................................. 82
6 Recommendations for Te Waihanga 30-year strategy ........................................... 86
Synthesis of core emerging issues ................................................................................................ 86
Strategic recommendations on preparing for technological change in the infrastructure sector .. 88
© Beca & Polis Consulting Group 2021.
This report has been prepared by Beca & Polis Consulting Group on the specific instructions of our Client. It is solely for our Client’s use for the purpose for which it is
intended in accordance with the agreed scope of work. Any use or reliance by any person contrary to the above, to which Beca has not given its prior written consent,
is at that person's own risk.
| |
Preparing for Technological Change in the Infrastructure Sector | 3821960-1147589789-62 | 31/05/2021 | iii
Appendix A – Incremental and disruptive technologies .............................................. 97
Appendix B – Infrastructure performance ................................................................... 127
Appendix C – Case studies ........................................................................................... 141
Case study – Digital twins for application to the infrastructure lifecycle ................................................ 141
Case study – Digitalisation of the health sector ..................................................................................... 145
Appendix D – Direct impacts on infrastructure ........................................................... 149
Cross-sector direct impacts ................................................................................................................... 149
Sector specific direct impacts ................................................................................................................ 157
Appendix E – Indirect Analysis .................................................................................... 163
References ..................................................................................................................... 170

| Preparing for technological change in the infrastructure sector |
Preparing for Technological Change in the Infrastructure Sector | 3821960-1147589789-62 | 31/05/2021 | 4
Preparing for technological change in the infrastructure sector
1

| Preparing for technological change in the infrastructure sector |
Preparing for Technological Change in the Infrastructure Sector | 3821960-1147589789-62 | 31/05/2021 | 5
1 Preparing for technological change in the infrastructure sector
Executive Summary
The Commission (Te Waihanga) and the Government have had the foresight to invest in a 30-year horizon for
infrastructure strategy. Technological change has been identified as one of the major trends for consideration.
This research study supports that effort.
Shaping the future: The Government expects to spend over $21bn in the short to medium term, with over
500 projects already in the pipeline.1 This is in addition to the billions in commitment via the Land Transport
Policy Statement, Provincial Growth Fund (PGF) and other sector specific funds. This is a significant,
potentially market and economy shaping financial envelope. UCL economist Professor Mariana Mazzucato
has observed that “Innovation has a rate, but it also has a direction, and that can be actively shaped”. This is
to say there is an opportunity, should the Crown and industry wish to take it, to influence the directionality of
infrastructure toward a more technologically prepared and innovative future.
The current state: At present, the infrastructure sector is not digitally sophisticated. The infrastructure sector,
like the rest of the economy faces enduring productivity challenges. To varying levels, the sub-sectors within
infrastructure lag benchmarked peers internationally. A major contributing factor to these productivity
challenges is the extent to which sector players are required, or equipped, to identify, adopt and diffuse well
established and emerging technologies during planning, delivery, and maintenance phases of the
infrastructure lifecycle. Interventions to address these weaknesses will benefit the sector and the nation in the
decades ahead.
Te Ao and technological change: Use of a Te Ao Māori lens in the context of technological change produces
a powerful insight; that of Kete Mātauranga, or a basket of knowledge. Understanding data and the information
produced in the infrastructure sector as a basket of knowledge and therefore as a valuable taonga will benefit
the infrastructure system and future generations. We need a new and better tikanga around data, insights and
their long-term value for infrastructure planning and delivery.
International shifts and a dynamic role for government: Internationally, major shifts have occurred across
several strategic domains for the infrastructure sector. The role of the state is evolving with creative and bold
new collaborative models between government and state to close infrastructure deficits, rapidly decarbonise
with green finance at scale, develop new requirements and measures to drive digitalisation, R&D and
innovation, and to align national economic strategic choices.
Benefits from existing technologies not just at the frontiers: A significant number of benefits can be
realised from the adoption and diffusion of proven technologies (or ordinary technological capabilities). A
1 “Budget Policy Statement” New Zealand Government, 11 December, 2019 https://budget.govt.nz/budget/2020/bps/delivering-for-nz-
infrastructure.htm

| Preparing for technological change in the infrastructure sector |
Preparing for Technological Change in the Infrastructure Sector | 3821960-1147589789-62 | 31/05/2021 | 6
national approach is required to drive system level identification and adoption of these technologies, as
currently the benefits of technology are in limited places due to scale, resource, and capability/expertise
constraints especially outside of the largest institutions and industry players.
Global technology scanning: Our deep global technology scan identified 22 technologies that are emerging
within the next three decades and will have a direct impact on the productivity and performance of the
infrastructure sector. The largest macro trends driving technological change relevant for this study include the
fourth industrial revolution, data as the most critical asset, and the inequality of technological change. Through
the analyses, four of these technologies and one technology theme stood out as having a transformative
impact across all sectors:
• Artificial Intelligence (AI): Through an increase in productivity, optimisation, predictive maintenance,
personalisation
• Internet of Things (IoT): Through the increased capture and availability of information on performance,
impact, and monitoring
• Digital Twins: Through an increase in productivity in design, consenting and construction, operations,
and maintenance
• Immersive Media (Augmented Reality (AR) / Virtual Reality (VR)): Through the ability to deliver
services at a distance, with a corresponding reduction in pressure on physical infrastructure and improved
community equity of service delivery
• Cyber Security: Through the need to secure critical infrastructure and protect, manage, and share data,
much of which will be sensitive.
Impacts of technological change: Major impacts from technological change for the infrastructure sector
include, but are not limited to:
• Improved productivity of existing infrastructure
• Increase in demand for additional infrastructure
• Increase in visibility of the performance of infrastructure
• Novel cyber-security risks
• Lowered cost of infrastructure across the lifecycle.
There is also potential for additional impact for human wellbeing. This can be enhanced through improved data
capture requirements and radical data transparency of infrastructure performance. A swift movement towards
digitisation across the infrastructure lifecycle is imperative to support this across the board.
Performance and competitiveness: In a global competitiveness index, New Zealand infrastructure is fair with
respect to infrastructure quality. Significant differences emerge between sectors on use and sophistication of
data collection and ICT maturity. Energy and telecommunications are clear leaders, with other sectors lagging
significantly behind on this performance measure. When market-based dynamics, revenues, a profit incentive,
competition, and some transparency of performance data are present, technological preparedness and
adoption are higher. Top-down mandatory direction is needed to drive technological upgrading and use where
this increases the transparency of performance and productivity, and where it enables more geographically
equitable outcomes.
The low-carbon transition opportunity: New Zealand requires bold interventions and strategic approaches
across the sectors to accelerate decarbonisation and achieve carbon neutrality. The decarbonisation
opportunities for infrastructure across design, construction and operations are significant. There is the potential
to accelerate the decarbonisation of the sector through investment in infrastructure (recycling, water re-use
and electrification of energy use) and through carbon budgeting / accounting on infrastructure construction
projects. There is a positive relationship between infrastructural decarbonisation efforts, and technological
utilisation, adoption, diffusion and upgrading.

| Preparing for technological change in the infrastructure sector |
Preparing for Technological Change in the Infrastructure Sector | 3821960-1147589789-62 | 31/05/2021 | 7
Primary recommendations summary: We have sought to focus effort and recommendations into those that
can have impact horizontally across infrastructure sectors at a system level. A high-level summary of primary
recommendations is below:
a) Commence immediate preparatory work around standardisation and piloting of both digital consenting
and a full digital twin on a public infrastructure project. Digital twins are a key technology that will
impact positively on all elements of the infrastructure lifecycle. Common infrastructure metadata
standards across the sector will also support technological preparedness and digital development.
b) Infrastructure procurement is a powerful and critical lever that can shape outcomes and technological
preparedness at a system level. A review is needed to determine how Crown procurement can drive
a) digitalisation, b) technological preparedness across the sector, c) collaborative culture and shared
upside/downside contractual models, d) decarbonisation of infrastructure delivery.
c) Shift toward a fully open data environment in New Zealand using a Te Ao Māori lens. New legislation
is required to shift all of government toward open data (with clear timelines and quality standards) so
the value of data can be unlocked, and insights applied for better infrastructure sector strategy,
planning and delivery.
d) Refresh the New Zealand Digital Strategy. A broad and deep review is needed for a new Digital
Strategy (2040 and beyond) that addresses key gaps in existing strategic direction including but not
limited to; Infratech, anticipatory regulation for emerging technology development (especially AI),
international deep sea and low-orbit connectivity, long-range technology roadmap (creation and
capture), and digital sovereignty and citizenship in the next half century.
e) Design and launch innovative use-cases for AI in infrastructure including but not limited to; transport
and health, and immersive technologies to improve service delivery at distance (education, primary
health etc).
f) Increase focused finance at scale through a Decarbonisation Infrastructure Investment Fund.
Decarbonisation of infrastructure construction and operations is an immediate and pressing
requirement that can be supported by existing and emerging technologies. Current market dynamics
may not support this, and direct intervention will be required at a procurement level and through
Decarbonisation Investment Fund financing where switching and adoption costs are not commercially
viable and where targeted finance does not exist at scale.
g) Improve the incentives to introduce and adopt technology in the transport and water sectors by
introducing market dynamics using activity data to create transparent performance and a functioning
supply-demand marketplace. This requires a technology-led strategy based on IoT, AI and Digital
Twins.
To be prepared for technological change or not in the infrastructure sector is an active and deliberate choice
for political leaders, policy makers, civil servants, and industry leaders alike. It either will be prioritised, and
changes made, or the status quo in the system will endure.
We hope this study, its findings and recommendations support the deliberate choices and prioritisation required
in the decades ahead. A snapshot of the report’s full set of recommendations is included on the following page.

| Preparing for technological change in the infrastructure sector |
Preparing for Technological Change in the Infrastructure Sector | 3821960-1147589789-62 | 31/05/2021 | 8

| Preparing for technological change in the infrastructure sector |
Preparing for Technological Change in the Infrastructure Sector | 3821960-1147589789-62 | 31/05/2021 | 9
Introduction
The “Preparing for Technological Change in the Infrastructure Sector” research study and the
recommendations put forward will form one input into the broader 30-year strategy Te Waihanga is preparing
for the Minister of Infrastructure. The role of technology in society will continue to intensify, and the impacts of
this will cut across all infrastructure sectors and classes. The ability to harness and adapt to the technological
changes is crucial to uplifting sector productivity, and understanding these technological forces is critical in
shaping how this will impact on Aotearoa New Zealand’s future infrastructure, economy, and society.
In this context, Te Waihanga is seeking a wider understanding of the technological forces that will shape
Aotearoa New Zealand and the impacts on infrastructure in the decades to come, so that the potential benefits
for our social and cultural wellbeing, our economy, and our environment can be maximised via effective and
informed planning and delivery. The study is intended to take a broad look at the possible futures, rather than
being a narrow projection of current technologies. It needs to look at what might occur as well as what will
occur, and put the possible changes in their wider societal, cultural, economic, environmental, and political
context.
The scope of this study is the Te Waihanga definition of infrastructure, which covers sectors including waste,
water, energy, telecoms, transport, health, and education services. Other sectors were out of scope and not
considered as part of this study.
The document is structured in the following sections:
• Section 1: Covers the executive summary, introduction, Te Ao Māori, mission-led approaches, and
research methodology
• Section 2: Covers global policy, regulatory and technological scanning and sensing
• Section 3: Covers infrastructure sector technological performance and needs
• Section 4: Covers direct and indirect impact analysis
• Section 5: Covers strategic policy and regulatory considerations
• Section 6: Covers synthesis of core emerging issues and recommendations.
| Preparing for technological change in the infrastructure sector |
Preparing for Technological Change in the Infrastructure Sector | 3821960-1147589789-62 | 31/05/2021 | 10
Te Ao Māori
The foundation of this country enshrined in Te Tiriti o Waitangi guides our thinking toward an integrated and
united view on preparing for change in the context of both Te Ao Western and Te Ao Māori. The unified
approach to analysis in this study supports the notion of human flourishing (another word for wellbeing) – many
empirical studies throughout the social and biomedical sciences focus only on narrow outcomes such as
income, a single specific disease state, or a measure of positive affect. Human wellbeing or flourishing,
however, consists of a broader range of states and outcomes, including mental and physical health, but also
encompassing happiness and life satisfaction, meaning and purpose, character and virtue, and close social
relationships.2
Combining world views enhances outcomes for all and brings us closer to the ideas explored by the growing
body of literature on human flourishing. We have drawn upon this concept when visualising “preparing for
technological change in the infrastructure sector” by including the Te Ao Māori concept of Te Taiao. Te Taiao
encompasses all elements of the environment we live in. When we consider the component parts of our
environment, Whenua (land), Wai (Water), Koiora (Communities-Life) and Āhuarangi (Climate over time), we
immediately open the door to a world view that helps visualise infrastructure and the impacts technology may
have into the future. It supports us to consider the health impacts on individuals and communities and explore
the values that bind a culture and enhance our collective wisdom and knowledge to the question of technology.
The logic of this model has its core rooted in Te Taiao – the environment. It assumes that designing and
implementing infrastructure enhances the way we not only interact with the environment, but also that
technology impacts should improve the understanding we have of how particular infrastructure sits in harmony
with Te Taiao. Whilst this is premised on a Māori world view, it has strong alignment to a cross cultural
understanding and desire for environmental harmony.
Mātauranga
Mātauranga is the concept of Māori knowledge, with the collection of knowledge referred to as Kete
Mātauranga.
We are all connected through the ages and pass knowledge and wisdoms (Mātauranga) as evidence-based
science expressed through Te Ao Māori with Pūrakau (Stories) and Maramataka (cyclical events) verbally from
generation to generation. Whakapapa, while commonly understood as geneology, is also Past-Present and
Future knowledge. It has been the mechanisim to sustain and grow knowledge since before Māori ancestors
arrived from Hawaiki over 1000 years ago.
2 VanderWeele, Tyler J. "On the promotion of human flourishing." Proceedings of the National Academy of Sciences 114, no. 31 (2017):
8148-8156.

| Preparing for technological change in the infrastructure sector |
Preparing for Technological Change in the Infrastructure Sector | 3821960-1147589789-62 | 31/05/2021 | 11
Taha Wairua (Māori spiritual wellbeing) is enhanced and enhances one’s mana through the knowledge
obtained. If you have more knowledge and are more aware and if Māori knowledge is implemented through
technology to infrastructure projects, the positive impacts on Taha Wairua could be evident to overall mana.
A paradigm shift is currently occuring to reflect the way that Mātauranga (Māori knowledge via observation
and learning) is accessed, grown and shared inter-generationally. The current wisdoms in Mātauranga
traditionally handed forward via whakapapa are being rapidly and readily challenged by digital forms of
knowledge.
Infrastructure creates large amounts of data through operations, maintenance and use, with some of this
information being personal. This knowledge is taonga and any consideration of infrastructure needs to be
cogniscent of this, identifying the value, ownership and management of data, Māori data sovereignty, and how
that is thought of in the context of the Principles of Te Tiriti o Waitangi.
Figure 1: Connection between Te Taiao and infrastructure through Kete Mātauranga
In 2002, Waka Kotahi NZ Transport Agency designed and planned the Northern Waikato Expressway.
The Hapū in the area – near Mercer, expressed their view that the location of a part of that expressway
encroached across the lair of Karutahi – The Taniwha (Kaitiaki) of that part of the Waikato River. Waka
Kotahi listened to the view of the Hapū and modified the location of the expressway slightly to accomodate
that view.
14 months later, a flood encroached across the lair of Karutahi and significantly inundated the land where
the expressway would have been.
In this context the Taniwha (Guardian) could be interpreted as the Guardian of the Expressway by its
actions.
Similarily the Taniwha is a way to express the need to protect that area. It came about through multiple
generations of observations and is a narrative that draws similar conclusions to modern and western risk
management techniques. It is not a big leap to suggest that Karutahi is Te Ao Māori for the RMA.

| Preparing for technological change in the infrastructure sector |
Preparing for Technological Change in the Infrastructure Sector | 3821960-1147589789-62 | 31/05/2021 | 12
“The Matatā wildlife reserve, home to native birdlife, the Waitepuru Stream and a Taniwha. It had a long
sinuous body that came down to the Bay of Plenty and this particular Pūrakau said that there is a taniwha
and you want to beware its flicking tail. In 2005 it didnt just flick its tail, he thrashed it”.
The story goes on to describe a flood/landslide event that devastated the township of Matatā and has
given rise to a rapid and controversial retreat from the locality. Pūrakau are myths and legends drawn from
observtions in the landscape and explained according to a Māori world view. These pūrakau illustrate
knowledge and information (years of data collection) that have potential to be accessed and drawn
alongside modern and western observation and modelling techniques to aid in infrastructure design as
well as risk mitigation.
“In 2005, three of the town’s Marae were untouched and to me this is absolutely no mistake as they had
created a distaster reduction mechanisim, i.e the taniwha to say look don’t build there....”
| Preparing for technological change in the infrastructure sector |
Preparing for Technological Change in the Infrastructure Sector | 3821960-1147589789-62 | 31/05/2021 | 13
Preparing for Technological Change: A Mission-Led Approach
Setting a “vision” for technological preparedness for the sector within the confines of this study would have
marginal impact or buy-in from the multi-stakeholder environment of the infrastructure sector.
Te Waihanga, the Government and industry should work together to define a small set of challenge-based
missions. Technology itself is only a tool, not the goal itself and “more is more” will not be very strategic, to
better anticipate and adapt to technological change. A common and galvanising mission can help better
orchestrate actors, investments, and decisions to realise several direct and positive spill-over benefits for the
economy, infrastructure sector, businesses, and users out to 2050.
A wide-ranging digital transformation is underway globally, affecting all economic sectors. It is characterised
by almost universal connectivity and ubiquitous computing and draws on the generation and utilisation of vast
amounts of data. The digital technology sector is an important driver of innovation, increased jobs and export
growth, and the application of technology across all sectors of the economy can make our businesses more
resilient, productive, and internationally competitive. Harnessing the digital revolution will play an important
part in achieving clean and knowledge intensive growth in the decades ahead.
The Government and industry players should work collaboratively to form a shared view on the grand
challenges (some of which are technological and productivity challenges) and settle on a very few galvanising
‘missions’ which have sufficient significance to orchestrate and direct state and industry activity and
investments in the infrastructure sector for the coming 30 years.
These considerations point to the need to adopt a pragmatic approach to defining missions. Chosen missions
for increasing preparedness for technological change, innovation and adoption and diffusion of technology
should be: feasible, draw on existing public and private resources, be amenable to existing policy instruments,
and command broad and continuous political support. Missions should create a long-term public agenda. A
mission-led approach is superior to a purely top-down policy or regulatory approach to helping the sector
anticipate and prepare for technological change and realise the myriad of spill-over benefits for the country.
The level of deep uncertainty that characterises both the time horizon of the strategy of Te Waihanga (30 years)
and that of the speed, depth, shape and impact of technological change and advancement, calls for a more
dynamic method of setting direction and orchestration of activity to address enduring grand challenges for the
sector. These include but are not limited to poor productivity growth; under investment in technological
foresight; slow diffusion and adoption of technologies (established and emerging); closed data environment
and understanding / realising benefits from this data; weak linkages with climate and decarbonisation policies;
and short term and risk adverse cultures and systems.
Table 1 identifies a selection of opportunity areas for a mission-led approach to better prepare for technological
change in the infrastructure sector for New Zealand.

| Preparing for technological change in the infrastructure sector |
Preparing for Technological Change in the Infrastructure Sector | 3821960-1147589789-62 | 31/05/2021 | 14
Table 1: Mission-led opportunity areas
Mission-led opportunity area
Method Impact / policy alignment
Transformation of
infrastructure sector
carbon footprint
Sets specific targets out to 2040 / 2050 and dates
for sectors’ diffusion and adoption of technologies
and materials to rapidly decarbonise
High / strong
Data driven intelligent
infrastructure system
Sets specific missions related to transformation of
data standards, quality, capture, real-time nature
improvement of decision making across the
infrastructure sector
High / strong
Productivity
transformation in
construction
Sets specific targets and dates to transform the
productivity performance and resource optimisation
of the construction sector and upgrading of higher
productive skills, jobs, processes, and capabilities.
High / strong
Implementation needs to be central Government led but work closely with industry (not just the large
incumbents). Te Waihanga as the orchestrator, and the capital-intensive agencies (Ministry of Health (MoH),
Ministry of Education (MoE), Waka Kotahi NZ Transport Agency, Ministry of Transport (MOT), Land
Information New Zealand (LINZ)), and of course Treasury, need to be at the table collaborating on setting,
executing, and monitoring mission-led approaches.
A detailed explanation of the methodological approach to missions and international case study examples of
mission-led approaches, along with other policy instruments is provided in section 5.5.
| Preparing for technological change in the infrastructure sector |
Preparing for Technological Change in the Infrastructure Sector | 3821960-1147589789-62 | 31/05/2021 | 15
The Character of Infrastructure
Infrastructure supports human flourishing through complex and interrelated physical, social, ecological,
economic, and technological systems. It requires substantial investment, often in large increments, long-
payback periods and asset lives. Community equity and inclusion is a key aspect of infrastructure investment
due to the potential for uneven levels of service and availability, along with the risks of stranded infrastructure
where the supply of infrastructure does not match technological or demographic changes.
An assessment of technological change on infrastructure requires:
• Assessment over the full life cycle
• Consideration of direct and indirect impacts
• Social and cultural context
• Market dynamics.
The infrastructure life cycle includes five phases:
• Planning & Design: Initial stage where a need for additional infrastructure is found and a solution is
devised
• Construction: Designed infrastructure is built
• Operations: Infrastructure is put into service. This stage runs in conjunction with the maintenance phase
• Maintenance: Additional effort is spent to keep the infrastructure in an operational condition
• Renewal or Disposal: Decisions made at the end of the economic life.
Digital infrastructure describes the ecosystem of physical and digital resources that enable connection,
processing, and digital interactions. This includes elements such as broadband, cloud, and devices.

| Preparing for technological change in the infrastructure sector |
Preparing for Technological Change in the Infrastructure Sector | 3821960-1147589789-62 | 31/05/2021 | 16
Research methodology
In dealing with subject matter that has such high levels of ambiguity, in a 30-year time horizon of technologies
characterised by deep uncertainty, a guiding framework is required. Traditional approaches have relied heavily
on hard telecoms and ICT system performance metrics. Both policymakers and economists are more
comfortable in this paradigm as it is easier to measure. However, in this study we have sought to go beyond
this and include wider considerations around sustainability (environmental, social, inclusion) and resilience
(system direction, foresight, adaptability, and preparedness).
This study had a project Te Kaiwhakatere (Navigator) who led the integration of Te Ao Māori. This involved
the application of the principles of Te Taiao and Mātauranga to the impact assessments, and the principles of
data as a taonga. The integration of Te Ao Māori led to specific recommendations.
Research sources included a global scan, and interviews with 16 subject matter experts across water, waste,
energy, telecommunications, construction, transport, education, and health.
Additional research steps included:
a) Archival and existing Te Waihanga research
b) OECD comparative analysis (all of OECD or a prioritised sub-set)
c) Desk based research from secondary sources including the G20’s Global Infrastructure Hub and other
document analysis
d) Focus group / expert consultation including:
i. Department of Prime minister and Cabinet (DPMC)
ii. Ministry of Health (MOH)
iii. Ministry of Business, Innovation and Enterprise (MBIE)
iv. Department of Internal Affairs (DIA)
v. ACE NZ
vi. Construction industry leaders
vii. Auckland Council
viii. Beca (Industrial 4.0, Asset Management, Transport, Three Waters, Local Government,
Construction, AR / VR / Digital Twin / IoT, 5G / Edge Computing / Quantum Computing / Drones,
Social Impact, Sustainability, BIM, Energy & Storage, Singapore).
To form a picture of how infrastructure could be impacted by technological change over the next 30 years, we
conducted a global scan of incremental and disruptive technologies. The purpose of this global scan was to
identify the overarching technologies that will impact on how we plan, design, construct and operate
infrastructure.
Our global scan accessed research from others, notably the G20’s Global Infrastructure Hub, on the emerging
technologies for the next 30 years. The focus was to identify the underpinning technologies that are not specific
to any particular sectors, but which will have the ability to impact on a variety of the different sectors.
Fundamental technology characteristics, including technology maturity, adoption timelines and example use
cases were found for each technology. An assessment of the barriers for the adoption of each these
technologies was made. The technologies were categorised into six different groupings of technologies based
on classifications from the World Bank to allow for similarities in impacts and treatments to be identified.
The direct impacts of technological change on the infrastructure sector are analysed in Section 4.1. Firstly,
using the technology groupings from the World Bank, general impacts of these technology groupings across
infrastructure performance, resilience and sustainability has been analysed. Justification for ratings is placed
mainly on current use cases of technology that exemplify the direct impacts of the technology groupings.
Secondly, each infrastructure sector is analysed for direct impacts of technological change – again using case
examples for drawing generalised conclusions about impacts. Key technologies for each sector are identified
| Preparing for technological change in the infrastructure sector |
Preparing for Technological Change in the Infrastructure Sector | 3821960-1147589789-62 | 31/05/2021 | 17
through recurrence of example cases. Barriers and enablers for technological change in each sector are also
identified which lead into specific recommendations.
The policy and regulatory considerations including digital strategy / regulation / citizenship were assessed,
including the importance of procurement culture in assisting or slowing technological change.
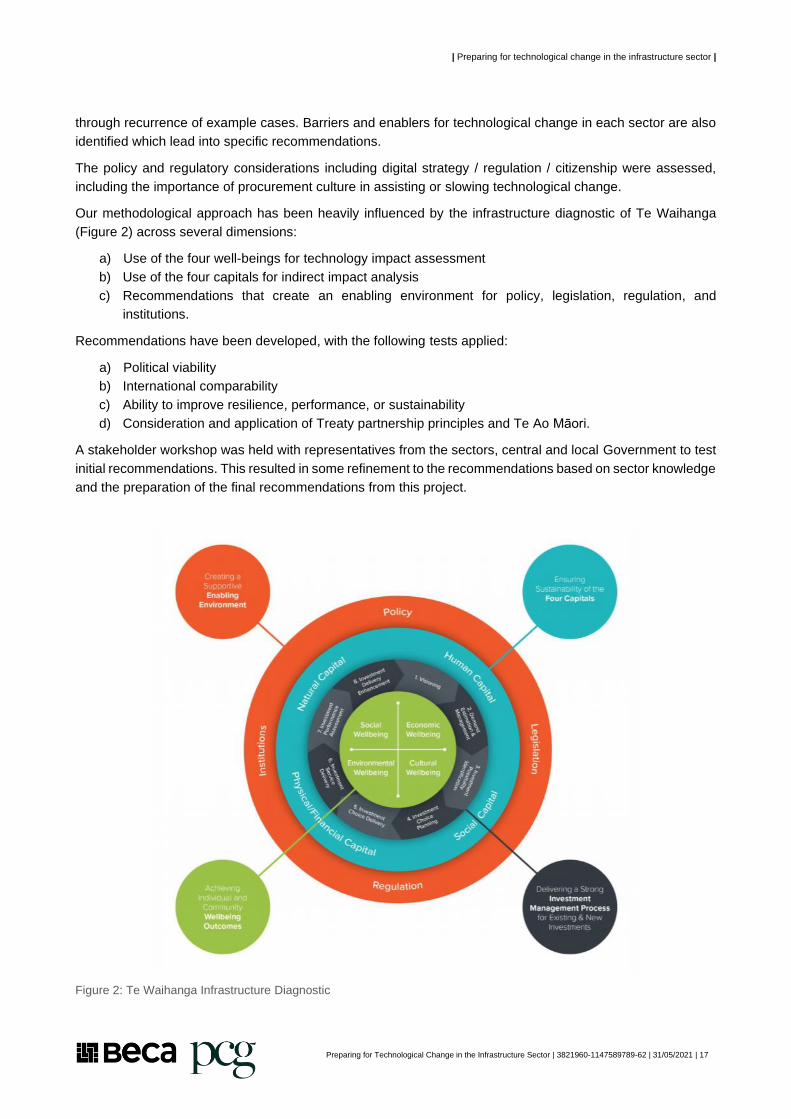
Our methodological approach has been heavily influenced by the infrastructure diagnostic of Te Waihanga
(Figure 2) across several dimensions:
a) Use of the four well-beings for technology impact assessment
b) Use of the four capitals for indirect impact analysis
c) Recommendations that create an enabling environment for policy, legislation, regulation, and
institutions.
Recommendations have been developed, with the following tests applied:
a) Political viability
b) International comparability
c) Ability to improve resilience, performance, or sustainability
d) Consideration and application of Treaty partnership principles and Te Ao Māori.
A stakeholder workshop was held with representatives from the sectors, central and local Government to test
initial recommendations. This resulted in some refinement to the recommendations based on sector knowledge
and the preparation of the final recommendations from this project.
Figure 2: Te Waihanga Infrastructure Diagnostic

| Preparing for technological change in the infrastructure sector |
Preparing for Technological Change in the Infrastructure Sector | 3821960-1147589789-62 | 31/05/2021 | 18
Global technological scanning and sensing 2

| Global technological scanning and sensing |
Preparing for Technological Change in the Infrastructure Sector | 3821960-1147589789-62 | 31/05/2021 | 19
2 Global technological scanning and sensing
30-year horizon for technological change: dealing with deep uncertainty
The wide scope of technological changes creates significant uncertainty about the future, the direction of firms
and the economy. Indeed, predictions about technological timelines are often inaccurate and over estimation
of their short-run impacts is common. The list of transformative technologies is long, but some technologies
have the potential to be particularly far-reaching, notably Artificial Intelligence (AI), the Internet of Things (IoT)
and to a lesser extent 5G / 6G. These transformative technologies present some common features, notably
their dependence on large data sets and a range of digital technologies – sensors in particular. Emerging
technologies carry several risks and uncertainties, and many also raise ethical issues. In infrastructure
planning, deep uncertainty can lead to institutional paralysis, intensification of incumbency and path
dependency, short termism, and sub-optimal decision making.
In exploring the impact of technological change on the infrastructure sector, we have endeavoured to explore
what could happen, as opposed to describe what will or should happen. This study has been developed based
on plausible assumptions, following clear methodologies. Where possible, we have leveraged empirical
evidence about past trends and quantitative and qualitative forecasts for drivers of change of infrastructure
technology.
There are inherent uncertainties when articulating a 30-year strategy. It should be noted that numerical data
and quantitative forecasts, no matter how rigorously developed rely on the availability of good data, where
there is a lack of data uncertainties exist. A problem for forecasters is the need to forecast phenomena not yet
experienced, especially when looking at potential new technologies over an extended timeframe. Forecasters
face a challenge, as 2nd and 3rd order effects can influence technology roll out.
The growing potential to collect and use real-time data will empower consumers to play a greater role in
determining the services they want, and how much they are prepared to pay for them. Real-time data on
energy use is already available in the energy sector to give customers greater choice over what time of day
they consume power, and therefore how much to pay. Growing consumer choice has implications for the way
infrastructure providers define levels of service and for how we ensure that the most vulnerable users of
infrastructure, who might be less likely to fully consider all available options, are able to benefit. Effective, real-
time data will also allow infrastructure providers to better understand their networks – from traffic flows to water
use – as well as how those networks interact with other infrastructure networks. While a lot of technological
advancements result in ‘gradual’ improvements to products, several potential ‘disruptive’ technological
advancements have been identified over the next 30 years or so – innovations that reorganise existing markets
and create entirely new markets.
Capturing the positive effects from digital disruption, such as efficiency and productivity, for firms, communities
and entrepreneurs will be critical for competitiveness 2020-2050. In parallel, so too will the identification and
mitigation of the negative effects such as cyber and national security threats, privacy, ethical data use and the
deficits in digital inclusion.
The key consideration for a system, sector or institution operating in deep uncertainty is to invest heavily into
capabilities. Capabilities need to be developed across the sector which can scale up, and down, be dynamic
and agile to flex and pivot as circumstances change (and they will).

| Global technological scanning and sensing |
Preparing for Technological Change in the Infrastructure Sector | 3821960-1147589789-62 | 31/05/2021 | 20
Technological change: Key global trends
Figure 3: Global trends of technological change
Applied deep uncertainty in infrastructure (World Bank, 2019)
There is a third dimension of uncertainty at play, which stems from the combination of truly novel
technologies and their 2nd- and 3rd-order effects. For example, with so little data on deployment of all-
electric vehicles (EVs), we do not yet know the 3rd-order effects of how charging patterns will affect grid
reliability or peak demands. Or for example, with no commercial, fully autonomous vehicles (AVs), we
cannot yet confidently say how they will affect vehicle-kilometres-travelled (VKT) or urban traffic
congestion. Nor, as a 3rd-order effect, do we know what either EVs or AVs might do to the housing and
labour markets. The costs and performance characteristics of the novel technologies can be estimated,
though with low confidence, but the 2nd- and 3rd-order uncertainties can barely be parameterised. This
deeper uncertainty is labelled "Knightian Uncertainty"1 by economists, as a way to distinguish quantifiable
from non-quantifiable uncertainty. In infrastructure planning, given the long-lived nature of assets such as
power plants, transmission lines, railways, water delivery systems, etc., Knightian uncertainty can lead to
institutional paralysis (e.g., why spend money when the outcome is so uncertain?) or poor decision making
(e.g., why pay attention to something so uncertain?).

| Global technological scanning and sensing |
Preparing for Technological Change in the Infrastructure Sector | 3821960-1147589789-62 | 31/05/2021 | 21
International policy and regulatory scanning
We undertook an international scan of key OECD nations. We assessed several dimensions, such as the
presence, quality, and level of integration they had across national strategies which set system direction for
technology or digital strategies, and digital infrastructure strategies to identify potential best practice policies
and to understand some of the infrastructure settings in those countries.
We identified five OECD countries which had similarities to New Zealand, such as land mass, population size
and a spread of rural and urban populations. The five countries identified were Australia3 4 5, Canada6 7 8, Finland9 10, Ireland11 12 and the UK13 14.
In addition, we selected two Asian countries that ranked highly internationally on technology adoption as a
comparison. These two countries identified were Singapore15 and Taiwan16 17.
Of the strategies reviewed we wanted to understand:
a) How closely their digital strategy and infrastructure strategies were integrated. The digital and
infrastructure strategies were reviewed, and a qualitative rating was assigned ranging from ‘Excellent’
3 “20 Year State Infrastructure Strategy”, Infrastructure South Australia May 2020, https://www.infrastructure.sa.gov.au/our-work/20-
year-strategy
4 “Vision 2025, Digital Transformation Agency”, 2018, https://dta-www-drupal-20180130215411153400000001.s3.ap-southeast-
2.amazonaws.com/s3fs-public/files/digital-transformation-strategy/digital-transformation-strategy.pdf
5 Australian Infrastructure Plan, Australian Government, Infrastructure Australia, February 2016,
https://www.infrastructureaustralia.gov.au/sites/default/files/2019-06/Australian_Infrastructure_Plan.pdf
6 Office of the Prime Minister, Minister of Infrastructure and Communities Mandate Letter, Rt. Hon. Justin Trudeau, Ottawa, Canada,
December 13, 2019
7 “Canada’s Digital Charter: Trust in a digital world” Government of Canada, date last modified January 12 2021,
thttps://www.ic.gc.ca/eic/site/062.nsf/eng/h_00108.html
8 “Investing in Canada, Canada’s Long-Term Infrastructure Plan”, Infrastructure Canada, https://www.infrastructure.gc.ca/plan/icp-
publication-pic-eng.html
9 “Digital Framework Finland”, Ministry of Economic Affairs and Employment of Finland,
https://www.businessfinland.fi/496a6f/globalassets/julkaisut/digital-finland-framework.pdf
10 “Turning Finland into the World Leader In Communications Networks - Digital Strategy 2025”, Ministry of Transport and
Communications , 2019
https://julkaisut.valtioneuvosto.fi/bitstream/handle/10024/161434/LVM_7_19_Digital_Infrastructure_WEB.pdf?sequence=1 11 “Doing more with Digital – National Strategy for Ireland”. Department of Communications, Energy, and Natural Resources, July 2013,
https://assets.gov.ie/27518/7081cec170e34c39b75cbec799401b82.pdf
12 “Project Ireland 2040 - National Development Plan”, Government of Ireland, 2018,
https://www.gov.ie/pdf/?file=https://assets.gov.ie/37937/12baa8fe0dcb43a78122fb316dc51277.pdf#page=47
13 “UK Digital Strategy 2017”, Department for Digital, Culture, Media & Sport”, March 1 2017,
https://www.gov.uk/government/publications/uk-digital-strategy/uk-digital-strategy
14 “National Infrastructure Assessment”, UK National Infrastructure Commission, July 2018
https://nic.org.uk/app/uploads/CCS001_CCS0618917350-001_NIC-NIA_Accessible-1.pdf
15 “Building On Singapore’s Infrastructure Ecosystem”, Enterprise Singapore, last modified February 8 2021,
https://www.enterprisesg.gov.sg/industries/hub/infrastructure-hub/build-on-singapores-infrastructure-ecosystem 16 Kelly Her, “Building the Future” Taiwan Review, November 01 2017,
https://taiwantoday.tw/news.php?post=124042&unit=8,32&unitname=Taiwan-Review&postname=Building-the-Future 17 “Vision” Digi-Taiwan, https://digi.taiwan.gov.tw
| Global technological scanning and sensing |
Preparing for Technological Change in the Infrastructure Sector | 3821960-1147589789-62 | 31/05/2021 | 22
– a clear connection between the two strategies, to ‘Poor’ – very little or no connections between the
two documents.
b) If there were industry consortiums18 19 20 21 22 23 24 in place and how these consortiums operated. For
‘Excellent’ this was defined where an entity was set up jointly between industry / Government and
research institutes to deliver innovation, where the benefits were equally shared among the consortium
partners. ‘Poor’ was at the other scale, where there was no consortium in place, with some information
sharing between the partners.
c) The readiness of that country to roll out new technologies. We leveraged the country ranking from the
United Nations Technology and Innovation Report 202125. This country ranking assessed IT skills,
overall skills, R&D, industry ranking and finance criteria to determine the ranking for each country.
d) The innovation performance for each country. We leveraged the Global Innovation Index Database26 as
prepared by Cornell, INSEAD and WIPO 2020. This determines the innovation performance for each
country.
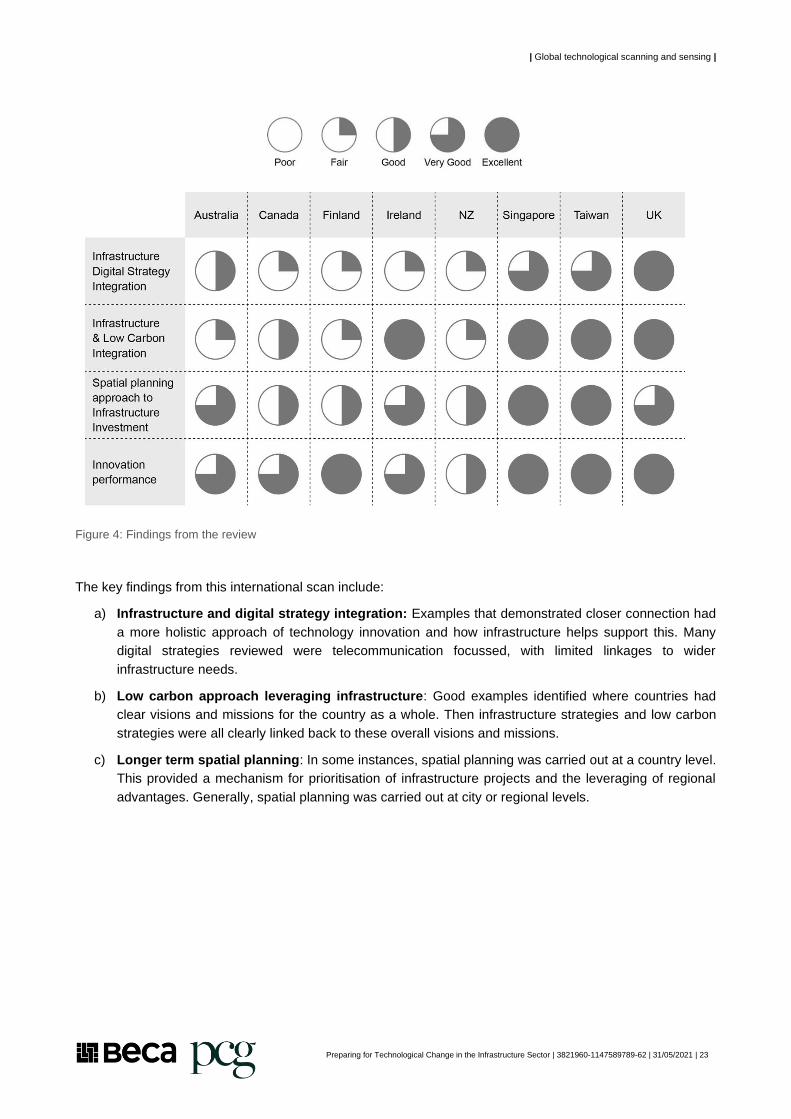
The findings from the international comparative analysis are shown in Figure 4.
18 “National Infrastructure Strategy”, HM Treasury, November 2020,
https://assets.publishing.service.gov.uk/government/uploads/system/uploads/attachment_data/file/938539/NIS_Report_Web_Accessibl
e.pdf
19 Lawrence Chung “US-Taiwan Infrastructure investment deal aims to reduce dependence on China, experts Say” South China Morning
Post, October 1, 2020, https://sg.news.yahoo.com/us-taiwan-infrastructure-investment-deal-090212273.html
20 “Building On Singapore’s Infrastructure Ecosystem”, Enterprise Singapore, last modified February 8 2021,
https://www.enterprisesg.gov.sg/industries/hub/infrastructure-hub/build-on-singapores-infrastructure-ecosystem
21 “Project Ireland 2040 - National Development Plan”, Government of Ireland, 2018,
https://www.gov.ie/pdf/?file=https://assets.gov.ie/37937/12baa8fe0dcb43a78122fb316dc51277.pdf#page=47
22 Keith Barrow “Finland to establish new companies to manage major rail projects”, International Railway Journal, September 10, 2019,
ttps://www.railjournal.com/infrastructure/finland-to-establish-new-companies-to-manage-major-rail-projects/
23 “Canada Infrastructure Bank Overview”, last modified March 2 2021, https://www.infrastructure.gc.ca/CIB-BIC/index-eng.html#about
24 “Why We Exist - Infrastructure Partnerships Australia,” September 13, 2016. https://infrastructure.org.au/why-we-exist/.
25 “The IMD World Digital Competitiveness Ranking 2020 results”, IMD World Competitiveness Centre, https://www.imd.org/wcc/world-
competitiveness-center-rankings/world-digital-competitiveness-rankings-2020/
26 “Global Innovation Index” https://www.globalinnovationindex.org/analysis-indicator
| Global technological scanning and sensing |
Preparing for Technological Change in the Infrastructure Sector | 3821960-1147589789-62 | 31/05/2021 | 23
Figure 4: Findings from the review
The key findings from this international scan include:
a) Infrastructure and digital strategy integration: Examples that demonstrated closer connection had
a more holistic approach of technology innovation and how infrastructure helps support this. Many
digital strategies reviewed were telecommunication focussed, with limited linkages to wider
infrastructure needs.
b) Low carbon approach leveraging infrastructure: Good examples identified where countries had
clear visions and missions for the country as a whole. Then infrastructure strategies and low carbon
strategies were all clearly linked back to these overall visions and missions.
c) Longer term spatial planning: In some instances, spatial planning was carried out at a country level.
This provided a mechanism for prioritisation of infrastructure projects and the leveraging of regional
advantages. Generally, spatial planning was carried out at city or regional levels.

| Global technological scanning and sensing |
Preparing for Technological Change in the Infrastructure Sector | 3821960-1147589789-62 | 31/05/2021 | 24
International comparative analysis – Infrastructure & Digital Strategy Integration
One best practice example of infrastructure and digital strategy integration was the UK. The digital and
infrastructure strategy were aligned in both their approach and messaging. The digital strategy addressed key
enablers for the UK to maximise the value of technological change, and the infrastructure strategy set long
term goals for the UK infrastructure. See Table 2 below for details of the digital strategy / infrastructure strategy
contents.
Table 2: UK Comparative Analysis
Digital Strategy Contents27 Infrastructure Strategy Contents28
Digital connectivity as a utility. Including 5G / full fibre
(1 Gb) / free Wi-Fi in public places
Nationwide full fibre broadband by 2033
Digital skills and training Half of the UK’s power provided by renewables by 2030
Innovation friendly regulation and significant R&D
investment
Three quarters of plastic packaging recycled by 2030
Supporting businesses to move into digital space to drive
innovation and productivity
£43 billion of stable long-term transport funding for regional
cities
Cyber security, and creating a safe cyberspace for children Preparing for 100 per cent electric vehicle sales by 2030
UK Government as a world leader in digital government Ensuring resilience to extreme drought
Unlocking the power of data and improving public
confidence in its use
National standard of flood resilience for all communities by
2050
International comparative analysis – spatial planning approach to infrastructure investment
Taiwan has a National Spatial Planning29 and Development approach, with all infrastructure decisions linked
back to four key pillars (see Table 3 below). Within each pillar there are clear examples of how technology and
innovation will be used to support achievement of the goals of the country.
Table 3: Taiwan comparative analysis
Strategic plan for national spatial development
Promoting the regional revitalisation policy
Promoting the regional revitalisation policy
Review and co-ordination of major public constructions
A national spatial plan is
available, taking into
account land use, sea level
The purpose of this is to
develop regional spatial
plans to encourage intra-
This is a funding
programme ($210Bn NZD
Framework for prioritising
major infrastructure
projects, with reports going
27 “National Infrastructure Assessment”, UK National Infrastructure Commission, July 2018
https://nic.org.uk/app/uploads/CCS001_CCS0618917350-001_NIC-NIA_Accessible-1.pdf
28 “National Infrastructure Strategy”, HM Treasury, November 2020,
https://assets.publishing.service.gov.uk/government/uploads/system/uploads/attachment_data/file/938539/NIS_Report_Web_Accessibl
e.pdf
29 “Special Act for Forward-Looking Infrastructure”, July 7 2017,
https://theme.ndc.gov.tw/lawout/EngLawContent.aspx?lan=E&id=55&KW=前瞻

| Global technological scanning and sensing |
Preparing for Technological Change in the Infrastructure Sector | 3821960-1147589789-62 | 31/05/2021 | 25
rise, demographics
change, industrial clusters,
ICT infrastructure, resource
allocation and
environmental protection
island migration to reduce
pressure on urban areas &
'balance development
throughout Taiwan'. This is
delivered using central
Government funding and
resources, as well as tax
incentives
over 4 years on key
infrastructure) covering:
• Water environment
infrastructure
• Green energy
infrastructure
• Digital infrastructure
• Urban-rural
infrastructure
• Infrastructure for
friendly child-rearing
space in response to
the low birth rate
• Food safety
infrastructure
• Infrastructure for
cultivating talent and
promoting employment
back to central
Government for
consideration.
This is across
transportation
infrastructure,
environmental resources,
economic development,
urban and regional
development, cultural
facilities, educational
facilities, agricultural
development, and health
and welfare facilities
International comparative analysis – Collaboration Models
In addition to reviewing the digital infrastructure strategies, a review was carried out to understand the funding
models for infrastructure collaboration. Table 4 below captures a snapshot of the models assessed.
Table 4: Funding models for infrastructure collaboration
Country Funding models of infrastructure collaboration
Australia • Significant amount of PPP (Public Private Partnerships).
• $4.1Bn allocated for research infrastructure to 2028/29. Funding is available to researchers. Government grant funding. Includes supercomputers funding which will help predict extreme weather events, which support infrastructure decision making.
Canada • 5G innovation hubs at five locations across Canada. Co-funding with private sector for innovation hubs, and R&D activities. Separate board set up for this initiative, with government as an observer. Joint funding approach, with government stimulation grant.
• Canada Bank set up in June 2017, at arm’s length from government. Use federal support to attract private sector and institutional investment with a focus on clean energy, broadband, large scale building retrofits, agriculture irrigation and zero carbon emission buses and charging infrastructure.
| Global technological scanning and sensing |
Preparing for Technological Change in the Infrastructure Sector | 3821960-1147589789-62 | 31/05/2021 | 26
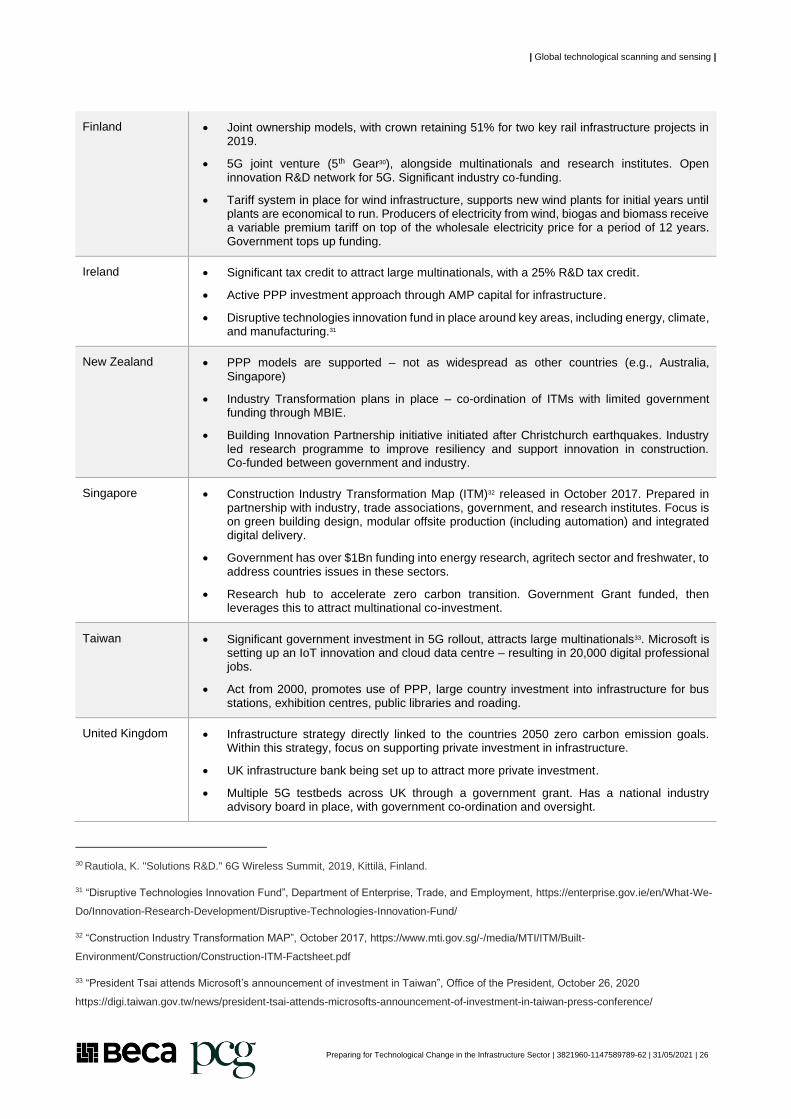
Finland • Joint ownership models, with crown retaining 51% for two key rail infrastructure projects in 2019.
• 5G joint venture (5th Gear30), alongside multinationals and research institutes. Open innovation R&D network for 5G. Significant industry co-funding.
• Tariff system in place for wind infrastructure, supports new wind plants for initial years until plants are economical to run. Producers of electricity from wind, biogas and biomass receive a variable premium tariff on top of the wholesale electricity price for a period of 12 years. Government tops up funding.
Ireland • Significant tax credit to attract large multinationals, with a 25% R&D tax credit.
• Active PPP investment approach through AMP capital for infrastructure.
• Disruptive technologies innovation fund in place around key areas, including energy, climate, and manufacturing.31
New Zealand • PPP models are supported – not as widespread as other countries (e.g., Australia, Singapore)
• Industry Transformation plans in place – co-ordination of ITMs with limited government funding through MBIE.
• Building Innovation Partnership initiative initiated after Christchurch earthquakes. Industry led research programme to improve resiliency and support innovation in construction. Co-funded between government and industry.
Singapore • Construction Industry Transformation Map (ITM)32 released in October 2017. Prepared in partnership with industry, trade associations, government, and research institutes. Focus is on green building design, modular offsite production (including automation) and integrated digital delivery.
• Government has over $1Bn funding into energy research, agritech sector and freshwater, to address countries issues in these sectors.
• Research hub to accelerate zero carbon transition. Government Grant funded, then leverages this to attract multinational co-investment.
Taiwan • Significant government investment in 5G rollout, attracts large multinationals33. Microsoft is setting up an IoT innovation and cloud data centre – resulting in 20,000 digital professional jobs.
• Act from 2000, promotes use of PPP, large country investment into infrastructure for bus stations, exhibition centres, public libraries and roading.
United Kingdom • Infrastructure strategy directly linked to the countries 2050 zero carbon emission goals. Within this strategy, focus on supporting private investment in infrastructure.
• UK infrastructure bank being set up to attract more private investment.
• Multiple 5G testbeds across UK through a government grant. Has a national industry advisory board in place, with government co-ordination and oversight.
30 Rautiola, K. "Solutions R&D." 6G Wireless Summit, 2019, Kittilä, Finland.
31 “Disruptive Technologies Innovation Fund”, Department of Enterprise, Trade, and Employment, https://enterprise.gov.ie/en/What-We-
Do/Innovation-Research-Development/Disruptive-Technologies-Innovation-Fund/
32 “Construction Industry Transformation MAP”, October 2017, https://www.mti.gov.sg/-/media/MTI/ITM/Built-
Environment/Construction/Construction-ITM-Factsheet.pdf
33 “President Tsai attends Microsoft’s announcement of investment in Taiwan”, Office of the President, October 26, 2020
https://digi.taiwan.gov.tw/news/president-tsai-attends-microsofts-announcement-of-investment-in-taiwan-press-conference/

| Global technological scanning and sensing |
Preparing for Technological Change in the Infrastructure Sector | 3821960-1147589789-62 | 31/05/2021 | 27
International comparative analysis – Digital Competitive Assessment
Significant effort is required to increase innovation
and adapt to new technologies. There are
currently no overall metrics for ranking innovation
in infrastructure, however an annual digital
competitiveness assessment of 63 countries has
been carried out since 2016 by IMD World
Competitiveness Centre. Countries are assessed
by competitive factors such as knowledge,
technology, and future readiness.
New Zealand is currently ranked as 22 out of 63.
This ranking is degrading year by year, with an
initial ranking of 10 in 2016.
Our top strengths include net flow of international
students; ease of starting a business; E-
participation; e-Government and software piracy.
Our top weaknesses include management of
cities; digital & technical skills; employee training;
high tech patent grants and public-private
partnerships.
International regulatory scanning and analysis
In preparing this overview, we have undertaken a high-level scan of the international legal, regulatory and
policy environment to identify key issues and trends prevalent in New Zealand’s main trading partners and
other comparable jurisdictions (in terms of size and position on the world stage). Having identified those key
issues and trends, we consider how the approach of other jurisdictions aligns with the demands of
New Zealand’s unique economic, political, and geographic circumstances and what this means for
New Zealand in terms of its long-term approach to regulation and policymaking in the infrastructure sector.
What does the international environment look like?
While regulations and policies in jurisdictions the world over are following broadly similar trends when it comes
to system-wide infrastructure, each jurisdiction also has its own challenges or circumstances, which have led
to jurisdiction-specific approaches. While government has a role in infrastructure planning and delivery in most
major economies, the extent of government involvement and willingness to partner with the private sector
varies for historical, economic, and political reasons that for each such jurisdiction require a nuanced
understanding of the broader framework within which infrastructure decisions are made.
What is clear is that planning and delivery of infrastructure systems by these jurisdictions require a legal,
regulatory and policy response, which addresses the challenges faced by each jurisdiction. While these types
of challenges are broadly similar across many jurisdictions, it is not evidently clear that they need to be
overcome, or can be overcome in the same way, by New Zealand.
Factors that influence legal, regulatory and policy approaches in the context of infrastructure include:
Figure 5: Digital competitiveness ranking 2018, 2019 and 2020

| Global technological scanning and sensing |
Preparing for Technological Change in the Infrastructure Sector | 3821960-1147589789-62 | 31/05/2021 | 28
• Federal systems, and the tension between State and Federal government (most notable in Germany,
Australia, and the United States, but also prevalent in the context of the nation states that make up the
United Kingdom)
• The influence of supranational bodies such as the European Union, which has a mandate to undertake
infrastructure initiatives and make funding available at a supra-regional level
• Historical private development and ownership of key infrastructure assets, such as railways (most notable
in the United Kingdom)
• Cross-border considerations in the context of the use of key infrastructure, which call into question national
sovereignty with respect to resilience and sustainability at a system-wide level, including trans-national
transport links, power exports and imports, and access to fresh water (including the Trans-European
Networks in the areas of transport, telecommunications and energy infrastructures)34
• Consideration of how to address disparity at a regional level, due to historical factors (East Germany) or
localised economic downturn (the North of England).
In addition, economic and political factors present in a jurisdiction may obfuscate the true impact of legal,
regulatory and policy decisions in the infrastructure sector. Significant market power (at a global or regional
level) and access to financial resources, and proximity to raw materials and manufacturing facilities may result
in the delivery of infrastructure projects in spite of, rather than due to, the legal, regulatory and policy
frameworks designed to support the planning and delivery of those projects, thereby presenting challenges in
in identifying ‘best practice’ at an international level.
However, several common themes emerge which are agnostic as to jurisdiction-specific challenges.
Siloed approaches are prevalent throughout. Siloes arise in the context of sub-sectors within the infrastructure
sector (for example, conflict between rail and road infrastructure within the wider transport sector). They also
arise in terms of conflicts between national and local decision-makers (at every level, be that state; region; or
city).
Responses to siloed approaches include the establishment of national infrastructure agencies with differing
mandates:
• Policy, advice, and systems-wide planning (Infrastructure Australia,35 Infrastructure Canada36)
• A wider mandate, including the above but also encompassing major project delivery and acting as a ‘centre
of excellence’ for major projects (the UK’s Infrastructure and Projects Agency37)
• Operational mandates, such as rail ownership, maintenance, and operation (the SNCF and Deutsche
Bahn) or three waters (Scottish Water).
Finland, a country not dissimilar in size and population to New Zealand, has championed alternative
approaches to addressing silo issues.38 The Finnish Ministry of Transport and Communications is responsible
for the provision of safe and secure transport and communications connections and services. It also enables
34 “The Treaty of the Functioning European Union”, l Article 170, Trans-European Networks, October 26 2012 https://eur-
lex.europa.eu/legal-content/EN/TXT/HTML/?uri=CELEX:12012E/TXT&from=EN
35 “What we do”, Infrastructure Australia, https://www.infrastructureaustralia.gov.au/
36 “About Infrastructure Canada”, last modified September 6, 2019, https://www.infrastructure.gc.ca/about-apropos/index-eng.html#1.2
37 “Infrastructure and Projects Authority Mandate”, HM Treasury, Cabinet Office, January 2021,
https://assets.publishing.service.gov.uk/government/uploads/system/uploads/attachment_data/file/949868/IPA_Mandate_2021.pdf
38 “The World Factbook”, last modified April 20, 2021 https://www.cia.gov/the-world-factbook/countries/finland/

| Global technological scanning and sensing |
Preparing for Technological Change in the Infrastructure Sector | 3821960-1147589789-62 | 31/05/2021 | 29
the use of new digital services, with the aim of creating a favourable operating environment for the services
and new business models.39 To support the aims of the Ministry, the Finnish Act on Transport Services
‘embraces all transport modes into one unique law, eliminating all specific laws referring to means of
transportation’. The law requires the opening of data and the handling of matters through open interfaces, with
a view to promoting the use of ‘mobility as a service’.40
Digital citizenship and inclusion is addressed pro-actively in Estonia, led by the Estonian government’s
approach to e-governance, ‘e-Estonia’, with 99% of state services provided online41 and 52,000 organisations
indirectly accessing services facilitated through the X-tee data exchange layer (based on the X-Road
technology developed jointly by Estonia and Finland through the MTU Nordic Institute for Interoperability
Solutions), through which organisations can exchange information in a manner that ensures confidentiality,
integrity and interoperability between the data exchange parties.
Jurisdictions the world over have responded to COVID-19 through stimulus packages targeting:
• Specific infrastructure projects
• Green energy and green infrastructure.
Both approaches followed to an extent already in New Zealand.
However, some stimulus packages include direct support for digital transformation. France has dedicated state
funding directed to: 42
• Education for the tech sector (€300m)
• Digital transformation of SMEs (€385m)
• Digital inclusion (€250m)
• Modernising public information systems (€1.7bn).
What can New Zealand take from this?
Laws, regulations, and policy addressing New Zealand’s infrastructure must take into account the unique
combination of factors that are prevalent within the New Zealand economic, political, and geographical
environment. While many of these factors are themselves not unique to New Zealand, since law, regulations
and policies seek to address outcomes at a system-wide level, they must contemplate the interaction between
these factors, and interdependencies place pressure on different pressure points within the system itself.
New Zealand is a long, thin, country; for the most-part sparsely population; earthquake-prone and
‘irredeemably pluvial’. Lawmakers and decision makers must pay heed to the Crown’s obligations under Te
Tiriti and the valid expectations of engagement with mana whenua. The combination of these factors means
that, while New Zealand can be ‘fast followers’ of legal, regulatory and policy frameworks that are seen as
‘best in breed’ in other jurisdictions, those frameworks must be critically analysed before being emulated, so
as to understand:
39 “The Ministry”, Ministry of Transport and Communication, https://www.lvm.fi/en/the-ministry
40 “Second Stage of the Act on Transport Services encompasses the whole transport system” Ministry of Transport and Communication,
October 19, 2017, https://www.lvm.fi/en/-/second-stage-of-the-act-on-transport-services-encompasses-the-whole-transport-system-
955021
41 “e-Estonia” e-Estonia Briefing Centre, https://e-estonia.com/
42 Romain Dillet, “France to spend $8.4 billion on digital as part of stimulus plan”, Extra Crunch, September 4 2020,
https://techcrunch.com/2020/09/03/france-to-spend-8-4-billion-on-digital-as-part-of-stimulus-plan/

| Global technological scanning and sensing |
Preparing for Technological Change in the Infrastructure Sector | 3821960-1147589789-62 | 31/05/2021 | 30
• Why those frameworks are appropriate for that jurisdiction, including the drivers which have resulted in
that being the case
• Considering the factors unique to New Zealand, including those factors outlined above and the prior
existence of policies already developed for and by New Zealand, the extent to which such frameworks can
or should be directly supplanted into the New Zealand ecosystem
• Whether the New Zealand ecosystem has the knowledge base, resources, and capacity to develop,
implement and manage those frameworks in a manner that will deliver the outcomes those frameworks
are designed to deliver.

| Global technological scanning and sensing |
Preparing for Technological Change in the Infrastructure Sector | 3821960-1147589789-62 | 31/05/2021 | 31
Global scanning of incremental and disruptive technologies
A wide-reaching global scan was undertaken to determine the incremental and transformational technologies
that will impact infrastructure within the next 30 years. Considering that specific technologies will change in the
coming decades, a technology scan needs to focus on the fundamental forthcoming technologies that will
underpin specific technology applications that sectors / providers themselves may uptake.
Categorisation is needed to provide an organised evaluation of a highly complex and deeply uncertain field.
The analysis framework used groups technologies under broader technology types. By providing groupings
for the technologies, similarities can be drawn between different technologies within the same group. The six
categories of technology outlined in the World Bank Group report “Infratech Value Drivers” have been adopted
for the global scan.
They are as follows:
1) Connectivity & Communication: Wired or wireless technologies that connect people or devices and
enable data transfer.
2) Analytics & Computation: Advanced analysis that uses machine learning to process large amounts of
unstructured data.
3) Cloud & Data Storage: Technology solutions that enable efficient mass movement and storage of large
data sources.
4) Devices & Automation: Physical interfaces and components that perform specific tasks or enhance
automation. This includes robotics and drones.
5) Platforms, Interfaces & Systems: Complex systems combining multiple technologies or that have
whole of system design thinking.
6) Materials, Energy & Construction: Applied science and engineering directly related to efficiency or
quality.
As part of the technological scan, our research has grouped technologies by broad function, identified whether
the technology is likely to be incremental or disruptive in impact, when the technology is likely to have a
pronounced impact and at what stage(s) of the infrastructure lifecycle the technology is likely to feature. As a
final step in the technological scanning process, we have identified the technologies that are likely to have an
impact on Mātauranga.
The global scan process identifies the stage of the infrastructure lifecycle where the technology is relevant.
This enables the identification of technologies that will have greater impact across the full life cycle, and which
are specifically relevant to the construction stage.
Technological change will bring new opportunities and challenges for access to, the transfer of and the storage
of knowledge and information. In particular this will become more digital. The principle of Kete Mātauranga
(basket of knowledge) is key to the impact of technological change on Te Ao Māori.
Deeper analysis of the incremental and disruptive technologies that will impact infrastructure is detailed in Appendix A. Appendix A describes each technology and its maturity, highlights an example application, and identifies potential adoption barriers and timelines.

| Global technological scanning and sensing |
Preparing for Technological Change in the Infrastructure Sector | 3821960-1147589789-62 | 31/05/2021 | 32
Resulting from the global scan the following key insights have been identified in each category:
a) Kete Mātauranga: The principal technologies that will impact Kete Mātauranga are where information
is collected and used (IoT with device connectivity, data capture and sensors, Artificial Intelligence (AI)
(particularly insight creation from data), data use in infrastructure operations, collection of information
through drones and robotics, and the use of immersive technologies (AR / VR). The amount of data that
Infrastructure produces will continue to grow, and the power of processing this through AI will mean that
data and knowledge will become more intertwined.
b) Connectivity & Communication: IoT and supporting connectivity such as 4G and LiFi currently exists
although at an early stage of adoption and development. These technologies are key for collecting and
transferring data arising from the operations and impacts of infrastructure.
c) Cloud & Storage: While the performance and capacity of this technology will improve, the benefits and
value of this technology are already present and so the challenges are around adoption, cyber security,
and data privacy.
d) Platforms, Interfaces and Systems: Key relevant technologies are immersive media to provide
services at a distance (the use of augmented reality, virtual reality, videoconferencing, tele-consulting),
and digital twins. Digital twins will enable digitalisation across the full life cycle of infrastructure.
e) Materials, Energy & Construction: With a trend towards electrification of infrastructure and the
increasing supply of sustainable energy, advanced battery storage is a key technology. Similarly, 3D
printing may develop into a key construction and maintenance technology.
Based on the evaluation, the following technologies are identified as having a substantial impact / importance
across all sectors:
1. AI (Optimisation, Personalisation, Scale)
2. IoT (Sensors, data collection, performance information)
3. Digital Twins (Asset Life Cycle optimisation)
4. Immersive Media (AR/VR) (Services at a distance)
5. Cyber Security (Data ownership, privacy, Mātauranga).
Further information specifically on AI, IoT, digital twins, and immersive media, including descriptions and practical applications, is located in the case studies in Appendix C.

| Global technological scanning and sensing |
Preparing for Technological Change in the Infrastructure Sector | 3821960-1147589789-62 | 31/05/2021 | 33
NISMOD MASTER DIGITAL MODEL CASE STUDY INSIGHTS (UK)
In 2010, researchers from the UK Infrastructure Transitions Research Consortium (ITRC) began the
development of an integrated model of models of infrastructure systems now captured under the name
NISMOD. Founded by a group of UK academics, the ITRC is the collaboration of seven universities and
more than 50 partners from infrastructure fields. The consortium investigates the role of infrastructure in
the development of society and aims to provide expertise on the interdependencies between infrastructure
sectors. In responding to the call for a systems approach to national infrastructure, ITRC embarked on the
mission to develop the infrastructure model of models (infNISMOD) to provide that system overview of
infrastructure.
The first iteration of the model – NISMOD 1 – simulates interdependent infrastructure systems in Great
Britain. NISMOD 1 consists of two main components, NISMOD for Long-term Planning (NISMOD-LP) and
NISMOD Database (NISMOD-DB). NISMOD-LP is the engineering simulation environment that models
the interactions between infrastructure, and NISMOD-DB is the storage centre for the NISMOD-LP model
outputs. Combined with spatial data, NISMOD-DB presents the modelled infrastructure visually for analysis
of simulated infrastructure performance and interactions.
NISMOD 2 develops on the foundation provided by NISMOD 1 and has been in development since 2016.
Developed to provide greater resolution and finer resolution modelling, NISMOD 2 has been tentatively
proven to be able to model future scenarios of infrastructure systems and provide input into decision
making. NISMOD 2 is fundamentally the integration of independent, sector-specific models through a
common simulation framework. NISMOD 2 provides the platform for conversation between previously
separate models to pass inputs and outputs between models to simulate practical interdependencies.
NISMOD 2 was applied as a case study to the decarbonisation of transport modelling for the area
commonly known as England’s Economic Heartland. Outputs from the NISMOD 2 transport model were
used to assess five pathways to achieving transport decarbonisation. Key to the modelling were inputs of
projected population growth in the study area. Results from the model provide information on emissions
and congestion and can give insight into which modelled scenario provides the best chance of
decarbonisation.
ITRC has proven the concept of a national infrastructure model of models for integrating decision making
and infrastructure scenario testing in a cross-sector manner to improve planning and decision making.

| Global technological scanning and sensing |
Preparing for Technological Change in the Infrastructure Sector | 3821960-1147589789-62 | 31/05/2021 | 34
Barriers to Technology Adoption
Barriers to technological change can be commercial, regulatory, or due to inherent requirements of the
technology (including other enabling technologies or standardisation). These apply to both existing
technologies that may be in use internationally but not in New Zealand, or to the adoption of changes in
technology as they are developed. In many cases, there is no technological barrier (many technologies exist
that are proven to improve productivity, reduce waste, carbon and time), rather, it is just the funding envelope
that inhibits adoption and diffusion of existing technologies in the market. Frontier / emerging technologies,
which tend to be more unproven and expensive need monitoring but are not the main problem. Four key
barriers for technology adoption are detailed in Table 5 below.
Table 5: Key barriers to technology adoption
Barrier Description Explanation
Cost / commercial
business case
Cost of implementing the
technology for specific
application.
Across the technologies cost is primarily a barrier for those
technologies that involve physical installation of digital devices for
the greatest impact or there are still costly development hurdles to
overcome for mass use.
Standardisation Whether the technology
needs standardisation of
data or interfaces between
different entities.
Standardisation is a key barrier for several technologies where the
benefits of the technology are realised through mass adoption by
various individuals or companies. In these situations, such as with
digital twins and digital consenting, a common data framework and
standard interface is required to facilitate the interaction of the
various individuals and companies.
Regulatory / Legal Technology adoption
might be dependent on
enabling legislation or
regulatory permissions or
is at risk of being legislated
against.
Regulatory and legal barriers affect technologies mostly when the
technology is likely to collect or access personal information such as
biometrics and civic technology. Technologies affected by these
barriers also involve those that can significantly impact on existing
regulations and standard ways of operating such as cryptocurrencies
and 3D printing.
Security Whether the technology
will create opportunities for
unsanctioned private
information access.
Security related barriers are present for those technologies that
share information digitally – creating a larger surface area for
cyber security risks.
This demonstrates that barriers to adoption of specific technologies are multifaceted with:
• Cost / commercial business case: Particularly digital twins and construction technologies
• Standardisation: Particularly digital twins
• Regulatory / Legal: Particularly data collection, and digital consenting and design
• Security: Particularly IoT, cloud and storage, and digital twins.
A strategy for preparing for technological change needs to identify next steps to work on these identified
barriers.
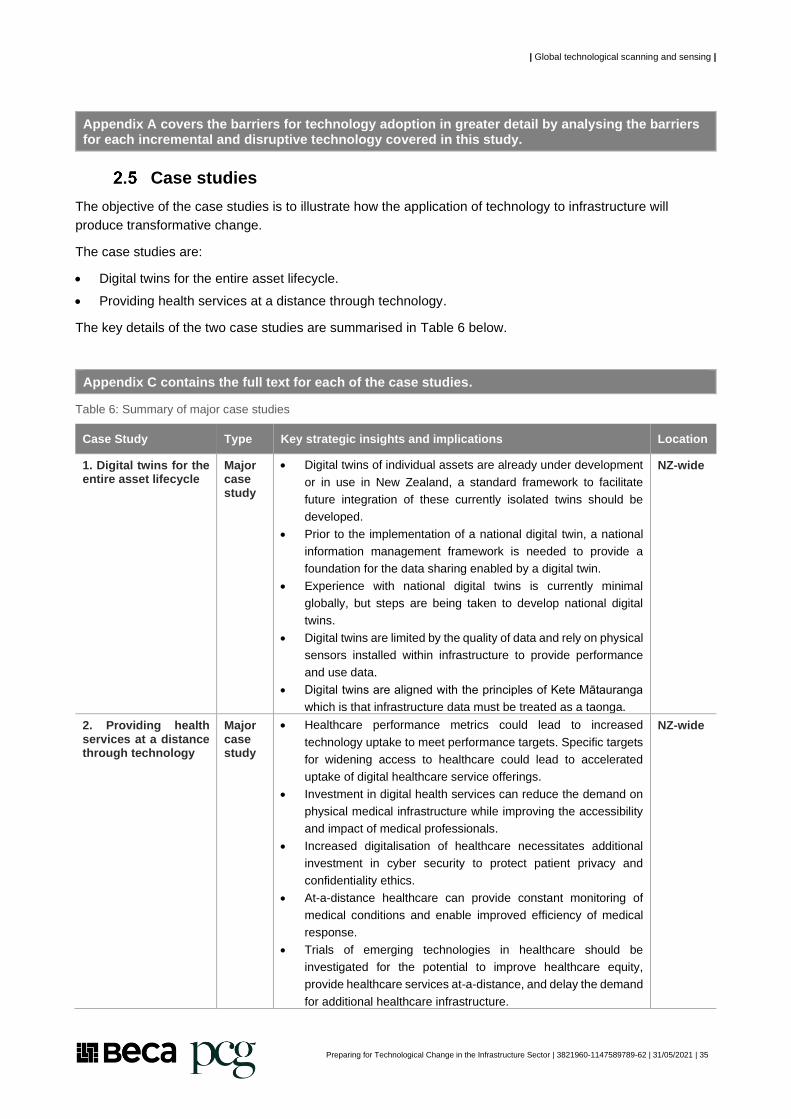
| Global technological scanning and sensing |
Preparing for Technological Change in the Infrastructure Sector | 3821960-1147589789-62 | 31/05/2021 | 35
Appendix A covers the barriers for technology adoption in greater detail by analysing the barriers for each incremental and disruptive technology covered in this study.
Case studies
The objective of the case studies is to illustrate how the application of technology to infrastructure will
produce transformative change.
The case studies are:
• Digital twins for the entire asset lifecycle.
• Providing health services at a distance through technology.
The key details of the two case studies are summarised in Table 6 below.
Appendix C contains the full text for each of the case studies.
Table 6: Summary of major case studies
Case Study Type Key strategic insights and implications Location
1. Digital twins for the entire asset lifecycle
Major case study
• Digital twins of individual assets are already under development
or in use in New Zealand, a standard framework to facilitate
future integration of these currently isolated twins should be
developed.
• Prior to the implementation of a national digital twin, a national
information management framework is needed to provide a
foundation for the data sharing enabled by a digital twin.
• Experience with national digital twins is currently minimal
globally, but steps are being taken to develop national digital
twins.
• Digital twins are limited by the quality of data and rely on physical
sensors installed within infrastructure to provide performance
and use data.
• Digital twins are aligned with the principles of Kete Mātauranga
which is that infrastructure data must be treated as a taonga.
NZ-wide
2. Providing health services at a distance through technology
Major case study
• Healthcare performance metrics could lead to increased
technology uptake to meet performance targets. Specific targets
for widening access to healthcare could lead to accelerated
uptake of digital healthcare service offerings.
• Investment in digital health services can reduce the demand on
physical medical infrastructure while improving the accessibility
and impact of medical professionals.
• Increased digitalisation of healthcare necessitates additional
investment in cyber security to protect patient privacy and
confidentiality ethics.
• At-a-distance healthcare can provide constant monitoring of
medical conditions and enable improved efficiency of medical
response.
• Trials of emerging technologies in healthcare should be
investigated for the potential to improve healthcare equity,
provide healthcare services at-a-distance, and delay the demand
for additional healthcare infrastructure.
NZ-wide

| Global technological scanning and sensing |
Preparing for Technological Change in the Infrastructure Sector | 3821960-1147589789-62 | 31/05/2021 | 36
What can New Zealand take from this?
The key global trends for technological change for the next three decades are relevant for New Zealand:
• Open data as the new oil: The increasing value of data.
• Fourth industrial revolution: A fusion of digital, physical, and biological spheres.
• Security and resilience in digital society: The need for regulation, privacy, and security of data.
• The human cost of technological change: The disruption to labour demand, supply, and productivity.
Globally, infrastructure strategies are integrated with digital, low carbon, spatial planning, and innovation
strategies to varying degrees. While New Zealand can and should take inspiration from international strategies
it is important to recognise the unique regulatory, cultural, and environmental context of New Zealand. Applying
a Te Ao Māori lens, specifically Mātauranga, there are opportunities and challenges related to the transfer of
and storage of knowledge and information, notably data ownership and privacy.
The five key technologies relevant across New Zealand’s infrastructure are:
• AI (Optimisation, Personalisation, Scale)
• IoT (Sensors, data collection, performance information)
• Digital Twins (Asset Life Cycle optimisation)
• Immersive Media (AR/VR) (Services at a distance)
• Cyber Security (Data ownership, privacy, Mātauranga)
New Zealand, at least in global terms, has small scale. The organisational structures in local government and
the dispersed population outside of major cities lead to unequal technology adoption. A national approach is
required for technology adoption and use with mandatory requirements and measures.

| Global technological scanning and sensing |
Preparing for Technological Change in the Infrastructure Sector | 3821960-1147589789-62 | 31/05/2021 | 37
Infrastructure technological performance and needs 3
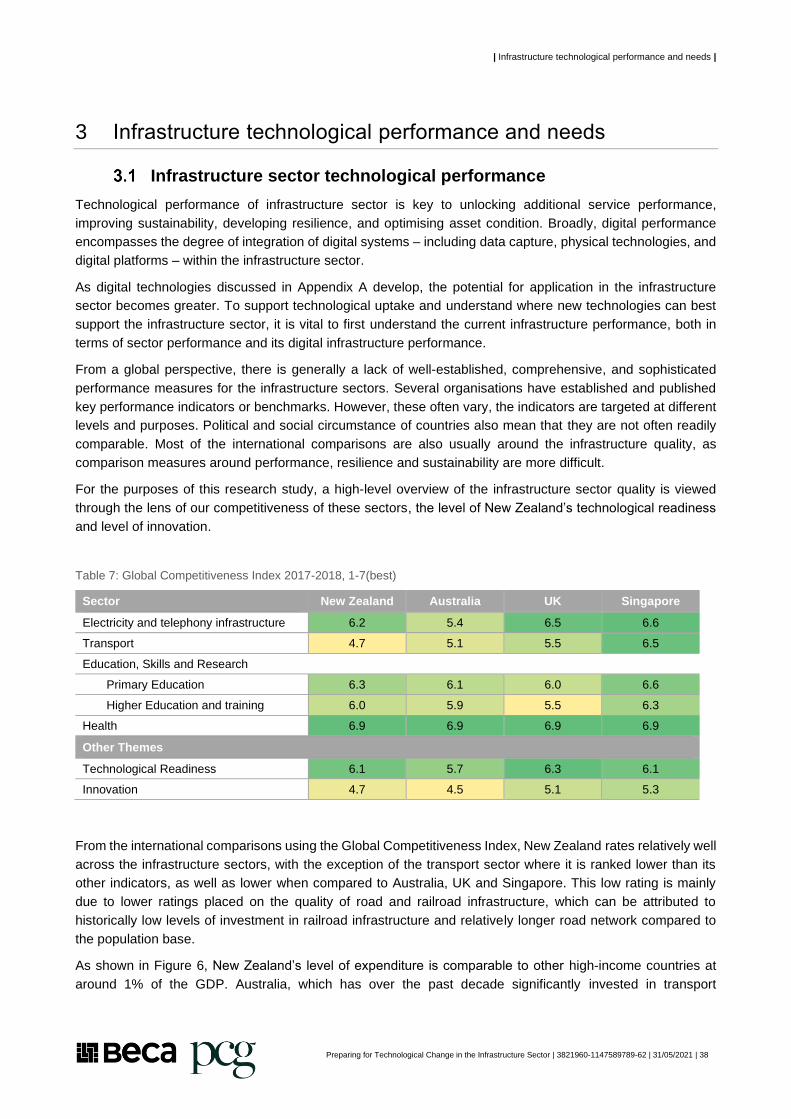
| Infrastructure technological performance and needs |
Preparing for Technological Change in the Infrastructure Sector | 3821960-1147589789-62 | 31/05/2021 | 38
3 Infrastructure technological performance and needs
Infrastructure sector technological performance
Technological performance of infrastructure sector is key to unlocking additional service performance,
improving sustainability, developing resilience, and optimising asset condition. Broadly, digital performance
encompasses the degree of integration of digital systems – including data capture, physical technologies, and
digital platforms – within the infrastructure sector.
As digital technologies discussed in Appendix A develop, the potential for application in the infrastructure
sector becomes greater. To support technological uptake and understand where new technologies can best
support the infrastructure sector, it is vital to first understand the current infrastructure performance, both in
terms of sector performance and its digital infrastructure performance.
From a global perspective, there is generally a lack of well-established, comprehensive, and sophisticated
performance measures for the infrastructure sectors. Several organisations have established and published
key performance indicators or benchmarks. However, these often vary, the indicators are targeted at different
levels and purposes. Political and social circumstance of countries also mean that they are not often readily
comparable. Most of the international comparisons are also usually around the infrastructure quality, as
comparison measures around performance, resilience and sustainability are more difficult.
For the purposes of this research study, a high-level overview of the infrastructure sector quality is viewed
through the lens of our competitiveness of these sectors, the level of New Zealand’s technological readiness
and level of innovation.
Table 7: Global Competitiveness Index 2017-2018, 1-7(best)
Sector New Zealand Australia UK Singapore
Electricity and telephony infrastructure 6.2 5.4 6.5 6.6
Transport 4.7 5.1 5.5 6.5
Education, Skills and Research
Primary Education 6.3 6.1 6.0 6.6
Higher Education and training 6.0 5.9 5.5 6.3
Health 6.9 6.9 6.9 6.9
Other Themes
Technological Readiness 6.1 5.7 6.3 6.1
Innovation 4.7 4.5 5.1 5.3
From the international comparisons using the Global Competitiveness Index, New Zealand rates relatively well
across the infrastructure sectors, with the exception of the transport sector where it is ranked lower than its
other indicators, as well as lower when compared to Australia, UK and Singapore. This low rating is mainly
due to lower ratings placed on the quality of road and railroad infrastructure, which can be attributed to
historically low levels of investment in railroad infrastructure and relatively longer road network compared to
the population base.
As shown in Figure 6, New Zealand’s level of expenditure is comparable to other high-income countries at
around 1% of the GDP. Australia, which has over the past decade significantly invested in transport
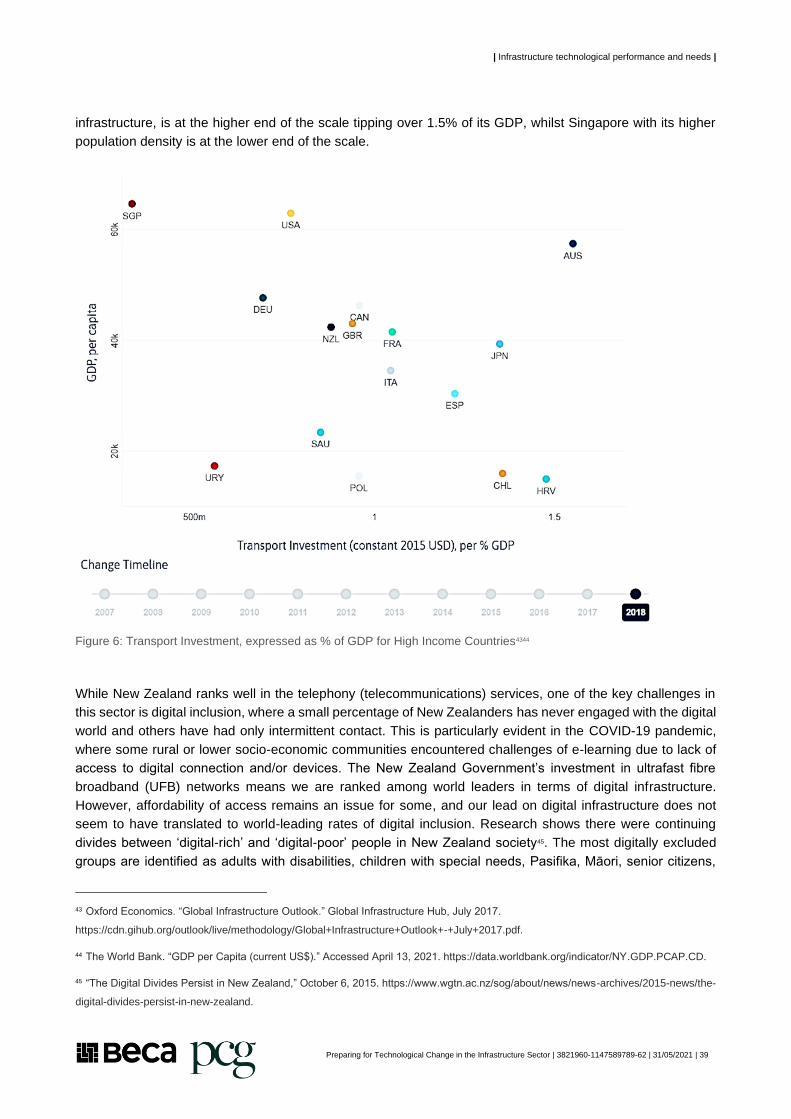
| Infrastructure technological performance and needs |
Preparing for Technological Change in the Infrastructure Sector | 3821960-1147589789-62 | 31/05/2021 | 39
infrastructure, is at the higher end of the scale tipping over 1.5% of its GDP, whilst Singapore with its higher
population density is at the lower end of the scale.
Figure 6: Transport Investment, expressed as % of GDP for High Income Countries4344
While New Zealand ranks well in the telephony (telecommunications) services, one of the key challenges in
this sector is digital inclusion, where a small percentage of New Zealanders has never engaged with the digital
world and others have had only intermittent contact. This is particularly evident in the COVID-19 pandemic,
where some rural or lower socio-economic communities encountered challenges of e-learning due to lack of
access to digital connection and/or devices. The New Zealand Government’s investment in ultrafast fibre
broadband (UFB) networks means we are ranked among world leaders in terms of digital infrastructure.
However, affordability of access remains an issue for some, and our lead on digital infrastructure does not
seem to have translated to world-leading rates of digital inclusion. Research shows there were continuing
divides between ‘digital-rich’ and ‘digital-poor’ people in New Zealand society45. The most digitally excluded
groups are identified as adults with disabilities, children with special needs, Pasifika, Māori, senior citizens,
43 Oxford Economics. “Global Infrastructure Outlook.” Global Infrastructure Hub, July 2017.
https://cdn.gihub.org/outlook/live/methodology/Global+Infrastructure+Outlook+-+July+2017.pdf.
44 The World Bank. “GDP per Capita (current US$).” Accessed April 13, 2021. https://data.worldbank.org/indicator/NY.GDP.PCAP.CD.
45 “The Digital Divides Persist in New Zealand,” October 6, 2015. https://www.wgtn.ac.nz/sog/about/news/news-archives/2015-news/the-
digital-divides-persist-in-new-zealand.

| Infrastructure technological performance and needs |
Preparing for Technological Change in the Infrastructure Sector | 3821960-1147589789-62 | 31/05/2021 | 40
people from low socio-economic backgrounds and those living in regions or communities with low internet
uptake rates.
Water and resource recovery sectors do not feature in the competitive index comparison, as it is likely that
provision of these services is generally viewed as essential and does not have various levels of service
provision, for example when compared to the telephony (broadband) infrastructure where overall perception
and ratings can be given for reliability, speed, latency and affordability. For the water sector, the only
appropriate comparison is against the Australian Bureau of Meteorology annual performance benchmark on a
range of indicators for Australian water service providers, such as pricing, customer relationship, water quality
and environmental performance. Care is required when interpreting these results however, as the data
accuracy captured between organisations may not be accurate. For example, Wellington Water recorded 172
wastewater overflows in the 2018/19 “National Performance Review” but has reported 2,096 overflows in their
2019/20 Annual Report46. These results can be found in the State of Play for the Water Sector.
While New Zealand fares relatively well on its quality of infrastructure, the efficiency of the sector is lower when
compared against other high-income nations, refer to Figure 7.
Figure 7: Quality of Overall Infrastructure v Total Infrastructure Investment per Capita4748
46 “Sector State of Play: Water.” New Zealand Infrastructure Commission Te Waihanga, 2021.
https://infracom.govt.nz/assets/Uploads/State-of-Play-Water.pdf.
47 Oxford Economics. “Global Infrastructure Outlook.”
48 The World Bank. “GDP per Capita (current US$).” Accessed April 13, 2021. https://data.worldbank.org/indicator/NY.GDP.PCAP.CD.

| Infrastructure technological performance and needs |
Preparing for Technological Change in the Infrastructure Sector | 3821960-1147589789-62 | 31/05/2021 | 41
Technological change has the potential to uplift the sector performance (further detailed in Section 0.
Understanding infrastructure sectors’ digital performance is critical to tailor our resources and investments
going forward. The digital performance of the infrastructure sector in New Zealand has been examined through:
(1) use of digital data, (2) intensity of ICT use, and (3) level of innovation and spending on research and
development.
Use of Digital Data
Collection of data about infrastructure is critical for enabling technological change in the decades ahead. Table
8 summarises what data is currently captured and used for each Te Waihanga defined infrastructure sector
under key themes of reliability, cost, coverage, and efficiency. Based on the 2013 Beca – Covec report
“Infrastructure Performance Indicator Framework Development” developed for the Infrastructure Unit of the
Treasury, and further research carried out, the performance for the infrastructure sectors can broadly be
measured on seven key metrics, which have been categorised under the technological change paradigm
across performance, resilience, and sustainability.
Figure 8: Infrastructure performance measures

| Infrastructure technological performance and needs |
Preparing for Technological Change in the Infrastructure Sector | 3821960-1147589789-62 | 31/05/2021 | 42
Data recording and sharing can be dependent on the structure of the industry in question. For example, within
the telecommunications sector, data is likely to be held more confidentially due to the competitive market.
Therefore, Table 8 focuses on rating likely levels of data use within each sector to assist with its performance
measures rather than a deep-dive of performance in each sector.
Appendix B contains the full research that provides the justification for the ratings in Table 8 including the locations of where to find performance data for each sector.
Table 8: Performance, resilience, and sustainability rating by infrastructure sector
Performance Measure
Te
lec
om
mu
nic
ati
on
s
En
erg
y
Wa
ter
Re
so
urc
e R
ec
ov
ery
an
d
Wa
ste
Tra
ns
po
rt
Ed
uc
ati
on
, S
kills
an
d
Re
se
arc
h
He
alt
h a
nd
Ag
ed
Ca
re
Performance
Capacity / Output
Access / Coverage / Utilisation *
Productivity / Efficiency
Resilience
Service Quality / Affordability / Reliability *
Safety / Security / Resilience
Sustainability
Sustainability / Environmental Impact
Asset Condition / Compliance
Legend
Good Data Usage
Fair Data Usage
Poor Data Usage
*Access and quality not as effective to assess overall performance of the Energy sector. Given the generally
consistent quality of electricity, other sources of energy (high-octane petroleum, diesel, hydrogen) the question
of quality is not as pressing as for an example, an internet connected that may vary significantly in speed and
latency. Similarly, access is a less pressing issue for energy in New Zealand given our level of development
and the period over which this has occurred.
Telecommunications and the energy sectors faired relatively well on use of data compared to the other
infrastructure sectors. This is likely driven by the more privatised sectors operating in these sectors, where
there is a financial incentive to make more data driven decisions to increase their productivity and optimise
their assets. In comparison, the other social infrastructure is less driven by these financial incentives, as the
output gains from these sectors are more a social-economic rather than a financial one. For example, quality

| Infrastructure technological performance and needs |
Preparing for Technological Change in the Infrastructure Sector | 3821960-1147589789-62 | 31/05/2021 | 43
investment in the transport sector would benefit the broader communities which do not necessarily result in
financial gains for the transport agencies and organisations operating in this sector.
Whilst the energy sector does not appear to feature well in certain aspects, it is worth noting that the power
sector is unique in the sense that it is broadly measured on three outcomes. Globally, the performance of the
energy sector is defined by three outcomes that countries must balance, termed the energy trilemma: equity
(prices and affordability), energy security, and sustainability. Balancing these outcomes assists with building
productivity and delivering long term wellbeing from the energy sector. Based on these performance
benchmarks, the World Energy Council ranked New Zealand 10th out of 128 countries in the index in 2019,
which is the only Asian-Pacific country in the top 10, with Australia placing 28th. Whilst there is room for
improvement, New Zealand’s energy sector is globally seen to be performing well. The International Energy
Agency, for example, has spoken highly of New Zealand’s electricity market and the market-driven
(nonsubsidised) rise in renewable generation. The World Bank meanwhile notes that the average retail price
of electricity in New Zealand is roughly ~US$0.12 per kWh, placing New Zealand 11th cheapest in the 37
members of the OECD49. It is acknowledged that there have been reports of low-socio economic communities
paying a relatively high portion of their income on electricity consumption, however there may be other non-
energy sector issues being the root cause, such as poor quality of home insulation and inefficient heating
systems.
For the other infrastructure sectors, there are some data collected to help with assessing across performance,
sustainability, and resilience. The infrastructure sectors, however, generally do not have a complete metadata
standard for the entire assets, which makes it difficult to maintain historical records of long-term data and limits
the ability to facilitate interoperability, integrate resources and optimise asset efficiency and life. The Controller
and Auditor-General Insights into Local Government report (2019) noted that many local councils do not yet
have systematic and comprehensive asset condition and performance information. The report also noted that
councils should keep good records of the cost breakdowns of all renewal and replacement contracts as often,
these records are not as complete as they should be.
Intensity of ICT Use
The level of information and communication technology (ICT) use relevant to infrastructure sectors can be
found in MBIE analysis that looked at the intensity of ICT use by New Zealand firms as part of their objectives
to double nation-wide productivity growth. ICT – namely electronic software, hardware and supporting
infrastructure – has been shown to have a positive and significant effect on productivity in nearly all studies on
the subject from the mid-1990s to the present50. Based on the Business Operations Survey (BOS) by Statistics
NZ that contained a module on ICT, the industries relevant to the infrastructure sectors reported are: (1)
construction sector and (2) professional, scientific and technical services. The construction sector has one of
the lowest intensities of ICT use, while the professional, scientific, and technical services sector was ranked
higher. While the construction sector has relatively lower ICT intensity, its results show that it is similar to other
similar goods-producing industries, while the professional services industry’s results are also relatively similar
to others in the information industries.
49 Te Waihanga: New Zealand Infrastructure Commission. “Sector State of Play: Energy Document, Discussion,” February 2021.
https://infracom.govt.nz/assets/Uploads/Energy-Sector-State-of-Play-Discussion-Document-February-2021.pdf.
50 Miller, Ben, and Robert D. Atkinson. “Raising European Productivity Growth Through ICT,” June 2, 2014.
https://doi.org/10.2139/ssrn.3079844.

| Infrastructure technological performance and needs |
Preparing for Technological Change in the Infrastructure Sector | 3821960-1147589789-62 | 31/05/2021 | 44
Figure 9: Intensity of ICT Use by Industries (Source: MBIE51)
Level of innovation and spending on R&D
The level of innovation and spending on research and development can be another lens to understand the
digital infrastructure performance in the infrastructure sector. Based on the sector studies by MBIE, the industry
reports relevant to infrastructure are:
• Construction industry: The construction industry includes firms engaged in the construction of buildings
and other structures, additions, alterations, reconstruction, installation, maintenance, and repairs.
• Knowledge intensive services, which focuses on the professional, scientific, and technical services. One
of the subsectors within this includes the scientific, architectural, and engineering services.
The key findings from these sector reports are as follows:
1. Construction sector has one of the lowest rates of innovation of all sectors of the economy, but is
average in terms of research and development activity
2. Innovation rate and research and development expenditure for professional, scientific and technical
services firms is around the average for all New Zealand firms, but this innovation rate is impacted by
legal and accounting firms that are less likely to report on innovation (and research and development).
The firms that undertook research and development also spent twice the New Zealand average.
51 “Business Information and Communication Technology (ICT) Use and Productivity Growth in New Zealand.” Ministry of Business,
Innovation & Employment, October 2017. https://www.mbie.govt.nz/dmsdocument/3338-business-ict-use-and-productivity-growth-pdf.

| Infrastructure technological performance and needs |
Preparing for Technological Change in the Infrastructure Sector | 3821960-1147589789-62 | 31/05/2021 | 45
Infrastructure sector technological capabilities and culture
Through the research and interview process, there was significant attention raised to capability gaps. Insights
suggested that there were significant capability gaps related to several areas including but not limited to:
• Awareness or foresight related to disruptive or emerging technologies in general, and in infrastructure
application
• Innovation methods
• Strategic procurement and how to incentivise technology innovation and diffusion
• Commercial negotiation
• Complex major programme management.
Capability gaps were discussed as being issues in:
• Central government agencies who commission major works
• Local government and regional authorities
• Industry.
Barriers for the uptake of digital technologies.
As shown earlier, the infrastructure sectors, particularly in construction, have been slow to innovate, but some,
such as those in the utilities are making progress in digitalisation. While each sector has unique challenges,
their needs and gaps have similar themes. In fact, many of these gaps are also not unique to New Zealand.
Based on a Building Innovation Partnership analysis on McKinsey Global Institute industry digitisation index
(Figure 10), the construction industry is shown to have the potential for large productivity gains through further
digitisation. While most research has been focused around construction costs, it is worth noting that the whole
of life costs for maintaining and operating an asset are often higher than its initial capital costs of construction.
As such, for the purpose of this study, we will further classify this as the ‘built environment’ that incorporates
the design, construction, operation, and maintenance of physical infrastructure.

| Infrastructure technological performance and needs |
Preparing for Technological Change in the Infrastructure Sector | 3821960-1147589789-62 | 31/05/2021 | 46
Figure 10: Sectors where Digitalisation Could Transform Productivity (Source: Building Innovation Partnership52, McKinsey53)
From this research, the lack of innovation and uptake of digital technologies in the built environment can be
attributed to several factors:
• Absence of clear leadership or common strategic intent
• Poor validation or value perception of the proposition
• Low profit margins
• Capacity and capability gap
• Procurement and contracting practices
• Management and ownership of risk. liability risks throughout the industry incentivise conservatism and
this is a barrier to getting products accepted for use
• Low investment in training
• Cost to implement
• Uncertainty created by boom-and-bust cycles.
52 Jones, Dan, Robert Amor, and Larry Bellamy. “Position Paper: Digitalisation of the New Zealand Building Industry.” Building
Innovation Partnership, December 2020. https://bipnz.org.nz/wp-content/uploads/2020/12/BIP-Digitalisation-of-the-New-Zealand-
Building-Industry-Position-Paper-digital-version.pdf.
53 Agarwal, Rajat, Shankar Chandrasekaran, and Mukund Sridhar. “Imagining Construction’s Digital Future.” McKinsey & Company,
June 22, 2016. https://www.mckinsey.com/business-functions/operations/our-insights/imagining-constructions-digital-future.

| Infrastructure technological performance and needs |
Preparing for Technological Change in the Infrastructure Sector | 3821960-1147589789-62 | 31/05/2021 | 47
Digital capabilities and career paths
Preparing for technological change in the infrastructure sector requires skills. Central government, local
governments and private companies will require the right employee capabilities to best leverage technological
change. The technological change that must be prepared for is dominated by the need for digital skills 54. The
“Digital Skills for Our Digital Future” report by the New Zealand Digital Skills Forum presents the current and
future landscape of digital skills in New Zealand.
Locally, and globally, there is a shortage of people with advanced digital skills. In New Zealand, the public
sector is the largest employer of digital technology skills and therefore, it is the public sector that has the most
to gain from addressing the advanced digital skills shortage. Presently, the local shortage of people with
advanced digital skills is addressed by immigration. But the coronavirus pandemic has highlighted the lack of
resilience in this approach. In New Zealand, there is a mismatch of local skills and local digital needs.
Employers are looking to hire people with advanced digital skills resulting in the local supply of entry-level
digital skills lacking demand and a pathway into employment55.
Skills wise, New Zealand lags comparative countries such as the UK, USA, Singapore, and Ireland when it
comes to the demand and skills growth for data analytics and cyber security.
Recommendations from the report focus on three areas:
• Building a digital skills pipeline that provides confidence for planning digital training.
• Supporting the transition to work with a national planning platform for education to employment, digital
apprenticeships, expanded internship grants, and a strengthening of the GovTechTalent graduate
programme.
• Upskilling and reskilling through funding and coordinating specialised training across ICT graduate schools
and encouraging industry accreditation.
In the UK, significant investments were made into the establishment of the Government Digital Service (GDS)
in 2008. A core strategic focus for GDS, from the Prime Minister’s office and Cabinet office down was to build
an elite “digital profession” across the civil service. This included significant talent acquisition from the private
sector, professional development, performance incentives, career mobility, high visibility and transformational
roles and programmes for emerging talent. This resulted in a significant leap in digital and technological
capability across the civil service, including those working across infrastructure and defence sectors.
Addressing these digital skills issues broadly and building an elite digital profession across the sector and the
public service will allow for greater digital and technological performance of the public sector in New Zealand,
facilitating the enhanced performance of the whole infrastructure lifecycle.
54 Servoz, Michel. “The Future of Work? Work of the Future!” European Commission, April 2019.
55 Hindle, Sarah, and Graham Muller. “Digital Skills For Our Digital Future.” New Zealand Digital Skills Forum, January 25, 2021.
https://nztech.org.nz/wp-content/uploads/sites/8/2021/01/Digital-Skills-Aotearoa-Report-2021_online.pdf.
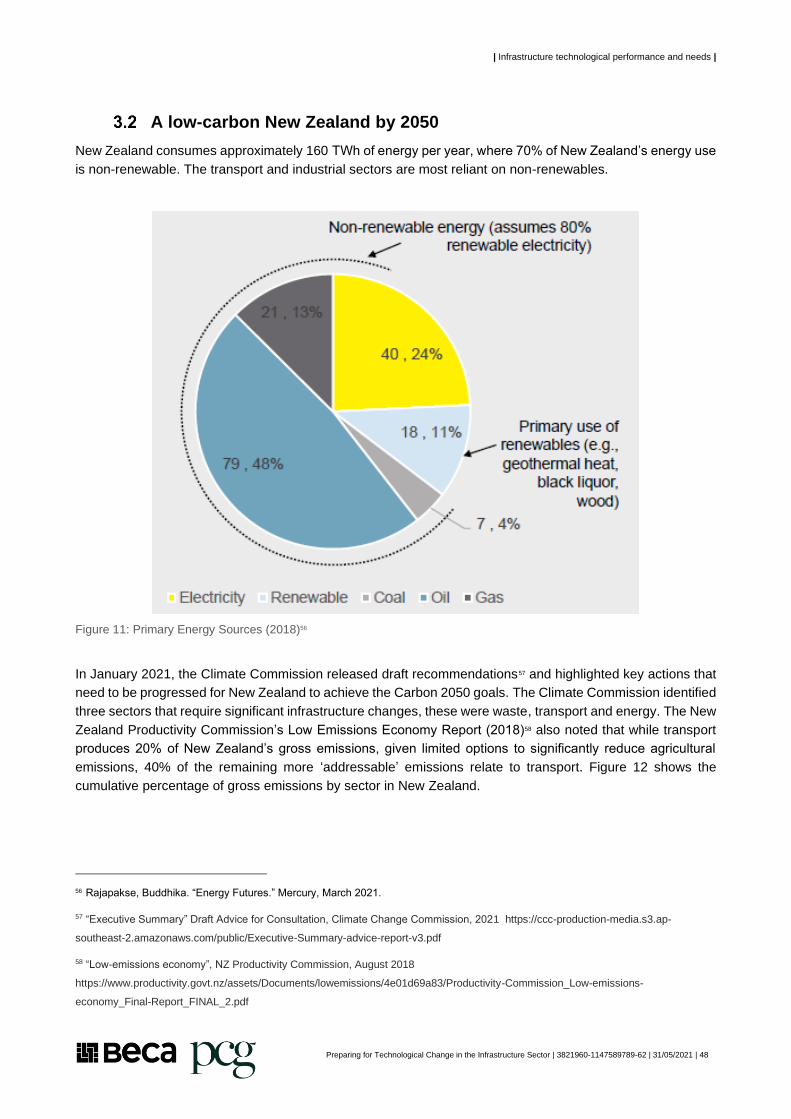
| Infrastructure technological performance and needs |
Preparing for Technological Change in the Infrastructure Sector | 3821960-1147589789-62 | 31/05/2021 | 48
A low-carbon New Zealand by 2050
New Zealand consumes approximately 160 TWh of energy per year, where 70% of New Zealand’s energy use
is non-renewable. The transport and industrial sectors are most reliant on non-renewables.
Figure 11: Primary Energy Sources (2018)56
In January 2021, the Climate Commission released draft recommendations57 and highlighted key actions that
need to be progressed for New Zealand to achieve the Carbon 2050 goals. The Climate Commission identified
three sectors that require significant infrastructure changes, these were waste, transport and energy. The New
Zealand Productivity Commission’s Low Emissions Economy Report (2018)58 also noted that while transport
produces 20% of New Zealand’s gross emissions, given limited options to significantly reduce agricultural
emissions, 40% of the remaining more ‘addressable’ emissions relate to transport. Figure 12 shows the
cumulative percentage of gross emissions by sector in New Zealand.
56 Rajapakse, Buddhika. “Energy Futures.” Mercury, March 2021.
57 “Executive Summary” Draft Advice for Consultation, Climate Change Commission, 2021 https://ccc-production-media.s3.ap-
southeast-2.amazonaws.com/public/Executive-Summary-advice-report-v3.pdf
58 “Low-emissions economy”, NZ Productivity Commission, August 2018
https://www.productivity.govt.nz/assets/Documents/lowemissions/4e01d69a83/Productivity-Commission_Low-emissions-
economy_Final-Report_FINAL_2.pdf

| Infrastructure technological performance and needs |
Preparing for Technological Change in the Infrastructure Sector | 3821960-1147589789-62 | 31/05/2021 | 49
Figure 12: Cumulative Percentage of Gross Emissions by Sector59
The key recommendations for these sectors (in relation to infrastructure change) and how technological
change in infrastructure can support these recommendations is captured below in Table 9.
Table 9: Climate change and technological change for infrastructure opportunities
Sector Climate change commission Recommendation
Technological change in Infrastructure can drive decarbonisation
Waste
Strengthen
commitment to
resource recovery
and reuse
• Analytics & Computation
– Computer to sort rubbish for more effective recycling – reduced
landfill need
• Devices & Automation
– Automated rubbish collection – reduced labour requirements
– Increased quantity of e-waste due to more technological adoption
• Materials, Energy & Construction
– Alternative methods for waste recovery and disposal
59 “Low-Emissions Economy: Issues Paper.” The New Zealand Productivity Commission, August 2017.
https://www.productivity.govt.nz/assets/Documents/50449807ff/Low-emissions-economy-issues-paper.pdf.
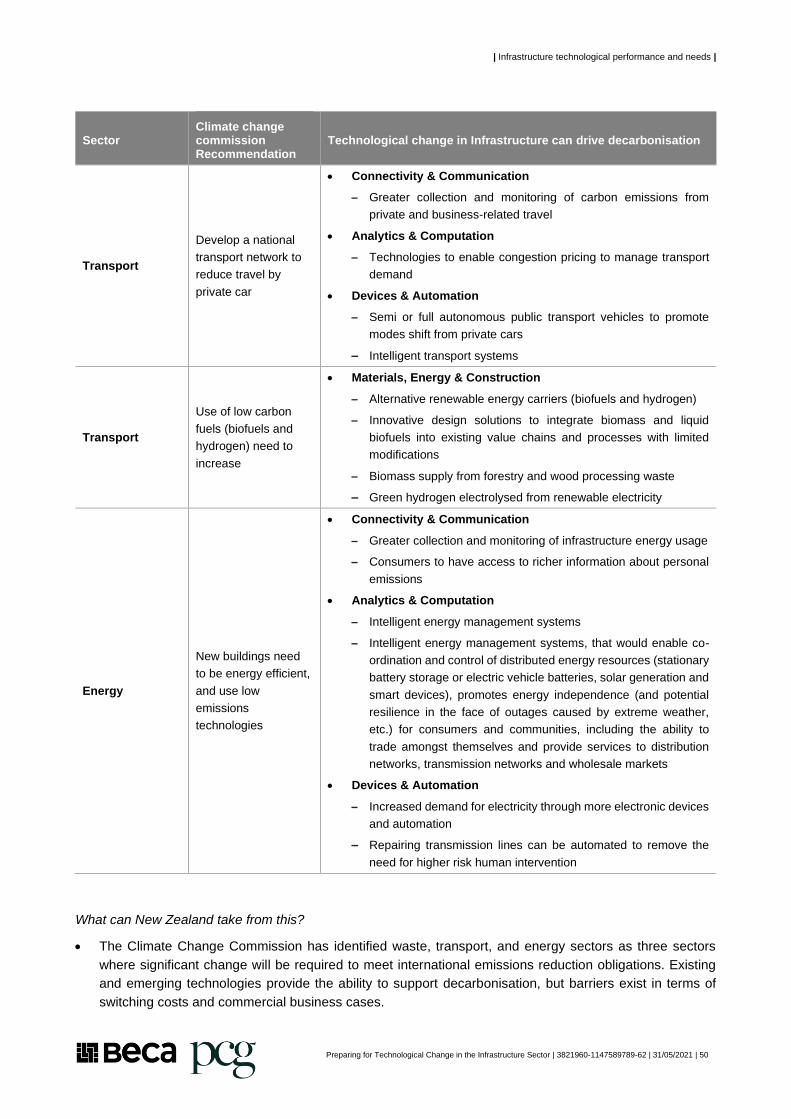
| Infrastructure technological performance and needs |
Preparing for Technological Change in the Infrastructure Sector | 3821960-1147589789-62 | 31/05/2021 | 50
Sector Climate change commission Recommendation
Technological change in Infrastructure can drive decarbonisation
Transport
Develop a national
transport network to
reduce travel by
private car
• Connectivity & Communication
– Greater collection and monitoring of carbon emissions from
private and business-related travel
• Analytics & Computation
– Technologies to enable congestion pricing to manage transport
demand
• Devices & Automation
– Semi or full autonomous public transport vehicles to promote
modes shift from private cars
– Intelligent transport systems
Transport
Use of low carbon
fuels (biofuels and
hydrogen) need to
increase
• Materials, Energy & Construction
– Alternative renewable energy carriers (biofuels and hydrogen)
– Innovative design solutions to integrate biomass and liquid
biofuels into existing value chains and processes with limited
modifications
– Biomass supply from forestry and wood processing waste
– Green hydrogen electrolysed from renewable electricity
Energy
New buildings need
to be energy efficient,
and use low
emissions
technologies
• Connectivity & Communication
– Greater collection and monitoring of infrastructure energy usage
– Consumers to have access to richer information about personal
emissions
• Analytics & Computation
– Intelligent energy management systems
– Intelligent energy management systems, that would enable co-
ordination and control of distributed energy resources (stationary
battery storage or electric vehicle batteries, solar generation and
smart devices), promotes energy independence (and potential
resilience in the face of outages caused by extreme weather,
etc.) for consumers and communities, including the ability to
trade amongst themselves and provide services to distribution
networks, transmission networks and wholesale markets
• Devices & Automation
– Increased demand for electricity through more electronic devices
and automation
– Repairing transmission lines can be automated to remove the
need for higher risk human intervention
What can New Zealand take from this?
• The Climate Change Commission has identified waste, transport, and energy sectors as three sectors
where significant change will be required to meet international emissions reduction obligations. Existing
and emerging technologies provide the ability to support decarbonisation, but barriers exist in terms of
switching costs and commercial business cases.
| Infrastructure technological performance and needs |
Preparing for Technological Change in the Infrastructure Sector | 3821960-1147589789-62 | 31/05/2021 | 51
• There is a need to provide decarbonisation infrastructure investment funding at scale to support carbon
neutrality and technological upgrades. The short-run switching costs are preventing the adoption of
existing (and proven) technologies that will improve reduce waste and carbon emissions and improve
sustainability, meaning that New Zealand is missing out on the social and environmental benefits to be
realised. Examples include the establishment of re-cycling processing in waste using advanced cameras
and AI, water re-use in sewage processing infrastructure, and delays in electrification of industrial process
heat systems. This requires active intervention (funding and plugging coordination failures across the
sector, including but not limited to procurement) so that the benefits of the investment occur earlier, and
other than at asset end of life.
• The carbon produced from infrastructure includes both operational emissions but also embedded carbon
through the construction materials and processes. Understanding the implications of design and
construction decisions is a foundation for delivering to carbon targets. The planning, design and
procurement process is the best place in the infrastructure process to identify these. In addition, there are
number of technologies identified that if adopted will accelerate decarbonisation in the operation of
infrastructure and services. An Infratech programme will identify the framework for evaluating and
implementing technological changes in construction and operations that lead to decarbonisation.
• There is value in examining the use of ISCA for construction across all sectors. Infrastructure development
plays a key role in creating a more sustainable country. With an established Infrastructure Sustainability
(IS) rating scheme, application of the scheme to New Zealand infrastructure projects could drive low-
carbon adaptation and drive technological adoption that will enable this. ISCA’s study, IS Rating Scheme
Return on Investment, finds infrastructure projects rated under the IS Rating Scheme deliver up to NZ$2.60
in benefit for every dollar spent. For instance, Waka Kotahi has recently partnered with ISCA, requiring
ISCA-IS Rating Scheme for capital projects over $15m.

| Infrastructure technological performance and needs |
Preparing for Technological Change in the Infrastructure Sector | 3821960-1147589789-62 | 31/05/2021 | 52
Direct and indirect impact analysis 4

| Direct and indirect impact analysis |
Preparing for Technological Change in the Infrastructure Sector | 3821960-1147589789-62 | 31/05/2021 | 53
4 Direct and indirect impact analysis
Direct impacts on infrastructure
As evident, technological change over the coming 30-year period will directly impact each infrastructure sector
in both similar and unique ways across the infrastructure lifecycle. Te Waihanga and other public organisations
have the opportunity to nurture the infrastructure sector in New Zealand to maximise the positive direct benefits
and minimise the negative direct benefits arising from the changing technological landscape.
Cross-sector and sector specific direct impacts
To analyse the direct impacts of technology change on infrastructure, seven characteristics of infrastructure
were devised, each one falling under a heading of performance, resilience, or sustainability. Each technology
grouping (introduced in section 2.3) was analysed for its potential impact on each characteristic.
Following from the cross-sector analysis of direct impacts, the impacts of technology change on each specific
infrastructure sector were examined. For each technology grouping (where applicable) an example of how that
technology could impact the provision of infrastructure service in the future was noted. From this investigation,
the core relevant technologies for each sector were identified along with the unique barriers and enablers for
technological change.
The resulting general trends in direct impacts from adopting technological change are:
• Existing infrastructure will be made more productive, in some cases reducing or delaying the need for
additional infrastructure and reducing the national infrastructure deficit.
• Increased demands on digital infrastructure will underpin increasing connectivity, processing, and
communications.
• Technology will support increased transparency in the operational performance of infrastructure, including
health and safety and environmental impact.
• Enhanced monitoring of asset condition will facilitate predictive maintenance of infrastructure.
• Technology will facilitate better personalisation of infrastructure services.
• Digitalisation of infrastructure will create cyber-security risks.
• Lower cost of providing infrastructure through improved construction productivity.
The infrastructure deficit
Technological change has the potential to reduce or in some cases increase the infrastructure deficit for each
of the infrastructure sectors as described in Table 10. Reducing the infrastructure deficit that exists in New
Zealand is a core focus for Te Waihanga.

| Direct and indirect impact analysis |
Preparing for Technological Change in the Infrastructure Sector | 3821960-1147589789-62 | 31/05/2021 | 54
Table 10: Impact on the infrastructure deficit across infrastructure sectors
Sector Impact on infrastructure deficit
Telecommunications
• Demand for speed and latency will increase the need for higher capacity
telecommunications infrastructure.
• Growing cyber security threats from increased digitalisation will require
additional IT infrastructure.
Energy
• The need for decarbonisation will increase sustainable energy generation
which will require additional infrastructure to manage electricity infrastructure
peak supply.
• Reduced demand for fossil fuel types will decrease the need for related
infrastructure.
• Improved demand management and energy storage capabilities through
technology can make more efficient use of existing energy infrastructure and
delay the need for new infrastructure.
Water
e) Technology can provide for improved demand management and monitoring
and work to make efficient use of existing capacity, delaying investment in
capacity improvements.
• The role of technology – including IoT – can improve our asset condition
monitoring this will likely lengthen the useful life of networks due to targeted
maintenance.
Resource Recovery and Waste
• Increased electrification and digitalisation of the economy will produce
additional e-waste and increase the need for e-waste management
infrastructure.
• Technology can accelerate advances towards a circular economy, including
more efficient recycling, reducing demand for waste infrastructure.
Transport
• Increased digital communication and management of travel demand through
new technologies can reduce pressure on the existing transport network
capacity and delay the need for new infrastructure.
• Emerging transport technologies might require new types of transport
infrastructure including shared paths and dedicated right-of-ways.
Education, Skills and Research
• Increased virtual learning can reduce the need for higher education
infrastructure.
• Improved monitoring of educational building conditions can facilitate early
maintenance and reduce maintenance costs.
Health and Aged Care
• Increased telehealth and improved health monitoring devices can reduce the
need for additional health infrastructure.
• Increasing digital infrastructure demand for digitised personalised and
accessible health information.
• Improved monitoring of health building conditions can facilitate early
maintenance and reduce maintenance costs.
Appendix D contains the details of an assessment of the direct impacts of technological change using the criteria of Performance, Resilience and Sustainability.

| Direct and indirect impact analysis |
Preparing for Technological Change in the Infrastructure Sector | 3821960-1147589789-62 | 31/05/2021 | 55
The Infrastructure Lifecycle
Technological change over the next 30 years will not only directly impact individual sectors, but also more
broadly the infrastructure delivery process from planning and design, through to construction, operations, and
maintenance across the various infrastructure sectors. The World Bank Group, in their report “Infratech Value
Drivers”, analyse how best to capture value across the asset lifecycle to support the improved integration of
technology with infrastructure. The key findings from the World Bank Group have formed the basis of the
findings in Table 11. Depending on the path taken by the infrastructure sector in New Zealand, the impacts
listed are more or less likely to occur.
Table 11: Direct impacts of technological change on the infrastructure lifecycle
Direct Impacts
Planning & Design
Gathering the Right Data – Emerging technologies will increase the availability of data for design of new infrastructure
with matched decreases in the costs of collecting and sharing this data. Currently there is a lack of data collected for
infrastructure performance which can limit the opportunities for informed forward planning and design. Data collection
via remote methods will improve safety and increase access to previously inaccessible data.
Advanced Analytical Modelling Techniques – Integrated and automated design processes using large quantities of
collected data will optimise decision making for infrastructure planning with more accurate estimates of the benefits of
additional investment. Powerful computational methods will allow wider consideration of effects outside of the direct
impacts of the infrastructure. A national digital twin platform can integrate infrastructure planning and design across
sectors.
Providing Data to Investors – Public funds for investment in infrastructure are limited. Harnessing private investment
through improved access to data about infrastructure performance in real-time allows for greater risk management and
measured investment allocation.
Streamlined Consenting Processes – Digital infrastructure planning within computational models can allow for
automated digital consenting that reduces the approval process for new infrastructure as compliance checks will be
automated.
Construction
Procurement and Contracting – New technologies have the ability to support clearer material specifications, supply
chain management and project controls – including real-time contract management.
Construction Execution – Construction execution is to be enhanced by automated computational processes that
manage construction sites, including staffing and issues with project timelines based on measured progress.
New Manufacturing Processes and Materials – New manufacturing processes, such as 3D printing, have the potential
to dramatically reduce costs as well as reshape supply and logistics chains.
Operations
Operations Readiness and Handover – Increased integration of technology at the operations stage of infrastructure
delivery requires greater coordination between infrastructure construction teams and operations teams. With greater
connection between execution teams and infrastructure operators the required enablers for operational technology can
be installed and facilitated from the outset.
Enhanced Safety, Quality, and Customer Service – Infrastructure delivery and use will increasingly transition to ‘as
a service’ business models that allow greater flexibility of use and cost for the end consumer. Enabling ‘as a service’
infrastructure requires enhanced data collection and connectivity for real-time interaction that will increase safety,
quality, and customer service.

| Direct and indirect impact analysis |
Preparing for Technological Change in the Infrastructure Sector | 3821960-1147589789-62 | 31/05/2021 | 56
Asset Utilisation Optimisation – Existing infrastructure can be optimised to prolong the useful lives by increased
connectivity through IoT and advanced analytics that can respond to end-user demands more accurately.
Automation – Infrastructure delivery will require reduced direct human input through advances in AI, sensors, and
robotics, increasing safety, consistency and reducing costs. Repetitive and more dangerous tasks can be undertaken
by robots with minimal or no human input.
Using Real-Time Data – Managing demand for infrastructure service can be achieved through dynamic pricing, enabled
by real-time data collection through IoT and communication with consumers.
Maintenance
Predictive and Targeted Maintenance – Advanced sensors enabling real-time performance monitoring of assets will
provide rich and frequent data to better respond to maintenance needs. Urgent maintenance can be better predicted
before failure occurs and ongoing maintenance can be economically rationalised based on increased information about
the infrastructure assets.
Remote Supervision – Drones, robotics, improved sensors, and greater connectivity will facilitate remote monitoring
of maintenance (and construction) activities. This reduces potential safety risks while also permitting supervision that
was previously unfeasible.
Decreasing Costs for Renewal Budgets – Improved analytics and monitoring of assets with a whole system view
(similar to targeted maintenance) can optimise the asset renewal process reducing costs. Optimisation can inform the
prioritisation of asset renewals depending on available budgets and provide greater foresight for future budgetary needs.
Increasing Life of Assets – New and advanced materials applied to infrastructure have the ability to greatly increase
the lifespan of assets and reduce maintenance needs.
Applying the Te Ao Māori lens
At its heart, the foundation of Te Ao Māori exists in Whenua, whanau and whakapapa. It starts to ask of us the
impacts of technology on infrastrucure to co-exist in harmony with these elements as the elements of whanau
and whakapapa are ancestoral and must be cared for as such.
“We embrace the Māori concept of te Taiao, a deep relationship of respect and reciprocity with the natural
world. The health of the climate, land, water and living systems comes first. And when nature thrives so do our
families, communities and businesses.”60
Māori wellbeing sits on the foundations of knowing who Māori are and where they come from and forms the
basis for Tūrangawaewae – “the place where we stand with our feet”. Māoridom is firmly rooted in Te Ao and
sitting around that are the four elements of wellbeing from Te Whare Tapa whā as developed by Sir Mason
Durie.
The elements of kawa and other values from Māoridom are the glue to binding all things together within Te
Taiao (Rangitiratanga – the right to decide, Tīkanga – customs, Whanaungatanga – relationships,
Manaakitanga – care and Kaitiakitanga – guardianship). This is not a complete list but gives insight to these
values.
60 Our land and Water Website quote https://ourlandandwater.nz/news/why-te-taiao-matters-and-the-supporting-role-of-our-research/
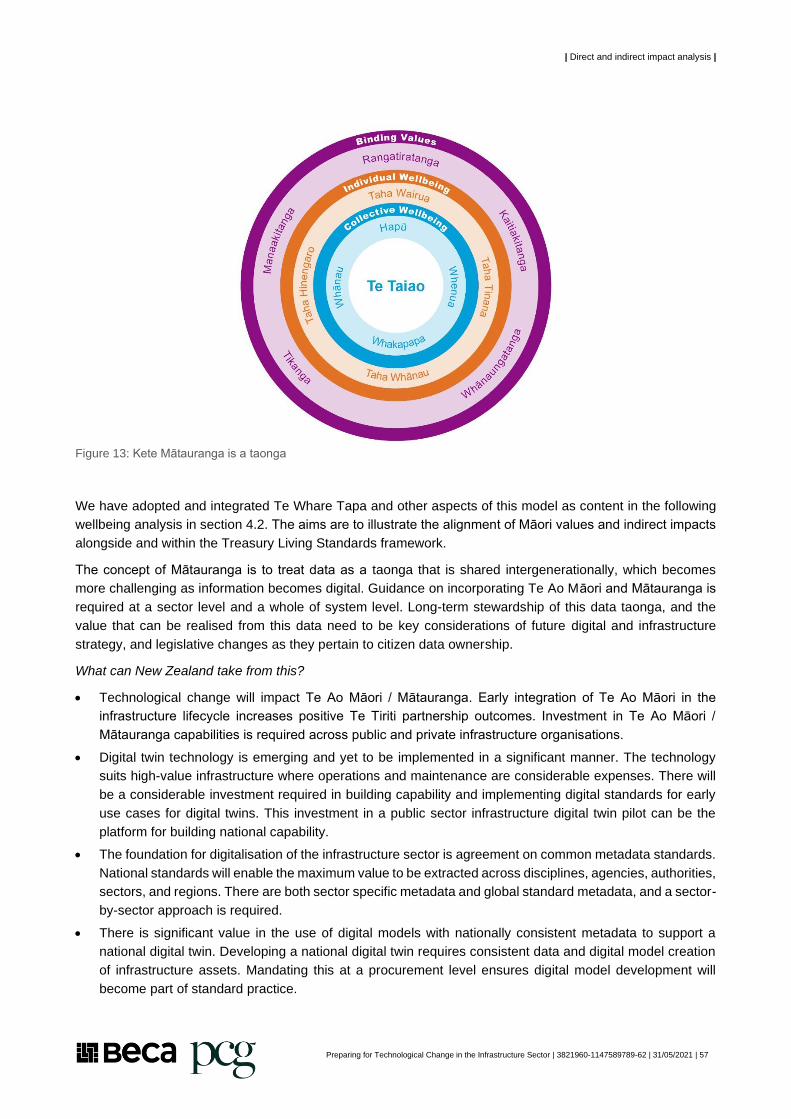
| Direct and indirect impact analysis |
Preparing for Technological Change in the Infrastructure Sector | 3821960-1147589789-62 | 31/05/2021 | 57
Figure 13: Kete Mātauranga is a taonga
We have adopted and integrated Te Whare Tapa and other aspects of this model as content in the following
wellbeing analysis in section 4.2. The aims are to illustrate the alignment of Māori values and indirect impacts
alongside and within the Treasury Living Standards framework.
The concept of Mātauranga is to treat data as a taonga that is shared intergenerationally, which becomes
more challenging as information becomes digital. Guidance on incorporating Te Ao Māori and Mātauranga is
required at a sector level and a whole of system level. Long-term stewardship of this data taonga, and the
value that can be realised from this data need to be key considerations of future digital and infrastructure
strategy, and legislative changes as they pertain to citizen data ownership.
What can New Zealand take from this?
• Technological change will impact Te Ao Māori / Mātauranga. Early integration of Te Ao Māori in the
infrastructure lifecycle increases positive Te Tiriti partnership outcomes. Investment in Te Ao Māori /
Mātauranga capabilities is required across public and private infrastructure organisations.
• Digital twin technology is emerging and yet to be implemented in a significant manner. The technology
suits high-value infrastructure where operations and maintenance are considerable expenses. There will
be a considerable investment required in building capability and implementing digital standards for early
use cases for digital twins. This investment in a public sector infrastructure digital twin pilot can be the
platform for building national capability.
• The foundation for digitalisation of the infrastructure sector is agreement on common metadata standards.
National standards will enable the maximum value to be extracted across disciplines, agencies, authorities,
sectors, and regions. There are both sector specific metadata and global standard metadata, and a sector-
by-sector approach is required.
• There is significant value in the use of digital models with nationally consistent metadata to support a
national digital twin. Developing a national digital twin requires consistent data and digital model creation
of infrastructure assets. Mandating this at a procurement level ensures digital model development will
become part of standard practice.

| Direct and indirect impact analysis |
Preparing for Technological Change in the Infrastructure Sector | 3821960-1147589789-62 | 31/05/2021 | 58
• As infrastructure becomes more connected and reliant on data, the risks around security, management of
data privacy and protection of Intellectual Property grow. Implementation of global best practice for cyber
security and data privacy across infrastructure sectors will help secure lifeline infrastructure. The
vulnerability and future resilience of the three deep-sea cables which connect New Zealand, and the
infrastructure sector to the world also will become more critical in the decades ahead. Considering the vast
technological changes ahead for the infrastructure sector, Te Waihanga, and appropriate intelligence
agencies should conduct a review.
• The benefits of the digitalisation of infrastructure information are maximised when the digitalisation occurs
early in the infrastructure lifecycle. For physical infrastructure, a key lifecycle element is consenting.
Phasing towards digital consenting nationally and piloting AI for consenting will streamline consenting
processes, quicken the pace of infrastructure delivery saving time and money and accelerate the adoption
of technology throughout the lifecycle. The first step towards digital consenting is standardisation (of meta-
data and methods), a coordinated national approach with potential simplification of standards.
• Use of AI in the infrastructure sector has the ability to grow the provision of service at a distance. Given a
focus of the current New Zealand government on addressing issues of equity, developing AI use-cases
for service delivery at a distance can remove the barrier of physical distance from accessing health and
education. Use-cases can demonstrate the potential of the technology and encourage uptake.
• Sectors can more readily adopt technology to improve performance where there are clear measured
performance KPIs and KPIs that reflect the principles of Te Tiriti o Waitangi. NZ lacks a clear national body
to look into the construction sector performance, infrastructure performance, cost, and benefit realisation
(c.f. UK). Te Waihanga would be a likely candidate to take on this responsibility for the infrastructure sector
and would need to develop the capabilities and industry players and technology suppliers.
• Some innovative commercialisation opportunities exist across asset management. Locally and globally,
built infrastructure is in a period of heightened renewal need due to the aging nature of the infrastructure
(e.g. water networks). In developing and adapting technologies to solve the investment prioritisation for
renewal challenges in New Zealand there exists the opportunity to commercialise local innovation on the
global market to create additional value. This would need to be a national programme setup and led by
central government with the funding, IP protection and commercialisation capability. It is likely that it would
provide additional impetus to the development of digital twins for existing / legacy network assets.
• Collecting performance information via IoT, the management of the network using AI, and a move towards
digital twins for optimisation and planning will drive performance transparency. Infrastructure operational
data and more transparency of performance across infrastructure sectors is helpful for citizens, users,
buyers, and the Crown. Where there is transparent performance information, there are clear drivers for
infrastructure owners and operators to respond to supply, cost, and demand drivers. Currently sectors
such as water and transport are operating without the dynamic market signals that other infrastructure
networks have (i.e., energy, telecommunications). Where these market forces do not exist, system level
targets (for efficiency, innovation, digitisation, and human centric benefits) can be implemented with
accountability frameworks around them.

| Direct and indirect impact analysis |
Preparing for Technological Change in the Infrastructure Sector | 3821960-1147589789-62 | 31/05/2021 | 59
Four well-beings analysis
In addition to assessing the direct impact of these technologies for each sector, a review of these technologies
using the Treasury Living Standards framework has also been applied.
It was impractical to apply a Treasury Living Standards Framework61 assessment to every technology identified
from the direct impacts’ sections. We have therefore chosen one key technology for each sector that has a
significant impact to wellbeing.
The technologies were assessed against the four capitals:
• Natural Capital: Environment, Animal health, energy resources, soil, and water
• Human Capital: Capabilities and capacity, skills, and mental health
• Social Capital: Rules, institutions, social norms, customs, values, cultural and community identity
• Financial and Physical Capital: Physical assets, material living conditions, factories, equipment, housing.
Each of the selected technologies has been reviewed to identify the positive and negative impacts to these
capitals, and measures have been identified, mainly using the living standards indicators.6263
Appendix E contains the details of this analysis.
61 “Our Living Standards Framework”, The Treasury, December 12, 2019, https://www.treasury.govt.nz/information-and-services/nz-
economy/higher-living-standards/our-living-standards-framework
62 “Indicators Aotearoa New Zealand”, Statistics New Zealand, https://wellbeingindicators.stats.govt.nz/en/aligning-with-sustainable-
development-goals/
63 “Living Standards Framework”, The Treasury, https://lsfdashboard.treasury.govt.nz/wellbeing/

| Direct and indirect impact analysis |
Preparing for Technological Change in the Infrastructure Sector | 3821960-1147589789-62 | 31/05/2021 | 60
Indirect impacts on infrastructure
As demonstrated above, the impact from technological change on infrastructure will have a significant impact
on New Zealand’s wellbeing, both positively and negatively. Six key findings have been identified through this
work. A summary of key insights is below:
• Currently only Research Management Act (RMA) negative effects are monitored or measured. To date,
the impacts that infrastructure will have on wellbeing has not been monitored well. In most cases, the only
attributes that require to be monitored, are where the RMA has identified ‘negative effects’. Through RMA
hearings, the measurement of these negative effects is agreed upon, and therefore have to be measured.
As technological change occurs in infrastructure, additional data will be gathered using IoT / Sensors. This
additional data needs to consider wider wellbeing measures and the data needs to be gathered and
reported on to help measure the benefits across each of the four capitals.
• Within the New Zealand Government Procurement guidelines, there is no requirement to monitor any
wellbeing attributes: New Zealand Government procurement guidelines promotes a ‘whole of life’
consideration for construction projects. The core focus of this document is around:
o Through life costs (end to end costs for the projects)
o Benefits (investment benefits, design quality, flexibility)
o Environment (Carbon used for construction, energy rating)
• There is a lack of consideration of Te Ao Māori indicators for infrastructure projects. Within the Treasury
Living Standards Indicators, there is a lack of indicators which can be used to measure the impact from a
Te Ao Māori perspective. This would need to be developed for each key infrastructure project, along with
local iwi / hapū to fully understand the implications this new infrastructure would have on their role. The
development of these indicators needs ongoing funding to support this mahi.
• Key considerations for wellbeing enhancement in preparing the infrastructure sector for technological
change could be a) as part of the current RMA reform, we need to include provisions for data gathering
that will support benefit tracking across each of the four capitals (including Mātauranga Māori), and b) as
part of a review of the New Zealand Government Procurement and Property guidance, consider as a
requirement that appropriate data is gathered from new infrastructure projects across the four capitals
(including Mātauranga Māori).
• The delivery of services via digital infrastructure will help reduce geographical inequity and reduce costs
of delivery through less travel and better scale. This could be in the form of basic video conferencing,
through to advanced robotics via augmented reality. It is expected that this will lead to an improvement in
the levels of services outside the main population centres, and the reduction in the need for new capital
infrastructure.
• In sectors with significant ongoing deaths and serious injuries (transport, health), Artificial Intelligence
provides a potentially effective way of reducing harm. It is possible to identify narrow use cases for AI
where significant benefits may accrue. For transport this could include active collision avoidance
technologies focussed on reducing pedestrian and cycling injuries, and in health this could include
identification of common factors leading up to harm incidents and detecting these before harm occurs.

| Direct and indirect impact analysis |
Preparing for Technological Change in the Infrastructure Sector | 3821960-1147589789-62 | 31/05/2021 | 61
What can New Zealand take from this?
• Technological change will impact across the lifecycle of infrastructure from planning and delivery to
operation and maintenance. Digitalisation has the potential to reduce infrastructure development times,
decrease costs of construction, change the skills needed, and increase the life of assets. Through this
increased productivity and life extension, the infrastructure deficit for significant infrastructure investment
may be reduced. Additionally, through technologically enabled predictive maintenance, the effort and
funding for repairs and renewals may also be reduced or provide greater benefits.
• There is work being done internationally to introduce digitalisation and digital twins. New Zealand, similar
to most comparative countries, is yet to have a mandate for digitalisation of infrastructure assets early in
their asset lifecycle. This is a significant opportunity and in the longer term there is potential for national
digital twins.
• Digitalisation will bring increased risks for New Zealand, particularly in cyber security, and the current
sector by sector approach may need to be coordinated, particularly for critical infrastructure.
• Early integration of Te Ao Māori in the infrastructure lifecycle will increase positive Te Tiriti partnership
outcomes. Investment is required in Te Ao Māori / Mātauranga capabilities across public and private
infrastructure organisations. An agreed approach is required for upholding Māori data and information
Sovereignty.
• As New Zealand looks to reform the RMA, there is the potential to reconsider data gathering for that will
support benefit tracking across each of the four wellbeing capitals, including Te Taiao.
• Any changes in technology in infrastructure will potentially have both positive and negative impacts on
geographical or socio-economic equity.

| Direct and indirect impact analysis |
Preparing for Technological Change in the Infrastructure Sector | 3821960-1147589789-62 | 31/05/2021 | 62
Policy and regulatory considerations: preparing for technological change
5

| Policy and regulatory considerations: preparing for technological change |
Preparing for Technological Change in the Infrastructure Sector | 3821960-1147589789-62 | 31/05/2021 | 63
5 Policy and regulatory considerations: preparing for
technological change
Policy and regulatory implications
The purpose of this section is to assist policymakers and regulators to distil system-wide implications from the
preceding analysis, and to propose areas where further development of policy, public strategy or regulatory
responses is warranted.
To do so we have brought together material from a range of sources:
• Our reading of relevant international best practice precedents, including recent policy and regulatory
material from other jurisdictions
• Wide-ranging infrastructure sector experience and practice, distilled through interviews, practice
knowledge and New Zealand published sources.
• A legal and regulatory review by one of New Zealand’s most prominent law firms, a member of one of the
world’s largest legal consortia.
Several caveats are in order:
• This section is focused at the general level of infrastructure policy and innovation systems. It does not
purport to convey technology or sector-specific or discipline specific recommendations. Analysis is
qualitative and supported with citations and references, including from primary research.
• Technology change and innovation is by nature dynamic and uncertain. Our era appears to be marked by
high levels of change in climatic, environmental, geo-political, economic, social, and political dimensions
– as well as complex system interactions between them.
• Recommendations should therefore be read as hypotheses that warrant further consideration to lift the
value and utility of infrastructure and digital performance, resilience, and sustainability.
In preparing this overview we have addressed the legal and regulatory issues in two layers:
• Systemic issues of policy and regulatory strategy and approach, including:
o Managing dynamism and uncertainty
o A mission-based approach
o Digital strategy
o Infrastructure as a system
o Approach to regulation
• Specific legal and authorising environment issues:
o Digital citizenship
o Privacy and cyber security
o Ownership of data
o Procurement
For each specific category we assess the current state and ask what New Zealand should aspire to from a
legal, regulatory and policy perspective, in order to minimise the legal, regulatory and policy barriers to
technological change that might impede the performance of the infrastructure sector.

| Policy and regulatory considerations: preparing for technological change |
Preparing for Technological Change in the Infrastructure Sector | 3821960-1147589789-62 | 31/05/2021 | 64
Managing dynamism and uncertainty in a digital age
From major infrastructure to household products, there will be a convergence of the digital and physical –
information, services and products will become virtually inseparable. The Internet of Things will connect myriad
devices in our personal lives. Artificial intelligence will sort our emails, assist children with learning, optimise
the performance of our vehicles, transport infrastructure and utilities.
Citizens will generate vast amounts of data that will be valuable to both service providers and commercial
actors, as well as creating vulnerabilities from a privacy and cyber security perspective. The privacy of this
data and the resilience of our household, business and governance systems to intrusion will become ever
more critical.
The ability of all New Zealanders to participate reasonably equitably in this new and necessary online digital
sphere and to interact with each other and their government (at all levels) will become a vital test of citizenship
– and increasingly seen as both a human right and a Te Tiriti o Waitangi imperative as iwi, hapū insist on both
full digital participation and ownership of Mātauranga rights in the digital domain.
In this context both digital infrastructure (connectivity, processing power and storage) will be a critical enabler.
So too will be the impact of digital layer on so-called ‘hard’ infrastructure – from energy-efficient, low-carbon
transport technologies to sustainable energy generation, to self-monitoring three waters infrastructure, and so
on.
Of growing complementary importance will be the service and social infrastructure that increasingly becomes
inseparable from the pipes, roads and other utilities that have been the traditional focus of infrastructure policy.
How should policy and strategy address such pervasive and essential topics in a context of fundamental,
ongoing, and often discontinuous change? The drivers of technology change might be considered both:
• Endogenous: driven from ongoing technological innovation and the convergence of technologies, fuelled
by advances in processing power, blockchain, big data, crypto tech, deep learning, nanotechnology, and
rapid advances in the richness and reach of communications technologies such and 5, 6 and 7G mobile;
low orbit mesh satellites, and energy / telecommunications / media convergence.
• Exogenous: the impact of ‘external’ change drivers, including climate change and the drive to carbon
neutrality; geo-political instability (including the potential bifurcation of the internet); social responses to
the impact of technology change on the future of work, and political manifestations of inequality, exclusion
and extremism.
• Complex system interaction: where endogenous and exogenous factors collide in ways that are
unpredictable but far reaching.
While we can extrapolate current trends, policy makers cannot determine what the future will look like over say
a 30-year period involving multiple technology life cycles. This challenge is not limited to public policy makers
– the practice of strategy generally has been challenged by the rise of dynamism and uncertainty. Management
theory is increasingly stressing agility and dynamic capabilities.
Public policy and strategy are guided by global trends in economic and political orthodoxy. A growing body of
literature64 tests the ability of ‘standard’ economics to deal with critical environmental threats. Public policy
appears to be challenged by the potential insufficiency of purely market-based strategies to deal with
discontinuous change, and an apparent lack of adaptive, agile, and active public policy responses.
64 Martin, James. The Meaning of the 21st Century: A Vital Blueprint for Ensuring Our Future. New York: Riverhead Trade, 2007.

| Policy and regulatory considerations: preparing for technological change |
Preparing for Technological Change in the Infrastructure Sector | 3821960-1147589789-62 | 31/05/2021 | 65
These contextual issues are important for public policy guiding the future of infrastructure and our digital
commons. Infrastructure investments are typically large and relatively long-lasting. Innovation performance is
impacted by public policy settings.

| Policy and regulatory considerations: preparing for technological change |
Preparing for Technological Change in the Infrastructure Sector | 3821960-1147589789-62 | 31/05/2021 | 66
Public policy and wellbeing
The New Zealand Government employs the Living Standards Framework (LSF) to guide investment decisions
in pursuit of higher living standards for all New Zealanders. It seeks to integrate decision making across four
capitals: physical / financial, social, human, and natural.65 Infrastructure decisions are made to maximise their
beneficial impact on society by estimating their benefits and costs in terms of each of the four capitals. The
Better Business Case process then allows these benefits to be modelled out according to clearly established
criteria.66
Figure 14: Treasury's Living Standards Framework
However, the policy goals of the LSF67 can be distinguished from the day-to-day reality of an agency theory /
contracting approach to infrastructure procurement that has arguably contributed to a ‘race to the bottom’ of
65 “Our Living Standards Framework”, The Treasury, December 12, 2019, https://www.treasury.govt.nz/information-and-services/nz-
economy/higher-living-standards/our-living-standards-framework
66 The Treasury. “BBC Guidance,” January 13, 2020. https://www.treasury.govt.nz/information-and-services/state-sector-
leadership/investment-management/better-business-cases/guidance.
67 The Treasury. “Why We Need the Living Standards Framework,” December 12, 2019. https://www.treasury.govt.nz/information-and-
services/nz-economy/higher-living-standards/our-living-standards-framework/why-we-need-living-standards-framework.

| Policy and regulatory considerations: preparing for technological change |
Preparing for Technological Change in the Infrastructure Sector | 3821960-1147589789-62 | 31/05/2021 | 67
short-term, cost-based decision-making historically typical in New Zealand.68 While the LSF takes a strongly
integrative perspective, it is not clear whether the practices of infrastructure strategy, procurement and
governance employed in New Zealand perform to the aspirations set out in the framework.
68 “Governing for the Future” NZ Climate Change Research Institute, November 17, 2015 https://www.wgtn.ac.nz/sgees/research-
centres/ccri/events/events-slides/Jonathan-Boston-Seminar-17-Nov-2015.pdf

| Policy and regulatory considerations: preparing for technological change |
Preparing for Technological Change in the Infrastructure Sector | 3821960-1147589789-62 | 31/05/2021 | 68
National system-level direction
Infrastructure investments are large and risky, and digital technology involves rapid innovation cycles and
dynamic uncertainty. Outcome-oriented strategic direction and public policy goals can reduce this risk and
improve contracting conditions for both public and private sector partners.
Depending on whether private markets can be expected to function well to deliver them, whether specific
intervention is required to offset a market impediment (for example, market dominance), or whether the
challenge is such that wholesale state intervention or public provision is required (for example, pure public
goods, major emergency management), public policy can adapt to seek the best mix of public and private
provision.69
Interventions into the market, and indeed market conditions, can be shaped. At the system level, there has
been a vacuum of direction across several domains. Firstly, the clarity and comprehensiveness of the
economic outcome statements from this Government and previous governments has been variable. There are
growing calls for a revision of existing research, science, and innovation strategy (RSI) for New Zealand in
light of COVID-19 among other factors. There are not in place clear and agreed long term infrastructure
outcome statements that are far reaching out past 30 years in New Zealand that are aligned and reinforce the
economic strategies and outcome statements. There is not a comprehensive spatial planning strategy in place
that gives the market and industry players clarity and some certainty about an integrated programme of work
that spans 20, 30 or even 40 years. Infrastructure NZ70 and others have been clear in their calls for many of
these national, system level gaps to be filled to be more in line with best practices in Hong Kong, Ireland and
Scotland. which bring strategic national decisions of economy, society and the built environment together in
an aligned outcome framework.
Investing in new technology for infrastructure introduces additional financial risk. Developing a long-term
national spatial planning strategy will provide greater investment certainty for public and private agents and
allow for more opportunities for technological integration.
69 Wade, Robert. Governing the Market: Economic Theory and the Role of Government in East Asian Industrialization. Revised edition.
Princeton University Press, 2003.
70 Infrastructure New Zealand. “Infrastructure as Strategy Report.” Infrastructure New Zealand, 2020.
https://infrastructure.org.nz/resources/Documents/Reports/Infrastructure%20as%20Strategy%20Report.pdf.
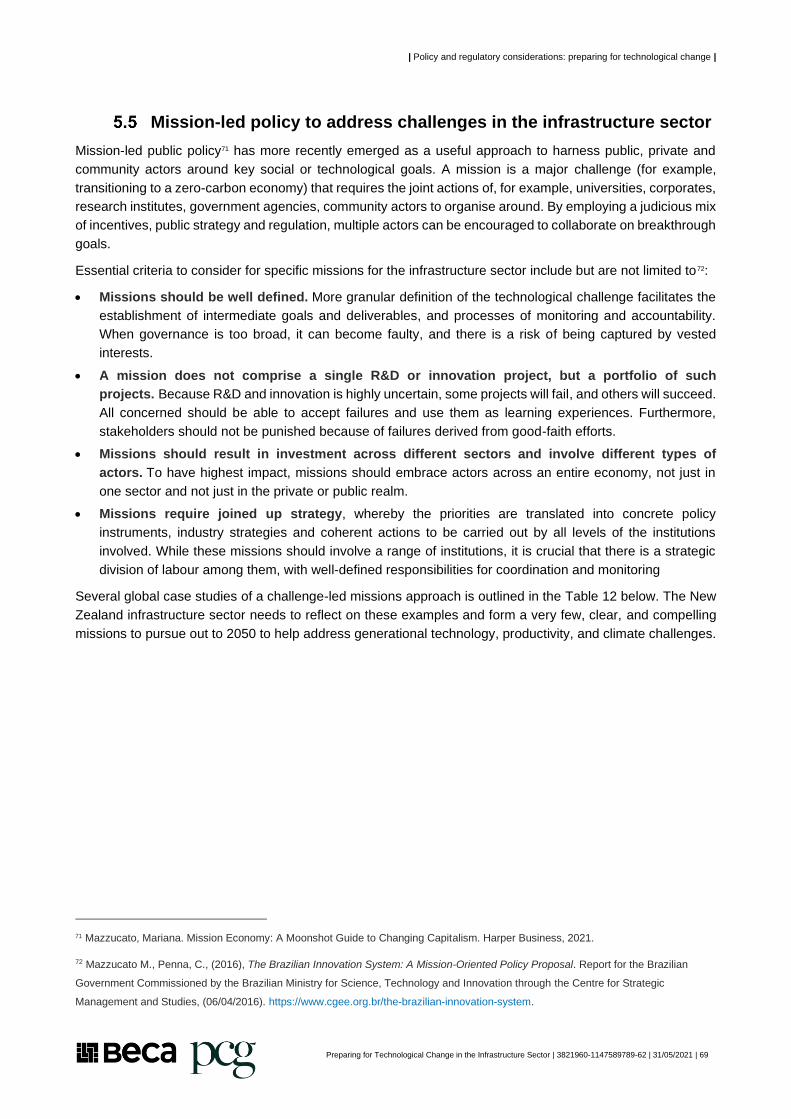
| Policy and regulatory considerations: preparing for technological change |
Preparing for Technological Change in the Infrastructure Sector | 3821960-1147589789-62 | 31/05/2021 | 69
Mission-led policy to address challenges in the infrastructure sector
Mission-led public policy71 has more recently emerged as a useful approach to harness public, private and
community actors around key social or technological goals. A mission is a major challenge (for example,
transitioning to a zero-carbon economy) that requires the joint actions of, for example, universities, corporates,
research institutes, government agencies, community actors to organise around. By employing a judicious mix
of incentives, public strategy and regulation, multiple actors can be encouraged to collaborate on breakthrough
goals.
Essential criteria to consider for specific missions for the infrastructure sector include but are not limited to72:
• Missions should be well defined. More granular definition of the technological challenge facilitates the
establishment of intermediate goals and deliverables, and processes of monitoring and accountability.
When governance is too broad, it can become faulty, and there is a risk of being captured by vested
interests.
• A mission does not comprise a single R&D or innovation project, but a portfolio of such
projects. Because R&D and innovation is highly uncertain, some projects will fail, and others will succeed.
All concerned should be able to accept failures and use them as learning experiences. Furthermore,
stakeholders should not be punished because of failures derived from good-faith efforts.
• Missions should result in investment across different sectors and involve different types of
actors. To have highest impact, missions should embrace actors across an entire economy, not just in
one sector and not just in the private or public realm.
• Missions require joined up strategy, whereby the priorities are translated into concrete policy
instruments, industry strategies and coherent actions to be carried out by all levels of the institutions
involved. While these missions should involve a range of institutions, it is crucial that there is a strategic
division of labour among them, with well-defined responsibilities for coordination and monitoring
Several global case studies of a challenge-led missions approach is outlined in the Table 12 below. The New
Zealand infrastructure sector needs to reflect on these examples and form a very few, clear, and compelling
missions to pursue out to 2050 to help address generational technology, productivity, and climate challenges.
71 Mazzucato, Mariana. Mission Economy: A Moonshot Guide to Changing Capitalism. Harper Business, 2021.
72 Mazzucato M., Penna, C., (2016), The Brazilian Innovation System: A Mission-Oriented Policy Proposal. Report for the Brazilian
Government Commissioned by the Brazilian Ministry for Science, Technology and Innovation through the Centre for Strategic
Management and Studies, (06/04/2016). https://www.cgee.org.br/the-brazilian-innovation-system.

| Policy and regulatory considerations: preparing for technological change |
Preparing for Technological Change in the Infrastructure Sector | 3821960-1147589789-62 | 31/05/2021 | 70
Collaborative mission-orientated approaches between industry and the state: global case studies
Table 12: Global case studies
Country Mission-type Approach
Chile73
Techno-economic challenge to upgrade and transform industrial structures and improve productivity in the Chilean mining industry.
The Chilean mining case was motivated by the ambition to foster innovation all along the mining value chain while promoting the adoption of green technologies. Technological solutions were to consider the scale of the Chilean mining sector and country-specific strengths. This is common in some resource dependent countries, aiming to transform a core sector of the economy by boosting innovation and technological development and creating new markets and sectors around it. Some of the most ambitious research, development, and innovation projects carried out under the initiative were the development of new technologies to monitor and map existing tailings, for zero-waste mining technologies, for a dual hydrogen–diesel combustion system for mining extraction trucks, and for climate smart mining
UK74
Industry transformation and knowledge intensive economic growth
For example, in the UK this approach was employed as part of efforts to transform industry. A cross-sector group worked across the country to define Grand Challenges which included artificial intelligence and data; ageing society; clean growth, and future of mobility.75 Specific cross-sector missions were then developed orchestrating state action, investments and developments industry side. For example, with respect to the clean growth challenge – two specific cross-sector missions were agreed, a) “halve the energy use of new buildings by 2030” and b) “establish the world’s first net-zero carbon industrial cluster by 2040”.
Germany
Clean energy transformation Germany’s Energiewende policy, for instance, aims to combat climate change, phase-out nuclear power, improve energy security by substituting imported fossil fuel with renewable sources, and increase energy efficiency. By providing a direction to technical change and growth across different sectors, Energiewende is tilting the playing field in the direction of a desired socio-economic goal. Importantly, it is not just about growing ‘green sectors’—it has required many sectors, including traditional ones such as steel, to transform themselves, and leads to changes in patterns of production, services and consumption of energy.
73 “The Age of Missions”, Inter-American Development Bank, 2020 https://publications.iadb.org/publications/english/document/The-Age-
of-Missions-Addressing-Societal-Challenges-Through-Mission-Oriented-Innovation-Policies-in-Latin-America-and-the-Caribbean.pdf
74 “A Mission-Oriented UK Industrial Strategy”, Institute for Innovation and Public Purpose, May 22 2019,
https://www.ucl.ac.uk/bartlett/public-purpose/publications/2019/may/mission-oriented-uk-industrial-strategy
75 “The Grand Challenges”, Department for Business, Energy & Industrial Strategy, last modified January 26 2021,
https://www.gov.uk/government/publications/industrial-strategy-the-grand-challenges/industrial-strategy-the-grand-challenges

| Policy and regulatory considerations: preparing for technological change |
Preparing for Technological Change in the Infrastructure Sector | 3821960-1147589789-62 | 31/05/2021 | 71
Columbia76
Live digital plan to boost engagement with the internet for greater socio-economic welfare
This initiative was guided by five basic principles: a) promote the development of the private sector to expand infrastructure, b) incentivise supply and demand of digital services to reach a critical mass, c) reduce regulatory and tax barriers to facilitate deployment of infrastructure and offer of telecommunications services, d) prioritise state resources in capital investments. Set an example through governmental action. The National Fibre Optic Strategy was a mission-oriented policy experiment that aimed to connect 788 municipalities that did not have access to fibre optic to generate adequate conditions for the telecommunications sector to increase its coverage.
Mission-orientated approaches to driving infrastructure and decarbonisation: global outlook
There has been a national system level direction set, and governments have stepped up to shape the direction
of the infrastructure sector toward design and delivery of infrastructure that is less carbon intensive and more
technologically enabled. In many cases, there was an uptick in adoption and diffusion of existing technologies
and capabilities, and investment in R&D into emerging technologies across infrastructure.
International examples:
a) Canadian Infrastructure Bank (CIB) Structure & Functions
The Canadian Infrastructure Bank (CIB) was established in 2017 to deliver infrastructure through partnerships
between governments and the private sector. This bank is wholly owned by the Canadian Government. CIB
invests in revenue-generating infrastructure in partnership with federal, provincial, territorial, municipal,
indigenous and private sector partners.
Functions are defined in the Canada Infrastructure Bank Act, with $35 Billion approved through the Canadian
Government. The Canadian government sets priorities for spending, priorities include:
• Public Transit, including major transit projects, and zero-emission buses with a long-term target of
$5 billion in investments
• Green Infrastructure, including energy efficient building retrofits, water and wastewater with a long-term
target of $5 billion in investments
• Trade and Transport, including trade corridors, bridges, passenger rail, and agricultural infrastructure,
with a long-term target of $5 billion in investments
• Broadband, including for unserved and underserved community broadband connectivity with a long-term
target of $3 billion in investments
• Clean Power, including renewables, district energy, storage and transmission with a long-term target of
$5 billion in investments.
76 “The Age of Missions”, Inter-American Development Bank, 2020 https://publications.iadb.org/publications/english/document/The-Age-
of-Missions-Addressing-Societal-Challenges-Through-Mission-Oriented-Innovation-Policies-in-Latin-America-and-the-Caribbean.pdf
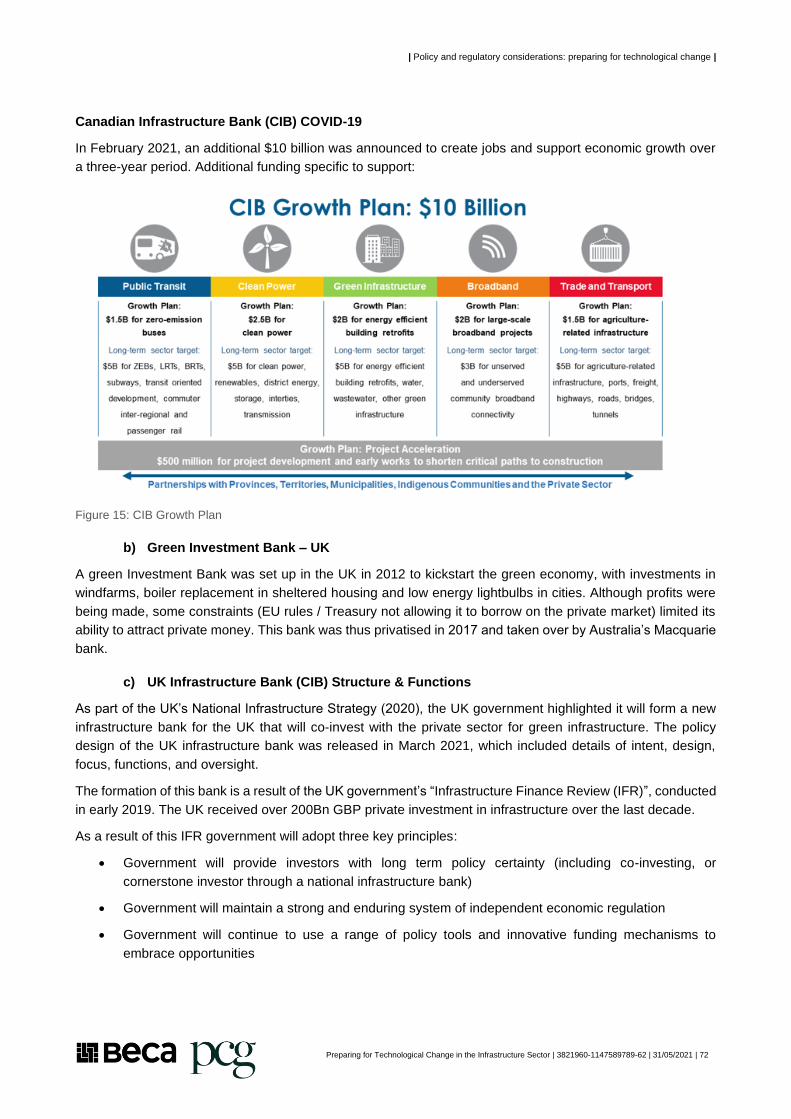
| Policy and regulatory considerations: preparing for technological change |
Preparing for Technological Change in the Infrastructure Sector | 3821960-1147589789-62 | 31/05/2021 | 72
Canadian Infrastructure Bank (CIB) COVID-19
In February 2021, an additional $10 billion was announced to create jobs and support economic growth over
a three-year period. Additional funding specific to support:
Figure 15: CIB Growth Plan
b) Green Investment Bank – UK
A green Investment Bank was set up in the UK in 2012 to kickstart the green economy, with investments in
windfarms, boiler replacement in sheltered housing and low energy lightbulbs in cities. Although profits were
being made, some constraints (EU rules / Treasury not allowing it to borrow on the private market) limited its
ability to attract private money. This bank was thus privatised in 2017 and taken over by Australia’s Macquarie
bank.
c) UK Infrastructure Bank (CIB) Structure & Functions
As part of the UK’s National Infrastructure Strategy (2020), the UK government highlighted it will form a new
infrastructure bank for the UK that will co-invest with the private sector for green infrastructure. The policy
design of the UK infrastructure bank was released in March 2021, which included details of intent, design,
focus, functions, and oversight.
The formation of this bank is a result of the UK government’s “Infrastructure Finance Review (IFR)”, conducted
in early 2019. The UK received over 200Bn GBP private investment in infrastructure over the last decade.
As a result of this IFR government will adopt three key principles:
• Government will provide investors with long term policy certainty (including co-investing, or
cornerstone investor through a national infrastructure bank)
• Government will maintain a strong and enduring system of independent economic regulation
• Government will continue to use a range of policy tools and innovative funding mechanisms to
embrace opportunities

| Policy and regulatory considerations: preparing for technological change |
Preparing for Technological Change in the Infrastructure Sector | 3821960-1147589789-62 | 31/05/2021 | 73
Digital Strategy
The 2005-8 Digital Strategy 2.0 set an overarching direction for digital development based on ‘three Cs’ of
Connectivity, user Capability and Content:
• The ability to connect to, access, manipulate, create, store, and transmit information with richness, reach
and speed, combining to support advanced ‘neural’ networks and cores that themselves generate positive
innovation externalities.
• Supporting New Zealanders to be confident and capable to use digital technology, including through
education, online safety, cyber security, and privacy.
• A world class digital environment creates value only when the applications, process, and content lead to
value creation. Accordingly, attracting capital, talent and technology to our digital commons becomes and
crucial determinant of future wellbeing, including:
o Improving the productivity and resilience of exiting industries
o Enabling the creation and growth of new firms and industries
o Improving the efficiency and resilience of existing and future infrastructure
o Helping NZ address future challenges and missions.
MBIE has launched a series of industry transformation plans (ITPs), including in 2019 a plan related to the
digital services industry.77 The digital service ITP was also updated in 2020 in response to
COVID-19. The digital technologies sector contributes almost $6.5bn to GDP. There were over 76,000 people
employed in this digital sector, many of them spread across sectors with the average salary ($119,422), almost
two times the New Zealand average ($59,703), meaning it is a high value, high wage sector and are far more
likely to invest in R&D than the average, as well as engage internationally and export.
Relevant to this report, the ITP identifies AI and Māori tech success as key growth engines and the government
and data as critical foundations for success. However, with the exception of 5G, the ITP is largely silent on the
interrelationship between infrastructure and the digital sector. The potential multiplier effects for greater
technological advancement in infrastructure as a result of the Government’s expected $21bn+ upcoming
investments into infrastructure have not been linked to digital diffusion of technology advancement. It is also
silent on the opportunity for shaping the directionality of the infrastructure spend, and the digital sector growth
initiatives spend to shift the entire system toward a more digitally enhanced and decarbonised future that also
creates significant digital economy growth, and potential export / IP opportunities therein.
There is an opportunity to deepen the national digital strategy framework related to Infratech. “Infratech” is the
deployment or integration of digital technologies with physical infrastructure to deliver efficient, connected,
resilient and agile assets. This combination of physical and digital infrastructure designs and produces assets
that respond intelligently, or inform and direct their own maintenance, use and delivery. These assets may also
be automated and responsive to real-time or historical data. This produces benefits not only for the
developer/operator, but also to the end-user in terms of efficiency, productivity, and a better overall user
experience. For example; the deployment of connected sensors in a public space (such as around a transport
hub) to optimise and re-direct footfall pathways during busy periods using data analytics; the deployment of
sensors in train tunnels to inform maintenance decisions; and, the deployment of smart motorway technology
to actively manage traffic flows and optimise the motorway network and monitoring of assets in remote
locations easily.
77 “Digital Technologies Industry Transformation Plan”, Ministry of Business, Innovation and Enterprise,
https://www.mbie.govt.nz/dmsdocument/11638-digital-technologies-industry-transformation-plan

| Policy and regulatory considerations: preparing for technological change |
Preparing for Technological Change in the Infrastructure Sector | 3821960-1147589789-62 | 31/05/2021 | 74
A significant portion of our future economic growth will depend on enhanced international connectivity to
improve productivity, access specialist skills and capital, and increase export volumes and values.78 Thanks to
helpful reforms in the telecommunications market, once national fibre roll out in 2022 is complete, New Zealand
will be leading in terms of fibre access. The digital network is robust – speeds are largely in line with the US
and during the March 2020 COVID-19 lock down, there was historic usage, yet normal speeds were
maintained.79
We currently have very limited diversity in deep sea cables connecting us digitally to the world. Of the three
currently operational cable, the most recent one came online in 2018 and another cable is due to come online
in 2022. The private sector appears to be able to develop sufficient infrastructure to meet New Zealand’s
fibreoptic cable needs. However, it is unclear what future needs New Zealand will have for international data
transfers as digitalisation intensifies, and there does not appear to be a publicly available long-term plan or
strategy for future international cable needs. A future upgrade of the digital strategy could therefore help to
shed light on New Zealand’s future fibreoptic cable needs and if there is a place for government in delivering
these needs. This is and will continue to be over the coming 30 years a key strategic infrastructure asset and
national security consideration.
While the now aged 2006 Digital Strategy was successful and has been built upon since (Digital Nation policy
programme among others since), it is timely to ask whether New Zealand’s digital policy and strategy settings
are fit for purpose in so far as they impact digital infrastructure performance and preparedness. The three
goals would appear to remain relevant – connection, capability, and content creation – but the stakes have
been raised. As bandwidth and processing power accelerates, so too do the potential applications. Conversely,
when digital participation and the benefits of digital infrastructure are ever more important, so too the
consequences of exclusion are more radically disempowering. When big data is everywhere and data is the
‘new oil’, vulnerabilities around loss of privacy, online harm and cyber insecurity are crucial to avoid. For a
timely revision, a refreshed “Digital Strategy 4.0” should consider:
• Citizenship (including Te Tiriti o Waitangi): digital access (including affordability) is now essential to
participation in society, so is increasingly seen as a right of citizenship
• Infratech and innovation
• Anticipatory regulation, especially in AI
• Global connectivity – capacity and security of future deep-sea cables out to 2050
• Security: in the broadest sense, including cyber, privacy, data ownership, and safety online within, across
and beyond the infrastructure sector.
These considerations are critical to get right for New Zealand to realise the full benefits of a connected digital
society, that shifts the infrastructure sector toward a more intelligent ‘smart system’ that has human and
whanau wellbeing at its core.
78 A, Barker, (2017) Improving Productivity in New Zealand’s Economy, New Zealand Productivity Commission
79 Telecommunications State of Play, 2020, Te Waihanga.

| Policy and regulatory considerations: preparing for technological change |
Preparing for Technological Change in the Infrastructure Sector | 3821960-1147589789-62 | 31/05/2021 | 75
Digital regulation
What is the current state?
Laws and regulations are often slow to adapt to different ways of doing business digitally and using new
technology. Regulatory gaps appear quickly as new ways of operating expand, with little certainty as to the
regulatory horizon: that is, if and how regulation will be introduced.
New Zealand-specific nuances result in a divergence from global practices at a legislative and regulatory level,
which fail to appreciate New Zealand’s place in the global digital economy.
Outcome-based regulations require specialist expertise to assess whether a solution is delivering the relevant
outcome. That expertise is absent in the system at the level of the decision-maker, resulting in the decision-
maker defaulting to precedent or risk averse decisions. This in turn stifles the use of innovative outcomes, and
results in inconsistent and competing ‘standards’ and ‘best practice guidelines’.
This is exacerbated by disjointed and inconsistent approaches taken by decision-makers at a regional level,
leading to uncertainty as to the viability of new or unique technologies, or other methods or processes that
drive efficiency or could be used to disrupt at a system level.
What are the desired outcomes?
Laws and regulations must continue to protect people and the environment while delivering positive outcomes
for infrastructure. Regulations must appropriately balance the need to coerce, permit and protect – but must
do so in a way that is nationally consistent.
Decisions should be made by those resourced and empowered to make the right decisions, with data, tools
and technology available to them to ensure that the decisions they are making are consistent and aligned with
the objectives of the regulatory framework through which they are issuing their decision.
In this regard, policy settings:
• Should be made against the background of accurate and reliable data
• Should ensure that discretion to make decisions is vested in those with appropriate resources, guidance,
and knowledge
• Should set decision making powers at the national level where to do so will deliver system-wide consistent
and efficiencies, while ensuring that the parameters of decision-making powers vested at the local or
regional level take into account system-wide objectives and desired outcomes.
In addition, lawmakers and regulators should be incentivised to improve the ‘speed to market’ of regulations
in the face of new technologies and new uses of technologies and make conscious and public decisions not
to regulate where existing frameworks are considered appropriate.
Of the emerging technologies identified, Artificial Intelligence (AI) will require significant regulatory focus and
potentially anticipatory regulations. In April 2021, the European Commission proposed new regulations for the
use of AI within the European Union, This was based on a risk-based assessment of the potential impact of AI
on citizen safety, livelihoods, and rights. The same risks identified would also apply to citizens of Aotearoa
New Zealand. For infrastructure, the use of AI in critical infrastructure (e.g. transport) could put the life and

| Policy and regulatory considerations: preparing for technological change |
Preparing for Technological Change in the Infrastructure Sector | 3821960-1147589789-62 | 31/05/2021 | 76
health of citizens at risk. The European Commission’s stated view is that regulation is required to give people
the confidence to embrace the use of AI technologies while encouraging businesses to develop them.80
80 Bahrke, Johannes, and Charles Manoury. “Europe Fit for the Digital Age: Commission Proposes New Rules and Actions for
Excellence and Trust in Artificial Intelligence.” European Commission, April 21, 2021.
https://ec.europa.eu/commission/presscorner/detail/en/IP_21_1682.
| Policy and regulatory considerations: preparing for technological change |
Preparing for Technological Change in the Infrastructure Sector | 3821960-1147589789-62 | 31/05/2021 | 77
Digital citizenship
What is the current state?
Barriers to access to technology arise from a lack of affordability and innovation, preventing an expansion of
the use of technological solutions and full inclusion. The benefits of digital technologies can only be fully
realised where they are functionally accessible to the population.
Lack of affordability is most pertinent in terms of:
• The digital divide between urban consumers who are well-connected, and rural consumers on the fringes
of New Zealand’s infrastructure who are imposed with high costs of participation in the digital economy
• Lower socio-economic groups, including many participants in the infrastructure workforce, who are unable
to afford the tools or skills needed to fully participate as digital citizens
• These barriers are particularly pronounced among (but not limited to) the following groups: Māori and
Pasifika, rural, elderly, and low-income families.
The lack of affordability is exacerbated by costs imposed to introduce or develop new technologies in the
sector. While New Zealand has a high ranking with respect to the ‘ease of doing business’, barriers to entry
for start-ups still exist, limiting innovation. Access to capital remains difficult for new businesses, as tax policy
continues to drive local investment towards real estate.
New Zealand laws and regulations – especially those regulating technology or touching on the global digital
economy – diverge from the practices of our major trading partners, imposing costs on multinational technology
providers and their customers arising from the need to comply with New Zealand’s bespoke requirements.
What are the desired outcomes?
In order to benefit to the greatest extent of the technological change needed to improve infrastructure
performance, resilience and sustainability at a system-wide level (including, as discussed below, with respect
to the tangible benefits deriving from developing accurate and complete data sets), full inclusion and
participation as digital citizens – both at an individual level, and at a sector level – is strongly desirable.
In this regard, policy settings:
• Should consider how to encourage more ‘homegrown’ innovative solutions, requiring a shift in the
legislative and regulatory dial towards a more supportive framework for investment, so that New Zealand
is seen as a market that facilitates innovation and entrepreneurship
• Should seek to facilitate consistent uptake of technological aids, with incentives to use them in practice
and deploy them quickly to fix emerging problems
• Should strive for the implementation of technology and tools for participation in the digital economy at the
lowest viable cost, through an opening up of the market by way of both homegrown solutions and
internationally developed solutions that are introduced with minimal regulatory ‘friction’.
Privacy and cyber security
What is the current state?
New Zealand’s privacy laws have been modernised to bring them more into line with global norms and
practices. However, they remain out of step with global best practice. While the primary requirements of privacy
laws are principles-based and are therefore flexible and adaptable in the face of changing technologies,
incentives to comply with those requirements are weak and inconsistently applied, and enforcement of New
Zealand standards in the context of the global digital economy is problematic. This results in an erosion of trust

| Policy and regulatory considerations: preparing for technological change |
Preparing for Technological Change in the Infrastructure Sector | 3821960-1147589789-62 | 31/05/2021 | 78
and scepticism of both the government’s and the private sector’s ability to act as appropriate stewards of
personal information, therefore resulting in less than full capture of market data and data sets lacking integrity.
Cyber security presents an ever-changing threat which requires increasing investment and cooperation at the
international level. In particular, the criticality of sustained, secure connectivity and the sensitivity of the deep-
sea cables that connects New Zealand to the world cannot be underestimated. Also, future 5G networks.
What are the desired outcomes?
Privacy is a key driver of technological change in all sectors. The use of data-driven technological solutions
which inform planning and assist in the efficient allocation of resources, and provide insights on current use
and future demand, rely on accurate and complete data sets, gathered from real individuals. Individuals should
have trust in the institutions that will hold that information; the way in which their personal information will be
collected; the purposes for which it will be used; and the technological and organisational measures in place
to prevent the misuse of that information through not only cyber security risks but also internal use beyond the
original parameters of its collection.
In this regard, policy settings:
• Should continue to ensure New Zealand laws addressing privacy and cyber security remain flexible,
technology-neutral, and adaptable to the changing ways in which infrastructure systems are developed
• Should take into account international best practice
• Should seek to embody the principles of privacy by design, which can be embedded in projects delivering
technological change in the infrastructure sector, with the Government taking a lead role in embracing
those principles
• Should consider the treatment of personal information as taonga in terms of how it is collected, and how
and where it is stored, and the implications for data sovereignty, and in this context, seek to establish
inherent trust in the systems and processes used by Government to collect, retain and use personal
information
• Focus should be on ensuring sustained, and secure international deep-sea network (and or satellite)
connectivity 34
• Should facilitate the leveraging of New Zealand’s existing networks to ensure that cyber security threats
are managed through a coordinated global approach, so that New Zealand has access to cyber security
experts and technologies which are ‘best in breed’.
Digital citizenship should be a key chapter of consideration in a refreshed Digital Strategy 4.0 for New Zealand.

| Policy and regulatory considerations: preparing for technological change |
Preparing for Technological Change in the Infrastructure Sector | 3821960-1147589789-62 | 31/05/2021 | 79
Ownership of data
What is the current state?
Data is moving from being scarce and difficult to process to being abundant and easy to use. But harnessing
its value for economic and social benefit is difficult. One of the challenges is that data is not available to
those who need it. And when it is made available it is sometimes done so in a way that can cause harm,
diminish trust or raise concerns that might prevent its full benefits from being realised.
Practical ‘control’ of data often vests in organisations that hold on to that data tightly, placing constraints on a
sector’s ability to exploit the data in a way that makes it valuable to the sector as a whole. Those best-placed
to make the most efficient use of data are unable to gain the access to the data that they need to provide
system-wide insights. While technologies (such as smart meters) exist to collect comprehensive and accurate
data in real time, little of this data is open-sourced.
At a practical level, few policy incentives exist to compel the free and frank sharing of data collected in the
context of infrastructure projects or use. In this regard:
• Competition laws may impede the of data between competitors or potential competitors in the same
industry, resulting in all participants in the industry operating in a ‘data vacuum’, especially when it comes
to pricing in risk in large projects
• The donors of data, consumers, are not readily recompensed for the data they make available
• Private companies who aggregate data are not recompensed for the collection of data, or any risks that
they assume by making that data available.
In short, the powerful and transformative potential of infrastructure data to unlock productivity gains, and
improve planning, delivery, modelling and decisions across the system is being lost.
Infrastructure data ownership is held by individual infrastructure sector players, and government agencies in a
deeply siloed fashion. Benefits to society are not being realised by way of data driven insights for infrastructure
sector planning and delivery for the current and future generations.
Open government data – current state
Open data policies are cross-cutting by nature. They include public sector budgeting, expenditure and
performance (including infrastructure performance), public trust, public service delivery, public contracting,
public sector employment, innovation, and digital performance. The New Zealand Government Open Data
Programme (ODP) ended in 2020 commissioned by Stats NZ. The programme was voluntary for agencies and
was internal across government. The programme was Cabinet mandated, not legislated which may have
downgraded or weakened the perception of the programmes importance and moved across several agencies
and did not have strong monitoring or statutory requirements.81 The programme had a small staff spread across
LINZ and Stats NZ and there was confusion about the objectives, what system wide the changes should be,
and reach and impact due to small staff size and budget meant impact was low.
What are the desired outcomes?
Smooth flows of data to the right channels will result in accurate insights and modelling of infrastructure use
and provide a solid foundation for decision-making based on accurate demand predictions. The allocation of
costly resources to infrastructure projects where there is a genuine need can be determined through cost-
81 Independent Review of the Open Data Programme, 2020, https://www.data.govt.nz/assets/ODP/Independent-review-of-the-Open-
Data-Programme-November-2020.pdf

| Policy and regulatory considerations: preparing for technological change |
Preparing for Technological Change in the Infrastructure Sector | 3821960-1147589789-62 | 31/05/2021 | 80
benefit analyses based on accurate information, and existing infrastructure may be repurposed through data-
inspired insights on current use and future demand.
In this regard, policy and institutional settings:
• Should take into account misconceptions regarding the ‘ownership’ of data and how they are conflated
with more concrete intellectual property rights arising in respect of original works
• Should include a stronger legislative approach to open government data that has statutory requirements,
bold and clear objectives and more resources and the legislation should cover data that is captured by
private firms for example in the planning and delivery of infrastructure that is paid for or owned by the
government
• Should seek to identify appropriate opportunities to ‘open’ up access to data sets – especially those already
being collected – so as to facilitate the sandboxing of ideas with respect to the best use of that data
• Should endeavour to facilitate data sharing at a system-wide level in a way that balances the benefits of
open data with the tangible benefits of competition, in each case in the context of and to a level appropriate
in light of, the relevant market
• Should take into account individual and corporate incentives and disincentives to make data available and
place appropriate value on data and conditions of access to data accordingly – including by limiting the
regulatory risks arising from the sharing of data – so as to facilitate the collection and aggregation of data
sets by those best-placed to collect and aggregate (who may not be the same as those best-placed to
exploit the data)
• Should promote data standards and consistency of practice, to ensure the integrity and accuracy of data
sets, with the Government taking a lead role in data integrity.
Trusted stewardship of data / Kete Mātauranga
To realise the potential benefits of data for our societies and economies, we need trustworthy data stewardship.
We need to establish different approaches to deciding who should have access to data, for what purposes and
to whose benefit, and make it easier for more people to adopt them. Data trusts could be one approach to data
stewardship. Internationally, in environments that are multi-stakeholder, in parts competitive, where there are
public institutions and or citizen data involved, data trusts have been an interesting institutional innovation. A
solid working definition of a data trust us simply ‘a legal structure that provides independent stewardship of
data’82 They have been seen to build equity, and ethical standards with how data is collected, used, organised
and how it can build an open and trustworthy data ecosystem. The UK has been leading in this space, with
early exploratory data trusts established as part of the UK AI Strategy, and across local government, illegal
wildlife trade, and national food waste missions.
82 “Data trusts in 2020”, Open Data Institute, March 17, 2020, https://theodi.org/article/data-trusts-in-2020/
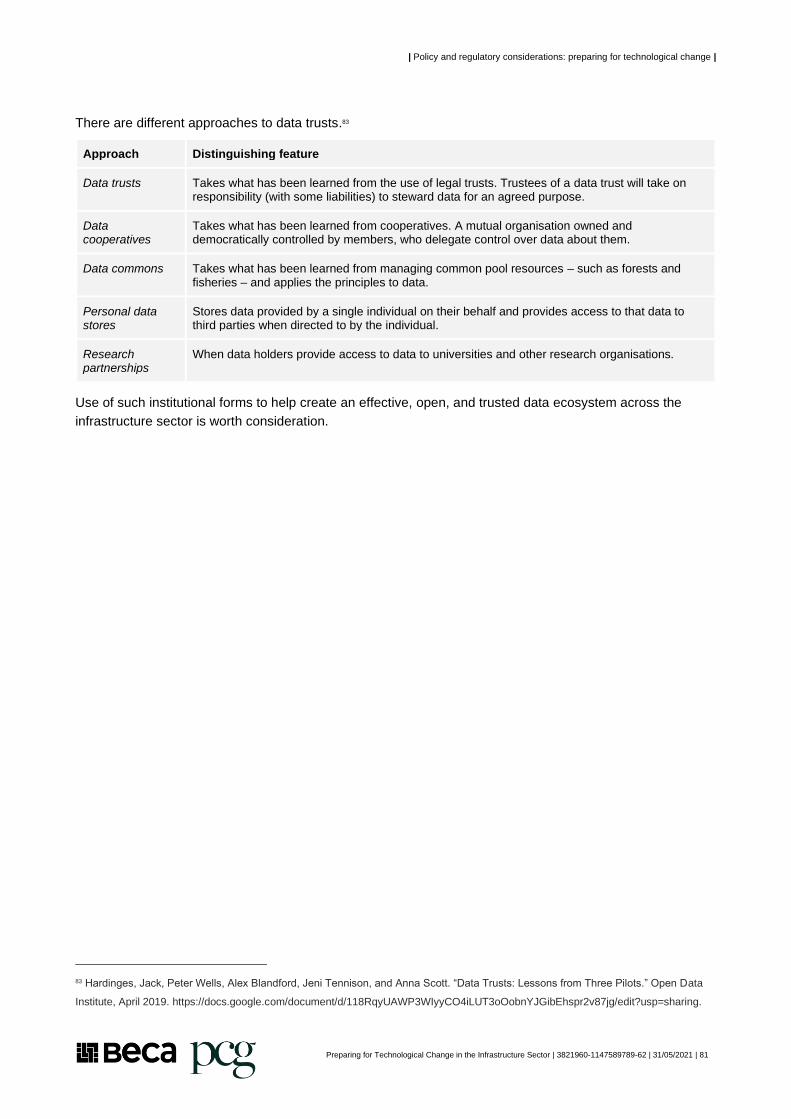
| Policy and regulatory considerations: preparing for technological change |
Preparing for Technological Change in the Infrastructure Sector | 3821960-1147589789-62 | 31/05/2021 | 81
There are different approaches to data trusts.83
Approach Distinguishing feature
Data trusts Takes what has been learned from the use of legal trusts. Trustees of a data trust will take on responsibility (with some liabilities) to steward data for an agreed purpose.
Data cooperatives
Takes what has been learned from cooperatives. A mutual organisation owned and democratically controlled by members, who delegate control over data about them.
Data commons Takes what has been learned from managing common pool resources – such as forests and fisheries – and applies the principles to data.
Personal data stores
Stores data provided by a single individual on their behalf and provides access to that data to third parties when directed to by the individual.
Research partnerships
When data holders provide access to data to universities and other research organisations.
Use of such institutional forms to help create an effective, open, and trusted data ecosystem across the
infrastructure sector is worth consideration.
83 Hardinges, Jack, Peter Wells, Alex Blandford, Jeni Tennison, and Anna Scott. “Data Trusts: Lessons from Three Pilots.” Open Data
Institute, April 2019. https://docs.google.com/document/d/118RqyUAWP3WIyyCO4iLUT3oOobnYJGibEhspr2v87jg/edit?usp=sharing.
| Policy and regulatory considerations: preparing for technological change |
Preparing for Technological Change in the Infrastructure Sector | 3821960-1147589789-62 | 31/05/2021 | 82
Procurement
What is the current state?
The Government is New Zealand’s largest procurer. Industry, the Crown and most critically citizens all loose
if procurement does not happen in a strategic, collaborative way. Procurement performance in New Zealand
has fallen and procurement expertise is falling in both public and private sectors.84
The 4th edition of the Government Procurement Rules came into effect in October 2019. The new rules require
Government agencies to consider broader environmental, social, economic, or cultural outcomes when
purchasing goods, services or construction works. It also requires Government agencies to consider how they
can create opportunities for New Zealand businesses through their procurement opportunities.
However, evidence from interview data indicates the updated rules do not encourage technological
experimentation, innovation or incentivise the system to focus on this. The current system of engaging with
the Crown and agencies in major procurement has an adversarial culture, with low levels of trust. Significant
issues were raised related to the culture, contracting and approach to procurement the government currently
takes.
Key challenges in the exciting system have already been clearly identified85, and include but are not limited to:
• Pipeline uncertainty
• Lack of joined up thinking between central and local government, industry, and uncoordinated approach
to the pipeline
• Deep confusion around value and immature approach to whole of life (WOL) cost
• Contracting clauses not adding value and approach around risk management immature and can add costs
• Significant waste in the tendering process with activities steps, checks etc that do not add value
• Key person risks between individuals and companies, and concerns long term around succession planning
and capabilities
• Culture of mistrust endures.
Procurement practices focus primarily on process, rather than outcomes, with conservative approaches to
procurement leading too often to a ‘race to the bottom’ driven by a lowest cost culture. The lowest cost culture
is itself driven by a risk aversion, created by subject-matter experts within the procurement field who
concentrate on the process of procuring ‘widgets’ rather than less tangible ‘outcomes’ and therefore fail to
properly understand the risks of large projects with system-wide implications, and who should best bear them.
The ‘race to the bottom’ and uncertain pipeline of work leaves little margin for participants in the infrastructure
sector, thereby stifling innovation and the ability to upskill. Since procurement is undertaken on a project-by-
project basis and sector-by-sector approach, siloes occur, thereby leading to a failure to address or quantify
system-wide benefits from a project, and a failure to link ‘outcomes’ from one project with the ‘outcomes’ from
another project.
84 Lang, Sarah. “2019 Infrastructure Procurement Survey Results.” Infrastructure New Zealand, August 22, 2019.
https://infrastructure.org.nz/resources/Building%20Nations%202019/Building%20Nations%202019%20Procurement%20Survey%20Pre
sentation.pdf.
85 “Creating Value Through Procurement”, Infrastructure New Zealand, August 2018,
https://infrastructure.org.nz/resources/Documents/Reports/Infrastructure%20NZ%20Procurement%20Study%20Report%20FINAL.pdf

| Policy and regulatory considerations: preparing for technological change |
Preparing for Technological Change in the Infrastructure Sector | 3821960-1147589789-62 | 31/05/2021 | 83
The Construction Sector Accord was launched in April 2019 by the Prime Minister, Accord Ministers, and the
industry Accord Development Group made up of 13 sector leaders from across industry and government.86
The Accord created a platform for industry and government to work together to meet some of the key
challenges facing the sector including skills and labour shortages, unclear regulations, a lack of coordinated
leadership, an uncertain pipeline of work and a culture of shifting risk. One of the principles it has is to ‘foster
innovation, and research and development.’ However, the accord, does not focus deeply technological
considerations for the sector or system level planning and delivery or monitoring and evaluation.
The document itself mentions technology and innovation in passing two to three times. Procurement on the
other hand, is mentioned in detail 10 times in the document, which demonstrates the balance of current focus.
What are the desired outcomes?
A consistent approach to outcomes-focused procurement of major projects will deliver better outcomes for with
the wider system, with less wastage and increased efficiencies. Risks should be assumed by those best-placed
to manage those risks, and industry should be rewarded for their use of innovation.
By taking a holistic approach to procurement, externalities and synergies can be identified at an earlier stage
and assessed in the context of the overall benefits of a project.
A consistent and fair approach where innovation, vision and efficiency are rewarded may open the market to
new players, thereby further driving innovation and cost-savings.
In this regard, policy settings:
• Should encourage industry-standard approaches to risk, championed by the Government, to leverage the
system data available to make informed decisions about the assumption of risk by the right entities
• Should consider, at a Government-level, whether procurement expertise and vision with respect to large
projects and system-wide change can be centralised within a ‘centre of excellence’, responsible for driving
change and delivering system-level outcomes
• Should promote regularity and consistent in the pipeline of work and future work programmes as a system-
wide objective, on the understanding that the certainty the pipeline brings will provide the market with the
confidence it needs to invest in innovation and people
• Should build innovation and technological capabilities and sector procurement expertise across local
governments.
86 “Construction Sector Accord”, New Zealand Government, April 2019, https://www.constructionaccord.nz/assets/Construction-
Accord/files/0930eac2bb/construction-sector-accord.pdf
| Policy and regulatory considerations: preparing for technological change |
Preparing for Technological Change in the Infrastructure Sector | 3821960-1147589789-62 | 31/05/2021 | 84
What can New Zealand take from this?
• New Zealand needs broader direction at the system level. Clear and compelling economic outcomes
statements, linked to clear long-term spatial strategy, which links to clear infrastructure sector outcomes
and a longer that spans 20 years+ to give the system and industry more clarity and certainty of the pipeline
and direction.
• The Government nor industry can address technological preparedness out to 2050 sufficiently working in
isolation of one another. A collaborative, mission-led approach between industry and the Government
needs to be explored. Focus, effort, and resources in siloes and in an uncoordinated way will not shift the
system sufficiently toward a more productive, technologically enabled, and lower carbon future. Missions
should identify a clear challenge to solve, be specific, and time bound, and have political and social
legitimacy so it can carry out to 2050 and beyond as a worthy mission to pursue.
• To achieve system level change swiftly, New Zealand requires a paradigm shift in the way infrastructure
is procured. The market will not move toward greater preparedness at speed without top-down urgency.
A shift is needed to shift the goal posts and introduce requirements for greater digital enablement, and to
share benefits and risks more strategically with the market.
• Open data legislation is a critical foundational step to unleashing the innovative potential and value from
data for the infrastructure sector and beyond to improve long term policy, planning, delivery and whole of
like maintenance.
• New Zealand requires a Digital Strategy 4.0 refresh. The new national-level strategy needs to consider
“multiplier domains” which act as catalysts to realise benefits across several areas. Multiplier domains for
a new and bold Digital Strategy include but are not limited to: Infratech commercialisation, anticipatory
regulation (especially for AI), international connectivity and low orbit connectivity, IOT and digital twins.

| Policy and regulatory considerations: preparing for technological change |
Preparing for Technological Change in the Infrastructure Sector | 3821960-1147589789-62 | 31/05/2021 | 85
Recommendations for Te Waihanga 30-year strategy 6
| Recommendations for Te Waihanga 30-year strategy |
Preparing for Technological Change in the Infrastructure Sector | 3821960-1147589789-62 | 31/05/2021 | 86
6 Recommendations for Te Waihanga 30-year strategy
Synthesis of core emerging issues
a) Market-based dynamics in infrastructure matter for benefits: Technological change, maturity and
innovation thrives in telecommunications and across some of the energy market. Yet in water, waste
and many parts of transport and education sectors infrastructure lags across many measures. The
former have competitive sectors, profit incentives and critical performance data availability that drives
technological innovation, agility, productivity, and benefits realisation. There is a need to create market-
based dynamics, facilitated by technologies and radical transparency to drive improvements across the
system. Where these market forces do not exist, we can consider imposing system level targets (for
efficiency, innovation, digitisation, and human centric benefits) and accountability frameworks around
them. Seeing data as a valuable asset to create incentives and more transparency of performance
across infrastructure sectors is helpful for scrutiny from citizens, users, buyers and the Crown.
b) Paradigm shift required in the commissioning and procurement across the infrastructure sector:
Shifting the paradigm from being an adversarial contract-based system, toward one based on
enablement, partnership and shared gains and pains is needed. Ministers and departments need to shift
the procedure and the culture. A low-trust culture and approach exists to procurement of infrastructure
(driving bids to the lowest possible dollar) in ways that do not constitute a collaborative and mature
commercial partnership. This approach to the built environment and construction limits the investment
by construction firms to those where there is no risk involved to innovate, which in turn means that the
construction sector will lag considerably in technology adoption and productivity gains in the decades
ahead. New principles and priorities should be established that expand accountability and KPIs toward
the productive and innovative use of technology across the infrastructure sector that drives productivity,
reduced costs and carbon. Infrastructure is legislated and regulated to focus on safety in design – it is
time to facilitate a paradigm shift in culture, prioritisation and accountabilities to focus on human
flourishing and innovation as critical benefits to realise alongside reduced schedule and cost overrun.
c) Strong and clear system level drivers for change are needed: Current settings across the public
infrastructure procurement system do not create a strong demand for technological change, innovation
or preparedness. If there are strong demands at the start of infrastructure major programmes and
commissioning, and a maturity in procurement capability realising the market needs greater a) certainty
of the pipeline over multiple decades, b) acceptable commercial upside to be able to technologically
invest, and c) clear Ministerial level prioritisation for technology, innovation and smart-systems
integration. The research clearly demonstrated unless there are clear, top-down, and mandatory
demands for this change (and support around it), little will happen.
d) Infrastructure data and insights are core to principles of Kete Mātauranga: Contained within Te
Ao Māori is the importance of knowledge, which is considered a taonga at a personal and cultural level.
Infrastructure produces large amounts of information with the main beneficiaries are the industry players
themselves. Consideration is needed using the principles of Te Tiriti o Waitangi of how information
(infrastructure data) is used and value created and shared for current and future generations. A move
towards open data would require the clear identification of the ownership of the data, independence of
those institutions who have Kaitiakitanga over it and capabilities to generate value from its management.
e) Whole of life digitalisation is critical for success: the benefits of digitalisation of infrastructure are
greatest the earliest that digitalisation starts in the lifecycle. As an example, if digitalisation is
commenced only after construction, then the costs are much higher and accuracy much lower, limiting
the benefits. It is this non-digital state that much of New Zealand’s infrastructure is in.
| Recommendations for Te Waihanga 30-year strategy |
Preparing for Technological Change in the Infrastructure Sector | 3821960-1147589789-62 | 31/05/2021 | 87
f) Decarbonisation, green infrastructure funding and technology upgrades are mutually
reinforcing: There are strong linkages to the electrification of infrastructure, particularly in the energy
and transport sectors. There are no significant technologies that decarbonise themselves, rather key
technologies enable the optimisation of infrastructure operations and use (AI, IOT particularly). A key
impact on decarbonisation is through procurement and construction, with embedded carbon in
construction able to be measured through the ISCA framework. Targeted investment funds for green
infrastructure, at scale (10s of billions) to help speed investment into green infrastructure which can
catalyse technological upgrades and capabilities in the infrastructure sector.
g) Some technologies matter most: While each sector has dominant technologies, there were 5
technologies we believe will have a transformative impact across all sectors. These are AI, IOT, Cyber
security, Digital Twins, and AR/VR (services at a distance). These technologies warrant further research,
feasibility and use-case design and testing across the infrastructure sector.
h) Local government has major capability and capacity challenges in this area: significant
infrastructure is created, operated and maintained by local government (e.g., water, transport). Due to
predominantly small scale, challenges with generating sufficient ‘market’ revenue and old non-digitalised
infrastructure, the technological solutions will likely be beyond the resources of individual councils. As a
key example, the need for pro-active and preventative maintenance of legacy underground water
networks is relevant to local government across and beyond New Zealand. Any creation of technological
approaches (for example an IoT, AI integration) will be useful nationally and valuable internationally.
There is potential for collaboration with funders for infrastructure maintenance and the
commercialisation of R&D in this area, particularly given the relevance to digital twins.
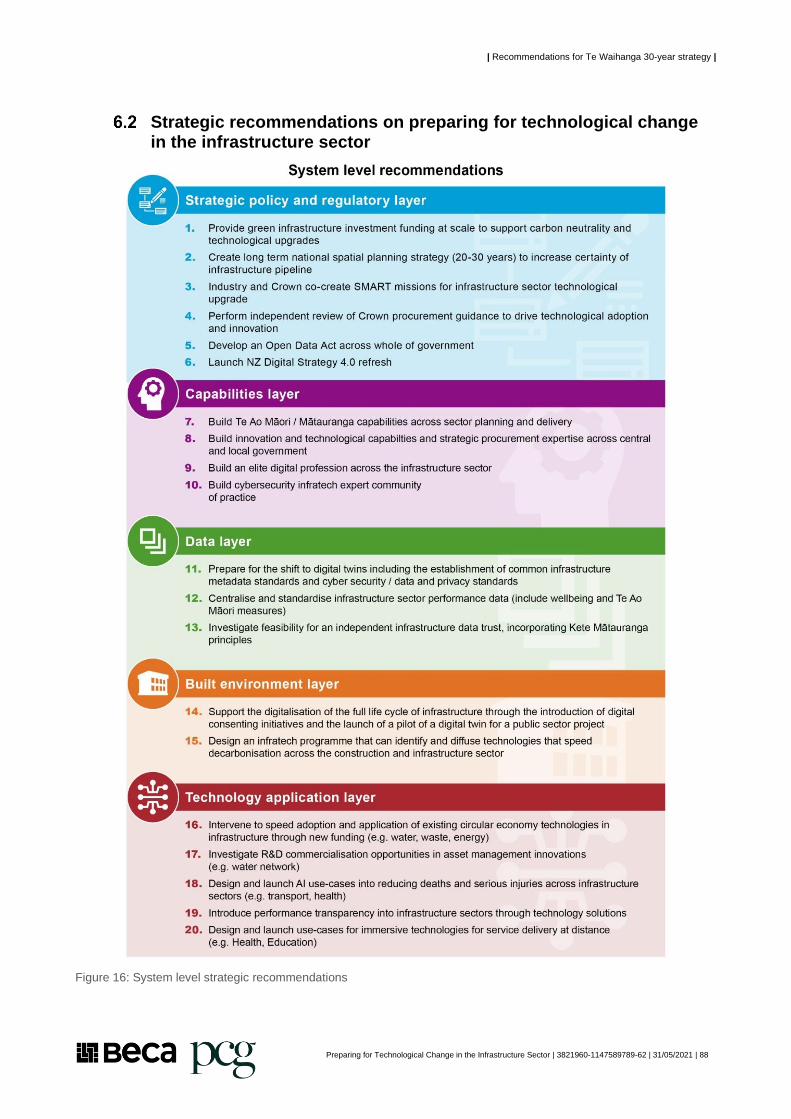
| Recommendations for Te Waihanga 30-year strategy |
Preparing for Technological Change in the Infrastructure Sector | 3821960-1147589789-62 | 31/05/2021 | 88
Strategic recommendations on preparing for technological change in the infrastructure sector
Figure 16: System level strategic recommendations
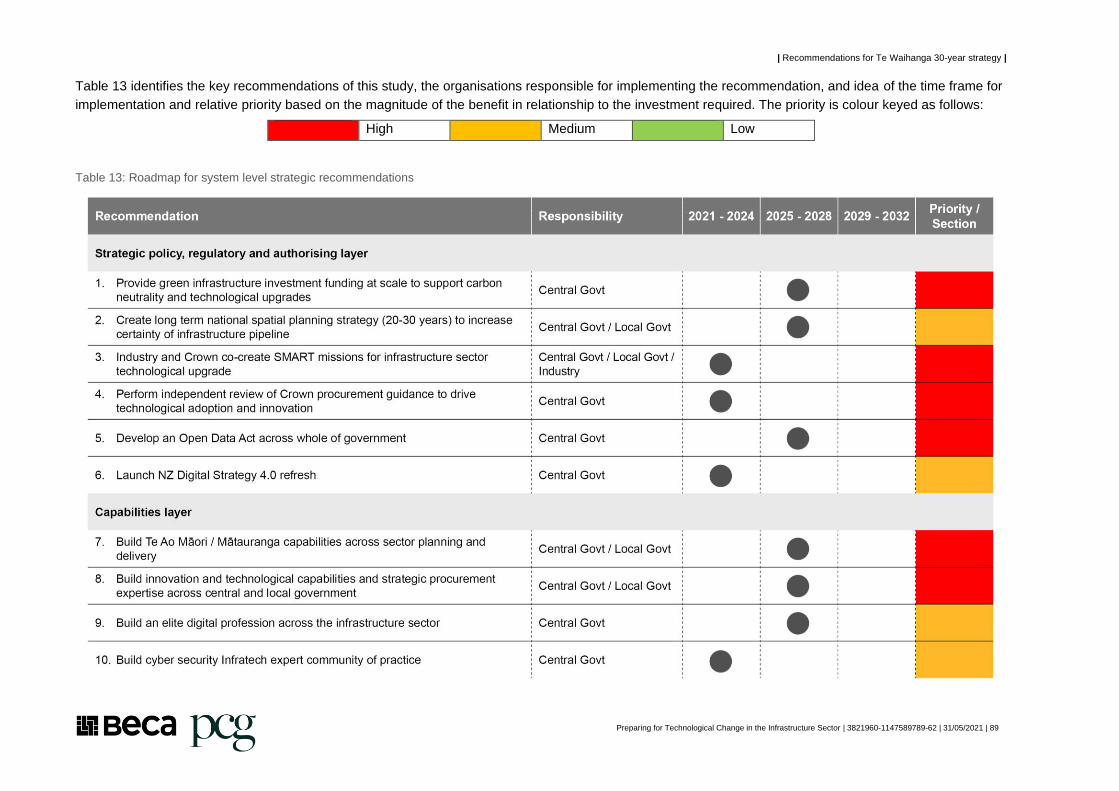
| Recommendations for Te Waihanga 30-year strategy |
Preparing for Technological Change in the Infrastructure Sector | 3821960-1147589789-62 | 31/05/2021 | 89
Table 13 identifies the key recommendations of this study, the organisations responsible for implementing the recommendation, and idea of the time frame for
implementation and relative priority based on the magnitude of the benefit in relationship to the investment required. The priority is colour keyed as follows:
High Medium Low
Table 13: Roadmap for system level strategic recommendations
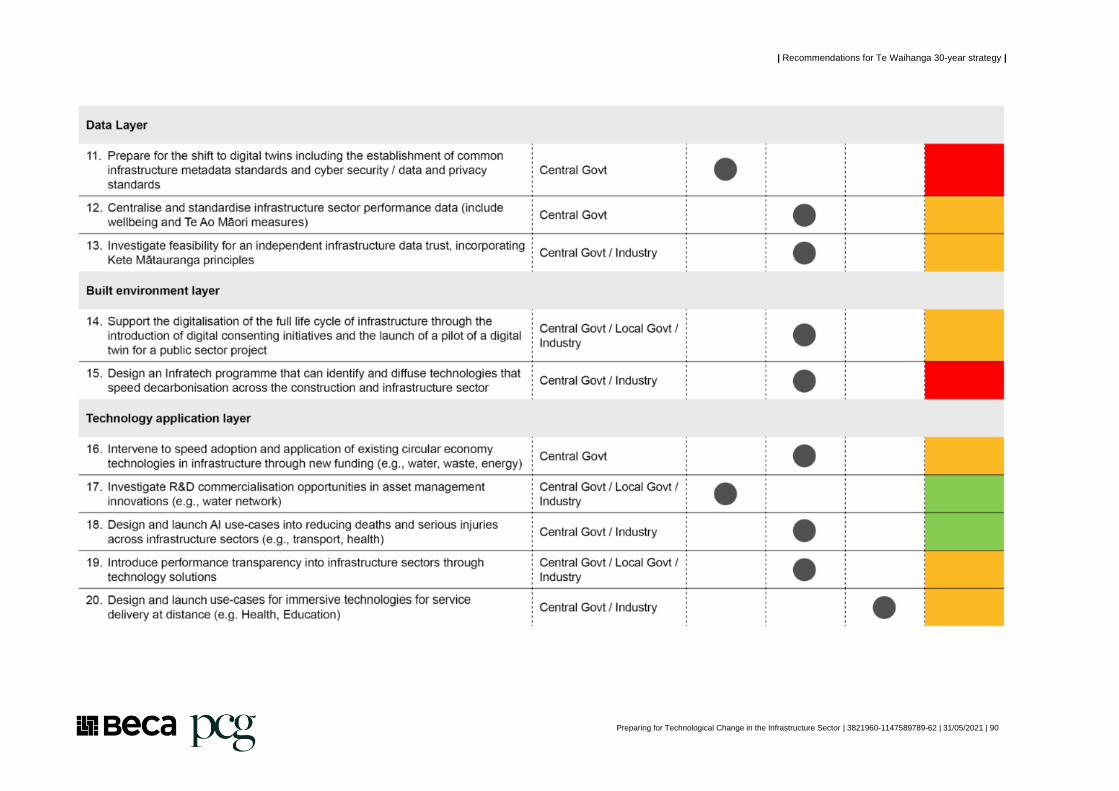
| Recommendations for Te Waihanga 30-year strategy |
Preparing for Technological Change in the Infrastructure Sector | 3821960-1147589789-62 | 31/05/2021 | 90
| Recommendations for Te Waihanga 30-year strategy |
Preparing for Technological Change in the Infrastructure Sector | 3821960-1147589789-62 | 31/05/2021 | 91
Detailed recommendations
1. Provide decarbonisation infrastructure investment funding at scale to support carbon neutrality
and technological upgrades
The mandate, strategy and funding envelope should be radically expanded at the NZ Green Investment Fund
(NZGIF). NZGIF’s current $100m will not go far enough to transform infrastructure, speed rapid
decarbonisation across the sectors, and act as a catalyst for technological advancement. The scale (billions
not millions of dollars), directionality and conditionality (carbon constrained and or reducing projects and
methods) of infrastructure finance (other than just the Crown) should be considered in the near future in New
Zealand.
2. Create long term spatial planning strategy (20-30 years) to increase certainty of the infrastructure
pipeline
A long-term spatial plan will identify the infrastructure requirements arising from land use growth and
intensification. This long-term infrastructure pipeline creates certainty of a future market that allows for scaling
of the construction industry to suit the planned pipeline and long-term contracts would encourage investment
in technology by construction groups.
Spatial planning strategy should cover at least the strategic horizon of the 30-year strategy Te Waihanga is
preparing. This would move New Zealand into alignment with international best practices and integrated
outcome frameworks similar to those in Ireland, Scotland and Hong Kong. In those jurisdictions local authorities
retain responsibility for detailed land use management, but take direction, guidance and additional resources
from central government. Long term spatial planning strategy should be aligned with national level economic
outcomes.
3. Industry and Crown co-create SMART missions for infrastructure sector technological upgrade
Neither the Crown, nor industry is able to address the significant technological, innovation, planning, delivery
and capability challenges facing the sector. It is critical that the Crown and industry develop collaboratively
undertake a mission-based approach to determining the priority grand challenges, and the specific actions
each will take, and how this will be measured, monitored over time. Key areas that would be ripe for a specific
time-bound bold mission could relate to data, decarbonisation, and productivity.
4. Perform independent review of Crown procurement guidance to drive technological adoption and
innovation
The current approach to procuring and contracting for infrastructure work leads to low-risk lower-cost
outcomes. This means that there is little incentive for contractors to innovate or invest in technology during the
period of a contract. The outcomes of a procurement review could be the identification of changes that enable
the investment required to diffuse current technologies and prepare for future technologies that will have a
substantive long-term effect on sector productivity. Part of this review should be a robust capabilities diagnostic
and international comparative analysis and benchmarking. The Construction Sector Accord may be a timely
mechanism to drive change through expanding the scope of workstreams to look at innovation.

| Recommendations for Te Waihanga 30-year strategy |
Preparing for Technological Change in the Infrastructure Sector | 3821960-1147589789-62 | 31/05/2021 | 92
5. Develop an Open Data Act across whole of government
Whole of Government Open Data should be a legislative programme with clear statutory requirements for all
government agencies, departments and state-owned enterprises and qangos. A voluntary approach to open
data will not be sufficient to speed this process across the machinery of government so benefits can be realised
quickly. This should also cover data generated from all infrastructures paid for, used and or owned by the
Crown. The use of infrastructure creates a lot of data about performance, the environment, and people. Where
the government collects that data (directly or indirectly) or regulates an industry where that data is being
collected, there is significant interest in ensuring that the data can be accessed and used by those best-placed
to create benefits for at a system level. While some work has been undertaken in this space on an ad hoc
basis, no overarching legal framework exists to encourage and facilitate the collection and aggregation of data,
the opening up of access to that data, and data standards.
An ‘Open Data Act’ would provide New Zealand with a world-leading all-of-government approach to the
governance and management of open data. Building on systems established to date and touching on concepts
developed elsewhere (such as the UK Open Government Licence), an Open Data Act would establish a
mandate to coordinate open data activities across government. The Act could seek to allocate responsibility
to a designated centralised agency (or independent data trust with powers) who will be responsible for
providing strategic direction and advice to government agencies in respect of the collection, aggregation of
data, and opening up access to data; developing and maintaining appropriate API standards and other
standards to ensure fair but secure access to datasets; reporting to government on progress made in terms of
the use of open data in the government sector; and developing and maintaining data standards to ensure the
integrity and accuracy of data. The Act could also specifically direct government agencies (including regulators)
to have regard to, and embody in their regulatory frameworks, the benefits of opening up access to data held
by them. The Act would be developed in consultation with key stakeholders in the infrastructure system,
including key utility regulators, government departments and other government agencies, infrastructure
providers, and government cybersecurity experts. The Privacy Commissioner would also be consulted to
ensure that the framework for open data does not undermine individual privacy rights and otherwise
incorporates principles of Privacy by Design; likewise, iwi should be consulted to ensure that the framework
recognises the role of data as taonga and accordingly builds in principles of Culture by Design.
6. Launch NZ Digital Strategy 4.0 refresh
The relevance of the current NZ Digital Strategy has lapsed and there is a need for a refresh of this national
strategy which sets direction and the digital trajectory for government and also the wider private economy.
A refreshed national digital strategy should consider wider economic competitive choices and niches clearly,
but also the role of technology and data as it becomes the glue holding the human, physical, and economic
systems together in the coming decades. The world has evolved significantly since the last Digital Strategy
and the Digital Nation Initiative as part of the business growth agenda (2017). New Zealand needs direction in
areas such as cloud strategy, digital infrastructure capacity and international connectivity needs out to 2050,
digital equity and digital inclusion (as a right) as part of defining clearly just digital citizenship. The refreshed
strategy should also consider data ownership / sovereignty issues and value realisation from all government
and user-generated data and the long-term stewardship of this data for future generations (Kete Mātauranga).
Anticipatory regulation may be required for AI, IOT and digital twins.
| Recommendations for Te Waihanga 30-year strategy |
Preparing for Technological Change in the Infrastructure Sector | 3821960-1147589789-62 | 31/05/2021 | 93
7. Build Te Ao Māori / Mātauranga capabilities across sector planning and delivery
The concept of Mātauranga is to treat data as a taonga that is shared intergenerationally, which becomes
more challenging as information becomes digital. Guidance on incorporating Te Ao Māori and Mātauranga is
required at a sector level and system level in procurement, commissioning, oversight and also monitoring and
evaluation of infrastructure performance.
8. Build innovation and technological capabilities and strategic procurement expertise across central
and local government
Local Government focuses on the delivery of significant core infrastructure, but in the most part does not have
the scale and market revenue streams to be able to invest in innovation, particularly where ratepayer risk is
involved and has limited debt capacity. This has big national equity implications. There are significant gaps in
resources, talent and capabilities at regional and local government levels across the country. A consolidated
approach reflects the commonalities of infrastructure operated by local government.
While the dynamics are different at the central government level, investment in the skills and capabilities
required for procuring technological solutions would provide a better foundation for future changes required.
9. Build an elite digital profession across the infrastructure sector
With weak system drivers for technological change or innovation, unlike in other industries (telecoms, banking
and finance) an elite digital profession has not come to fruition across the infrastructure sector. Efforts to build
an elite digital profession in the UK Civil Service and an elite major project management profession of master
builders have been successful through very high-quality training and development, strategic recruitment and
selection, industry and state secondments, talent management, incentives and succession planning. New
Zealand requires a clear strategy and set of coherent actions regarding this.
10. Build cyber security Infratech expert community of practice
Technological change in the infrastructure sectors is inevitably bringing both increased levels of data and
sensitivity / criticality to potential attack. The current paradigm in New Zealand across government and most
of industry sees this topic as distant and voluntary. There are some helpful industry cyber standards emerging.
Cyber security in New Zealand has higher levels of devolution to specific sectors or organisations when
compared to, for example, European nations. Due to the uneven levels of digital capability across and between
sectors, a culture of collaboration around cyber security considerations in public or critical infrastructure, needs
to be recreated, led by central govt. A clearer cross-sector approach, strategic intent, and deliberate build of a
community of practice with intelligence agencies, DPMC and industry players and relevant scholars would
benefit the system and cyber resilience.

| Recommendations for Te Waihanga 30-year strategy |
Preparing for Technological Change in the Infrastructure Sector | 3821960-1147589789-62 | 31/05/2021 | 94
11. Prepare for the shift to digital twins including the establishment of common infrastructure
metadata standards and cyber security / data and privacy standards
The foundation for digitalisation of the infrastructure sector is agreement on common metadata standards.
National standards will enable the maximum value to be extracted across disciplines, agencies, authorities,
sectors and regions. There are both sector specific metadata and global standard metadata, and a sector-by-
sector approach is required. This is essential as a first step to help facilitate the move toward digital models
use and eventually full digital twins in the infrastructure sector.
As infrastructure becomes more connected and reliant on data, the risks around security, management of data
privacy and protection of Intellectual Property grow. The vulnerability and future resilience of the three deep
sea cables which connect New Zealand, and the infrastructure sector to the world also will become more
critical in the decades ahead. In light of the vast technological changes ahead for the infrastructure sector, Te
Waihanga, and appropriate intelligence agencies should conduct a review.
12. Centralise and standardise infrastructure sector performance data (include wellbeing and Te Ao
Māori measures)
Sectors can more readily adopt technology to improve performance where there are clear measured
performance KPIs and KPIs that reflect the principles of Te Tiriti o Waitangi. NZ lacks a clear national body to
look into the construction sector performance, infrastructure performance, cost and benefit realisation (c.f. UK).
Te Waihanga would be a likely candidate to take on this responsibility for the infrastructure sector and would
need to develop the capabilities and industry players and technology suppliers.
13. Investigate feasibility for an independent infrastructure data trust, incorporating Kete Mātauranga
principles
Data trusts are an institutional innovation to bring more independence, trust and stewardship to data (often
public or citizen / user generated). As part of the legislative feasibility study (recommendation #5), data trusts
and similar models should be explored. Trustees or ‘stewards’ are independent and can be drawn from across
sectors, Iwi, academia, etc.
14. Support the digitalisation of the full life cycle of infrastructure through the introduction of digital
consenting initiatives and the launch of a pilot of a digital twin for a public sector project.
The benefits of the digitalisation of infrastructure information are maximised when the digitalisation occurs
early in the infrastructure lifecycle. For physical infrastructure a key lifecycle element is consenting. By
mandating digital consenting, this will accelerate the adoption of technology throughout the lifecycle. The first
step towards digital consenting is standardisation (of meta-data, methods), a coordinated national approach
with potential simplification of standards.
Digital twin technology is emerging and yet to be implemented in any significant manner. The technology suits
high-value infrastructure where operations and maintenance are considerable expenses. There will be a
considerable investment required in building capability and implementing digital standards for early use cases
| Recommendations for Te Waihanga 30-year strategy |
Preparing for Technological Change in the Infrastructure Sector | 3821960-1147589789-62 | 31/05/2021 | 95
for digital twins. This investment in a public sector infrastructure digital twin pilot can be the platform for building
national capability.
15. Design an Infratech programme that can identify and diffuse technologies that speed
decarbonisation across the construction and infrastructure sector
The carbon produced from infrastructure includes both operational emissions but also embedded carbon
through the construction materials and processes. Understanding the implications of design and construction
decisions is a foundation for delivering to carbon targets. The planning, design and procurement process is
the best place in the infrastructure process to identify these. In addition, there are number of technologies
identified that if adopted will accelerate decarbonisation in the operation of infrastructure and services.
An Infratech programme will identify the framework for evaluating and implementing technological changes in
construction and operations that lead to decarbonisation.
16. Intervene to speed adoption and application of existing circular economy technologies to
infrastructure through new funding (e.g. water, waste, energy)
The short-run switching costs are preventing the adoption of existing (and proven) technologies that will
improve reduce waste and carbon emissions and improve sustainability, meaning that New Zealand is missing
out on the social and environmental benefits to be realised.
Examples include the establishment of re-cycling processing in waste using advanced cameras and AI, water
re-use in sewage processing infrastructure, and delays in electrification of industrial process heat systems.
This requires active intervention (funding and plugging coordination failures across the sector, including but
not limited to procurement) so that the benefits of the investment occur earlier, and other than at asset end of
life.
17. Investigate R&D commercialisation opportunities in asset management innovations (e.g. water
network)
Some innovative commercialisation opportunities exist across asset management. Locally and globally, built
infrastructure is in a period of heightened renewal need due to the aging nature of the infrastructure (e.g.,
water network). In developing and adapting technologies to solve the investment prioritisation for renewal
challenges in New Zealand there exists the opportunity to commercialise local innovation on the global market
to create additional value. This would need to be a national programme setup and led by central government
with the funding, IP protection and commercialisation capability. It is likely that it would provide additional
impetus to the development of digital twins for existing / legacy network assets.

| Recommendations for Te Waihanga 30-year strategy |
Preparing for Technological Change in the Infrastructure Sector | 3821960-1147589789-62 | 31/05/2021 | 96
18. Design and launch AI use-cases into reducing deaths and serious injuries across infrastructure
sectors (e.g. transport, health)
In sectors with significant ongoing deaths and serious injuries (transport, health), Artificial Intelligence provides
a potentially effective way of reducing harm. It is possible to identify narrow use cases for AI where significant
benefits may accrue. For transport this could include active collision avoidance technologies focussed on
reducing pedestrian and cycling injuries, and in health this could include identification of patterns leading up
to harm incidents and detecting these before harm occurs.
19. Introduce performance transparency into infrastructure sectors through technology solutions
Where there is transparent performance information, there are clear drivers for infrastructure owners and
operators to respond to supply, cost and demand drivers. Currently, sectors such as water and transport are
operating without the dynamic market signals that other infrastructure networks have (i.e., energy,
telecommunications). A technology-led approach with the application of collecting performance information via
IoT, the management of the network using AI, and a move towards digital twins for optimisation and planning.
20. Design and launch use-cases for immersive technologies for service delivery at distance (e.g.
Health, Education)
The delivery of services via digital infrastructure will help reduce geographical inequity and reduce costs of
delivery through less travel and better scale. This could be in the form of basic video conferencing, through to
advanced robotics via augmented reality. It is expected that this will lead to an improvement in the levels of
services outside the main population centres, and the reduction in the need for new capital infrastructure.

| Appendix A – Incremental and disruptive technologies |
Preparing for Technological Change in the Infrastructure Sector | 3821960-1147589789-62 | 31/05/2021 | 97
Appendix A – Incremental and disruptive technologies
Appendix A details the wide technological scan conducted to identify the incremental and disruptive
technologies that are likely to have an impact on infrastructure. Each technology or grouping of similar
technologies is described to ensure the reader is familiar with the technology in discussion. Further to this,
results of research are presented that highlight existing or emerging applications of the technology, the
maturity of the technology, a rough timeline of when wider adoption of the technology is likely and a
discussion of the potential barriers for the adoption of the technology. The final item included for each
technology is a short list of potential application in the infrastructure industry that the reader can use as the
basis for further research.
Table 14 summarises the technologies and includes information on the stages of the infrastructure lifecycle
where implementation of a technology is likely and also whether each technology will impact Mātauranga.
Table 15 summarises the barriers for adoption of each technology.

| Appendix A – Incremental and disruptive technologies |
Preparing for Technological Change in the Infrastructure Sector | 3821960-1147589789-62 | 31/05/2021 | 98
Connectivity & Communication
1. 5G / 6G / Li-Fi
Technological Maturity Technology Timeline Key Barriers
Developing/Adopted 2020-2040 Regulation, security, social perception
5th generation and 6th generation mobile internet and light fidelity (Li-Fi) are advanced forms of wireless
communication expected to be capable of transferring larger quantities of data much faster amongst a larger
quantity of devices with greater reliability and reduced latency87. Li-Fi unlike existing Wi-Fi networks relies on
the visible light spectrum to transmit data instead of the radio spectrum. The resulting two key differences are
much faster internet speeds and more secure transmission of data as Li-Fi could not penetrate barriers for
light such as walls. Advanced wireless internet connectivity will allow for applications such as remote control
of construction activities.
Example Application: Whim, a mobility-as-a-service provider in Helsinki, makes use of 5G technology to
provide improved transport journey planning across the variety of available transport options – each
communicating with a user’s phone application to provide information on the best option to get from A to B.
Technological Maturity: Li-Fi and 5G are both developed for commercial application while 6G is still in
initial phases of development.
Technology Timeline: 5G is predicted to be widespread in application within the next decade with 6G
developing some point after this. Li-Fi is available for adoption currently.
Key Barriers: Wireless connectivity faces barriers of regulation of the electromagnetic spectrum and digital
security as greater wireless connectivity and dependence creates more access points for unwanted data
access. Social perception especially in related to 5G will be a key barrier to overcome as concerns have
been raised about national security threats.
Use Cases:
• Enabling IoT
• Faster internet speeds, greater connectivity
• Autonomous vehicles
• Smart cities
87 Arup. “Emerging Technology Timeline.” Arup, 2017.

| Appendix A – Incremental and disruptive technologies |
Preparing for Technological Change in the Infrastructure Sector | 3821960-1147589789-62 | 31/05/2021 | 99
2. Internet of Things – Sensors
Technological Maturity Technology Timeline Key Barriers
Developing 2020-2030 Security, regulation, bandwidth, compatibility
The Internet of Things (IoT) is a network of physical objects capable of collecting, sharing and acting on data
without human intervention. At its core, the IoT relies on physical devices, sensors and telecommunication
networks to optimise processes based on a greater set of data from the whole network of devices88.
The Internet of Things will impact on the way infrastructure is managed and optimised through greater real-
time communication between elements in a network.
Example Application: Suez, a Singapore-based environmental technologies company, successfully
reduced water consumption through incentives and a network of internet connected smart water sensors to
manage demand and allow individuals to track water consumption on their electronic devices89.
Technological Maturity: The IoT is already presented in limited forms as devices have the capability of
communicating with each other without human interaction, however, development will continue, and greater
benefits will be achieved when dominant IoT platforms emerge with a common connection format.
Technology Timeline: Adoption is already underway however, a step-change in the integration of devices
could occur within the decade.
Key Barriers: Development of enabling technologies such as 5G and more efficient and smaller batteries
can hold back the IoT development. Security of the technology and data being transmitted is a second key
barrier as the IoT greatly increases the surface area for attack. Regulation of the IoT market is likely to lag
development and could cause uncertain for adopters. Compatibility of different devices and bandwidth for
connecting the devices90.
Use Cases:
• Wearable technology – improved connectivity, health tracking etc.
• Traffic monitoring
• Smart farms – better monitoring of soil condition, weather etc.
• Smart meters for water supply, electricity supply
• Managing maintenance sensors to predict health of structures
88 PricewaterhouseCoopers. “2019 IoT Survey: Speed Operations, Strengthen Relationships and Drive What’s next.” Accessed March
15, 2021. https://www.pwc.com/us/en/services/consulting/technology/emerging-technology/iot-pov.html.
89 “What If Saving Water Became a Game?” Accessed February 18, 2021. https://www.suezsmartsolutions.com/en/blog/what-if-saving-
water-became-a-game.
90 D’mello, Anasia. “5 Challenges Still Facing the Internet of Things,” June 3, 2020. https://www.iot-now.com/2020/06/03/103228-5-
challenges-still-facing-the-internet-of-things/.
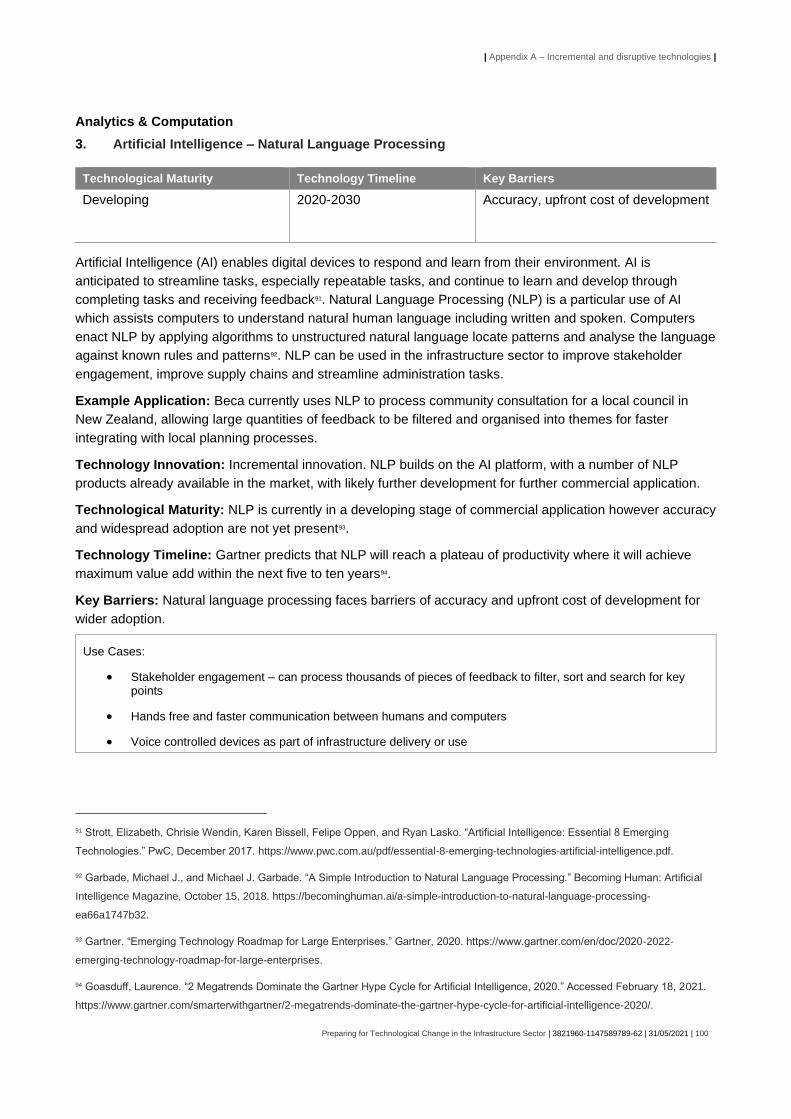
| Appendix A – Incremental and disruptive technologies |
Preparing for Technological Change in the Infrastructure Sector | 3821960-1147589789-62 | 31/05/2021 | 100
Analytics & Computation
3. Artificial Intelligence – Natural Language Processing
Technological Maturity Technology Timeline Key Barriers
Developing 2020-2030 Accuracy, upfront cost of development
Artificial Intelligence (AI) enables digital devices to respond and learn from their environment. AI is
anticipated to streamline tasks, especially repeatable tasks, and continue to learn and develop through
completing tasks and receiving feedback91. Natural Language Processing (NLP) is a particular use of AI
which assists computers to understand natural human language including written and spoken. Computers
enact NLP by applying algorithms to unstructured natural language locate patterns and analyse the language
against known rules and patterns92. NLP can be used in the infrastructure sector to improve stakeholder
engagement, improve supply chains and streamline administration tasks.
Example Application: Beca currently uses NLP to process community consultation for a local council in
New Zealand, allowing large quantities of feedback to be filtered and organised into themes for faster
integrating with local planning processes.
Technology Innovation: Incremental innovation. NLP builds on the AI platform, with a number of NLP
products already available in the market, with likely further development for further commercial application.
Technological Maturity: NLP is currently in a developing stage of commercial application however accuracy
and widespread adoption are not yet present93.
Technology Timeline: Gartner predicts that NLP will reach a plateau of productivity where it will achieve
maximum value add within the next five to ten years94.
Key Barriers: Natural language processing faces barriers of accuracy and upfront cost of development for
wider adoption.
Use Cases:
• Stakeholder engagement – can process thousands of pieces of feedback to filter, sort and search for key points
• Hands free and faster communication between humans and computers
• Voice controlled devices as part of infrastructure delivery or use
91 Strott, Elizabeth, Chrisie Wendin, Karen Bissell, Felipe Oppen, and Ryan Lasko. “Artificial Intelligence: Essential 8 Emerging
Technologies.” PwC, December 2017. https://www.pwc.com.au/pdf/essential-8-emerging-technologies-artificial-intelligence.pdf.
92 Garbade, Michael J., and Michael J. Garbade. “A Simple Introduction to Natural Language Processing.” Becoming Human: Artificial
Intelligence Magazine, October 15, 2018. https://becominghuman.ai/a-simple-introduction-to-natural-language-processing-
ea66a1747b32.
93 Gartner. “Emerging Technology Roadmap for Large Enterprises.” Gartner, 2020. https://www.gartner.com/en/doc/2020-2022-
emerging-technology-roadmap-for-large-enterprises.
94 Goasduff, Laurence. “2 Megatrends Dominate the Gartner Hype Cycle for Artificial Intelligence, 2020.” Accessed February 18, 2021.
https://www.gartner.com/smarterwithgartner/2-megatrends-dominate-the-gartner-hype-cycle-for-artificial-intelligence-2020/.

| Appendix A – Incremental and disruptive technologies |
Preparing for Technological Change in the Infrastructure Sector | 3821960-1147589789-62 | 31/05/2021 | 101
4. Artificial intelligence – Machine Learning
Technological Maturity
Technology Timeline
Key Barriers
Developing 2020-2030 Training and skills to implement, application cases, data quality
and scope.
Machine learning is a branch of artificial intelligence concerning the constant autonomous improvement of
the accuracy of computational processes through mass data and repetition. Machine learning involves
algorithms that are trained to enact processes and make decision based on data of previous decisions and
outcomes. As more data is made available, the algorithm improves to become more accurate for future
decisions95. Machine learning is fundamental to the practical application of predictive maintenance which
based on a subset of data could predict likely failure or maintenance needs for assets96.
Example Application: The University of Queensland has made use of machine learning for predictive
maintenance using a condition monitoring device made by Movus which can record data about building
condition and check against reference case patterns for likely failure97.
Technological Maturity: Machine learning is a developing technology that has existing commercial
applications; however, most business are either only exploring machine learning or are early adopters
according to American learning company O’Reilly Media98.
Technology Timeline: Machine learning is anticipated to reach widespread integrated use within the next
two to five years according to Gartner99.
Key Barriers: Machine learning faces the following three main barriers to widespread implementation: a
shortage of skilled and trained staff to implement machine learning, difficulty applying machine learning to
particular fields of work, lack of data quality and collection.
Use Cases:
• Analyse individual use of infrastructure to optimise services
• In new transport solutions such as autonomous vehicles
• Diagnosis of diseases and ailments
• Predicting electricity demand based on learned use
95 IBM Cloud Education. “What Is Machine Learning?” Accessed March 1, 2021. https://www.ibm.com/cloud/learn/machine-learning.
96 Global Infrastructure Hub. “InfraTech Stock Take of Use Cases.” Global Infrastructure Hub, July 2020.
97 Global Infrastructure Hub. “InfraTech Stock Take of Use Cases.”
98 Lorica, Ben, and Paco Nathan. “The State of Machine Learning Adoption in the Enterprise.” O’Reilly Media, August 2018.
https://www.bastagroup.nl/wp-content/uploads/2019/01/the-state-of-machine-learning-adoption-in-the-enterprise.pdf.
99 Goasduff, Laurence. “2 Megatrends Dominate the Gartner Hype Cycle for Artificial Intelligence, 2020.”
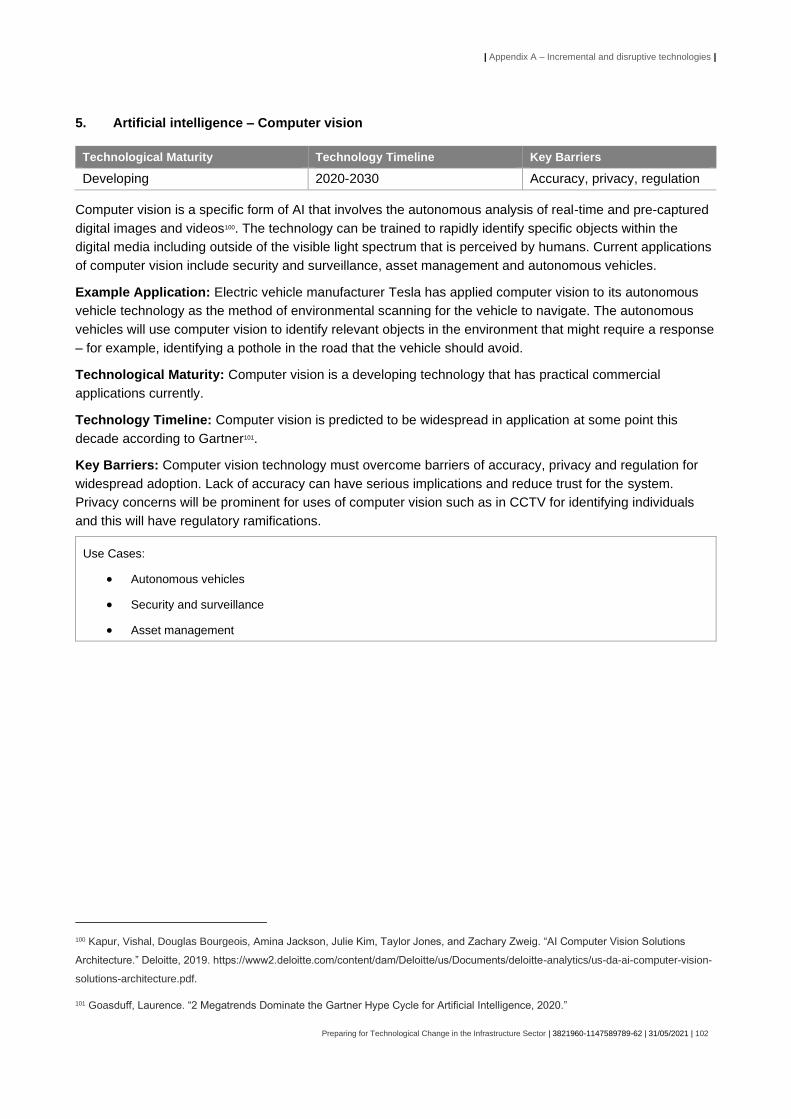
| Appendix A – Incremental and disruptive technologies |
Preparing for Technological Change in the Infrastructure Sector | 3821960-1147589789-62 | 31/05/2021 | 102
5. Artificial intelligence – Computer vision
Technological Maturity Technology Timeline Key Barriers
Developing 2020-2030 Accuracy, privacy, regulation
Computer vision is a specific form of AI that involves the autonomous analysis of real-time and pre-captured
digital images and videos100. The technology can be trained to rapidly identify specific objects within the
digital media including outside of the visible light spectrum that is perceived by humans. Current applications
of computer vision include security and surveillance, asset management and autonomous vehicles.
Example Application: Electric vehicle manufacturer Tesla has applied computer vision to its autonomous
vehicle technology as the method of environmental scanning for the vehicle to navigate. The autonomous
vehicles will use computer vision to identify relevant objects in the environment that might require a response
– for example, identifying a pothole in the road that the vehicle should avoid.
Technological Maturity: Computer vision is a developing technology that has practical commercial
applications currently.
Technology Timeline: Computer vision is predicted to be widespread in application at some point this
decade according to Gartner101.
Key Barriers: Computer vision technology must overcome barriers of accuracy, privacy and regulation for
widespread adoption. Lack of accuracy can have serious implications and reduce trust for the system.
Privacy concerns will be prominent for uses of computer vision such as in CCTV for identifying individuals
and this will have regulatory ramifications.
Use Cases:
• Autonomous vehicles
• Security and surveillance
• Asset management
100 Kapur, Vishal, Douglas Bourgeois, Amina Jackson, Julie Kim, Taylor Jones, and Zachary Zweig. “AI Computer Vision Solutions
Architecture.” Deloitte, 2019. https://www2.deloitte.com/content/dam/Deloitte/us/Documents/deloitte-analytics/us-da-ai-computer-vision-
solutions-architecture.pdf.
101 Goasduff, Laurence. “2 Megatrends Dominate the Gartner Hype Cycle for Artificial Intelligence, 2020.”

| Appendix A – Incremental and disruptive technologies |
Preparing for Technological Change in the Infrastructure Sector | 3821960-1147589789-62 | 31/05/2021 | 103
6. Ambient intelligence (hyper-personalisation)
Technological Maturity Technology Timeline Key Barriers
Developing 2020-2030 Power sources, device connectivity
Ambient intelligence describes a range of technological devices implanted in the human environment that
actively sense and respond to human presence and autonomously act to enhance the environment to benefit
those present102. Ambient intelligence relies on integrating four elements of computing: ubiquitous computing,
intelligent systems research, context awareness, and understanding social interactions of objects in their
environments. Ambient intelligence relies on the Internet of Things for the sensing and communication of and
between electronic devices.
Example Application: Smart home technology products use basic elements of ambient intelligence to
improve comfort, security and health through limited sensing of the needs of occupants.
Technology Innovation: Incremental innovation. Technology will be incrementally rolled out building on
Internet of Things for the sensing and communication between electronic devices.
Technological Maturity: Elements of ambient intelligence are in commercial use; however, extensive
development is required to realise the full potential of the technology.
Technology Timeline: Adoption of ambient intelligence is predicted by Gartner to occur within the next
decade. Gartner refers to aspects of ambient intelligence within the domain of ‘smart spaces’ which was
identified as a leading technology trend in 2020103.
Key Barriers: Barriers include limitations of enabling technologies such as 5G and batteries to connect
small and distributed sensors and devices104.
Use Cases:
• Smart homes and buildings that can automatically sense and respond to the presence of people – impact on energy
• Health and aged care facilities that might require less active monitoring as the room will be able to sense and adjust appropriately
102 Hutchinson, Frederick. “A Literature Review of Modern Ambient Intelligence in Smarthomes.” University of Auckland, Abgerufen Am
17 (2016): 2014.
103 Cearley, Analyst :. David, Nick Jones, David Smith, Brian Burke, Arun Chandrasekaran, and C. K. Lu. “Top 10 Strategic Technology
Trends for 2020.” Accessed February 17, 2021. https://emtemp.gcom.cloud/ngw/globalassets/en/doc/documents/432920-top-10-
strategic-technology-trends-for-2020.pdf.
104 Shadbolt, Nigel. “Ambient Intelligence.” IEEE Intelligent Systems 18, no. 4 (2003): 2–3.
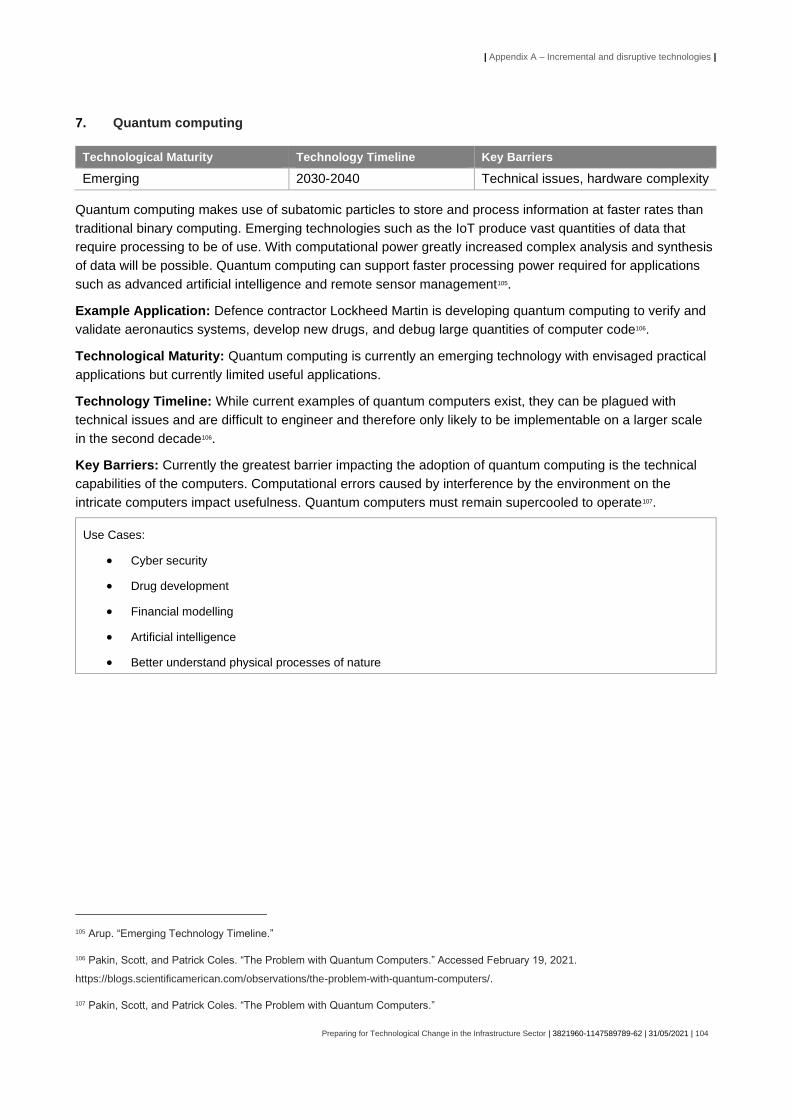
| Appendix A – Incremental and disruptive technologies |
Preparing for Technological Change in the Infrastructure Sector | 3821960-1147589789-62 | 31/05/2021 | 104
7. Quantum computing
Technological Maturity Technology Timeline Key Barriers
Emerging 2030-2040 Technical issues, hardware complexity
Quantum computing makes use of subatomic particles to store and process information at faster rates than
traditional binary computing. Emerging technologies such as the IoT produce vast quantities of data that
require processing to be of use. With computational power greatly increased complex analysis and synthesis
of data will be possible. Quantum computing can support faster processing power required for applications
such as advanced artificial intelligence and remote sensor management105.
Example Application: Defence contractor Lockheed Martin is developing quantum computing to verify and
validate aeronautics systems, develop new drugs, and debug large quantities of computer code106.
Technological Maturity: Quantum computing is currently an emerging technology with envisaged practical
applications but currently limited useful applications.
Technology Timeline: While current examples of quantum computers exist, they can be plagued with
technical issues and are difficult to engineer and therefore only likely to be implementable on a larger scale
in the second decade106.
Key Barriers: Currently the greatest barrier impacting the adoption of quantum computing is the technical
capabilities of the computers. Computational errors caused by interference by the environment on the
intricate computers impact usefulness. Quantum computers must remain supercooled to operate107.
Use Cases:
• Cyber security
• Drug development
• Financial modelling
• Artificial intelligence
• Better understand physical processes of nature
105 Arup. “Emerging Technology Timeline.”
106 Pakin, Scott, and Patrick Coles. “The Problem with Quantum Computers.” Accessed February 19, 2021.
https://blogs.scientificamerican.com/observations/the-problem-with-quantum-computers/.
107 Pakin, Scott, and Patrick Coles. “The Problem with Quantum Computers.”

| Appendix A – Incremental and disruptive technologies |
Preparing for Technological Change in the Infrastructure Sector | 3821960-1147589789-62 | 31/05/2021 | 105
8. Generative Design
Technological Maturity Technology Timeline Key Barriers
Emerging 2020-2030 Complementary technology
Generative design enhances the design process by using algorithms and technology to expand the design
variations considered at each step of the design process108. The algorithms compare thousands of variations
to the main design by testing different parameters to reach a more optimal design based on the chosen
favoured attributes109. Currently, generative design is most used in structural optimisation where there is
tension between design parameters such as strength, mass, and stiffness.
Example Application: Software company, Autodesk, has utilised generative design to produce an optimised
3D model of a potential future airplane seat which would reduce airplane weight and hence generate cost
and emissions savings110.
Technological Maturity: Generative design is an emerging technology that has limited commercial
examples at this stage.
Technology Timeline: Adoption of generative design is limited by the use of the output. Generative design
can produce complex designs that physically are difficult to create and rely on advanced 3D printing to
manufacture.
Key Barriers: Complementary technology provides a barrier for wider use of generative design – limitations
in the materials that can be printed in 3D restrict the realisation of outputs from generative design111.
Use Cases:
• Design of all types of assets and infrastructure
108 McKnight, Matthew. “Generative Design: What It Is? How Is It Being Used? Why It’s a Game Changer.” KnE Engineering 2, no. 2
(February 9, 2017): 176.
109 Brossard, Mickael, Giacomo Gatto, Alessandro Gentile, Tom Merle, and Chris Wlezien. “How Generative Design Could Reshape the
Future of Product Development.” McKinsey & Company, February 5, 2020. https://www.mckinsey.com/business-
functions/operations/our-insights/how-generative-design-could-reshape-the-future-of-product-development.
110 “Optimized Airplane Seat Design Using 3D-Printing.” Accessed February 19, 2021.
https://www.autodesk.com/campaigns/additive/airplane-seat.
111 Global Infrastructure Hub. “InfraTech Stock Take of Use Cases.”
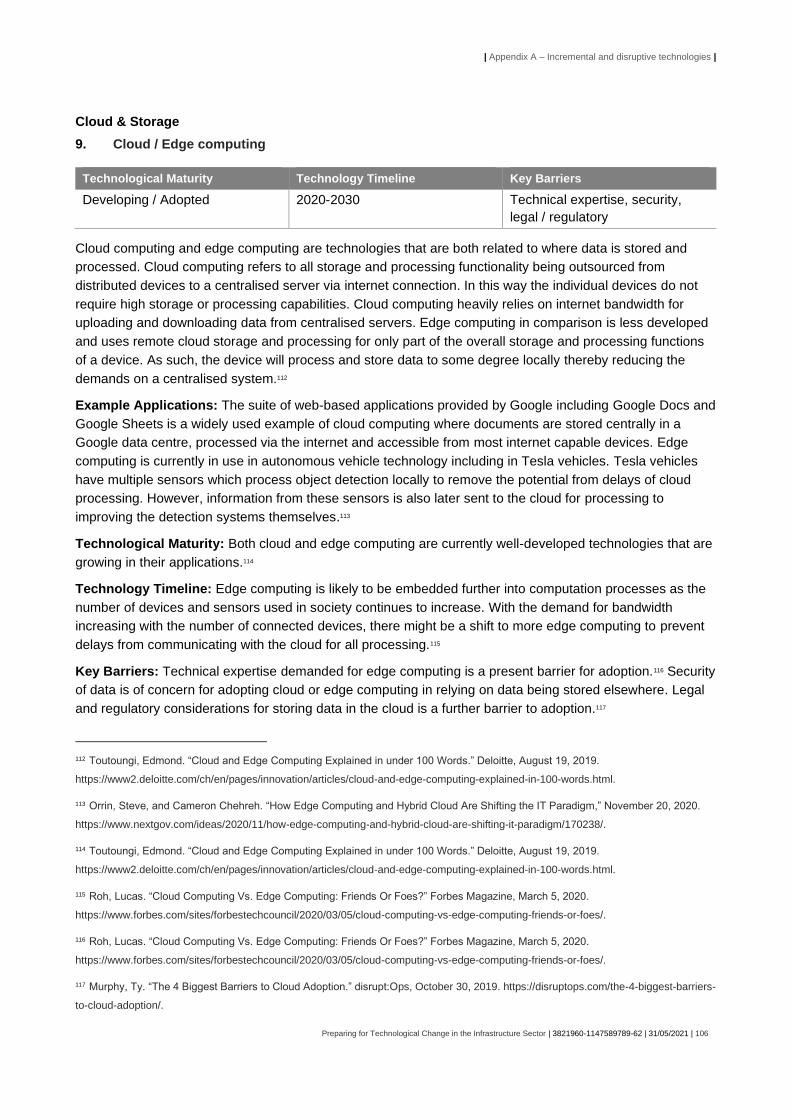
| Appendix A – Incremental and disruptive technologies |
Preparing for Technological Change in the Infrastructure Sector | 3821960-1147589789-62 | 31/05/2021 | 106
Cloud & Storage
9. Cloud / Edge computing
Technological Maturity Technology Timeline Key Barriers
Developing / Adopted 2020-2030 Technical expertise, security,
legal / regulatory
Cloud computing and edge computing are technologies that are both related to where data is stored and
processed. Cloud computing refers to all storage and processing functionality being outsourced from
distributed devices to a centralised server via internet connection. In this way the individual devices do not
require high storage or processing capabilities. Cloud computing heavily relies on internet bandwidth for
uploading and downloading data from centralised servers. Edge computing in comparison is less developed
and uses remote cloud storage and processing for only part of the overall storage and processing functions
of a device. As such, the device will process and store data to some degree locally thereby reducing the
demands on a centralised system.112
Example Applications: The suite of web-based applications provided by Google including Google Docs and
Google Sheets is a widely used example of cloud computing where documents are stored centrally in a
Google data centre, processed via the internet and accessible from most internet capable devices. Edge
computing is currently in use in autonomous vehicle technology including in Tesla vehicles. Tesla vehicles
have multiple sensors which process object detection locally to remove the potential from delays of cloud
processing. However, information from these sensors is also later sent to the cloud for processing to
improving the detection systems themselves.113
Technological Maturity: Both cloud and edge computing are currently well-developed technologies that are
growing in their applications.114
Technology Timeline: Edge computing is likely to be embedded further into computation processes as the
number of devices and sensors used in society continues to increase. With the demand for bandwidth
increasing with the number of connected devices, there might be a shift to more edge computing to prevent
delays from communicating with the cloud for all processing.115
Key Barriers: Technical expertise demanded for edge computing is a present barrier for adoption.116 Security
of data is of concern for adopting cloud or edge computing in relying on data being stored elsewhere. Legal
and regulatory considerations for storing data in the cloud is a further barrier to adoption.117
112 Toutoungi, Edmond. “Cloud and Edge Computing Explained in under 100 Words.” Deloitte, August 19, 2019.
https://www2.deloitte.com/ch/en/pages/innovation/articles/cloud-and-edge-computing-explained-in-100-words.html.
113 Orrin, Steve, and Cameron Chehreh. “How Edge Computing and Hybrid Cloud Are Shifting the IT Paradigm,” November 20, 2020.
https://www.nextgov.com/ideas/2020/11/how-edge-computing-and-hybrid-cloud-are-shifting-it-paradigm/170238/.
114 Toutoungi, Edmond. “Cloud and Edge Computing Explained in under 100 Words.” Deloitte, August 19, 2019.
https://www2.deloitte.com/ch/en/pages/innovation/articles/cloud-and-edge-computing-explained-in-100-words.html.
115 Roh, Lucas. “Cloud Computing Vs. Edge Computing: Friends Or Foes?” Forbes Magazine, March 5, 2020.
https://www.forbes.com/sites/forbestechcouncil/2020/03/05/cloud-computing-vs-edge-computing-friends-or-foes/.
116 Roh, Lucas. “Cloud Computing Vs. Edge Computing: Friends Or Foes?” Forbes Magazine, March 5, 2020.
https://www.forbes.com/sites/forbestechcouncil/2020/03/05/cloud-computing-vs-edge-computing-friends-or-foes/.
117 Murphy, Ty. “The 4 Biggest Barriers to Cloud Adoption.” disrupt:Ops, October 30, 2019. https://disruptops.com/the-4-biggest-barriers-
to-cloud-adoption/.

| Appendix A – Incremental and disruptive technologies |
Preparing for Technological Change in the Infrastructure Sector | 3821960-1147589789-62 | 31/05/2021 | 107
Use Cases118:
• Autonomous vehicles – processing and storing necessary data locally while transmitting other data for processing and storage elsewhere.
• Predictive maintenance – especially in areas with lower internet bandwidth.
• In-hospital patient monitoring – a combination of edge and cloud computing can be used to process patient information without needed to store sensitive information off-device.
• Live traffic management – sensors with some processing capability will be able to analyse operations without needing constant bandwidth to a centralised processing location. Data can be sent to cloud storage on an as-needed basis.
10. Distributed ledger technology / Blockchain
Technological Maturity Technology Timeline Key Barriers
Developing 2020-2030 Implementation, security, and
legal limitations
Blockchain is the common name given to distributed digital ledger technology. Digital ledgers record and
verify transactions with unique identifiers in a shared ledger to ensure reliability and anonymity. Once a
transaction has been recorded in the digital ledger it generally cannot be altered119. Blockchain removes
intermediaries such as a bank, government or company from transactions reducing costs and increasing
speeds of information or financial transfer120. Blockchain is the foundation behind cryptocurrencies where it is
primarily used currently, although broader use for blockchain is anticipated to develop121. Blockchain is
predicted to have direct applications in the infrastructure sector for uses including contract management,
alignment and monitoring of infrastructure standards and improved traceability and transferral of construction
information when ownership of assets changes122.
Example Applications: US-based blockchain developer Briq has developed a use case for a distributed
ledger to capture and securely store the documentation for a construction project. The documentation can
then be accessed by the various parties undertaking the project and upon delivery be readily transferred to
the client123.
118 Siersted, Nikolai. “10 Edge Computing Use Case Examples.” STL Partners, June 16, 2020. https://stlpartners.com/edge-
computing/10-edge-computing-use-case-examples/.
119 Davis, Steve, Henri Arslanian, Dick Fong, Andrew Watkins, William Gee, and Chun Yin Cheung. “PwC’s Global Blockchain Survey
2018.” PwC, 2018. https://www.pwccn.com/en/research-and-insights/publications/global-blockchain-survey-2018/global-blockchain-
survey-2018-report.pdf.
120 Furlonger, David, and Christophe Uzureau. “The Real Business of Blockchain.” Gartner, 2019.
https://emtemp.gcom.cloud/ngw/globalassets/en/publications/documents/the-real-business-of-blockchain-chapter-1.pdf.
121 Yaga, Dylan, Peter Mell, Nik Roby, and Karen Scarfone. “Blockchain Technology Overview.” Gaithersburg, MD: National Institute of
Standards and Technology, October 2018. https://doi.org/10.6028/nist.ir.8202.
122 “Blockchain-Technologies-as-a-Digital-Enabler-for-Sustainable-Infrastructure-Key-Findings.pdf,” n.d.
https://www.oecd.org/finance/Blockchain-technologies-as-a-digital-enabler-for-sustainable-infrastructure-key-findings.pdf.
123 “How Blockchain Will Change Construction.” Harvard Business Review, July 26, 2019. https://hbr.org/2019/07/how-blockchain-will-
change-construction.

| Appendix A – Incremental and disruptive technologies |
Preparing for Technological Change in the Infrastructure Sector | 3821960-1147589789-62 | 31/05/2021 | 108
Technological Maturity: Blockchain is already in successful commercial operation through cryptocurrencies
such as Bitcoin, but currently has limited application outside of this application121.
Technology Timeline: Gartner predicts that blockchain will deliver initial complete blockchain solutions by
2023, but that enhanced blockchain – where it is integrated with complementary technologies will reach the
market post 2030124.
Key Barriers: Cost of blockchain development, unclarity of application and lack of regulatory governance
are stalling progress of the technology according to PWC’s Global Blockchain Survey 2018125. Trust in the
technology along with lack of standardisation and interoperability of different blockchain platforms are also
perceived as barriers to blockchain adoption126.
Use Cases:
• Peer to peer selling of individual electricity production
• Smart contracts – enforced in real-time to add accountability
• Transferring medical information securely – could allow for a more integrated primary healthcare industry in NZ
• Enabling cryptocurrency
• Adding higher level of security to IoT
• Improve data transparency for shipping industry to provide a single source of truth and enable more accurate tracking of cargo.
Devices & Automation
11. Building Management Systems (BMS) / Building Automation Systems (BAS)
Technological Maturity Technology Timeline Key Barriers
Developing 2020-2030 Resilience, retrofitting, cost
Building Management Systems (BMS) – also called Building Automation Systems (BAS) – are an integrated
system of devices installed in a building that through a centralised processing unit can monitor and control
the technical systems and services of that building. Such technical systems or services can include lighting,
air conditioning, elevators, water management and security. BMS is predicted to have useful applications in
the planning, operation, and maintenance of infrastructure.
Example Application: Global technology and design company Honeywell, installed a BMS in Buda Castle
in Budapest to automate the electric control, access system, intrusion alarm, video surveillance and fire
alarm systems127.
Technological Maturity: BMS already exists in commercial operation but will further mature as
complementary technologies such as BIM develop further.
124 Panetta, Kasey. “The CIO’s Guide to Blockchain - Smarter With Gartner.” Accessed February 17, 2021.
https://www.gartner.com/smarterwithgartner/the-cios-guide-to-blockchain/.
125 Davis, Arslanian, Fong, Watkins, Gee, and Cheung. “PwC’s Global Blockchain Survey 2018.”
126 Davis, Arslanian, Fong, Watkins, Gee, and Cheung. “PwC’s Global Blockchain Survey 2018.”
127 “Automation of the Buda Castle Complex.” Honeywell Building Solutions, 2019.
https://buildings.honeywell.com/content/dam/honeywell-building-technology/en-us/documents/Buda%20Castle_CS.pdf.

| Appendix A – Incremental and disruptive technologies |
Preparing for Technological Change in the Infrastructure Sector | 3821960-1147589789-62 | 31/05/2021 | 109
Technology Timeline: Generally limited currently to commercial and larger residential buildings, especially
new builds, in the coming decade it is likely that BMS will be retrofitted to existing buildings and smaller
residential buildings.
Key Barriers: Resilience is likely to be a barrier for uptake of BMS as controlling all building systems
through one digital platform increases the vulnerability of building operations if the platform fails. BMS relies
on new physical infrastructure for operation and therefore cost of implementation might reduce
implementation.
Use Cases:
• Monitor and control the technical systems and services of that building. Such technical systems or services can include lighting, air conditioning, elevators, water management and security. BMS is predicted to have useful applications in the planning, operation, and maintenance of infrastructure.
12. Automation
Technological Maturity Technology Timeline Key Barriers
Mature 2020-2050 Social acceptance, skills and guidance
Automation describes a broad range of technologies where automatic processes replace or reduce the need
for human input128. Automation may involve robotics for physical activities, or the automation could involve
solely digital processes. The degree of automation and hence the reduce in human input varies from low
level automation such as automating basic repeatable tasks to higher level automation that involves AI to
allow decision making to further reduce the required human input.
Example Application: Ford, the car manufacturing company, has developed an autonomous robot to
independently transport industrial and welding materials to other robots physically constructing vehicles.
Process automation has reduced manual handling and repetitive tasks for human employees129.
Technological Maturity: Robotic process automation (RPA) is well implemented within some industries
today and is already creating value for businesses130.
Technology Timeline: Automation is an existing technology which will mature further and integrate with
other technologies such as AI and ML to derive additional value for commercial applications.
Key Barriers: Social implication of automation will present a barrier for increased implementation for fear of
rendering existing jobs obsolete. Skills and guidance within and for businesses will be a key challenge for
further adopting automation.
Use Cases:
• Automated construction / assembly
• Automated operation of infrastructure
128 IBM. “What Is Automation?” Accessed March 16, 2021. https://www.ibm.com/topics/automation.
129 Weinberg, Neal. “Case Study: Why Ford Deployed AMRs to Automate Spanish Factory,” September 26, 2019.
https://www.roboticsbusinessreview.com/case_studies/case-study-why-ford-deployed-amrs-to-automate-spanish-factory/.
130 Ray, Analyst :. Saikat, Cathy Tornbohm, Marc Kerremans, and Derek Miers. “Move beyond RPA to Deliver Hyperautomation.”
Accessed February 18, 2021. https://emtemp.gcom.cloud/ngw/globalassets/en/doc/documents/433853-move-beyond-rpa-to-deliver-
hyperautomation.pdf.

| Appendix A – Incremental and disruptive technologies |
Preparing for Technological Change in the Infrastructure Sector | 3821960-1147589789-62 | 31/05/2021 | 110
13. Drones / Robotics (including autonomous technology)
Technological Maturity Technology Timeline Key Barriers
Developing 2020-2040 Regulation
Drones and robotics are unmanned electronic devices that extend the reach of electronic devices which
require direct human input or interaction. Drones and robotics have wide ranging uses including surveillance,
inspection, physical delivery of goods and data collection. A key benefit of drones and robotics is to provide a
cost-effective alternative for previously high-risk or time-consuming tasks including for tasks such as
maintenance inspections and manufacturing131.
Example Application: The national railway company of France, SNCF, has used drones fitted with LIDAR
sensors which create a 3D image of the rail assets with accuracy to within one centimetre allowing for
advanced remote inspection132.
Technological Maturity: Developing. While commercial and recreational drones and robotic devices are
commonplace, effectively integrating drones and robotics into specific industries relies on complementary
technology, much of which is still under development133.
Technology Timeline: Drones and robotics are currently in widespread use in many industries however,
their use is likely to continue to grow as further applications are found and the technology develops further.
Key Barriers: Due to the rapidly developing nature of drone and robotic technology key regulations might
not be in place to facilitate their use or enable innovation. Key regulations around safety and security must
be addressed133.
Use Cases:
• Surveying hard to reach / dangerous locations
• Transportation of materials, equipment, and people
• Robotic manufacturing for cost saving and accuracy
131 Global Infrastructure Hub. “InfraTech Stock Take of Use Cases.”
132 SNCF Reseau. “Drones, the Railway and Altametris.” SNCF Reseau. Accessed February 19, 2021. https://www.sncf-
reseau.com/en/entreprise/newsroom/sujet/drones-the-railway-and-altametris.
133 SNCF Reseau. “Drones, the Railway and Altametris.”

| Appendix A – Incremental and disruptive technologies |
Preparing for Technological Change in the Infrastructure Sector | 3821960-1147589789-62 | 31/05/2021 | 111
14. Biometrics
Technological Maturity Technology Timeline Key Barriers
Developing/Mature 2020-2040 Legal, regulatory, social, security
Biometrics is the use of unique, personal identifiers for identification and authentication of identity134. The two
main forms of biometrics are physiological measurements and behavioural measurements. Physiological
measurements are either morphological (visibly distinct features such as fingerprints) or biological
(chemically distinct features such as DNA), while behavioural measurements are identifiable behavioural
traits such as speech, gestures and keystroke dynamics.
Example Application: Myriad personal electronic devices make use of morphological and behavioural
measures such a fingerprint and facial recognition for authentication.
Technological Maturity: Biometrics are widely used in commercial operation today, further development in
more secure forms such as biological measurements and wider applications of all forms is likely to occur.
Technology Timeline: Biometric technology is already in use with wider use developing over the next two
decades as security – especially digital security – becomes more important.
Key Barriers: Legal and regulatory challenges are likely to impact the adoption biometric technology as
users deliberate the rights to personal identifying information. In part this is due to a related barrier of
information security. Biometric technology will need to be proven to be secure for greater adoption in the
future.
Use Cases:
• Advanced security and identity verification for travel, employment, finance
134 Thales. “Biometrics (facts, Use Cases, Biometric Security),” March 6, 2021. https://www.thalesgroup.com/en/markets/digital-identity-
and-security/government/inspired/biometrics.
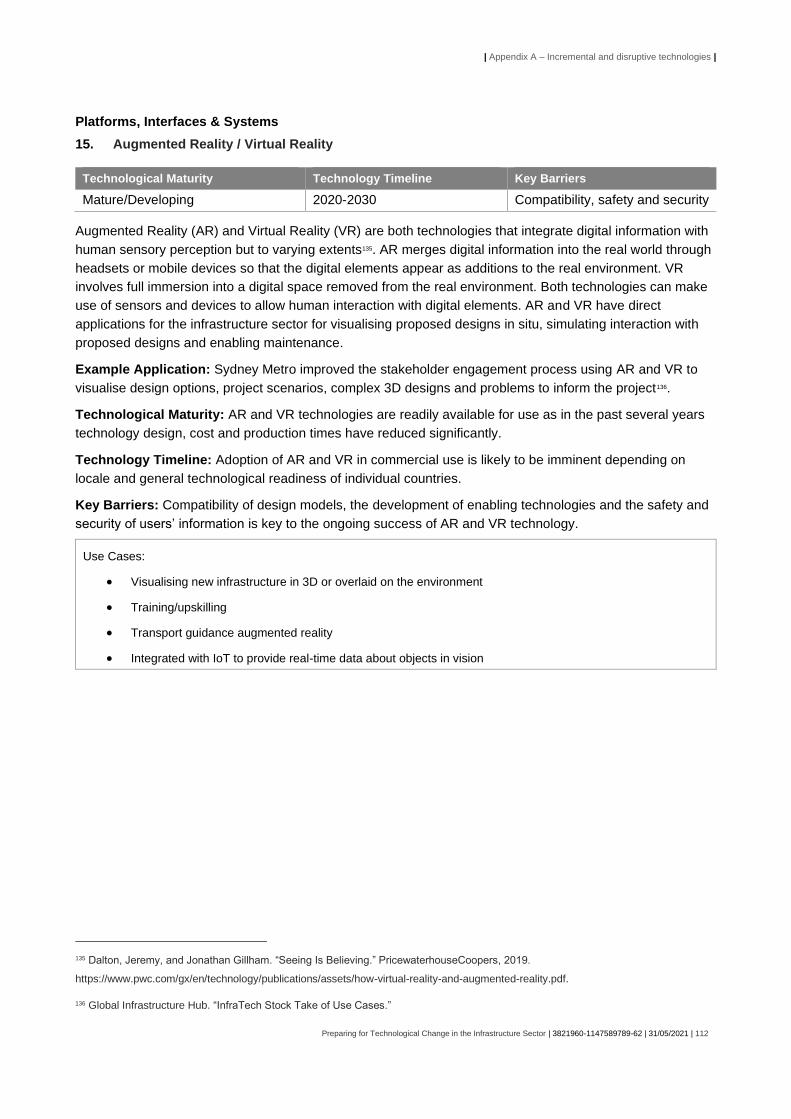
| Appendix A – Incremental and disruptive technologies |
Preparing for Technological Change in the Infrastructure Sector | 3821960-1147589789-62 | 31/05/2021 | 112
Platforms, Interfaces & Systems
15. Augmented Reality / Virtual Reality
Technological Maturity Technology Timeline Key Barriers
Mature/Developing 2020-2030 Compatibility, safety and security
Augmented Reality (AR) and Virtual Reality (VR) are both technologies that integrate digital information with
human sensory perception but to varying extents135. AR merges digital information into the real world through
headsets or mobile devices so that the digital elements appear as additions to the real environment. VR
involves full immersion into a digital space removed from the real environment. Both technologies can make
use of sensors and devices to allow human interaction with digital elements. AR and VR have direct
applications for the infrastructure sector for visualising proposed designs in situ, simulating interaction with
proposed designs and enabling maintenance.
Example Application: Sydney Metro improved the stakeholder engagement process using AR and VR to
visualise design options, project scenarios, complex 3D designs and problems to inform the project136.
Technological Maturity: AR and VR technologies are readily available for use as in the past several years
technology design, cost and production times have reduced significantly.
Technology Timeline: Adoption of AR and VR in commercial use is likely to be imminent depending on
locale and general technological readiness of individual countries.
Key Barriers: Compatibility of design models, the development of enabling technologies and the safety and
security of users’ information is key to the ongoing success of AR and VR technology.
Use Cases:
• Visualising new infrastructure in 3D or overlaid on the environment
• Training/upskilling
• Transport guidance augmented reality
• Integrated with IoT to provide real-time data about objects in vision
135 Dalton, Jeremy, and Jonathan Gillham. “Seeing Is Believing.” PricewaterhouseCoopers, 2019.
https://www.pwc.com/gx/en/technology/publications/assets/how-virtual-reality-and-augmented-reality.pdf.
136 Global Infrastructure Hub. “InfraTech Stock Take of Use Cases.”

| Appendix A – Incremental and disruptive technologies |
Preparing for Technological Change in the Infrastructure Sector | 3821960-1147589789-62 | 31/05/2021 | 113
16. Digital payments / Cryptocurrencies
Technological Maturity Technology Timeline Key Barriers
Developing 2020-2030 Security, volatility, regulation
Digital payments and cryptocurrency are cashless payment platforms that rely on digital mediums whether
with existing currencies that have a physical form or cryptocurrencies which only exist digitally.
Cryptocurrency in being transacted only digitally allowing fast payments and reduced transaction fees as
payments are direct peer-to-peer payments with no intermediary such as a bank. Cryptocurrencies are not
backed by government institutions, their values can vary greatly over time, and transactions are generally
irreversible leading more prevalent scamming137. Digital payments and cryptocurrencies are not anticipated to
have a specific impact on infrastructure within New Zealand.
Example Application: Bitcoin is an example of a cryptocurrency which has value and can be used to
purchase goods and services digitally – one notable company that is planning to accept Bitcoin is electric car
manufacturer Tesla.
Technological Maturity: Digital payments and cryptocurrencies will continue to develop and mature. Digital
payments are ubiquitous yet will develop further to increase speed, convenience and security.
Cryptocurrency has limited commercial application currently due to barriers.
Technology Timeline: Widespread adoption of cryptocurrencies as a means of digital payments is not
guaranteed due to the barriers for adoption. Despite this, the market of value of cryptocurrencies continue to
grow in aggregate and with some retailers accepting Bitcoin as payment widespread adoption within the next
decade is possible.
Key Barriers: Few barriers exist for digital payments using government backed currencies.
Cryptocurrencies, meanwhile, face three main barriers. Volatility of cryptocurrency value produces
uncertainty for vendors, security of cryptocurrency adds risk of theft and fraud, and regulation (or lack
thereof) of the market provides uncertainty for the future of cryptocurrency138.
Use Cases:
• Payment for goods and services in a peer-to-peer manner reducing transaction fees
• Potential for worldwide currency
137 “What to Know About Cryptocurrency,” October 19, 2018. https://www.consumer.ftc.gov/articles/what-know-about-cryptocurrency.
138 Scott, Matt. “Cryptocurrencies - On the Cusp of Mainstream?” Accessed February 18, 2021. https://www.mercer.co.nz/our-
thinking/wealth/cryptocurrencies-on-the-cusp-of-mainstream.html.
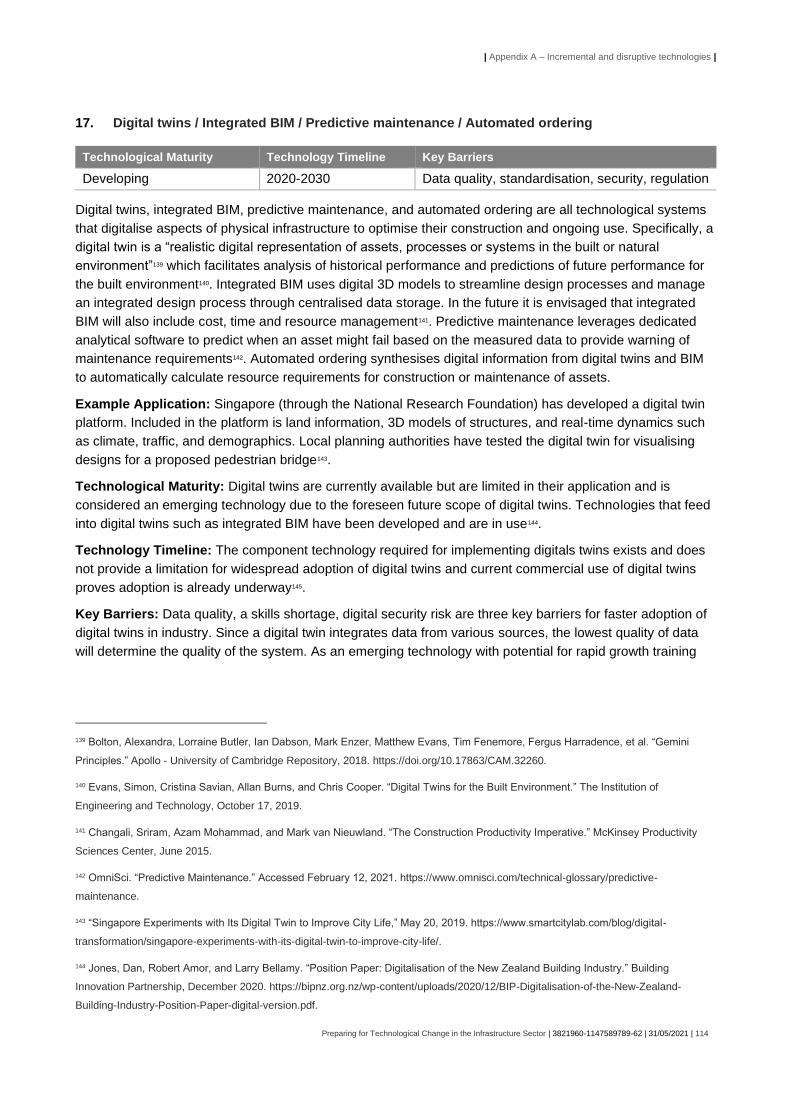
| Appendix A – Incremental and disruptive technologies |
Preparing for Technological Change in the Infrastructure Sector | 3821960-1147589789-62 | 31/05/2021 | 114
17. Digital twins / Integrated BIM / Predictive maintenance / Automated ordering
Technological Maturity Technology Timeline Key Barriers
Developing 2020-2030 Data quality, standardisation, security, regulation
Digital twins, integrated BIM, predictive maintenance, and automated ordering are all technological systems
that digitalise aspects of physical infrastructure to optimise their construction and ongoing use. Specifically, a
digital twin is a “realistic digital representation of assets, processes or systems in the built or natural
environment”139 which facilitates analysis of historical performance and predictions of future performance for
the built environment140. Integrated BIM uses digital 3D models to streamline design processes and manage
an integrated design process through centralised data storage. In the future it is envisaged that integrated
BIM will also include cost, time and resource management141. Predictive maintenance leverages dedicated
analytical software to predict when an asset might fail based on the measured data to provide warning of
maintenance requirements142. Automated ordering synthesises digital information from digital twins and BIM
to automatically calculate resource requirements for construction or maintenance of assets.
Example Application: Singapore (through the National Research Foundation) has developed a digital twin
platform. Included in the platform is land information, 3D models of structures, and real-time dynamics such
as climate, traffic, and demographics. Local planning authorities have tested the digital twin for visualising
designs for a proposed pedestrian bridge143.
Technological Maturity: Digital twins are currently available but are limited in their application and is
considered an emerging technology due to the foreseen future scope of digital twins. Technologies that feed
into digital twins such as integrated BIM have been developed and are in use144.
Technology Timeline: The component technology required for implementing digitals twins exists and does
not provide a limitation for widespread adoption of digital twins and current commercial use of digital twins
proves adoption is already underway145.
Key Barriers: Data quality, a skills shortage, digital security risk are three key barriers for faster adoption of
digital twins in industry. Since a digital twin integrates data from various sources, the lowest quality of data
will determine the quality of the system. As an emerging technology with potential for rapid growth training
139 Bolton, Alexandra, Lorraine Butler, Ian Dabson, Mark Enzer, Matthew Evans, Tim Fenemore, Fergus Harradence, et al. “Gemini
Principles.” Apollo - University of Cambridge Repository, 2018. https://doi.org/10.17863/CAM.32260.
140 Evans, Simon, Cristina Savian, Allan Burns, and Chris Cooper. “Digital Twins for the Built Environment.” The Institution of
Engineering and Technology, October 17, 2019.
141 Changali, Sriram, Azam Mohammad, and Mark van Nieuwland. “The Construction Productivity Imperative.” McKinsey Productivity
Sciences Center, June 2015.
142 OmniSci. “Predictive Maintenance.” Accessed February 12, 2021. https://www.omnisci.com/technical-glossary/predictive-
maintenance.
143 “Singapore Experiments with Its Digital Twin to Improve City Life,” May 20, 2019. https://www.smartcitylab.com/blog/digital-
transformation/singapore-experiments-with-its-digital-twin-to-improve-city-life/.
144 Jones, Dan, Robert Amor, and Larry Bellamy. “Position Paper: Digitalisation of the New Zealand Building Industry.” Building
Innovation Partnership, December 2020. https://bipnz.org.nz/wp-content/uploads/2020/12/BIP-Digitalisation-of-the-New-Zealand-
Building-Industry-Position-Paper-digital-version.pdf.

| Appendix A – Incremental and disruptive technologies |
Preparing for Technological Change in the Infrastructure Sector | 3821960-1147589789-62 | 31/05/2021 | 115
will be required to enable digital twin use. Wherever data is being stored and shared there is a risk of
security breach and this is no different for digital twins145.
Use Cases:
• Integrated design solutions on a city-wide scale
145 Global Infrastructure Hub. “InfraTech Stock Take of Use Cases.”

| Appendix A – Incremental and disruptive technologies |
Preparing for Technological Change in the Infrastructure Sector | 3821960-1147589789-62 | 31/05/2021 | 116
18. Civic technology
Technological Maturity Technology Timeline Key Barriers
Developing 2030-2040 Security, participation
Civic technology is a collection of technologies centred on improving the provision of public services and
democratic governance146. Civic technology relies on a series of other technologies for implementation
including blockchain, machine learning and natural language processing. Predicted applications of civic
technology involve greater community engagement and involvement in democratic decision making.
Example Application: SeeClickFix is an internet-based platform used throughout the United States that
seeks notice of maintenance requirements of public infrastructure from citizens themselves as a form of
distributed maintenance alert system147.
Technological Maturity: Civic technology is mature for some aspects such as community engagement, but
for other uses such as voting and affording greater transparency of government processes the technology is
less developed.
Technology Timeline: Civic technologies are likely to be further integrated into civic life throughout this
decade as better tools are developed.
Key Barriers: Security of the civic technology systems is a key barrier for further adoption of the technology
especially for highly sensitive applications such as voting. Participation in civic technologies can lead to
skewed representation that will need to be overcome for this technology to succeed.
Use Cases:
• Democratic engagement with elected officials – including voting
• Provide greater public data access and transparency
• Peer-to-peer sharing of personally owned goods
• Crowd funding for public infrastructure
• Place-based social networks
• Community organisation and demonstration
146 Saldivar, Jorge, Cristhian Parra, Marcelo Alcaraz, Rebeca Arteta, and Luca Cernuzzi. “Civic Technology for Social Innovation: A
Systematic Literature Review.” Computer Supported Cooperative Work: CSCW: An International Journal 28, no. 2 (May 23, 2018).
https://doi.org/10.1007/s10606-018-9311-7.
147 “Building Better Cities with Civic Technology.” Accessed February 19, 2021. https://datasmart.ash.harvard.edu/news/article/building-
better-cities-civic-technology.

| Appendix A – Incremental and disruptive technologies |
Preparing for Technological Change in the Infrastructure Sector | 3821960-1147589789-62 | 31/05/2021 | 117
19. Digital Consenting
Technological Maturity Technology Timeline Key Barriers
Emerging 2020-2030 Complementary technology, regulation
Digital consenting is an application of BIM and digital twins that has the potential to streamline the
consenting and approval process. Development of the built environment is subject to strict codes and
compliance checks at several stages of the process. Traditionally, consenting and approval of changes to
the built environment relies on human intervention to check compliance. Digital consenting removes the
human element by integrating the consenting and compliance checks into BIM and digital twin applications.
When a BIM model is added to a larger digital twin, a computer process will be run to check compliance with
the existing built environment and development regulations148.
Example Application: The City of Wanneroo in Western Australia has approved the trial use of the
automated consenting program uDrew. This online program allows those applying for a consent to draw
what is proposed and the program will cross check the proposal against the relevant codes and immediately
let the applicant know whether the proposal is feasible or not.149150
Technological Maturity: Digital consenting is an emerging technology which will likely have several steps
before full adoption.
Technology Timeline: Integrating digital consenting into the delivery of infrastructure projects is likely to
occur over the next decade as demand for streamlined and faster consenting processes increase.
Key Barriers: Development of complementary technologies such as digital twins and BIM could limit the
application of digital consenting. Regulation and acceptance of the risks of digital consenting might restrict or
delay its widespread use.
Use Cases:
• Faster consenting processes facilitating faster trial process of new things.
148 Dimyadi, Johannes, Geoff Thomas, and Robert Amor. “Enabling Automated Compliance Audit of Architectural Designs.” In Back to
the Future: The next 50 Years. Accessed February 22, 2021. https://www.researchgate.net/profile/Johannes-
Dimyadi/publication/320935659_Enabling_Automated_Compliance_Audit_of_Architectural_Designs/links/5a1dfe34a6fdccc6b7f86008/E
nabling-Automated-Compliance-Audit-of-Architectural-Designs.pdf.
149 City of Wanneroo. “New Building Approvals Program to Cut Red Tape.” City of Wanneroo, February 18, 2021.
https://www.wanneroo.wa.gov.au/news/article/1255/new_building_approvals_program_to_cut_red_tape.
150 uDrew. “About uDrew - Build, Plan and Approve Technology!” Accessed April 13, 2021. https://www.udrew.com.au/about/.

| Appendix A – Incremental and disruptive technologies |
Preparing for Technological Change in the Infrastructure Sector | 3821960-1147589789-62 | 31/05/2021 | 118
Materials, Energy & Construction
20. 3D Printing
Technological Maturity Technology Timeline Key Barriers
Emerging 2020-2030 Energy consumption, security, social, applicability
3D printing involves producing three-dimensional objects from computer designs151. Using a wide variety of
printing materials 3D printing can reduce manufacturing burdens by outsourcing and on-siting the production
of physical items.
Example Application: Deutsche Bahn – the German national railway company – uses 3D printing for the
production of new parts for the maintenance of its high-speed train rolling stock. For example, replacing an
armrest can now be achieved in the space of a week rather than the previous four months.
Technological Maturity: While 3D printing already has some sophisticated applications, production of entire
assets is still limited by the development level of the technology.
Technology Timeline: 3D printing is an incremental technology that will improve within the coming decade
for wider uses beyond its current typical application of small maintenance parts. In the future, larger
structures and components will be possible.
Key Barriers: 3D printing expends significant energy and could impact on national grids. The 3D printing
uses digital files as plans opening a risk of hacking which could alter designs leading to substandard or
dangerous implications. 3D printing might directly replace existing jobs and could face social barriers for
implementation. A final limitation is the materials currently available for 3D printing mean that it is not a
suitable method for producing all types of objects152.
Use Cases:
• Prototyping and manufacturing
• Bioprinting of implants
• Outsourcing the production of goods to the consumer
151 Global Infrastructure Hub. “InfraTech Stock Take of Use Cases.”
152 Global Infrastructure Hub. “InfraTech Stock Take of Use Cases.”

| Appendix A – Incremental and disruptive technologies |
Preparing for Technological Change in the Infrastructure Sector | 3821960-1147589789-62 | 31/05/2021 | 119
21. Nanotechnology
Technological Maturity Technology Timeline Key Barriers
Emerging 2020-2050 (depending on form on nanotechnology) Development
Nanotechnology are devices, sensors, and materials of an atomic or molecular size also known as
nanomaterials153. Unique properties of materials such as conductivity, reactivity and strength can be
harnessed at this scale that are not possible at a macro scale. The scale of nanotechnology opens up
opportunities for sensing and collecting data where it was physically not possible.
Example Application: Mineral exploration company Zenyatta is working to develop graphene-infused
concrete which is anticipated to have faster curing times, improved earthquake resistance and improved
mechanical performance. Zenyatta, a mineral exploration company, has partnered with concrete producer
Larisplast to develop graphene-infused concrete. As well as preventing premature failure, anticipated
benefits include faster curing times, improved mechanical performance with smaller volumes, and the ability
to withstand large forces, for example during earthquakes.
Technological Maturity: Current nanotechnology is limited to passive nanomaterials – ones that have fixed
properties. Further advances in nanotechnology involving active materials and nanosystems are limited to
scientific research154.
Technology Timeline: Nanotechnologies will continue to play an increasing role over the coming decades
as the technology improves.
Key Barriers: Technology development remains a key barrier to further implementation of nanotechnology
outside of scientific research.
Use Cases:
• New materials for construction
• Small sensors capable of fitting almost anywhere
• New energy storing capabilities
• New medical applications
22. Advanced batteries
Technological Maturity Technology Timeline Key Barriers
Emerging 2020-2050 Technology development
Batteries are a key enabler and limiter for the development of new technology. New battery technology
promises to increase the energy storage potential and performance, reduce production costs, and minimise
size and weight. In addition to incremental improvements to existing forms of battery technology such as
153 “What Is Nanotechnology and What Can It Do?,” March 5, 2005. https://www.azonano.com/article.aspx?ArticleID=1134.
154 Rahman, Tameem. “What Is Nanotechnology and What Is Its Future?” Predict, March 19, 2020. https://medium.com/predict/the-
future-of-nanotechnology-accddc9822fb.

| Appendix A – Incremental and disruptive technologies |
Preparing for Technological Change in the Infrastructure Sector | 3821960-1147589789-62 | 31/05/2021 | 120
lithium-ion batteries, new types of batteries such as foam batteries155 and sodium-ion batteries156 have the
potential to provide a step change in energy storage. Foam batteries charge and expend energy across a 3D
storage medium rather than in the linear manner of lithium-ion batteries increasing energy density and
electricity transmission speeds. Foam batteries are also considered less toxic. Sodium-ion batteries derive
their benefit in being cheaper to produce due to the abundance of sodium in the environment removing the
need for less accessible elements such as lithium, nickel and cobalt. Advanced batteries have the potential
to impact the infrastructure industry through the new devices that will be enabled for monitoring assets and
energy storage for transitioning to renewable energy production.
Example Application: Colorado State University-backed start-up Prieto Battery has developed a solid-state
3D foam copper battery capable greater power and energy densities than existing 2D functioning lithium ion
batteries.
Technological Maturity: Advanced battery maturity depends on the advanced battery technology in
question. Currently lithium ion batteries remain the ubiquitous type of battery on the market.
Technology Timeline: Due to the range of types of advanced battery types under development some are
closer to commercial application than others leaving a two-decade range for when they are likely to be
adopted more widespread.
Key Barriers: The main barrier to advances in battery technology is the technology itself. Lithium ion
batteries took 40 years to develop to the level they are currently at representing the technical challenges in
battery development157.
Use Cases:
• Transport solutions – flexibility of not needed constant charging
• Electricity network peak demand solution
• Distributed electricity generation and storage
Other potential technologies with significant unknown characteristics:
• Fusion Reactors – a proposed technology for power generation involving the energy released from the
fusion of atomic nuclei
• Holography – projection of 3D light images
• Living Robots – programmable organisms that are neither robot nor living being
• Smart Dust – microscopic electromechanical systems including robots, sensors or other devices
• 4D Printing – enhances upon 3D printing by developing objects that change over time
• Orbital Solar Power – a new form of solar power collection using satellites to collect solar energy and
transmit it to Earth.
155 Arup. “Emerging Technology Timeline.”
156 Stringer, David. “The Secret to a Greener, Longer-Lasting Battery Is Blue.” Bloomberg News, September 22, 2020.
https://www.bloomberg.com/news/articles/2020-09-22/sodium-ion-batteries-emerge-as-cheaper-alternative-to-lithium.
157 Conca, James. “Energy’s Future - Battery and Storage Technologies.” Forbes Magazine, August 26, 2019.
https://www.forbes.com/sites/jamesconca/2019/08/26/energys-future-battery-and-storage-technologies/?sh=56c408444cf1.

| Appendix A – Incremental and disruptive technologies |
Preparing for Technological Change in the Infrastructure Sector | 3821960-1147589789-62 | 31/05/2021 | 121
Summary of Global Scanning
The technologies we have identified are likely to have a pronounced impact on infrastructure within the
next 30 years. For each technology from our scan, the likely timing of the impact of that technology by
ten-year period is included using a heat-map style categorisation system. Each decade can be either
green, amber, or red referring to whether widespread adoption of the specific technology is likely,
possible, or improbable respectively by that decade.

| Appendix A – Incremental and disruptive technologies |
Preparing for Technological Change in the Infrastructure Sector | 3821960-1147589789-62 | 31/05/2021 | 122
Table 14: Summary of Global Scanning of Incremental and Disruptive Technologies
Technology Technology Innovation
Technology Timeline
Potential Application in Infrastructure Sector Phase(s)
Mā
tau
ran
ga
Pla
nn
ing
&
Des
ign
Co
ns
tru
cti
on
Op
era
tio
ns
Ma
inte
na
nce
1s
t D
eca
de
2n
d
Dec
ad
e
3rd
Dec
ad
e
Connectivity & Communication
5G / 6G / Li-Fi Incremental
Technology
Internet of Things – Sensors Disruptive
Technology
Analytics & Computation
Artificial Intelligence – Natural Language Processing Disruptive
Technology
Artificial intelligence – Machine Learning Disruptive
Technology
Artificial Intelligence – Computer vision Disruptive
Technology
Ambient Intelligence (hyper-personalisation) Incremental
Technology
Quantum Computing Disruptive
Technology
Generative Design Incremental
Technology
Cloud & Storage

| Appendix A – Incremental and disruptive technologies |
Preparing for Technological Change in the Infrastructure Sector | 3821960-1147589789-62 | 31/05/2021 | 123
Technology Technology Innovation
Technology Timeline
Potential Application in Infrastructure Sector Phase(s)
Mā
tau
ran
ga
Pla
nn
ing
&
Des
ign
Co
ns
tru
cti
on
Op
era
tio
ns
Ma
inte
na
nce
1s
t D
eca
de
2n
d
Dec
ad
e
3rd
Dec
ad
e
Cloud / Edge computing Incremental
Technology
Distributed ledger technology / Blockchain Disruptive
Technology
Devices & Automation
Building Management Systems (BMS) / Building Automation
Systems (BAS)
Incremental
Technology
Automation Incremental
Technology
Drones / Robotics (including autonomous technology) Incremental
Technology
Biometrics Incremental
Technology
Platforms, Interfaces & Systems
Augmented Reality / Virtual Reality Disruptive
Technology
Digital payments / Cryptocurrencies Disruptive
Technology
Digital twins / Integrated BIM / Predictive maintenance /
Automated ordering
Incremental
Technology
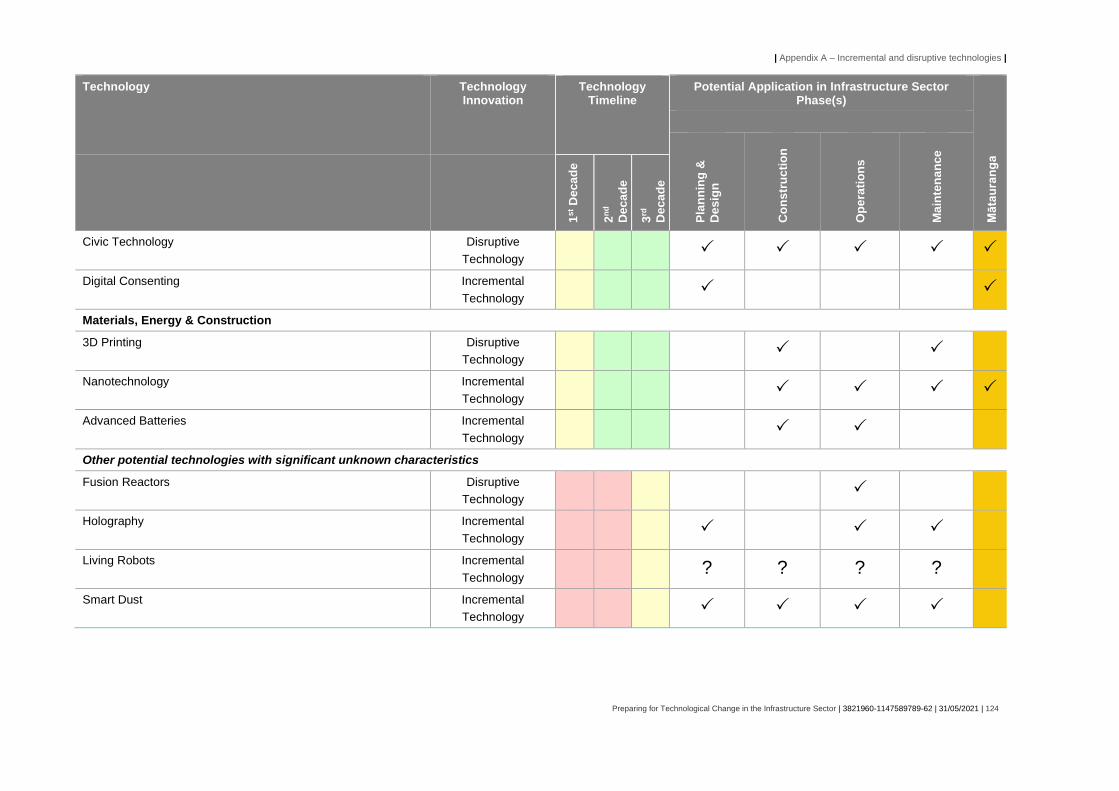
| Appendix A – Incremental and disruptive technologies |
Preparing for Technological Change in the Infrastructure Sector | 3821960-1147589789-62 | 31/05/2021 | 124
Technology Technology Innovation
Technology Timeline
Potential Application in Infrastructure Sector Phase(s)
Mā
tau
ran
ga
Pla
nn
ing
&
Des
ign
Co
ns
tru
cti
on
Op
era
tio
ns
Ma
inte
na
nce
1s
t D
eca
de
2n
d
Dec
ad
e
3rd
Dec
ad
e
Civic Technology Disruptive
Technology
Digital Consenting Incremental
Technology
Materials, Energy & Construction
3D Printing Disruptive
Technology
Nanotechnology Incremental
Technology
Advanced Batteries Incremental
Technology
Other potential technologies with significant unknown characteristics
Fusion Reactors Disruptive
Technology
Holography Incremental
Technology
Living Robots Incremental
Technology
? ? ? ?
Smart Dust Incremental
Technology

| Appendix A – Incremental and disruptive technologies |
Preparing for Technological Change in the Infrastructure Sector | 3821960-1147589789-62 | 31/05/2021 | 125
Technology Technology Innovation
Technology Timeline
Potential Application in Infrastructure Sector Phase(s)
Mā
tau
ran
ga
Pla
nn
ing
&
Des
ign
Co
ns
tru
cti
on
Op
era
tio
ns
Ma
inte
na
nce
1s
t D
eca
de
2n
d
Dec
ad
e
3rd
Dec
ad
e
4D Printing Disruptive
Technology
Orbital Solar Power Disruptive
Technology

| Appendix A – Incremental and disruptive technologies |
Preparing for Technological Change in the Infrastructure Sector | 3821960-1147589789-62 | 31/05/2021 | 126
Table 15 summarises the key implementation barriers for each of the technologies identified above.
Table 15: Technology Implementation Barriers
Technology & Implementation Barriers
Bu
sin
ess
Ca
se /
Co
st
Sta
nd
ard
isa
tio
n
Re
gu
lato
ry / L
eg
al
Se
cu
rity
5G / 6G / Li-Fi
Internet of Things Sensors (metering / charging / demand management)
Artificial Intelligence – Natural Language Processing
Artificial intelligence – Machine Learning
Artificial Intelligence – Computer vision
Ambient Intelligence (hyper-personalisation)
Quantum Computing
Generative Design
Cloud / Edge computing
Distributed ledger technology / Blockchain
Building Management Systems (BMS) / Building Automation Systems (BAS)
Automation
Drones / Robotics (including autonomous tech)
Biometrics
Augmented Reality / Virtual Reality
Digital Payments / Cryptocurrencies
Digital twins / Integrated BIM / Predictive Maintenance / Automated ordering
Civic Technology
Digital Consenting
3D Printing
Nanotechnology
Advanced Batteries
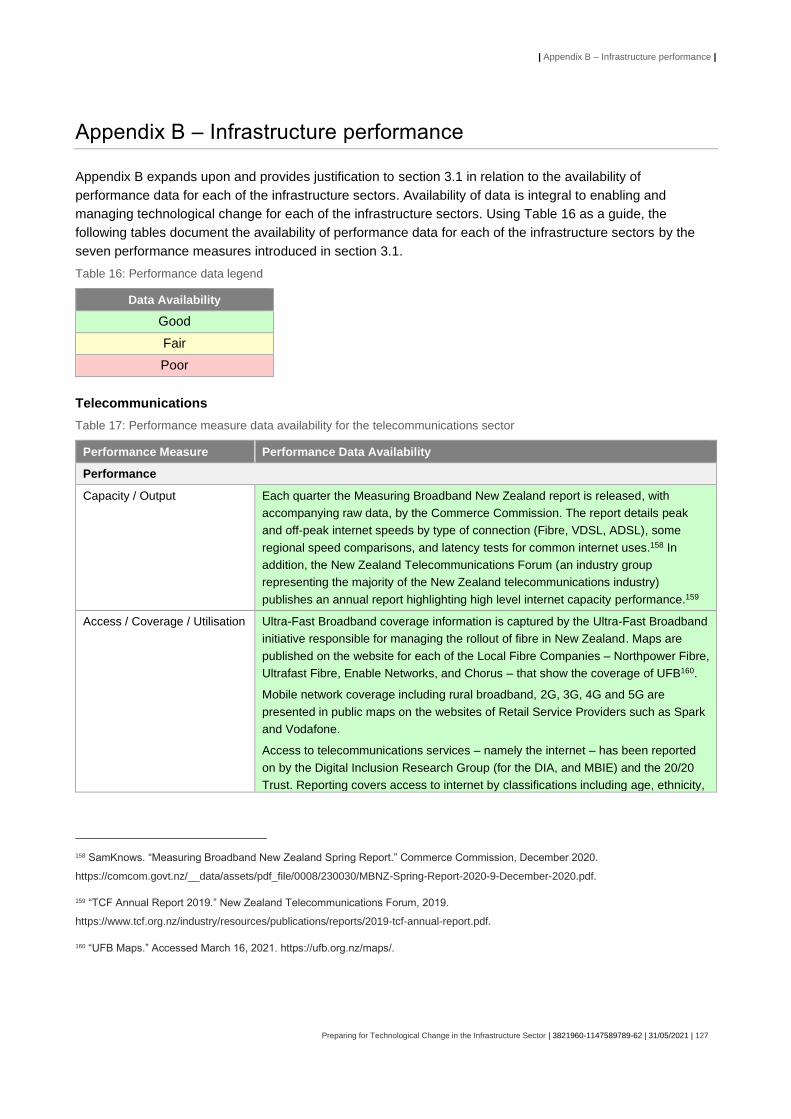
| Appendix B – Infrastructure performance |
Preparing for Technological Change in the Infrastructure Sector | 3821960-1147589789-62 | 31/05/2021 | 127
Appendix B – Infrastructure performance
Appendix B expands upon and provides justification to section 3.1 in relation to the availability of
performance data for each of the infrastructure sectors. Availability of data is integral to enabling and
managing technological change for each of the infrastructure sectors. Using Table 16 as a guide, the
following tables document the availability of performance data for each of the infrastructure sectors by the
seven performance measures introduced in section 3.1.
Table 16: Performance data legend
Data Availability
Good
Fair
Poor
Telecommunications
Table 17: Performance measure data availability for the telecommunications sector
Performance Measure Performance Data Availability
Performance
Capacity / Output Each quarter the Measuring Broadband New Zealand report is released, with
accompanying raw data, by the Commerce Commission. The report details peak
and off-peak internet speeds by type of connection (Fibre, VDSL, ADSL), some
regional speed comparisons, and latency tests for common internet uses.158 In
addition, the New Zealand Telecommunications Forum (an industry group
representing the majority of the New Zealand telecommunications industry)
publishes an annual report highlighting high level internet capacity performance.159
Access / Coverage / Utilisation Ultra-Fast Broadband coverage information is captured by the Ultra-Fast Broadband
initiative responsible for managing the rollout of fibre in New Zealand. Maps are
published on the website for each of the Local Fibre Companies – Northpower Fibre,
Ultrafast Fibre, Enable Networks, and Chorus – that show the coverage of UFB160.
Mobile network coverage including rural broadband, 2G, 3G, 4G and 5G are
presented in public maps on the websites of Retail Service Providers such as Spark
and Vodafone.
Access to telecommunications services – namely the internet – has been reported
on by the Digital Inclusion Research Group (for the DIA, and MBIE) and the 20/20
Trust. Reporting covers access to internet by classifications including age, ethnicity,
158 SamKnows. “Measuring Broadband New Zealand Spring Report.” Commerce Commission, December 2020.
https://comcom.govt.nz/__data/assets/pdf_file/0008/230030/MBNZ-Spring-Report-2020-9-December-2020.pdf.
159 “TCF Annual Report 2019.” New Zealand Telecommunications Forum, 2019.
https://www.tcf.org.nz/industry/resources/publications/reports/2019-tcf-annual-report.pdf.
160 “UFB Maps.” Accessed March 16, 2021. https://ufb.org.nz/maps/.

| Appendix B – Infrastructure performance |
Preparing for Technological Change in the Infrastructure Sector | 3821960-1147589789-62 | 31/05/2021 | 128
location, income, and gender. These reports are not periodical however, which
reduces the quality of access to internet tracking161.
Productivity / Efficiency Public information on the productivity and performance of telecommunications
services are limited due to the private and competitive nature of the industry. Some
insight into the productivity of individual companies is possible from annual business
reports.
Resilience
Service Quality / Affordability /
Reliability
The Commerce Commission also benchmarks the prices paid for fixed line
broadband against Australia and the OECD on an annual basis, noting that it is
difficult to precisely benchmark across countries given discrepancies in plans and
international data protocols162.
New Zealand compares well with other OECD countries for the quality of internet
services162.
Safety / Security / Resilience Information on the resilience of telecommunications infrastructure in New Zealand is
being worked on by MBIE and telecommunication services providers. The New
Zealand Lifelines Council conducted a stock take of the key resilience issues
underpinning telecommunications infrastructure in its National Infrastructure
Vulnerability Assessment 2020 report163.
Security and safety of telecommunication services is monitored by the Government
Communications Security Bureau – however limited information is made public
aside from an annual report164. Cyber security is also a growing challenge, and the
risks this poses will become even greater with technology changes.
Sustainability
Sustainability / Environmental
Impact
Some public information about sustainability initiatives in the sector are presented
by the New Zealand Telecommunications Forum, but no detailed environmental
impact data is publicly available.
Asset Condition / Compliance Limited public information is available on the condition of telecommunications
infrastructure including fibre internet, copper cable networks, and mobile
telecommunication assets. Given the recency of the rollout, fibre assets are
expected to be in good condition.
161 DIA, and MBIE. “Digital New Zealanders: The Pulse of Our Nation,” May 2017. https://www.mbie.govt.nz/dmsdocument/3228-digital-
new-zealanders-the-pulse-of-our-nation-pdf.
162 SamKnows. “Measuring Broadband New Zealand Spring Report.”
163 New Zealand Lifelines Council. “New Zealand Critical Lifelines Infrastructure - National Vulnerability Assessment.” Civil Defence,
2020. https://www.civildefence.govt.nz/assets/Uploads/lifelines/nzlc-nva-2020-full-report.pdf.
164 Government Communications Security Bureau. “Government Communications Security Bureau Te Tira Tiaki.” Government
Communications Security Bureau, June 30, 2019. https://www.gcsb.govt.nz/assets/GCSB-Annual-Reports/GCSB-Annual-Report-
2019.pdf.

| Appendix B – Infrastructure performance |
Preparing for Technological Change in the Infrastructure Sector | 3821960-1147589789-62 | 31/05/2021 | 129
Energy
Table 18: Performance measure data availability for the energy sector
Performance Measure Performance Data Availability
Performance
Capacity / Output MBIE publishes the annual Energy in New Zealand report and accompanying data
which details the capacity and output of the energy sector in New Zealand by energy
type165.
For the electrical grid, supply into the grid must always equal demand. Very small
deviations in output are manageable, but continued deviation affects end consumers
and businesses greatly. Therefore, electricity has multiple layers of critical protection
equipment.
Access / Coverage / Utilisation The Energy Efficiency & Conservation Authority (EECA) monitors the consumption
of energy in New Zealand by fuel type, sector, energy use and technology using
information from MBIE, Stats NZ, and the Residential Baseline Study 2015.166
Productivity / Efficiency EECA captures usage of energy by type and monitors energy losses from
production processes – but detailed monitoring of energy efficiency at a household
or business level is not reported on.
Resilience
Service Quality / Affordability /
Reliability
The Security and Reliability Council, under the Electricity Authority, is a special-
purpose advisory group with a mandate to identify risks affecting the sector and
make recommendations to the Electricity Authority including in relation to reliability
of supply.
MBIE conducted the Electricity Price Review in 2018/19 which provided a snapshot
of electricity affordability in New Zealand – this review was a once-off review167.
MBIE tracks the annual and quarterly average prices for petrol, diesel, fuel oil,
natural gas, and electricity168.
Limited public information on energy infrastructure quality is available.
Safety / Security / Resilience Limited ongoing reporting by sector participants is present on security and
resilience. In 2014 the National Infrastructure Unit under The Treasury reported on
the resilience of energy infrastructure in New Zealand169.
165 “Energy in New Zealand 2020.” Ministry of Business, Innovation & Employment, August 2020.
https://www.mbie.govt.nz/dmsdocument/11679-energy-in-new-zealand-2020.
166 EECA. “Energy End Use Database.” Accessed March 16, 2021. https://tools.eeca.govt.nz/energy-end-use-database/.
167 “Electricity Price Review: Final Report.” Ministry of Business, Innovation and Employment, May 21, 2019.
https://www.mbie.govt.nz/assets/electricity-price-review-final-report.pdf.
168 Ministry of Business, Innovation & Employment. “Energy Prices,” March 11, 2021. https://www.mbie.govt.nz/building-and-
energy/energy-and-natural-resources/energy-statistics-and-modelling/energy-statistics/energy-prices/.
169 National Infrastructure Unit, New Zealand Treasury. “Evidence Base: Resilience,” 2014.
https://www.treasury.govt.nz/sites/default/files/2017-12/nip-evidence-resilience.pdf.

| Appendix B – Infrastructure performance |
Preparing for Technological Change in the Infrastructure Sector | 3821960-1147589789-62 | 31/05/2021 | 130
In line with the International Energy Agency, New Zealand is required to hold 90
days’ worth of oil in storage for resilience169.
The Gas Industry Company (GIC) is a co-regulatory body that is responsible for
improving the operation of gas markets, access to infrastructure, and consumer
outcomes. The 2016 Transmission Security and Reliability Issues Paper provides a
snapshot of the various regulatory and non-regulatory drivers of resilience in the
sector170.
Worksafe and ACC both record information about workplace incidents that include
categorisation by industry. Public data provided by Worksafe shows incidents,
investigations, assessments and enforcement activities for the electricity and gas
sectors by region and incident type171.
The New Zealand Lifelines Council conducted a stock take of the key resilience
issues underpinning energy infrastructure in its National Infrastructure Vulnerability
Assessment 2020 report172.
Sustainability
Sustainability / Environmental
Impact
EECA captures usage of energy by type and monitors to understand our energy,
emissions, and climate change impacts173.
Transpower, along with managing increased electrification in New Zealand,
published in 2020 and 2021 respectively the reports Empowering our Energy Future
and A Roadmap for Electrification that identify the required energy transitions to
meet global climate agreements174.
Interim Climate Change Committee is tasked with providing independent evidence
and analysis related to transitioning electricity production in New Zealand to 100%
renewable.
Asset Condition / Compliance There is limited publicly available information on the condition of generation assets.
There is little publicly available information on other assets in the sector, particularly
oil and gas extraction, and other fuel infrastructure.
*Access and quality not as effective to assess overall performance of the Energy sector. Given the generally
consistent quality of electricity, other sources of energy (high-octane petroleum, diesel, hydrogen) the
question of quality is not as pressing as for an example, an internet connected that may vary significantly in
speed and latency. Similarly, access is a less pressing issue for energy in New Zealand given our level of
development and the period over which this has occurred.
170 “Security and Reliability Issues Paper.” Gas Industry Company, April 2016. https://www.gasindustry.co.nz/work-programmes/pipeline-
security-and-reliability/background/gas-transmission-security-and-reliablity-issues-paper/document/5345.
171 Worksafe. “Incidents” March 9, 2021.
https://data.worksafe.govt.nz/graph/detail/incidents?industry=Electricity%2C+Gas%2C+Water+and+Waste+Services&startDate=2020-
03&endDate=2021-02&sub_industry=Electricity+Supply.
172 New Zealand Lifelines Council. “New Zealand Critical Lifelines Infrastructure - National Vulnerability Assessment.”
173 EECA. “Energy End Use Database.” Accessed March 16, 2021. https://tools.eeca.govt.nz/energy-end-use-database/.
174 “Electrification Roadmap.” Accessed March 16, 2021. https://www.transpower.co.nz/about-us/transmission-tomorrow/electrification-
roadmap.
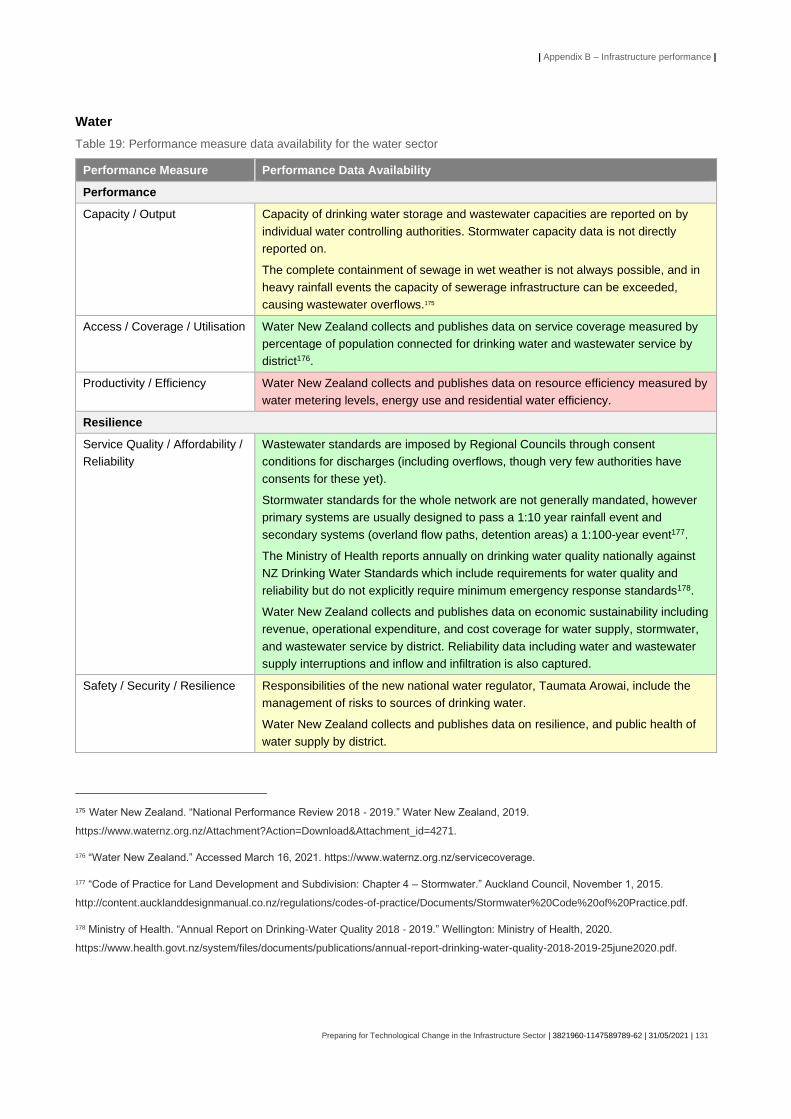
| Appendix B – Infrastructure performance |
Preparing for Technological Change in the Infrastructure Sector | 3821960-1147589789-62 | 31/05/2021 | 131
Water
Table 19: Performance measure data availability for the water sector
Performance Measure Performance Data Availability
Performance
Capacity / Output Capacity of drinking water storage and wastewater capacities are reported on by
individual water controlling authorities. Stormwater capacity data is not directly
reported on.
The complete containment of sewage in wet weather is not always possible, and in
heavy rainfall events the capacity of sewerage infrastructure can be exceeded,
causing wastewater overflows.175
Access / Coverage / Utilisation Water New Zealand collects and publishes data on service coverage measured by
percentage of population connected for drinking water and wastewater service by
district176.
Productivity / Efficiency Water New Zealand collects and publishes data on resource efficiency measured by
water metering levels, energy use and residential water efficiency.
Resilience
Service Quality / Affordability /
Reliability
Wastewater standards are imposed by Regional Councils through consent
conditions for discharges (including overflows, though very few authorities have
consents for these yet).
Stormwater standards for the whole network are not generally mandated, however
primary systems are usually designed to pass a 1:10 year rainfall event and
secondary systems (overland flow paths, detention areas) a 1:100-year event177.
The Ministry of Health reports annually on drinking water quality nationally against
NZ Drinking Water Standards which include requirements for water quality and
reliability but do not explicitly require minimum emergency response standards178.
Water New Zealand collects and publishes data on economic sustainability including
revenue, operational expenditure, and cost coverage for water supply, stormwater,
and wastewater service by district. Reliability data including water and wastewater
supply interruptions and inflow and infiltration is also captured.
Safety / Security / Resilience Responsibilities of the new national water regulator, Taumata Arowai, include the
management of risks to sources of drinking water.
Water New Zealand collects and publishes data on resilience, and public health of
water supply by district.
175 Water New Zealand. “National Performance Review 2018 - 2019.” Water New Zealand, 2019.
https://www.waternz.org.nz/Attachment?Action=Download&Attachment_id=4271.
176 “Water New Zealand.” Accessed March 16, 2021. https://www.waternz.org.nz/servicecoverage.
177 “Code of Practice for Land Development and Subdivision: Chapter 4 – Stormwater.” Auckland Council, November 1, 2015.
http://content.aucklanddesignmanual.co.nz/regulations/codes-of-practice/Documents/Stormwater%20Code%20of%20Practice.pdf.
178 Ministry of Health. “Annual Report on Drinking-Water Quality 2018 - 2019.” Wellington: Ministry of Health, 2020.
https://www.health.govt.nz/system/files/documents/publications/annual-report-drinking-water-quality-2018-2019-25june2020.pdf.
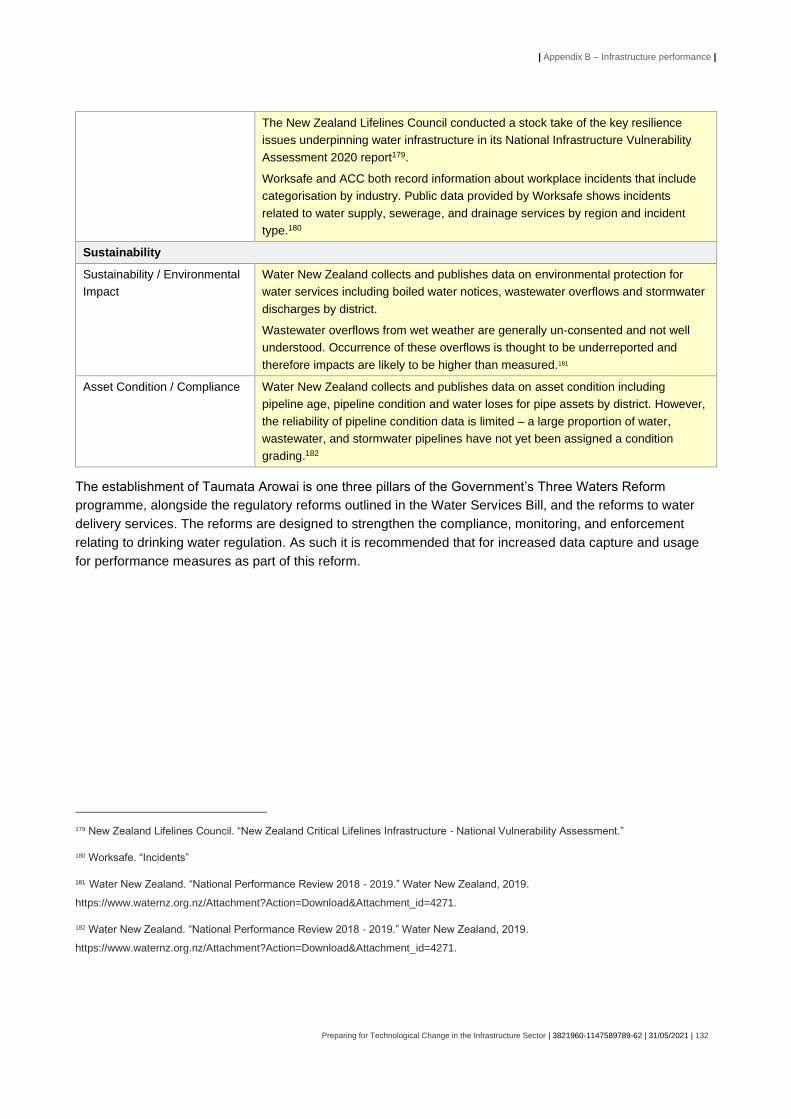
| Appendix B – Infrastructure performance |
Preparing for Technological Change in the Infrastructure Sector | 3821960-1147589789-62 | 31/05/2021 | 132
The New Zealand Lifelines Council conducted a stock take of the key resilience
issues underpinning water infrastructure in its National Infrastructure Vulnerability
Assessment 2020 report179.
Worksafe and ACC both record information about workplace incidents that include
categorisation by industry. Public data provided by Worksafe shows incidents
related to water supply, sewerage, and drainage services by region and incident
type.180
Sustainability
Sustainability / Environmental
Impact
Water New Zealand collects and publishes data on environmental protection for
water services including boiled water notices, wastewater overflows and stormwater
discharges by district.
Wastewater overflows from wet weather are generally un-consented and not well
understood. Occurrence of these overflows is thought to be underreported and
therefore impacts are likely to be higher than measured.181
Asset Condition / Compliance Water New Zealand collects and publishes data on asset condition including
pipeline age, pipeline condition and water loses for pipe assets by district. However,
the reliability of pipeline condition data is limited – a large proportion of water,
wastewater, and stormwater pipelines have not yet been assigned a condition
grading.182
The establishment of Taumata Arowai is one three pillars of the Government’s Three Waters Reform
programme, alongside the regulatory reforms outlined in the Water Services Bill, and the reforms to water
delivery services. The reforms are designed to strengthen the compliance, monitoring, and enforcement
relating to drinking water regulation. As such it is recommended that for increased data capture and usage
for performance measures as part of this reform.
179 New Zealand Lifelines Council. “New Zealand Critical Lifelines Infrastructure - National Vulnerability Assessment.”
180 Worksafe. “Incidents”
181 Water New Zealand. “National Performance Review 2018 - 2019.” Water New Zealand, 2019.
https://www.waternz.org.nz/Attachment?Action=Download&Attachment_id=4271.
182 Water New Zealand. “National Performance Review 2018 - 2019.” Water New Zealand, 2019.
https://www.waternz.org.nz/Attachment?Action=Download&Attachment_id=4271.

| Appendix B – Infrastructure performance |
Preparing for Technological Change in the Infrastructure Sector | 3821960-1147589789-62 | 31/05/2021 | 133
Resource Recovery and Waste
Table 20: Performance measure data availability for the resource recovery and waste sector
Performance Measure Performance Data Availability
Performance
Capacity / Output The New Zealand Waste Data Framework includes measures of quantity of waste to
landfills, including and excluding special wastes – these are yet to be
implemented.183
Access / Coverage / Utilisation Public data on the coverage and utilisation of waste management infrastructure and
services is available through territorial authorities when an assessment has been
conducted – however, public reporting is variable between territories.
Collection of data related to resource recovery and waste management is limited in
New Zealand and often is commercially sensitive and collected by individual
organisations with no central database. Territorial authorities gather some
performance information to meet statutory responsibilities. The New Zealand Waste
Data Framework was developed in 2015 but as yet has not been fully integrated
within the sector.
Productivity / Efficiency Territorial authorities have published data compiled from private waste operators
within their territories which provides snapshots of resource recovery and waste
outcomes – however, there is no standardisation of reporting.184
The New Zealand Waste Data Framework includes measures of waste disposal
rate, recycling recovery rates, and recycling contamination rate – these are yet to be
implemented.185
Resilience
Service Quality / Affordability /
Reliability
The New Zealand Waste Data Framework includes measures of waste disposal
rate, recycling recovery rates, and recycling contamination rate – these are yet to be
implemented.186
New Zealand uses a landfill levy to provide a Waste Minimisation Fund that
sponsors projects that minimise the impact of waste.187
Safety / Security / Resilience Parts of the New Zealand recycling market has heavily relied on exporting materials
to international markets. With a reduced export market, the lack of resilience in our
waste management system was highlighted.187
183 “National Waste Data Framework - Standard Reporting Indicators for Territorial Authorities.” WasteMINZ, 2015.
http://www.wasteminz.org.nz/wp-content/uploads/2018/04/National-Waste-Data-Framework-Standard-Reporting-Indicators-Final.pdf.
184 Murray, Sandra. “Hamilton City Council: Waste Assessment.” Hamilton City Council, August 2017.
https://www.fightthelandfill.co.nz/assets/Files/2017-HCC-Waste-Assessment.pdf.
185 “National Waste Data Framework - Standard Reporting Indicators for Territorial Authorities.” WasteMINZ.
186 “National Waste Data Framework - Standard Reporting Indicators for Territorial Authorities.” WasteMINZ.
187 Seadon, Jeff. “New Zealand Invests in Growing Its Domestic Recycling Industry to Create Jobs and Dump Less Rubbish at Landfills.”
The Conversation, September 16, 2020. http://theconversation.com/new-zealand-invests-in-growing-its-domestic-recycling-industry-to-
create-jobs-and-dump-less-rubbish-at-landfills-143684.

| Appendix B – Infrastructure performance |
Preparing for Technological Change in the Infrastructure Sector | 3821960-1147589789-62 | 31/05/2021 | 134
Worksafe and ACC both record information about workplace incidents that include
categorisation by industry. Public data provided by Worksafe shows incidents
related to waste collection, treatment and disposal services by region and incident
type.188
Isolated data is collected for landfills that are vulnerable to sea level rise amongst
other reporting by the Ministry for the Environment on climate change adaptation.
Sustainability
Sustainability / Environmental
Impact
New Zealand does not currently centrally and publicly report total resource recovery
rates for municipal, commercial, industrial, construction, and demolition waste.
Environmental impacts of landfills such as uncontained leachate, odours and wind-
blown rubbish are not reported on by standard.
Asset Condition / Compliance Waste disposal facilities must register with the Ministry for the Environment under
the Waste Minimisation Act 2008 – this Act also requires territorial authorities to
adopt waste management and minimisation plans that provide objectives for
effective and efficiency waste management and minimisation within the district.
Broadly, the waste and resource recovery sector lags other sectors in using data to evaluate its
performance. As outlined in the Te Waihanga State of Play for Resource Recovery and Waste, the lack of
consistent, high-quality data at a national level presents a barrier to investment decision making. While
territorial authorities may have good information available locally, there are no nationally agreed data
standards or reporting mechanisms, which means New Zealand lacks information to support a fulsome
national snapshot for policy, planning or performance measurement purposes. To address this, it is
recommended that the sector performance data be centralised, and metadata standards established.
Transport
Table 21: Performance measure data availability for the transport sector
Performance Measure Performance Data Availability
Performance
Capacity / Output The Ministry of Transport collects and publishes high-level data on the output of the
domestic transport infrastructure sector including household travel, road freight
tonne-km, rail freight tonne-km, domestic and international air arrivals, and coastal
shipping tonne-km.189
Access / Coverage / Utilisation Waka Kotahi, the New Zealand Transport Agency, collects and publishes data on
vehicle traffic numbers across the country. Access and coverage data are presented
in the Ministry of Transport data repository; however, data is limited in detail.
Productivity / Efficiency Information on the productivity of water and air-based transportation infrastructure is
more commercially sensitive due to the nature of these industries.
Resilience
188 Worksafe. “Incidents”
189 Ministry of Transport. “Statistics and Insights.” Ministry of Transport. Accessed March 17, 2021.
https://www.transport.govt.nz/statistics-and-insights/SearchForm.

| Appendix B – Infrastructure performance |
Preparing for Technological Change in the Infrastructure Sector | 3821960-1147589789-62 | 31/05/2021 | 135
Service Quality / Affordability /
Reliability
A mixture of private and public organisations monitors reliability and service quality
to different extents depending on the particular transport. Private logistics
companies will monitor travel reliability, but data is not publicly available.
Affordability of transport in New Zealand is intermittently measured by the Ministry of
Transport.
Safety / Security / Resilience Worksafe and ACC both record information about workplace incidents that include
categorisation by industry. Public data provided by Worksafe shows incidents
related to transport, postal and warehousing services by region and incident type.190
Sustainability
Sustainability / Environmental
Impact
The Ministry for the Environment monitors the emissions of transport in New
Zealand.
Asset Condition / Compliance Waka Kotahi manages and maintains the road assessment and maintenance
management (RAMM) database as a repository of asset condition of the New
Zealand state highway network and local roads – this database is not accessible to
the public.
Data on rail infrastructure in New Zealand is maintained by Kiwirail, however, this is
not publicly available.
Information about asset condition for water and air travel is of a commercially
sensitive nature and insight is only available through annual reports from the various
companies operating in these sub sectors.
Education, Skills and Research
Table 22: Performance measure data availability for the education, skills and research sector
Performance Measure Performance Data Availability
Performance
Capacity / Output Data on the number of schools and capacity is readily available and reliable from the
Ministry of Education through the Education Counts website.191
An estimated 100,000 additional places in schools are needed in high-growth areas
by 2030. Distance learning has been emphasised by Covid-19 forcing students to
learn remotely, it is unclear whether this trend may continue therefore challenging
the need for additional education infrastructure.192
Access / Coverage / Utilisation Data on access to education by demographic and regional metrics, coverage of
education facilities (especially in relation to school zones), and utilisation of
190 Worksafe. “Incidents”
191 Education Counts. “Ministry of Education - Education Counts.” Education Counts. Ministry of Education, September 9, 2020.
http://educationcounts.govt.nz.
192 “Te Rautaki Rawa Kura 2030 NZ School Property Strategy 2030.” Ministry of Education, June 2020.
https://www.education.govt.nz/assets/Documents/Ministry/Strategies-and-policies/MOE-Te-Rautaki-Rawa-Kura-The-School-Property-
Strategy-2030.pdf.

| Appendix B – Infrastructure performance |
Preparing for Technological Change in the Infrastructure Sector | 3821960-1147589789-62 | 31/05/2021 | 136
education facilities is readily available and reliable from the Ministry of Education
through the Education Counts website.
Shifting populations – resulting in areas of population decline and increase – can
result in education facilities having surplus and deficit property. There is growth in
learning support needs and demand for Māori medium education. Parental choice
and competition between schools can result in inefficiencies.193
Productivity / Efficiency The Productivity Commission, through Statistics New Zealand data, monitor the
industry productivity of education and training on measures including labour and
capital productivity, labour hours paid, and capital-to-labour ratio. Over 2019
employment in the education industry expanded by 1.5% and the sector is estimated
to have experienced weak productivity growth of -1.4%.194
Data available from the Ministry of Education through the Education Counts website
provides some insight into the productivity and efficiency of the education, skills and
research sector in New Zealand.195
Resilience
Service Quality / Affordability /
Reliability
Data available from the Ministry of Education through the Education Counts website
tracks the financial performance of tertiary institutions, and funding to schools
including for capital and operational expenditure on property.
Fiscal constraints and construction industry capacity are limiting the range and
quality of education infrastructure provision and hence the ability to deliver a service
with high quality and high reliability.196
Safety / Security / Resilience The education sector is at a higher risk of cyberattack primarily due to the
distribution the networks, using different data storage methods for different
providers. CERT NZ and Netsafe collect reports of safety and security incidents
related to internet use and schools – however the data is aggregated, and reliability
is limited due to the self-reporting nature of the services.197
Worksafe and ACC both record information about workplace incidents that include
categorisation by industry. Public data provided by Worksafe shows incidents
related to the education and training industry by region and incident type.198
Sustainability
193 “Te Rautaki Rawa Kura 2030 NZ School Property Strategy 2030.” Ministry of Education.
194 Nolan, Patrick, Reece Pomeroy, and Guanyu Zheng. “Productivity-by-the-Numbers-2019.pdf.” New Zealand Productivity
Commission, 2019. https://www.productivity.govt.nz/assets/Documents/productivity-by-the-numbers-2019/42ead8d24d/Productivity-by-
the-Numbers-2019.pdf.
195 Education Counts. “Ministry of Education - Education Counts.”
196 “Te Rautaki Rawa Kura 2030 NZ School Property Strategy 2030.” Ministry of Education.
197 Ministry of Education. “Protect Your School from Cyber-Attacks and Cyber Security Breaches.” Ministry of Education, March 11,
2021. https://www.education.govt.nz/school/digital-technology/protect-your-school-from-cyber-attacks-and-cyber-security-breaches/.
198 Worksafe. “Incidents”
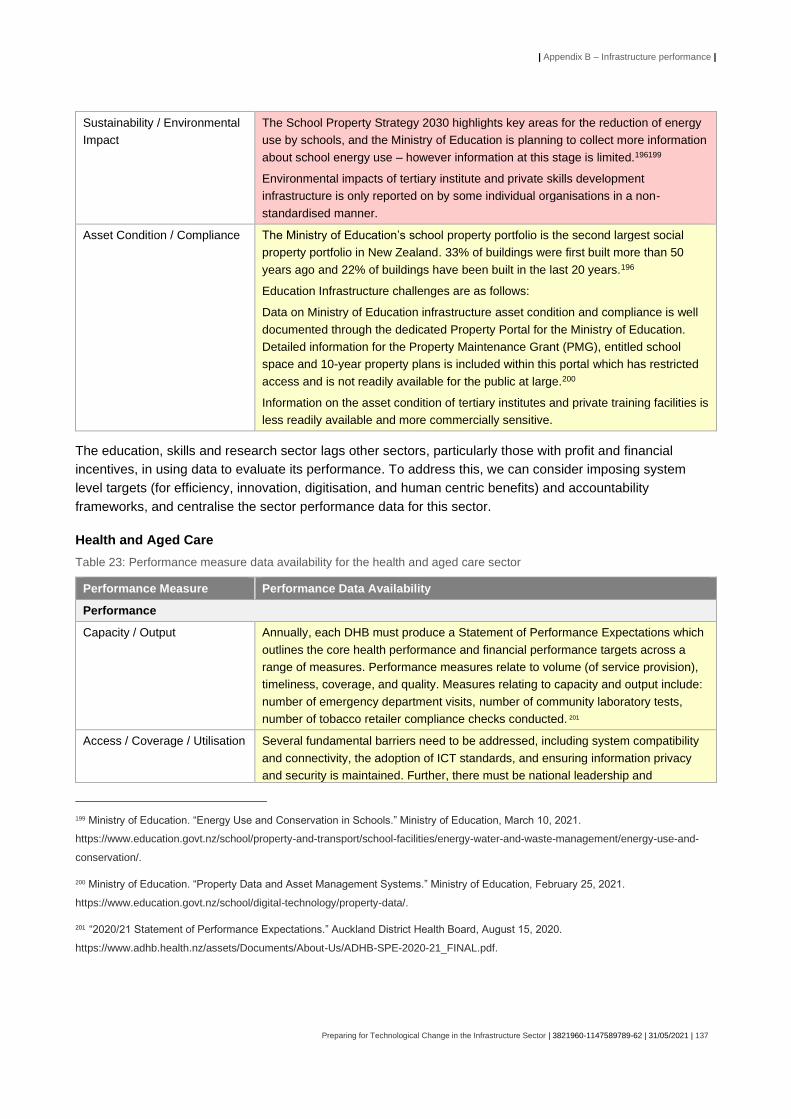
| Appendix B – Infrastructure performance |
Preparing for Technological Change in the Infrastructure Sector | 3821960-1147589789-62 | 31/05/2021 | 137
Sustainability / Environmental
Impact
The School Property Strategy 2030 highlights key areas for the reduction of energy
use by schools, and the Ministry of Education is planning to collect more information
about school energy use – however information at this stage is limited.196199
Environmental impacts of tertiary institute and private skills development
infrastructure is only reported on by some individual organisations in a non-
standardised manner.
Asset Condition / Compliance The Ministry of Education’s school property portfolio is the second largest social
property portfolio in New Zealand. 33% of buildings were first built more than 50
years ago and 22% of buildings have been built in the last 20 years.196
Education Infrastructure challenges are as follows:
Data on Ministry of Education infrastructure asset condition and compliance is well
documented through the dedicated Property Portal for the Ministry of Education.
Detailed information for the Property Maintenance Grant (PMG), entitled school
space and 10-year property plans is included within this portal which has restricted
access and is not readily available for the public at large.200
Information on the asset condition of tertiary institutes and private training facilities is
less readily available and more commercially sensitive.
The education, skills and research sector lags other sectors, particularly those with profit and financial
incentives, in using data to evaluate its performance. To address this, we can consider imposing system
level targets (for efficiency, innovation, digitisation, and human centric benefits) and accountability
frameworks, and centralise the sector performance data for this sector.
Health and Aged Care
Table 23: Performance measure data availability for the health and aged care sector
Performance Measure Performance Data Availability
Performance
Capacity / Output Annually, each DHB must produce a Statement of Performance Expectations which
outlines the core health performance and financial performance targets across a
range of measures. Performance measures relate to volume (of service provision),
timeliness, coverage, and quality. Measures relating to capacity and output include:
number of emergency department visits, number of community laboratory tests,
number of tobacco retailer compliance checks conducted. 201
Access / Coverage / Utilisation Several fundamental barriers need to be addressed, including system compatibility
and connectivity, the adoption of ICT standards, and ensuring information privacy
and security is maintained. Further, there must be national leadership and
199 Ministry of Education. “Energy Use and Conservation in Schools.” Ministry of Education, March 10, 2021.
https://www.education.govt.nz/school/property-and-transport/school-facilities/energy-water-and-waste-management/energy-use-and-
conservation/.
200 Ministry of Education. “Property Data and Asset Management Systems.” Ministry of Education, February 25, 2021.
https://www.education.govt.nz/school/digital-technology/property-data/.
201 “2020/21 Statement of Performance Expectations.” Auckland District Health Board, August 15, 2020.
https://www.adhb.health.nz/assets/Documents/About-Us/ADHB-SPE-2020-21_FINAL.pdf.

| Appendix B – Infrastructure performance |
Preparing for Technological Change in the Infrastructure Sector | 3821960-1147589789-62 | 31/05/2021 | 138
appropriate funding and resourcing for health ICT. There is also a need for
information technology vendors, and system and software planners and purchasers
to recognise the need for compatibility and connectivity of systems.
The Ministry of Health’s Health Information Standards Organisation (HISO)
oversees the selection, development and adoption of all standards for
interoperability in health care. However, adoption by the health sector has been slow
and inconsistent.
Clinical data comes from each core departmental system and there is limited
interoperability for sharing among applications, to support work with patients and
use the data for analytics.
Measures in the Auckland DHB Statement of Performance Expectations related to
access, coverage and utilisation include percentage of children dental-decay free at
five years of age (by target ethnicity groups), percentage of population (by age) who
access Mental Health services and the percentage of women aged 50-69 years
having a breast cancer screen in the last 2 years.202
Productivity / Efficiency According to the Health and Disability System Review, 2020 productivity and
efficiency of the health sector is hampered by a slowness to adopt digital standards
and coded forms of data has related to203:
• health professionals’ preference for text and reluctance to use coded forms
of data in their clinical work
• incomplete and poorly configured implementations of patient administration
systems and a lack of standardised approaches to data across multiple
data repositories
• lack of attention to strategies for enterprise reporting and analytics, other
than the disease and procedures codes that are grouped for funding
purposes at discharge from hospital
• poor understanding of national and global standards as key enablers for
quality, efficiency, information sharing and analytics.
Resilience
Service Quality / Affordability /
Reliability
According to the National Asset Management Programme problems with DHB
management of data security related both to the complexity of legacy systems and
to financial constraints.204 Issues include:
• lack of data security policies and staff training
• multiple applications with inconsistent functionality around user profiles and
tracking of data views and updates
202 “2020/21 Statement of Performance Expectations.” Auckland District Health Board, August 15, 2020.
https://www.adhb.health.nz/assets/Documents/About-Us/ADHB-SPE-2020-21_FINAL.pdf.
203 “Health and Disability System Review: Final Report / Pūrongo Whakamutunga.” Health and Disability System Review, March 2020.
https://systemreview.health.govt.nz/assets/Uploads/hdsr/health-disability-system-review-final-report.pdf.
204 “The National Asset Management Programme for District Health Boards.” Wellington: Ministry of Health, June 2020.
https://www.health.govt.nz/system/files/documents/publications/national-asset-management-programme-district-health-boards-report-
current-state-assessment9june2020.pdf.

| Appendix B – Infrastructure performance |
Preparing for Technological Change in the Infrastructure Sector | 3821960-1147589789-62 | 31/05/2021 | 139
• large numbers of users who work across different health organisations
require access to several applications – these users can repeatedly join
and leave each organisation as they move through cycles of training,
without being removed from systems
• lack of IT system configuration and tools to detect security attacks
• lack of skilled IT staff to focus on security.
Measures in the Auckland DHB Statement of Performance Expectations related to
quality and reliability include: percentage of ED patients discharged, admitted or
transferred within six hours of arrival, percentage of patients waiting longer than four
months for their first specialist assessment, and percentage of older patients
assessed for the risk of falling.205
Safety / Security / Resilience The Ministry of Health’s Information Standards Organisation (HISO) the purpose of
the organisation and standard is to provide a secure means of capturing, storing,
and transmitting health information.206
Sustainability
Sustainability / Environmental
Impact
In 2019, the Ministry of Health released a guide for improving sustainable practices
in the health sector which highlights that the health sector (excluding direct transport
emissions) is the public sector with the highest emissions profile. Currently, there is
no mandate for DHBs to measure their carbon emissions, however, some have
aligned with international standard to set targets and measure progress, such as
Northland DHB207
Asset Condition / Compliance The Ministry of Health released the National Asset Management Programme
(NAMP) Report 1: Current-state assessment in June 2020. This report provides a
benchmark for DHB assets by collating asset information – including the condition,
functionality and consolidation – into a national asset register. In doing so, the report
has laid the groundwork for consistent national DHB asset management and will
provide input into a future asset plan.208
205 “2020/21 Statement of Performance Expectations.” Auckland District Health Board, August 15, 2020.
https://www.adhb.health.nz/assets/Documents/About-Us/ADHB-SPE-2020-21_FINAL.pdf.
206 Account, Superuser. “Health Information Standards Organisation - HISO 10029 Health Information Security Framework.” New
Zealand Nurses Organisation, August 10, 2015. https://www.nzno.org.nz/get_involved/consultation/artmid/4775/articleid/1393/health-
information-standards-organisation---hiso-10029-health-information-security-framework.
207 “Sustainability and the Health Sector: A Guide to Getting Started.” Wellington: Ministry of Health, July 2019.
https://www.health.govt.nz/system/files/documents/publications/sustainability-and-the-health-sector-30jul2019_1.pdf.
208 “The National Asset Management Programme for District Health Boards.” Wellington: Ministry of Health, June 2020.
https://www.health.govt.nz/system/files/documents/publications/national-asset-management-programme-district-health-boards-report-
current-state-assessment9june2020.pdf.

| Appendix B – Infrastructure performance |
Preparing for Technological Change in the Infrastructure Sector | 3821960-1147589789-62 | 31/05/2021 | 140
The second NAMP report due in 2022 will develop a clearer framework for asset
management and develop a comprehensive work programme to address asset
deficiencies.209
Estimates of the investment needed in the next 10 years for DHB infrastructure
show $14 billion is required and infrastructure over the next 10 years. In 2019, the
Ministry of Health estimated DHB information technology requires $2.3 billion
investment.210
The New Zealand Government recently announced reforms to restructure the health system. While the
public health and disability system performs well overall by some measures, it has significant and persistent
issues in delivering equity and consistency for all. Through a single nationwide health service, it is expected
that the sector performance data for this sector would be centralised.
209 “The National Asset Management Programme for District Health Boards.” Wellington: Ministry of Health, June 2020.
https://www.health.govt.nz/system/files/documents/publications/national-asset-management-programme-district-health-boards-report-
current-state-assessment9june2020.pdf.
210 “The National Asset Management Programme for District Health Boards.” Wellington: Ministry of Health, June 2020.
https://www.health.govt.nz/system/files/documents/publications/national-asset-management-programme-district-health-boards-report-
current-state-assessment9june2020.pdf.
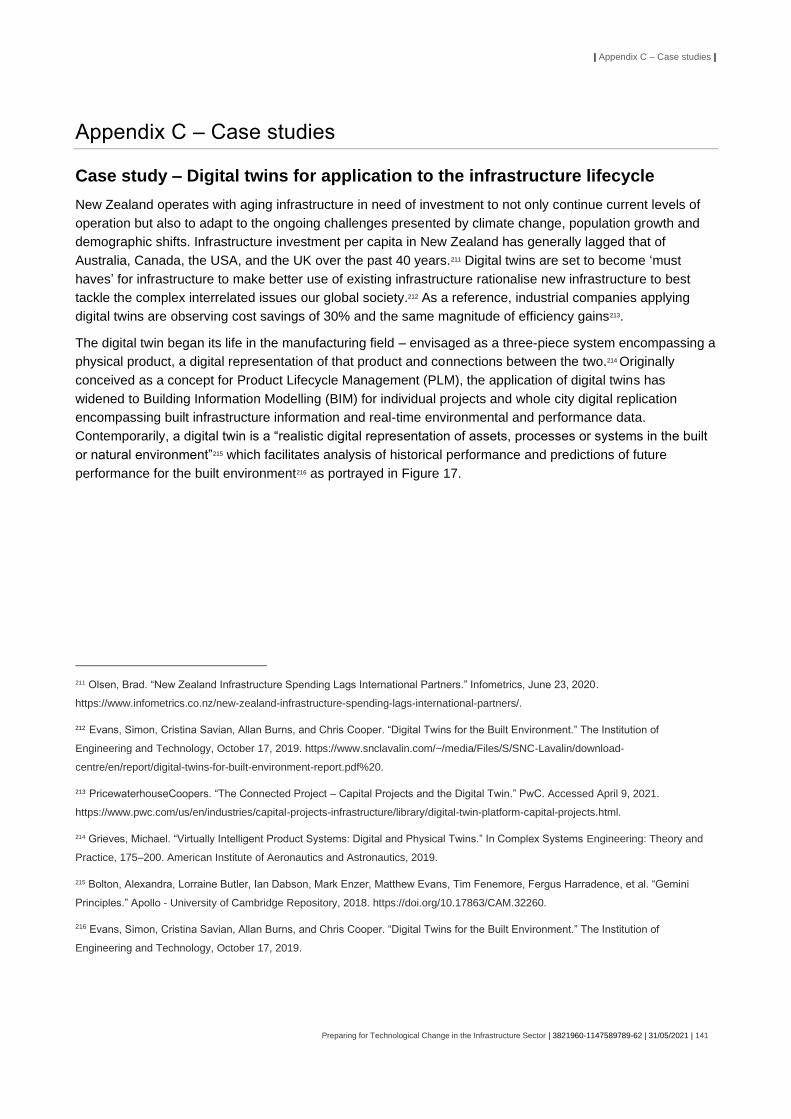
| Appendix C – Case studies |
Preparing for Technological Change in the Infrastructure Sector | 3821960-1147589789-62 | 31/05/2021 | 141
Appendix C – Case studies
Case study – Digital twins for application to the infrastructure lifecycle
New Zealand operates with aging infrastructure in need of investment to not only continue current levels of
operation but also to adapt to the ongoing challenges presented by climate change, population growth and
demographic shifts. Infrastructure investment per capita in New Zealand has generally lagged that of
Australia, Canada, the USA, and the UK over the past 40 years.211 Digital twins are set to become ‘must
haves’ for infrastructure to make better use of existing infrastructure rationalise new infrastructure to best
tackle the complex interrelated issues our global society.212 As a reference, industrial companies applying
digital twins are observing cost savings of 30% and the same magnitude of efficiency gains213.
The digital twin began its life in the manufacturing field – envisaged as a three-piece system encompassing a
physical product, a digital representation of that product and connections between the two.214 Originally
conceived as a concept for Product Lifecycle Management (PLM), the application of digital twins has
widened to Building Information Modelling (BIM) for individual projects and whole city digital replication
encompassing built infrastructure information and real-time environmental and performance data.
Contemporarily, a digital twin is a “realistic digital representation of assets, processes or systems in the built
or natural environment”215 which facilitates analysis of historical performance and predictions of future
performance for the built environment216 as portrayed in Figure 17.
211 Olsen, Brad. “New Zealand Infrastructure Spending Lags International Partners.” Infometrics, June 23, 2020.
https://www.infometrics.co.nz/new-zealand-infrastructure-spending-lags-international-partners/.
212 Evans, Simon, Cristina Savian, Allan Burns, and Chris Cooper. “Digital Twins for the Built Environment.” The Institution of
Engineering and Technology, October 17, 2019. https://www.snclavalin.com/~/media/Files/S/SNC-Lavalin/download-
centre/en/report/digital-twins-for-built-environment-report.pdf%20.
213 PricewaterhouseCoopers. “The Connected Project – Capital Projects and the Digital Twin.” PwC. Accessed April 9, 2021.
https://www.pwc.com/us/en/industries/capital-projects-infrastructure/library/digital-twin-platform-capital-projects.html.
214 Grieves, Michael. “Virtually Intelligent Product Systems: Digital and Physical Twins.” In Complex Systems Engineering: Theory and
Practice, 175–200. American Institute of Aeronautics and Astronautics, 2019.
215 Bolton, Alexandra, Lorraine Butler, Ian Dabson, Mark Enzer, Matthew Evans, Tim Fenemore, Fergus Harradence, et al. “Gemini
Principles.” Apollo - University of Cambridge Repository, 2018. https://doi.org/10.17863/CAM.32260.
216 Evans, Simon, Cristina Savian, Allan Burns, and Chris Cooper. “Digital Twins for the Built Environment.” The Institution of
Engineering and Technology, October 17, 2019.

| Appendix C – Case studies |
Preparing for Technological Change in the Infrastructure Sector | 3821960-1147589789-62 | 31/05/2021 | 142
Figure 17: Digital twins in the physical and conceptual worlds of assets. 217
Already, several public organisations in New Zealand, including Waka Kotahi, LINZ, and the Quake Centre
have developed elements of a digital twin.218 In addition, at the individual project level, BIM is gaining traction
for the management of data needed for the design and construction infrastructure.219
Since 2017, Hamilton City Council has enlisted the expertise of Beca to apply BIM to the upgrade of the
Pukete Wastewater Treatment Plant. The use of BIM was spearheaded by unclear maintenance and
upgrade needs caused by a lack of reliable data about the existing asset. Lidar and drones were used to
create a 3D point cloud of the physical assets which formed the basis of the digital twin. Augmented by
operation and maintenance information and integrated with the Council’s asset management system, the
digital twin has become a single source of information for the operation and maintenance of the treatment
plant. Barcodes have been installed to link the physical assets with the digital twin allowing detailed asset
information to be profiled and cross-checked within the digital twin. While the BIM model came at a cost for
217 Witherden, Stephen. “Digital Twins What, Why and How.” Beca, November 27, 2019. https://www.beca.com/ignite-your-
thinking/ignite-your-thinking/november-2019/digital-twins-what-why-and-how.
218 “Unlocking the Value of Data: Managing New Zealand’s Interconnected Infrastructure.” Infrastructure New Zealand, May 2020.
https://infrastructure.org.nz/resources/Documents/Reports/Infrastructure%20NZ%20Unlocking%20the%20Value%20of%20Data%20Re
port.pdf.
219 Jones, Amor, and Bellamy. “Position Paper: Digitalisation of the New Zealand Building Industry.”
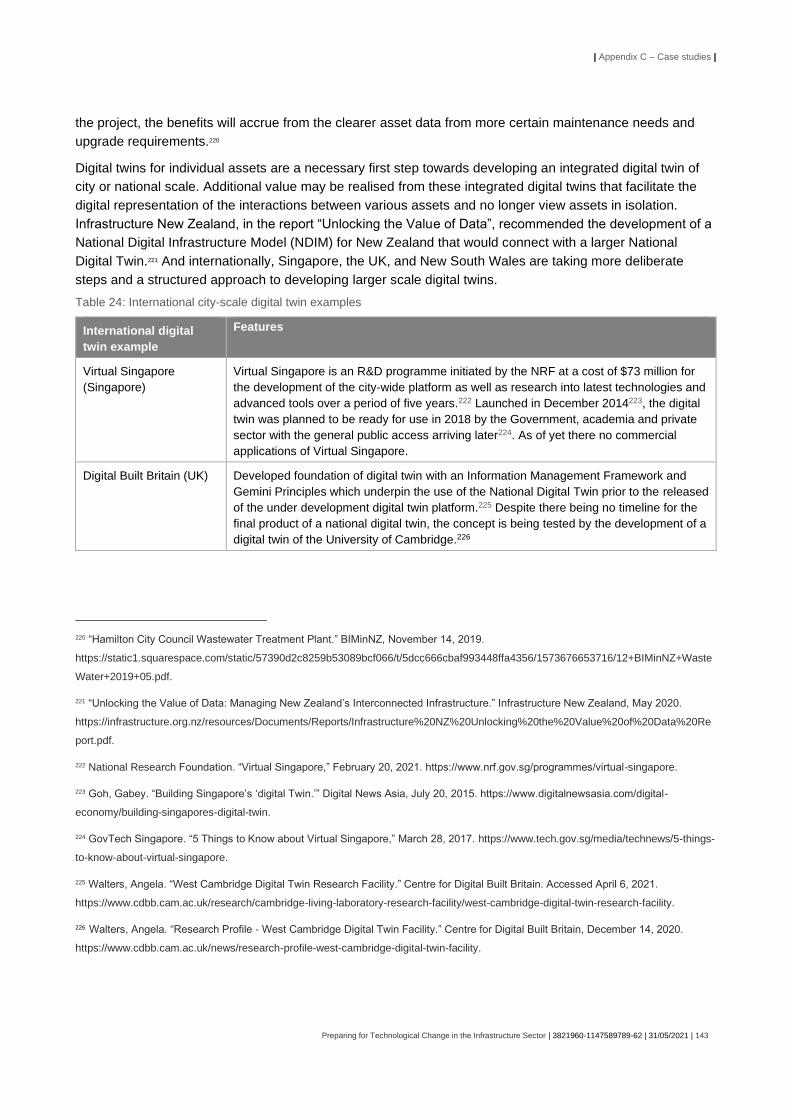
| Appendix C – Case studies |
Preparing for Technological Change in the Infrastructure Sector | 3821960-1147589789-62 | 31/05/2021 | 143
the project, the benefits will accrue from the clearer asset data from more certain maintenance needs and
upgrade requirements.220
Digital twins for individual assets are a necessary first step towards developing an integrated digital twin of
city or national scale. Additional value may be realised from these integrated digital twins that facilitate the
digital representation of the interactions between various assets and no longer view assets in isolation.
Infrastructure New Zealand, in the report “Unlocking the Value of Data”, recommended the development of a
National Digital Infrastructure Model (NDIM) for New Zealand that would connect with a larger National
Digital Twin.221 And internationally, Singapore, the UK, and New South Wales are taking more deliberate
steps and a structured approach to developing larger scale digital twins.
Table 24: International city-scale digital twin examples
International digital
twin example
Features
Virtual Singapore
(Singapore)
Virtual Singapore is an R&D programme initiated by the NRF at a cost of $73 million for
the development of the city-wide platform as well as research into latest technologies and
advanced tools over a period of five years.222 Launched in December 2014223, the digital
twin was planned to be ready for use in 2018 by the Government, academia and private
sector with the general public access arriving later224. As of yet there no commercial
applications of Virtual Singapore.
Digital Built Britain (UK) Developed foundation of digital twin with an Information Management Framework and
Gemini Principles which underpin the use of the National Digital Twin prior to the released
of the under development digital twin platform.225 Despite there being no timeline for the
final product of a national digital twin, the concept is being tested by the development of a
digital twin of the University of Cambridge.226
220 “Hamilton City Council Wastewater Treatment Plant.” BIMinNZ, November 14, 2019.
https://static1.squarespace.com/static/57390d2c8259b53089bcf066/t/5dcc666cbaf993448ffa4356/1573676653716/12+BIMinNZ+Waste
Water+2019+05.pdf.
221 “Unlocking the Value of Data: Managing New Zealand’s Interconnected Infrastructure.” Infrastructure New Zealand, May 2020.
https://infrastructure.org.nz/resources/Documents/Reports/Infrastructure%20NZ%20Unlocking%20the%20Value%20of%20Data%20Re
port.pdf.
222 National Research Foundation. “Virtual Singapore,” February 20, 2021. https://www.nrf.gov.sg/programmes/virtual-singapore.
223 Goh, Gabey. “Building Singapore’s ‘digital Twin.’” Digital News Asia, July 20, 2015. https://www.digitalnewsasia.com/digital-
economy/building-singapores-digital-twin.
224 GovTech Singapore. “5 Things to Know about Virtual Singapore,” March 28, 2017. https://www.tech.gov.sg/media/technews/5-things-
to-know-about-virtual-singapore.
225 Walters, Angela. “West Cambridge Digital Twin Research Facility.” Centre for Digital Built Britain. Accessed April 6, 2021.
https://www.cdbb.cam.ac.uk/research/cambridge-living-laboratory-research-facility/west-cambridge-digital-twin-research-facility.
226 Walters, Angela. “Research Profile - West Cambridge Digital Twin Facility.” Centre for Digital Built Britain, December 14, 2020.
https://www.cdbb.cam.ac.uk/news/research-profile-west-cambridge-digital-twin-facility.
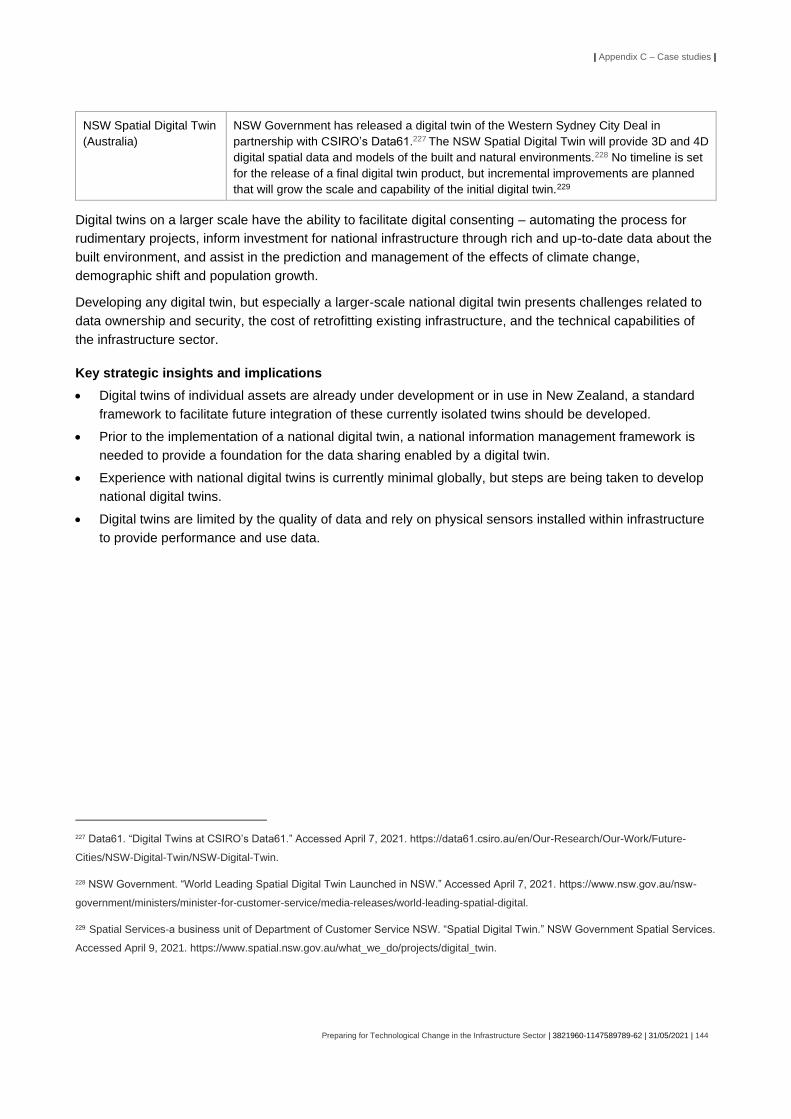
| Appendix C – Case studies |
Preparing for Technological Change in the Infrastructure Sector | 3821960-1147589789-62 | 31/05/2021 | 144
NSW Spatial Digital Twin
(Australia)
NSW Government has released a digital twin of the Western Sydney City Deal in
partnership with CSIRO’s Data61.227 The NSW Spatial Digital Twin will provide 3D and 4D
digital spatial data and models of the built and natural environments.228 No timeline is set
for the release of a final digital twin product, but incremental improvements are planned
that will grow the scale and capability of the initial digital twin.229
Digital twins on a larger scale have the ability to facilitate digital consenting – automating the process for
rudimentary projects, inform investment for national infrastructure through rich and up-to-date data about the
built environment, and assist in the prediction and management of the effects of climate change,
demographic shift and population growth.
Developing any digital twin, but especially a larger-scale national digital twin presents challenges related to
data ownership and security, the cost of retrofitting existing infrastructure, and the technical capabilities of
the infrastructure sector.
Key strategic insights and implications
• Digital twins of individual assets are already under development or in use in New Zealand, a standard
framework to facilitate future integration of these currently isolated twins should be developed.
• Prior to the implementation of a national digital twin, a national information management framework is
needed to provide a foundation for the data sharing enabled by a digital twin.
• Experience with national digital twins is currently minimal globally, but steps are being taken to develop
national digital twins.
• Digital twins are limited by the quality of data and rely on physical sensors installed within infrastructure
to provide performance and use data.
227 Data61. “Digital Twins at CSIRO’s Data61.” Accessed April 7, 2021. https://data61.csiro.au/en/Our-Research/Our-Work/Future-
Cities/NSW-Digital-Twin/NSW-Digital-Twin.
228 NSW Government. “World Leading Spatial Digital Twin Launched in NSW.” Accessed April 7, 2021. https://www.nsw.gov.au/nsw-
government/ministers/minister-for-customer-service/media-releases/world-leading-spatial-digital.
229 Spatial Services-a business unit of Department of Customer Service NSW. “Spatial Digital Twin.” NSW Government Spatial Services.
Accessed April 9, 2021. https://www.spatial.nsw.gov.au/what_we_do/projects/digital_twin.
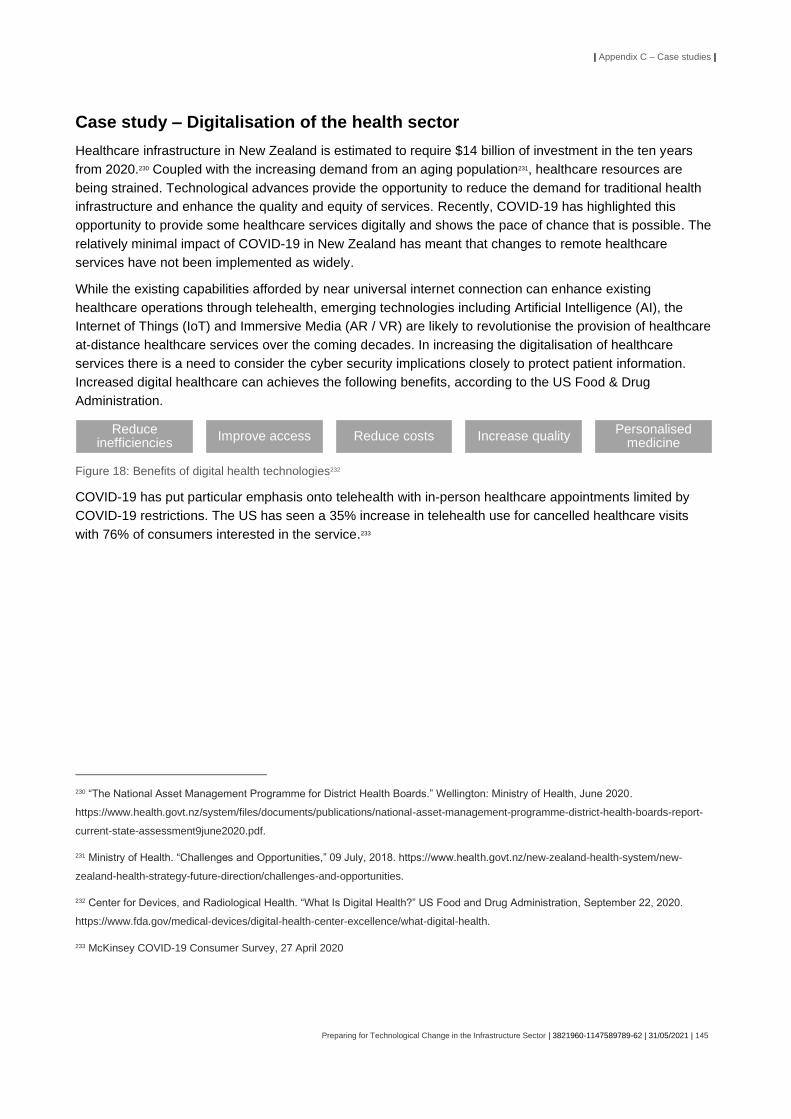
| Appendix C – Case studies |
Preparing for Technological Change in the Infrastructure Sector | 3821960-1147589789-62 | 31/05/2021 | 145
Case study – Digitalisation of the health sector
Healthcare infrastructure in New Zealand is estimated to require $14 billion of investment in the ten years
from 2020.230 Coupled with the increasing demand from an aging population231, healthcare resources are
being strained. Technological advances provide the opportunity to reduce the demand for traditional health
infrastructure and enhance the quality and equity of services. Recently, COVID-19 has highlighted this
opportunity to provide some healthcare services digitally and shows the pace of chance that is possible. The
relatively minimal impact of COVID-19 in New Zealand has meant that changes to remote healthcare
services have not been implemented as widely.
While the existing capabilities afforded by near universal internet connection can enhance existing
healthcare operations through telehealth, emerging technologies including Artificial Intelligence (AI), the
Internet of Things (IoT) and Immersive Media (AR / VR) are likely to revolutionise the provision of healthcare
at-distance healthcare services over the coming decades. In increasing the digitalisation of healthcare
services there is a need to consider the cyber security implications closely to protect patient information.
Increased digital healthcare can achieves the following benefits, according to the US Food & Drug
Administration.
Figure 18: Benefits of digital health technologies232
COVID-19 has put particular emphasis onto telehealth with in-person healthcare appointments limited by
COVID-19 restrictions. The US has seen a 35% increase in telehealth use for cancelled healthcare visits
with 76% of consumers interested in the service.233
230 “The National Asset Management Programme for District Health Boards.” Wellington: Ministry of Health, June 2020.
https://www.health.govt.nz/system/files/documents/publications/national-asset-management-programme-district-health-boards-report-
current-state-assessment9june2020.pdf.
231 Ministry of Health. “Challenges and Opportunities,” 09 July, 2018. https://www.health.govt.nz/new-zealand-health-system/new-
zealand-health-strategy-future-direction/challenges-and-opportunities.
232 Center for Devices, and Radiological Health. “What Is Digital Health?” US Food and Drug Administration, September 22, 2020.
https://www.fda.gov/medical-devices/digital-health-center-excellence/what-digital-health.
233 McKinsey COVID-19 Consumer Survey, 27 April 2020
Reduce inefficiencies
Improve access Reduce costs Increase qualityPersonalised
medicine

| Appendix C – Case studies |
Preparing for Technological Change in the Infrastructure Sector | 3821960-1147589789-62 | 31/05/2021 | 146
Figure 19: McKinsey research highlights strong interest in telehealth from consumers.234
Telehealth has the potential to reduce demand for physical healthcare infrastructure through the following
applications:
• On-demand virtual urgent care – a direct alternative to low emergency department (ED) visits
• Virtual office visits – a direct alternative to general practitioner (GP) consults
• Virtual home health services – services can be delivered remotely such as patient and care giver
education, physical therapy, occupational therapy, and speech therapy
• Tech-enabled home medication administration – allows patients to shift receiving some infusible and
injectable drugs from the clinic to the home.
Telehealth and healthcare services at-a-distance can be demonstrated across the three following emerging
technologies with proven application.
Artificial Intelligence
Artificial intelligence has the capability to enhance the quality of healthcare services across the spectrum
including keeping people well, early detection of disease, diagnosis of illness, and provide optimised
treatment options.
Visual diagnosis is still required for many diseases. Diagnosis by humans can inadvertently introduce bias
and error.235 AI has the potential to reduce or control bias and aid the visual diagnosis of diseases by
professionals. AI company DeepMind has worked with Moorfields Eye Hospital in the UK to demonstrate the
benefits of AI in identifying eye conditions. The AI has been proven to be able to recommend patient referrals
for over 50 eye diseases as accurately as eye professionals reducing the time required from professionals
for diagnosis and minimising the number of false diagnoses.236 Introducing AI into diagnosis can therefore
reduce the need for in-person diagnosis and reduce the barriers of physical access to healthcare services.
Internet of Things
234 Bestsennyy, Oleg, Greg Gilbert, Alex Harris, and Jennifer Rost. “Telehealth: A Quarter-Trillion-Dollar Post-COVID-19 Reality?”
McKinsey & Company. McKinsey & Company, May 28, 2020. https://www.mckinsey.com/industries/healthcare-systems-and-
services/our-insights/telehealth-a-quarter-trillion-dollar-post-covid-19-reality.
235 “Artificial Intelligence for Health in New Zealand.” Artificial Intelligence Forum of New Zealand, October 21, 2019.
https://aiforum.org.nz/wp-content/uploads/2019/10/AI-For-Health-in-New-Zealand.pdf.
236 De Fauw, Jeffrey, Joseph R. Ledsam, Bernardino Romera-Paredes, Stanislav Nikolov, Nenad Tomasev, Sam Blackwell, Harry
Askham, et al. “Clinically Applicable Deep Learning for Diagnosis and Referral in Retinal Disease.” Nature Medicine 24, no. 9
(September 2018): 1342–50.

| Appendix C – Case studies |
Preparing for Technological Change in the Infrastructure Sector | 3821960-1147589789-62 | 31/05/2021 | 147
The IoT can increase the availability of data related to the performance, impact and monitoring of medical
devices, individual health, and health infrastructure. Devices and sensors can be implanted or worn that can
measure health performance and trigger alerts and send reports to medical professionals when issues are
detected.
American medical device company, Medtronic, has developed the MyCareLink Heart mobile app to use in
conjunction with their cardiac pacer device. Initially conceived as a way to reduce the contact between
patients and their clinicians and minimise the risk of COVID-19 transmission – the mobile app has proven to
be more effective at ensuring patients adhere to their remote monitoring schedule than those using
traditional monitors. 237 Similarly, researchers in conjunction with the Royal Melbourne Hospital in Australia
have trialled remote device interrogation (RI) for implanted pacemakers and defibrillators. The trial attempts
to reduce need for cardiologists to visit rural locations where usually large volume device interrogations
would occur or reduce the need for rural citizens to travel to larger metropolitan areas. This trial used
interrogation devices at two rural pharmacies to interrogate implanted devices. These interrogation devices
can then transmit the results to a centralised system for review by specialists without the need for a face-to-
face interaction when no abnormal conditions are detected.238 Evidently, these COVID -19 instigated remote
monitoring of devices can also work to provide healthcare services at-a-distance reducing visits to health
clinics, providing easier healthcare access in rural locations, and saving time and costs of health specialists.
Immersive Media
Augmented reality and virtual reality increase the ability to deliver healthcare services at distance, with a
corresponding reduction in pressure on physical infrastructure and improved community equity of service
delivery while still providing an immersive experience.
Virtual reality has found strong application in the educational aspect of healthcare with the ability to create
simulated environments to deliver cost-effective, repeatable, and standardised clinical training without the
need for a real clinical environment.239 Clinical studies are also investigating the use of VR to conduct clinical
sessions remotely with one study investigating the use of home-based virtual reality for balance training for
those with Parkinson’s disease.240 In this study, the effectiveness of self-managed virtual reality training was
compared with training by a licensed physical therapist. The results found training by both methods improved
237 Manthre, Ryan, and Ryan Weispfenning. “New Data Unveiled at Heart Rhythm 2020 Demonstrate Effectiveness of App-Based
Remote Monitoring of Medtronic Cardiac Devices, Significant Reduction in Complications with Micra Leadless Pacemaker.” Medtronic,
May 8, 2020. https://newsroom.medtronic.com/node/31521/pdf.
238 Wong, Joshua, Anthony Longhitano, Jessica Yao, Pavithra Jayadeva, Kim Arendshorst, Leeanne Grigg, Gareth Wynn, and Irene
Stevenson. “Remote Device Interrogation Kiosks (ReDInK) - Pharmacy Kiosk Remote Testing of Pacemakers and Implantable
Cardioverter-Defibrillators for Rural Victorians. A Novel Strategy to Tackle COVID-19.” Heart, Lung & Circulation, January 28, 2021.
https://doi.org/10.1016/j.hlc.2020.12.013.
239 Pottle, Jack. “Virtual Reality and the Transformation of Medical Education.” Future Healthcare Journal 6, no. 3 (October 2019): 181–
85.
240 Persky, Susan. “Here’s How Virtual Reality Could Transform Medical Research after COVID-19.” World Economic Forum, October 8,
2020. https://www.weforum.org/agenda/2020/10/virtual-labs-how-virtual-reality-could-transform-medical-trials-after-covid-19/.

| Appendix C – Case studies |
Preparing for Technological Change in the Infrastructure Sector | 3821960-1147589789-62 | 31/05/2021 | 148
the patients’ metrics in balance tests with no significant differences between the two methods.241 This
research highlights how virtual reality might be able to reduce the demands of trained specialists and allow
for patient therapy to be conducted at-a-distance.
Cyber security
Augmented digital integration in healthcare requires the increased capturing of patient information in digital
formats. In this, there is a greater vulnerability to the unwarranted access of private information – highlighting
the need for secure digital medical data. Healthcare organisations are frequently targeted by cyber-attacks
and might be poorly prepared to defend against such an attack according to KPMG. In its survey from KPMG
found that only 13% of healthcare organisation respondents reported tracking cyber threats more than once
a day, and one organisation found a 1000% increase in incidents and vulnerabilities when the tracking was
improved.242 Some countries, including Estonia, are transferring to e-health data management systems and
99% of data from hospitals and doctors has been digitised.243 Digitised health information allows for
individuals to access their records and with the permission of individuals medical information can be
accessed by health providers when needed such as for paramedics on route to an individual’s home.244
Digital health data facilitates further integration of technology in the provision of healthcare services.
Key strategic insights and implications
• Healthcare performance metrics could lead to increased technology uptake to meet performance targets.
Specific targets for widening access to healthcare could lead to accelerated uptake of digital healthcare
service offerings.
• Investment in digital health services can reduce the demand on physical medical infrastructure while
improving the accessibility and impact of medical professionals.
• Increased digitalisation of healthcare necessitates additional investment in cyber security to protect
patient privacy and confidentiality ethics.
• At-a-distance healthcare can provide constant monitoring of medical conditions and enable improved
efficiency of medical response.
• Trials of emerging technologies in healthcare should be investigated for the potential to improve
healthcare equity, provide healthcare services at-a-distance, and delay the demand for additional
healthcare infrastructure.
• Digital twins could be aligned with the principles of Kete Mātauranga which is that infrastructure data
must be treated as a taonga.
241 Yang, Wen-Chieh, Hsing-Kuo Wang, Ruey-Meei Wu, Chien-Shun Lo, and Kwan-Hwa Lin. “Home-Based Virtual Reality Balance
Training and Conventional Balance Training in Parkinson’s Disease: A Randomized Controlled Trial.” Journal of the Formosan Medical
Association = Taiwan Yi Zhi 115, no. 9 (September 2016): 734–43.
242 Ebert, Michael, and Greg Bell. “Health Care and Cyber Security.” KPMG, 2015.
https://assets.kpmg/content/dam/kpmg/pdf/2015/09/cyber-health-care-survey-kpmg-2015.pdf.
243 “Artificial Intelligence for Health in New Zealand.” Artificial Intelligence Forum of New Zealand, October 21, 2019.
https://aiforum.org.nz/wp-content/uploads/2019/10/AI-For-Health-in-New-Zealand.pdf.
244 “Artificial Intelligence for Health in New Zealand.” Artificial Intelligence Forum of New Zealand, October 21, 2019.
https://aiforum.org.nz/wp-content/uploads/2019/10/AI-For-Health-in-New-Zealand.pdf.

| Appendix D – Direct impacts on infrastructure |
Preparing for Technological Change in the Infrastructure Sector | 3821960-1147589789-62 | 31/05/2021 | 149
Appendix D – Direct impacts on infrastructure
In Appendix D, a high-level view of the direct impacts of technological change on infrastructure is examined
focusing on seven key measures underpinning performance, resilience, and sustainability.
Cross-sector direct impacts
Each category of technology – as introduced in section 2.3 – is analysed against the direct impact categories
in Table 25. Following Table 25, the justification for each of the ratings is provided through an analysis table
for each technology category. The following are a summary of the overall direct impacts of technological
change on infrastructure:
• Existing infrastructure will be made more productive – reducing the need for new infrastructure
• Drive demand for additional infrastructure
• Changes in technology will require new forms of infrastructure
• Increased visibility of the performance of infrastructure
• Infrastructure operations will require reduced direct human input
• Digitalisation of infrastructure will create cyber-security risks
• Lower cost of providing infrastructure

| Appendix D – Direct impacts on infrastructure |
Preparing for Technological Change in the Infrastructure Sector | 3821960-1147589789-62 | 31/05/2021 | 150
Note: An impact is not expected for each technology grouping however, some impacts might be omitted in
that the correlation is complex or difficult to substantiate.
Table 25: Direct impacts on infrastructure
Direct Impact
Co
nn
ec
tivit
y &
Co
mm
un
ica
tio
n
An
aly
tics
&
Co
mp
uta
tio
n
Clo
ud
& D
ata
Sto
rag
e
De
vic
es &
Au
tom
ati
on
Pla
tfo
rms
, In
terf
ace
s &
Sy
ste
ms
Ma
teri
als
, E
ne
rgy
&
Co
ns
tru
cti
on
Pe
rfo
rma
nce
Capacity / Output + + +
Access / Coverage / Utilisation + + - + / - +
Productivity / Efficiency + + + +
Resili
ence Service Quality / Affordability / Reliability + / - + - + / - - +
Safety / Security / Resilience + / - + / - + / - + / -
Su
sta
ina
bili
ty
Sustainability / Environmental Impact + / - + + + + / -
Asset Condition / Compliance + + + + +

| Appendix D – Direct impacts on infrastructure |
Preparing for Technological Change in the Infrastructure Sector | 3821960-1147589789-62 | 31/05/2021 | 151
Table 26 to 29 provide the justification for each of the ratings in Table 25, ordered by technology category.

| Appendix D – Direct impacts on infrastructure |
Preparing for Technological Change in the Infrastructure Sector | 3821960-1147589789-62 | 31/05/2021 | 152
Table 26: Direct impacts from connectivity and communication technologies
Connectivity & Communication
Pe
rfo
rma
nce
Capacity / Output
Hyperconnected networks will facilitate greater digital data capture for infrastructure
through more connected devices at a minimum 1 million connected devices per
square kilometre245 with faster data transfer speeds potentially 10 times faster than
4G246
Access / Coverage /
Utilisation
Hyperconnected networks will allow greater collection of infrastructure utilisation,
access, and coverage data247.
Productivity /
Efficiency
Emerging technologies to improve transmitting and sharing data can enable an
increase in productivity for construction of as much as 50%248.
Resili
ence
Service Quality /
Affordability /
Reliability
Hyperconnected network technologies will improve the service quality of infrastructure
by better tailoring service to the needs of individuals249.
Large networks of sensors and devices integrated with infrastructure results in more
components where failure can occur potentially reducing the reliability of infrastructure
provision.
Safety / Security /
Resilience
Ubiquitous digital networks will allow constant monitoring of infrastructure and can
predict unsafe conditions prior to any issue occurring250.
Greater digital integration of infrastructure increases the surface area for cyber-
attacks251.
Su
sta
ina
bili
ty
Sustainability /
Environmental
Impact
Sensors and connected networks can remotely monitor environmental impacts of
infrastructure operation including greenhouse gas emissions.
245 Mohyeldin, Eiman. “Minimum Technical Performance Requirements for IMT-2020 Radio Interface (s).” In ITU-R Workshop on IMT-
2020 Terrestrial Radio Interfaces, 1–12, 2016.
246 “5G Is Live.” Accessed March 9, 2021. https://www.vodafone.co.nz/5g/.
247 Global Infrastructure Hub. “InfraTech Stock Take of Use Cases.”
248 Barbosa, Filipe, Jonathan Woetzel, Jan Mischke, Maria João Ribeirinho, Mukund Sridhar, Matthew Parsons, Nick Bertram, and
Stephanie Brown. “Reinventing Construction: A Route to Higher Productivity.” McKinsey Global Institute, February 2017.
https://www.mckinsey.com/~/media/McKinsey/Business%20Functions/Operations/Our%20Insights/Reinventing%20construction%20thro
ugh%20a%20productivity%20revolution/MGI-Reinventing-Construction-Executive-summary.pdf.
249 Global Infrastructure Hub. “InfraTech Stock Take of Use Cases.”
250 Global Infrastructure Hub. “InfraTech Stock Take of Use Cases.”
251 Global Infrastructure Hub. “InfraTech Stock Take of Use Cases.”

| Appendix D – Direct impacts on infrastructure |
Preparing for Technological Change in the Infrastructure Sector | 3821960-1147589789-62 | 31/05/2021 | 153
Digitally connected infrastructure might require greater energy consumption to
operate. Additionally, there is a risk that increased data collection might result in
changing processes to just meet environmental requirements where previously these
targets might have been well-exceeded.
Asset Condition /
Compliance
Sensors and information transfer about asset conditions and compliance allowing
better maintenance of infrastructure252.
Table 27: Direct impacts from analytics and computation technologies
Analytics & Computation
Pe
rfo
rma
nce
Capacity / Output
Optimisation of existing infrastructure through advanced computational methods will
unlock additional capacity and output without additional physical infrastructure
investment253.
Access / Coverage /
Utilisation
Productivity /
Efficiency
Infrastructure service can be optimised as needs require using AI to increase
productivity by accelerating the time to and improving the accuracy of completing
tasks254.
Resili
ence
Service Quality /
Affordability /
Reliability
Improved computer analytics and AI can reduce the costs and improve service
consistency of infrastructure operation by reducing the need for human input.
Safety / Security /
Resilience
Su
sta
ina
bili
ty Sustainability /
Environmental
Impact
AI and machine learning can be utilised to identify strategies for emissions reductions
by optimising infrastructure operations255.
Asset Condition /
Compliance
Complex analytics of operating data can predict asset issues allowing for correction
before any compliance or failure occurs.
252 Global Infrastructure Hub. “InfraTech Stock Take of Use Cases.”
253 Costa, Bernardo, Aiko Bernardes, Julia Pereira, Vitoria Zampa, Vitoria Pereira, Guilherme Matos, Eduardo Soares, Claiton Soares,
and Alexandre Silva. “Artificial Intelligence in Automated Sorting in Trash Recycling,” 198–205, 2018.
254 Costa, Bernardes, Pereira, Zampa, Pereira, Matos, E. Soares, C. Soares, and Silva. “Artificial Intelligence in Automated Sorting in
Trash Recycling,”
255 Global Infrastructure Hub. “InfraTech Stock Take of Use Cases.”

| Appendix D – Direct impacts on infrastructure |
Preparing for Technological Change in the Infrastructure Sector | 3821960-1147589789-62 | 31/05/2021 | 154
Table 28: Direct impacts from cloud and data storage technologies
Cloud & Data Storage
Pe
rfo
rma
nce
Capacity / Output
Access / Coverage /
Utilisation
Emerging methods of distributed data storage and peer-to-peer transfer will facilitate
more distributed infrastructure use and development by private individuals that can
then interact with public infrastructure.256
Productivity /
Efficiency
Resili
ence
Service Quality /
Affordability /
Reliability
Reliance on new centralised data storage methods can open vulnerability of
connection issues or failure of the centralised system.
Safety / Security /
Resilience
New technologies for data security and storage will improve the security of
infrastructure assets. Infrastructure data is less likely to be lost in the case of physical
damage as data is stored remotely.
Greater automation of infrastructure through computer networks and internet-based
systems opens more access points for cyber-attacks257.
Su
sta
ina
bili
ty
Sustainability /
Environmental
Impact
Asset Condition /
Compliance
256 Tushar, Wayes, Tapan K. Saha, Chau Yuen, David Smith, and H. Vincent Poor. “Peer-to-Peer Trading in Electricity Networks: An
Overview.” arXiv [cs.MA], January 19, 2020. arXiv. http://arxiv.org/abs/2001.06882.
257 Global Infrastructure Hub. “InfraTech Stock Take of Use Cases.”
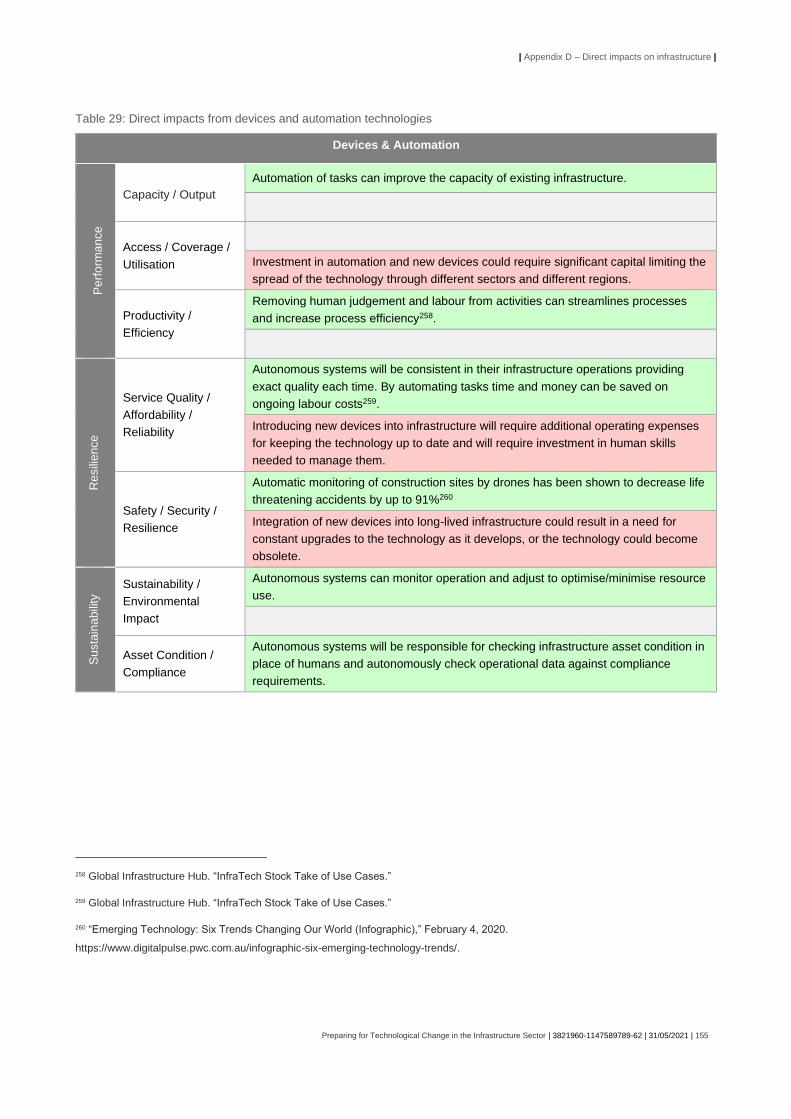
| Appendix D – Direct impacts on infrastructure |
Preparing for Technological Change in the Infrastructure Sector | 3821960-1147589789-62 | 31/05/2021 | 155
Table 29: Direct impacts from devices and automation technologies
Devices & Automation
Pe
rfo
rma
nce
Capacity / Output
Automation of tasks can improve the capacity of existing infrastructure.
Access / Coverage /
Utilisation
Investment in automation and new devices could require significant capital limiting the
spread of the technology through different sectors and different regions.
Productivity /
Efficiency
Removing human judgement and labour from activities can streamlines processes
and increase process efficiency258.
Resili
ence
Service Quality /
Affordability /
Reliability
Autonomous systems will be consistent in their infrastructure operations providing
exact quality each time. By automating tasks time and money can be saved on
ongoing labour costs259.
Introducing new devices into infrastructure will require additional operating expenses
for keeping the technology up to date and will require investment in human skills
needed to manage them.
Safety / Security /
Resilience
Automatic monitoring of construction sites by drones has been shown to decrease life
threatening accidents by up to 91%260
Integration of new devices into long-lived infrastructure could result in a need for
constant upgrades to the technology as it develops, or the technology could become
obsolete.
Su
sta
ina
bili
ty
Sustainability /
Environmental
Impact
Autonomous systems can monitor operation and adjust to optimise/minimise resource
use.
Asset Condition /
Compliance
Autonomous systems will be responsible for checking infrastructure asset condition in
place of humans and autonomously check operational data against compliance
requirements.
258 Global Infrastructure Hub. “InfraTech Stock Take of Use Cases.”
259 Global Infrastructure Hub. “InfraTech Stock Take of Use Cases.”
260 “Emerging Technology: Six Trends Changing Our World (Infographic),” February 4, 2020.
https://www.digitalpulse.pwc.com.au/infographic-six-emerging-technology-trends/.

| Appendix D – Direct impacts on infrastructure |
Preparing for Technological Change in the Infrastructure Sector | 3821960-1147589789-62 | 31/05/2021 | 156
Table 30: Direct impacts from platforms, interfaces, and systems technologies
Platforms, Interfaces & Systems
Pe
rfo
rma
nce
Capacity / Output
Access / Coverage /
Utilisation
Digital platforms for managing infrastructure will reduce distance effects allowing more
rural areas to access greater expertise through digital means.
Investment in new digital platforms and systems could require significant capital
limiting the spread of the technology through different sectors depending on capital
availability.
Productivity /
Efficiency
Digital platforms and interfaces are capable of augmenting human capabilities for
infrastructure maintenance and planning.261
Resili
ence
Service Quality /
Affordability /
Reliability
Establishing new digital systems and platforms can be expensive.
Safety / Security /
Resilience
Digital interfaces for management of infrastructure development and operation can
reduce the time staff must spend in less safe environments and can reduce personal
safety issues to almost zero262.
New platforms for system design thinking require sharing of data between various
sources which creates greater risk of sensitive information being accessed without
authorisation.
Su
sta
ina
bili
ty
Sustainability /
Environmental
Impact
Utilisation of emerging digital tools and interfaces such as digital twins will allow
modelling of environmental impacts of infrastructure both of built and yet-to-be-built
infrastructure.
Asset Condition /
Compliance
Digital interfaces with infrastructure such as digital twins and integrated BIM will
facilitate improved infrastructure condition monitoring and compliance
assessments263.
261 “Looking Smart: Augmented Reality Is Seeing Real Results In Industry.” Accessed March 9, 2021.
https://www.ge.com/news/reports/looking-smart-augmented-reality-seeing-real-results-industry-today.
262 Global Infrastructure Hub. “InfraTech Stock Take of Use Cases.”
263 Global Infrastructure Hub. “InfraTech Stock Take of Use Cases.”
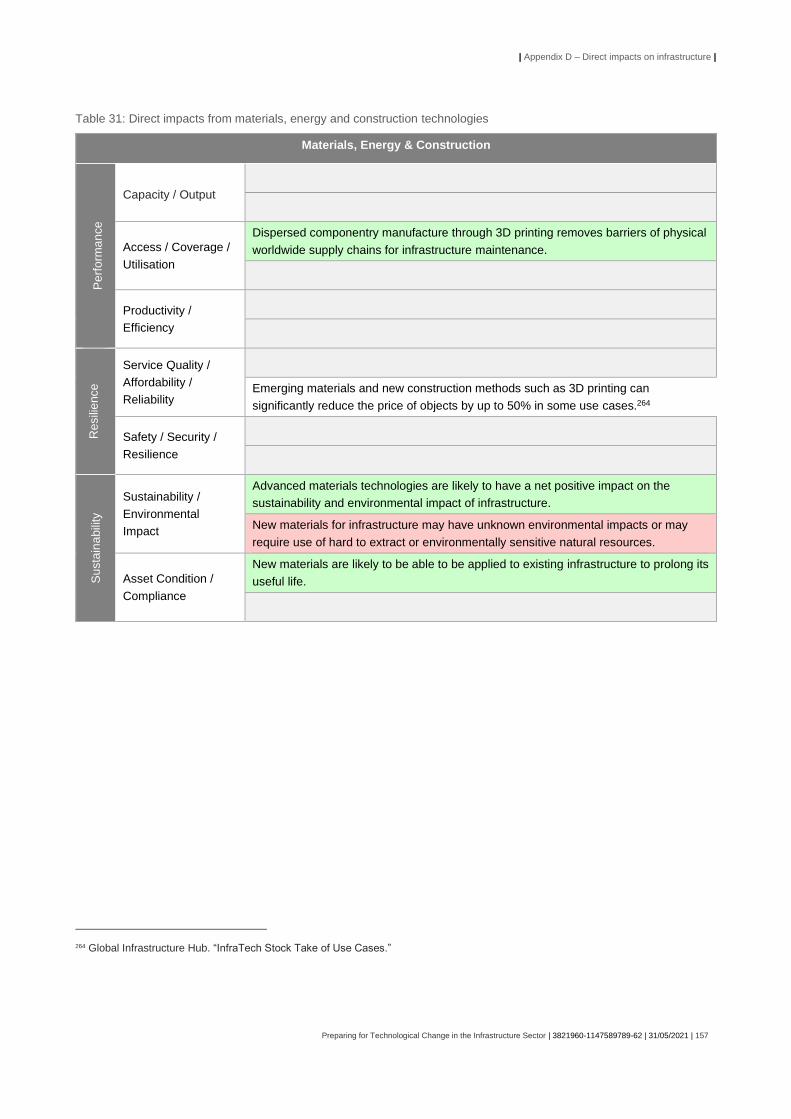
| Appendix D – Direct impacts on infrastructure |
Preparing for Technological Change in the Infrastructure Sector | 3821960-1147589789-62 | 31/05/2021 | 157
Table 31: Direct impacts from materials, energy and construction technologies
Materials, Energy & Construction
Pe
rfo
rma
nce
Capacity / Output
Access / Coverage /
Utilisation
Dispersed componentry manufacture through 3D printing removes barriers of physical
worldwide supply chains for infrastructure maintenance.
Productivity /
Efficiency
Re
sili
ence
Service Quality /
Affordability /
Reliability
Emerging materials and new construction methods such as 3D printing can
significantly reduce the price of objects by up to 50% in some use cases.264
Safety / Security /
Resilience
Su
sta
ina
bili
ty
Sustainability /
Environmental
Impact
Advanced materials technologies are likely to have a net positive impact on the
sustainability and environmental impact of infrastructure.
New materials for infrastructure may have unknown environmental impacts or may
require use of hard to extract or environmentally sensitive natural resources.
Asset Condition /
Compliance
New materials are likely to be able to be applied to existing infrastructure to prolong its
useful life.
264 Global Infrastructure Hub. “InfraTech Stock Take of Use Cases.”

| Appendix D – Direct impacts on infrastructure |
Preparing for Technological Change in the Infrastructure Sector | 3821960-1147589789-62 | 31/05/2021 | 158
Sector specific direct impacts
In this section of Appendix D, direct impacts for each of the defined infrastructure sectors are analysed.
The direct impacts are arranged under the different technology categories to show which technologies might
have a larger impact in certain sectors. Also analysed are the most relevant technologies for each sector,
along with current barriers for technology adoption and potential future enablers.
Telecommunications
Table 32: Telecommunications – direct impacts of technological change
Direct Impacts Relevant Technologies
• Connectivity & Communication
– Telecommunications are to become exponentially
faster and reach more isolated locations, new
transmitting devices will require installation
around the country that will enable these faster
speeds.
– Reduced need for wired connections is likely to
occur.
– Increased reliance on vast quantities of sensors
and devices which can fail
– Greater energy consumption of sector to power
big networks of devices.
• Analytics & Computation
– Communication will involve greater computer
input – managing communication autonomously
between individuals and devices based on
databases of historical information and
predictions.
– Automated monitoring of asset conditions
• Cloud & Data Storage
– Reliance on wireless connections for data access
– Individuals will transition more to service-based
storage plans relying on centralised data storage
facilities as the speed of connecting to a
centralised database – in comparison with on
device storage – drops.
• Devices & Automation
– Ubiquitous devices that are carried everywhere
will increase the number of telecommunication
devices connected to networks across New
Zealand.
– Remote monitoring of assets
– Computer assisted human maintenance of assets
• Platforms, Interfaces & Systems
– Improved individual monitoring of
telecommunications use
– Modelling of natural disaster scenarios
• AI – Natural Language Processing, Machine
Learning
• 5G / 6G / Li-Fi
• Distributed ledger technology / Blockchain
• AR / VR
• IoT
Barriers
• Lack of data transparency for determining benefits or
negatives of technological change.
• Low profit margins for enacting technological change
• Increasing consolidation of the internet market within
NZ
Enablers
• Competitive market with drivers for competitive edge
through innovation
• Well-regulated market by international standards
with a history of innovation
• A national telecommunications strategy with
government driven targets for the sector to drive
technological innovation e.g.Coverage targets,
speed targets that telco providers must show how
they will commit to.

| Appendix D – Direct impacts on infrastructure |
Preparing for Technological Change in the Infrastructure Sector | 3821960-1147589789-62 | 31/05/2021 | 159
• Materials, Energy & Construction
– New energy production and storage allowing
telecommunications infrastructure to be more
remote
Energy
Table 33: Energy – direct impacts of technological change
Direct Impacts Relevant Technologies
• Connectivity & Communication
– Greater collection and monitoring of infrastructure
energy usage
– Consumers to have access to richer information
about personal emissions.
• Analytics & Computation
– Intelligent energy management systems
• Cloud & Data Storage
• Devices & Automation
– Increased demand for electricity through more
electronic devices and automation
– Repairing transmission lines can be automated to
remove the need for higher risk human
intervention.
• Platforms, Interfaces & Systems
– Peer-to-peer selling of electricity across the grid
– Modelling of natural disaster scenarios
• Materials, Energy & Construction
– Decentralised electricity generation
– New energy sources with local production reduce
reliance on global supply chains
– Closure of existing energy production locations.
• Advanced batteries
• Distributed ledger technology / Blockchain
• AI – Machine learning
• Building Management Systems (BMS) / Building
Automation Systems (BAS)
• Ambient intelligence (hyper-personalisation)
Barriers
• Regulations around distributed electricity production
and existence of 29 separate businesses in the
electricity distribution sector with different ownership
structures and regulatory frameworks265.
• Uncertainty over dominant future energy forms in
New Zealand.
• Imperfect information for uptake of new energy
technologies for businesses and industry266.
• Cost of investing in new energy production methods.
Enablers
• Enhance New Zealand Emission Trading Scheme to
foster technological adoption
• Government targets for 100% renewable electricity
will drive innovation
• Greater collaboration across electricity distributors
for investment to harness economies of scale.
• Government incentives for technological uptake by
industry.
265 International Energy Agency. “Energy Policies of IEA Countries - New Zealand 2017.” International Energy Agency, 2017.
https://webstore.iea.org/download/direct/305.
266 “Unlocking Our Energy Productivity and.” Ministry of Business, Innovation & Employment, June 2017.
https://www.mbie.govt.nz/dmsdocument/140-nzeecs-2017-2022-pdf.

| Appendix D – Direct impacts on infrastructure |
Preparing for Technological Change in the Infrastructure Sector | 3821960-1147589789-62 | 31/05/2021 | 160
Water
Table 34: Water – direct impacts of technological change
Direct Impacts Relevant Technologies
• Connectivity & Communication
– Real-time monitoring of water consumption and
reduced water supply losses.
– Tracking of stormwater flows and issues
• Analytics & Computation
• Cloud & Data Storage
• Devices & Automation
– Easier data capture of existing assets with new
sensors and remote data capture.
• Platforms, Interfaces & Systems
– Modelling of future demographic scenarios
– Modelling of natural disaster scenarios
• Materials, Energy & Construction
– Reduced reliance on international manufacturing
for replacement parts
– New materials for pipe linings reducing the
thickness of linings and increasing capacity
• IoT
• AI – Machine Learning
• Digital twin
• Automation
• 3D printing
Barriers
• Unwillingness for water providers to innovate due to
a risk of adverse outcomes.
• Lack of information about existing assets.
• Investment barriers for local councils to innovate –
restricted capital to invest in new technologies.
Enablers
• Government innovation fund to provide more
equitable access to technological innovations across
different local governments with varying capital
budgets.
• National three waters oversight agency responsible
for procurement to enable economies of scale and
standardisation.
Resource Recovery and Waste
Table 35: Resource Recover and Waste – direct impacts of technological change
Direct Impacts Relevant Technologies
• Connectivity & Communication
– Analytics & Computation
– Computer to sort rubbish for more effective
recycling – reduced landfill need
• Cloud & Data Storage
• Devices & Automation
– Automated rubbish collection – reduced labour
requirements
– Increased quantity of e-waste due to more
technological adoption
• Platforms, Interfaces & Systems
• Materials, Energy & Construction
– Alternative methods for waste recovery and
disposal
• AI – Machine Learning, Computer Vision
• Automation
• IoT
• Drones / Robotics
Barriers
• Lack of visibility of current operations.
• Lack of strong strategy from government and local
councils
• Lack of data about the waste sector
• Fragmented sector governance
• Onshore processing capacity gaps
• Changing or emerging waste streams creating
investment uncertainty and adaptation to climate
change.
• New Zealand’s municipal waste to landfill per capita
is the highest in the OECD
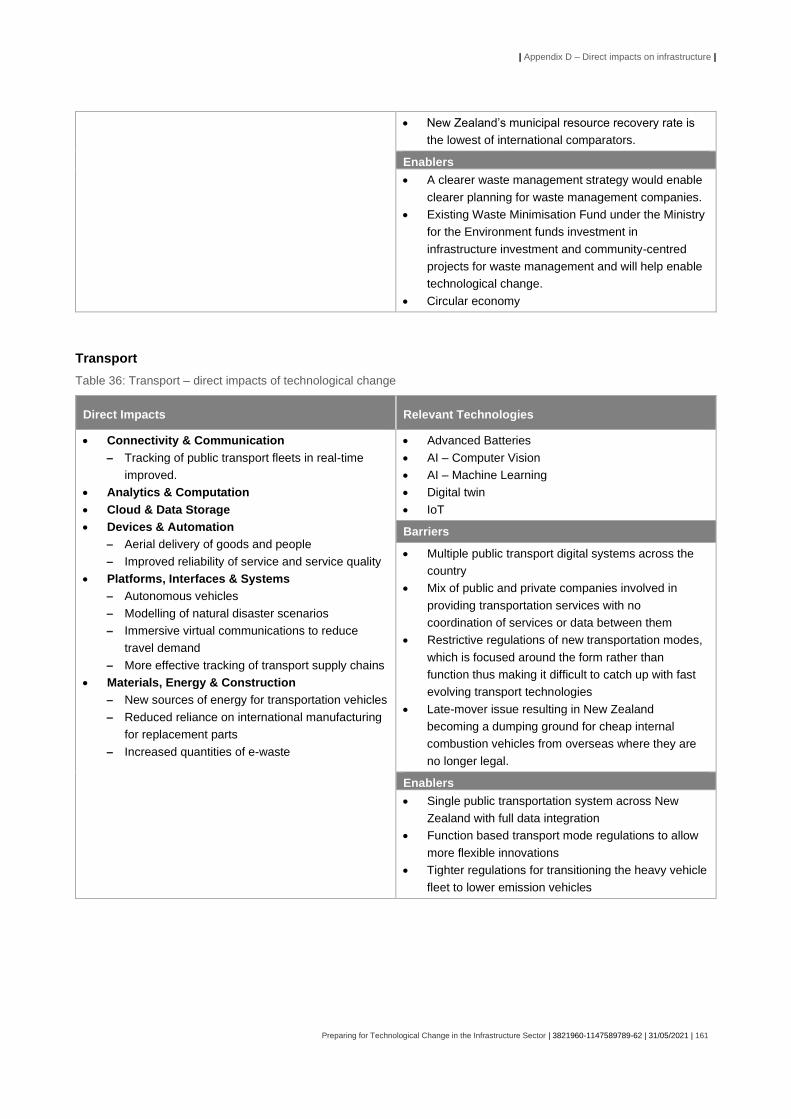
| Appendix D – Direct impacts on infrastructure |
Preparing for Technological Change in the Infrastructure Sector | 3821960-1147589789-62 | 31/05/2021 | 161
• New Zealand’s municipal resource recovery rate is
the lowest of international comparators.
Enablers
• A clearer waste management strategy would enable
clearer planning for waste management companies.
• Existing Waste Minimisation Fund under the Ministry
for the Environment funds investment in
infrastructure investment and community-centred
projects for waste management and will help enable
technological change.
• Circular economy
Transport
Table 36: Transport – direct impacts of technological change
Direct Impacts Relevant Technologies
• Connectivity & Communication
– Tracking of public transport fleets in real-time
improved.
• Analytics & Computation
• Cloud & Data Storage
• Devices & Automation
– Aerial delivery of goods and people
– Improved reliability of service and service quality
• Platforms, Interfaces & Systems
– Autonomous vehicles
– Modelling of natural disaster scenarios
– Immersive virtual communications to reduce
travel demand
– More effective tracking of transport supply chains
• Materials, Energy & Construction
– New sources of energy for transportation vehicles
– Reduced reliance on international manufacturing
for replacement parts
– Increased quantities of e-waste
• Advanced Batteries
• AI – Computer Vision
• AI – Machine Learning
• Digital twin
• IoT
Barriers
• Multiple public transport digital systems across the
country
• Mix of public and private companies involved in
providing transportation services with no
coordination of services or data between them
• Restrictive regulations of new transportation modes,
which is focused around the form rather than
function thus making it difficult to catch up with fast
evolving transport technologies
• Late-mover issue resulting in New Zealand
becoming a dumping ground for cheap internal
combustion vehicles from overseas where they are
no longer legal.
Enablers
• Single public transportation system across New
Zealand with full data integration
• Function based transport mode regulations to allow
more flexible innovations
• Tighter regulations for transitioning the heavy vehicle
fleet to lower emission vehicles

| Appendix D – Direct impacts on infrastructure |
Preparing for Technological Change in the Infrastructure Sector | 3821960-1147589789-62 | 31/05/2021 | 162
Education, Skills and Research
Table 37: Education, Skills and Research – direct impacts of technological change
Direct Impacts Relevant Technologies
• Connectivity & Communication
– Enables remote learning – reduced need for
physical learning spaces
• Analytics & Computation
– Computer capable of conducting research and
writing reports autonomously
• Cloud & Data Storage
– Cyber security risk of personal health information
• Devices & Automation
• Platforms, Interfaces & Systems
– Remote learning facilitated through new digital
learning environments
• Materials, Energy & Construction
– Quick prototyping of products to speed up
research and innovation
• AR / VR
• 5G / 6G / Li-Fi
• AI – Natural Language Processing, Machine
Learning
• IoT
Barriers
• Internet coverage in rural areas
• Skill levels of education staff in new technologies
• Social acceptance of less face-to-face education
• Inequalities of financing across schools
Enablers
• Specialised digital futures training for education staff

| Appendix D – Direct impacts on infrastructure |
Preparing for Technological Change in the Infrastructure Sector | 3821960-1147589789-62 | 31/05/2021 | 163
Health and Aged Care
Table 38: Health and Aged Care – direct impacts of technological change
Direct Impacts Relevant Technologies
• Connectivity & Communication
– Personal health tracking devices connected
directly to healthcare services
• Analytics & Computation
– Predictions of health issues based on collected
data and risk factors
– Use AI
• Cloud & Data Storage
– Potential for a nationally accessible, standardised
e-health platform stored on the cloud
– Cyber security risk of personal health information
• Devices & Automation
– Health tracking of individuals in real-time
– Automated robotic surgeries
– Health robots for managing patient care
• Platforms, Interfaces & Systems
– Reduced need to physical attendance at medical
centres – increased capacity of physical services.
• Materials, Energy & Construction
• Design and launch AI use-cases into reducing
deaths and serious injuries across infrastructure
sectors (e.g. Transport, health)
– Developing use-cases for specific sectors will
enable the benefits to be seen to encourage
additional investment and full integration.
• IoT
• Drones / Robotics
• Cloud / edge computing
• AI – Natural Language Processing, Machine
Learning
• Automation
Barriers
• No common computer operating systems across
DHBs
• Separate procurement models for each DHB need
something similar to PHARMAC.
• No nationally consistent data for national
procurement.
• Permission for increased collection and sharing of
personal health information
• Semi-private primary healthcare providers operate
with less centralised coordination
Enablers
• Single computer system behind all DHBs
• Data trust established for storing health data of
individuals

| Appendix E – Indirect Analysis |
Preparing for Technological Change in the Infrastructure Sector | 3821960-1147589789-62 | 31/05/2021 | 164
Appendix E – Indirect Analysis
Appendix E provides the support for section 0 of the report. In this appendix the four capitals of natural, human, social, and financial have been used a lens to
analyse the impact of technological change in each infrastructure sector through the lens of one emerging technology. In using a specific emerging technology
for each infrastructure sector, the indirect impacts become more tangible. A specific focus has been placed on the indirect impacts related to Te Ao Māori to
highlight the need for continuing acknowledgement of unique cultural impacts.
Table 39: Indirect Impacts - Transport
Transport &
Battery
Advances
Impact Natural Capital Human Capital Social Capital Financial / Physical Capital
Battery advances
for EV result in
significant uptake
across NZ –
Private cars /
Bikes / Mass
transport
Resulting in direct
impacts on
Transport
Infrastructure: - Additional
charging infrastructure across NZ
- Changes in modal transport infrastructure - urban
Positive All as a result of less petrol /
Diesel cars on the road, plus
increased use of e-Bike / mass
transport Positive impact on
following Living Standards
Indicators: - Air Quality
- Perceived environmental quality
- Access to the Natural Environment
Kaitiakitanga – the voice of The
Taiao is heard and
acknowledged - Cultural identity
Reduction in taking resources
from Papatūānuku – upholding
wellbeing of Papatūānuku - Perceived environmental
quality
Taha Wairua – connections
(Infrastructure through land) to
narratives and stories to
As a result of improved distances
travel possible by e-Bike &
increased mass transport options - Health status
- Unemployment / employment rate
- Youth NEET Rate
Due to less congestion /
improvement in travel time
efficiency - Leisure and personal care
- Satisfaction with Work life balance
Wellness – ability to provide
wellness for yourself – Mana
enhancing & Taha Tīnana -
Physical exercise options - Health Status
Taha Hinengaro - Mental
wellbeing through connecting with
whanau - reducing isolation from
whanau. - Mental health - Loneliness - Family wellbeing
Leveraging additional transport
options, able to connect with
family / friends
-Family Wellbeing
- General Life Satisfaction
Taha Whanau – enhanced
opportunities for community
connections and communal
living – Whanaungatanga - Social network support
- Māori connection to Marae - Family Wellbeing
Employment close to Marae
means whanau can raise
whanau on/near Marae - Employment rate - Unemployment rate
- Māori connection to Marae - Hourly earnings
Assuming battery prices fall &
cost of charging vs traditional
petrol / Diesel
-Disposable income
- Financial wellbeing
Community based business
opportunities for Local
e-biking opportunities in rural
environs - Financial wellbeing
- General life satisfaction - Access to the natural
environment
Affordability to enhance
transport options to go to rural
tours – Manaakitanga upheld - Financial wellbeing
- General life satisfaction - Access to the natural
environment

| Appendix E – Indirect Analysis |
Preparing for Technological Change in the Infrastructure Sector | 3821960-1147589789-62 | 31/05/2021 | 165
acknowledge and celebrate
Ancestral elements. - Cultural identity
Negative Will require additional material to
be mined for battery production - Perceived environmental
quality
Storage / What we do with end-
of-life batteries - Perceived environmental
quality
Mass transport options do not roll
out to rural areas, results in
movement of people from rural to
urban NZ. Inhibits whanau from
moving home to their rohe, with
many marae in rural areas.
- Census survey information
- Māori connection to Marae
Upfront capital costs for
changing to new technology –
Barrier
-Disposable income
- Financial wellbeing
Note: Items highlighted in BLUE above are all indicators which can be tracked using the Living standards indicator, or Census information.
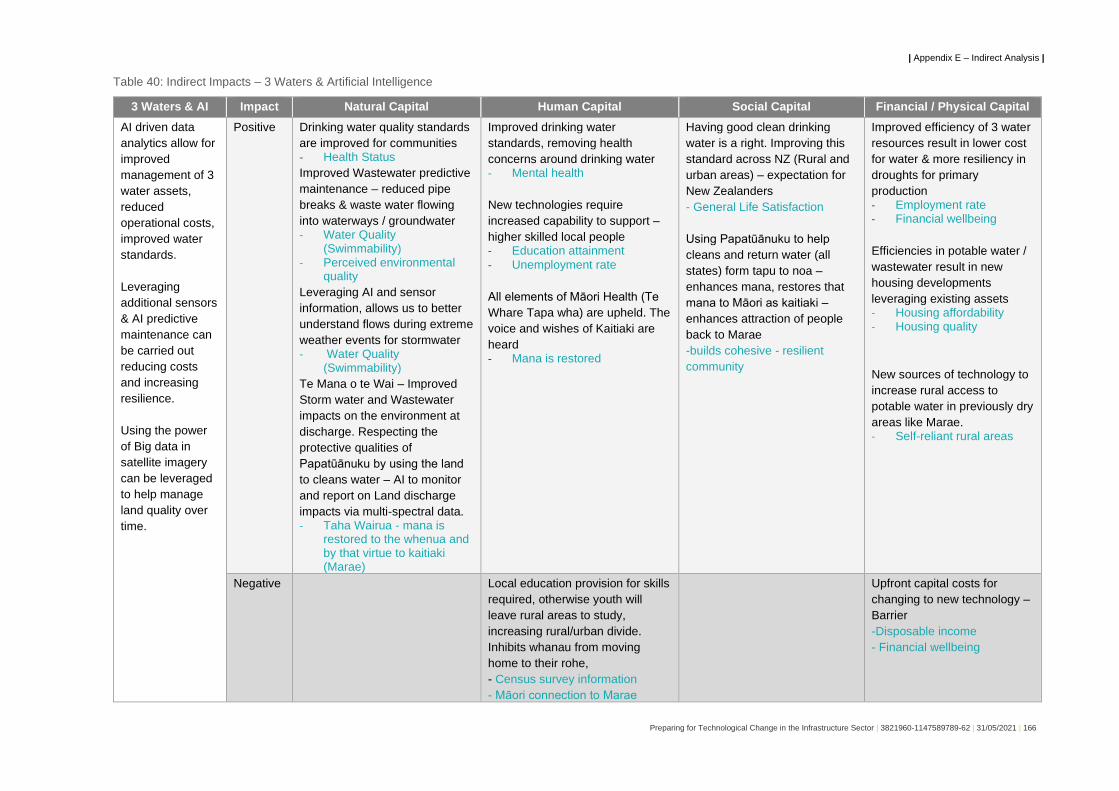
| Appendix E – Indirect Analysis |
Preparing for Technological Change in the Infrastructure Sector | 3821960-1147589789-62 | 31/05/2021 | 166
Table 40: Indirect Impacts – 3 Waters & Artificial Intelligence
3 Waters & AI Impact Natural Capital Human Capital Social Capital Financial / Physical Capital
AI driven data
analytics allow for
improved
management of 3
water assets,
reduced
operational costs,
improved water
standards.
Leveraging
additional sensors
& AI predictive
maintenance can
be carried out
reducing costs
and increasing
resilience.
Using the power
of Big data in
satellite imagery
can be leveraged
to help manage
land quality over
time.
Positive Drinking water quality standards
are improved for communities - Health Status
Improved Wastewater predictive
maintenance – reduced pipe
breaks & waste water flowing
into waterways / groundwater - Water Quality
(Swimmability) - Perceived environmental
quality
Leveraging AI and sensor
information, allows us to better
understand flows during extreme
weather events for stormwater - Water Quality
(Swimmability)
Te Mana o te Wai – Improved
Storm water and Wastewater
impacts on the environment at
discharge. Respecting the
protective qualities of
Papatūānuku by using the land
to cleans water – AI to monitor
and report on Land discharge
impacts via multi-spectral data. - Taha Wairua - mana is
restored to the whenua and by that virtue to kaitiaki (Marae)
Improved drinking water
standards, removing health
concerns around drinking water - Mental health
New technologies require
increased capability to support –
higher skilled local people - Education attainment
- Unemployment rate
All elements of Māori Health (Te
Whare Tapa wha) are upheld. The
voice and wishes of Kaitiaki are
heard - Mana is restored
Having good clean drinking
water is a right. Improving this
standard across NZ (Rural and
urban areas) – expectation for
New Zealanders
- General Life Satisfaction
Using Papatūānuku to help
cleans and return water (all
states) form tapu to noa –
enhances mana, restores that
mana to Māori as kaitiaki –
enhances attraction of people
back to Marae
-builds cohesive - resilient
community
Improved efficiency of 3 water
resources result in lower cost
for water & more resiliency in
droughts for primary
production - Employment rate - Financial wellbeing
Efficiencies in potable water /
wastewater result in new
housing developments
leveraging existing assets - Housing affordability - Housing quality
New sources of technology to
increase rural access to
potable water in previously dry
areas like Marae. - Self-reliant rural areas
Negative Local education provision for skills
required, otherwise youth will
leave rural areas to study,
increasing rural/urban divide.
Inhibits whanau from moving
home to their rohe,
- Census survey information
- Māori connection to Marae
Upfront capital costs for
changing to new technology –
Barrier
-Disposable income
- Financial wellbeing
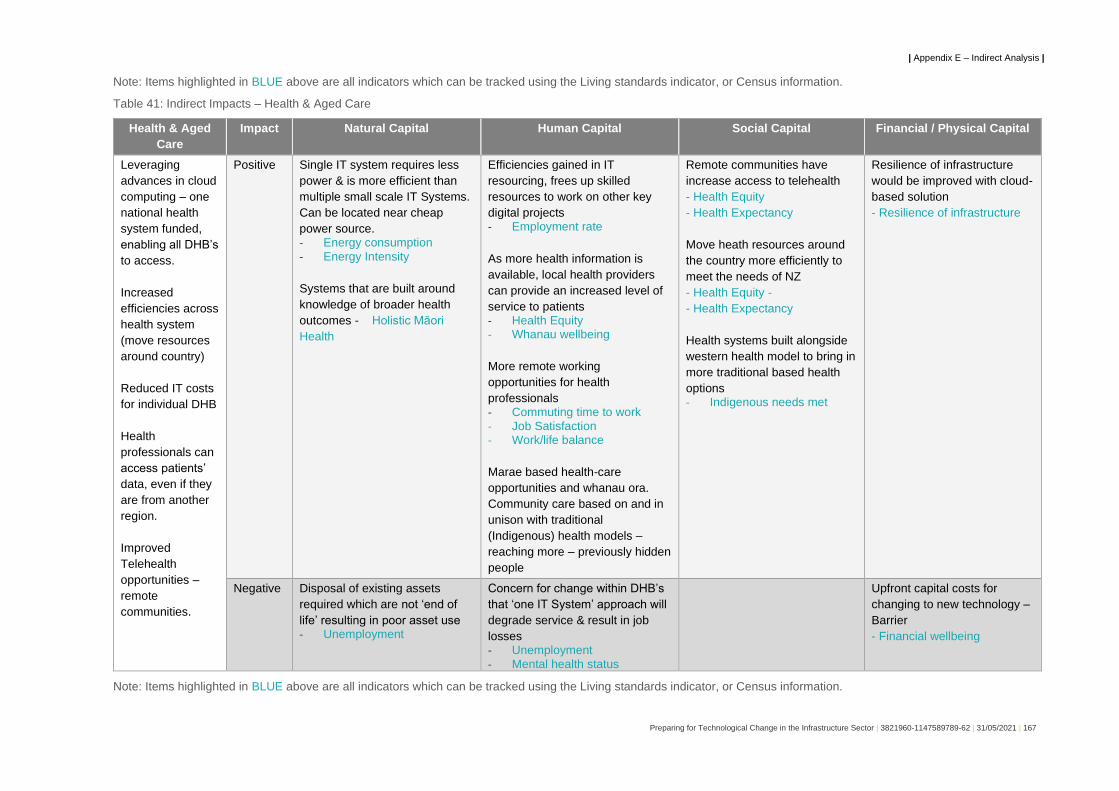
| Appendix E – Indirect Analysis |
Preparing for Technological Change in the Infrastructure Sector | 3821960-1147589789-62 | 31/05/2021 | 167
Note: Items highlighted in BLUE above are all indicators which can be tracked using the Living standards indicator, or Census information.
Table 41: Indirect Impacts – Health & Aged Care
Health & Aged
Care
Impact Natural Capital Human Capital Social Capital Financial / Physical Capital
Leveraging
advances in cloud
computing – one
national health
system funded,
enabling all DHB’s
to access.
Increased
efficiencies across
health system
(move resources
around country)
Reduced IT costs
for individual DHB
Health
professionals can
access patients’
data, even if they
are from another
region.
Improved
Telehealth
opportunities –
remote
communities.
Positive Single IT system requires less
power & is more efficient than
multiple small scale IT Systems.
Can be located near cheap
power source. - Energy consumption
- Energy Intensity
Systems that are built around
knowledge of broader health
outcomes - Holistic Māori
Health
Efficiencies gained in IT
resourcing, frees up skilled
resources to work on other key
digital projects - Employment rate
As more health information is
available, local health providers
can provide an increased level of
service to patients - Health Equity - Whanau wellbeing
More remote working
opportunities for health
professionals - Commuting time to work
- Job Satisfaction - Work/life balance
Marae based health-care
opportunities and whanau ora.
Community care based on and in
unison with traditional
(Indigenous) health models –
reaching more – previously hidden
people
Remote communities have
increase access to telehealth
- Health Equity
- Health Expectancy
Move heath resources around
the country more efficiently to
meet the needs of NZ
- Health Equity -
- Health Expectancy
Health systems built alongside
western health model to bring in
more traditional based health
options - Indigenous needs met
Resilience of infrastructure
would be improved with cloud-
based solution
- Resilience of infrastructure
Negative Disposal of existing assets
required which are not ‘end of
life’ resulting in poor asset use - Unemployment
Concern for change within DHB’s
that ‘one IT System’ approach will
degrade service & result in job
losses - Unemployment
- Mental health status
Upfront capital costs for
changing to new technology –
Barrier
- Financial wellbeing
Note: Items highlighted in BLUE above are all indicators which can be tracked using the Living standards indicator, or Census information.
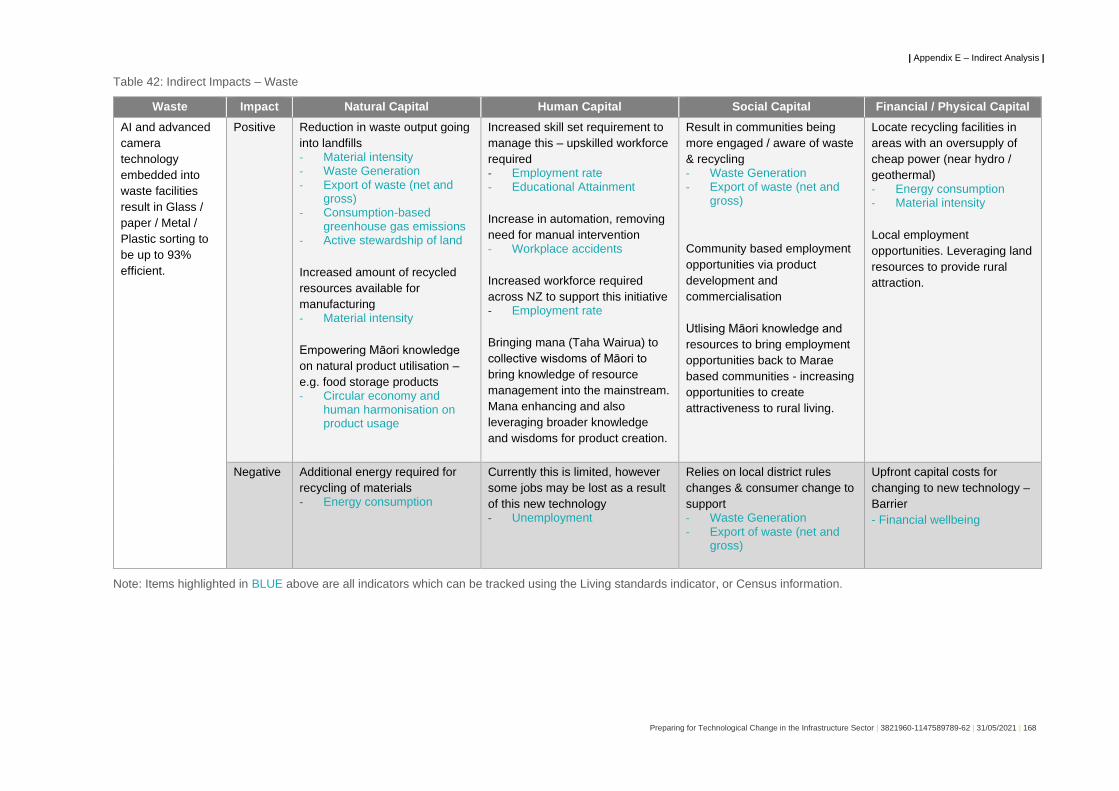
| Appendix E – Indirect Analysis |
Preparing for Technological Change in the Infrastructure Sector | 3821960-1147589789-62 | 31/05/2021 | 168
Table 42: Indirect Impacts – Waste
Waste Impact Natural Capital Human Capital Social Capital Financial / Physical Capital
AI and advanced
camera
technology
embedded into
waste facilities
result in Glass /
paper / Metal /
Plastic sorting to
be up to 93%
efficient.
Positive Reduction in waste output going
into landfills - Material intensity - Waste Generation
- Export of waste (net and gross)
- Consumption-based greenhouse gas emissions
- Active stewardship of land
Increased amount of recycled
resources available for
manufacturing - Material intensity
Empowering Māori knowledge
on natural product utilisation –
e.g. food storage products - Circular economy and
human harmonisation on product usage
Increased skill set requirement to
manage this – upskilled workforce
required - Employment rate - Educational Attainment
Increase in automation, removing
need for manual intervention - Workplace accidents
Increased workforce required
across NZ to support this initiative - Employment rate
Bringing mana (Taha Wairua) to
collective wisdoms of Māori to
bring knowledge of resource
management into the mainstream.
Mana enhancing and also
leveraging broader knowledge
and wisdoms for product creation.
Result in communities being
more engaged / aware of waste
& recycling - Waste Generation - Export of waste (net and
gross)
Community based employment
opportunities via product
development and
commercialisation
Utlising Māori knowledge and
resources to bring employment
opportunities back to Marae
based communities - increasing
opportunities to create
attractiveness to rural living.
Locate recycling facilities in
areas with an oversupply of
cheap power (near hydro /
geothermal) - Energy consumption - Material intensity
Local employment
opportunities. Leveraging land
resources to provide rural
attraction.
Negative Additional energy required for
recycling of materials - Energy consumption
Currently this is limited, however
some jobs may be lost as a result
of this new technology - Unemployment
Relies on local district rules
changes & consumer change to
support - Waste Generation
- Export of waste (net and gross)
Upfront capital costs for
changing to new technology –
Barrier
- Financial wellbeing
Note: Items highlighted in BLUE above are all indicators which can be tracked using the Living standards indicator, or Census information.

| Appendix E – Indirect Analysis |
Preparing for Technological Change in the Infrastructure Sector | 3821960-1147589789-62 | 31/05/2021 | 169
Table 43: Indirect Impacts - Energy
Energy Impact Natural Capital Human Capital Social Capital Financial / Physical Capital
Increase in solar
technology and
battery technology
result in
significant uptake
of these
technologies in
new home
buildings &
refurbishments
Leveraging
blockchain
technologies,
power generated
at homes can be
sold back into the
grid.
Positive Reduction of demand on
traditional fossil fuels (Oil / Gas) - Gross greenhouse gas
emissions
- Waste Generation - Energy intensity - Renewables energy
- Level of pollutants: NO2
Utlising Land and Te Taiao
based resources – Solar, Hydro,
wind etc. to provide energy to
outlying parts of the network that
are expensive to supply
Increased skill set requirement to
manage this – upskilled workforce
required - Employment rate - Educational Attainment
Looking for opportunities to create
self-reliant communities.
Increased ability for rural
communities (Marae etc) to
function efficiently (and cheaply)
with self-produced power.
Lower cost for heating healthy
home - Low income - Heath expectancy
- Experienced wellbeing - Housing quality - Whanau wellbeing
- Income adequacy
Rural based Marae and hapū
plus Urban ones function on a
community workforce who all
have day jobs – revenue
opportunities to Marae are few
and far between. Lowering cost
creates resilience.
Improved resiliency during
extreme weather events - Costs of extreme weather
events
- Resilience of infrastructure
Can deploy technologies to
core assets which would
normally require back up
power – especially in remote
locations - GDP
Negative
Due to up front capital costs –
results in a larger divide
between those who have the
means to install & those who do
not - Health equity
Upfront capital costs for
changing to new technology –
Barrier
- Financial wellbeing
Note: Items highlighted in BLUE above are all indicators which can be tracked using the Living standards indicator, or Census information.
Table 44: Indirect Impacts – Telecommunications
Telecommunications Impact Natural Capital Human Capital Social Capital Financial / Physical Capital
Rollout of 5G
technologies result in
significant
telecommunication
speeds increases (from
2-4Mb mobile upload to
200-500Mb
upload/download)
Positive Increased environmental
monitoring (soil/water) through
IoT / Other sensors available –
live - Soil health - Access to safe water for
recreation and food gathering
- Active stewardship of land
Increased skill set requirement
to manage this – upskilled
workforce required - Employment rate - Educational Attainment
Employment close to Marae
means whanau can raise
whanau on/near Marae - Employment rate - Unemployment rate
- Māori connection to Marae
- Hourly earnings - Work/life balance
Efficiency of factories
improved, leveraging
additional data that can be
collected in real time - GDP

| Appendix E – Indirect Analysis |
Preparing for Technological Change in the Infrastructure Sector | 3821960-1147589789-62 | 31/05/2021 | 170
Innovation occur across
NZ, leveraging these
technologies
Increase primary production
efficiency using digital
technology – Orchards / farms - GDP
Leveraging technologies to
transcend generational
knowledge sharing - shifting
the paradigm for Mātauranga
to be passed via whakapapa
Access to big data and
platforms to share knowledge
on the natural environment to
utilise to address
Environmental issues.
Leverage of huge amounts of
knowledge and skills in the
Māori economy based on data
and knowledge to benefit and
sustain Te Taiao (including
Humans within Te Taiao)
Remote communities have
increase access to telehealth
- Health Equity
- Health Expectancy
Increased access to fast
internet access in rural areas
- Early childhood education
participation - Employment rate - Hourly earnings - Underutilisation
Marae managed outcomes for
Te Taiao positively impact on
overall wellbeing.
Non-Marae based Māori grow
opportunities to contribute to
overall outcomes (Matawaka)
Leverage of Mātauranga is a
powerful new data band to
contribute to the whole
economy for social uplifting.
Efficiencies of outcomes in
general improved through
faster access to broader
data and information
Negative
Costs to access 5G is
prohibitive for lower socio-
economic groups – reinforcing
digital divide
- Child poverty
- Low income
- Life satisfaction
- Hope for the future
Access to 5G focused on
urban areas, resulting in a
great urban/rural divide - Early childhood
education participation - Employment rate
- Hourly earnings - Underutilisation
Note: Items highlighted in BLUE above are all indicators which can be tracked using the Living standards indicator, or Census information.

| Appendix E – Indirect Analysis |
Preparing for Technological Change in the Infrastructure Sector | 3821960-1147589789-62 | 31/05/2021 | 171
References
“2020/21 Statement of Performance Expectations.” Auckland District Health Board, August 15, 2020.
https://www.adhb.health.nz/assets/Documents/About-Us/ADHB-SPE-2020-21_FINAL.pdf.
“5G Is Live.” Accessed March 9, 2021. https://www.vodafone.co.nz/5g/.
“A Mission-Oriented UK Industrial Strategy”, Institute for Innovation and Public Purpose, May 22 2019,
https://www.ucl.ac.uk/bartlett/public-purpose/publications/2019/may/mission-oriented-uk-industrial-strategy
“About Infrastructure Canada”, last modified September 6, 2019, https://www.infrastructure.gc.ca/about-apropos/index-eng.html#1.2
“Artificial Intelligence for Health in New Zealand.” Artificial Intelligence Forum of New Zealand, October 21, 2019.
https://aiforum.org.nz/wp-content/uploads/2019/10/AI-For-Health-in-New-Zealand.pdf.
“Automation of the Buda Castle Complex.” Honeywell Building Solutions, 2019. https://buildings.honeywell.com/content/dam/honeywell-
building-technology/en-us/documents/Buda%20Castle_CS.pdf.
“Blockchain-Technologies-as-a-Digital-Enabler-for-Sustainable-Infrastructure-Key-Findings.pdf,” n.d.
https://www.oecd.org/finance/Blockchain-technologies-as-a-digital-enabler-for-sustainable-infrastructure-key-findings.pdf.
“Building Better Cities with Civic Technology.” Accessed February 19, 2021. https://datasmart.ash.harvard.edu/news/article/building-
better-cities-civic-technology.
“Business Information and Communication Technology (ICT) Use and Productivity Growth in New Zealand.” Ministry of Business,
Innovation & Employment, October 2017. https://www.mbie.govt.nz/dmsdocument/3338-business-ict-use-and-productivity-growth-pdf.
“Canada Infrastructure Bank Overview”, last modified March 2 2021, https://www.infrastructure.gc.ca/CIB-BIC/index-eng.html#about
“Code of Practice for Land Development and Subdivision: Chapter 4 – Stormwater.” Auckland Council, November 1, 2015.
http://content.aucklanddesignmanual.co.nz/regulations/codes-of-practice/Documents/Stormwater%20Code%20of%20Practice.pdf.
“Construction Industry Transformation MAP”, October 2017, https://www.mti.gov.sg/-/media/MTI/ITM/Built-
Environment/Construction/Construction-ITM-Factsheet.pdf
“Construction Sector Accord”, New Zealand Government, April 2019, https://www.constructionaccord.nz/assets/Construction-
Accord/files/0930eac2bb/construction-sector-accord.pdf
“Creating Value Through Procurement”, Infrastructure New Zealand, August 2018,
https://infrastructure.org.nz/resources/Documents/Reports/Infrastructure%20NZ%20Procurement%20Study%20Report%20FINAL.pdf
“Data trusts in 2020”, Open Data Institute, March 17, 2020, https://theodi.org/article/data-trusts-in-2020/
“Digital Technologies Industry Transformation Plan”, Ministry of Business, Innovation and Enterprise,
https://www.mbie.govt.nz/dmsdocument/11638-digital-technologies-industry-transformation-plan
“Disruptive Technologies Innovation Fund”, Department of Enterprise, Trade, and Employment, https://enterprise.gov.ie/en/What-We-
Do/Innovation-Research-Development/Disruptive-Technologies-Innovation-Fund/
“e-Estonia” e-Estonia Briefing Centre, https://e-estonia.com/
“Electricity Price Review: Final Report.” Ministry of Business, Innovation and Employment, May 21, 2019.
https://www.mbie.govt.nz/assets/electricity-price-review-final-report.pdf.
“Electrification Roadmap.” Accessed March 16, 2021. https://www.transpower.co.nz/about-us/transmission-tomorrow/electrification-
roadmap.
| Appendix E – Indirect Analysis |
Preparing for Technological Change in the Infrastructure Sector | 3821960-1147589789-62 | 31/05/2021 | 172
“Emerging Technology: Six Trends Changing Our World (Infographic),” February 4, 2020.
https://www.digitalpulse.pwc.com.au/infographic-six-emerging-technology-trends/.
“Energy in New Zealand 2020.” Ministry of Business, Innovation & Employment, August 2020.
https://www.mbie.govt.nz/dmsdocument/11679-energy-in-new-zealand-2020.
“Executive Summary” Draft Advice for Consultation, Climate Change Commission, 2021 https://ccc-production-media.s3.ap-southeast-
2.amazonaws.com/public/Executive-Summary-advice-report-v3.pdf
“Global Innovation Index” https://www.globalinnovationindex.org/analysis-indicator
“Governing for the Future” NZ Climate Change Research Institute, November 17, 2015 https://www.wgtn.ac.nz/sgees/research-
centres/ccri/events/events-slides/Jonathan-Boston-Seminar-17-Nov-2015.pdf
“Hamilton City Council Wastewater Treatment Plant.” BIMinNZ, November 14, 2019.
https://static1.squarespace.com/static/57390d2c8259b53089bcf066/t/5dcc666cbaf993448ffa4356/1573676653716/12+BIMinNZ+Waste
Water+2019+05.pdf.
“Health and Disability System Review: Final Report / Pūrongo Whakamutunga.” Health and Disability System Review, March 2020.
https://systemreview.health.govt.nz/assets/Uploads/hdsr/health-disability-system-review-final-report.pdf.
“How Blockchain Will Change Construction.” Harvard Business Review, July 26, 2019. https://hbr.org/2019/07/how-blockchain-will-
change-construction.
“Indicators Aotearoa New Zealand”, Statistics New Zealand, https://wellbeingindicators.stats.govt.nz/en/aligning-with-sustainable-
development-goals/
“Infrastructure and Projects Authority Mandate”, HM Treasury, Cabinet Office, January 2021,
https://assets.publishing.service.gov.uk/government/uploads/system/uploads/attachment_data/file/949868/IPA_Mandate_2021.pdf
“Living Standards Framework”, The Treasury, https://lsfdashboard.treasury.govt.nz/wellbeing/
“Looking Smart: Augmented Reality Is Seeing Real Results In Industry.” Accessed March 9, 2021.
https://www.ge.com/news/reports/looking-smart-augmented-reality-seeing-real-results-industry-today.
“Low-Emissions Economy: Issues Paper.” The New Zealand Productivity Commission, August 2017.
https://www.productivity.govt.nz/assets/Documents/50449807ff/Low-emissions-economy-issues-paper.pdf.
“Low-emissions economy”, NZ Productivity Commission, August 2018
https://www.productivity.govt.nz/assets/Documents/lowemissions/4e01d69a83/Productivity-Commission_Low-emissions-
economy_Final-Report_FINAL_2.pdf
“National Infrastructure Assessment”, UK National Infrastructure Commission, July 2018
https://nic.org.uk/app/uploads/CCS001_CCS0618917350-001_NIC-NIA_Accessible-1.pdf
“National Infrastructure Strategy”, HM Treasury, November 2020,
https://assets.publishing.service.gov.uk/government/uploads/system/uploads/attachment_data/file/938539/NIS_Report_Web_Accessibl
e.pdf
“National Waste Data Framework - Standard Reporting Indicators for Territorial Authorities.” WasteMINZ, 2015.
http://www.wasteminz.org.nz/wp-content/uploads/2018/04/National-Waste-Data-Framework-Standard-Reporting-Indicators-Final.pdf.
“Optimized Airplane Seat Design Using 3D-Printing.” Accessed February 19, 2021.
https://www.autodesk.com/campaigns/additive/airplane-seat.
“Our Living Standards Framework”, The Treasury, December 12, 2019, https://www.treasury.govt.nz/information-and-services/nz-
economy/higher-living-standards/our-living-standards-framework
| Appendix E – Indirect Analysis |
Preparing for Technological Change in the Infrastructure Sector | 3821960-1147589789-62 | 31/05/2021 | 173
“President Tsai attends Microsoft’s announcement of investment in Taiwan”, Office of the President, October 26, 2020
https://digi.taiwan.gov.tw/news/president-tsai-attends-microsofts-announcement-of-investment-in-taiwan-press-conference/
“Second Stage of the Act on Transport Services encompasses the whole transport system” Ministry of Transport and Communication,
October 19, 2017, https://www.lvm.fi/en/-/second-stage-of-the-act-on-transport-services-encompasses-the-whole-transport-system-
955021
“Sector State of Play: Water.” New Zealand Infrastructure Commission Te Waihanga, 2021.
https://infracom.govt.nz/assets/Uploads/State-of-Play-Water.pdf.
“Security and Reliability Issues Paper.” Gas Industry Company, April 2016. https://www.gasindustry.co.nz/work-programmes/pipeline-
security-and-reliability/background/gas-transmission-security-and-reliablity-issues-paper/document/5345.
“Singapore Experiments with Its Digital Twin to Improve City Life,” May 20, 2019. https://www.smartcitylab.com/blog/digital-
transformation/singapore-experiments-with-its-digital-twin-to-improve-city-life/.
“Special Act for Forward-Looking Infrastructure”, July 7 2017, https://theme.ndc.gov.tw/lawout/EngLawContent.aspx?lan=E&id=55&KW=
前瞻
“Sustainability and the Health Sector: A Guide to Getting Started.” Wellington: Ministry of Health, July 2019.
https://www.health.govt.nz/system/files/documents/publications/sustainability-and-the-health-sector-30jul2019_1.pdf.
“TCF Annual Report 2019.” New Zealand Telecommunications Forum, 2019.
https://www.tcf.org.nz/industry/resources/publications/reports/2019-tcf-annual-report.pdf.
“Te Rautaki Rawa Kura 2030 NZ School Property Strategy 2030.” Ministry of Education, June 2020.
https://www.education.govt.nz/assets/Documents/Ministry/Strategies-and-policies/MOE-Te-Rautaki-Rawa-Kura-The-School-Property-
Strategy-2030.pdf.
“The Age of Missions”, Inter-American Development Bank, 2020 https://publications.iadb.org/publications/english/document/The-Age-of-
Missions-Addressing-Societal-Challenges-Through-Mission-Oriented-Innovation-Policies-in-Latin-America-and-the-Caribbean.pdf
“The Digital Divides Persist in New Zealand,” October 6, 2015. https://www.wgtn.ac.nz/sog/about/news/news-archives/2015-news/the-
digital-divides-persist-in-new-zealand.
“The Grand Challenges”, Department for Business, Energy & Industrial Strategy, last modified January 26 2021,
https://www.gov.uk/government/publications/industrial-strategy-the-grand-challenges/industrial-strategy-the-grand-challenges
“The IMD World Digital Competitiveness Ranking 2020 results”, IMD World Competitiveness Centre, https://www.imd.org/wcc/world-
competitiveness-center-rankings/world-digital-competitiveness-rankings-2020/
“The Ministry”, Ministry of Transport and Communication, https://www.lvm.fi/en/the-ministry
“The National Asset Management Programme for District Health Boards.” Wellington: Ministry of Health, June 2020.
https://www.health.govt.nz/system/files/documents/publications/national-asset-management-programme-district-health-boards-report-
current-state-assessment9june2020.pdf.
“The Treaty of the Functioning European Union”, l Article 170, Trans-European Networks, October 26 2012 https://eur-
lex.europa.eu/legal-content/EN/TXT/HTML/?uri=CELEX:12012E/TXT&from=EN
“The World Factbook”, last modified April 20, 2021 https://www.cia.gov/the-world-factbook/countries/finland/
“UFB Maps.” Accessed March 16, 2021. https://ufb.org.nz/maps/.
“Unlocking Our Energy Productivity and.” Ministry of Business, Innovation & Employment, June 2017.
https://www.mbie.govt.nz/dmsdocument/140-nzeecs-2017-2022-pdf.
| Appendix E – Indirect Analysis |
Preparing for Technological Change in the Infrastructure Sector | 3821960-1147589789-62 | 31/05/2021 | 174
“Unlocking the Value of Data: Managing New Zealand’s Interconnected Infrastructure.” Infrastructure New Zealand, May 2020.
https://infrastructure.org.nz/resources/Documents/Reports/Infrastructure%20NZ%20Unlocking%20the%20Value%20of%20Data%20Re
port.pdf.
“Water New Zealand.” Accessed March 16, 2021. https://www.waternz.org.nz/servicecoverage.
“What If Saving Water Became a Game?” Accessed February 18, 2021. https://www.suezsmartsolutions.com/en/blog/what-if-saving-
water-became-a-game.
“What Is Nanotechnology and What Can It Do?,” March 5, 2005. https://www.azonano.com/article.aspx?ArticleID=1134.
“What to Know About Cryptocurrency,” October 19, 2018. https://www.consumer.ftc.gov/articles/what-know-about-cryptocurrency.
“What we do”, Infrastructure Australia, https://www.infrastructureaustralia.gov.au/
“Why We Exist - Infrastructure Partnerships Australia,” September 13, 2016. https://infrastructure.org.au/why-we-exist/.
A, Barker, (2017) Improving Productivity in New Zealand’s Economy, New Zealand Productivity Commission
Account, Superuser. “Health Information Standards Organisation - HISO 10029 Health Information Security Framework.” New Zealand
Nurses Organisation, August 10, 2015. https://www.nzno.org.nz/get_involved/consultation/artmid/4775/articleid/1393/health-information-
standards-organisation---hiso-10029-health-information-security-framework.
Agarwal, Rajat, Shankar Chandrasekaran, and Mukund Sridhar. “Imagining Construction’s Digital Future.” McKinsey & Company, June
22, 2016. https://www.mckinsey.com/business-functions/operations/our-insights/imagining-constructions-digital-future.
Arup. “Emerging Technology Timeline.” Arup, 2017.
Bahrke, Johannes, and Charles Manoury. “Europe Fit for the Digital Age: Commission Proposes New Rules and Actions for Excellence
and Trust in Artificial Intelligence.” European Commission, April 21, 2021.
https://ec.europa.eu/commission/presscorner/detail/en/IP_21_1682.
Barbosa, Filipe, Jonathan Woetzel, Jan Mischke, Maria João Ribeirinho, Mukund Sridhar, Matthew Parsons, Nick Bertram, and
Stephanie Brown. “Reinventing Construction: A Route to Higher Productivity.” McKinsey Global Institute, February 2017.
https://www.mckinsey.com/~/media/McKinsey/Business%20Functions/Operations/Our%20Insights/Reinventing%20construction%20thro
ugh%20a%20productivity%20revolution/MGI-Reinventing-Construction-Executive-summary.pdf.
Bestsennyy, Oleg, Greg Gilbert, Alex Harris, and Jennifer Rost. “Telehealth: A Quarter-Trillion-Dollar Post-COVID-19 Reality?”
McKinsey & Company. McKinsey & Company, May 28, 2020. https://www.mckinsey.com/industries/healthcare-systems-and-
services/our-insights/telehealth-a-quarter-trillion-dollar-post-covid-19-reality.
Bolton, Alexandra, Lorraine Butler, Ian Dabson, Mark Enzer, Matthew Evans, Tim Fenemore, Fergus Harradence, et al. “Gemini
Principles.” Apollo - University of Cambridge Repository, 2018. https://doi.org/10.17863/CAM.32260.
Brossard, Mickael, Giacomo Gatto, Alessandro Gentile, Tom Merle, and Chris Wlezien. “How Generative Design Could Reshape the
Future of Product Development.” McKinsey & Company, February 5, 2020. https://www.mckinsey.com/business-
functions/operations/our-insights/how-generative-design-could-reshape-the-future-of-product-development.
Cearley, Analyst :. David, Nick Jones, David Smith, Brian Burke, Arun Chandrasekaran, and C. K. Lu. “Top 10 Strategic Technology
Trends for 2020.” Accessed February 17, 2021. https://emtemp.gcom.cloud/ngw/globalassets/en/doc/documents/432920-top-10-
strategic-technology-trends-for-2020.pdf.
Center for Devices, and Radiological Health. “What Is Digital Health?” US Food and Drug Administration, September 22, 2020.
https://www.fda.gov/medical-devices/digital-health-center-excellence/what-digital-health.
Changali, Sriram, Azam Mohammad, and Mark van Nieuwland. “The Construction Productivity Imperative.” McKinsey Productivity
Sciences Center, June 2015.

| Appendix E – Indirect Analysis |
Preparing for Technological Change in the Infrastructure Sector | 3821960-1147589789-62 | 31/05/2021 | 175
City of Wanneroo. “New Building Approvals Program to Cut Red Tape.” City of Wanneroo, February 18, 2021.
https://www.wanneroo.wa.gov.au/news/article/1255/new_building_approvals_program_to_cut_red_tape.
Conca, James. “Energy’s Future - Battery and Storage Technologies.” Forbes Magazine, August 26, 2019.
https://www.forbes.com/sites/jamesconca/2019/08/26/energys-future-battery-and-storage-technologies/?sh=56c408444cf1.
Costa, Bernardo, Aiko Bernardes, Julia Pereira, Vitoria Zampa, Vitoria Pereira, Guilherme Matos, Eduardo Soares, Claiton Soares, and
Alexandre Silva. “Artificial Intelligence in Automated Sorting in Trash Recycling,” 198–205, 2018.
D’mello, Anasia. “5 Challenges Still Facing the Internet of Things,” June 3, 2020. https://www.iot-now.com/2020/06/03/103228-5-
challenges-still-facing-the-internet-of-things/.
Dalton, Jeremy, and Jonathan Gillham. “Seeing Is Believing.” PricewaterhouseCoopers, 2019.
https://www.pwc.com/gx/en/technology/publications/assets/how-virtual-reality-and-augmented-reality.pdf.
Data61. “Digital Twins at CSIRO’s Data61.” Accessed April 7, 2021. https://data61.csiro.au/en/Our-Research/Our-Work/Future-
Cities/NSW-Digital-Twin/NSW-Digital-Twin.
Davis, Steve, Henri Arslanian, Dick Fong, Andrew Watkins, William Gee, and Chun Yin Cheung. “PwC’s Global Blockchain Survey
2018.” PwC, 2018. https://www.pwccn.com/en/research-and-insights/publications/global-blockchain-survey-2018/global-blockchain-
survey-2018-report.pdf.
De Fauw, Jeffrey, Joseph R. Ledsam, Bernardino Romera-Paredes, Stanislav Nikolov, Nenad Tomasev, Sam Blackwell, Harry Askham,
et al. “Clinically Applicable Deep Learning for Diagnosis and Referral in Retinal Disease.” Nature Medicine 24, no. 9 (September 2018):
1342–50.
DIA, and MBIE. “Digital New Zealanders: The Pulse of Our Nation,” May 2017. https://www.mbie.govt.nz/dmsdocument/3228-digital-
new-zealanders-the-pulse-of-our-nation-pdf.
Dimyadi, Johannes, Geoff Thomas, and Robert Amor. “Enabling Automated Compliance Audit of Architectural Designs.” In Back to the
Future: The next 50 Years. Accessed February 22, 2021. https://www.researchgate.net/profile/Johannes-
Dimyadi/publication/320935659_Enabling_Automated_Compliance_Audit_of_Architectural_Designs/links/5a1dfe34a6fdccc6b7f86008/E
nabling-Automated-Compliance-Audit-of-Architectural-Designs.pdf.
Ebert, Michael, and Greg Bell. “Health Care and Cyber Security.” KPMG, 2015.
https://assets.kpmg/content/dam/kpmg/pdf/2015/09/cyber-health-care-survey-kpmg-2015.pdf.
Education Counts. “Ministry of Education - Education Counts.” Education Counts. Ministry of Education, September 9, 2020.
http://educationcounts.govt.nz.
EECA. “Energy End Use Database.” Accessed March 16, 2021. https://tools.eeca.govt.nz/energy-end-use-database/.
Evans, Simon, Cristina Savian, Allan Burns, and Chris Cooper. “Digital Twins for the Built Environment.” The Institution of Engineering
and Technology, October 17, 2019. https://www.snclavalin.com/~/media/Files/S/SNC-Lavalin/download-centre/en/report/digital-twins-
for-built-environment-report.pdf%20.
Furlonger, David, and Christophe Uzureau. “The Real Business of Blockchain.” Gartner, 2019.
https://emtemp.gcom.cloud/ngw/globalassets/en/publications/documents/the-real-business-of-blockchain-chapter-1.pdf.
Garbade, Michael J., and Michael J. Garbade. “A Simple Introduction to Natural Language Processing.” Becoming Human: Artificial
Intelligence Magazine, October 15, 2018. https://becominghuman.ai/a-simple-introduction-to-natural-language-processing-
ea66a1747b32.
Gartner. “Emerging Technology Roadmap for Large Enterprises.” Gartner, 2020. https://www.gartner.com/en/doc/2020-2022-emerging-
technology-roadmap-for-large-enterprises.
Global Infrastructure Hub. “InfraTech Stock Take of Use Cases.” Global Infrastructure Hub, July 2020.

| Appendix E – Indirect Analysis |
Preparing for Technological Change in the Infrastructure Sector | 3821960-1147589789-62 | 31/05/2021 | 176
Goasduff, Laurence. “2 Megatrends Dominate the Gartner Hype Cycle for Artificial Intelligence, 2020.” Accessed February 18, 2021.
https://www.gartner.com/smarterwithgartner/2-megatrends-dominate-the-gartner-hype-cycle-for-artificial-intelligence-2020/.
Goh, Gabey. “Building Singapore’s ‘digital Twin.’” Digital News Asia, July 20, 2015. https://www.digitalnewsasia.com/digital-
economy/building-singapores-digital-twin.
Government Communications Security Bureau. “Government Communications Security Bureau Te Tira Tiaki.” Government
Communications Security Bureau, June 30, 2019. https://www.gcsb.govt.nz/assets/GCSB-Annual-Reports/GCSB-Annual-Report-
2019.pdf.
GovTech Singapore. “5 Things to Know about Virtual Singapore,” March 28, 2017. https://www.tech.gov.sg/media/technews/5-things-to-
know-about-virtual-singapore.
Grieves, Michael. “Virtually Intelligent Product Systems: Digital and Physical Twins.” In Complex Systems Engineering: Theory and
Practice, 175–200. American Institute of Aeronautics and Astronautics, 2019.
Hardinges, Jack, Peter Wells, Alex Blandford, Jeni Tennison, and Anna Scott. “Data Trusts: Lessons from Three Pilots.” Open Data
Institute, April 2019. https://docs.google.com/document/d/118RqyUAWP3WIyyCO4iLUT3oOobnYJGibEhspr2v87jg/edit?usp=sharing.
Hindle, Sarah, and Graham Muller. “Digital Skills For Our Digital Future.” New Zealand Digital Skills Forum, January 25, 2021.
https://nztech.org.nz/wp-content/uploads/sites/8/2021/01/Digital-Skills-Aotearoa-Report-2021_online.pdf.
Hutchinson, Frederick. “A Literature Review of Modern Ambient Intelligence in Smarthomes.” University of Auckland, Abgerufen Am 17
(2016): 2014.
IBM Cloud Education. “What Is Machine Learning?” Accessed March 1, 2021. https://www.ibm.com/cloud/learn/machine-learning.
IBM. “What Is Automation?” Accessed March 16, 2021. https://www.ibm.com/topics/automation.
Independent Review of the Open Data Programme, 2020, https://www.data.govt.nz/assets/ODP/Independent-review-of-the-Open-Data-
Programme-November-2020.pdf
Infrastructure New Zealand. “Infrastructure as Strategy Report.” Infrastructure New Zealand, 2020.
https://infrastructure.org.nz/resources/Documents/Reports/Infrastructure%20as%20Strategy%20Report.pdf.
International Energy Agency. “Energy Policies of IEA Countries - New Zealand 2017.” International Energy Agency, 2017.
https://webstore.iea.org/download/direct/305.
Jones, Dan, Robert Amor, and Larry Bellamy. “Position Paper: Digitalisation of the New Zealand Building Industry.” Building Innovation
Partnership, December 2020. https://bipnz.org.nz/wp-content/uploads/2020/12/BIP-Digitalisation-of-the-New-Zealand-Building-Industry-
Position-Paper-digital-version.pdf.
Kapur, Vishal, Douglas Bourgeois, Amina Jackson, Julie Kim, Taylor Jones, and Zachary Zweig. “AI Computer Vision Solutions
Architecture.” Deloitte, 2019. https://www2.deloitte.com/content/dam/Deloitte/us/Documents/deloitte-analytics/us-da-ai-computer-vision-
solutions-architecture.pdf.
Keith Barrow “Finland to establish new companies to manage major rail projects”, International Railway Journal, September 10, 2019,
ttps://www.railjournal.com/infrastructure/finland-to-establish-new-companies-to-manage-major-rail-projects/
Lang, Sarah. “2019 Infrastructure Procurement Survey Results.” Infrastructure New Zealand, August 22, 2019.
https://infrastructure.org.nz/resources/Building%20Nations%202019/Building%20Nations%202019%20Procurement%20Survey%20Pre
sentation.pdf.
Lorica, Ben, and Paco Nathan. “The State of Machine Learning Adoption in the Enterprise.” O’Reilly Media, August 2018.
https://www.bastagroup.nl/wp-content/uploads/2019/01/the-state-of-machine-learning-adoption-in-the-enterprise.pdf.

| Appendix E – Indirect Analysis |
Preparing for Technological Change in the Infrastructure Sector | 3821960-1147589789-62 | 31/05/2021 | 177
Manthre, Ryan, and Ryan Weispfenning. “New Data Unveiled at Heart Rhythm 2020 Demonstrate Effectiveness of App-Based Remote
Monitoring of Medtronic Cardiac Devices, Significant Reduction in Complications with Micra Leadless Pacemaker.” Medtronic, May 8,
2020. https://newsroom.medtronic.com/node/31521/pdf.
Martin, James. The Meaning of the 21st Century: A Vital Blueprint for Ensuring Our Future. New York: Riverhead Trade, 2007.
Mazzucato M., Penna, C., (2016), The Brazilian Innovation System: A Mission-Oriented Policy Proposal. Report for the Brazilian
Government Commissioned by the Brazilian Ministry for Science, Technology and Innovation through the Centre for Strategic
Management and Studies, (06/04/2016). https://www.cgee.org.br/the-brazilian-innovation-system.
Mazzucato, Mariana. Mission Economy: A Moonshot Guide to Changing Capitalism. Harper Business, 2021.
McKinsey COVID-19 Consumer Survey, 27 April 2020
McKnight, Matthew. “Generative Design: What It Is? How Is It Being Used? Why It’s a Game Changer.” KnE Engineering 2, no. 2
(February 9, 2017): 176.
Miller, Ben, and Robert D. Atkinson. “Raising European Productivity Growth Through ICT,” June 2, 2014.
https://doi.org/10.2139/ssrn.3079844.
Ministry of Business, Innovation & Employment. “Energy Prices,” March 11, 2021. https://www.mbie.govt.nz/building-and-
energy/energy-and-natural-resources/energy-statistics-and-modelling/energy-statistics/energy-prices/.
Ministry of Education. “Energy Use and Conservation in Schools.” Ministry of Education, March 10, 2021.
https://www.education.govt.nz/school/property-and-transport/school-facilities/energy-water-and-waste-management/energy-use-and-
conservation/.
Ministry of Education. “Property Data and Asset Management Systems.” Ministry of Education, February 25, 2021.
https://www.education.govt.nz/school/digital-technology/property-data/.
Ministry of Education. “Protect Your School from Cyber-Attacks and Cyber Security Breaches.” Ministry of Education, March 11, 2021.
https://www.education.govt.nz/school/digital-technology/protect-your-school-from-cyber-attacks-and-cyber-security-breaches/.
Ministry of Health. “Annual Report on Drinking-Water Quality 2018 - 2019.” Wellington: Ministry of Health, 2020.
https://www.health.govt.nz/system/files/documents/publications/annual-report-drinking-water-quality-2018-2019-25june2020.pdf.
Ministry of Health. “Challenges and Opportunities,” 09 July, 2018. https://www.health.govt.nz/new-zealand-health-system/new-zealand-
health-strategy-future-direction/challenges-and-opportunities.
Ministry of Transport. “Statistics and Insights.” Ministry of Transport. Accessed March 17, 2021. https://www.transport.govt.nz/statistics-
and-insights/SearchForm.
Mohyeldin, Eiman. “Minimum Technical Performance Requirements for IMT-2020 Radio Interface (s).” In ITU-R Workshop on IMT-2020
Terrestrial Radio Interfaces, 1–12, 2016.
Murphy, Ty. “The 4 Biggest Barriers to Cloud Adoption.” disrupt:Ops, October 30, 2019. https://disruptops.com/the-4-biggest-barriers-to-
cloud-adoption/.
Murray, Sandra. “Hamilton City Council: Waste Assessment.” Hamilton City Council, August 2017.
https://www.fightthelandfill.co.nz/assets/Files/2017-HCC-Waste-Assessment.pdf.
National Infrastructure Unit, New Zealand Treasury. “Evidence Base: Resilience,” 2014.
https://www.treasury.govt.nz/sites/default/files/2017-12/nip-evidence-resilience.pdf.
National Research Foundation. “Virtual Singapore,” February 20, 2021. https://www.nrf.gov.sg/programmes/virtual-singapore.
New Zealand Lifelines Council. “New Zealand Critical Lifelines Infrastructure - National Vulnerability Assessment.” Civil Defence, 2020.
https://www.civildefence.govt.nz/assets/Uploads/lifelines/nzlc-nva-2020-full-report.pdf.

| Appendix E – Indirect Analysis |
Preparing for Technological Change in the Infrastructure Sector | 3821960-1147589789-62 | 31/05/2021 | 178
Nolan, Patrick, Reece Pomeroy, and Guanyu Zheng. “Productivity-by-the-Numbers-2019.pdf.” New Zealand Productivity Commission,
2019. https://www.productivity.govt.nz/assets/Documents/productivity-by-the-numbers-2019/42ead8d24d/Productivity-by-the-Numbers-
2019.pdf.
NSW Government. “World Leading Spatial Digital Twin Launched in NSW.” Accessed April 7, 2021. https://www.nsw.gov.au/nsw-
government/ministers/minister-for-customer-service/media-releases/world-leading-spatial-digital.
Olsen, Brad. “New Zealand Infrastructure Spending Lags International Partners.” Infometrics, June 23, 2020.
https://www.infometrics.co.nz/new-zealand-infrastructure-spending-lags-international-partners/.
OmniSci. “Predictive Maintenance.” Accessed February 12, 2021. https://www.omnisci.com/technical-glossary/predictive-maintenance.
Orrin, Steve, and Cameron Chehreh. “How Edge Computing and Hybrid Cloud Are Shifting the IT Paradigm,” November 20, 2020.
https://www.nextgov.com/ideas/2020/11/how-edge-computing-and-hybrid-cloud-are-shifting-it-paradigm/170238/.
Our land and Water Website quote https://ourlandandwater.nz/news/why-te-taiao-matters-and-the-supporting-role-of-our-research/
Oxford Economics. “Global Infrastructure Outlook.” Global Infrastructure Hub, July 2017.
https://cdn.gihub.org/outlook/live/methodology/Global+Infrastructure+Outlook+-+July+2017.pdf.
Pakin, Scott, and Patrick Coles. “The Problem with Quantum Computers.” Accessed February 19, 2021.
https://blogs.scientificamerican.com/observations/the-problem-with-quantum-computers/.
Panetta, Kasey. “The CIO’s Guide to Blockchain - Smarter With Gartner.” Accessed February 17, 2021.
https://www.gartner.com/smarterwithgartner/the-cios-guide-to-blockchain/.
Persky, Susan. “Here’s How Virtual Reality Could Transform Medical Research after COVID-19.” World Economic Forum, October 8,
2020. https://www.weforum.org/agenda/2020/10/virtual-labs-how-virtual-reality-could-transform-medical-trials-after-covid-19/.
Pottle, Jack. “Virtual Reality and the Transformation of Medical Education.” Future Healthcare Journal 6, no. 3 (October 2019): 181–85.
PricewaterhouseCoopers. “2019 IoT Survey: Speed Operations, Strengthen Relationships and Drive What’s next.” Accessed March 15,
2021. https://www.pwc.com/us/en/services/consulting/technology/emerging-technology/iot-pov.html.
PricewaterhouseCoopers. “The Connected Project – Capital Projects and the Digital Twin.” PwC. Accessed April 9, 2021.
https://www.pwc.com/us/en/industries/capital-projects-infrastructure/library/digital-twin-platform-capital-projects.html.
Rahman, Tameem. “What Is Nanotechnology and What Is Its Future?” Predict, March 19, 2020. https://medium.com/predict/the-future-
of-nanotechnology-accddc9822fb.
Rajapakse, Buddhika. “Energy Futures.” Mercury, March 2021.
Rautiola, K. "Solutions R&D." 6G Wireless Summit, 2019, Kittilä, Finland.
Ray, Analyst :. Saikat, Cathy Tornbohm, Marc Kerremans, and Derek Miers. “Move beyond RPA to Deliver Hyperautomation.” Accessed
February 18, 2021. https://emtemp.gcom.cloud/ngw/globalassets/en/doc/documents/433853-move-beyond-rpa-to-deliver-
hyperautomation.pdf.
Roh, Lucas. “Cloud Computing Vs. Edge Computing: Friends Or Foes?” Forbes Magazine, March 5, 2020.
https://www.forbes.com/sites/forbestechcouncil/2020/03/05/cloud-computing-vs-edge-computing-friends-or-foes/.
Romain Dillet, “France to spend $8.4 billion on digital as part of stimulus plan”, Extra Crunch, September 4 2020,
https://techcrunch.com/2020/09/03/france-to-spend-8-4-billion-on-digital-as-part-of-stimulus-plan/
Saldivar, Jorge, Cristhian Parra, Marcelo Alcaraz, Rebeca Arteta, and Luca Cernuzzi. “Civic Technology for Social Innovation: A
Systematic Literature Review.” Computer Supported Cooperative Work: CSCW: An International Journal 28, no. 2 (May 23, 2018).
https://doi.org/10.1007/s10606-018-9311-7.
| Appendix E – Indirect Analysis |
Preparing for Technological Change in the Infrastructure Sector | 3821960-1147589789-62 | 31/05/2021 | 179
SamKnows. “Measuring Broadband New Zealand Spring Report.” Commerce Commission, December 2020.
https://comcom.govt.nz/__data/assets/pdf_file/0008/230030/MBNZ-Spring-Report-2020-9-December-2020.pdf.
Scott, Matt. “Cryptocurrencies - On the Cusp of Mainstream?” Accessed February 18, 2021. https://www.mercer.co.nz/our-
thinking/wealth/cryptocurrencies-on-the-cusp-of-mainstream.html.
Seadon, Jeff. “New Zealand Invests in Growing Its Domestic Recycling Industry to Create Jobs and Dump Less Rubbish at Landfills.”
The Conversation, September 16, 2020. http://theconversation.com/new-zealand-invests-in-growing-its-domestic-recycling-industry-to-
create-jobs-and-dump-less-rubbish-at-landfills-143684.
Servoz, Michel. “The Future of Work? Work of the Future!” European Commission, April 2019.
Shadbolt, Nigel. “Ambient Intelligence.” IEEE Intelligent Systems 18, no. 4 (2003): 2–3.
Siersted, Nikolai. “10 Edge Computing Use Case Examples.” STL Partners, June 16, 2020. https://stlpartners.com/edge-computing/10-
edge-computing-use-case-examples/.
SNCF Reseau. “Drones, the Railway and Altametris.” SNCF Reseau. Accessed February 19, 2021. https://www.sncf-
reseau.com/en/entreprise/newsroom/sujet/drones-the-railway-and-altametris.
Spatial Services-a business unit of Department of Customer Service NSW. “Spatial Digital Twin.” NSW Government Spatial Services.
Accessed April 9, 2021. https://www.spatial.nsw.gov.au/what_we_do/projects/digital_twin.
Stringer, David. “The Secret to a Greener, Longer-Lasting Battery Is Blue.” Bloomberg News, September 22, 2020.
https://www.bloomberg.com/news/articles/2020-09-22/sodium-ion-batteries-emerge-as-cheaper-alternative-to-lithium.
Strott, Elizabeth, Chrisie Wendin, Karen Bissell, Felipe Oppen, and Ryan Lasko. “Artificial Intelligence: Essential 8 Emerging
Technologies.” PwC, December 2017. https://www.pwc.com.au/pdf/essential-8-emerging-technologies-artificial-intelligence.pdf.
Te Waihanga: New Zealand Infrastructure Commission. “Sector State of Play: Energy Document, Discussion,” February 2021.
https://infracom.govt.nz/assets/Uploads/Energy-Sector-State-of-Play-Discussion-Document-February-2021.pdf.
Telecommunications State of Play, 2020, Te Waihanga.
Thales. “Biometrics (facts, Use Cases, Biometric Security),” March 6, 2021. https://www.thalesgroup.com/en/markets/digital-identity-
and-security/government/inspired/biometrics.
The Treasury. “BBC Guidance,” January 13, 2020. https://www.treasury.govt.nz/information-and-services/state-sector-
leadership/investment-management/better-business-cases/guidance.
The Treasury. “Why We Need the Living Standards Framework,” December 12, 2019. https://www.treasury.govt.nz/information-and-
services/nz-economy/higher-living-standards/our-living-standards-framework/why-we-need-living-standards-framework.
The World Bank. “GDP per Capita (current US$).” Accessed April 13, 2021. https://data.worldbank.org/indicator/NY.GDP.PCAP.CD.
Toutoungi, Edmond. “Cloud and Edge Computing Explained in under 100 Words.” Deloitte, August 19, 2019.
https://www2.deloitte.com/ch/en/pages/innovation/articles/cloud-and-edge-computing-explained-in-100-words.html.
Tushar, Wayes, Tapan K. Saha, Chau Yuen, David Smith, and H. Vincent Poor. “Peer-to-Peer Trading in Electricity Networks: An
Overview.” arXiv [cs.MA], January 19, 2020. arXiv. http://arxiv.org/abs/2001.06882.
uDrew. “About uDrew - Build, Plan and Approve Technology!” Accessed April 13, 2021. https://www.udrew.com.au/about/.
Wade, Robert. Governing the Market: Economic Theory and the Role of Government in East Asian Industrialization. Revised edition.
Princeton University Press, 2003.
Walters, Angela. “Research Profile - West Cambridge Digital Twin Facility.” Centre for Digital Built Britain, December 14, 2020.
https://www.cdbb.cam.ac.uk/news/research-profile-west-cambridge-digital-twin-facility.

| Appendix E – Indirect Analysis |
Preparing for Technological Change in the Infrastructure Sector | 3821960-1147589789-62 | 31/05/2021 | 180
Walters, Angela. “West Cambridge Digital Twin Research Facility.” Centre for Digital Built Britain. Accessed April 6, 2021.
https://www.cdbb.cam.ac.uk/research/cambridge-living-laboratory-research-facility/west-cambridge-digital-twin-research-facility.
Water New Zealand. “National Performance Review 2018 - 2019.” Water New Zealand, 2019.
https://www.waternz.org.nz/Attachment?Action=Download&Attachment_id=4271.
Weinberg, Neal. “Case Study: Why Ford Deployed AMRs to Automate Spanish Factory,” September 26, 2019.
https://www.roboticsbusinessreview.com/case_studies/case-study-why-ford-deployed-amrs-to-automate-spanish-factory/.
Witherden, Stephen. “Digital Twins What, Why and How.” Beca, November 27, 2019. https://www.beca.com/ignite-your-thinking/ignite-
your-thinking/november-2019/digital-twins-what-why-and-how.
Wong, Joshua, Anthony Longhitano, Jessica Yao, Pavithra Jayadeva, Kim Arendshorst, Leeanne Grigg, Gareth Wynn, and Irene
Stevenson. “Remote Device Interrogation Kiosks (ReDInK) - Pharmacy Kiosk Remote Testing of Pacemakers and Implantable
Cardioverter-Defibrillators for Rural Victorians. A Novel Strategy to Tackle COVID-19.” Heart, Lung & Circulation, January 28, 2021.
https://doi.org/10.1016/j.hlc.2020.12.013.
Worksafe. “Incidents” March 9, 2021.
https://data.worksafe.govt.nz/graph/detail/incidents?industry=Electricity%2C+Gas%2C+Water+and+Waste+Services&startDate=2020-
03&endDate=2021-02&sub_industry=Electricity+Supply.
Yaga, Dylan, Peter Mell, Nik Roby, and Karen Scarfone. “Blockchain Technology Overview.” Gaithersburg, MD: National Institute of
Standards and Technology, October 2018. https://doi.org/10.6028/nist.ir.8202.
Yang, Wen-Chieh, Hsing-Kuo Wang, Ruey-Meei Wu, Chien-Shun Lo, and Kwan-Hwa Lin. “Home-Based Virtual Reality Balance
Training and Conventional Balance Training in Parkinson’s Disease: A Randomized Controlled Trial.” Journal of the Formosan Medical
Association = Taiwan Yi Zhi 115, no. 9 (September 2016): 734–43.

| Appendix E – Indirect Analysis |
Preparing for Technological Change in the Infrastructure Sector | 3821960-1147589789-62 | 31/05/2021 | 181