Preliminary study on the drivers of deforestation & potential
for REDD+ in Zambia
Republic of Zambia
Ministry of Lands,
Natural Resources and
Environmental Protection

2012
Preliminary study on the drivers of deforestation & potential
for REDD+ in Zambia
Consultancy report prepared by School of Natural Resources, Copperbelt University, on behalf of Forestry Department and FAO under the national UN-REDD+ Programme
Contacts
School of Natural Resources, Copperbelt University, P.O. Box 21692 Kitwe, Zambia. Telephone: +260 212 230923. Email: [email protected]
Consultants
Name Email Royd Vinya (PhD) [email protected] Exhildah C. Kasumu (PhD) [email protected] Stephen Syampungani (PhD) [email protected] Concilia Monde [email protected] Robby Kasubika [email protected]
Citation:
Vinya, R., Syampungani, S., Kasumu, E.C., Monde, C. & Kasubika, R. (2011). Preliminary Study on the Drivers of Deforestation and Potential for REDD+ in Zambia. A consultancy report prepared for Forestry Department and FAO under the national UN-REDD+ Programme Ministry of Lands & Natural Resources. Lusaka, Zambia.
The designations employed and the presentation of material in this information product do not imply the expression of any opinion whatsoever on the part of the Food and Agriculture Organization of the United Nations (FAO) concerning the legal or development status of any country, territory, city or area or of its authorities, or concerning the delimitation of its frontiers or boundaries. The mention of specific companies or products of manufacturers, whether or not these have been patented, does not imply that these have been endorsed or recommended by FAO in preference to others of a similar nature that are not mentioned.
The views expressed in this information product are those of the author(s) and do not necessarily reflect the views of FAO.
All rights reserved. FAO encourages reproduction and dissemination of material in this information product. Non-commercial uses will be authorized free of charge, upon request. Reproduction for resale or other commercial purposes, including educational purposes, may incur fees. Applications for permission to reproduce or disseminate FAO copyright materials, and all queries concerning rights and licences, should be addressed by e-mail to [email protected] or to the Chief, Publishing Policy and Support Branch, Office of Knowledge Exchange, Research and Extension, FAO, Viale delle Terme di Caracalla, 00153 Rome, Italy.
© FAO 2012

iii
EXECUTIVE SUMMARY
1. This study sought to answer the question: what drives deforestation and what is
the potential for REDD+ in Zambia? Since deforestation and poor forest
management reduce carbon storage in tropical forests, there has been increasing
pressure to minimize carbon stock losses. The objectives of this study were to
provide a preliminary understanding regarding drivers of deforestation and the
potential for REDD+in Zambia; to assess to what extent our current consumption,
production and development patterns affect deforestation levels, as well as
assessing the potential impact of future shifts in these patterns; to draw
conclusions as to which actions/trends would probably have the most serious
consequences in terms of additional deforestation, and analyse how these could
be reduced in future. The final aim was to outline the potential for REDD+ in
these circumstances.
2. In order to address these stated objectives, we used an interdisciplinary data
gathering approach, integrating literature search, policy level consultancy,
community level consultations, stakeholder interviews, courtesy calls and field
visits.
3. According to this preliminary study, deforestation hotspots in Zambia are mainly
located along the highly urbanized rail link running from Southern to Copperbelt
provinces. New hotspots are also rapidly emerging in the less urbanized
provinces.
4. This preliminary study has revealed that forest cover loss in deforestation
hotspots has been on an upward trend since the late 1980s.
5. The direct drivers of deforestation in Zambia can be grouped into four categories.
These are:
Agricultural expansion
Infrastructure development
Wood extraction
Fires

iv
6. The ultimate drivers of forest cover loss are agricultural expansion, charcoal
production, fuelwood collection, wood harvesting, settlements, fires, urbanization,
industrialization, urban expansion and livestock grazing. The underlying drivers
are high poverty levels, low employment opportunities, brick-making, tobacco
curing, insecure tenure rights, low institutional capacity (poor funding, low staffing
levels, lack of reliable transport for monitoring) and lack of synergy among
policies and legislation.
7. The challenges of reducing deforestation in Zambia include improving linkages
and coordination between relevant institutions in natural resource management
(NRM); regularly updating information on the national status of forests; enhancing
complementarity of relevant policies and institutions; making NRM policies
supportive and inclusive; developing a close relationship between infrastructure
development and forest conservation; eliminating or minimizing political
interference in forest resource management; promoting secure land tenure
systems and developing clear policies and guidelines that effectively address
issues of benefit-sharing mechanisms.
8. Viable options available for halting forest cover loss in Zambia may include
enhancing soil quality and erosion control, afforestation, woodland regeneration
and agroforestry as conservation strategies aimed at increasing carbon stocks in
degraded sites.
9. Current high levels of deforestation (between 250 000 and 300 000 ha/year) in
Zambia mean there is high potential for Zambia’s participation under REDD+,
since degraded sites may still be managed for carbon sequestration through
coppice or regeneration management. The capacity of miombo woodlands to
recover almost completely following clearing for either charcoal production or
slash-and-burn agriculture, offers very high potential for local communities to
participate in carbon trading under REDD+ financing mechanisms.
10. In conclusion, deforestation is a complex matter, with many drivers operating at
varying levels. The major challenge is therefore to reconcile the need to improve
people’s livelihoods with the urgency of achieving sustainable forest resource
management. REDD+ offers an opportunity for rural dwellers to trade in forest
ecosystem services that do not lead to loss in forest cover.
v
TABLE OF CONTENTS
EXECUTIVE SUMMARY ....................................................................................................... III
TABLE OF CONTENTS ......................................................................................................... V
LIST OF TABLES ................................................................................................................. VII
LIST OF FIGURES ............................................................................................................... VII
ACRONYMS/ ABBREVIATIONS ........................................................................................ VIII
1.0 INTRODUCTION .............................................................................................................. 1
1.1 VEGETATION TYPES OF ZAMBIA .............................................................................. 2
1.2 MANAGEMENT OF FOREST RESOURCES ............................................................... 3
1.2.1 PAST STRATEGIES TO ENHANCE SUSTAINABLE FOREST MANAGEMENT .. 3
2.0 METHODOLOGY ............................................................................................................. 6
2.1 SITE SELECTION ......................................................................................................... 6
2.2 METHODOLOGY .......................................................................................................... 6
2.2.1 DATA COLLECTION .............................................................................................. 6
2.2.2 DATA ANALYSIS .................................................................................................... 7
3.0 FINDINGS ......................................................................................................................... 8
3.1 DEFORESTATION HOTSPOTS IN ZAMBIA ................................................................ 8
3.2 HISTORIC, CURRENT & FUTURE TRENDS OF DEFORESTATION AND FOREST DEGRADATION .......................................................................................... 9
3.3 DRIVERS OF DEFORESTATION AND THEIR LINKAGES........................................ 13
3.3.1 LEGISLATIVE AND POLICY FRAMEWORK ....................................................... 15
3.3.2 INSTITUTIONAL FACTORS ................................................................................. 16
3.3.3 ENVIRONMENTAL FACTORS AND THEIR LINK TO DEFORESTATION .......... 17
3.3.4 SOCIO-ECONOMIC DRIVERS AND CAUSES OF DEFORESTATION .............. 21
3.3.5 INFRASTRUCTURE DEVELOPMENT ................................................................. 25
3.4 CHALLENGES FOR REDUCING DRIVERS OF DEFORESTATION ......................... 27
3.4.1 POOR LINKAGE AND COORDINATION WITH OTHER RELEVANT INSTITUTIONS .............................................................................................................. 27
3.4.2 UNAVAILABILITY OF UPDATED INFORMATION ON THE NATIONAL STATUS OF FORESTS ................................................................................................. 27
3.4.3 LACK OF COMPLEMENTARITY OF RELEVANT POLICIES AND INSTITUTIONS ..................................................................................................... 27
3.4.4 LACK OF SUPPORTIVE AND INCLUSIVE NATURAL POLICIES ...................... 27
3.4.5 INFRASTRUCTURE DEVELOPMENT AND FOREST CONSERVATION ........... 28
3.4.6 POLITICAL INTERFERENCE .............................................................................. 28
vi
3.4.7 INSECURE LAND TENURE SYSTEM ................................................................. 28
3.4.8 LACK OF BENEFIT-SHARING MECHANISM ...................................................... 29
3.5 OPTIONS AVAILABLE TO EFFECTIVELY REDUCE IMPACTS ON FOREST RESOURCES .................................................................................................... 29
3.5.1 REGENERATION AND COPPICE ENHANCEMENT MANAGEMENT ................ 30
3.5.2 AGROFORESTRY, SOIL MANAGEMENT AND CLIMATE CHANGE MITIGATION ................................................................................................. 30
3.5.3 FIRE MANAGEMENT ........................................................................................... 32
3.5.4 ALTERNATIVE ENERGY SOURCES AND IMPROVED CHARCOAL USE AND PRODUCTION METHODS ................................................................................... 33
3.5.5 ALTERNATIVE LIVELIHOOD SYSTEMS ............................................................ 34
3.5.6 IMPROVING STAFFING LEVELS AND COLLABORATION WITH LOCAL COMMUNITY MEMBERS ............................................................................................. 34
3.6 POTENTIAL FOR REDD+ IN ZAMBIA ........................................................................ 35
3.6.1 WOODLAND RECOVERY, PRODUCTIVITY AND POTENTIAL FOR REDD+ PROJECTS ...................................................................................................... 36
3.6.2 MECHANISMS OF CARBON STORAGE AND LOSS IN WOODLANDS ............ 38
3.7 METHODOLOGIES AND TOOLS FOR ESTIMATING DEFORESTATION TRENDS 39
4.0 CONCLUSIONS AND RECOMMENDATIONS .............................................................. 42
5.0 REFERENCES ............................................................................................................... 43
GLOSSARY .......................................................................................................................... 50
APPENDICES ....................................................................................................................... 51

vii
LIST OF TABLES Table 1: Major vegetation formation of Zambia ...................................................................... 2 Table 2: provinces and districts involved in the study ............................................................. 6 Table 3: Annual rate of deforestation by province for the period 1965 - 2005 ........................ 9 Table 4: Changes in forest area in Zambia from 1965 to 2005 ............................................. 10 Table 5: Long-term changes in forest cover in Zambia ......................................................... 11 Table 6: Land cover/Land use change in the Misaka National Forest from 1979 to 2010 .... 12 Table 7: Estimates of main forest types ................................................................................ 35 Table 8: Biomass related parameters of Southern Africa woodlands ................................... 36 Table 9: Total above-ground biomass and biomass density in the major land use classes in Zambia .................................................................................................................................. 37 Table 10: Estimated historical biomass and carbon stock changes from 1965-2005 in Zambia .................................................................................................................................. 38 Table 11: Present acquisition and analysis costs* of monitoring of various technologies in US$ ....................................................................................................................................... 41
LIST OF FIGURES Figure 1: Deforestation hotspots in Zambia ............................................................................ 8 Figure 2: Projected deforestation as result of land use change in Zambia ........................... 11 Figure 3: Area under cultivation for the period 1987 to 2010 ............................................... 13 Figure 4: Interrelationships between proximate and underlying drivers of deforestation in Zambia .................................................................................................................................. 14 Figure 5: Hilly and rocky area with limited vegetation formation in Serenje, Central Province ................................................................................................................... 20 Figure 6: Frequency of occurrence of the specific proximate drivers of deforestation .......... 22 Figure 7: Frequency of occurrence of specific drivers of deforestation by province ............. 22
viii
ACRONYMS/ ABBREVIATIONS CBNRM: Community-Based Natural Resource Management
FAO: Food & Agricultural Organization of the United Nations
FSP: Forest Support Programme
GRZ: Government of the Republic of Zambia
ILUA: Integrated Land Use Assessment
JFM: Joint Forest Management
MTENR: Ministry of Tourism, Environment & Natural Resources
REDD: Reducing Emissions from Deforestation and Forest Degradation
UNFCCC: United Nations Framework Convention for Climate Change
VAG: Village Action Group
ZAWA: Zambia Wildlife Authority
ZFAP: Zambia Forestry Action Plan

1
1.0 INTRODUCTION
Africa's miombo woodlands are vast, of high conservation value and important for
human well-being. Forests play a crucial role in the livelihoods of the majority of
resource-poor rural Zambians, who lack access to other sources of subsistence
income and employment. It is, however, an unfortunate fact that agricultural
production and the use of fire have constantly modified tropical woodlands over the
years (Chidumayo, 1997). Livelihood factors such as the need for agricultural land,
food, income and employment have all greatly contributed to degradation, and, in
some cases, depletion of forest resources in Zambia (Chidumayo, 2002; Chipika &
Kowero, 2000; FAO 2005). Numerous studies have shown that tropical deforestation
is one of the major causes of global climate change (Henry et al., 2010). However,
the question of what drives tropical deforestation at both local and global levels
remains largely unanswered. It is interesting to note that over the past three
decades, a significant body of evidence has revealed that factors promoting tropical
deforestation are complex, and vary in scale at global, country and regional levels.
The consequences of deforestation are devastating, and may, amongst other
negative impacts, result in a reduction in the provision of overall ecosystem services,
and also contribute to global warming. Since deforestation and poor forest
management reduce carbon storage in tropical forests, there has been increasing
pressure to minimize carbon stock losses. In the UNFCCC negotiations, action on
deforestation and forest degradation is considered a critical pathway for achieving
the overall objective of mitigating climate change. The main purpose of this study
was to generate a preliminary understanding regarding drivers of deforestation, from
a Zambian perspective. The specific objectives of the study, as provided in the terms
of reference (Appendix 1), were:
To provide a preliminary understanding regarding drivers of deforestation and
the potential for REDD+ in Zambia;
To assess to what extent our current consumption, production and
development patterns affect deforestation levels, as well as assessing the
potential impact of future shifts in these patterns;

2
To draw conclusions as to which actions/trends would probably have the most
serious consequences in terms of additional deforestation, analyse how these
could be reduced in future and outline the potential for REDD+ in these
circumstances.
1.1 VEGETATION TYPES OF ZAMBIA
Zambia has three major vegetation formations (Table 1). The closed forests are
limited in extent, covering only about 6 percent of the country. The most extensive
closed forests are the Cryptosepalum and Baikiaea forests, covering parts of North-
Western and Western provinces (MTENR, 2003).
Table 1: Major vegetation formation of Zambia
Vegetation type Approximate extent, area 1000 ha Proportion (%) Closed Forests
Parinari 420 0.06 Marquesia 430 0.06 Lake basin 15 560 2.07 Cryptosepalum 15 210 2.00 Baikiaea 6 830 0.91 Itigi 1 900 0.25 Montane 40 0.01 Swamp 1 530 0.20 Riparian 810 0.11
Woodland (Open Forest) Miombo 311 460 41.41 Kalahari 85 460 11.36 Mopane 38 700 5.15 Munga 32 600 4.34 Termitaria 24 260 3.23
Grassland 206 350 27.44 Open waters 10 500 1.40 (Source: MTENR, 2002)
Open forests/woodlands are the dominant vegetation formations in Zambia, covering
66 percent of the forested area (MTENR, 2002). There are four types of woodlands
in the country, of which the most extensive is miombo. Miombo woodland covers 42
percent of the country and is characterized by the following genera: Brachystegia,
Julbernadia and Isoberlinia. This is followed by the Kalahari woodlands,
characterized by Mopane, Munga and Termitaria (MTENR, 2002). Termitaria, or
anthill vegetation, covers 3 percent of land, and is present in all regions of the
country, except in areas of pure stands. It is classified according to its association

3
with other vegetation types, as in: Miombo Termitaria, Kalahari Termitaria, Mopane
Termitaria, Munga Termitaria, Riparian Termitaria and Grassland Termitaria.
1.2 MANAGEMENT OF FOREST RESOURCES
In Zambia, the Forestry Department is responsible for implementing national forestry
policies and plans for forest use and management. The Forestry Department
provides the general management and control of forest resources, in order to meet
national and local demand. The Department’s aim is to ensure a sustainable flow of
timber and non-timber forest products and services, while at the same time ensuring
protection and maintenance of biodiversity for the benefit of present and future
generations, through active participation of all stakeholders.
Since the inception of the Forestry Department in 1949, forest resource
management in local and national forest areas has failed to facilitate meaningful
involvement of other stakeholders, such as communities living near these forest
areas. Although some attempts have been made to democratize forest resource
management in Zambia through the 1998 forest policy, this document remains
largely inactive. Furthermore, the legal aspects of forest resource management in
Zambia continue to be covered by the 1973 Act, despite the subsequent formulation
of the 1999 Forestry Act. The autocratic nature of both forest policy and legal
frameworks, compounded by a declining national economic situation, has
contributed to unprecedented loss in forest cover throughout Zambia. There has
been an upward trend in deforestation since the 1990s (FAO, 2005; ILUA, 2010). As
a result, the Zambian government faces the major challenge of reducing forest cover
loss.
1.2.1 PAST STRATEGIES TO ENHANCE SUSTAINABLE FOREST MANAGEMENT
1.2.1.1 THE WORLD CONSERVATION STRATEGY
The World Conservation Strategy was launched in 1980 with the task of encouraging
nations to develop their own national conservation strategies in order to improve the
conservation of natural resources. In Zambia, the National Conservation Strategy
was developed in 1984, its main goal being that of satisfying the basic needs of all
the country’s present and future generations through wise management of natural
resources. Specifically, the objectives of the national conservation strategy were to:

4
Ensure the sustainable use of Zambia’s renewable natural resources, such as
forests;
Maintain Zambia’s biological diversity;
Maintain essential ecological processes and life support systems.
The National Conservation Strategy’s main method was to establish policies, devise
plans and fully integrate conservation into Zambia’s social and economic
development. It also aimed to analyse trends and current issues so as to better
anticipate needs and problems.
However, the National Conservation Strategy failed to be fully integrated into
national development priorities and clearly failed to reach local groups in rural
communities. According to Chabala (2004), the failure of the National Conservation
Strategy to achieve its set goals was attributed to the planning process, which used
a top-down approach, confined to scientists and government institutions, without
involving local communities in all stages of the conservation strategy. Depletion of
natural resources still continued at a faster rate than had been anticipated.
1.2.1.2 ZAMBIA FORESTRY ACTION PLAN (ZFAP)
After the National Conservation Strategy, the Zambia Forestry Action Plan (ZFAP)
was launched in 1998 by the Ministry of Environment and Natural Resources. The
ZFAP process was intended to focus on forest–related issues such as reforestation,
forest management, forest conservation and forest restoration at national level. The
ZFAP process aimed to overcome political and institutional barriers in order to
effectively manage Zambia’s remaining forest resources. However, unfortunately,
ZFAP shared the fate of previous initiatives, since it remained a sector (Forestry
Department) programme, with little influence on other sectors and the country as a
whole, due to a lack of national development planning. Grassroots programmes
initiated by local communities were never considered as part of the scope, and such
initiatives failed to receive any meaningful policy support from the government via
ZFAP.
1.2.1.3 JOINT FOREST MANAGEMENT (JFM)
The purpose of JFM is to encourage the devolution of management for protected
forests in Zambia to local communities and villages through specific arrangements
such as co-management agreements, village forest reserves and community

5
forestry. According to Bwalya (2004), the Forests Act of 1999 aimed to promote
democracy in forest resource governance (local/village people participatory
approach), replacing the previous top-down approach. JFM ensures active
participation of villagers in forest resource management through the formation of
semi-autonomous commissions. The general principle behind JFM is that power-
sharing for forest conservation will instill a sense of belonging in communities living
close to protected forests. Zambia aside, similar semi-autonomous forestry
commissions exist in Kenya, South Africa, Tanzania and Uganda.
However, implementation of JFM in Zambia has failed to produce significant
results. This is largely due to lack of proper legal backing, coupled with other factors
outside the legal framework.
6
2.0 METHODOLOGY
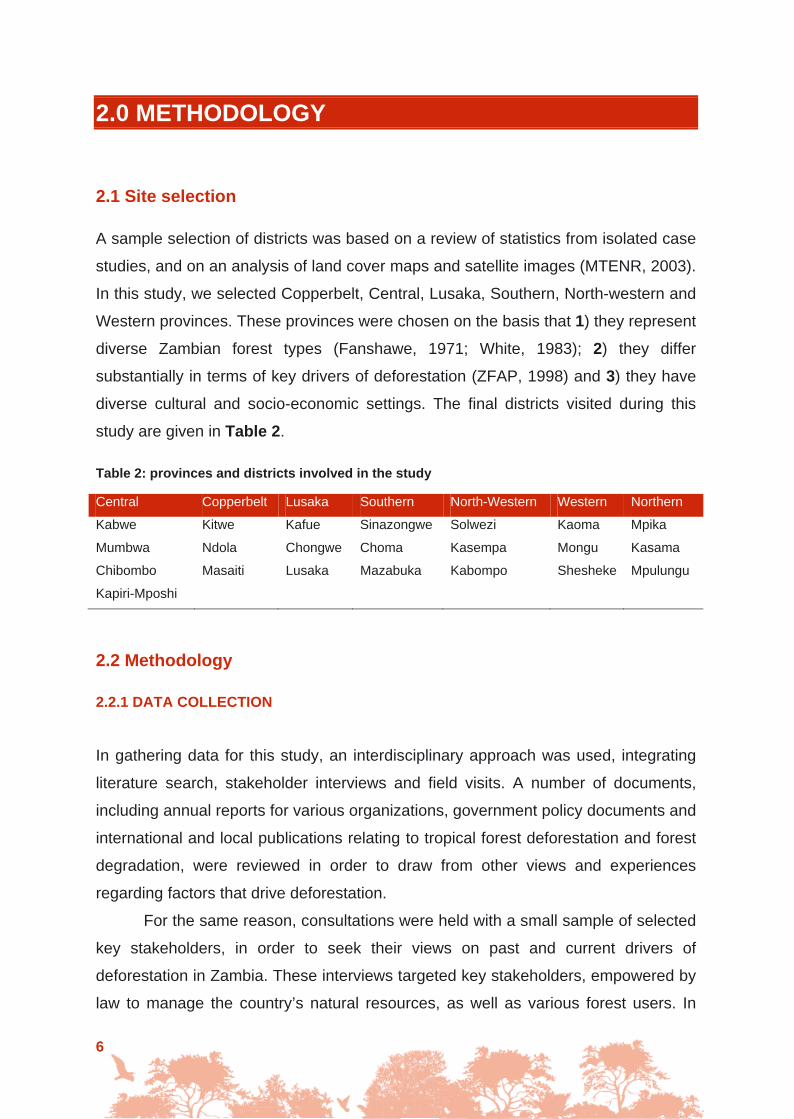
2.1 Site selection
A sample selection of districts was based on a review of statistics from isolated case
studies, and on an analysis of land cover maps and satellite images (MTENR, 2003).
In this study, we selected Copperbelt, Central, Lusaka, Southern, North-western and
Western provinces. These provinces were chosen on the basis that 1) they represent
diverse Zambian forest types (Fanshawe, 1971; White, 1983); 2) they differ
substantially in terms of key drivers of deforestation (ZFAP, 1998) and 3) they have
diverse cultural and socio-economic settings. The final districts visited during this
study are given in Table 2.
Table 2: provinces and districts involved in the study
Central Copperbelt Lusaka Southern North-Western Western Northern Kabwe Kitwe Kafue Sinazongwe Solwezi Kaoma Mpika
Mumbwa Ndola Chongwe Choma Kasempa Mongu Kasama
Chibombo Masaiti Lusaka Mazabuka Kabompo Shesheke Mpulungu
Kapiri-Mposhi
2.2 Methodology
2.2.1 DATA COLLECTION
In gathering data for this study, an interdisciplinary approach was used, integrating
literature search, stakeholder interviews and field visits. A number of documents,
including annual reports for various organizations, government policy documents and
international and local publications relating to tropical forest deforestation and forest
degradation, were reviewed in order to draw from other views and experiences
regarding factors that drive deforestation.
For the same reason, consultations were held with a small sample of selected
key stakeholders, in order to seek their views on past and current drivers of
deforestation in Zambia. These interviews targeted key stakeholders, empowered by
law to manage the country’s natural resources, as well as various forest users. In

7
addition to investigating deforestation drivers, consultations also provided an
opportunity to gain an in-depth understanding of deforestation and the inherit
institutional challenges for managing deforestation in Zambia.
It was also important to witness the physical nature of the problems, so field
visits were conducted to assess the extent of deforestation and forest degradation
for a few selected deforestation hotspots.
2.2.2 DATA ANALYSIS
The results presented in Fig. 2 are based on the simulation of land use changes
using the CLUE-s model (the Conversion of Land Use and its Effects) (Veldkamp
and Fresco, 1996). A nationwide application for Zambia at relatively coarse
resolution CLUE-s was used. It was specifically developed for the spatially explicit
simulation of land use change, based on an empirical analysis of location suitability,
combined with the dynamic simulation of competition and interactions between the
spatial and temporal dynamics of land use systems. The explicit focus on the spatial
dynamics of land use change makes the model suitable for the purposes of this
study.
The model is based on an integrated analysis of socio-economic and
biophysical factors that determine the allocation of land use change in combination
with the simulation of temporal dynamics (path-dependence and reversibility of
changes), spatial policies and land requirements (Verburg and Veldkamp, 2003).
Different scenarios of near-future developments in land use patterns were simulated,
illustrating the effects of implementing spatial policies. The results in Fig. 2, from the
coarse scale model with national extent, mainly serve to identify the overall pattern of
land use change and hotspots of deforestation in Zambia.
In order to identify the deforestation hotspots, the Global Land Cover 2000
(GLC, 2000) was used as the baseline land use map. The simulation of deforestation
was based on this baseline scenario. The four main categories of information used in
the model include: Land use requirements (demand), Location characteristics,
Spatial policies and restrictions and Land use type specific conversion settings. A
more detailed description of the model is provided by Verburg et al. (2002).

8
3.0 FINDINGS
3.1 DEFORESTATION HOTSPOTS IN ZAMBIA
A visible characteristic of the pattern of deforestation hotspots in Zambia is its close
association with urbanization (Fig. 1). The close link between urbanization and
deforestation is confirmed by hotspot analysis using the CLUE-S (Conversion of
Land Use and its Effects) model, developed by Verburg and Veldkamp (2004).
Figure 1: Deforestation hotspots in Zambia
The major corridor of deforestation hotspots is along the rail link from Livingstone to
Chililabombwe. This covers four key provinces (Southern, Lusaka, Central and
Copperbelt). However, there is evidence of growing numbers of hotspots in North-
Western Province, driven by rapid urbanization and industrialization. The close link
between urbanization and deforestation suggests that areas experiencing high
population growth are likely to be more severely affected by deforestation in the near
future.

9
3.2 HISTORIC, CURRENT & FUTURE TRENDS OF DEFORESTATION AND FOREST DEGRADATION
Trends for deforestation are variable, depending on the period (Chidumayo, 2012).
For example, the average deforestation rate during 1965-2005 was 0.81 percent per
province (Table 3). Among the provinces considered in this study, Luapula Province
had the highest annual deforestation rate during the period 1965-1996, while
Southern and Western had the lowest annual rate of deforestation during the period
1965-2005.
Table 3: Annual rate of deforestation by province for the period 1965 - 2005
Province Annual deforestation (%) 1965 - 2005 Central (including Lusaka) -0.65 Copperbelt -0.84 Eastern -0.85 Luapula -2.47 Northern -0.47 Northwestern -0.77 Southern -0.20 Western -0.20
Source: Chidumayo, 2012
According to Chidumayo (2012), the countrywide annual rate of decline in forest area
increased from -0.34 percent (or -157 300 ha) for the intermediate past period of
1965 – 1996 to -0.66 percent (or -307 900 ha) for the maximum period of 1965 -
2005; the forest area decline for the minimum period of 1996 – 2005 was estimated
at -1.99 percent (or -826 554 ha). Forest area in most of the country’s provinces has
followed a pattern of decline (Table 4).
10
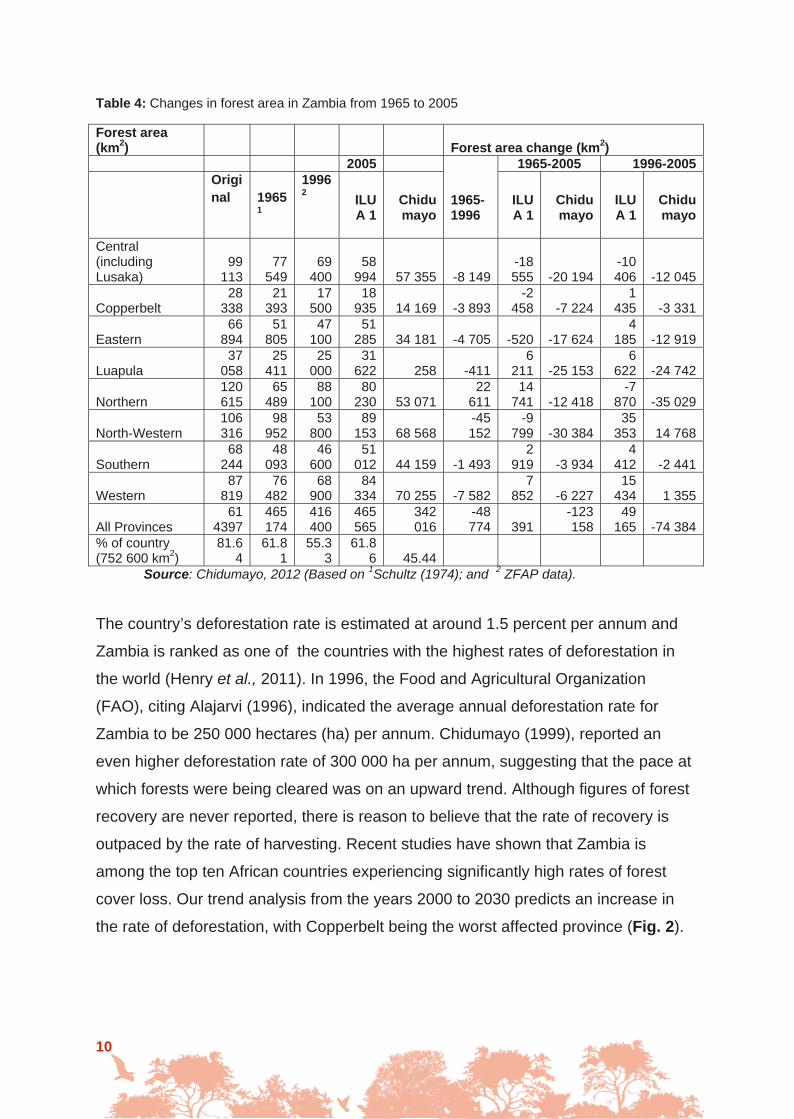
Table 4: Changes in forest area in Zambia from 1965 to 2005
Forest area (km2) Forest area change (km2) 2005
1965-1996
1965-2005 1996-2005
Original
19651
19962 ILU
A 1
Chidumayo
ILUA 1
Chidumayo
ILUA 1
Chidumayo
Central (including Lusaka)
99 113
77 549
69 400
58 994 57 355 -8 149
-18 555 -20 194
-10 406 -12 045
Copperbelt 28
338 21
393 17
500 18
935 14 169 -3 893 -2
458 -7 224 1
435 -3 331
Eastern 66
894 51
805 47
100 51
285 34 181 -4 705 -520 -17 624 4
185 -12 919
Luapula 37
058 25
411 25
000 31
622 258 -411 6
211 -25 153 6
622 -24 742
Northern 120 615
65 489
88 100
80 230 53 071
22 611
14 741 -12 418
-7 870 -35 029
North-Western 106 316
98 952
53 800
89 153 68 568
-45 152
-9 799 -30 384
35 353 14 768
Southern 68
244 48
093 46
600 51
012 44 159 -1 493 2
919 -3 934 4
412 -2 441
Western 87
819 76
482 68
900 84
334 70 255 -7 582 7
852 -6 227 15
434 1 355
All Provinces 61
4397 465 174
416 400
465 565
342 016
-48 774 391
-123 158
49 165 -74 384
% of country (752 600 km2)
81.64
61.81
55.33
61.86 45.44
Source: Chidumayo, 2012 (Based on 1Schultz (1974); and 2 ZFAP data).
The country’s deforestation rate is estimated at around 1.5 percent per annum and
Zambia is ranked as one of the countries with the highest rates of deforestation in
the world (Henry et al., 2011). In 1996, the Food and Agricultural Organization
(FAO), citing Alajarvi (1996), indicated the average annual deforestation rate for
Zambia to be 250 000 hectares (ha) per annum. Chidumayo (1999), reported an
even higher deforestation rate of 300 000 ha per annum, suggesting that the pace at
which forests were being cleared was on an upward trend. Although figures of forest
recovery are never reported, there is reason to believe that the rate of recovery is
outpaced by the rate of harvesting. Recent studies have shown that Zambia is
among the top ten African countries experiencing significantly high rates of forest
cover loss. Our trend analysis from the years 2000 to 2030 predicts an increase in
the rate of deforestation, with Copperbelt being the worst affected province (Fig. 2).

11
Figure 2: Projected deforestation as result of land use change in Zambia
The amount of forest cover loss is expected to vary between the different simulation
periods within the deforestation hotspots. Between the baseline year 2000 and 2010,
the amount of forest cover loss was 890 400 ha and is expected to increase to 1 358
200 ha in 2020. The amount of forest cover loss between 2020 and 2030 is expected
to decline from 1 358 200 ha in 2020 to 1 238 800 ha in 2030 (Table 5).
Table 5: Long-term changes in forest cover in Zambia
Land use/Land cover change from 2000 to 2030 Year Extensive
Agriculture (00 ha) Primary forest
(00 ha) Secondary forest
(00 ha) Shrubland
(00 ha) 2000 64 344 161 044 288 221 184 130 2010 73 248 158 907 284 392 181 726 2020 86 830 155 647 278 552 178 059 2030 99 218 152 674 273 225 174 714

12
Box 1 Examples of deforestation trend in Kitwe’s Misaka National Forest in the Copperbelt Province for the period 1979-2010
At local level, deforestation in Kitwe’s Misaka area has been increasing (Box 1). The
main driver of land use change in Misaka has been a combination of charcoal
production, settlements, and agriculture.
Over the years, agriculture and settlements have been the main drivers of forest
cover loss, particularly during the period between 1989 and 2002 (Table 6). This
corresponds to the structural adjustment programme era, during which the country’s
mines made substantial cuts in their workforce.
Table 6: Land cover/Land use change in the Misaka National Forest from 1979 to 2010
forest cover (ha) exotic plantation cover (ha)
settlements/ agricultural land (ha)
surface water area
(ha) 1979 16 362 2 090 2 696 22 1989 7 878 5 722 7 350 22 2002 4 396 5 362 11 192 22 2010 4 712 5 313 10 859 88
Source: WRAP, 2011

13
Empirical data shows that land under cultivation has been steadily increasing since
the late 1980s and that this trend may continue in the future (Fig. 3).
Figure 3: Area under cultivation for the period 1987 to 2010
Source: Ministry of Agriculture
The rapid rise in area under cultivation (Fig. 3) may be attributed to the
intensification of the fertilizer support programme, launched by the Zambian
government in 2000. It would have been interesting to compare this trend with forest
cover loss as a result of forest-related activities, such as charcoal production and
logging over the same period. However, unfortunately no empirical data could be
retrieved from Forestry Department HQ, due to poor record-keeping.
3.3 DRIVERS OF DEFORESTATION AND THEIR LINKAGES
Results of this study revealed that the proximate factors driving deforestation in
Zambia can be broadly grouped into four categories (Fig. 4):
Agricultural expansion
Infrastructure development
Wood extraction
Fires
These factors work in an interactive way to influence forest cover loss at different
spatial scales.

Fi
gure
4: I
nter
rela
tions
hips
bet
wee
n pr
oxim
ate
and
unde
rlyin
g dr
iver
s of
def
ores
tatio
n in
Zam
bia

15
The proximate drivers of deforestation in Zambia are shifting agriculture, agricultural
extensification, charcoal production, fuelwood collection, logging, settlements,
uncontrolled fires, industrialization and urban expansion (Fig. 4).
The underlying drivers of deforestation can be divided into five broad groups (Fig. 4):
Policy and legal framework
Socio-economic
Demography
Institutional
Environmental
However, the specific underlying drivers of deforestation are high poverty levels, low
employment opportunities, brick-making, tobacco curing, insecure tenure rights, low
institutional capacity (poor funding, low staffing levels, lack of reliable transport for
monitoring) and lack of synergy among the various policies and acts of legislation.
3.3.1 LEGISLATIVE AND POLICY FRAMEWORK
Over the years, the Zambian government has introduced a number of policies and
acts of legislation, designed to address one or more aspects of natural resource
management (NRM). Some of the more effective of these measures in terms of
Zambian forest resources management have included:
National Policy on Environment – promotes holistic and sound
environmental management in Zambia.
Forestry policy: promotes involvement of local communities in sustainable
forest management and conservation.
National Parks and Wildlife Act, no. 12 of 1998: provides for the
establishment, control and management of national parks, and the
conservation and protection of wildlife resources and objects of interest.
National Heritage Conservation Commission Act: promotes the protection
and conservation of ancient, cultural and natural heritages.
Agricultural (including fisheries) policy: promotes sustainable agriculture
(agroforestry) through wise use of resources.

16
Wildlife policy: promotes the sustainable management of wildlife resources
and community participation in the management of these resources.
Energy policy: promotes the use of alternative sources of energy and the
adoption of energy-saving technologies.
Decentralization policy: promotes local involvement in decision-making and
concentration of decision-making at local rather than national level.
Town & Country planning Act, CAP 475: promotes environmentally-friendly
development in all towns in Zambia.
Despite their positive contribution to sustainable NRM, these policies have been
characterized by widespread failure in terms of implementation and enforcement.
The main factors have been lack of political will, low levels of support for
implementation and inconsistencies in both policy and legislation. Generally, these
policies have resulted in the forest sector being regulated in a sectoral manner, with
distinct regulatory and monitoring institutions, resulting in varying degrees of overlap
and conflict. The legislation also lacks provision for conflict resolution and disputes
among competing concessionaires, such as those for the timber and mining sectors.
Although the Zambian government has accepted and introduced Community-
Based Natural Resource Management (CBNRM) approaches, aimed at providing
rural communities with secure tenure of their environmental resources, a
commitment to develop appropriate supporting legislation and technical capacity
appears to be lacking. Current CBNRM approaches lack clear guidelines on cost and
benefit-sharing mechanisms between GRZ and participating communities (Bwalya,
2007; Phiri, 2009). Furthermore, communities have not received the required
assistance to manage their activities and environmental resources in an
independent manner.
3.3.2 INSTITUTIONAL FACTORS
Inadequate staffing in government departments dealing with NRM-related issues has
greatly contributed to the downward trend in the sustainability of forest and natural
resources in the country. For example, out of a total 544 positions made available at
both technical and professional levels for the Forestry Department, 390 have yet to
be filled. Inadequate staffing makes it difficult for the department to implement and
monitor sustainable forest management programmes. This may be attributed to lack
of investment by central government, since most natural resource-based
17
departments are poorly funded. During the course of this study, it emerged that
district forest offices receive no funding whatsoever, despite the fact that they raise
millions of kwachas in revenue (Per. Comm.). Inadequate appropriate technology to
the sector has also made it difficult for these departments to perform their duties
effectively.
Additionally, the institutions created by various acts of legislation governing
land and natural resources tend to operate independently and with limited
coordination. A good example is the demarcation of forest reserves by the
Department of Land Resettlement. This responsibility comes under the Office of the
Vice President, yet the forest reserves fall under the jurisdiction of the Forest
Department of the Ministry of Mines and Natural Resources. Such cases highlight
the need to strengthen and streamline the role of the forest sector in relation to other
relevant sectors.
Political interference may have also contributed to massive forest cover loss
in Zambia. Often, forests are converted into farmland for reasons of political
expediency. Government attempts to provide for poverty alleviation have left natural
management-based institutions such as the Forestry Department all but powerless.
A number of forest reserves have been degazzetted and appropriated to provide
land for illegal squatters. Currently, out of 489 forest reserves in the country, 170 are
heavily encroached, while 109 are partially encroached (Forestry Department, 2005).
Between 6 and 12 forest reserves have been degazzetted since 2000 in each of the
following provinces: Copperbelt, Southern and Eastern. The degazzetting of such
forest reserves has probably served as an incentive to other squatters.
3.3.3 ENVIRONMENTAL FACTORS AND THEIR LINK TO DEFORESTATION
The biophysical environment of some parts of the country, namely Southern,
Western, and some parts of Central province, is relatively sensitive and fragile,
particularly in terms of steep slopes (escarpments), soils, climate and water. These
features influence the ability of vegetation to recover once it has been disturbed.
They also tend to have a strong impact on rural livelihood food security systems.
18
3.3.3.1 CLIMATE CHANGE AND THE PERFORMANCE OF THE AGRICULTURAL SECTOR
Higher temperatures and unpredictable rainfall (quantity and timing), frequent
extreme weather events and increasing severity of pests and diseases are common
phenomena not only in Zambia, but throughout Southern Africa (Lobell et al., 2008).
These factors have a severe impact on smallholder farmers, exacerbating levels of
poverty in the region, since local economies are largely dependent on subsistence
farming. Agriculture is a crucially important sector, not just for Zambia but for the
region as a whole, in terms of food security, contribution to Gross Domestic Product
(35 percent), employment (contributes between 60 and 80 percent of total labour)
and foreign exchange earnings (30 percent) (Abalu and Hassan, 1998).
Climate has been seen to exert an impact on agriculture through increased
drought frequency and intensity over the past 20 years in Zambia. The droughts of
1991/92, 1994/95 and 1997/98 resulted in a sharp drop in maize yields, which fell
from more than 500 000 metric tonnes in 1988 to about 10 000 metric tonnes in
some parts (e.g. Southern Province) (de Wit, 2006). In the 2004/2005 agricultural
season, two-thirds of Zambia, namely Eastern, Southern and Western provinces,
experienced prolonged drought spells, resulting in irreversible damage to most
crops, including drought-tolerant crops such as cotton and tobacco. These areas
experienced cereal production losses of some 56 percent, and more than one million
people needed food assistance up to June 2006 (de Wit, 2006). Generally, failure in
the agricultural sector due to adverse weather patterns leads resource-poor rural
communities to engage in off-farm activities, such as charcoal production.
Climate change may indirectly drive vegetation cover change. Its influences
on the extent, severity and frequency of wildfires depends on interactions between
several factors, including forest management history, drought frequency and severity
and a wide range of others. One example of a vegetation type where climate change
and forest management history may interact to influence change in vegetation cover
is the Baikiaea Forest. The exploited forest areas of the Baikiaea Forest tend to have
large quantities of woody debris on the floor, and grasses grow in open areas. With
persistent drought and high temperatures, these open areas become potential fire
hazards.
19
Furthermore, the starting of fires for all sorts of reasons is common practice
among many Zambians. Driving factors include vegetation control, clearing of fields
for cultivation, provision of potash (the Chitemene system), visibility improvement
during hunting and pasture management. Experimental evidence has shown that, if not
well managed, fire has the potential to contribute directly to forest cover loss (Bond,
2009; Lawton, 1978; Trapnell, 1959). Wild fires, especially late dry-season fires,
have been observed to reduce the productivity of miombo woodland across the
ecoregion (Grundy, 1995).
Once burnt, most miombo woodland trees tend to produce significantly less
basal area than unburnt trees of the same age (Grundy, 1995). Fires also have a
negative impact on the regeneration and survival of young plants. Fierce fires, which
in most cases occur in late dry season, are the most damaging to the woodland
ecosystem because of high quantities of extremely dry litter biomass (Chidumayo,
1995). According to Chidumayo et al. (1996), fierce fires are common in areas where
felling has recently taken place, due to large quantities of timber debris.
3.3.3.2 SOIL AND GEOMORPHOLOGICAL SYSTEMS
Geomorphological processes that have taken place over a geological time-scale
have resulted in some plateaux and hilly areas, with scattered vegetation forms (Fig. 5). This is particularly true for central, eastern and southern parts of the country,
which are covered by hilly escarpments and complex zones that form part of the lift
valley systems.

20
Figure 5: Hilly and rocky area with limited vegetation formation in Serenje, Central Province
These escarpments usually have steep slopes, making them highly sensitive to
erosion. Any human-induced disturbance to the existing vegetation cover in such
areas can cause severe land degradation, with no possibility of recovery even when
the disturbance ceases. The precise rates of erosion countrywide have not been
estimated, but visible evidence of this problem has been observed in localized areas
of Central, Lusaka and Southern provinces. Given that in most Zambian soils, the
highest nutrient concentration is found in the top 0-10 cm layer, erosion can result in
considerable losses of plant nutrients (MTENR, 2002), thus making it difficult for
regeneration to be sustained.
Poor land use practices such as uncontrolled slash-and-burn agriculture,
continuous monocropping, cultivation on sloped areas without conservation
measures, and overgrazing, easily accelerate soil erosion and hence deforestation.
Soil erosion has been observed to result in low crop yields and low livestock
productivity, causing food insecurity. As such, some farmers look to forest
exploitation as an alternative to agriculture, in an attempt to bridge the food security
gap.
21
3.3.4 SOCIO-ECONOMIC DRIVERS AND CAUSES OF DEFORESTATION
3.3.4.1 POVERTY AND DEFORESTATION
Poverty is perhaps the most immediate factor that undermines household capacity to
contribute to environmental management and sustainability. Extreme poverty has
consistently been higher in rural and peri-urban areas than in urban areas. Extreme
poverty levels continue to fluctuate, due to economic instability. High poverty levels
can be attributed to the national economic structure that has failed to favour
Zambia’s rural poor. Although the Zambian government has consistently expressed
a wish to take development to rural areas, it is also true that social welfare protection
has yet to be worked into the country’s economic programmes. Low domestic
earnings, coupled with high demand for fuelwood, have combined to exert pressure
on forest resources in rural Zambia.
3.3.4.2 WOOD EXTRACTION
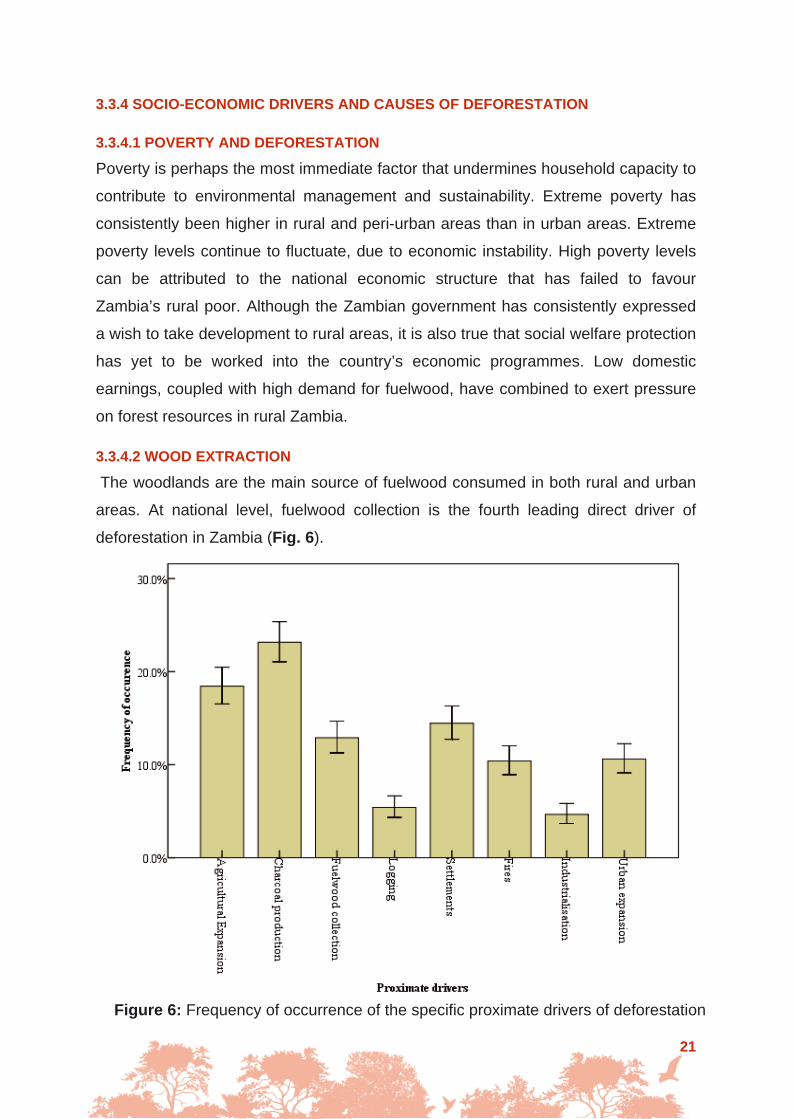
The woodlands are the main source of fuelwood consumed in both rural and urban
areas. At national level, fuelwood collection is the fourth leading direct driver of
deforestation in Zambia (Fig. 6).
Figure 6: Frequency of occurrence of the specific proximate drivers of deforestation
22
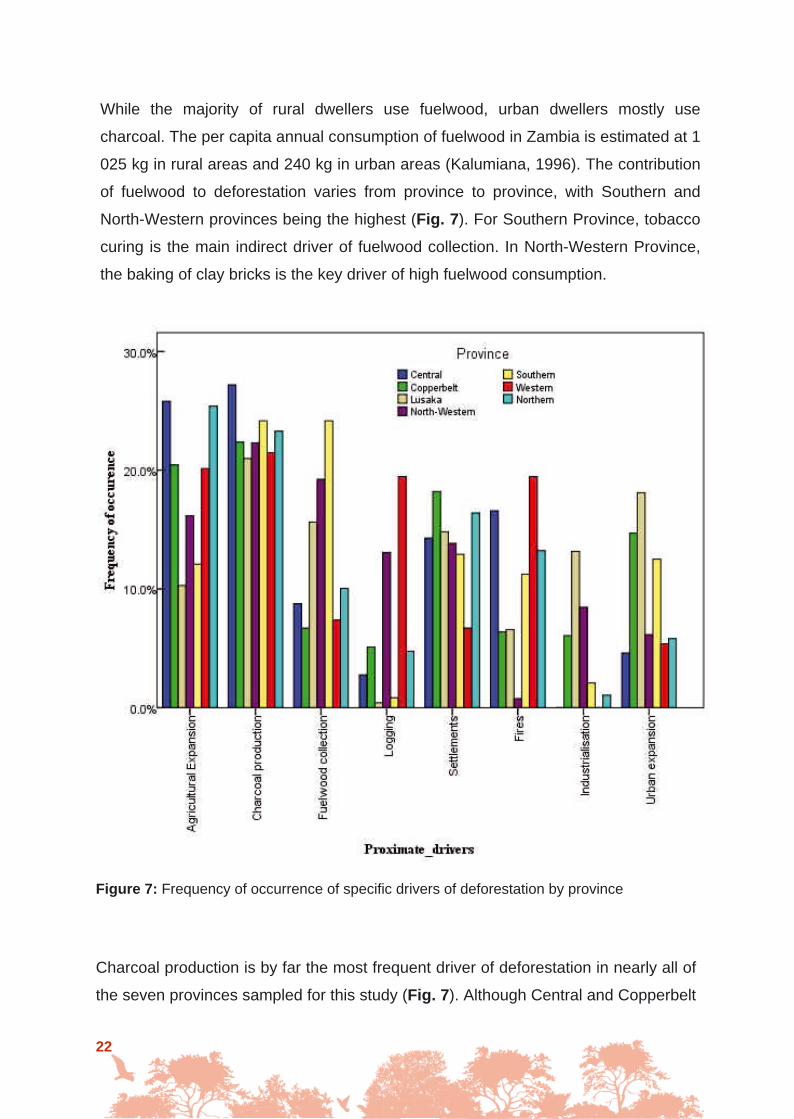
While the majority of rural dwellers use fuelwood, urban dwellers mostly use
charcoal. The per capita annual consumption of fuelwood in Zambia is estimated at 1
025 kg in rural areas and 240 kg in urban areas (Kalumiana, 1996). The contribution
of fuelwood to deforestation varies from province to province, with Southern and
North-Western provinces being the highest (Fig. 7). For Southern Province, tobacco
curing is the main indirect driver of fuelwood collection. In North-Western Province,
the baking of clay bricks is the key driver of high fuelwood consumption.
Figure 7: Frequency of occurrence of specific drivers of deforestation by province
Charcoal production is by far the most frequent driver of deforestation in nearly all of
the seven provinces sampled for this study (Fig. 7). Although Central and Copperbelt

23
provinces are the main charcoal hotspots in Zambia, there are worrying signs of
accelerated charcoal production in North-Western and Western provinces.
Generally, the increase in charcoal production is propelled by high energy demand in
the country’s urban centres. Fuelwood production is estimated to contribute at least
3 percent of the country’s GDP, and accounts for approximately 80 percent of the
economy’s total energy household balance (Kalinda et al., 2008). Charcoal use
therefore has socio-economic benefits for numerous actors along the chain, from
producers in rural areas to consumers in urban areas (Malimbwi et al., 2010).
Production distribution and marketing employs up to 500 000 people (Kalinda et al.,
2008). Low domestic earnings are forcing most rural households to intensify this
non-agricultural activity, as a risk avoidance strategy. Charcoal production has been
observed to have increased per capita income even when other sectors are not
doing well in rural areas. For example, the study of the contribution of charcoal to
income revealed that although rural per capita income from forestry and crop
agriculture declined from US$37.07 in 1990 to US$17.33 in 2000, the contribution of
charcoal increased from 65 percent to 83 percent over the same period (Chidumayo
et al., 2001). The demand for charcoal continues to increase due to rises in urban
populations and urban centres (e.g. Lumwana Town in North-Western Province).
The proportion of city dwellers is also on the increase. Growing and persistent urban
poverty in Zambia (Chiwele and Syampungani, 2011) has resulted in the dominance
of charcoal use, since this is assumed to be a cheap energy source. Consequently,
urbanization is also an environmental problem in Zambia. It should be emphasized
that charcoal production alone does not necessarily lead to permanent loss in
vegetation, but when followed by cultivation and late bushfires it may significantly
delay forest regeneration (Chidumayo,1997). A realistic solution to deforestation
driven by charcoal demand may lie in promoting synergies between forest and
energy policies in Zambia. While appreciating the efforts that have gone into
promoting rural electrification and solar energy, the slow pace at which these
initiatives are moving ahead gives considerable cause for concern.
3.3.4.3 AGRICULTURAL EXPANSION AND ASSOCIATED IMPACTS
Although the government has been promoting expanded agricultural production, the
practice on the ground has been that of extensification rather than intensification.
Agriculture has made a significant contribution to loss of forest resources in most

24
parts of Zambia. Overall, agricultural expansion ranks as the second most frequent
driver of deforestation in Zambia (Fig. 7). Results from this study revealed that in
Central, Copperbelt, Northern and Western provinces, agricultural expansion is the
second most frequent driver of deforestation (Fig. 7). These findings are hardly
surprising, given that the economy of Zambia is agro-based, with the majority of the
inhabitants’ practising subsistence farming. Agriculture provides the bulk of food and
cash requirements for the majority of Zambians (MTENR, 2002). With the growth in
population, there is mounting pressure to increase the area under agriculture to meet
food requirements, even if this is at the expense of forestry in Zambia. MTENR,
(2002) estimates that clearing land for agricultural production may account for some
90 percent of forest cover loss in Zambia. Large-scale agricultural systems and
shifting cultivation have been seen to be the major causes of forest cover loss.
Slash-and-burn, semi-shifting cultivation practices in areas where population density
is high (e.g. Southern and Northern provinces) results in a slow regeneration
process, thereby affecting forest cover. Rural-urban migration, coupled with low
incomes received from urban employment, also result in increased pressure on
forests. Recent political upheavals in Zimbabwe have seen waves of local
commercial farmers migrating to Zambia, most of them to Central Province. This
development carries with it the risk of reducing forest cover further, as newly settled
farmers open up land for crop production.
Internal migration has contributed to deforestation in some areas. For
example, movement from Southern Province into Lusaka and Copperbelt provinces,
due to land shortage and persistent drought, is causing areas such as Chongwe and
Masaiti Districts to be opened up for new settlements. Kalumba (1997) observed
deforestation of up to 400 ha and massive encroachment of the lower Zambezi
National Park arising from new settlements and immigration into the area.
Although grazing is among the least frequent drivers of deforestation,
overgrazing is a common phenomenon in Southern Province and parts of Lusaka,
Western and North-Western provinces (Fig. 7). Indirect drivers of overgrazing are
poor management practices, such as non-rotational grazing, the absence of
supplementary feeding systems, lack of control of livestock populations and
concentrating grazing pressure in localized pastoral areas. This latter practice has

25
resulted in overgrazing in most of these areas (MTENR, 2002). Overgrazing is
evident in Lusitu, Southern Province, Katete-Kagoro, Eastern Province and
Luangwa, Lusaka Province (MTENR, 2002). In the past, the problem of overgrazing
has also been observed in areas frequented by wildlife, especially in Luangwa
Valley, due to the high density of elephants in the 1970s and hippos along the
Luangwa River stretch (Caughley, 1975; Jachmann, 1994). High concentrations of
these animals resulted in severe pressure on vegetation, particularly on Mopane
woodland, with extensive areas left bare. Overgrazed areas are often associated
with bare land and gully formations, and sometimes with compacted soils, making it
difficult for any regeneration to be sustained.
3.3.4.4 LAND TENURE AND PROPERTY RIGHTS
The relevance of tenure security to forest governance lies in its role in shaping
incentives for forest management. History has shown how periods of insecure tenure
have led to widespread over-exploitation and destruction of forests. Conversely,
tenure security is known to be a necessary condition for sustainable forest
management. Strong tenure security, coupled with other enabling conditions (market
access, forest value, effectiveness of local institutions), can encourage local forest
users to invest in long-term returns from forests, preferring these to immediate pay-
offs. When systems of rights are unclear or unenforced, as is the case in Zambia,
open-access regimes may result in quick resource degradation and depletion. Most
of the land in Zambia is open access, without clearly defined property rights. It is
therefore not surprising that the majority of the open areas visited by the study team
were found to have been heavily disturbed. There can be little doubt that insecure
land tenure systems represent one of the major drivers for deforestation and
degradation in Zambia.
3.3.5 INFRASTRUCTURE DEVELOPMENT
Urbanization and industrialization are among the least frequent drivers of
deforestation in Zambia (Fig. 7). However, notwithstanding the potential socio-
economic benefits that come with urbanization and industrialization, these two
processes are contributing to forest degradation and deforestation in a number of
ways. Firstly, both are linked to land clearance, in order to pave the way for buildings
and road infrastructure. The mining sector has greatly contributed to forest cover

26
loss. Often, huge tracts of land are cleared to provide space for mining
infrastructures. At the Kalumbila Mining Concession alone, infrastructure
preparations will result in the loss of more than 7 000 ha of land before the
concession becomes fully operational. Secondly, infrastructure development is often
followed by increased demand for construction timber, already high on both local and
international markets. The result is greater pressure on both natural and plantation
forest resources.

27
3.4 CHALLENGES FOR REDUCING DRIVERS OF DEFORESTATION
Reducing deforestation and forest degradation is faced with many daunting
challenges which include:
3.4.1 POOR LINKAGE AND COORDINATION WITH OTHER RELEVANT INSTITUTIONS
Forest management efforts are still sectoral, scattered and uncoordinated, with
limited institutional enforcement and support. Linkage between the Forest
Department and other departments such as those of Energy and Agriculture need to
be strengthened to ensure optimal intervention in the management of forest
resources such as fuelwood supply and use, as well as the transition from fuelwood
to sources of renewable energy.
3.4.2 UNAVAILABILITY OF UPDATED INFORMATION ON THE NATIONAL STATUS OF FORESTS
Existing information on the forests and woodlands of Zambia is outdated and
incomplete. The last meaningful nationwide forest inventory was undertaken
between 1952 and 1967 (ILUA, 2010). Although ILUA (2005-2008) generated some
significant data sets, the methodology used was inadequate, given current demands
for sustainable forest management in Zambia. In addition, field surveys at 221
sample plots spread throughout the country, were designed to capture data for
global forest inventory reporting. As such, the inventory was not specific to the
different forest ecosystems and structures found across the country. A major
challenge therefore lies in developing a sound forest database that is of local
relevance.
3.4.3 LACK OF COMPLEMENTARITY OF RELEVANT POLICIES AND INSTITUTIONS
Natural resource-based policies are in most cases at variance with each other. In
order to overcome forces that degrade forest cover in Zambia, it is important to
enhance synergies between the various policies, many of which do not appear to be
consistent with norms of sustainable forest resource management.
3.4.4 LACK OF SUPPORTIVE AND INCLUSIVE NATURAL POLICIES
Current policies and legislation are restrictive. The regulatory system that governs
the management of forest and other natural resources involves the issuance of
permits by government authorities. The local regulatory systems, like the traditional

28
institutions, do not work closely with the government regulatory system, since this
latter is considered superior to the traditional system. The independent nature of
these two regulatory systems -- and to some extent, the subtle competition between
them -- has resulted in both institutions performing poorly as far as natural resources
management is concerned. The challenge would be to make policies supportive of
one another, and ensure that they are inclusive when it comes to management of
forest resources.
3.4.5 INFRASTRUCTURE DEVELOPMENT AND FOREST CONSERVATION
Increased population, urbanization and high poverty levels, especially those
associated with high levels of unemployment, result in over-dependence on
traditional biomass fuel and the clearing of surrounding woodlands for agriculture.
There is growing pressure on natural resources (including forest resources) to meet
human development needs and livelihood demands.
3.4.6 POLITICAL INTERFERENCE
In the past, high levels of political pressure have forced the Zambian government to
encourage over-exploitation and conversion of woodlands to other seemingly more
profitable land uses, at the expense of the environmental and ecological services
that the woodlands offer. There is a compelling need to minimize political pressure
on the management of forest resources. The key challenge is to raise awareness
among politicians of the role played by forest resources in the national development
agenda as a whole.
3.4.7 INSECURE LAND TENURE SYSTEM
Secure tenure is lacking for most of the land under traditional administration. Even
local community members who live on such land cannot be sure that they will not be
evicted to make way for foreign investors. Land is normally of open access and often
associated with the so-called tragedy of the commons – a situation where individuals
act independently in their own self interest, often to the detriment of shared
resources. Tenure security is an important issue for any carbon sequestration
project. Without clear and defensible rights to land, forest or sequestration services,
suppliers cannot make a credible commitment to supply carbon offsets. Investors
tend to have little confidence in financing carbon projects where local communities
do not have secure rights to land on which forestry activities are to take place.

29
3.4.8 LACK OF BENEFIT-SHARING MECHANISM
Experiences in areas under participatory management of natural resources show
that many of the benefits that accrue at community level are usurped by local elites,
in such a way that they do not trickle down to ordinary community members.
According to Tembo et al. (2009), the poor and less powerful members of the
community only attend meetings with their respective Village Action Groups (VAGs),
and get fewer benefits from their efforts, compared with more influential community
members. Resources and opportunities related to JFM programmes tend to be
skewed towards the upper caste and wealthier households, rather than benefiting
disadvantaged groups. This may still prove to be a problem when it comes to
implementing REDD+ programmes in Zambia.
3.5 OPTIONS AVAILABLE TO EFFECTIVELY REDUCE IMPACTS ON FOREST RESOURCES
Addressing land degradation and deforestation in Zambia presents two
complementary strategies for mitigating climate change. Firstly, by reducing or
halting degradation and deforestation, greenhouse gas (GHG) emissions associated
with land degradation and deforestation can be reduced (Syampungani and Chirwa,
2011). Secondly, changes in land management practices can lead to greater carbon
sequestration, thereby removing carbon from the atmosphere. Since carbon loss
from woodlands is associated with loss of vegetation cover and soil erosion,
management interventions that slow or reverse these processes can simultaneously
achieve carbon sequestration (Trumper et al., 2008). There are a number of forest-
based conservation strategies and initiatives designed to increase carbon stocks in
degraded sites (Syampungani et al., 2010c). They include enhancing soil quality and
erosion control, afforestation, woodland regeneration and agroforestry. Forest-based
systems, such as agroforestry and conservation of existing carbon pools through the
expansion of carbon sinks and avoided deforestation, are known to have significant
potential for carbon sequestration (Syampungani and Chirwa, 2011). Agroforestry
systems sequester carbon from the atmosphere and store it in both soil and their
vegetation components. The amount of carbon sequestered varies from one site to
another, and is also dependent on the rotational age of trees.
30
3.5.1 REGENERATION AND COPPICE ENHANCEMENT MANAGEMENT
Miombo woodland regrowth stands are said to be highly productive ecosystems
(Geldenhuys, 2005). This implies that these ecosystems have high rates of
photosynthetic processes and therefore a high uptake of carbon dioxide. Given the
formidable rates of deforestation and degradation in Zambia, it follows that there are
many degraded sites where carbon sequestration could be practised through
coppice or regeneration management. This would call for the adaptation of
management strategies that protect seedlings and shoots against fires, animal
grazing or drought. For example, weeding around seedlings would result in reduced
fire hazards, especially if done early. Reduction in stocking may reduce water stress.
Increasing stump heights during felling for either charcoal or slash-and-burn
agriculture would enhance the survival of stumps and coppicing (Grundy, 1990).
Handavu et al., (2011) indicated that adhering to optimum diameter classes, within
which species have high coppicing effectiveness during felling for either charcoal
production or for slash-and-burn agriculture, can enhance coppicing ability and
therefore recovery of woodland.
The time when trees are cut also affects coppicing vigour and production during the
initial stage of development. For example, Chidumayo (1993) observed that cutting
in July and November results in lower productivity than cutting in October. According
to Chidumayo et al., (1996), seasonality and climatic factors, especially temperature,
and phenology all appear to affect coppicing vigour and the productivity of sprouts
after tree cutting. Cutting in September and October probably results in the most
vigorous and productive coppice in the Zambian miombo woodland (Chidumayo et
al., 1996). Using the above information on the response of the woodland species to
cutting, there is scope for improving on existing silvicultural systems, namely i)
Coppice with standards and ii) Clear felling to enhance regeneration potential.
3.5.2 AGROFORESTRY, SOIL MANAGEMENT AND CLIMATE CHANGE MITIGATION
Shifting cultivation is a major cause of deforestation and degradation in Zambia. This
farming system is the result of extremely low fertility of highly weathered tropical soils
(oxisols), which forces farmers to shift to nearby forests. Agroforestry is often
considered as an alternative land use strategy that offers solutions to low soil fertility
problems. Agroforestry trees have the potential to increase organic matter in soil and
store sufficient amounts of carbon (C) woody biomass (Unrush et al., 1993).
31
Agroforestry helps to maximize soil fertility, thereby increasing crop yields (Akinnifesi
et al., 2008). The most common agroforestry technologies for improving crop yields
in Southern Africa include: traditional tree-crop and parkland systems such as the
Faidherbia albida-based system; improved fertilizer tree systems, such as coppicing
tree fallows (e.g. Gliricidia sepium and Leucaena spp.,) and improved fallow with
short duration species such as Sesbania spp., Tephrosia spp. These fertilizer tree-
based systems have demonstrated their ability to increase crop yields in the miombo
ecoregion. In Zambia, Sesbania sesban fallow was reported to have increased
maize yields by 500 percent (Chirwa et al., 2003), while in Malawi, an increase of
415 percent was reported among farmers using Sesbania sesban (Haule et al.,
2003). Different researchers have attributed the increased yields to a number of
factors namely:
Increased nutrient inputs, including biological N fixation (Kang and Akinnifesi,
2000);
Increased nutrient availability through enhanced soil biological activity and
rates of nutrient turnover (Akinnifesi et al., 2008);
Improved micro-climate and soil physic-chemical properties (Buresh and Tian,
1997).
These systems have also been reported to reduce insect pests, such as termites,
and weed problems (Sileshi and Mafongoya, 2006). The benefits of these soil
enriching technologies are not limited to soil replenishment, but extend to the
provision of fuelwood and other wood requirements for rural households.
Recent recognition of agroforestry as a GHG mitigation strategy under the Kyoto
Protocol has earned it added attention as a strategy for biological carbon
sequestration (Nair et al., 2009). Forest-based systems are known to have the
largest potential to mitigate climate change through conservation of existing carbon
pools and expansion of carbon sinks (e.g. agroforestry). The expansion of carbon
sinks through agroforestry provides unique opportunities for mitigating GHG
emissions, while addressing other more pressing livelihood concerns of the rural
poor. Zambia’s degraded land and low biomass land use systems can be converted
into agroforestry tree C-rich systems (Syampungani et al., 2010c).
32
The integration of trees in agroforestry land use has potential to increase soil
organic matter (SOM) and store significant amounts of carbon in the woody biomass.
Carbon can be sequestered from the atmosphere and stored in soils or vegetation in
agroforestry systems. The available literature indicates that smallholder systems
have the potential to sequester large quantities of carbon (Montagnini and Nair,
2004). For example, a two-year rotation of non-coppicing agroforestry species in
Eastern Zambia was reported to sequester 26-78 Mg ha-1 carbon in the soil, while a
four-year rotation sequestered 120 Mg ha-1 (Makumba et al., 2006).
3.5.3 FIRE MANAGEMENT
Four groups of species are observed across the miombo ecoregion, based on their
degree of tolerance to fire. These are:
Fire-intolerant species: Species that cannot survive fire and therefore occur only
where there is complete protection against fires. Examples include Parinari excelsa,
Entandophragma delevoyi and Syzygium guineense
Fire-tender species: Species which decline under regular burning and increase
under complete protection. These are predominantly the canopy species such as
Julbernadia paniculata, Isoberlinia angolensis and Brachystegia spiciformis
Semi-tolerant species: Species such as Maranthes polyandra, Uapaca kirkiana,
Baphia bequeartii and Strychnos pungens, that are relatively unaffected by early dry-
season fires but are reduced under late dry-season fires.
Fire-tolerant species: Species able to survive regular late dry-season fires either as
adults, saplings or regrowth. Examples include Pterocarpus angolensis, Parinari
curatellifolia and Pericopsis angolensis.
A successful fire management strategy in miombo woodland should therefore take
into account the age of the woodland, the phenology of the dominant and desired
species, the type of land use and the management objective of the area. However,
some of the general fire management practices in the miombo woodland are as
follows:
Piling all the discarded wood away from stumps and patches of dense sapling
and then burnt;

33
Protection of young regrowth stands against late dry-season fires by early-
season burning;
Grazing to maintain low grass levels while maximizing woody production;
Planned and management use of fires for clearing fields.
3.5.4 ALTERNATIVE ENERGY SOURCES AND IMPROVED CHARCOAL USE AND PRODUCTION METHODS
Fuelwood is the primary energy source for the majority of Zambians, for both
domestic use and processing (curing tobacco, drying fish). The high levels of
fuelwood used in Zambia point to the need to replan and manage the country’s
energy sector. Bioenergy presents an alternative modern, and more efficient use of
biomass energy. It involves converting the sugary and starchy part of a given plant,
or the oil in fruit, into liquid. Zambia has various types of bioenergy material (plant
materials, twigs, leaf litter, agricultural residues and dung) that may be exploited for
bioenergy production. This may call for strengthening the linkage between the
Forestry Department and other government offices, such as the Department of
Energy, so as ensure optimal intervention in the supply, management and use of
fuelwood in the transition to renewable energy sources.
Reducing the impact of charcoal production and consumption on woodland cover
would also require the use of improved stoves such as Jiko and Rocket models.
These stoves have high combustion and heat transfer efficiency. They can be
purchased at low and affordable prices. There is also a need to improve charcoal
production methods. Currently, the efficiency of traditional earth kiln methods is very
low, at up to just 25 percent (Chaposa, 2002). Other methods such as Casamance and
the Retort kiln, offer production efficiency rates of 35 percent (Seidal, 2008). However, using
these kilns for charcoal production involves overcoming a number of challenges:
i) The sophisticated skills needed to construct them present obstacles for the rural poor.
ii) High initial capital investment, ranging from US$300-400 (Falcão, 2008).
Overcoming these challenges requires supportive and coherent policies and
institutional structures. There is a need to have programmes in place that provide
assistance to rural communities, so that they can acquire the skills needed to build
and manage such kilns.
34
3.5.5 ALTERNATIVE LIVELIHOOD SYSTEMS
Poverty forces the majority of Zambians into indiscriminate exploitation of most
woodland resources. Reducing the impact of rural communities on woodlands
therefore requires developing other livelihood strategies that will be less damaging.
Woodlands play an important role in the livelihoods of many people by providing a
range of non-timber forest products (NFTPs) for subsistence consumption and trade.
The growing international trade in NTFPs, including medicinal plants, has increased
demand (FAO, 2005). Although there are many NTFPs with scope for poverty
alleviation, medicinal plants, honey and beeswax are believed to offer the greatest
potential.
Medicinal plants: Increased urbanization and the inadequacy of conventional
medicinal facilities have resulted in growing demand for traditional healing methods.
This has in turn led to a rise in demand for medicinal plants. Trade in medicinal
products can greatly enhance the economic well-being of communities at local,
national and international levels. For example, FAO (2000) estimated an annual
trade in medicinal plants of about US$4.4 million for Zambia. At regional level, the
market in raw materials for medicinal or therapeutic plants and products is estimated
at US$150 million. Trade in medicinal plants therefore offers an alternative livelihood
strategy, with potential for poverty alleviation among the country’s rural communities.
Honey and beeswax trade: Honey and beeswax are the main products harvested
from the honey bee, Apis mellifera; other products include pollen and brood comb.
Among woodland countries, Zambia is a leading exporter of honey. In 2005 the
country exported 219 tonnes of honey, valued at US$491,000 (ITC, 2006). Demand
for honey has increased by 30 percent over the past few years (Chidumayo &
Gumbo, 2010). Trade in honey and beeswax is therefore a real possibility for
resource-poor rural communities, and can have a significant impact on poverty
alleviation.
3.5.6 IMPROVING STAFFING LEVELS AND COLLABORATION WITH LOCAL COMMUNITY MEMBERS
If the Forestry Department is to monitor and manage forest resources effectively,
steps must be taken to improve staffing levels. There is also a need for the
department to motivate its employees through training and improved office

35
infrastructure and equipment. Forest Stations should be provided with reliable
transport for patrols and other forest management programmes.
The Forestry Department also needs to improve collaboration with local community
members. It is important that transparency prevails between the department and
local communities for the implementation of forest-related programmes. Clear
benefit-sharing mechanisms need to be set up between the government and local
communities. These mechanisms should clearly stipulate the distribution of benefits
between community members to avoid the problem of members of the elite taking
more than their fair share.
3.6 POTENTIAL FOR REDD+ IN ZAMBIA
There is much potential for REDD+ in Zambia. ILUA (2010) reports that the country
still has close to 50 million ha of forested land, which offers considerable potential to
increase carbon stocks if properly managed (Table 7).
Table 7: Estimates of main forest types
Forest type Total area (ha) Evergreen forest 819
Semi-evergreen forests 34 145
Deciduous forests 14 865
Other Natural forests 139
Broad-leaved forest plantations 0
Coniferous forest plantations 0
Total 49 968 Source: ILUA (2010)
The availability of huge expanses of forested land raises the possibility of Zambia’s
effective participation in the REDD+ mechanism. Deforestation that is not
accompanied by infrastructure development presents another path through which the
country could benefit from REDD+, through management of regeneration and
degraded lands.

36
3.6.1 WOODLAND RECOVERY, PRODUCTIVITY AND POTENTIAL FOR REDD+ PROJECTS
The Southern African woodland savannas are capable of almost total recovery from
clearing for either charcoal production or slash-and-burn agriculture (Fanshawe,
1971). Several studies have reported rapid development of regrowth in many parts
of the Southern African savannas (Syampungani & Chirwa, 2011). The regrowth
stands have been reported to be of higher stocking levels than mature woodlands
(Syampungani, 2008: Table 6). Additionally, higher values of stand basal areas of
between 30 and 50 m2 ha-1 have been recorded in the wet miombo and dry miombo
of Zambia and Zimbabwe respectively, in small-sized plots (Grundy, 1995;
Chidumayo, 1985) compared with up to just 22 m2 in old even stands (Table 8). The
recovery of woodland savannah after clearing is possible because most woodland
species have both vertical and extensive root systems, that facilitate recuperation
after cutting (Mistry, 2000).
Table 8: Biomass related parameters of Southern Africa woodlands
Range of variables Land use type Authors Density (stems/ha)
1 121-6 685 Regrowth (miombo) Syampungani et al., 2010a; Campbell et al., 1995; Strang, 1974
2 434-2 773 Uneven aged mature woodland (miombo)
Syampungani, 2008
837-1 131 Uneven aged mature woodland (Kalahari)
Timberlake et al., 2010
7 264-9 700 Regrowth (Kalahari)
Timberlake et al., 2010
Basal area (m2)
7-22 Uneven aged mature woodland
Lowore et al., 1994; Freson et al., 1994
30-50 Regrowth Grundy, 1995 Mean biomass (Mg ha-1)
21.8-81.03 Uneven aged mature woodland
Chidumayo, 1991
22-44.47 Uneven aged mature woodland
Guy, 1981; Martin, 1974
Growth rate (Mean annual ring width, mm)
4.4-5.6 Regrowth Syampungani, et al., 2010b
2.3-4.8 Uneven aged mature woodland
Shackleton, 2002; Rathogwa, 1999; Chidumayo, 1988
Adopted from Chirwa et al. (in prep)
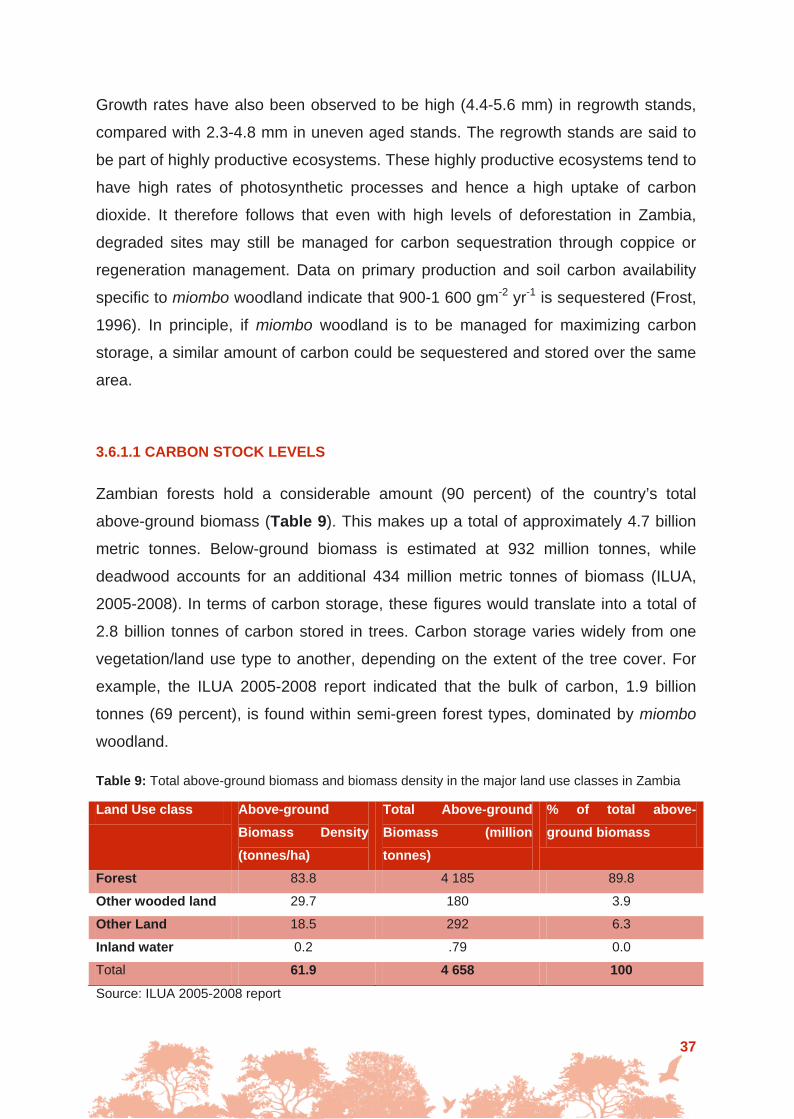
37
Growth rates have also been observed to be high (4.4-5.6 mm) in regrowth stands,
compared with 2.3-4.8 mm in uneven aged stands. The regrowth stands are said to
be part of highly productive ecosystems. These highly productive ecosystems tend to
have high rates of photosynthetic processes and hence a high uptake of carbon
dioxide. It therefore follows that even with high levels of deforestation in Zambia,
degraded sites may still be managed for carbon sequestration through coppice or
regeneration management. Data on primary production and soil carbon availability
specific to miombo woodland indicate that 900-1 600 gm-2 yr-1 is sequestered (Frost,
1996). In principle, if miombo woodland is to be managed for maximizing carbon
storage, a similar amount of carbon could be sequestered and stored over the same
area.
3.6.1.1 CARBON STOCK LEVELS
Zambian forests hold a considerable amount (90 percent) of the country’s total
above-ground biomass (Table 9). This makes up a total of approximately 4.7 billion
metric tonnes. Below-ground biomass is estimated at 932 million tonnes, while
deadwood accounts for an additional 434 million metric tonnes of biomass (ILUA,
2005-2008). In terms of carbon storage, these figures would translate into a total of
2.8 billion tonnes of carbon stored in trees. Carbon storage varies widely from one
vegetation/land use type to another, depending on the extent of the tree cover. For
example, the ILUA 2005-2008 report indicated that the bulk of carbon, 1.9 billion
tonnes (69 percent), is found within semi-green forest types, dominated by miombo
woodland.
Table 9: Total above-ground biomass and biomass density in the major land use classes in Zambia
Land Use class Above-ground Biomass Density (tonnes/ha)
Total Above-ground Biomass (million tonnes)
% of total above-ground biomass
Forest 83.8 4 185 89.8
Other wooded land 29.7 180 3.9
Other Land 18.5 292 6.3
Inland water 0.2 .79 0.0
Total 61.9 4 658 100
Source: ILUA 2005-2008 report

38
Changes in land cover have a significant influence on the biomass stock of any
vegetation type. Land use type, together with vegetation type, has an impact on the
amount of biomass stock of a particular region, and hence the carbon stock levels.
For example, Luapula Province, when compared with North-Western Province,
experienced a higher rate of change in both biomass and carbon stocks between
1965 and 2005 (Table 10). This may be attributed to the fact wood extraction,
especially for fish drying, was higher in Luapula Province than in North-Western
Province, where the demand for fuelwood is low due to less economic activity in that
period.
Table 10: Estimated historical biomass and carbon stock changes from 1965-2005 in Zambia
Province Biomass stocks
(million tonnes)
Annual biomass
change
(1965-2005)
Carbon stocks
(million tonnes)
Annual change in
carbon stocks
1965 2005 Million
tonnes
% 1965 2005 Million
tonnes
%
Central 450.56 266.59 4.6 1.02 211.76 125.3 2.16 1.02
Copperbelt 149.54 89.14 1.51 1.01 70.28 41.89 0.71 1.01
Eastern 274.57 181.16 2.34 0.85 129.05 85.14 1.1 0.85
Luapula 215.99 1.58 5.36 2.48 101.52 0.74 2.52 2.48
Northern 486.58 283.91 5.07 1.04 228.69 133.44 2.38 1.04
North-
Western
868.8 481.62 9.68 1.11 408.34 226.36 4.55 1.11
Southern 279.42 256.56 0.57 0.2 131.33 120.59 0.27 0.2
Western 339.58 249.55 2.25 0.01 159.6 117.29 1.06 0.01
Zambia 3065.04 1810.11 31.38 1.02 1440.57 850.75 14.75 1.02
Source: Chidumayo, 2012
3.6.2 MECHANISMS OF CARBON STORAGE AND LOSS IN WOODLANDS
Land use change and degradation are important sources of GHGs. Land
degradation leads to increased carbon emissions in two ways: i) through loss of
biomass due to vegetation destruction and ii) increased soil erosion.
39
Zambian woodlands, like many other vegetation formations, take up CO2 from
the atmosphere by the process of photosynthesis and incorporate it into plant
biomass. Although plant biomass per unit area of the Zambian vegetation may be
low (6 Kg/m2), as in many dryland ecosystems, the country’s large surface area of
vegetation gives the potential for carbon sequestration an international significance.
Deforestation, through conversion to farmland, slash-and-burn agriculture, charcoal
production, bushfires and wood harvesting, are modifying and transforming Zambian
woodlands into a degraded landscape (Chilufya and Tengäs, 1996). Conversion of
land into other uses leads to soil erosion, continuous loss of nutrients and
degradation of woodlands. In terms of carbon content, a comparative study between
agricultural fields and natural woodlands in Malawi indicated that degraded sites
contain 40 percent less carbon than natural woodlands (Walker and Desanker,
2004). This implies that the degraded sites are far from being saturated with carbon,
and their potential to sequester carbon could therefore be high. That is because in
addition to erosion, the conversion of forests influences soil properties, such as the
chemical composition of organic matter and its matrix capacity to act as storage for
carbon (FAO, 2004; Lal, 2004).
3.7 METHODOLOGIES AND TOOLS FOR ESTIMATING DEFORESTATION TRENDS
Remote sensing remains an essential tool for establishing baselines and monitoring
progress in reducing emissions from deforestation. However, in many developing
countries, capacity will need to be strengthened considerably if such methodologies
are to be used (BÖttcher et al., 2009). The assessment of emissions from
deforestation and degradation requires data on both change in forest cover and
estimates of carbon stock changes associated with transition between land use
types.
A number of new and innovative technologies have recently approached
operational feasibility. These include light detection and ranging (LiDAR) (Defries et
al., 2007). LiDAR techniques involve large amounts of data. The IPCC compiled
methods and good practice guidance (IPCC, 2003) to move from two-dimensional
(forest area) to three-dimensional (carbon stock) evaluation changes. IPCC suggests

40
the use of remote sensing technologies only to assess forest area changes, while
there are no indications for the use for direct biomass estimates (BÖttcher et al.,
2009). Usually, this methodology should be consistent at repeated intervals, and
results need verification with ground-based or very high resolution remote
observations.
The existing technologies and their associated costs for acquisition and
analysis are listed in Table 11 (BÖttcher et al., 2009). Though remote sensing-
related methodologies have been identified as key technologies for successfully
implementing and monitoring the REDD mechanism (Herold and John, 2007), they
are expensive and beyond the reach of most developing countries. Remote sensing
assessments of deforestation and degradation involve the cost of obtaining suitable
satellite data, processing hardware and software, training and capacity building, to
name but a few.
Zambia may continue to rely on ground-based national forest inventories as
the main tool for monitoring deforestation and degradation. Recognizing the
availability of cheap reliable remote sensing tools, we recommend that Zambia
combine both ground inventories and some remote sensing. In terms of
sustainability, traditional national inventories would provide data of the growing
stock, timber volume per unit area, by tree diameter or age classes and species
composition. In order to implement remote sensing technologies for estimating
deforestation and forest degradation, Zambia, like any other developing country, will
face capacity building costs which may include costs for establishing research
capacity, technological transfer and legal support. However, if commitment is made,
we feel that the country has enough human capacity to manage a well functioning
remote sensing unit.

41
Table 11: Present acquisition and analysis costs* of monitoring of various technologies in US$
Satellite Sensor Resolution and coverage or project area
Cost for data acquisition (US$/km2)
Cost for analysis (US$/km2)
Total monitoring costs (US$/km2
)
Optical, medium resolution sensors Landsat-5, TM 30 m, 180x180 km 0.02-
free Classification 0.12-0.31 Change detection 0.4-0.6
0.50-1.21
SPOT 4 20 m 0.31 Terra ASTER 15 m, 60x60 km 0.02 CBERS-2, HRCCD 20 m Free in
Brazil
DMC 32 m, 160x 660 km 0.04 IRS-P6-LISS III 23.5 m 0.07 Human resources and
equipment 0.5 0.57
Optical, high resolution sensors Quickbird 3 m 25 Classification 2.2-2.5
Change detection 4.7-7.9 7.50-35.40
Ikonos 4 m 25 RapidEye 5 m 2.8 SPOT-5, HRVIR 5-20 m, 60x60 km 0.6 Optical, very high resolution sensors Quickbird 0.6 m 16-22 Classification 100-125 116-272 WorldView-1 0.5 m 16-22 Change detection 160-250 116-272 Radar, SAR ALOS PALSAR 10-15 m 0.04 Classification 2.2-2.5 6.94-
10.44 Satellite or Shuttle 0.14 Change detection 4.7-7.9 7.04-
10.54 Airborne SAR 345 >345 LiDAR UK, forest monitoring, national average
28 000 km2 415
US, forest inventory at project level
40 km2
455
US, project area 180 km2 388 Indonesia, forest inventory at project level
136 km2 400-550
169 hours processing time >400-550
Ground-based inventories and national/project examples US, project example 180 km2, 1 000 sample plots 167 UK, ground survey 28 000 km2 172 Bolivia, Noel Kempff 6 340km2, 625 sample plots 17-
0.16 55
Costa Rica, Private forestry project monitoring
570 km2 100
Indian National Forest Inventory and additional biomass assessment
677 088 km2; ca. 7 000 NFI plots + 1 400 additional plots
<10
National Forest Monitoring and Assessment
Total forest monitoring costs of five examples (Zambia, Honduras, Nicaragua, Bangladesh, Cameroon)
1.2-8.2
Indonesia, Ulu Masen Project RS monitoring and management Airborne monitoring (ultra light aircraft)
7 500 km2 81 200
Source: BÖttcher et al., 2009
42
4.0 CONCLUSIONS AND RECOMMENDATIONS
Evidence from this preliminary study suggests that deforestation is on the rise and
may continue to be so for many years to come. The key deforestation hotspots still
lie along the main rail link. However, an upward trend can be seen in most parts of
rural Zambia. The drivers of deforestation in Zambia are numerous and at any one
site, the main ones are closely interlinked. These drivers vary from province to
province. The top four leading drivers of deforestation are charcoal production,
agricultural expansion, fuelwood collection and settlements. The major indirect
drivers of deforestation are low institutional capacity, declining economic gains, high
poverty levels and environmental factors. The interaction between these drivers is
complex. Addressing these factors requires an integrated approach, ranging from
improved livelihood systems to an enhanced supportive policy framework. Improving
rural livelihood systems would greatly contribute to rural poverty alleviation, thereby
reducing over-dependence on forest resources by rural communities. The study has
also shown that most Zambian woodland has high recovery potential once
disturbances cease. This high recovery potential is indicative of the carbon
sequestration potential for these woodlands.
Although the original objective of this work was to carry out a nationwide
survey, the time and resources available did not permit such a wide-ranging study to
be undertaken. For this reason, the results of the present study must be interpreted
with some caution. In general terms, it was not easy to reach major conclusions
regarding the drivers of deforestation and the potential for REDD+, based on 21
towns in a space of five weeks. We believe that more detailed and longer-term
studies, focusing on all the major vegetation types, would be required to answer
pertinent questions such as: i) What are the biomass stocks of the major vegetation
types of Zambia, and how are they changing? ii) How does primary production vary
across the major vegetation types in Zambia? iii) What are drivers of land use
change across the major vegetation types, and how do they influence biomass
accumulation over time? The above recommendations are intended to provide a
stronger scientific database on biomass accumulation and carbon sequestration for
the major vegetation types found in the country.

43
5.0 REFERENCES Abalu, G. & Hassan, R. 1998. Agriculture productivity and natural resource use in
Southern Africa. Food Policy, 23: 477-490.
Akinnifesi F.K., Chirwa, P.W., Ajayi, O.C., Sileshi, G., Matakala, P., Kwesiga, F.R., Harawa, R. & Makumba, W. 2008. Contributions of agroforestry research to livelihood of smallholder farmers in Southern Africa: 1. Taking stock of the adaptation, adoption and impact of fertilizer tree options. Agricultural Journal 3(1): 58-75.
Alajarvi, P. 1996. Forest Management Planning and Inventory. ZFAP, MENR. Lusaka, Zambia.
Bond, W. J., Woodward, F. I. & Midgley, G. F. 2005. The global distribution of ecosystems in a world without fire. New Phytologist 165: 525-538.
Bottcher H., Eisbrenner K., Fritz S., Kindermann G., Kraxner F., McCallum I. & Obersteiner M. 2009. An assessment of monitoring requirements and costs of
reduced emissions from deforestation and degradation. Carbon Balance and
Management 4: 4-7.
Bwalya, B. 2007. Katanino Joint Forest Management area, Masaiti District, Zambia: Challenges and opportunities. Msc Dissertation, Norwegian University of Life Sciences, Norway.
Bwalya, S.M. 2004. Rural Livelihoods and Collective Action in Joint Forest Management in Zambia. Unpublished report February 2004. University of Rhode Island. Department of environmental and natural resource economics. Atlanta, Georgia, USA.
Buresh, R.J. & Tian, G. 1997. Soil improvement by trees in sub-Saharan Africa. Agroforest System 38: 51-76.
Caughley, G. 1975. The Elephant Problem in the Luangwa Valley: Vegetation Response to the effects of Elephant Browsing.
Chabala, C. 2004. Forest management in Zambia: A focus on women’s access to forest resources management in Chief Chiwala’s area, Masaiti district. Submitted in partial fulfilment of the Master’s Degree in Women’s law, 26 March, 2004. Southern African Regional Centre for Women’s Law, University of Zimbabwe. Food and Agriculture Organization, 2005. Global Forest Resources Assessment. Progress towards sustainable forest management. FAO forestry paper 147.

44
CHAPOSA .2002. Charcoal Potential in Southern Africa. NCO-DEV: International
Cooperation with Developing Countries.
Chidumayo, E.N. 1985. Structural differentiation of contiguous savanna woodland types in Zambia. Geo-Eco-Trop 9: 51-66.
Chidumayo E.N. 1988. A re-assessment of effects of fire on Miombo regeneration in Zambian Copperbelt. Journal Tropical Ecology 4: 361-372.
Chidumayo, E.N. 1991. Woody biomass structure and utilization for charcoal production in a Zambian miombo woodland. Bioresources Technology 37: 43-52.
Chidumayo, E.N. 1993. Responses of miombo to harvesting: ecology and management. Stockholm Environment Institute, Stockholm, Sweden.
Chidumayo, E.N. 1997. Miombo ecology and management: An introduction. Stockholm Environment Institute, Stockholm, Sweden.
Chidumayo, E.N. 1995. Handbook of miombo ecology and management. Draft edition, Stockholm Environment Institute, Stockholm, Sweden.
Chidumayo, E.N., Gambiza, J. & Grundy, I. 1996. Managing miombo woodlands. In: Campbell, B. (ed)., The Miombo in Transition: Woodlands and Welfare in Africa. CIFOR, Bogor.
Chidumayo, E.N., Masaileti, I., Ntalasha, H. & Kalumiana, O.S. 2001. Charcoal potential in Southern Africa (CHAPOSA)-report for Zambia. Stockholm Environment Institute, Stockholm, Sweden.
Chidumayo, E.N. 2012. Development of reference emission levels for Zambia.
Report prepared for FAO – Zambia.
Chilufya, H., Tengnäs, B. 1996. Agroforestry extension manual for northern Zambia. Regional Soil Conservation Unit (RSU), Technical Handbook Series, Nairobi, Kenya.
Chirwa, T.S., Mafongoya P.L., Chintu, R. 2003. Mixed planted-fallows using coppicing and non-coppicing tree species for degraded Acrisols in eastern Zambia. Agroforest System 59: 243-251.
Chirwa, P.W., Syampungani, S. & Geldenhuys, C.J. (in prep). Managing Southern African woodlands for biomass production: The potential challenges and opportunities. In: Bioenergy production from forests. Springer.
Chiwele, D. & Syampungani, S. 2011. Millenium Development Goal Report for Zambia.

45
Chundama, M. (2009) Preparing for REDD in dryland forests: Investigating the options and potential synergy for REDD payments in the miombo eco-region (Zambia country study). International Institute for Environment and Development (IIED), London, UK.
Defries, R., Achard, F., Brown, S., Herold, M., Murdiyarso, D.,Schlamadinger, B. & de Sauza, C. Jr. 2007. Earth Observations for estimating greenhouse gas emissions from deforestation in developing countries. Environmental Science and Policy 2007, 10: 385-394.
Environmental Council of Zambia. 2008. Zambia Environment Outlook Report 3. Environmental Council of Zambia, Lusaka, Zambia.
Falcáo, M. P. 2008. Charcoal Production and Use in Mozambique, Malawi, Tanzania
and Zambia, Historical Overview, Present Situation and Outlook.
FAO. 2000. FRA 2000 On definitions of forest and forest change. Working Paper 33. 2nd November 2000. FAO. Rome.
FAO. 2004. Carbon sequestration in Dryland Soils, World Soils Resources Reports 102. Rome.
FAO. 2005. Global Outlook Study For Africa. Sub-regional Report: Southern Africa. African Development Bank/European Commission/FAO. Rome.
Forestry Depart. 2005. Annual Reports. Unpublished. Forestry Department, Lusaka, Zambia.
Frost, P.G.H. 1996. The ecology of miombo woodlands. In: Campbell, B. (Ed.), The miombo in transition: Woodland and Welfare in Africa. CIFOR, Bogor. pp 11-55.
Geldenhuys, C.J. 2005. Basic guidelines for silvicultural and management practices in Mozambique. Report FW-04/05, FORESTWOOD cc, Pretoria, South Africa. 78 pp.
Geist, H.J. & Lambin, E.F. 2002. Proximate causes and underlying driving forces of tropical deforestation. BioScience, 52: 143-150.
Grundy, I.M. 1990. The potential for management of indigenous woodlands in communal farming areas of Zimbabwe with reference to the regeneration of Brachystegia spiciformis and Julbernadia globiflora. Msc. Thesis, University of Zimbabwe, Harare, Zimbabwe.
Grundy, I.M. 1995. Regeneration and Management of Brachystegia spiciformis (Benth). And Julbernadia globiflora (Troupin) in miombo woodland, Zimbabwe. D.Phil Thesis, University of Oxford, UK.
46
GRZ. 1998. An overview of Copperbelt Province Forestry Action Plan. PFAP/DfID, Ndola.
Guys, P.R. 1981. Change in the biomass and productivity of woodlands in the Sengwa Wildlife Research Area, Zimbabwe. Journal of Applied Ecology, 18: 507-519.
Handavu, F., Syampungani, S. & Chisanga, E. 2011. The influence of stump diameter and height on coppicing ability of selected key miombo woodland tree species of Zambia: A guide for harvesting for charcoal production. Journal of Ecology and the Environment, 3(12).
Haule, C.A., Kanyanma-Phiri, G.Y., Nyirenda, N.M., Mafongoya, P.L. & Kwapata, M.P. 2003. Maize and biomass production and soil fertility improvement under
Sesbania sesban improved fallows in Kasungu district in central Malawi.
Malawi Journal of Agricultural Science, 2: 21-33.
Henry, M., Maniatis, D., Gitz, V., Huberman, D. & Valentini, R. 2011.
Implementation of REDD+ in sub-Saharan Africa: state of knowledge,
challenges and opportunities. Environment and Development Economics, 16:
381-404.
Hosier, H.H. 1993. Charcoal production and environmental degradation. Energy Policy, 21: 491-509.
ILUA. 2010. Integrated Land Use Assessment 2005 – 2008. ILUA. Lusaka, Zambia.
Jachmann, H. 1994. 40 years of hippo population monitoring in the Luangwa Valley. LIDRP, Chipata.
Kaimowitz, D. 2003. Forest Law Enforcement and Rural Livelihoods. CIFOR, Bogor.
Kalinda, T., Bwalya, S., Mulolwa, A. & Haantuba, H. 2008. Use of Integrated Land Use Assessment (ILUA) data for forestry and agricultural policy review and analysis in Zambia. Ministry of Tourism, Environment and Natural Resources, Zambia.
Kalumba, J. 1997. Human Encroachment in Lower Zambezi National Park: Resolving the Conflict. EDF/NPWS Project, Lusaka. In: Larsen, T. & Lungu, F.B. (Eds), Preparation Report for Luangwa Integrated Resource Development Project. NORAD, Lusaka, Zambia.
Kalumiana, O.S. 1996. Study on the demand and supply of firewood and charcoal, Copperbelt Province. Provincial Forestry Action Programme, Ndola, Zambia.

47
Kang, B.T. & Akinnifesi, F.K. 2000. Agroforestry as alternative land-use production systems for the tropics. Natural Resources Forum, 24: 137-151.
Lal, R. 2004. Soil Carbon Sequestration Impacts on Global Climate Change and Food Security. Science, 304 (5677): 1623-1627.
Lawton, R. M. 1978. A Study of the Dynamic Ecology of Zambian Vegetation. Journal of Ecology 66: 175-198.
Lobell, D.B., Burke, M.B., Tebanldi, C., Mastrandrea, M.D., Falcon, W.P. & Naylor, R.L. 2008. Prioritizing climate adaptation needs for food security in 2030. Science, 319:607-610.
Lowore, J., Coote, H.C., Abbott, P.G., Chapola, G.B. & Malembo, L.N. 1995. Community use and management of indigenous trees and forest products in Malawi: The case of four villages close to Chimaliro forest reserve. Forestry Institute of Malawi Report No. 93008, Zomba.
Makumba, W., Akinnifesi, F.K., Janssen, B. & Oenema, O. 2006. Long-term impact of a Gliricidia-maize intercropping system on carbon sequestration in southern Malawi. Agriculture, Ecosystems & Environment 118: 237–243.
Martin, R.B. 1974. Structure, biomass and utilization of vegetation in mopane and miombo woodlands of Sengwa Wildlife Research Area. Certificate in Field Ecology thesis, University of Rhodesia, Salisbury, Zimbabwe.
Millenium Assessment (MA). 2005. Millenium Ecosystem Assessment. Ecosystems and Human Well-being: Desertification Synthesis. World Resources Institute, Washington, DC., USA.
Ministry of Tourism, Environment and Natural Resources (MTENR). 2002. Zambia National Action Programme for combating Desertification & Mitigating serious effects of Drought in the Context of the United Nations Convention to combat Desertification. Ministry of Science, Technology and Vocational Training, Lusaka, Zambia.
Mistry, J. 2000. Woodland Savannas. Ecology and Human Use. Pearson Education Limited, Edinburgh. UK.
Montagnini, F. & Nair, P.K.R. 2004. Carbon sequestration: unexploited
environmental benefit of agroforest systems. Book of Abstracts. 1st World
Congress of Agroforestry.
Nair, P.K.R., Kumar, B.M. & Nair,V.D. 2009. Agroforestry as a strategy for carbon sequestration. Journal Plant Nutrition & Soil Science 172: 10–23.

48
Phiri, M. 2009. Investigation on Performance of Joint Forest Management (JFM) Programme: Case of Dambwa Forest Reserve in Livingstone District, Zambia. MFor. Dissertation, University of Stellenbosch, South Africa.
Shackleton, C.M. 2002. Growth patterns of Pterocarpus angolensis in savannas of the South African lowveld. Forest Ecology and Management 166: 85-97.
Shackleton, C.M. & Scholes, R.J. 2011. Above ground woody community attributes, biomass and carbon stocks along a rainfall gradient in the savannas of Central lowveld, South Africa. South Africa Journal of Botany 77: 184-192.
Sileshi, G. & Mafongoya, P.L. 2006. Long-term effect of legume-improved fallows on soil invertebrates and maize yield in eastern Zambia. Agriculture Ecosystems & Environment 115: 69-78.
Syampungani, S. 2008. Vegetation Change Analysis and Ecological Recovery of the Copperbelt Miombo Woodlands of Zambia. PhD Thesis, University of Stellenbosch, South Africa.
Syampungani, S. & Chirwa, P.W. 2011. Miombo Woodland Productivity: The Potential Contribution to Carbon Sequestration and Payment for Environmental Services in East and Southern Africa. In: Wallace, E.B. (ed.), Woodlands: Ecology, Management and Conservation. Nova Science Publishers, Inc., New York, USA.
Syampungani, S., Chirwa, P.W., Akinnifesi, F.K. & Ajayi, O.C. 2010c. The Potential of Using Agroforestry as a Win-Win Solution to Climate Change Mitigation and Adaptation and Meeting Food Security Challenges in Southern Africa. Agricultural Journal 5(2): 80-88.
Tembo, G., Bandyopadhyay, S. & Pavy, J.M. 2009. Impact of Natural Resources Conservation Policies on Household Consumption around Zambian National Parks. Policy Synthesis, Food Security Project: Lusaka, Zambia.
Timberlake, J, Chidumayo, E. & Sawadogo, L. 2010. Distribution and characteristics of African dry forests and woodlands. In Chidumayo, E. and Gumbo, D.J. (Eds.) The dry forests and woodlands of Africa: Managing for products and services, pp.11-39. Earthscan.
Trapnell, C. G. 1959. Ecological Results of Woodland and Burning Experiments in Northern Rhodesia. Journal of Ecology, 47: 129-168.
Trumper, K., Ravillous, C. & Dickson, B. 2008. Carbon in Drylands: Desertification, Climate Change and Carbon Finance. A UNEP-UNDP-UNCCD Technical Note for Discussions at CRIC 7, Istanbul, Turkey-03-14 November, 2008.
Unruh, J.D., Houghton, R.A. & Lefebvre, P.A. 1993. Carbon storage in agroforestry: an estimate for sub-Saharan Africa. Climate Research 3: 39-52.

49
Veldkamp, A. & Fresco L.O. 1996. CLUE-CR: an integrated multi-scale model to
simulate land use change scenarios in Costa Rica. Ecological Modelling 91:
231–248.
Verburg, P.H., Soepboer, W., Limpiada, R., Espaldon, M.V.O. & Sharifa, M. 2002. Land use change modelling at the regional scale: the CLUE-s model.
Environmental Management 30: 391–405.
Verburg, P.H., Veldkamp, A., Engelsman W., van Zalinge R., van Mensvoort, M.E.F. & Overmars, K. 2003. The use of models to assess the impact of land
use change on ecological processes: case-studies of deforestation in SE Asia.
In: Gerold, G., Fremerey, M. & Guhardja, E. (eds). Land use, nature
conservation, and the stability of rainforest. Springer. Berlin, Germany.
Walker, S.M. & Desanker, P.V. 2004. The impact of land use on soil carbon in miombo woodlands in Malawi. Forest Ecology and Management, 203: 345-360.
Wamunyima, S. 2011. Land cover/land use change analysis for the Kamfinsa sub catchment area Kitwe, Zambia. Report for the Ministry of Energy and Water Development.
White, F. 1983. The Vegetation of Africa. A descriptive memoir to accompany the UNESCO/AETFAT/UNSO vegetation map of Africa. UNESCO.

50
GLOSSARY
Afforestation: Conversion from other land uses into forest, or the increase of the canopy cover to above the 10 percent threshold.
Deforestation: The conversion of forest to another land use or the long-term reduction of tree canopy cover below the 10 percent threshold.
Forest degradation: Reduction of the canopy cover or stocking within a forest (provided that the canopy cover stays above 10 percent).
Forests: Lands of more than 0.5 ha, with a tree canopy cover of more than 10 percent, which are not primarily under agricultural or urban land use.
Industrialization: The process of social and economic change that transforms a human group from an agrarian society into an industrial one (closely related with technological innovation, particularly with the development of large-scale energy and metallurgy production).
Reforestation: Re-establishment of forest formations after a temporary condition with less than 10 percent canopy cover due to human-induced or natural perturbations.
Urban expansion: The spreading outwards of a city and its suburbs to its outskirts to low-density and auto-dependent development on rural land.
Urbanization: Process by which there is an increase in proportion of a population living in places classified as urban (the movement from a rural to urban area).

51
APPENDICES
APPENDIX I: Terms of reference
TERMS OF AGREEMENT
1. Introduction
In accordance with the United Nations Collaborative Programme on Reducing
Emissions from Deforestation and Forest Degradation (UN-REDD+) in Zambia work
plan, the programme invited eligible consultants to undertake the following
consultancy:
‘Preliminary Study on Drivers of Deforestation and Forest Degradation and Potential
for REDD+ in Zambia’
The School of Natural Sciences of the Copperbelt University accordingly applied and
was awarded the consultancy.
2.0 BACKGROUND
The Inter-governmental Panel on Climate Change (IPCC) report indicated that about
20 percent of GHG emissions was as a result of land use changes, mainly
deforestation and forest degradation. Consequently, the REDD+ mechanism was
conceived and entered international climate change negotiations. Zambia is among
the first nine pilot countries of the United Nations Collaborative Programme on
Reducing Emissions from Deforestation and Forest Degradation in Developing
Countries (UN-REDD Programme) (http://www.un-redd.org/). The UN-REDD
programme for Zambia is a United Nations support to Government, civil society and
community level stakeholders to assist with the preparation for the REDD+
mechanism in the country. It fits within the framework of the Environment and
Natural Resource Management and Mainstreaming Programme (ENRMMP),
ensuring that the country, in view of the post-Kyoto protocol climate change regime,
is ready for the REDD+ initiative. It is expected that REDD+ will be an internationally

52
agreed and recognized climate change mitigation instrument in the post-Kyoto
context.
The UN-REDD programme for Zambia intends “to prepare Zambian institutions and
stakeholders for effective nationwide implementation of the REDD+ mechanism”,
and was allocated a budget of US$4.5 million for a period of 3 years (2011-2013). It
will be implemented by the Government of Zambia, with support from the three U.N.
agencies that are part of the partnership (namely FAO, UNDP and UNEP), and with
intense stakeholder engagement.
REDD+ is an international initiative aimed at enhancing the value of standing
forests and offering incentives for sustainable forest management through a multi-
stakeholder approach. During the REDD+ readiness process (UN-REDD
Programme), in order to benefit from the initiative, Zambia will have to undertake the
following actions:
Develop a National Strategy or Action Plan to reduce deforestation;
Develop a national forest reference emission level and/or forest reference
level (interim measure, sub- national);
Develop a robust and transparent national forest monitoring system for the
monitoring and reporting of REDD + activities (interim measure, sub-national);
Establish a system for providing information on how safeguards for local
community and forest biodiversity are being addressed and respected
throughout the implementation of REDD+ activities, while respecting
sovereignty.
The readiness process for Zambia involves the development of a national strategy to
reduce deforestation and forest degradation.
The Zambian National Joint Programme Document goals, objectives and outcomes
are outlined below:
Programme Goal: To prepare Zambian institutions and stakeholders for effective
nationwide implementation of the REDD+ mechanism.
Programme Objectives:
a. Build institutional and stakeholder capacity to implement REDD+

53
b. Develop an enabling policy environment for REDD+
c. Develop REDD+ benefit-sharing model
d. Develop Monitoring, Reporting and Verification (MRV) systems for REDD+.
Joint Programme Outcomes: Outcome 1: Capacity to manage REDD+ Readiness strengthened
Outcome 2: Broad-based stakeholder support for REDD+ established
Outcome 3: National governance framework and institutional capacities for the
implementation of REDD+ strengthened
Outcome 4: National REDD+ strategies identified
Outcome 5: MRV capacity to implement REDD+ strengthened
Outcome 6: Assessment of Reference Emission Level (REL) and Reference Level
(RL) undertaken.
2.1 Context
The objective of this particular study is:
To provide a preliminary understanding regarding drivers of deforestation and
the potential for REDD+ in Zambia;
To assess to what extent our current consumption, production and
development patterns affect deforestation levels, as well as assessing the
potential impact of future shifts in these patterns;
To draw conclusions as to which actions/trends would probably have the most
serious consequences in terms of additional deforestation, analyse how these
could be reduced in future and to outline the potential for REDD+ in these
circumstances.
54
2.2 TASKS AND SCOPE OF THE STUDY Scope of work
a) This study will mainly involve desk research, interviews with key informants
and field visits in order to identify the key drivers of deforestation in Zambia;
b) The scope of the assignment is to better understand the linkages between
different deforestation drivers, and their significance, taking into account past
and current trends in economic and environmental policy. The study will
further estimate the general effects of changes in drivers (with various
scenarios to be defined) for deforestation levels and assess challenges for
reducing deforestation in order to contribute to mitigating climate change and
preserve biodiversity;
c) In recognizing the drivers and trends in deforestation and forest degradation,
the study will outline the potential for REDD+ in Zambia, taking into account
various options/scenarios;
d) The study will undertake an in-depth review of existing and promising new
methodologies and tools to generate scientifically sound estimates of
historical rates or levels of deforestation in Zambia;
e) The consultant will collate and critically review case studies, articles,
guidelines, manuals and other documents describing methodologies for
assessing historical rates of deforestation and will compare and contrast
different methodologies. Aspects to be considered include the following:
i. Soundness of approach;
ii. Advantages and disadvantages (strengths and weaknesses);
iii. Feasibility (replicability, possibility of scaling up/down, skills and
equipment needs, suitability for different forest types/conditions.)
iv. Cost effectiveness;
v. Applicability to developing countries.
f. Present findings to a working group for comments before the stakeholders’
workshop as a validation process.

55
Specific Tasks i. Carry out desk research on deforestation drivers in Zambia, using various
reports and assessments;
ii. Identify deforestation hotspots in Zambia and their causes, conduct interviews
with a wide range of stakeholders, including government, civil society, and
traditional leadership;
iii. Document current and historical trends of deforestation and forest
degradation in different forest types, under different forest management
categories and approaches;
iv. Identify the different drivers of deforestation and their linkages, using past and
present scenarios/trends, assessing the effects of such changes on these
drivers;
v. Identify the challenges of reducing the identified drivers of deforestation and
the options available to effectively reduce their impacts on forest resources;
vi. Outline the potential for REDD+ in Zambia, giving carbon stock levels in the
identified scenarios, based on current and potential carbon markets.
MAIN OUTPUTS i. Inception report
ii. Final Report outlining drivers of deforestation
iii. Maps of the most threatened forests (Maps of deforestation hotspots in
Zambia and their causes).

UN-REDD P R O G R A M M E
UNEPEmpowered lives.Resilient nations.
FAO Representation in ZambiaFAO Representation
Hse 5 Addis Ababa DriveRidgeway, Lusaka
Tel: +260-211-252277Fax: +260-211-254173
www.un-redd.org
Mrs Anna M. C. MasinjaDirector of Forestry
Ministry of Lands Natural Resources
and Environmental Protection
Forestry Department
P.O. Box 50042
Lusaka, ZAMBIA
Tel. +260 211 221087
Dr Julian C. FoxUN-REDD MRV
Facilitator for Zambia
FAO, P.O. Box 30563
Lusaka, ZAMBIA
Tel: +260 211 252277/252558
Mr Deuteronomy KasaroNational REDD+ Coordinator
Ministry of Lands Natural Resources
and Environmental Protection
Forestry Department
P.O. Box 50042
Lusaka, ZAMBIA
Tel. +260 211 221087
Dr Inge G.C. JonckheereUN-REDD MRV
Africa
FAO HQ
Rome, ITALY
Tel: +39 0657053896
I2827E/1/08.12


![Drivers of Deforestation anD forest DegraD ation · Drivers of Deforestation and Forest Degradation: A Synthesis Report for REDD+ Policymakers [ 1 ] Acknowledgements The authors wish](https://static.cupdf.com/doc/110x72/5e13e9d744f020744d02cfc5/drivers-of-deforestation-and-forest-degrad-drivers-of-deforestation-and-forest-degradation.jpg)