http://pih.sagepub.com/Medicine
Engineers, Part H: Journal of Engineering in Proceedings of the Institution of Mechanical
http://pih.sagepub.com/content/early/2014/08/31/0954411914548700The online version of this article can be found at:
DOI: 10.1177/0954411914548700
August 2014 published online 31Proceedings of the Institution of Mechanical Engineers, Part H: Journal of Engineering in Medicine
D Kathirvelu and M Anburajanfrom dental panoramic radiographs
Prediction of low bone mass using a combinational approach of cortical and trabecular bone measures
Published by:
http://www.sagepublications.com
On behalf of:
Institution of Mechanical Engineers
can be found at:Proceedings of the Institution of Mechanical Engineers, Part H: Journal of Engineering in MedicineAdditional services and information for
http://pih.sagepub.com/cgi/alertsEmail Alerts:
http://pih.sagepub.com/subscriptionsSubscriptions:
http://www.sagepub.com/journalsReprints.navReprints:
http://www.sagepub.com/journalsPermissions.navPermissions:
http://pih.sagepub.com/content/early/2014/08/31/0954411914548700.refs.htmlCitations:
What is This?
- Aug 31, 2014OnlineFirst Version of Record >>
by guest on September 1, 2014pih.sagepub.comDownloaded from by guest on September 1, 2014pih.sagepub.comDownloaded from
Original Article
Proc IMechE Part H:J Engineering in Medicine1–9� IMechE 2014Reprints and permissions:sagepub.co.uk/journalsPermissions.navDOI: 10.1177/0954411914548700pih.sagepub.com
Prediction of low bone mass using acombinational approach of cortical andtrabecular bone measures from dentalpanoramic radiographs
D Kathirvelu and M Anburajan
AbstractThe aim of this study is to extract cortical and trabecular features of the mandible and to develop a novel combinationalmodel of mandibular cortical thickness, trabecular bone area and age in order to predict low bone mineral density orosteoporosis from a dental panoramic radiograph. The study involved 64 south Indian women (age = 52.5 6 12.7 years)categorised into two groups (normal and low bone mineral density) based on total femur bone mineral density. The den-tal panoramic radiographs were obtained by a digital scanner, and measurement of total bone mineral density at the rightfemur was performed by a dual-energy X-ray absorptiometry scanner. The mandibular cortical thickness and panoramicmandibular index were measured bilaterally, and the mean values were considered. The region of interest of 128 3 128pixels around the mental foramen region was manually cropped and subjected to pre-processing, normalisation and aver-age threshold-based segmentation to determine trabecular bone area. Multiple linear regression analyses of cortical andtrabecular measures along with age were performed to develop a combinational model to classify subjects as normal andlow bone mineral density. The proposed approach demonstrated strong correlation (r = 0.76; p \ 0.01) against thetotal bone mineral density and resulted in accuracy, sensitivity and positive predictive values of 0.84, 0.92 and 0.85,respectively; the receiver operating characteristic outcomes disclosed that the area under the curve was 0.89.Ourresults suggest that the proposed combinational model could be useful to diagnose subjects with low bone mineraldensity.
KeywordsOsteoporosis, bone mineral density, dental panoramic radiograph, mandibular cortical thickness, trabecular bone area,panoramic mandibular index
Date received: 16 April 2014; accepted: 28 July 2014
Introduction
Low bone mineral density (BMD) (osteoporosis) hasbeen claimed to be a major health disorder among theaged population across the globe. It is a disease result-ing in deterioration of bony architecture, severe bonefragility and fracture risk. It has been estimated thatmore than 200 million people are suffering from thisdisease worldwide.1 Osteoporosis has been consideredto be a disregarded disease as it is under-diagnosed andunder-treated in Asia. In the most populated nationslike China and India, where the majority of people livein rural regions, treatment is a costly affair. Therefore,fractures are treated conservatively and at home insteadof being treated at hospitals.2 Reports reveal that thenumber of osteoporosis patients was estimated to be
about 36 million in 2013 and was about 26 million in2003.3 In 2013, about 50 million Indians were expectedto be diagnosed with either osteoporosis (T-score lowerthan 22.5) or osteopenia (T-score between 21.0 and22.5).4 Indian women belonging to low-income groupshave low levels of BMD at skeletal sites compared tothose in the developed countries. The cause for the highprevalence of osteoporosis (29%) and osteopenia
Department of Biomedical Engineering, SRM University, Kattankulathur,
Tamil Nadu, India
Corresponding author:
M Anburajan, Department of Biomedical Engineering, SRM University,
Kattankulathur 603 203, Tamil Nadu, India.
Email: [email protected]
by guest on September 1, 2014pih.sagepub.comDownloaded from
(52%) among Indian women can be attributed to mal-nutrition. The impact of bone-related disorders can beexamined by several imaging modalities: radiography,quantitative computed tomography (QCT) and dual-energy X-ray absorptiometry (DXA). Although DXAhas been regarded as the World Health Organization(WHO) standard method for BMD measurement, itinvolves a large capital investment and treatment cost.It has been reported that the number of DXA machinesavailable in India is 250 (i.e. about 0.2 DXA machinesper million people), which falls well below the thresholdrecommended by European regulations pertaining toDXA machines.2 Studies on mandibular bones revealthat there exists a strong connection between oralhygiene and osteoporosis.5–9 The effect of degradationof skeletal bone influencing morphological changes inthe mandible has been investigated among populationsall over the world.10–13 Dentists are accustomed tousing dental panoramic radiograph (DPR) for theirroutine dental examinations to examine oral cavitiesand jaws. Studies on DPR reveal that mandible radio-morphometric indices such as mandibular corticalthickness (MCT), panoramic mandibular index (PMI),trabecular bone mass and morphology of endostealmargin could be used to identify individuals with therisk of low BMD and to refer them to undergo a DXAscan for BMD assessment. It is also claimed that BMDcannot be the only measure for proving fragile boneabnormality among women affected by fracturesbecause of the overlapping nature of BMD measure-ments between control and fractured individuals.14 Thestudies on trabecular bone confirmed that the mechani-cal characteristics of trabecular bone influence lowbone mass to a greater extent than BMD and themicro-architecture of trabeculae can viably defineosteoporosis.15,16 The nature of micro-architecturalframework of trabeculae could act as an indicator ofthe status of bone quality. A denser trabeculation is anindication of healthy bone, whereas sparse trabecula-tion is a sign of osteoporosis.11,17–19 The PMI was firstproposed by Benson et al. as a prediction tool for adultcortical bone mass. The PMI calculated, as per Bensonet al., also has the ability to discriminate normal sub-jects from the low bone mass group.8,9 Earlier studieshave affirmed that the MCT measured on a DPR sig-nificantly correlates with DXA-BMD in the hip, lum-bar spine and forearm.5–7 Hence, the aim of this studyis to extract features of cortical and trabecular bones ofthe mandible and perform a novel combinationalapproach using MCT, trabecular bone area (TBA) andage to predict low BMD from DPR.
Materials and methods
Study population
A free dental health and osteoporosis screening campwas organised for women aged more than 30 years atSRM hospital and research centre in Kattankulathur,
India. It was conducted in six different phases betweenSeptember 2013 and December 2013. The study aimedto evaluate mandibular bone measurements and theirassociation with low BMD. The Institutional EthicalCommittee approved the study protocol (Ethical clear-ance number: 280/IEC/2012), and written informedconsent, in their own language, was obtained from allparticipants. The study involved 64 south Indianwomen (mean age: 52.56 12.7 years, range: 31–80years). The exclusion criteria included women under-going hormone replacement therapy and calcium sup-plement therapy, subjects who underwent ahysterectomy or oophorectomy, and subjects with frac-tures, deformities or who were suffering from bone-related disorders.
Imaging techniques
The measurement of BMD at the right femur wasobtained using a standard narrow fan beam scannerwith multiple view image reconstruction (DPX ProdigyDXA Scanner; GE Lunar Corporation, Madison, WI,USA). The software provided by the manufacturerevaluated BMD quantifications, and the WHO stan-dard for osteoporosis diagnosis was adopted to classifythe subjects based on BMD. The study population wassub-divided into two categories based on the T-scorevalues of the measured total right femur BMD(T-BMD) values as follows: (1) normal (n=28, age=45.66 9.2 years) for those with T-score521 and (2)with low BMD (n=36, age=57.96 12.6 years) forthose with T-score421 standard deviation (SD).
The DPR was taken using a digital orthopantomo-gram scanner (KODAK 8000C) at 70 kV by a skilledradiographer following the standard protocol. TheDPR was assessed independently by two authors (whowere trained by a radiologist who possessed 15 years ofexperience) to identify the region of interest (ROI),location of the mental foramen on both sides and loca-tion of the inner and outer boundaries of the mandibu-lar cortex.
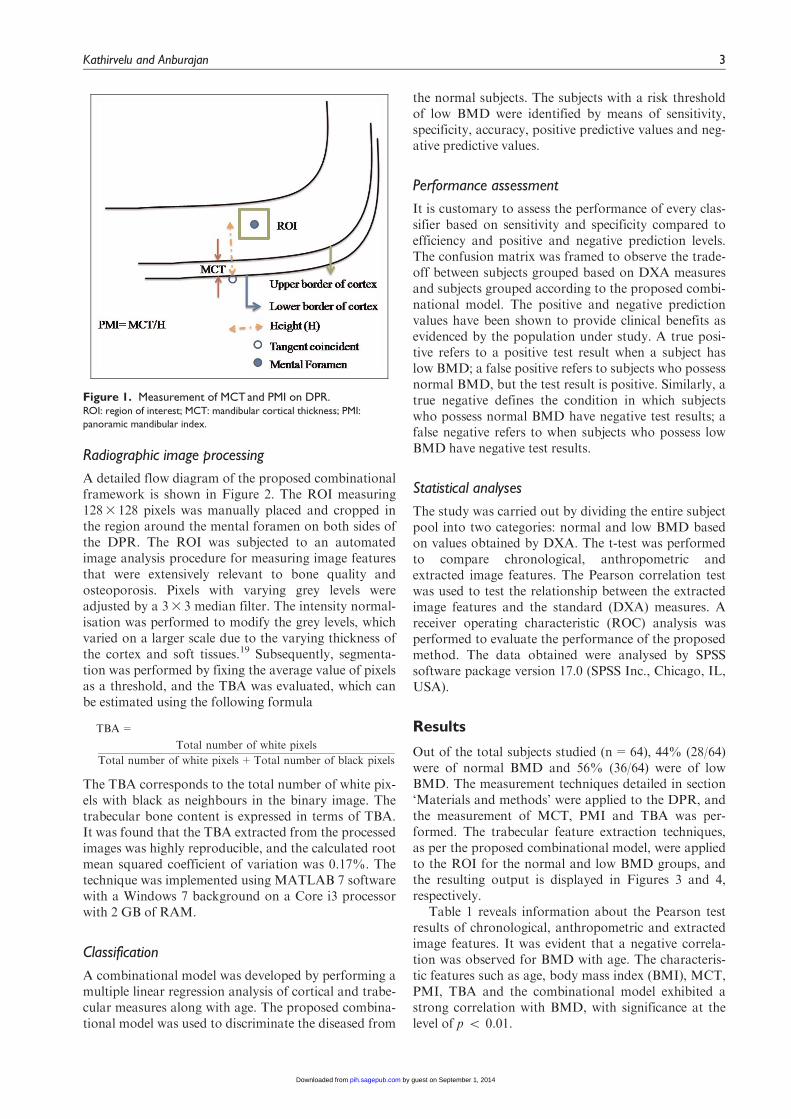
The MCT was measured on both sides at the site ofthe mental foramen. On locating the mental foramen, aline was drawn that passed through the centre of themental foramen, which is perpendicular to the tangentdrawn to the lower border of the mandibular cortex onthe DPR, as shown in Figure 1. The measurements ofMCT and PMI were obtained based on the protocoldetailed by Taguchi et al.13 and Benson et al.,8 respec-tively. The measurements of MCT and PMI were per-formed bilaterally, and the average of each value wasconsidered. An inter-rater agreement with a kappacoefficient of 0.9 was found between the measurementscarried out by the two authors. Reliability measuresusing intra-class correlation coefficients also demon-strated better outcomes as follows: single measures(intra-class correlation: 0.98, confidence interval (CI):92.2%–99.5%) and average measures (intra-class corre-lation: 0.99, CI: 95.9%–99.7%).
2 Proc IMechE Part H: J Engineering in Medicine
by guest on September 1, 2014pih.sagepub.comDownloaded from
Radiographic image processing
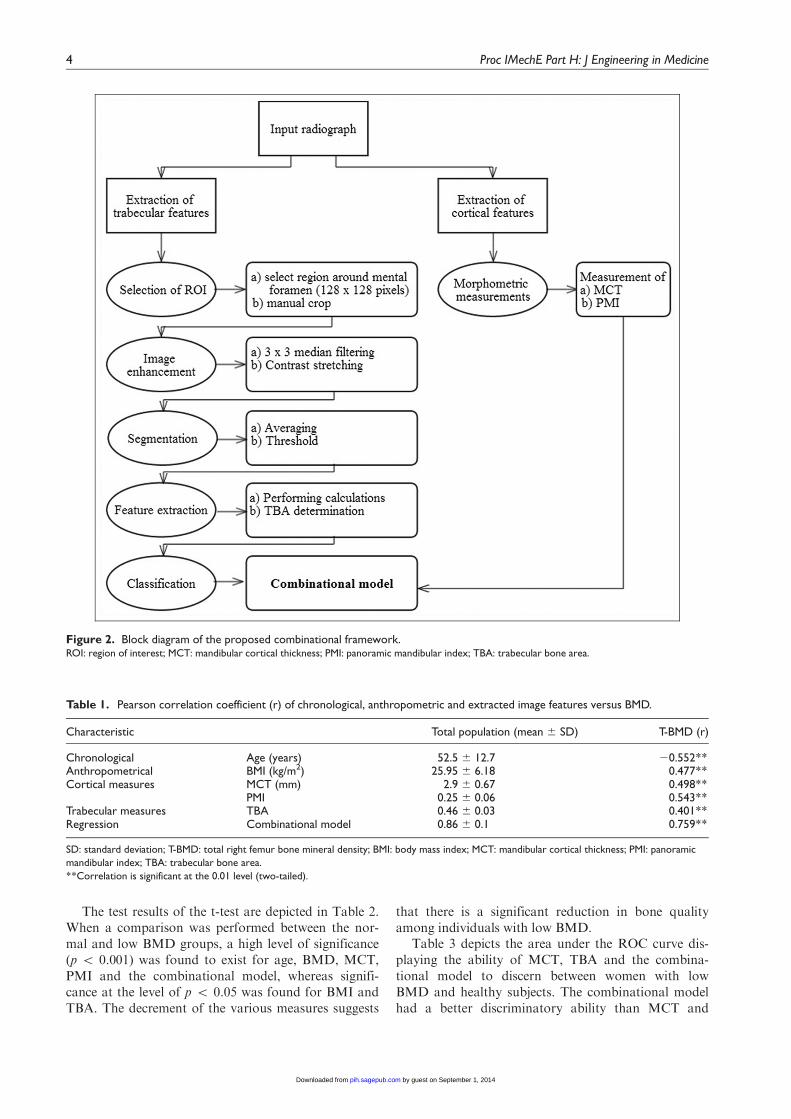
A detailed flow diagram of the proposed combinationalframework is shown in Figure 2. The ROI measuring1283 128 pixels was manually placed and cropped inthe region around the mental foramen on both sides ofthe DPR. The ROI was subjected to an automatedimage analysis procedure for measuring image featuresthat were extensively relevant to bone quality andosteoporosis. Pixels with varying grey levels wereadjusted by a 33 3 median filter. The intensity normal-isation was performed to modify the grey levels, whichvaried on a larger scale due to the varying thickness ofthe cortex and soft tissues.19 Subsequently, segmenta-tion was performed by fixing the average value of pixelsas a threshold, and the TBA was evaluated, which canbe estimated using the following formula
TBA=
Total number of white pixels
Total number of white pixels+Total number of black pixels
The TBA corresponds to the total number of white pix-els with black as neighbours in the binary image. Thetrabecular bone content is expressed in terms of TBA.It was found that the TBA extracted from the processedimages was highly reproducible, and the calculated rootmean squared coefficient of variation was 0.17%. Thetechnique was implemented using MATLAB 7 softwarewith a Windows 7 background on a Core i3 processorwith 2 GB of RAM.
Classification
A combinational model was developed by performing amultiple linear regression analysis of cortical and trabe-cular measures along with age. The proposed combina-tional model was used to discriminate the diseased from
the normal subjects. The subjects with a risk thresholdof low BMD were identified by means of sensitivity,specificity, accuracy, positive predictive values and neg-ative predictive values.
Performance assessment
It is customary to assess the performance of every clas-sifier based on sensitivity and specificity compared toefficiency and positive and negative prediction levels.The confusion matrix was framed to observe the trade-off between subjects grouped based on DXA measuresand subjects grouped according to the proposed combi-national model. The positive and negative predictionvalues have been shown to provide clinical benefits asevidenced by the population under study. A true posi-tive refers to a positive test result when a subject haslow BMD; a false positive refers to subjects who possessnormal BMD, but the test result is positive. Similarly, atrue negative defines the condition in which subjectswho possess normal BMD have negative test results; afalse negative refers to when subjects who possess lowBMD have negative test results.
Statistical analyses
The study was carried out by dividing the entire subjectpool into two categories: normal and low BMD basedon values obtained by DXA. The t-test was performedto compare chronological, anthropometric andextracted image features. The Pearson correlation testwas used to test the relationship between the extractedimage features and the standard (DXA) measures. Areceiver operating characteristic (ROC) analysis wasperformed to evaluate the performance of the proposedmethod. The data obtained were analysed by SPSSsoftware package version 17.0 (SPSS Inc., Chicago, IL,USA).
Results
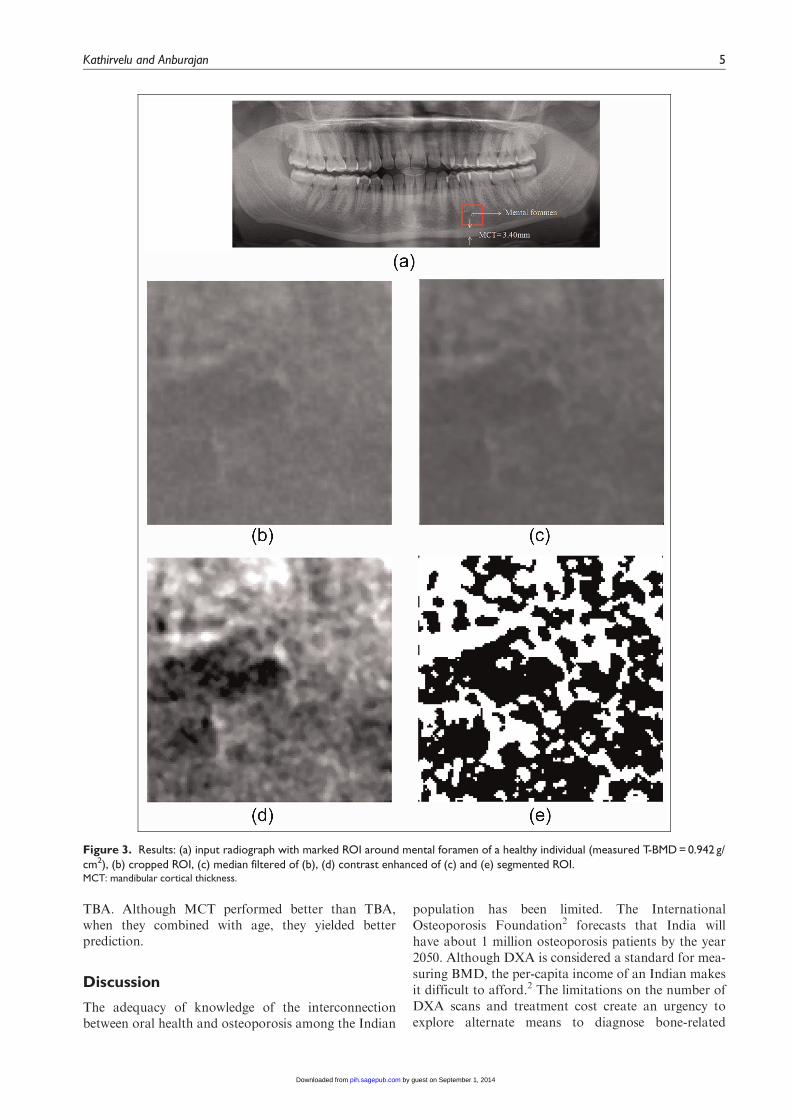
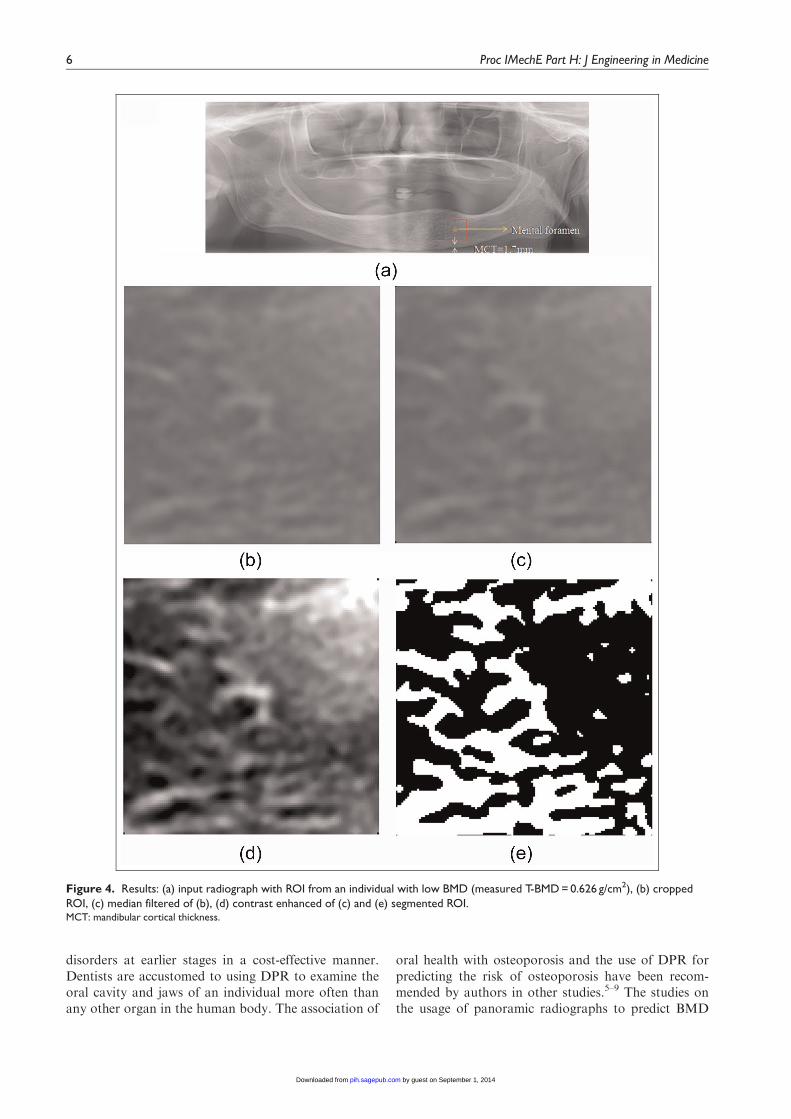
Out of the total subjects studied (n=64), 44% (28/64)were of normal BMD and 56% (36/64) were of lowBMD. The measurement techniques detailed in section‘Materials and methods’ were applied to the DPR, andthe measurement of MCT, PMI and TBA was per-formed. The trabecular feature extraction techniques,as per the proposed combinational model, were appliedto the ROI for the normal and low BMD groups, andthe resulting output is displayed in Figures 3 and 4,respectively.
Table 1 reveals information about the Pearson testresults of chronological, anthropometric and extractedimage features. It was evident that a negative correla-tion was observed for BMD with age. The characteris-tic features such as age, body mass index (BMI), MCT,PMI, TBA and the combinational model exhibited astrong correlation with BMD, with significance at thelevel of p \ 0.01.
Figure 1. Measurement of MCT and PMI on DPR.ROI: region of interest; MCT: mandibular cortical thickness; PMI:
panoramic mandibular index.
Kathirvelu and Anburajan 3
by guest on September 1, 2014pih.sagepub.comDownloaded from
The test results of the t-test are depicted in Table 2.When a comparison was performed between the nor-mal and low BMD groups, a high level of significance(p \ 0.001) was found to exist for age, BMD, MCT,PMI and the combinational model, whereas signifi-cance at the level of p \ 0.05 was found for BMI andTBA. The decrement of the various measures suggests
that there is a significant reduction in bone qualityamong individuals with low BMD.
Table 3 depicts the area under the ROC curve dis-playing the ability of MCT, TBA and the combina-tional model to discern between women with lowBMD and healthy subjects. The combinational modelhad a better discriminatory ability than MCT and
Figure 2. Block diagram of the proposed combinational framework.ROI: region of interest; MCT: mandibular cortical thickness; PMI: panoramic mandibular index; TBA: trabecular bone area.
Table 1. Pearson correlation coefficient (r) of chronological, anthropometric and extracted image features versus BMD.
Characteristic Total population (mean 6 SD) T-BMD (r)
Chronological Age (years) 52.5 6 12.7 20.552**Anthropometrical BMI (kg/m2) 25.95 6 6.18 0.477**Cortical measures MCT (mm) 2.9 6 0.67 0.498**
PMI 0.25 6 0.06 0.543**Trabecular measures TBA 0.46 6 0.03 0.401**Regression Combinational model 0.86 6 0.1 0.759**
SD: standard deviation; T-BMD: total right femur bone mineral density; BMI: body mass index; MCT: mandibular cortical thickness; PMI: panoramic
mandibular index; TBA: trabecular bone area.
**Correlation is significant at the 0.01 level (two-tailed).
4 Proc IMechE Part H: J Engineering in Medicine
by guest on September 1, 2014pih.sagepub.comDownloaded from
TBA. Although MCT performed better than TBA,when they combined with age, they yielded betterprediction.
Discussion
The adequacy of knowledge of the interconnectionbetween oral health and osteoporosis among the Indian
population has been limited. The InternationalOsteoporosis Foundation2 forecasts that India willhave about 1 million osteoporosis patients by the year2050. Although DXA is considered a standard for mea-suring BMD, the per-capita income of an Indian makesit difficult to afford.2 The limitations on the number ofDXA scans and treatment cost create an urgency toexplore alternate means to diagnose bone-related
Figure 3. Results: (a) input radiograph with marked ROI around mental foramen of a healthy individual (measured T-BMD = 0.942 g/cm2), (b) cropped ROI, (c) median filtered of (b), (d) contrast enhanced of (c) and (e) segmented ROI.MCT: mandibular cortical thickness.
Kathirvelu and Anburajan 5
by guest on September 1, 2014pih.sagepub.comDownloaded from
disorders at earlier stages in a cost-effective manner.Dentists are accustomed to using DPR to examine theoral cavity and jaws of an individual more often thanany other organ in the human body. The association of
oral health with osteoporosis and the use of DPR forpredicting the risk of osteoporosis have been recom-mended by authors in other studies.5–9 The studies onthe usage of panoramic radiographs to predict BMD
Figure 4. Results: (a) input radiograph with ROI from an individual with low BMD (measured T-BMD = 0.626 g/cm2), (b) croppedROI, (c) median filtered of (b), (d) contrast enhanced of (c) and (e) segmented ROI.MCT: mandibular cortical thickness.
6 Proc IMechE Part H: J Engineering in Medicine
by guest on September 1, 2014pih.sagepub.comDownloaded from
suggest that DPR can be used to assess the loss of bonemass.
In this study, when MCT (r=0.50) and PMI(r=0.54) were taken into consideration, both corre-lated with T-BMD at the level p \ 0.01. Horner andDevlin20 studied the relationship between mandibularBMD and panoramic radiographic measurements andobserved that the MCT (r=0.50; p \ 0.01) and PMI(r=0.38; p \ 0.05) measures showed significant corre-lation with mandibular BMD. However, they affirmedthat their feasibility as diagnostic indicators could beproved on validation with a larger sample size.20
Klemetti et al.21 also experienced that the PMI corre-lated (r=0.37) with buccal cortical BMD measuredusing QCT. Earlier studies have shown that a signifi-cant connection exists between the MCT and BMD.The MCT was significantly thinner in individuals withlower BMD, as expected, and concurs with previousstudies.22–26 When PMI was compared between thenormal and low BMD groups, significance (p \ 0.001)was observed. Similar findings were seen by Yashodaet al.27 when such comparisons were made among theIndian population. Damilakis and Vlasiadis28 recom-mended that MCT could perform better than PMI indiscriminating between subjects with low and normalBMD.
Studies by Sapthagirivasan and Anburajan29 on tra-becular bone features extracted from hip radiographsdemonstrated significant differences (p \ 0.001)between normal and low BMD groups. The results ofour study also showed similar observations exhibitingsignificance (p \ 0.05) when TBA was taken into
consideration. Pulkkinen et al.30 also found that trabe-cular features (TBA) extracted from hip radiographswere significantly correlated with BMD measured fromDXA. The results of this study also showed a signifi-cant correlation (r=0.401; p \ 0.01) between TBAand BMD
Licks et al.,31 using clinical information and featuresextracted from periapical radiographs, devised a com-binational approach in the assessment of low BMD. Itwas observed that when clinical information (age, bonemass index, etc.) was combined with trabecular fea-tures, it could identify people with low BMD with bet-ter accuracy.31 Similarly, better results were found inthis study when the combinational model was used todiscriminate subjects with low BMD. The results of thestudy matched the findings made by Lee and White.32
When MCT and TBA were separately taken intoaccount, the areas under the curve were 0.856 and0.659, respectively; whereas when the combinationalmodel was implemented, the area under the curveincreased to 0.889, proving that age was an importantcriterion in the prediction of low BMD. Geraets andhis colleagues made similar observations using a multi-ple regression model; they found that age was animportant factor that accounts for 10% and 14% ofvariation in total hip and spine BMD, respectively.They also found that the prediction of BMD doubledwhen age and image features were taken into account.33
Earlier attempts by Kavitha et al.34 and Muramatsuet al.,35 in the prediction of osteoporosis from DPR,exhibited sensitivity at 91% and 89% and specificity at81% and 97%, respectively. The proposed framework
Table 2. The t-test between normal and low BMD groups.
Characteristic Normal (n = 28) Low BMD (n = 36) P
Chronological Age (years) 45.57 6 9.2 57.89 6 12.6 0.000**Anthropometrical BMI (kg/m2) 28.37 6 6.9 24.07 6 4.9 0.005*Cortical measures MCT (mm) 3.31 6 0.48 2.58 6 0.62 0.000**
PMI 0.29 6 0.06 0.21 6 0.04 0.000**Trabecular measures TBA 0.47 6 0.04 0.45 6 0.02 0.019*DXA measure BMD (g/cm2) 1.01 6 0.08 0.73 6 0.12 0.000**Regression Combinational model 0.93 6 0.07 0.81 6 0.09 0.000**
BMD: bone mineral density; BMI: body mass index; MCT: mandibular cortical thickness; PMI: panoramic mandibular index; TBA: trabecular bone
area; DXA: dual-energy X-ray absorptiometry.
*p \ 0.05; **p \ 0.001.
Table 3. The area under the curve: the potential of MCT, TBA and the combined model to differentiate between women with lowBMD and healthy individuals.
Test result variable(s) Area under the curve Standard error Asymptotic significance 95% Confidence interval
Lower bound Upper bound
MCT (mm) 0.856 0.050 0.000 0.759 0.953TBA 0.659 0.072 0.030 0.519 0.800Combinational model 0.889 0.043 0.000 0.805 0.974
MCT: mandibular cortical thickness; TBA: trabecular bone area.
Kathirvelu and Anburajan 7
by guest on September 1, 2014pih.sagepub.comDownloaded from
could demonstrate sensitivity of 91.7%, specificity of78.6%, a positive predictive value of 84.6% and a nega-tive predictive value of 88%.
The incidence of osteoporosis increases with ageing.The findings of our study showed that cortical and tra-becular features decreased with ageing. The combina-tional approach of involving the vital parametersassociated with low BMD could increase the diagnosticpotential of DPR in low BMD assessments. The limita-tions of our study are that it involves a small samplesize, which needs to be justified with a largerpopulation.
Conclusion
The results of this study reflect the status of oral indica-tors as a sign of low bone quality. The proposed novelcombinational model has demonstrated a strong corre-lation (r=0.76; p \ 0.01) against the T-BMD, and asignificant decrement by 13% (p \ 0.001) was seen inthe low BMD group when compared with the normalgroup; the ROC results revealed that the value of thearea under the curve was 0.89. The accuracy, sensitivityand positive predictive value of 0.84, 0.92 and 0.85,respectively, give a clear indication that the combina-tional model derived from DPR could help the subjectswho are unaware of their low BMD to undergo theBMD test. Currently, dentists are only using DPRs toexamine dental disorders; however, identifying asymp-tomatic patients with osteoporosis by dental examina-tions could be a surrogate diagnostic aid. Hence, basedon the sensitivity, accuracy and positive predictive valueoutcomes, the proposed tool could improve the diag-nostic efficiency for identifying women with low BMDfrom DPR.
Acknowledgements
The authors wish to express their deep sense of grati-tude to the management of SRM Hospital andResearch Centre for providing the required infrastruc-ture. They also wish to thank Mr V. Sapthagirivasan,Research Scholar, for his kind support and help.
Declaration of conflicting interests
None.
Funding
This research received no specific grant from any fund-ing agency in the public, commercial or not-for-profitsectors.
References
1. Kanis JA. WHO technical report. Sheffield: University of
Sheffield, 2007.2. The International Osteoporosis Foundation. The Asian
audit: epidemiology, costs and burden of osteoporosis in
Asia. Nyon: The International Osteoporosis Foundation,
2009, pp.24–27.3. Osteoporosis Society of India. Action Plan Osteoporosis:
consensus statement of an expert group. New Delhi, India:
Osteoporosis Society of India, 2003.4. Mithal A and Kaur P. Osteoporosis in Asia: a call to
action. Curr Osteoporos Rep 2012; 10(4): 245–247.5. Taguchi A. Triage screening for osteoporosis in dental
clinics using panoramic radiographs – a review. Oral Dis-
ease 2010; 16(4): 316–327.6. Karayianni K, Homer K, Mitsea A, et al. Accuracy in
osteoporosis diagnosis of a combination of mandibular
cortical width measurement on dental panoramic radio-
graphs and a clinical risk index (OSIRIS): the OSTEO-
DENT project. Bone 2007; 40(1): 223–229.7. Alman AC, Johnson LR, Calverley DC, et al. Diagnostic
capabilities of fractal dimension and mandibular cortical
width to identify men and women with decreased bone
mineral density. Osteoporos Int 2012; 23(5): 1631–1636.8. Benson BW, Prihoda TJ and Glass BJ. Variations in
adult cortical bone mass as measured by a panoramic
mandibular index. Oral Surg Oral Med Oral Pathol 1991;
71(3): 349–356.9. Khojastehpour L, Shahidi SH, Barghan S, et al. Efficacy
of panoramic mandibular index in diagnosing osteoporo-
sis in women. J Dent Tehran Univ Med Sci 2009; 6(1):
11–15.10. Krejc CB and Bissada NF. Women’s health issues and
their relationship to periodontitis. J Am Dent Assoc 2002;
133(3): 323–329.11. Jonasson G, Bankvall G and Kiliaridis S. Estimation of
skeletal bone mineral density by means of the trabecular
pattern of the alveolar bone, its interdental thickness, and
the bone mass of the mandible. Oral Surg Oral Med Oral
Pathol Oral Radiol Endod 2001; 92(3): 346–352.12. Jeffcoat MK, Lewis CE, Reddy MS, et al. Postmenopau-
sal bone loss and its relationship to oral bone loss. Period-
ontol 2000; 23: 94–102.13. Taguchi A, Tanimoto K, Suei Y, et al. Tooth loss and
mandibular osteopenia. Oral Surg Oral Med Oral Pathol
Oral Radiol Endod 1995; 79(1): 127–132.14. Ott SM, Kilcoyne RF and Chesnut CH. Ability of four
different techniques of measuring bone mass to diagnose
vertebral fractures in postmenopausal women. J Bone
Miner Res 1987; 2: 201–210.15. Ammann P and Rizzoli R. Bone strength and its determi-
nants. Osteoporos Int 2003; 14(Suppl. 3): 13–18.16. Seeman E and Delmas P. Bone quality – the material and
structural basis of bone strength and fragility. N Engl J
Med 2006; 354(21): 2250–2261.17. Lindh C, Petersson A and Rohlin M. Assessment of the
trabecular pattern before endosseous implant treatment:
diagnostic outcome of periapical radiography in the
mandible. Oral Surg Oral Med Oral Pathol Oral Radiol
Endod 1996; 82: 335–343.18. Lindh C, Horner K, Jonasson G, et al. The use of visual
assessment of dental radiographs for identifying women
at risk of having osteoporosis: the OSTEODENT project.
Oral Surg Oral Med Oral Pathol Oral Radiol Endod 2008;
106: 285–293.19. Geraets WG, Lindh C and Verheij H. Sparseness of the
trabecular pattern on dental radiographs: visual assess-
ment compared with semi-automated measurements. Br
J Radiol 2012; 85(1016): 455–460.
8 Proc IMechE Part H: J Engineering in Medicine
by guest on September 1, 2014pih.sagepub.comDownloaded from
20. Horner K and Devlin H. The relationship between man-dibular bone mineral density and panoramic radiographicmeasurements. J Dent 1998; 26: 337–343.
21. Klemetti E, Kolmakov S, Heiskanen P, et al. Panoramicmandibular index and bone mineral densities in postme-nopausal women. Oral Surg Oral Med Oral Pathol 1993;75(6): 774–779.
22. Devlin H and Horner K. Mandibular radiomorphometricindices in the diagnosis of reduced skeletal bone mineraldensity. Osteoporos Int 2002; 13: 373–378.
23. Devlin H, Karayianni K, Mitsea A, et al. Diagnosingosteoporosis by using dental panoramic radiographs: theOSTEODENT project. Oral Surg Oral Med Oral Pathol
Oral Radiol Endod 2007; 104: 821–828.24. Taguchi A, Suei Y, Ohtsuka M, et al. Usefulness of
panoramic radiography in the diagnosis of postmenopau-sal osteoporosis in women. Width and morphology of
inferior cortex of the mandible. Dentomaxillofac Radiol
1996; 25: 263–267.25. Taguchi A, Ohtsuka M, Tsuda M, et al. Risk of vertebral
osteoporosis in post-menopausal women with alterationsof the mandible. Dentomaxillofac Radiol 2007; 36:143–148.
26. Okabe S, Morimoto Y, Ansai T, et al. Assessment of therelationship between the mandibular cortex on panoramicradiographs and the risk of bone fracture and vasculardisease in 80-year-olds. Oral Surg Oral Med Oral Pathol
Oral Radiol Endod 2008; 106: 433–442.27. Yashoda DBK, Nagaraju R and Nagi R. Diagnostic effi-
cacy of panoramic mandibular index to identify postme-nopausal women with low bone mineral densities. J Clin
Exp Dent 2011; 3(5): 456–461.
28. Damilakis J and Vlasiadis K. Have panoramic indices the
power to identify women with low BMD at the axial ske-
leton? Phys Med 2011; 27(1): 39–43.29. Sapthagirivasan V and Anburajan M. Diagnosis of
osteoporosis by extraction of trabecular features from
hip radiographs using support vector machine: an investi-
gation panorama with DXA. Comput Biol Med 2013;
43(11): 1910–1919.30. Pulkkinen P, Jamsa T, Lochmuller EM, et al. Experimen-
tal hip fracture load can be predicted from plain radio-
graphy by combined analysis of trabecular bone structure
and bone geometry. Osteoporos Int 2008; 19: 547–558.31. Licks R, Licks V, Ourique F, et al. Development of a pre-
diction tool for low bone mass based on clinical data and
periapical radiography. Dentomaxillofac Radiol 2010;
39(4): 224–230.32. Lee BD and White SC. Age and trabecular features of
alveolar bone associated with osteoporosis. Oral Surg
Oral Med Oral Pathol Oral Radiol Endod 2005; 100:
92–98.33. Geraets WGM, Verheij JGC, van der Stelt PF, et al. Pre-
diction of bone mineral density with dental radiographs.
Bone 2007; 40(5): 1217–1221.34. Kavitha MS, Asano A, Taguchi A, et al. Diagnosis of
osteoporosis from dental panoramic radiographs using
the support vector machine method in a computer-aided
system. BMC Med Img 2012; 12(1): 1–11.
35. Muramatsu C, Matsumoto T, Hayashi T, et al. Auto-
mated measurement of mandibular cortical width on den-
tal panoramic radiographs. Int J Comput Assist Radiol
Surg 2013; 8(6): 877–885.
Kathirvelu and Anburajan 9
by guest on September 1, 2014pih.sagepub.comDownloaded from