
•
•
•
•

•
•
•
•
•
•
3

→
→


0
50
100
150
200
250
300
350
Ind
ex: 1
99
4 =
10
0
Growth in industrial sector employment
World Vietnam Bangladesh Mexico

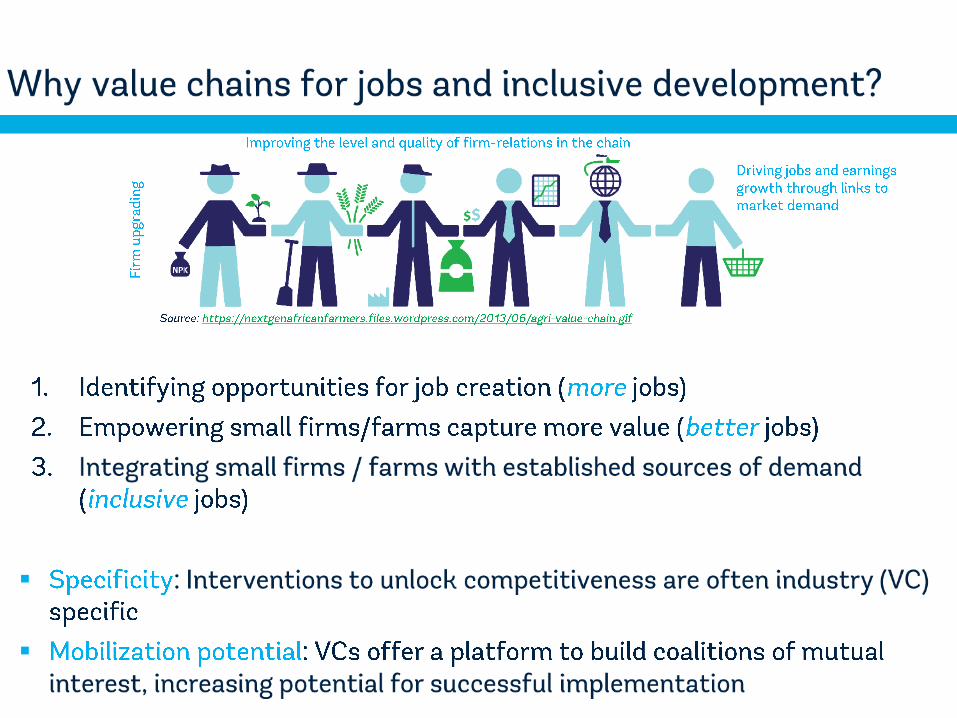
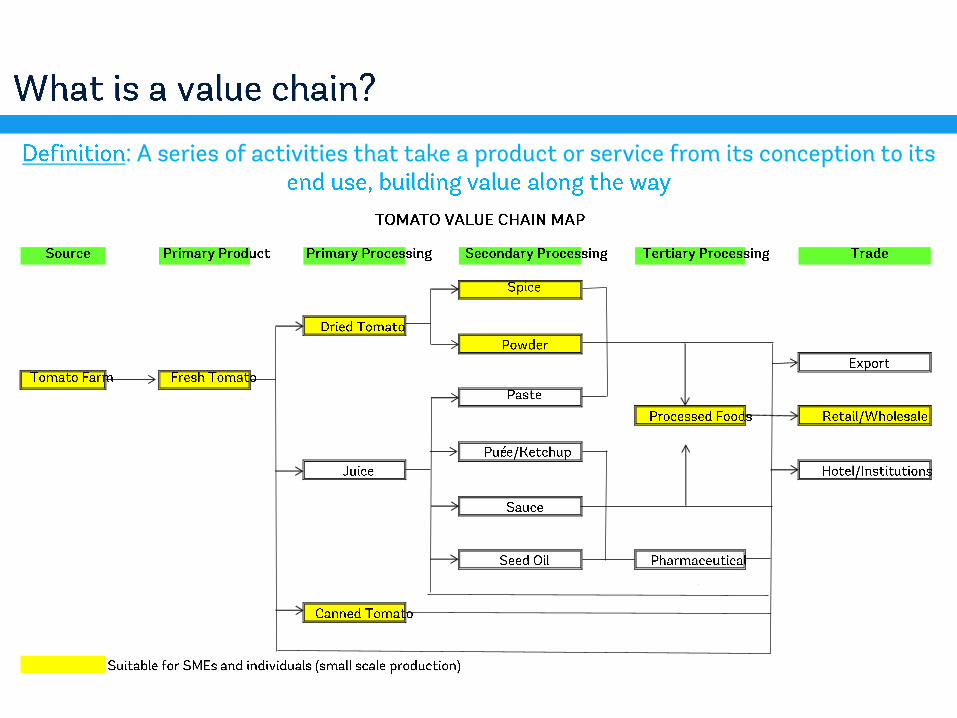
What do we mean by a global value chain?

What do we mean by a global value chain?
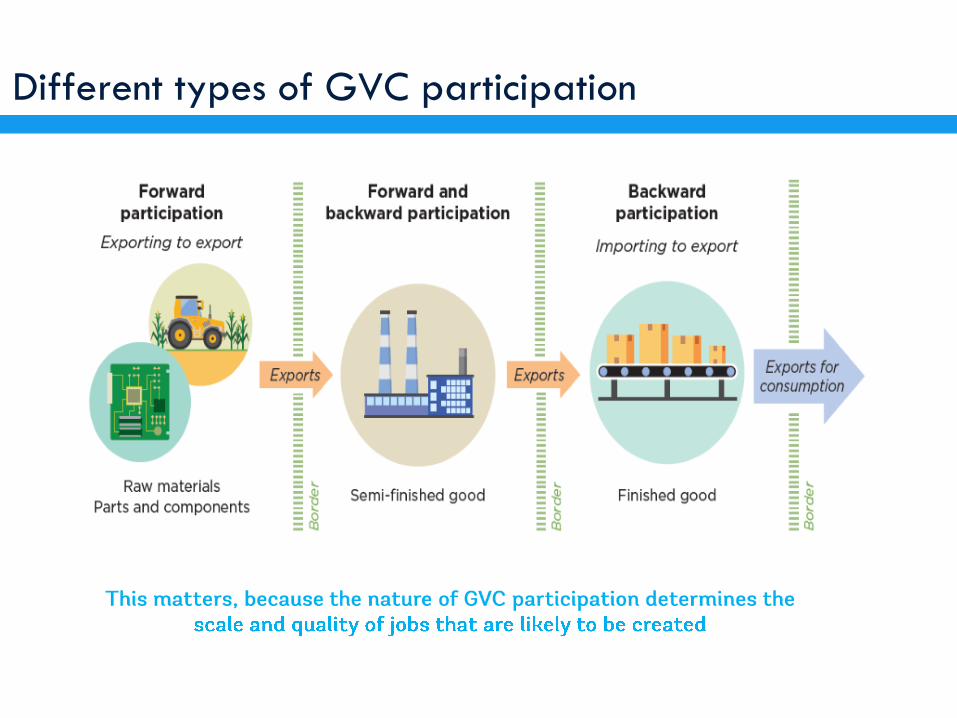
Different types of GVC participation
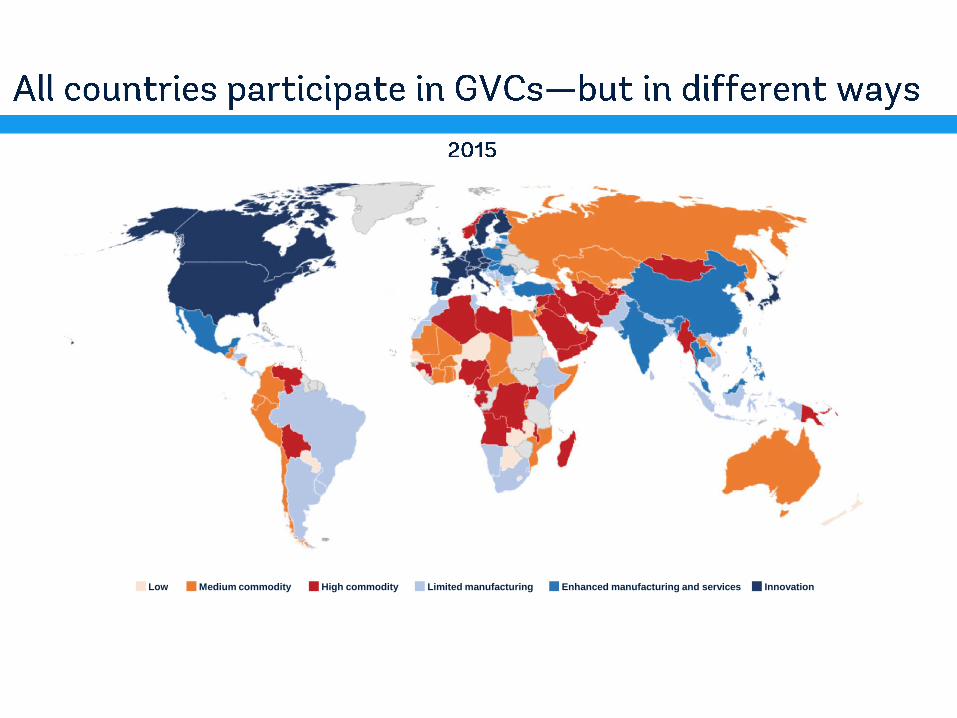
InnovationMedium commodity High commodityLow Limited manufacturing Enhanced manufacturing and services
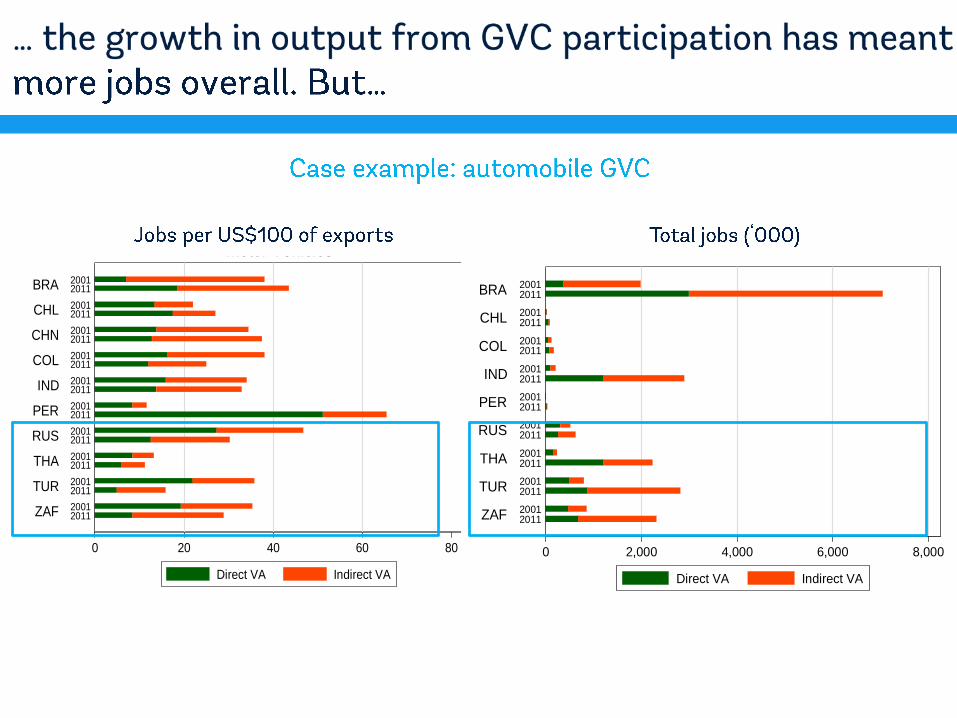
0 20 40 60 80
ZAF
TUR
THA
RUS
PER
IND
COL
CHN
CHL
BRA
20112001
20112001
20112001
20112001
20112001
20112001
20112001
20112001
20112001
20112001
Motor Vehicles
Direct VA Indirect VA
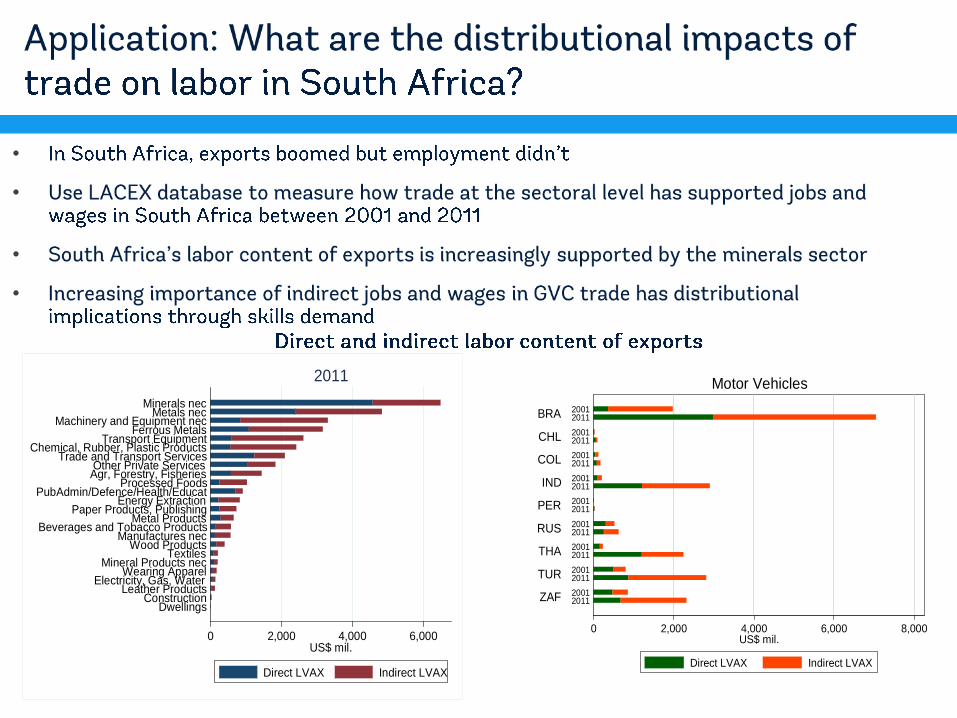
0 2,000 4,000 6,000 8,000
ZAF
TUR
THA
RUS
PER
IND
COL
CHL
BRA
20112001
20112001
20112001
20112001
20112001
20112001
20112001
20112001
20112001
Motor Vehicles
Direct VA Indirect VA


0.00
0.50
1.00
1.50
2.00
2.50
3.00
3.50
4.00
4.50
5.00
Production workers Administration, saleworkers
Pe
rce
nta
ge
of
fem
ale
wo
rke
rs in
to
tal
wo
rke
rs, re
lati
ve
to
no
n-G
VC
fir
m
-0.14
-0.12
-0.10
-0.08
-0.06
-0.04
-0.02
0.00
Majority ownership Top management
Pro
ba
bilit
y (
pe
rce
nt)
of
fem
ale
ow
ne
r o
r m
an
ag
er,
re
lati
ve
to
no
n-G
VC
fir
ms

•
•
•
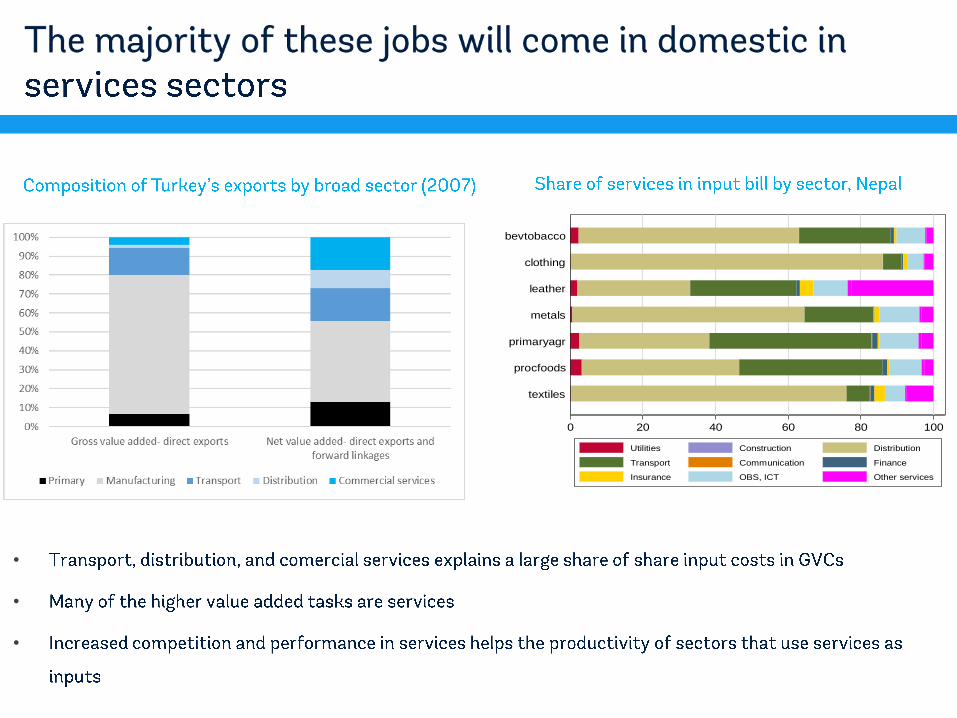
0 20 40 60 80 100
textiles
procfoods
primaryagr
metals
leather
clothing
bevtobacco
Utilities Construction Distribution
Transport Communication Finance
Insurance OBS, ICT Other services
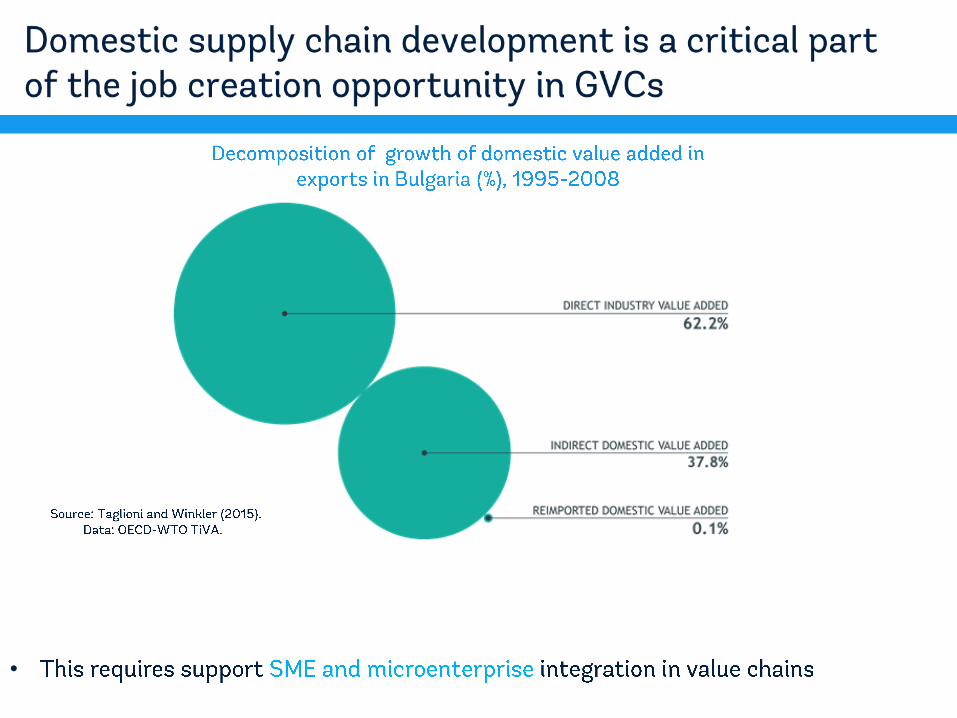
•
•
•


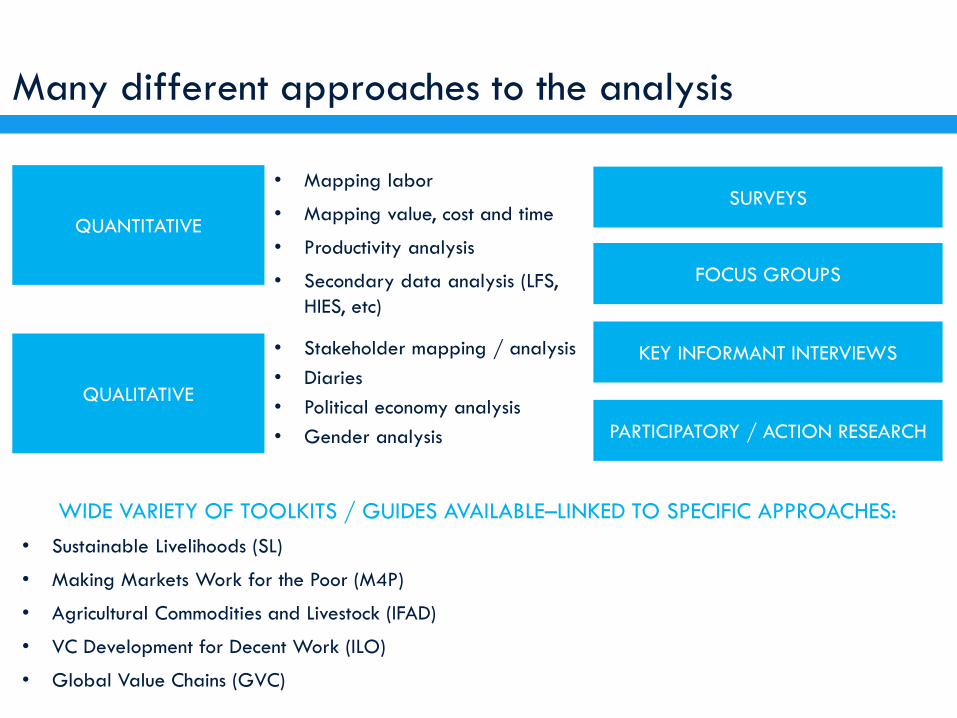
Many different approaches to the analysis
QUANTITATIVE
QUALITATIVE
SURVEYS
FOCUS GROUPS
KEY INFORMANT INTERVIEWS
PARTICIPATORY / ACTION RESEARCH
• Stakeholder mapping / analysis
• Diaries
• Political economy analysis
• Gender analysis
• Mapping labor
• Mapping value, cost and time
• Productivity analysis
• Secondary data analysis (LFS,
HIES, etc)
WIDE VARIETY OF TOOLKITS / GUIDES AVAILABLE–LINKED TO SPECIFIC APPROACHES:
• Sustainable Livelihoods (SL)
• Making Markets Work for the Poor (M4P)
• Agricultural Commodities and Livestock (IFAD)
• VC Development for Decent Work (ILO)
• Global Value Chains (GVC)
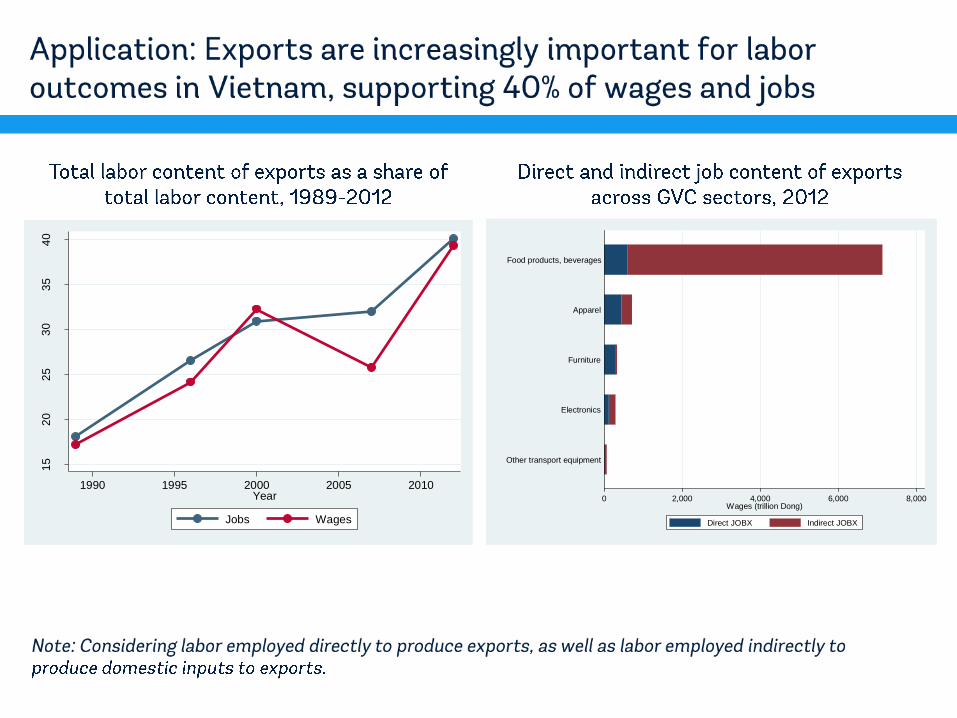
15
20
25
30
35
40
Exp
ort
lab
or
in tota
l la
bo
r (%
)
1990 1995 2000 2005 2010Year
Jobs Wages
0 2,000 4,000 6,000 8,000Wages (trillion Dong)
Other transport equipment
Electronics
Furniture
Apparel
Food products, beverages
Direct JOBX Indirect JOBX
•
•
•
•
32
0 2,000 4,000 6,000 8,000US$ mil.
ZAF
TUR
THA
RUS
PER
IND
COL
CHL
BRA
20112001
20112001
20112001
20112001
20112001
20112001
20112001
20112001
20112001
Motor Vehicles
Direct LVAX Indirect LVAX
0 2,000 4,000 6,000US$ mil.
DwellingsConstruction
Leather ProductsElectricity, Gas, Water
Wearing ApparelMineral Products nec
TextilesWood Products
Manufactures necBeverages and Tobacco Products
Metal ProductsPaper Products, Publishing
Energy ExtractionPubAdmin/Defence/Health/Educat
Processed FoodsAgr, Forestry, FisheriesOther Private Services
Trade and Transport ServicesChemical, Rubber, Plastic Products
Transport EquipmentFerrous Metals
Machinery and Equipment necMetals nec
Minerals nec
2011
Direct LVAX Indirect LVAX
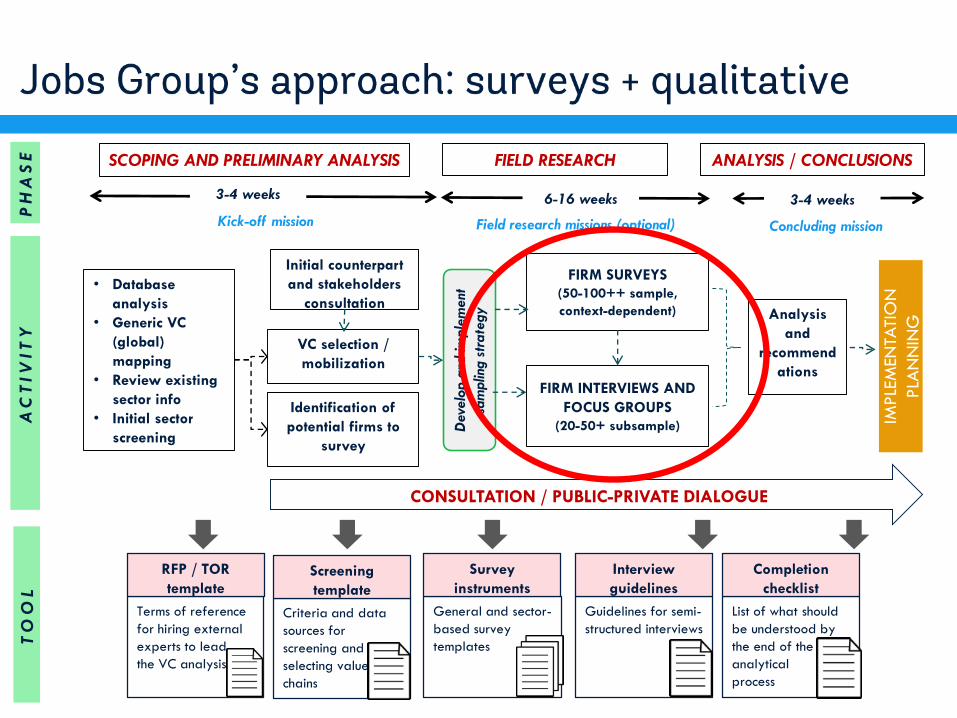
6-16 weeks
• Database
analysis
• Generic VC
(global)
mapping
• Review existing
sector info
• Initial sector
screening
VC selection /
mobilization
FIRM SURVEYS
(50-100++ sample,
context-dependent)
FIRM INTERVIEWS AND
FOCUS GROUPS
(20-50+ subsample)
3-4 weeks
Identification of
potential firms to
survey
Initial counterpart
and stakeholders
consultation
Deve
lop a
nd im
ple
ment
sam
plin
g s
trate
gy
IMPLE
MEN
TATI
ON
PLA
NN
ING
CONSULTATION / PUBLIC-PRIVATE DIALOGUE
Analysis
and
recommend
ations
3-4 weeks
Kick-off mission Field research missions (optional) Concluding mission
PH
AS
EA
CT
IVIT
YT
OO
L
SCOPING AND PRELIMINARY ANALYSIS FIELD RESEARCH ANALYSIS / CONCLUSIONS
Terms of reference
for hiring external
experts to lead
the VC analysis
RFP / TOR
template
General and sector-
based survey
templates
Survey
instruments
Guidelines for semi-
structured interviews
Interview
guidelines
List of what should
be understood by
the end of the
analytical
process
Completion
checklist
Criteria and data
sources for
screening and
selecting value
chains
Screening
template

▪
▪
▪
▪
▪
▪
▪
▪
▪
→
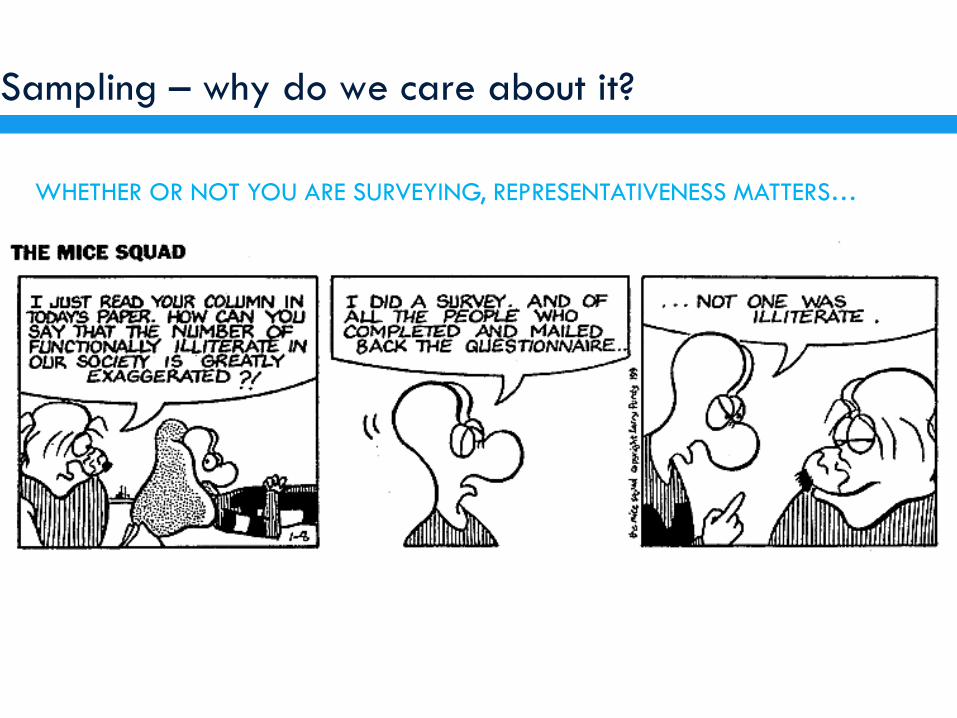
Sampling – why do we care about it?
WHETHER OR NOT YOU ARE SURVEYING, REPRESENTATIVENESS MATTERS…

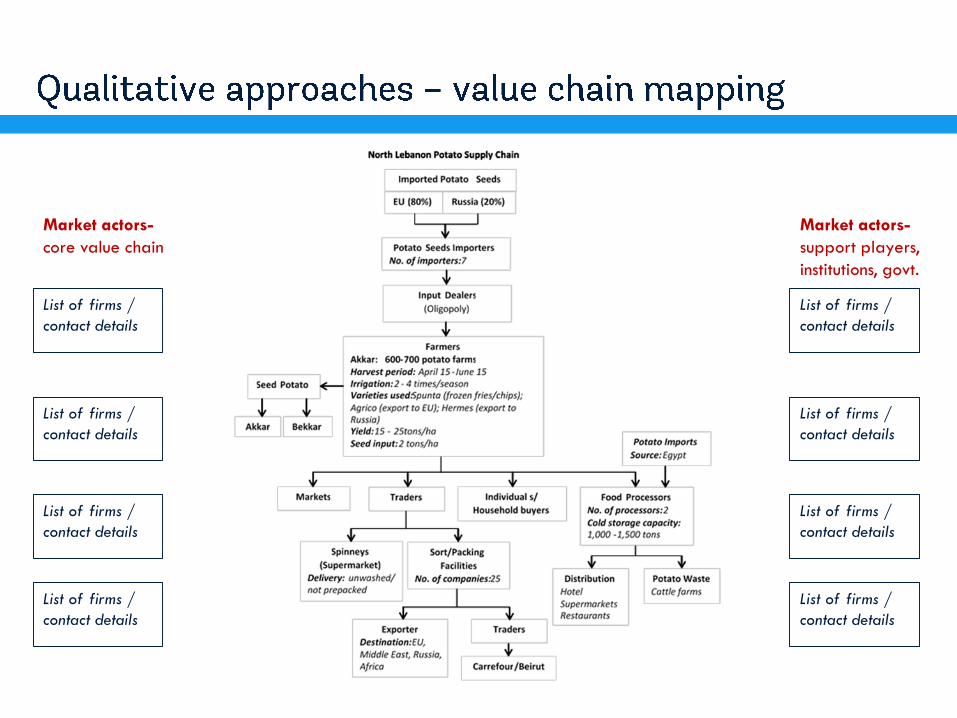
Market actors-
core value chain
List of firms /
contact details
List of firms /
contact details
List of firms /
contact details
List of firms /
contact details
Market actors-
support players,
institutions, govt.
List of firms /
contact details
List of firms /
contact details
List of firms /
contact details
List of firms /
contact details
• •
•
•
•
•
•
•
•
•
•
•
•
•
•
•
•
•
•
•
•
•
•
•
•
•
•


To Limited Manufacturing To advanced manufacturing and
services
To innovative activities
Poor endowments?
FDI: Investment policy and business climate
Access to finance and technology
Competitive labor costs: exchange rates, labor regulation Skills: Education, Technical / vocational training, managerial skills. Education, training, and skill increasingly important
Remote location?
Trade infrastructure: investment in ports and transport infra /
customs reform
Advanced logistics services: Multimodal, digitally-enabled transport infrastructure investment; liberalized transport services
environment
Trade facilitation complemented by liberalization of transport
and distribution services
Basic ICT connectivity: Infrastructure investment Advanced ICT services: Infrastructure, competitive markets
(liberalized ICT services environment)
Small market size?
Access to inputs: Liberalized access to key inputs (selective
tariffs / NTM reform)
Access to inputs: Broad-based liberalization – goods and services – including trade, investment, and domestic regulatory policy
Market access: Preferential trade agreements Market access: Deep trade agreements (incl investment and
services)
Weak institutions?
Governance: political stability Governance: policy predictability Deepen trade cooperation and commitments
Legal: contract enforcement Legal: contract enforcement + IPR protection
Innovation: basic standards regime Innovation: innovation ecosystem (R&D policy, industry-academia
links, etc)
Creating an environment for continuous innovation
R&D capacity and IPR protection
Trade facilitation and
transport liberalization
Skill development: technical
and managerial

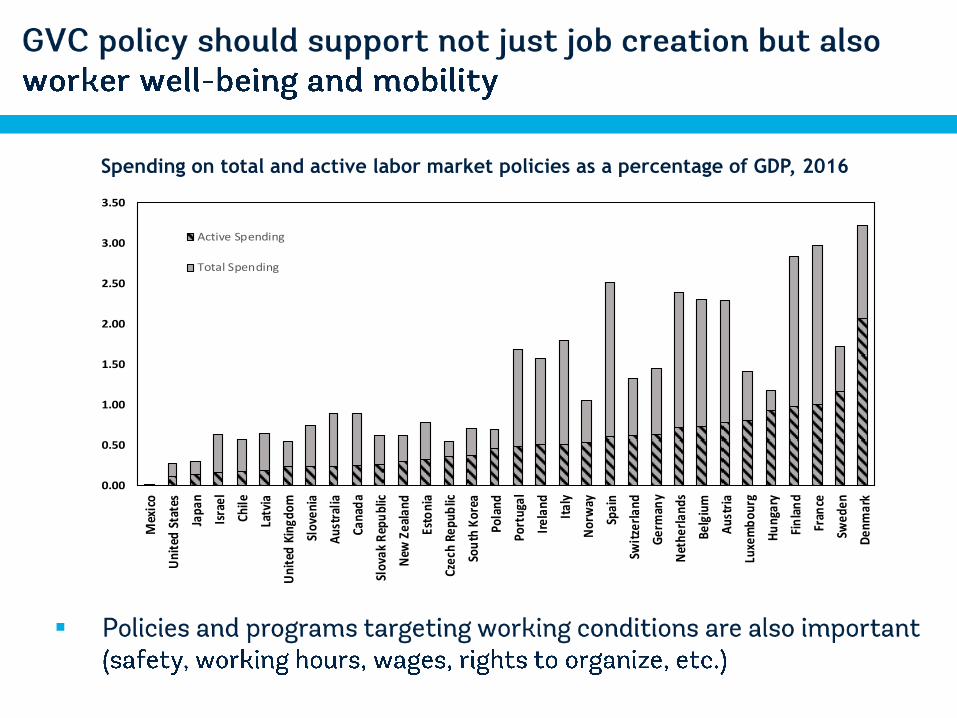
Spending on total and active labor market policies as a percentage of GDP, 2016
0.00
0.50
1.00
1.50
2.00
2.50
3.00
3.50
Mex
ico
Uni
ted
Sta
tes
Japa
n
Isra
el
Chile
Latv
ia
Uni
ted
Kin
gdom
Slov
enia
Aus
tral
ia
Cana
da
Slov
ak R
epu
blic
New
Zea
land
Esto
nia
Czec
h Re
pub
lic
Sou
th K
orea
Pola
nd
Port
ugal
Irel
and
Ital
y
Nor
way
Spai
n
Swit
zerl
and
Ger
man
y
Net
herl
ands
Belg
ium
Aus
tria
Luxe
mb
ourg
Hu
ngar
y
Fin
lan
d
Fran
ce
Swed
en
Den
mar
k
Active Spending
Total Spending
▪


•
•
•

•
•
•

traders processorsWholesalers/
retailers
•
•
•
•
•
•

•
•
•
•
•
•
•
•
•
•
•

•
•
•
•

•
•
•

•
•
•
•
•
•
•
•

Linkages– examples and lessons
•
•
•
•
•
•
Guinea Linkages Program
Chile World Class
Supplier Development
Program
Malaysia Industrial
Linkages Program
Czech Pilot Supplier
Development Program
Supplier Development
Program

•
•
•
•
•
•
•
➢
➢
➢
•
•
•
•
•
•
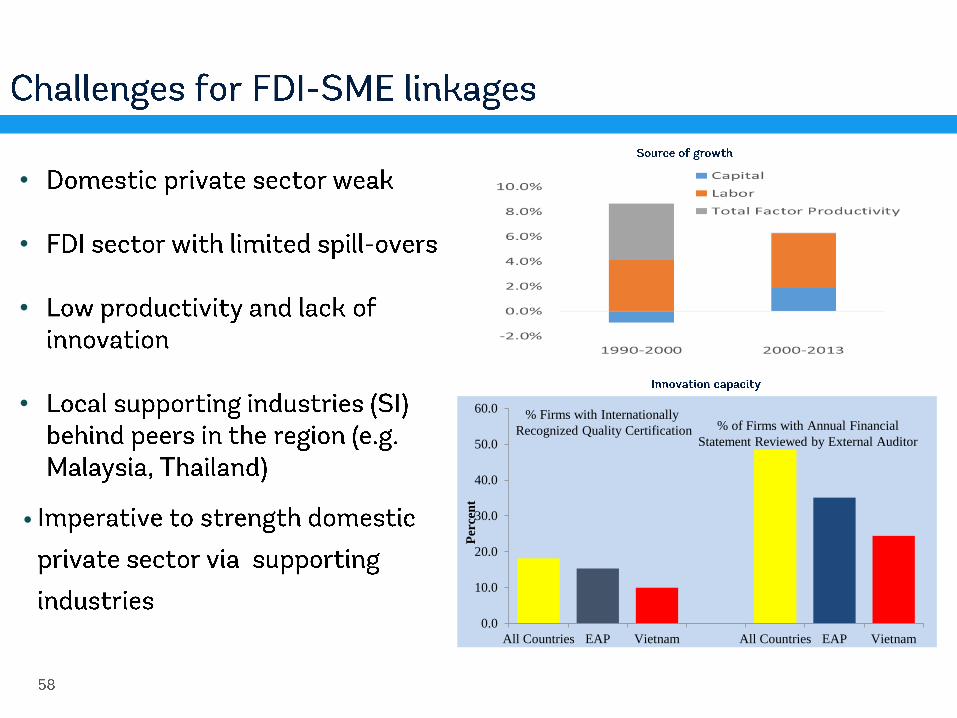
0.0
10.0
20.0
30.0
40.0
50.0
60.0
All Countries EAP Vietnam All Countries EAP Vietnam
Per
cen
t
% Firms with Internationally
Recognized Quality Certification % of Firms with Annual Financial
Statement Reviewed by External Auditor
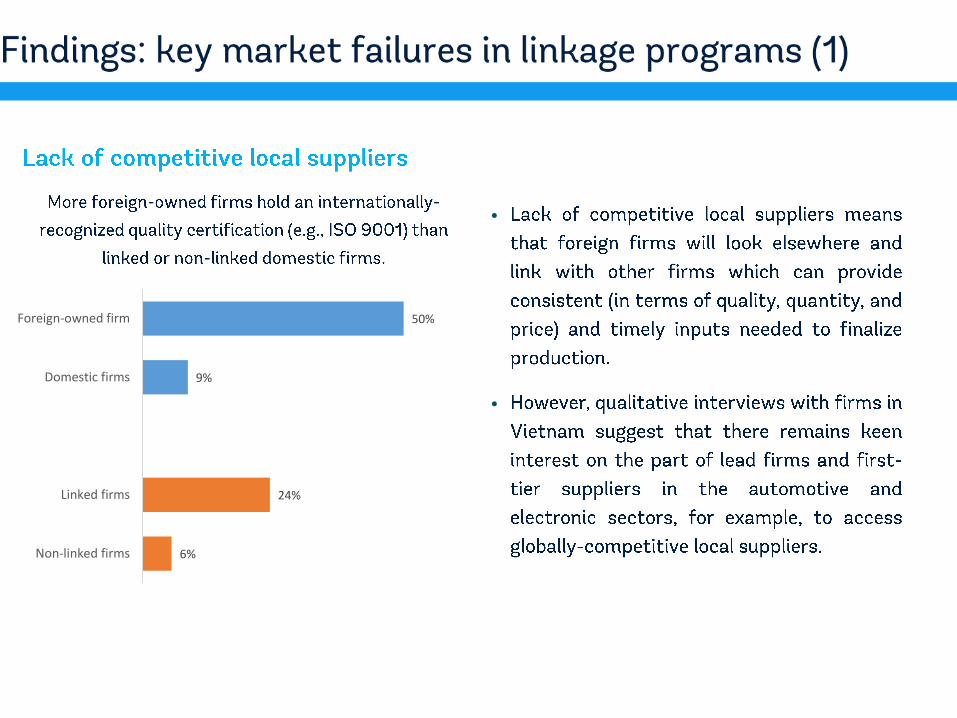
50%
9%
24%
6%
Foreign-owned firm
Domestic firms
Linked firms
Non-linked firms
•
•


•
•
•
•
•

•
62
•
•