ODUBOLA ISRAEL
O.
POVERTY, UNEMPLOYMENT, HUMAN CAPITAL DEVELOPMENT AND
GROWTH IN NIGERIA
ABSTRACT
The study explored the synergy among poverty, unemployment, human
development and growth in Nigeria between 1985-2013. The Ordinary
Least Square technique was employed for the regression analysis. Poverty
and unemployment are interlinked and in conjunction, contributed
adversely to the growth of the economy. It was also gathered that the
government has not prioritized on human capital development by failing to
give the education and health sectors adequate budgetary allocation and
attention. The results obtained unveiled that the principal causes of poverty
in Nigeria are unemployment and inflation. The study therefore
recommends that government should bring up an all-encompassing policy
that will basically focus on poverty alleviation, job creation and
macroeconomic stability.
1

Keywords: Poverty, Unemployment, Human Development,
Growth.
CHAPTER
ONE
1.1 INTRODUCTIO
N
Nigeria is the most populous nation in Africa and the
8th in the world with an estimated figure of about 170
million people based on the facts released by the
National Population Commission (NPC, 2012). In addition
to this, the nation boasts of being the largest economy
in Africa as the GDP figure for 2013 and 2014 stood at
N13526.25 and N14475.38 billion respectively (Economic
Watch). Despite these magnificent feats, the country
is still faced with several developmental, economic and
political problems such as youth unemployment, poverty,
corruption, income inequality, population explosion and
political instability.
2

Unemployment has been an hindering factor to the
attainment of sustainable development. In Nigeria,
unemployment is more prevalent among the youths. Every
year, tertiary institutions turn out thousands of
graduates in large mass with no absorptive capacity in
the labour market. Moreover, young people are more
likely to be employed in jobs of low quality, poor
working conditions, poor remuneration and engagement in
dangerous works or receive a short term informal
employment arrangements. The inadequate employment
situation of youths attracts a number of socio-
economic, moral and political vices such as armed
robbery, thuggery, vandalisation of government assets,
corruption, prostitution, wastage and underutilization
of human resource. The prevalence of unemployment has
birthed the presence of poverty in the nation.
Successive government has employed several strategies
to curb both challenges, but the results achieved so
far have not been remarkable.
Poverty in Nigeria is soaring with almost 100 million
of its population living less than a dollar per day
despite the country’s status of the largest market size3
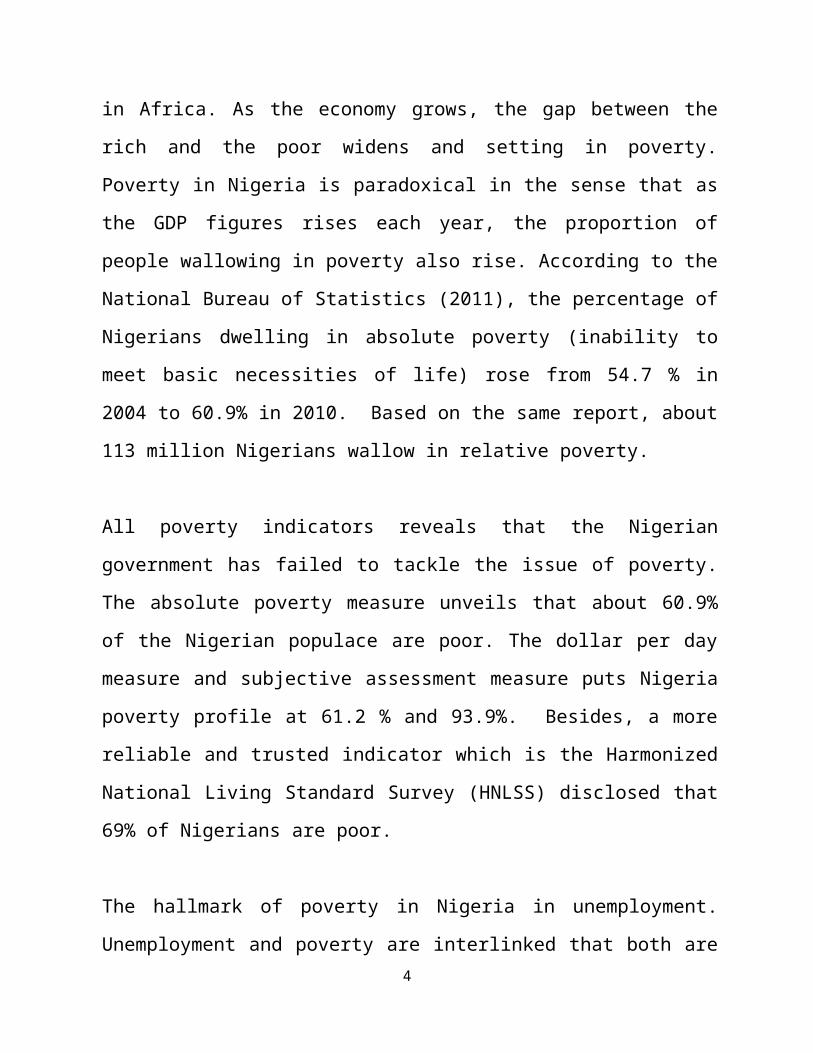
in Africa. As the economy grows, the gap between the
rich and the poor widens and setting in poverty.
Poverty in Nigeria is paradoxical in the sense that as
the GDP figures rises each year, the proportion of
people wallowing in poverty also rise. According to the
National Bureau of Statistics (2011), the percentage of
Nigerians dwelling in absolute poverty (inability to
meet basic necessities of life) rose from 54.7 % in
2004 to 60.9% in 2010. Based on the same report, about
113 million Nigerians wallow in relative poverty.
All poverty indicators reveals that the Nigerian
government has failed to tackle the issue of poverty.
The absolute poverty measure unveils that about 60.9%
of the Nigerian populace are poor. The dollar per day
measure and subjective assessment measure puts Nigeria
poverty profile at 61.2 % and 93.9%. Besides, a more
reliable and trusted indicator which is the Harmonized
National Living Standard Survey (HNLSS) disclosed that
69% of Nigerians are poor.
The hallmark of poverty in Nigeria in unemployment.
Unemployment and poverty are interlinked that both are4

interchangeably used for one another. It is very
possible for someone to be employed and still be poor,
this clearly explains underemployment. Underemployment
is a subset of unemployment that reflects the failure
to utilize factor inputs (labour) to stimulating
economic growth. Low returns of labour and high rate of
unemployment generates poverty. Poverty makes it hard
to invest in human capital development that would boost
productivity.
Households also face inter-generational poverty trap.
They are faced with the dilemma of either sending their
children to school or to earn a sub-income. The social
negative effect of unemployment breeds a sense of
hopelessness. Structural unemployment and poverty are
one of the reasons for the prevalence of terrorism in
some regions of the country. Insecurity caused by the
deadly Boko-Haram sect and the Militants of the Niger
Delta can be traced to poverty and unemployment simply
because if all the youths are fully employed, none will
think of undertaking catastrophic acts.
5

It can therefore be asserted that high poverty and
unemployment level poses greater threat to the nation’s
economic prosperity, security and peaceful co-
existence. Thus, a giant step must be taken by the
current administration at all levels to combat with
this menace.
1.2 STATEMENT OF THE
PROBLEM
An average Nigerian man is a poor man. Nigeria is a
nation mixed with affluence and penury which means that
large proportion of the country’s wealth is controlled
by the few elite leaving the masses with none. The
divergence of macroeconomic indicators and the day-life
experience is a source of concern. Macroeconomic
indicators are not accurate yardstick to estimate the
yearnings and needs of the people.
The essence of every administration is to make life
easier for the people. The true success of any
government is measured by its ability to reduce
poverty, create wealth and jobs, provide qualitative
6
education and health facilities and invest in human
capital formation. Without these, developmental realm
cannot be achieved.
1.3 OBJECTIVES OF THE
STUDY
The main objective of this research study is to
investigate critically the main determinants of poverty
in Nigeria.
1.4 RESEARCH QUESTIONS
The questions raised in this study are
i. Why is an average Nigerian poor and unemployed?
ii. What are the necessary effective strategies to be
taken by the government to reduce the high rate
of poverty and unemployment in Nigeria?
1.5 JUSTIFICATION FOR THE
STUDY
Poverty and Unemployment is as old as man. Both evils
are present in every economy even in the advanced
economies of the world. Many a research study only
7
focuses on the poverty and unemployment on economic
growth. This study expands the frontiers by
investigating the specific factors that causes poverty
in Nigeria. It is no doubt that the study will be
useful for the monetary and public authorities,
financial and non-financial institutions, academics and
relevant stakeholders in making sharp policies in
curbing it. It will also be beneficial for students and
other researchers in their future research
undertakings.
1.6 SCOPE OF THE
STUDY
The study x-rays the impact of poverty and unemployment
on growth and also examines the determinants of poverty
in Nigeria. The study makes use of secondary data from
the Central Bank of Nigeria statistical bulletin. The
years to be reviewed in the study ranges from 1985-
2013.
1.7 ORGANISATION OF THE STUDY
The study has been broken into five parts. The first
chapter presents the introduction. The second and third
provides the literature review and research methodology8

and model specification respectively. While the fourth
and last section explores the presentation and
interpretation of results and conclusion and relevant
policy recommendation.
9
CHAPTER TWO
REVIEW OF RELATED LITERATURE AND THEORETICAL FRAMEWORK
2.1 THE CONCEPT OF UNEMPLOYMENT
One of the challenges obstructing Nigeria from
attaining the height of economic development is the
high rate of unemployment experienced over years. The
total labour force encompasses people between the ages
of 15-64, excluding students, home keepers, retired and
those who are disinterested from working. Unemployment
or perhaps the unemployed are group of people who are
capable and qualified to work but unable to find job to
earn a means of livelihood.
Earlier school of economic thought gave much attention
to the issue of unemployment and treated it as
something undesirable and injurious to the economy.
Economists from the era of Adam Smith to Karl Marx down
to Keynes expressed varying degree of concern to
unemployment. The population in a country is into two
that is the working population and the dependent
10

population. The working population or the economically
active population includes those who are actively
employed plus those who are unemployed (willing and
able to work). The economically inactive population
constitutes those who are neither working nor willing
to work (Njoku, 2011).
The International Labour Organization (ILO) defined the
unemployed as the number of the economically active
population who are currently without work but actively
seeking for job, also including those who voluntarily
left their job and those who were sacked from their
work. The application of this definition has be
criticized , mainly for the purpose of comparison and
policy formulation, as different nations have varying
zeal of commitment in tackling the menace (Akintoye,
2008). Moreso, housewives, who are willing and able to
work, the definition of the age bracket stands as a
limitation to the definition given by the ILO
(Douglason and Gbosi, 2006).
Unemployment serves as an impediment to social
progress. It represents a total wastage of a country’s
manpower resources. It leads to welfare loss in terms
11
of productivity thereby reducing income and living
standard (Raheem, 1993). Unemployment is a serious
issue facing all the countries of the world especially
among the less developed countries in general (Rama,
1998) and the Sub-Saharan African countries in
particular (Umo, 1986).
2.1.1 FORMS OF UNEMPLOYMENT
The creation of full employment is a common
macroeconomic goal every nation strives to achieve.
However, full employment does not imply a zero
unemployment rate. Full employment can be said to be
achieved when the unemployment rate is minimally low
(between 3-4%). Every dynamic economy will certainly
have some unemployment, which is not harmful. The
commonest types of unemployment are structural
unemployment, cyclical unemployment, frictional
unemployment, disguised unemployment, seasonal
unemployment, residual unemployment, voluntary
unemployment and involuntary unemployment
Structural Unemployment:
12
Changes occur in market economies such that demand
increases for some job skills while other job skills
are outdated and are no longer in demand. Structural
unemployment is said to occur when there is a mismatch
between the worker’s skill and technological
advancement.
Frictional Unemployment:
This type of unemployment occurs because of workers who
are voluntarily between jobs. Some are looking for
better jobs. Others may be moving to a different
geographical area for personal reasons and time must be
spent searching for a new job.
Cyclical Unemployment:
This occurs due to downturn in overall business
activity usually during a recession or deep depression.
During a recession, total productivity will decline and
as such there will be less demand for labour simply
because less labour will need to produce less output.
Disguised Unemployment:
13

Disguised unemployment exists frequently in developing
countries whose large population creates a labour
surplus in the labour force. When more people are
working than is necessary, the overall productivity of
each individual drops. Disguised unemployment is
characterized by low productivity and frequently
accompanies informal labour markets and agricultural
labour markets, which can absorb substantial quantities
of labour.
Seasonal Unemployment:
Seasonal unemployment occurs when there is a limited
need for a kind of work to be performed during a
particular period during the year based on some factors
like deadlines or climate.
Residual Unemployment:
It is the kind of unemployment that remains in periods
of full employment, as a result of those physically,
mentally or emotionally unfit to work.
14

Voluntary and Involuntary Unemployment:
Voluntary unemployment is a situation when a person is
unemployed not because of not being able to find
employment, but due to the fact of being unable to find
his/her own desired job. Sometimes, people reject
employment opportunities if they do not receive the
desired wages or if they are not offered the kind of
work they wish to do.
On the other hand, involuntary unemployment occurs when
a person is willing to work at the prevailing wage rate
yet unemployed. It is different from voluntary because
workers choose not to work because their reservation
wage is higher than the prevailing wage. In an economy
with involuntary unemployment, there is usually surplus
of labour at the current wage rate.
Underemployment:
It is a situation in which a worker is employed but not
in the desired capacity whether in terms of
compensation, hours, skills and experience. It occurs
when a worker is working for longer hours with a low
pay in commensuration with his qualification and skill.
15

Technically, unemployed and underemployed often compete
for available jobs.
2.1.2 THEORIES OF UNEMPLOYMENT
Economists from time memorial have postulated different
theories as regard unemployment. Different school of
thought conceived unemployment from different angle but
the bottom line remains the same that unemployment
decreases national output. The theories of unemployment
are
Classical Theory of Unemployment:
Classical unemployment occurs when the real wages are
kept above the market clearing wage, leading to surplus
of labour supplied. The classical economists believed
that unemployment exists because the current wage rate
is higher than the wage rate employers are willing to
pay their workers. Classical unemployment indicates
that the prevailing market wage rate is too high. They
proposed that if wages are more flexible (market-
determined by the invisible hand), unemployment will be
solved.
Neo-Classical Theory of Unemployment:
16

The neo-classical theorists alluded that the labour
market is similar to market for any tangible products.
According to them, unemployment is voluntary, that is
workers are unemployed because they have not found
their suitable and desired job or their wage cannot be
reduced by their employers due to national labour laws.
This reflects the inability of the labour market to
operate under perfect competition either because there
are monopolistic trends in the market or workers have
limited information about the position to be filled in.
The inflexibility of setting wages downwards and the
lack of information leads to an unstable market
equilibrium. They proposed that conditions that will
bring the existence of a perfect competitive labour
market where wages will be determined by the supply and
demand for labour should be established to terminate
unemployment.
Keynesian Theory of Unemployment:
17
This is a situation where low wage rates should produce
higher employment levels, but don’t because the economy
is in recession and the employers are facing low demand
for their goods and service, consequently demanding for
low amount of labour. Keynes saw the lack of demand for
jobs as potentially resolvable bythe government by
raising its aggregate expenditure.
Okun’s Law
Arthur Okun proposed the empirical observed
relationship between unemployment and losses in a
country’s production. The gap version states that for
every 1 percent increase in the unemployment rate, a
country’s GDP will be roughly an additional 2 percent
lower than its potential GDP. The difference version
describes the quarterly change in real GDP and
unemployment. The stability and application of the law
has been criticized.
Okun’s law is rather an empirical observation rather
than a result derived from theory. Okun’s law is
approximate because factors other than employment such
as productivity affect output. In Okun’s original
18
statement of his law, 2 percent output increase
corresponds to a 1 percent fall in cyclical
unemployment rate. A 0.5 percent increase in labour
force participation, a 0.5 percent increase in hours
worked per worker and 1 percent in output per hour
worked (labour productivity).
Okun’s law states that a point increase in cyclical
unemployment rate is associated with two percentage
points of negative growth in real GDP. The relationship
depends on the country and time period under
consideration. The relationship has been tested by
regressing GDP or GNP growth on the change in the
unemployment rate. Martin Prachowny estimated about a 3
percent fall in output for every 1 percent increase in
unemployment rate. He asserted that majority of this
change in output is attributable to changes in other
factors like capacity utilization and hours worked
other than unemployment. Holding these other factors
constant reduces the association between unemployment
and GDP to around 0.7 percent for every 1 percent
change in unemployment rate (Prachowny, 1993).
19
There are several reasons why GDP may rise or fall more
rapidly than a rise or fall in unemployment rate. As
unemployment increases
a.A reduction in the multiplier effect created by the
circulation of money from employees.
b.Unemployed persons may drop out of the labour force
after which they are no longer counted in
unemployment statistics.
c.Employed persons may work for shorter hours.
d.Labour productivity may decrease, because employers
retain more workers than they need.
2.1.3 FACTORS ATTRIBUTABLE TO HIGH UNEMPLOYMENT RATE
IN NIGERIA
Unemployment in Nigeria is pervasive among the youths.
Over 65 percent of the Nigerian youths are unemployed
and if plans are not made to tackle this menace by the
youths, government and other stakeholders, the
situation will become incurable. The number of
applicants for the Nigeria Immigration Service aptitude
test that took place on the 15th March, 2014 is a
testament that unemployment is by and large a national
20
insult to the Nigerian economy. Policy makers should be
more interested in knowing the factors responsible for
the high unemployment situation and providing several
ways to resolve it. Some of the factors responsible for
this ‘evil monster’ are
Poor Educational Policy and Poor Personal Development
of the Youth
It is quite unfortunate that the curricula used in the
Nigerian tertiary institutions of learning are in
concordance with the demands of employers in the labour
markets. Anybody who wants to be employable must be
knowledgeable and conversant with the current trends
within and outside of his area of discipline.
On the other hand, most youths or perhaps graduate
cannot write understandably well and speak fluently.
Some of them are not proficient with the use of
computer and they are aware that any job that must be
gotten in this ‘jet-age’ needs a sound knowledge of
computer, hence they become unemployable.
Lack of Infrastructures
21
Nigeria is a consuming (import-oriented) nation rather
than a producing nation. It is when the country turns
to a diversified producing economy that more jobs can
be created. The manufacturing, agriculture and
construction sectors are the one that can create more
jobs and this will have a multiplier effect on the
economy. These sectors can meaningfully contribute to
GDP when infrastructures like roads, railway, water,
power supply, telecommunications and financial services
are put in place.
Poor Leadership
Past leaders of the country should have projected the
current state of unemployment in the country and made
strategic plans to mitigate its prevalence. Proceeds
realized from crude oil should have been diversified
into other sectors of the economy. Policies to create
small scale businesses to the unemployed youths and
widows should have been implemented, but it is a pity
that Nigerian leaders are personal-interest driven and
greed oriented.
Corruption
22
Corruption is one of the big troubles confronting the
economic progress of the nation. Though, people’s
perception towards corruption is that it kills economic
growth and development, in contrary, a school of
thought stressed that corruption can improve the growth
and wealth of a nation if the money and funds embezzled
are spent on productive and meaningful projects rather
than siphoning it into their personal bank accounts. It
is crystal clear that almost Nigeria leaders embezzle
public funds, but at least the fund embezzled should be
invested via establishing industries and giving of
grants and capital for setting up of small and medium
scale businesses. The few available vacancies in the
civil service or government agencies should be based on
‘qualification and competency’ rather ‘connection or
long-leg’.
Others reasons amongst others are lack of savings and
investment trait, incompetent business skills and
administration and bad attitude to work and
unattractiveness of the agricultural sector
23
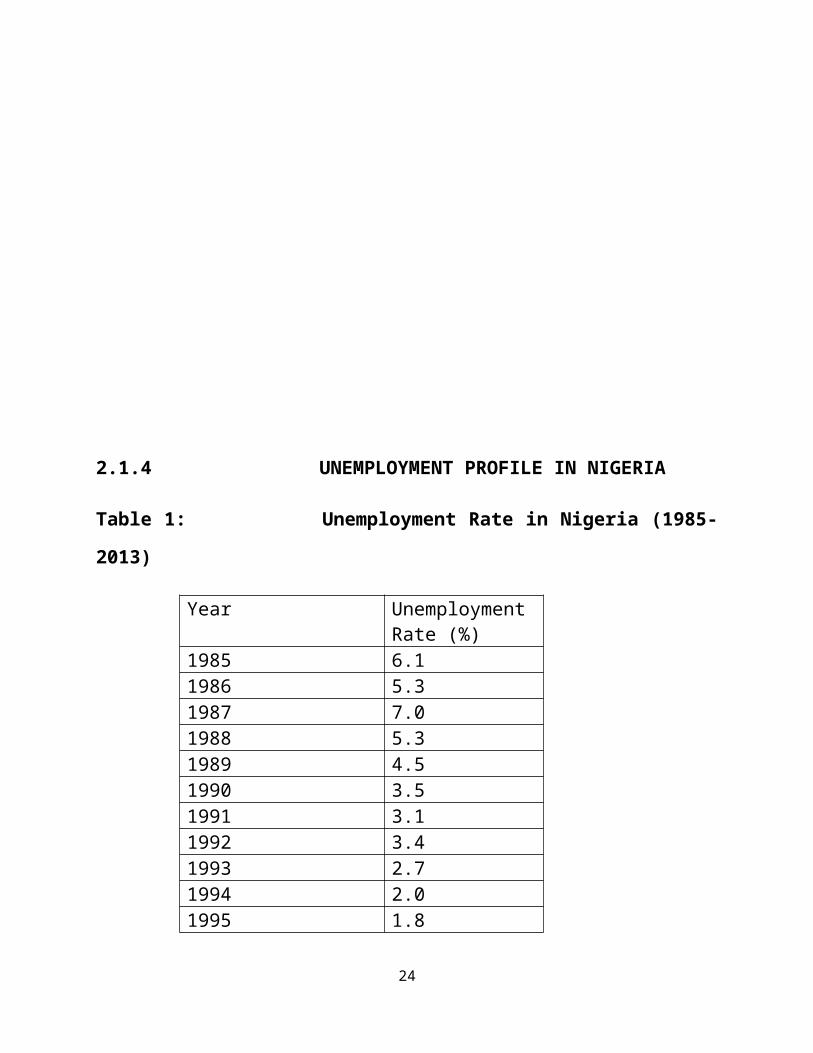
2.1.4 UNEMPLOYMENT PROFILE IN NIGERIA
Table 1: Unemployment Rate in Nigeria (1985-
2013)
Year UnemploymentRate (%)
1985 6.11986 5.31987 7.01988 5.31989 4.51990 3.51991 3.11992 3.41993 2.71994 2.01995 1.8
24

1996 3.41997 3.21998 3.21999 3.12000 4.72001 4.22002 3.02003 14.82004 13.42005 11.92006 14.62007 12.72008 14.92009 19.72010 21.42011 23.92012 25.72013 23.9
Source: Economic Watch (2014)
Figure 1: Trend of Unemployment Rate (%) in Nigeria
(1985-2013)
25

2.2 CONCEPT OF POVERTY
There is no precise and specific definition of poverty
because it cut across different aspects from life
spanning from physical, moral and to psychological of
human conditions. Different yardsticks have been
devised to explain poverty. Poverty is the inability to
meet basic needs (Watts, 2000). However, the term
26
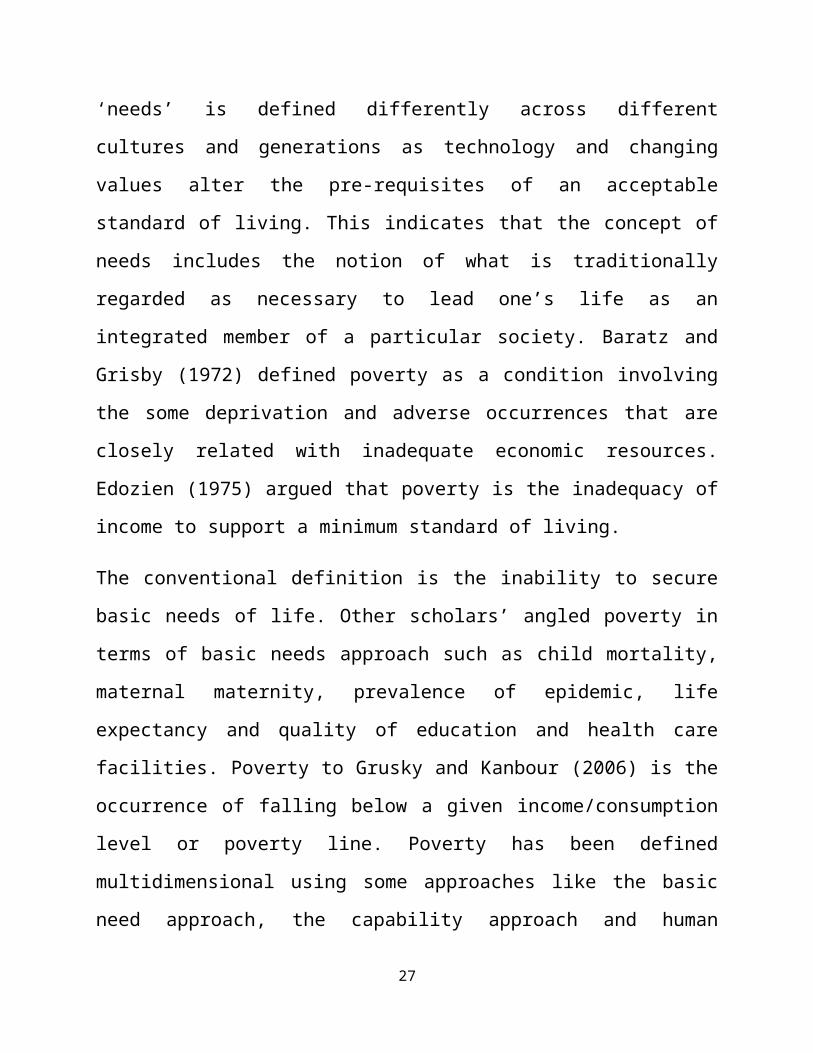
‘needs’ is defined differently across different
cultures and generations as technology and changing
values alter the pre-requisites of an acceptable
standard of living. This indicates that the concept of
needs includes the notion of what is traditionally
regarded as necessary to lead one’s life as an
integrated member of a particular society. Baratz and
Grisby (1972) defined poverty as a condition involving
the some deprivation and adverse occurrences that are
closely related with inadequate economic resources.
Edozien (1975) argued that poverty is the inadequacy of
income to support a minimum standard of living.
The conventional definition is the inability to secure
basic needs of life. Other scholars’ angled poverty in
terms of basic needs approach such as child mortality,
maternal maternity, prevalence of epidemic, life
expectancy and quality of education and health care
facilities. Poverty to Grusky and Kanbour (2006) is the
occurrence of falling below a given income/consumption
level or poverty line. Poverty has been defined
multidimensional using some approaches like the basic
need approach, the capability approach and human
27
development approach. The most widely accepted one is
the human development index approach set by the United
Nations Development Programme (1990) which constitutes
the three vital part of human development namely life
expectancy, educational attainment and standard of
living.
Poverty is the inability to meet the three core-values
of development which are life sustenance, self-esteem
of the people and freedom from servitude. It is the
severe deprivation of basic needs of life and
fundamental human right. It is a plague that affects
all countries of the world but more pervasive in less
developed countries. Poverty based on the World Bank
definition, is the inability of an individual to earn
below a dollar (the international poverty line) in a
day.
Olayemi (2012) conceptualized poverty into four
components namely lack of access to basic goods and
services, lack of impaired access to productive
resources, inefficient use of common resources and
exclusion mechanism effect. Poverty as a lack to basic
needs is economic and consumption oriented. It explains
28
poverty in material terms and adopts consumption based
approach to identify the extremity of poverty and
distinguish the poor from the non-poor. The poor are
the individuals in the society incapable of purchasing
basic goods and services in the society. Impaired
access to productive resources sees poverty as the
inability to have access to agricultural land, physical
capital and financial asset which leads to low
disposable income, low productivity, low savings and
low investment. It also focuses on the extent to which
individual can utilize his available resources to
improve his material wellbeing. Poverty is the outcome
of common resources used inefficiently due to weak
policy formulation, inadequate infrastructure and low
technical knowhow. All these translate to low
productivity and hence low output growth. Lastly,
poverty can be due to certain mechanism in the system
excluding individuals from contributing to economic
development including in a democratic political
setting. For instance, the discomfort index
(composition of unemployment and inflation rate),
though of low economic importance but used by
29

politicians to present their scorecard to the public or
to criticize their opponents policies and performance.
2.2.1 MEASURMENT OF POVERTY
There are many approaches to measuring poverty. Among
them are
Relative Poverty Measurement
Relative poverty is defined by reference to the living
standards of majority in a given society that separates
the poor from the non-poor. Households with
expenditure greater than two-thirds of the total
household per capita expenditure are non-poor whereas
those below it are poor. Furthermore, households with
expenditure less than one-third of the total household
per capita expenditure are core-poor or extreme poor
while households with more than one-third but less than
two-thirds of the total expenditure per capita are
moderate poor. Accordingly, the poor category is sub-
divided into those in extreme poverty and moderate
poverty, where extreme poverty is more severe than
moderate poverty. Those in moderate poverty are
constituted by the growing middle class who are at the
30
point of moving to the non-poor category. Also, the
non-poor is also grouped into two namely the fairly
rich and the very rich (NBS report, 2012). The National
Bureau of Statistics report on poverty (2012) unveiled
that relative poverty in Nigeria as at 2004 stood at
54.4 percent (68.7 million out of 126.3 million people)
but rose to 69 percent in 2010 (approximately 112.5
million people out of 163 million people). The North -
West and North- East geo-political zone had the highest
poverty rate in the country with 77.7 percent and 76.3
percent respectively. The South-West zones recorded the
least poverty rate of 59. 1 percent. Among the states,
Sokoto received the highest poverty rate of 86.4
percent while Niger state had 43.6 percent poverty rate
(NBS, 2012). It can therefore be said that poverty is
more prevalent in the North-West zone and less rampant
in the South-West zone.
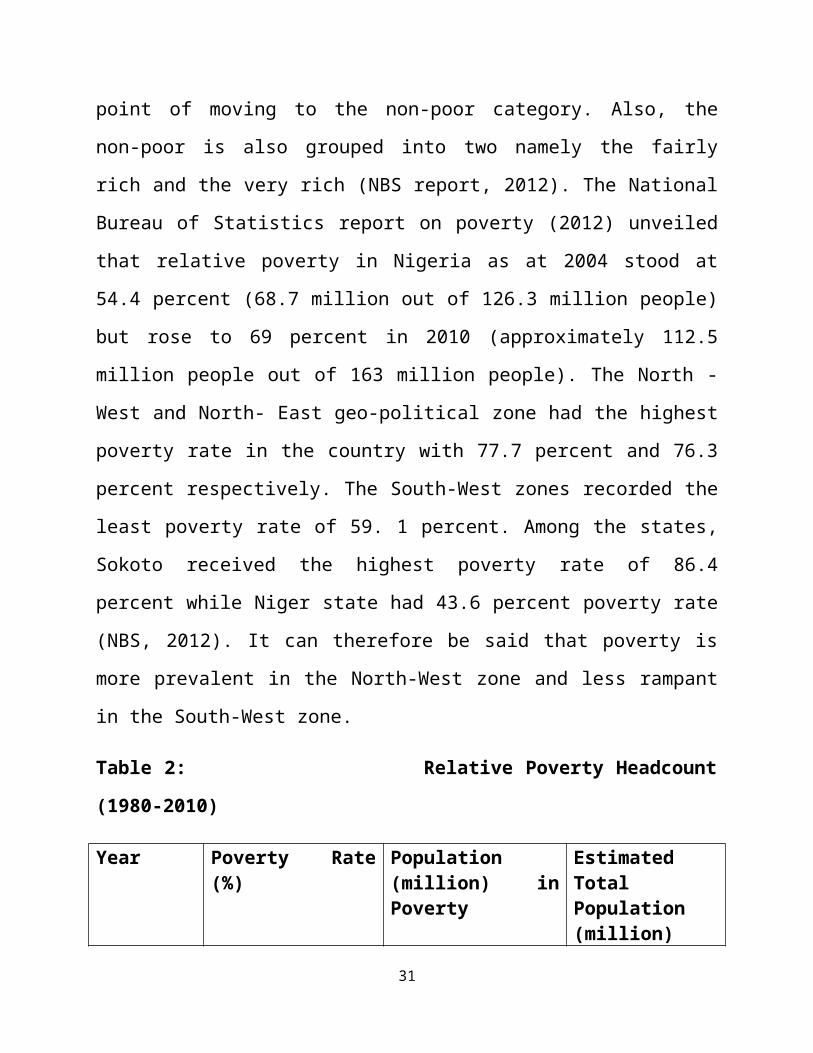
Table 2: Relative Poverty Headcount
(1980-2010)
Year Poverty Rate(%)
Population(million) inPoverty
EstimatedTotalPopulation(million)
31

1980 27.2 17.1 651985 46.3 34.7 751992 42.7 39.2 91.51996 65.6 67.1 102.32004 54.4 68.7 126.32010 69.0 112.5 163Source: Harmonized National Living Standard Survey
(2010).
Absolute Poverty Measurement
It is defined in terms of the minimum requirements
necessary to afford minimal standards of food,
clothing, healthcare and shelter. Using this measure,
54.7 percent of Nigerians were living in poverty in
2004 and rose to 60.9 percent in 2010 (99.3 million
Nigerians). Among the geo-political zones, the North-
West and North-East recorded the highest poverty rate
of 70 percent and 69 percent respectively while the
South-West had the least poverty rate of 49.8 percent.
At the state level, Sokoto had the highest poverty rate
of 81.2 percent while Niger state recorded the least
poverty rate of 33.8 percent.
The Dollar-Per Day Measurement
32

This refers to the proportion of those living on less
than $1 per day poverty line. With this approach, 51.6
percent of Nigerians were living below $1 per day in
2004, but increased to 61.2 percent in 2010. Although,
the World Bank standard according to the NBS report in
2012 has to be marginally raised to $1.25 in opposition
to the $1 used when the survey was conducted. The
North-West geopolitical zone recorded the highest
poverty rate of 70.4 percent while the South-West
region has the least rate of 50.1 percent. At the state
level, the Sokoto state recorded the highest poverty
rate with 81.9 percent, while Niger state has the least
poverty rate standing at 33.9 percent (NBS report,
2012). Out of the 6 geopolitical zones, poverty is more
prevalent in the North-West but this does not mean that
poverty is not pervasive in other geopolitical zones.
Table 3: Incidences of Poverty by
Zones (%)
33

Zones AbsolutePoverty
RelativePoverty
Dollar PerDay
NorthCentral
59.5 67.5 59.7
North East 69.0 76.3 69.1North West 70.0 77.7 70.4South East 58.7 67.0 59.2South South 55.9 63.8 56.1South West 49.8 59.1 50.1 Source: Harmonized Living Standard Survey, 2010.
Subjective Assessment Poverty Measurement
This involves inquiring from the populace through their
opinions on whether they themselves think they are poor
or not.
Gini-Coefficient
This is a yardstick used to measure the degree of
income inequality in a given society at a particular
period of time. Income disparity and poverty are
interlinked. A country with a high degree of income
disparity will have poverty at its doorstep, because
the margin between the rich and the poor will widen
profusely. The gini coefficient or index ranges between
0 and 1. The higher the gini index, the more the
34
incidence of income disparity in such society. Gini
index of 0 is perfect equality (where all the citizens
earn the same income) and 1 is perfect inequality
(where one person earns all the income and others earn
zero income). Moreover, both cases are unrealistic.
2.2.2 CAUSES OF POVERTY IN NIGERIA
The main causes of poverty in Nigeria are unemployment,
ignorance, high inflation, environmental degradation,
high population growth, poor governance and the like.
Poverty is more pervasive in the rural regions and more
precisely in the North West geo-political zone. The
major causes of poverty in the rural region are use of
outmoded and inefficient system in agriculture and
craft. Others factors responsible for low income in the
rural areas according to Abubakar (1995) include
inadequate infrastructures, lack of credit and
marketing facilities, unfavorable rural institutions as
regard land tenure, illiteracy, ignorance and cultural
and institutional rigidities. Williams (1984) has also
identified lack of viable non-farm employment
opportunities in the rural sector thereby leading to
overcrowding on the land and underemployment of labour.
35

It should be added that even though alternative
occupations like traditional craft and petty trading do
exist in most villages, yet investigations have showed
that incomes realized from these occupation is still
identical to the income gotten from farming.
In addition to the scarcity of renemeruative non-
farming occupations during the dry season, Hill (1982)
mentioned the following additional factors as chief
causes of poverty particularly in a rural Hausa setting
i. Limitation of the farming season
ii. The unreliability of the climate especially as it
concerns annual and erratic distribution of
rainfall within the famine season.
iii.The underutilization of labour resources during
the famine season resulting from the inability of
many poor farmers to farm on a scale which
matches their labour resources and rudimentary
nature of the system of farm-labour employment
and the dire shortages of working capital, which
severely limits the scale and productiveness of
farming especially where the cultivation of the
36

manure farmland is the preferred agronomic
system.
Unfavourable physical environmental conditions such as
land desertification in the North, water hyacinth in
inland waterways and oil spillage in the Niger Delta,
have contributed to the economic fortune of the
inhabitants of those areas of the country, thereby
worsening their level of poverty. Abubukar (2002)
stated in corrobation that 35 percent of the country’s
land mass in the North has been desertificated. In
addition to this, unemployment is the major cause of
poverty in Nigeria. Unemployment has aggravated the
incidence of poverty in Nigeria. Abubakar (2002) noted
that between 1985 and 1996, the tertiary institutions
in Nigeria turned out 1,110,000 graduates and only
90,000 (8.2 percent) were able to secure formal jobs
which rendered the remaining 93.8 percent jobless or
underemployed during the period.
The National Bureau of Statistics (1996) noted that the
main causes of poverty in Nigeria are unemployment,
inflation rate, illiteracy, economic mismanagement,37
poor governance, corruption, insecurity, high external
debt burden, high incidence of diseases, population and
environmental degradation. In concordance, Ajakaiye
and Adeyeye (2001) alluded that the causal factors of
poverty are low economic growth, macroeconomic shocks,
policy failures; labour market deficiency, unemployment
and underemployment lag in human development, debt
burden, disease, environmental degradation and criminal
acts. Abubakar (2002) captured the poverty occurring
factors as macroeconomic distortions, corruption, bad
governance, bad debt, socio-economic factors, physical
environment and high population growth.
2.2.3 POVERTY PROFILE IN NIGERIA
Poverty is still rampant in the Nigerian economy.
Statistics revealed that poverty incidence in Nigeria
has been alarming since the 1980s. The United Nation
Development Programme Report (2010) stated that between
1980 and 1996, the percentage of the core-poor rose
from 6.2 percent to 29.3 percent and declined to 22.0
percent. There is the geographical dimension of
poverty in Nigeria. According to Aigbokhan (2000),
poverty is severe in the rural areas than in the urban
38

areas. In 2004, 67 percent of the urban populace had
access to potable water whereas in the rural areas, 31
percent had access to such. In addition to this, 53
percent of the urban dwellers had access to sanitation
services while 36 percent of the rural populace was
accessed to that (World Bank, 2002). This fact
justified the reason for the prevalence of disease in
the rural areas simply because the living condition is
extremely low in the areas.
Garba (2002) alluded that the World’s per capita income
was $7140 in 2003. Nigeria’s per capita income in 2003
was $290, therefore making Nigeria one of the poorest
nations in the world. This relegated Nigeria to the
league of other poor nations like Togo ($270), Rwanda
($220) and Mali ($210). Other indicators of development
such as the life expectancy ranked Nigeria 155th out 177
countries in the world and infant mortality rate ranked
Nigeria 148th out of 173 countries further buttressed
the fact that Nigeria is paradoxical in nature-rich
country, poor people (CIA, 2009).
According to the Earth Trends (2003), 70.2 percent of
Nigerians live less than $1 in a day and 90.8 percent
39
live less than $2 daily. The total income earned by the
top 20 percent of the population is 55.7 percent while
the total income earned by the bottom 20 percent is 4.4
percent. This explains the alarming increase in poverty
and the sharp inequality between the rich and the poor.
Bayelsa state which has the highest welfare per capita
in Nigeria, recorded 26.2 incidence of poverty between
1995 and 2006 is still below the state that has the
highest welfare per capita in other countries like
Accra, Ghana (2.4 percent), Douala, Cameroun (10.9
percent), Baoteng, South Africa (19.0 percent) (World
Bank, 2008). Using selected world development
indicators, the life expectancy at birth in 2006 for
male and female in Nigeria was 46 and 47 years
respectively. Between 2002 and 2007, 27.2 percent of
children under the age of five were malnourished
compared to 3.7 percent of the same indicator in
Brazil. The mortality rate of children below the age of
five in Nigeria was 191 per 1000 births in 2006. The
situation is alarming compared to 69 per 1000 births in
South Africa, 108 per 1000 births in Togo, 120 per 1000
birth in Ghana and 149 per 1000 births in Cameroun
(World Bank, 2008). This implies that there is a40
general high level of poverty in Nigeria. Poverty is
plentiful amidst the poor in the Nigerian society.
Nigeria is the 8th largest oil producing nation in
Nigeria and has the largest gross domestic product in
the African continent but contains the largest
proportion of the poor in the Sub-Saharan region. There
is a wide income disparity between the rich and the
poor which has resulted in the resources of the nation
in the hands of the few rich.
2.2.4 EFFECT OF THE PREVALENCE OF POVERTY AND
UNEMPLOYMENT
Poverty and unemployment are the developmental
challenges behind the economic stagnancy of Nigeria.
Poverty and unemployment are interlinked and are
positively correlated with one another. The effect of
poverty and unemployment in the economy is adverse.
Abubakar (2002) believed that poverty is always
associated with unemployment and in conjunction they
produce unpleasant socio-economic repercussion.
Poverty and unemployment destroy hope, aspirations,
self esteem, sense of personal competency and
41

happiness. They lead to religious clashes, ethnic
violence, terrorism, insecurity, prostitution,
disorder, armed robbery, social disorder, human
trafficking, loss of output and income, para-suicide,
depression, gangsterism, and personal hardship, waste
of human skills and resources, child labour, abuse of
human and civil rights and brain drain where highly
skilled and educated Nigerians migrate to other
countries in search for greener pastures.
2.2.5 POVERTY ALLEVIATION STRATEGY IN
NIGERIA
Successive administrations in Nigeria have formulated
various policies and programme to alleviate and reduce
the incidence of poverty via the activities of its
ministries and agencies, partnering with international
agencies and through the creation of agencies with the
exclusive goal on tackling the rising rate of poverty
and unemployment. At the inception of the Obasanjo
administration, the Joda panel was established to
review various poverty eradication programmes initiated
by the previous administrations. Some of the agencies
42

created by the past administrations before the return
of democracy in 1999 were
i. The National Directorate of Employment (NDE)
ii. Peoples Bank of Nigeria (PBN)
iii.Nigerian Agricultural and Cooperative Bank Ltd
(NACB)
iv. Nigerian Agricultural Insurance Corporation
(NAIC)
v. National Commission for Nomadic Education (NCNE)
vi. National Primary Healthcare Development Agency
(NPHDA)
vii.National Agricultural Land Development Authority
(NALDA)
viii. National Commission for Mass Literacy, Adult
and Non-Formal Education
ix. Federal Agricultural Coordinating Unit (FACU)
x. Directorate for Food, Roads and Rural
Infrastructures (DFRRI)
xi. Agricultural Projects Monitoring and Evaluation
Unit (APMEU)
xii.Family Economic Advancement Programme (FEAP)
xiii. Industrial Development Centre (IDC)
43
xiv.Federal Department of Rural Development (FDRD)
xv. Federal Ministry of Agriculture, Water Resources
and Power and Steel
xvi.River Basin Development Authorities (RBDAs)
xvii. Family Support Trust Fund (FSTF)
xviii. National Centre for Women Development (CWD)
xix.Nigerian Industrial Development Bank (NIDB)
xx. Nigerian Import-Export Bank
xxi.Nigerian Bank for Commerce and Industry (NBCI)
xxii. Nigerian Economic Reconstruction Fund
xxiii. Green Revolution (GR)
xxiv. Operation Feed the Nation (OFN)
Others are
i. National Empowerment for Economic and Development
Strategy (NEEDS)
ii. National Poverty Eradication Programme (NAPEP)
iii.Poverty Alleviation Programme (PAP).
It is worthwhile to know that the programmes and
agencies aforementioned are saddled with the core-
responsibility of tackling poverty directly or
indirectly (through employment generation). Some of
the commonest programmes are explained below
44
Rural Basin Development Authorities (RBDAs)
It was established by Decree 37 of August 1976 during
Muritala Muhammed Administration. It is one of the
earliest attempts to combat with poverty through
improved agricultural production. The main goal of
RBDAs is the economic exploitation and management of
land and water resources of their respective areas of
operation with particular but varying emphasis on the
development of agriculture, fishing and human
settlement, infrastructural facilities and the
improvement of the environment.
Operation Feed the Nation (OFN)
OFN was initiated in 1979 by General Olusegun
Obasanjo. The programme attempted to eradicate poverty
through increasing food production on the premise that
availability of food will raise the nutritional level
of the ordinary Nigerian and invariably lead to high
per capita income and standard of living. OFN lasted
till the emergence of the civilian administration of
AlhajiShehuShagari in 1979.
45
Green Revolution (GR)
The programme founded by ShehuShagari in 1979 shared
the same objective of tackling poverty through
increased food production with the preceding military
administration of General Olusegun Obasanjo.
Directorate for Food, Roads and Rural Infrastructure
(DFRRI)
DFRRI was introduced by Ibrahim Babaginda during his
administration that lasted between 1985 to 1992. DFRRI
sought to open up rural areas through construction of
feeder roads and provision of basic amenities that
would turn them into production centers for the
national economy.
National Directorate of Employment (NDE)
It is an indirect measure taken by the government to
tackle poverty via creation of jobs.
National Empowerment for Economic and Development
Strategy (NEEDS)
NEEDS was designed in 1999 during the Obasanjo
civilian administration. The focus of the programme is46
to trigger the nation to economic development through
reducing poverty, generating job opportunities,
creating wealth and value.
National Poverty Alleviation Programme (NAPEP)
It was introduced in early 2001 and remains the
current programme with the core-goal of eradicating
absolute poverty in Nigeria. NAPEP is supplemented by
the National Poverty Eradication Council (NAPEC),
which is saddled with the duty of coordinating
poverty-reduction related activities of all relevant
ministries, parastatals and agencies. It has the
mandate to ensure that wider range of activities is
centrally planned, co-ordinate and complement one
another so that the goals of policy continuity and
sustainability are achieved.
NAPEP encompasses four schemes namely
Youth Empowerment Scheme (YES)
This deals with capacity acquisition, mandatory
attachment, productivity improvement, credit delivery,
technology development and enterprise promotion.
Rural Infrastructure Development Scheme (RIDS)
47
This deals with the provision of potable and
irrigation water, transport (rural and urban), rural
energy and power support.
Social Welfare Service Scheme (SOWESS)
This deals with special education, primary healthcare
services, establishment and maintenance of recreation
centers, public awareness facilities, youth
development, environmental protection facilities, food
security provision, micro and macro credit delivery,
rural telecommunications facilities, and provision and
maintenance of mass transit.
National Resources Development and Conservation Scheme (NRDCS)
This deals with the harnessing of the agricultural,
water, social mineral resources, conservation of land
and space (beaches and reclaimed space) particularly
for the convenient and effective utilization by small
scale operators and immediate community. In short,
NAPEP is concerned with youth empowerment, rural
infrastructure development, provision of social
welfare services and natural resources development
conservation.
Poverty Alleviation Programme (PAP)48
PAP was an interim measure designed in 2000 to address
the problem of rising unemployment and crime incidence
particularly among the youths. It was targeted at
improving the material wellbeing of the populace. The
primary goals of PAP are to reduce the problem of
unemployment and raise effective demand in the
economy, boost productivity and lastly to reduce the
level of crimes in the country. In line with these
goals, PAP is targeted to
i. Provide at least 200,000 jobs for the unemployed
ii. Creating a credit system in which farmers will
have easy access to loans, aids and grants.
iii.Raise adult literacy rate from 51 to 70 percent
by the year 2003
iv. Increasing health care delivery system
v. Training of at least 60 percent tertiary
institution graduates
vi. Establishing and developing small and medium
scale businesses.
It is unfortunate that as strategic these programmes
were, it failed to reduce the rate of poverty, create
job opportunities and empowerment and material
wellbeing of the people. Collin (2003) stressed that a49

number of factors militated against the delivery of
various poverty eradication programmes. The factors
were lack of targeting mechanism for the poor (most of
the programmes were not poor-focused), political
instability, frequent policy changes, inconsistent
implementation, inadequate co-ordination of various
programmes which have resulted in each institution
carrying out its own activities with resultant
duplication of efforts and inefficient use of the
limited resources. Antai (2007) added that severe
budgetary, management and governance problems have
afflicted most of the programme resulting in facilities
not completed, broken down, abandoned and ill-equipped.
Also lack of accountability and transparency made the
programme serve as a pipe for draining natural
resources. In addition, over-extended scope of
activities of institutions resulted in resources being
spread too thinly on too many projects. Example of such
is DFRRI and Better Life for African Women Development
which covered almost every sector and overlapped with
many existing programmes.
2.2.6 HUMAN DEVELOPMENT INDEX (HDI)
50
The HDI was created to emphasize that people and their
capabilities should be the ultimate criteria for
assessing the development of a country and not economic
growth alone. The HDI can be used to question national
policy choices asking how two countries with the same
level of per capita income can end up having different
human development outcomes. These contrasts can
stimulate debate about government policy priorities.
The human development index is a summary measure of
average achievement in key dimensions of human
development namely long and healthy life, being
knowledgeable and enlightened and having a decent
standard of living. The HDI is a geometric mean of
normalized indices for each of the three dimensions.
The health dimension is assessed by life expectancy at
birth component of the HDI is calculated using a
minimum value of 20 years and a maximum value of 85
years. The education component of the HDI is measured
by the mean of years of schooling for adults aged 25
and expected years of schooling for children of school
entering age. Mean years of schooling is estimated by
UNESCO institute for statistics based on educational
51

attainment data from censuses and surveys available in
its database. Expected years of schooling are capped at
18 years. The indicators are normalized using a minimum
value of zero and maximum aspirational values of 15 and
18 years respectively. The two indices are combined
into an education index using arithmetic mean.
The standard of living dimension is measured by the
gross national income per capita. The goalpost for
minimum income is $100 (PPP) and the maximum value is
$75000 (PPP). The minimum value for GNI per capita set
at $100 is justified by the considerable amount of
unmeasured subsistence and nonmarket production in
economies close to the minimum that is not captured in
the official data.
The HDI uses the logarithm of income to reflect the
diminishing importance of income with increasing GNI.
The scores of the three HDI dimension indices are
aggregated into a composite index using the geometric
mean. The HDI varies between 0 and 1. HDI value of more
than 0.8 signifies a very high human development. HDI
value between 0.799-0.700 represents high human
development. HDI value between 0.699-0.560 connotes
52
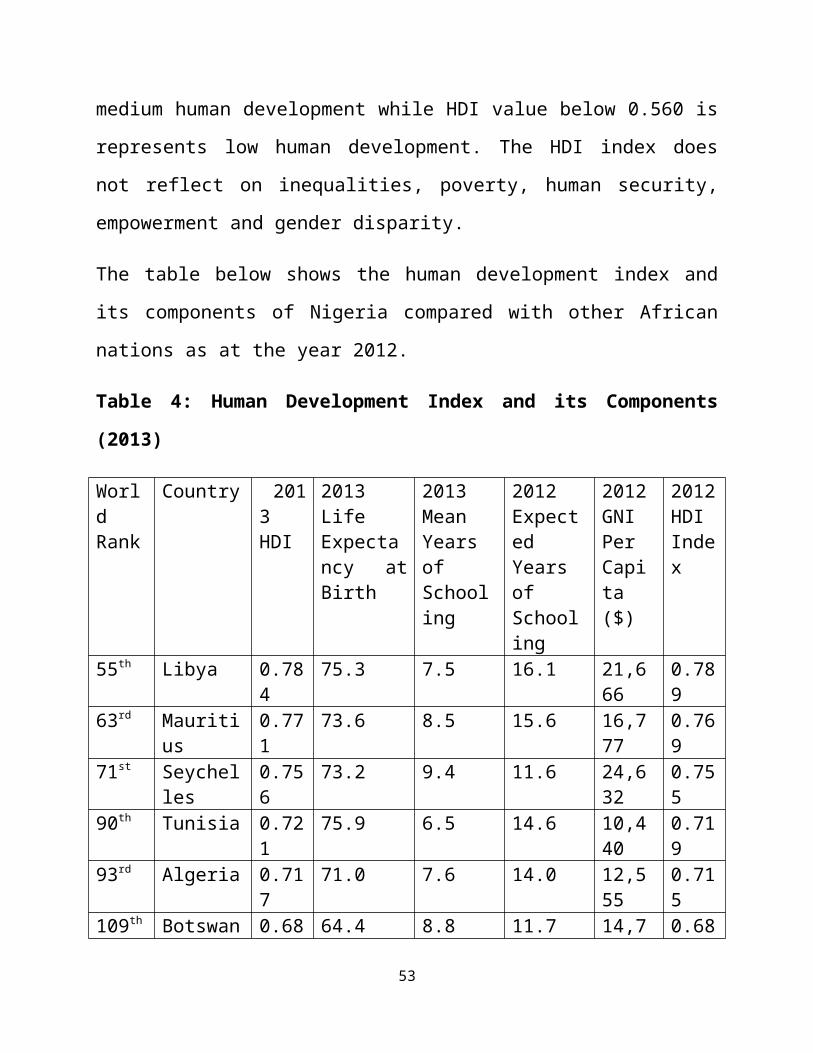
medium human development while HDI value below 0.560 is
represents low human development. The HDI index does
not reflect on inequalities, poverty, human security,
empowerment and gender disparity.
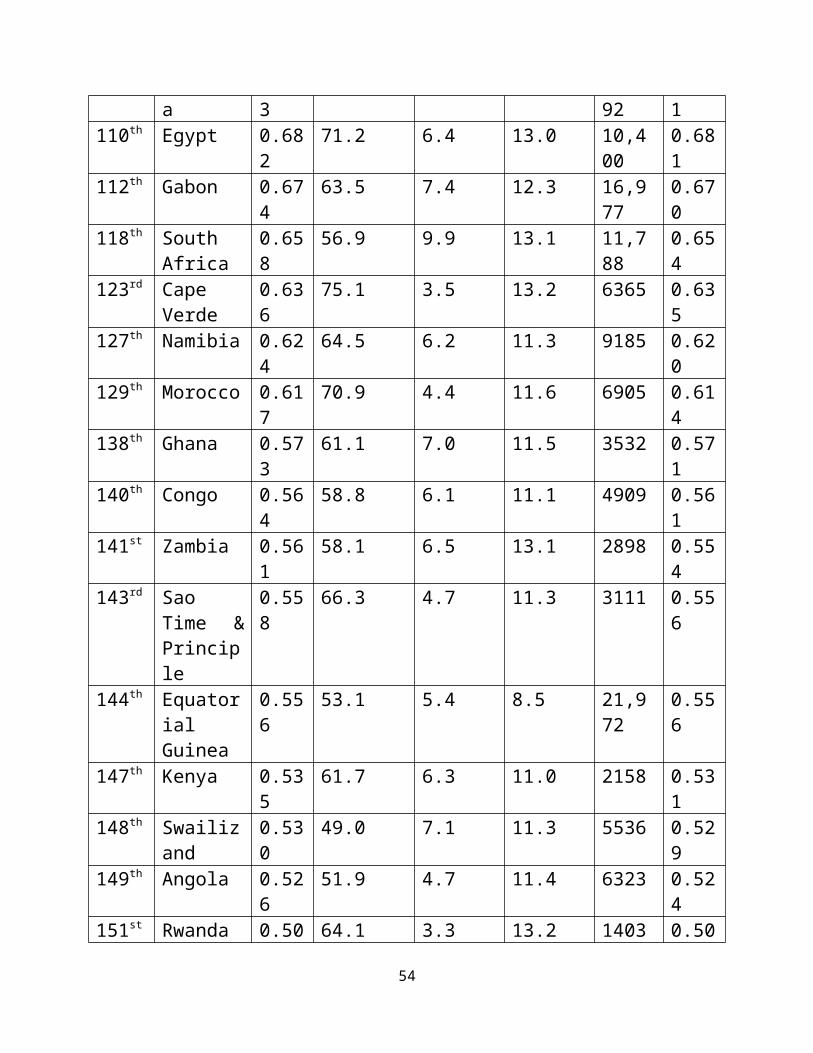
The table below shows the human development index and
its components of Nigeria compared with other African
nations as at the year 2012.
Table 4: Human Development Index and its Components
(2013)
WorldRank
Country 2013HDI
2013LifeExpectancy atBirth
2013MeanYearsofSchooling
2012ExpectedYearsofSchooling
2012GNIPerCapita($)
2012HDIIndex
55th Libya 0.784
75.3 7.5 16.1 21,666
0.789
63rd Mauritius
0.771
73.6 8.5 15.6 16,777
0.769
71st Seychelles
0.756
73.2 9.4 11.6 24,632
0.755
90th Tunisia 0.721
75.9 6.5 14.6 10,440
0.719
93rd Algeria 0.717
71.0 7.6 14.0 12,555
0.715
109th Botswan 0.68 64.4 8.8 11.7 14,7 0.68
53
a 3 92 1110th Egypt 0.68
271.2 6.4 13.0 10,4
000.681
112th Gabon 0.674
63.5 7.4 12.3 16,977
0.670
118th SouthAfrica
0.658
56.9 9.9 13.1 11,788
0.654
123rd CapeVerde
0.636
75.1 3.5 13.2 6365 0.635
127th Namibia 0.624
64.5 6.2 11.3 9185 0.620
129th Morocco 0.617
70.9 4.4 11.6 6905 0.614
138th Ghana 0.573
61.1 7.0 11.5 3532 0.571
140th Congo 0.564
58.8 6.1 11.1 4909 0.561
141st Zambia 0.561
58.1 6.5 13.1 2898 0.554
143rd SaoTime &Principle
0.558
66.3 4.7 11.3 3111 0.556
144th EquatorialGuinea
0.556
53.1 5.4 8.5 21,972
0.556
147th Kenya 0.535
61.7 6.3 11.0 2158 0.531
148th Swailizand
0.530
49.0 7.1 11.3 5536 0.529
149th Angola 0.526
51.9 4.7 11.4 6323 0.524
151st Rwanda 0.50 64.1 3.3 13.2 1403 0.50
54

6 2152nd Camerou
n0.504
55.1 5.9 10.4 2557 0.501
153rd Nigeria 0.504 52.5 5.2 9.0 5353 0.500Source: UNDP Report (2013)
2.2.7 MULTIDIMENSIONAL POVERTY INDEX
The multidimensional index (MPI) was developed in 2010
by the Oxford Poverty and Human development initiative
and the United Nations Development Programme. It uses
different factors to determine poverty beyond based
income levels. The MPI is an international measure of
acute poverty covering over 100 developing economies.
It supplements traditional income-based poverty
measures by capturing the severe deprivations that each
person faces at the same time with respect to
education, health and living standards. The MPI
assesses poverty at individual level. If someone is
deprived in a third or more of ten (weighted)
indicators, the global index identifies them as ‘MPI
poor” and the extent or intensity of their poverty is
measured by the number of deprivations they are
experiencing. The MPI can be used to create a
comprehensive picture of people living in poverty and
55

permits comparisons both across countries, regions and
the world and within ethnic group, urban/rural location
as well as other key household community
characteristics. This makes it an invaluable tool to
identify the most vulnerable people – the poorest among
the poor, revealing countries and overtime, enabling
policy makers to target resources and design policies
more effectively.
The index uses the same three dimensions as the Human
Development Index; health, education and living
standards. These are measured using ten indicators
which are health (child mortality, nutrition),
education (years of schooling, school attendance),
living standards (cooking fuel, sanitation, water,
electricity, floor and asset). Each indicator is
equally weighted. A person is considered poor if in at
least a third of the weighted indicators of poverty
denotes the proportion of indicators in which they are
deprived.
The MPI constitutes a sincere effort towards expansion
as well as simplification of poverty estimation. While
HDI and MPI use the 3 broad dimensions of health,
56
education and living standards. HDI uses only single
indicators for each dimension of poverty while MPI uses
more than one indicator for each one. This amongst
other reasons has led to the MPI only being calculated
for 104 nations where data is available for all these
diverse indicators while HDI is calculated for almost
all countries. However, though HDI is thus more
universally applicable, its relative sparsity of
indicators also makes it more susceptible to bias.
Indeed some studies have found it to be somewhat biased
towards GDP per capita as demonstrated by a high
correlation between HDI and the log of GDPpc. This has
led to the abandonment of HDI as an accurate yardstick
for measuring poverty and development.
The table below presents the MPI index and other
poverty parameters of developing African nations as at
2009.
Table 4: MPI Index and Other Poverty Parameter for
Some Selected African Nations
Country MPI% ofpeoplewho are
AverageIntensity of MPI
PercentageNumber
PercentageNumber
57
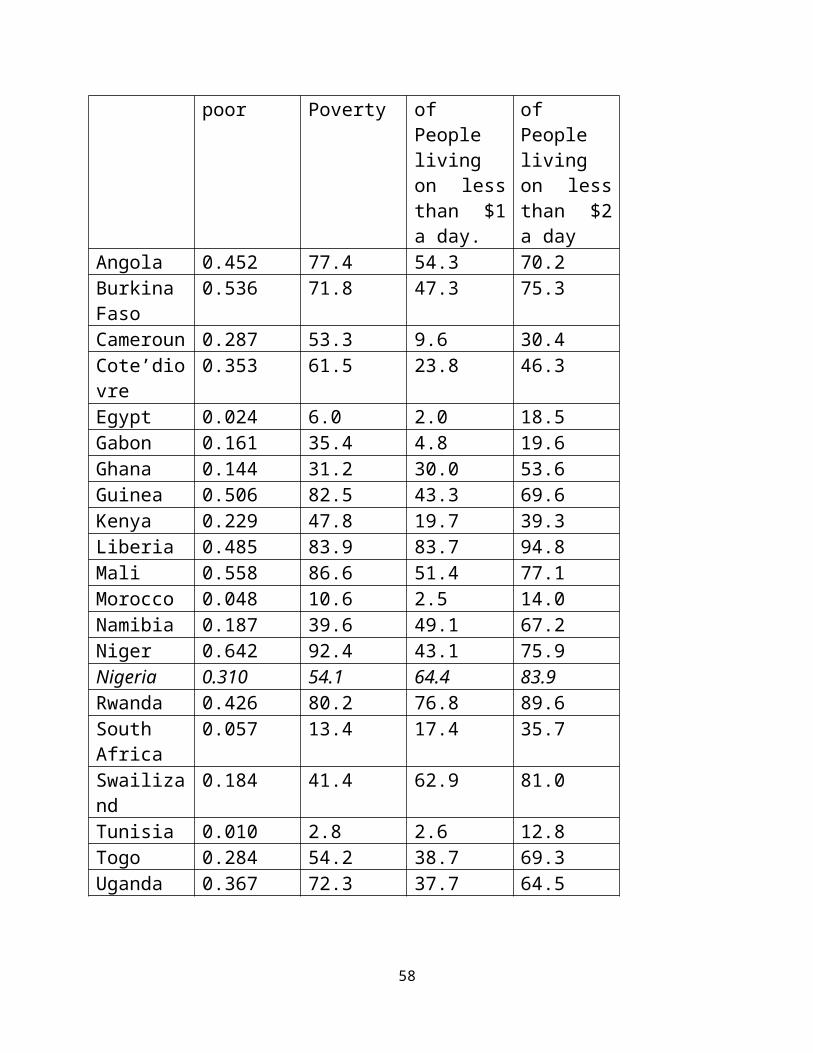
poor Poverty ofPeoplelivingon lessthan $1a day.
ofPeoplelivingon lessthan $2a day
Angola 0.452 77.4 54.3 70.2BurkinaFaso
0.536 71.8 47.3 75.3
Cameroun 0.287 53.3 9.6 30.4Cote’diovre
0.353 61.5 23.8 46.3
Egypt 0.024 6.0 2.0 18.5Gabon 0.161 35.4 4.8 19.6Ghana 0.144 31.2 30.0 53.6Guinea 0.506 82.5 43.3 69.6Kenya 0.229 47.8 19.7 39.3Liberia 0.485 83.9 83.7 94.8Mali 0.558 86.6 51.4 77.1Morocco 0.048 10.6 2.5 14.0Namibia 0.187 39.6 49.1 67.2Niger 0.642 92.4 43.1 75.9Nigeria 0.310 54.1 64.4 83.9Rwanda 0.426 80.2 76.8 89.6SouthAfrica
0.057 13.4 17.4 35.7
Swailizand
0.184 41.4 62.9 81.0
Tunisia 0.010 2.8 2.6 12.8Togo 0.284 54.2 38.7 69.3Uganda 0.367 72.3 37.7 64.5
58
Source; Oxford Poverty and Human Development initiative
(2011)
2.3 HUMAN CAPITAL DEVELOPMENT
Human capital development is the training,
strengthening, fortifying and energizing the human
capital base of a country. Human resource and human
capital have been often being used interchangeably.
Human resource refers to the mere population (youth-
adult size capacity) of a country while human capital
refers to the developmental and tactical training of
the human resource. The human resource of any country
can be either a blessing or curse depending on how they
are being utilized.
Human capital development also connotes the process in
which the human resource of a nation is trained,
exploited, harnessed and utilized. In other words, it
is the management of the human resource of a nation.
Many researches conducted revealed that one of the big
difference between advanced economies and less
developed economies is how well they have invested in
59
human capital development. Advanced countries of the
world have assiduously spent the resources of time,
energy and finance on human capital development and it
paid off for them in terms of higher productivity and
growth.
Human capital development is dissected into two
components which are namely education and health.
Massive investment into these two sectors is a license
for economic boom, progress and prosperity.
2.3.1 EDUCATION
Education is the process of imparting knowledge,
skills, attitude and norms to people. Education is the
greatest legacy that can ever be given to anyone.
Education is the answer to the poverty and misery of
man. Education is the key to exposure. The benefits of
education to mankind can never be overemphasized. All
nations of the world must give extra attention to the
educational sector because the recipients are the
leaders of tomorrow and if they are not properly
educated or imparted upon, they can become catastrophic
to the nation.
60
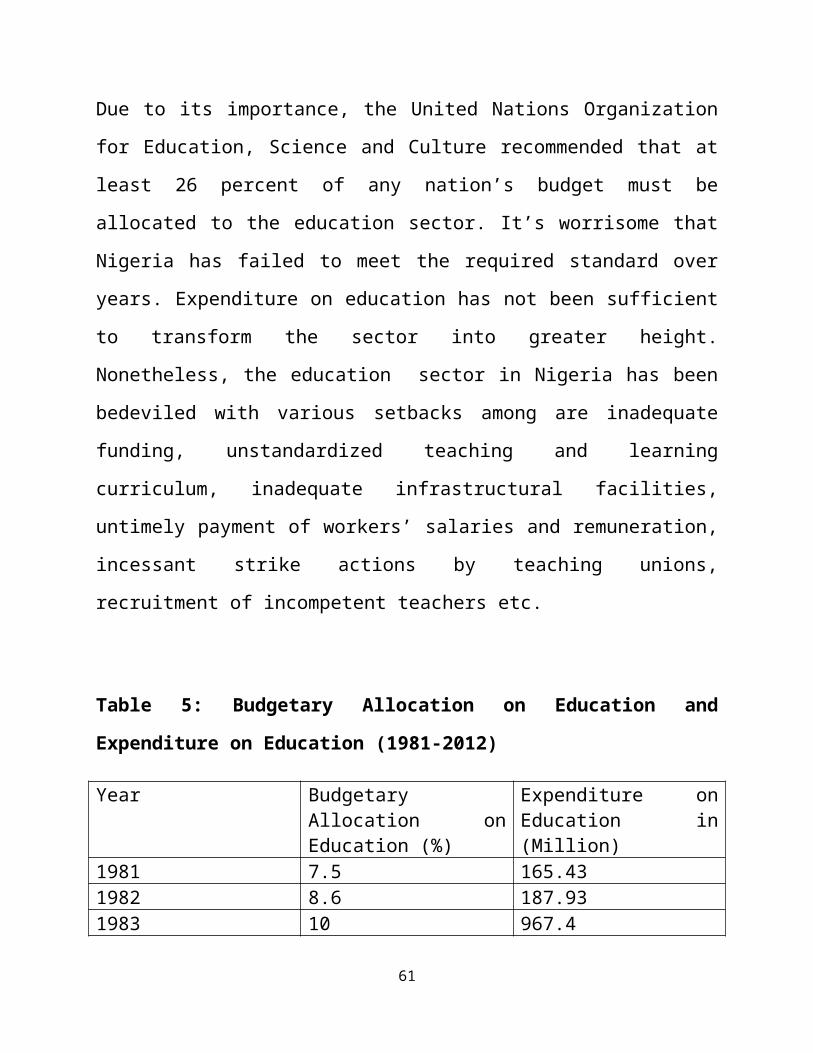
Due to its importance, the United Nations Organization
for Education, Science and Culture recommended that at
least 26 percent of any nation’s budget must be
allocated to the education sector. It’s worrisome that
Nigeria has failed to meet the required standard over
years. Expenditure on education has not been sufficient
to transform the sector into greater height.
Nonetheless, the education sector in Nigeria has been
bedeviled with various setbacks among are inadequate
funding, unstandardized teaching and learning
curriculum, inadequate infrastructural facilities,
untimely payment of workers’ salaries and remuneration,
incessant strike actions by teaching unions,
recruitment of incompetent teachers etc.
Table 5: Budgetary Allocation on Education and
Expenditure on Education (1981-2012)
Year BudgetaryAllocation onEducation (%)
Expenditure onEducation in(Million)
1981 7.5 165.431982 8.6 187.931983 10 967.4
61
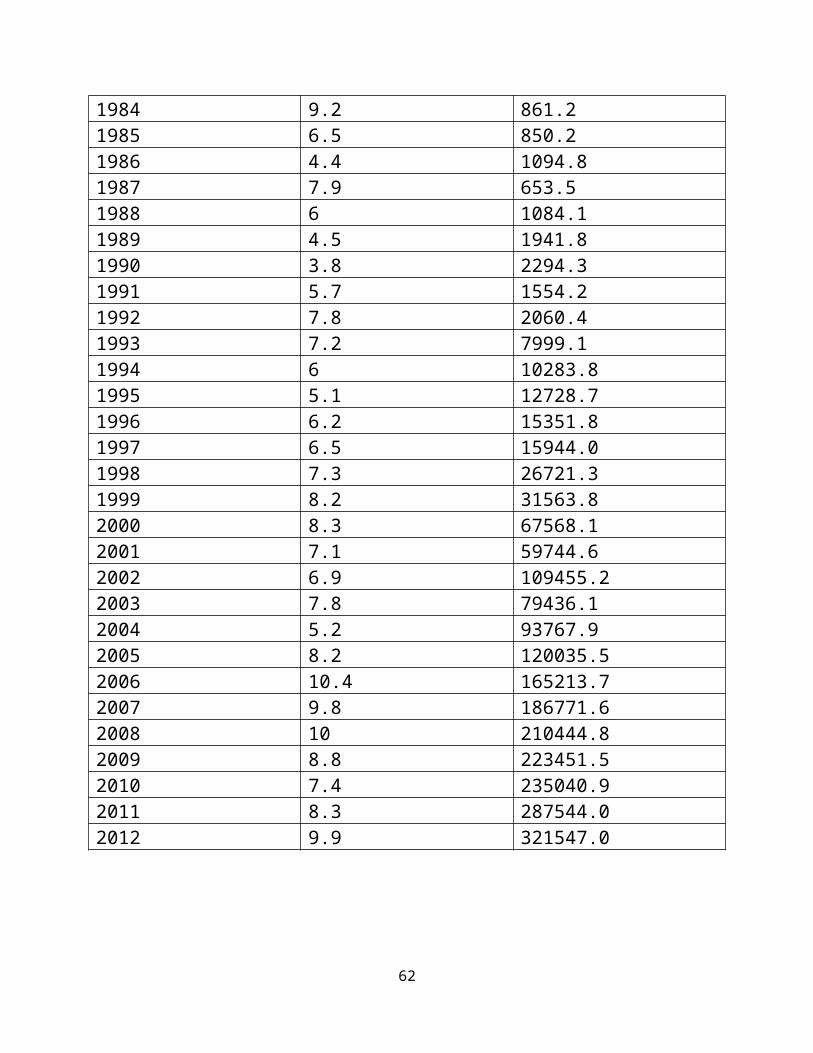
1984 9.2 861.21985 6.5 850.21986 4.4 1094.81987 7.9 653.51988 6 1084.11989 4.5 1941.81990 3.8 2294.31991 5.7 1554.21992 7.8 2060.41993 7.2 7999.11994 6 10283.81995 5.1 12728.71996 6.2 15351.81997 6.5 15944.01998 7.3 26721.31999 8.2 31563.82000 8.3 67568.12001 7.1 59744.62002 6.9 109455.22003 7.8 79436.12004 5.2 93767.92005 8.2 120035.52006 10.4 165213.72007 9.8 186771.62008 10 210444.82009 8.8 223451.52010 7.4 235040.92011 8.3 287544.02012 9.9 321547.0
62

Figure 2: Budgetary Allocation to Education in Nigeria
(%) 1981-2012
63

Figure 3: Total Expenditure on Education in Nigeria in
Million Naira, 1981-2012
2.3.2
HEALTH
To the layman, health is the absence of illness or
infirmities, but the concept of ‘health’ goes beyond
64

this. The most comprehensive and encompassing of health
was given by the World Health Organization (1977), they
defined health as the complete well-being state of a
man physically, emotionally, physiologically,
psychologically and spiritually.
All nations are ensued to give their health sector full
attention, because an healthy worker is a productive
worker, and a productive worker adds value to economic
growth of his country.
The yardsticks used for determining the Development of
Health Sector of a Country are
Life Expectancy: This is the minimum number of years
an individual is expected to live assuming the death
rate is assumed to be zero. In other words, it is the
predicted life-span of an individual when subjecting
the mortality rate to zero. Life expectancy varies
across different countries depending on their health
and environmental conditions. Life expectancy in the
advanced world is higher compared to the undeveloped
countries.
65
Mortality rate: This is the ratio of total deaths to
total population in a specified community or area at a
specified period of time. It is often expressed as the
number of deaths per 1000 of the population per time.
Maternal Mortality rate: This is annual number of
female deaths per 100,000 live birth from any cause
related to or aggravated by pregnancy or its management
excluding accidental or incidental causes.
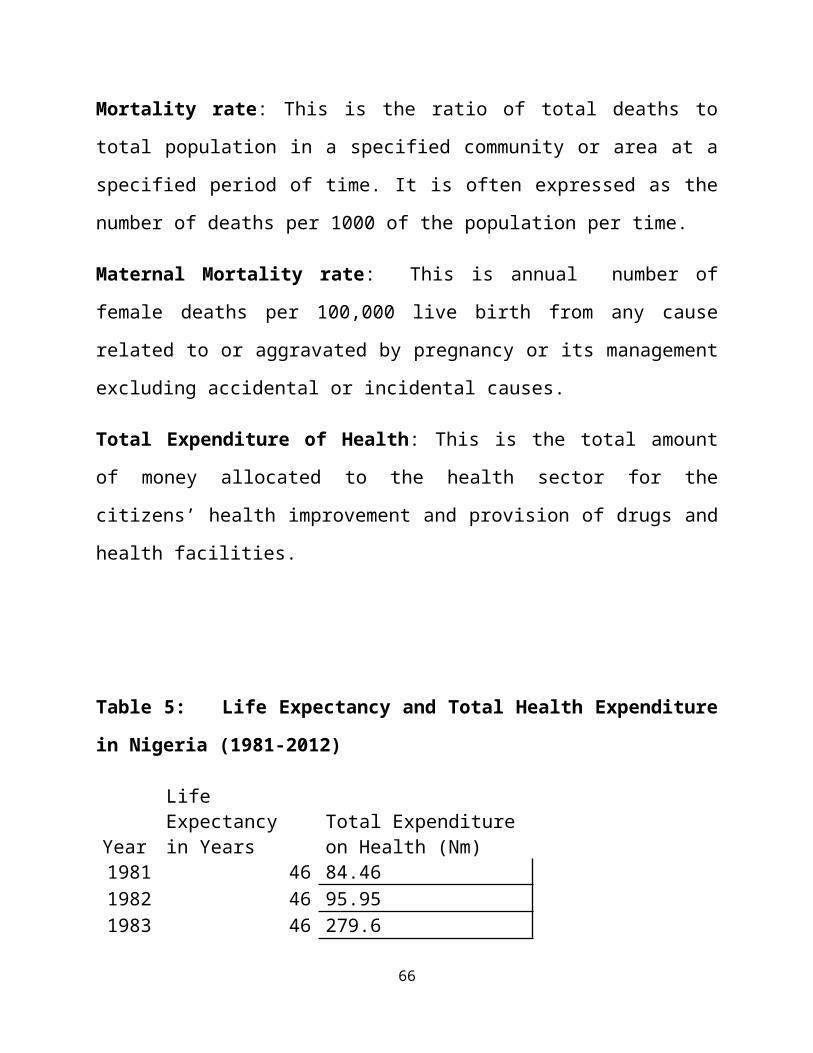
Total Expenditure of Health: This is the total amount
of money allocated to the health sector for the
citizens’ health improvement and provision of drugs and
health facilities.
Table 5: Life Expectancy and Total Health Expenditure
in Nigeria (1981-2012)
Year
Life Expectancy in Years
Total Expenditureon Health (Nm)
1981 46 84.461982 46 95.951983 46 279.6
66

1984 46 190.21985 46 223.41986 46 360.41987 46 236.41988 46 443.21989 46 452.61990 46 658.11991 46 7571992 46 1025.41993 46 2684.51994 46 3027.81995 46 5060.91996 46 58031997 46 11984.31998 46 161801999 46 18181.82000 47 44651.52001 47 63171.22002 47 39685.52003 48 59787.42004 48 71676.42005 49 98786.72006 49 1055902007 50 1224002008 50 138179.72009 51 1418792010 51 156896.82011 52 200278.9
2012 52225760.8
2013 54 229850.3
67
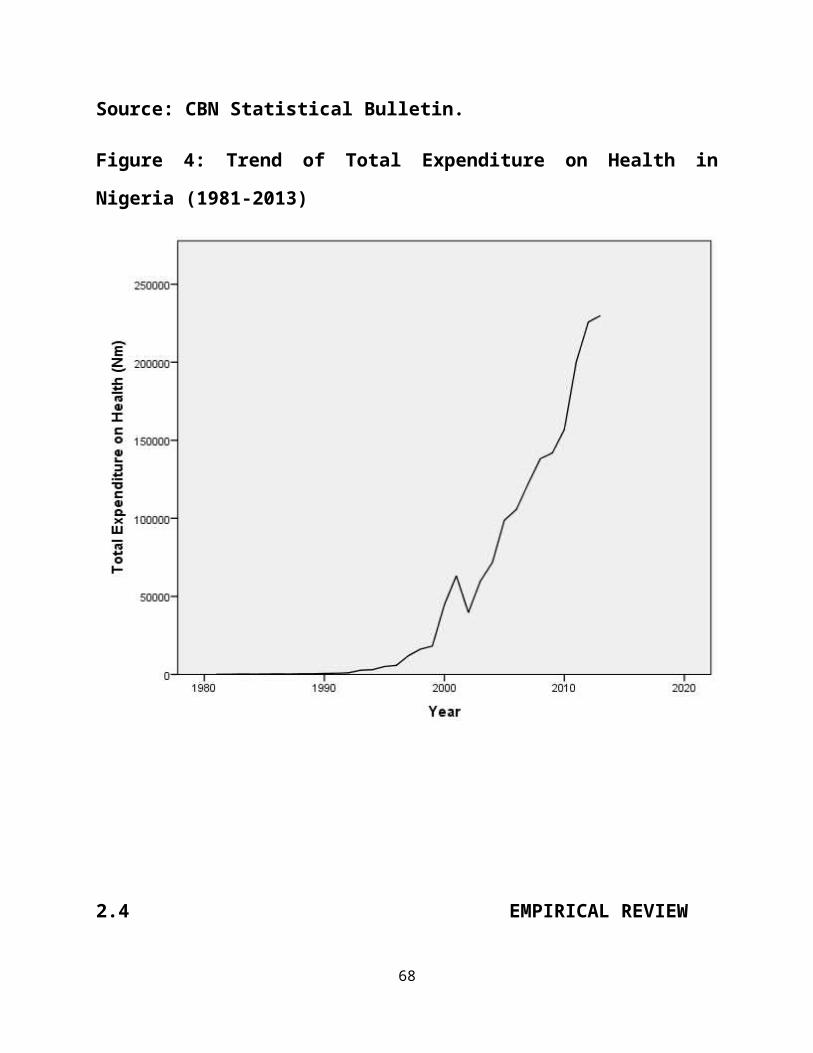
Source: CBN Statistical Bulletin.
Figure 4: Trend of Total Expenditure on Health in
Nigeria (1981-2013)
2.4 EMPIRICAL REVIEW
68

Osinubi (2006) asserted find it worthwhile to explain
the synergy among poverty, unemployment and growth in
Nigeria. He stressed that Nigeria is a nation blessed
with multifarious and multitudinous natural and human
resources. But due to gross mismanagement, adverse
government policies, none and underutilization of
resources and non-channeling to resources for maximum
benefits. As a result of these, Nigeria has been
bedeviled with poverty and unemployment crisis.
Simbowale (2003) conducted a study between the linkage
of macroeconomic policies and pro-poor economic growth
in Nigeria for the period 1960-2000. The study
unveiled among others that growth was weakly pro-poor.
Again, those who are below the poverty line have not
enjoyed the dividends of growth and the probability of
it getting to them is decreasing at an increasing rate.
Overall, economic growth in Nigeria is not pro-poor.
Bello and Abdul (2010) examined the poverty situation
in Nigeria by employing the data on economic growth and
millennium development goals (MDGs) expenditure. The
methodology adopted was panel data analysis, fixed and
random effects and the weighted least squares. The
69
results revealed that a unit increase in per capita
income produced a unit increase of 0.6 in poverty
level. Similarly, a unit increase in MDG expenditure
resulted in 11.56 unit rise in relative poverty. The
study concluded that economic growth and MDGs
expenditure within the sample period. Ibrahim and Umar
(2008) assessed the determinants of poverty as well as
poverty coping strategies among family households in
Nassarawa State, Nigeria. The study employed sampling
to select 150 farming households and the used of cost
of calorie method and discrimination analysis to
explore the incidence and determinants of poverty. The
incidence of poverty was found to be high and its
determinants are size of household, size of income,
number of household employed outside agricultural and
the number of adult literate. The major poverty coping
strategies include skipping of meals, reduction in the
quantity of meals served and engaged in wage labour.
The study recommended that the farming households
should family households should be effectively involved
in the formulation of strategies for imparting
knowledge on family planning to the household.
70

Bakare (2010) examined the determinants of urban
unemployment in Nigeria. The determinants used were
unemployment rate, demand for labour, and supply of
labour, inflation, unemployment, capital formation,
capacity utilization and nominal wage rate. The results
indicated that rising nominal wage rate and rapid
population growth has multiplied the supply of labour
relative to the absorptive capacity of the economy and
this is the chief determinant of unemployment in
Nigeria. Muhammad (2011) assessed the relationship
between economic growth and unemployment in Nigeria
using the OLS technique for the period 2000-2008. His
result showed that unemployment is inversely related to
GDP. A rise in unemployment rate results in 65 percent
fall in GDP. Durosimi (2012) did an empirical
investigation of the impact of unemployment on economic
growth between 1970-2010. The variables employed in the
model were government expenditure, broad money supply,
unemployment rate and GDP growth rate-being the
explained variable. The results indicated that
government expenditure and money supply favors growth
while unemployment rate was found to be significant to
the reduction of growth within the period reviewed. The71
study recommends amongst others that the educational
system should be restructured so as to enable the youth
to be self reliant and self employed
Downes (2008) investigated the necessary conditions for
reducing unemployment rate in Trinidad and Tobago for
the period 1971-1996. Using the ECM estimated by the
OLS instrumental variables. He discovered that long and
short runs changes in RGDP and Real Average Earnings
have a statistically impact on changes in unemployment
rate. While increase in GDP reduces the unemployment
rate in short and long terms but lower in the short run
and increase in real average earnings raises the
unemployment rate in the long run.
Onyedikachi and Nwabueze (2013) conducted a study on
the linkage between poverty a economic growth in
Nigeria between 1990 and 2010 using the OLS regression
technique. The dependent variable is the economic
growth indexed by the GDP. The independent variables
captured the three dimensions of the human development
index (life expectancy (health), adult literacy rate
(education) and per capita income (decent standard of
living) and the discomfort index (unemployment rate).
72
The results indicated that life expectancy and per
capita income were positively related to GDP with their
co-efficient being 0.09 and 0.45. on the other hand,
adult literacy rate and unemployment rate were
adversely related to GDP with the co-efficient of -
0.003 and -0.01. They attributed the negativity of
adult literacy rate to the failure of the government to
allocate at least 26 percent of the budget to the
education sector. It was also found higher life
expectancy should translates to increased economic
growth, massive investment in education will lead to
economic growth, high per capita income will lead to
growth. They advised that government should embark to
human development programme as the only panacea to
poverty. The study recommends amongst others that the
educational system should be restructured so as to
enable the youth to be self reliant and self employed.
Chigbu (2012) explored the effect of poverty and
unemployment on growth in Nigeria between 1991-2010.
The variables adopted were health expenditure, health
expenditure, agricultural expenditure, population and
unemployment rate. The results revealed that health
expenditure, population and unemployment rate have73

influenced on growth positively while education
expenditure and agricultural expenditure. The study
noted that the causes of poverty and unemployment in
Nigeria are low economic growth, increasing population,
bad governance, macroeconomic instability, corruption,
debt burden, poor environment, neglect of the
agricultural sector, poor health facilities and
inadequate education infrastructures.
74

CHAPTER THREE
RESEARCH METHODOLOGY AND EMPIRICAL ANALYSIS
3.1 IDENTIFICATION OF
VARIABLES
The variables that are employed in the study are annual
time series secondary data on poverty level (PL), GDP
growth rate (GDGR), unemployment rate, (UMR),
population (POP), inflation rate (INF), total education
expenditure (TEED), total health expenditure (TEEH),
external debt (EXD), corruption perception index (CPI).
The years reviewed covers the period of 1985-2013.
3.2 MODEL SPECIFICATION
Referring to Abubakar (2002), Ajakaiye and Adeyeye
(2001) and NBS (1996), the main causes of poverty in
Nigeria are low economic growth, unemployment, high
inflation rate, high population, inadequate funding and
delivery of the education and health sector, foreign
debt burden, corruption and bad governance.
In the same vein, the study seeks to examine the
determinants of poverty in Nigeria. The dependent
75
variable adopted is the poverty level (PL) and the
independent variables are Growth rate of GDP (GDGR),
unemployment rate (UMR), population (POP), inflation
rate (INF), total education expenditure (TEED), total
health expenditure (TEEH), external debt (EXD) and
corruption perception index (CPI). Stating the above
expression using a function relationship we have
PL= f (GDGR, UMR, POP, INF, TEED, TEEH, EXD, CPI)………………
(1)
Converting the above functional relationship in
equation 1 into an econometric model, it becomes
PL= b0+ b1GDGR+ b2UMR + b3POP + b4INF + b5TEED +b6TEEH +
b7EXD + b8CPI + u------ (2), where b0-b8 are the co-
efficient of parameter estimate and u is the
disturbance term.
3.3 DISCCUSION OF VARIABLES
A. POVERTY LEVEL:
This is the unit of the proportion of the poor people
(those below $1) in the total population. It measures
the number of the people who are inaccessible to the
76

basic needs of life such as food, cloth, shelter and
education and health facilities it is the explained
variable.
B. GROSS DOMESTIC PRODUCT GROWTH RATE
The gross domestic product is the total market value of
commodities produced within the geographical boundary
of a nation at a specified period of time. It is
equally seen as the market size of an economy. The GDP
can either rise or fall in relation to the base year.
GDP growth is the percentage change in the GDP over
year. High growth rate is perceived to minimize the
incidence of poverty. Therefore, a negative
relationship exists between poverty and growth rate.
(b1<0)
C. UNEMPLOYMENT RATE
This is the percentage of those who are actively
seeking for job but unable to get one out of the total
labour force (economically active population). The
higher the unemployment rate, the higher the intensity
of unemployment. An average unemployed man is a poor
man because he currently did not have a means of
77
livelihood to meet basic needs of life. Therefore a
positive relationship exists between unemployment and
poverty (b2>0)
D. POPULATION
This is the total number of people living in a
geographical setting at a particular point in time.
Increase in population makes an average income to
decline because it will spread on all heads. Also,
rapid rise of population growth ahead of GDP growth is
a sign of underdevelopment and hence poverty. High
population translates to increased poverty. (b3>0)
E. INFLATION RATE
Inflation is the persistent and sustained rise in the
general price level of goods and services within an
economy over a specified period of time. Inflation also
arises when the quantity of money exceeds the rise in
output, or when the aggregate demand exceeds aggregate
supply at full employment equilibrium or when the
nominal wage rate exceeds labour productivity.
Inflation weakens the monetary mechanism of an economy
and leads to the escalating increase in the price of
78
basic commodities which will be unaffordable by an
average individual. High inflation produces economic
hardship for the citizens (b4>0)
F. EDUCATION EXPENDITURE
Education expenditure is the total amount expended to
the educational sector for its improvement, service
delivery and rehabilitation. It is unfortunate that the
expenditure on education has not been sufficient to
reduce poverty to the barest minimum in Nigeria.
Moreover, the Nigerian education is sub-standard
because it is usually under-funded by the government
and the allocation that goes into the sector is less
than the required 26 percent of the proposed budget as
laid down by UNESCO. Education being a component of
human development is a veritable of reducing poverty
through skill acquisition. Thus, a negative
relationship exists between education expenditure and
poverty (b5<0)
G. HEALTH EXPENDITURE
Health expenditure is the total amount expended to the
health sector for its improvement, service delivery and
79
rehabilitation. It is unfortunate that the health
sector has not remarkable over years. The budgetary
allocation to the health sector is always less than 8
percent since 1980. A proof for the under-performance
of the sector is low life expectancy, high maternal and
infant mortality rate, inadequate access to health
facilities and strike action by health workers among
others. Expenditure on health ought to suppress the
incidence of poverty in Nigeria (b6<0)
H. EXTERNAL DEBT
External debt is the amount a country owed foreign
agencies and countries. It is debt incurred from
outside the geographical limits of a country. External
debt raises poverty simply because the funds obtained
will be repaid out of the insufficient resources of the
country ( b7>0)
I. CORRUPTION PERCEPTION INDEX
Corruption is the misuse of public power for personal
illegitimate gains which need not to be monetary.
Corruption involves all form of embezzlement,
misallocation of resources, and misappropriation of
80
funds, thuggery, godfatherism, extortion, electoral
malpractices, nepotism, money laundering and the like.
Corruption is present in every economies but in varying
degree. Corruption is found to be prevalent among the
less developed economies. Corruption propagates poverty
because the money and resources meant for the welfare
of the nation is siphoned but few people who are in
authority and rendering them into destitution (b8>0).
3.5 NATURE AND SOURCES OF
DATA
The data employed in the study are secondary data
obtained from the Central Bank of Nigeria Statistical
Bulletin, National Bureau of Statistics report and the
United Nations Development Programme report.
3.6 ESTIMATION TECHNIQUE
The study adopts the Ordinary Least Square technique
using multiple regression analysis. The technique will
be adopted because it is the best unbiased estimator in
terms of efficiency, minimum variance, consistency,
accuracy and depicting the significance status of the
81
parameter estimates. The Statistical Package for Social
Science (V.20) will be employed to run the regression
among the variables.
CHAPTER FOUR
PRESENTATION OF DATA AND INTERPRETATION OF
RESULTS
4.1 RESEARCH DATA82
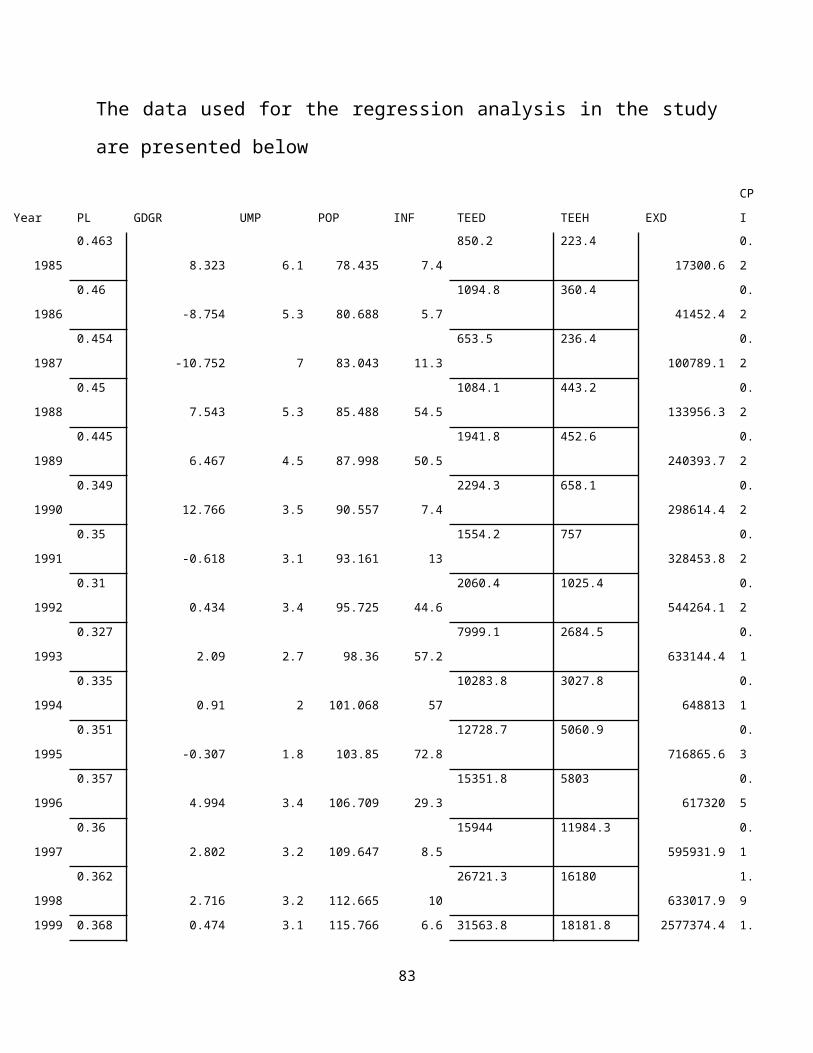
The data used for the regression analysis in the study
are presented below
Year PL GDGR UMP POP INF TEED TEEH EXD
CP
I
1985
0.463
8.323 6.1 78.435 7.4
850.2 223.4
17300.6
0.
2
1986
0.46
-8.754 5.3 80.688 5.7
1094.8 360.4
41452.4
0.
2
1987
0.454
-10.752 7 83.043 11.3
653.5 236.4
100789.1
0.
2
1988
0.45
7.543 5.3 85.488 54.5
1084.1 443.2
133956.3
0.
2
1989
0.445
6.467 4.5 87.998 50.5
1941.8 452.6
240393.7
0.
2
1990
0.349
12.766 3.5 90.557 7.4
2294.3 658.1
298614.4
0.
2
1991
0.35
-0.618 3.1 93.161 13
1554.2 757
328453.8
0.
2
1992
0.31
0.434 3.4 95.725 44.6
2060.4 1025.4
544264.1
0.
2
1993
0.327
2.09 2.7 98.36 57.2
7999.1 2684.5
633144.4
0.
1
1994
0.335
0.91 2 101.068 57
10283.8 3027.8
648813
0.
1
1995
0.351
-0.307 1.8 103.85 72.8
12728.7 5060.9
716865.6
0.
3
1996
0.357
4.994 3.4 106.709 29.3
15351.8 5803
617320
0.
5
1997
0.36
2.802 3.2 109.647 8.5
15944 11984.3
595931.9
0.
1
1998
0.362
2.716 3.2 112.665 10
26721.3 16180
633017.9
1.
9
1999 0.368 0.474 3.1 115.766 6.6 31563.8 18181.8 2577374.4 1.
83
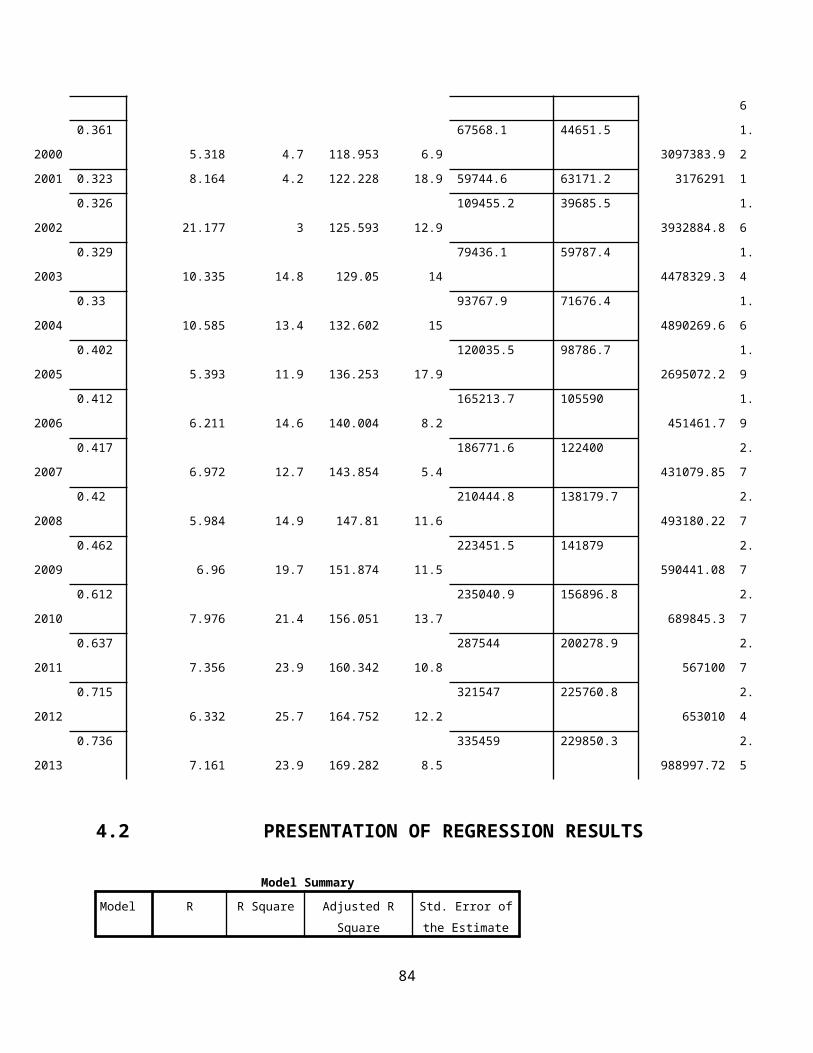
6
2000
0.361
5.318 4.7 118.953 6.9
67568.1 44651.5
3097383.9
1.
2
2001 0.323 8.164 4.2 122.228 18.9 59744.6 63171.2 3176291 1
2002
0.326
21.177 3 125.593 12.9
109455.2 39685.5
3932884.8
1.
6
2003
0.329
10.335 14.8 129.05 14
79436.1 59787.4
4478329.3
1.
4
2004
0.33
10.585 13.4 132.602 15
93767.9 71676.4
4890269.6
1.
6
2005
0.402
5.393 11.9 136.253 17.9
120035.5 98786.7
2695072.2
1.
9
2006
0.412
6.211 14.6 140.004 8.2
165213.7 105590
451461.7
1.
9
2007
0.417
6.972 12.7 143.854 5.4
186771.6 122400
431079.85
2.
7
2008
0.42
5.984 14.9 147.81 11.6
210444.8 138179.7
493180.22
2.
7
2009
0.462
6.96 19.7 151.874 11.5
223451.5 141879
590441.08
2.
7
2010
0.612
7.976 21.4 156.051 13.7
235040.9 156896.8
689845.3
2.
7
2011
0.637
7.356 23.9 160.342 10.8
287544 200278.9
567100
2.
7
2012
0.715
6.332 25.7 164.752 12.2
321547 225760.8
653010
2.
4
2013
0.736
7.161 23.9 169.282 8.5
335459 229850.3
988997.72
2.
5
4.2 PRESENTATION OF REGRESSION RESULTS
Model SummaryModel R R Square Adjusted R
SquareStd. Error ofthe Estimate
84

1 .847a .717 .604 .221a. Predictors: (Constant), CPI, EXD, INF, GDGR, UMP, POP,TEED, TEEH
ANOVAa
Model Sum ofSquares
df Mean Square F Sig.
1
Regression 2.472 8 .309 6.334 .000b
Residual .976 20 .049
Total 3.448 28a. Dependent Variable: PLb. Predictors: (Constant), CPI, EXD, INF, GDGR, UMP, POP, TEED, TEEH
Coefficientsa
Model UnstandardizedCoefficients
StandardizedCoefficients
t Sig.
B Std. Error Beta
1
(Constant) .341 .710 .481 .636GDGR -.001 .009 -.020 -.130 .898UMP .001 .018 .031 .075 .941POP -.004 .008 -.328 -.548 .590INF .001 .003 .041 .284 .779TEED 2.059E-006 .000 .632 .552 .587TEEH 3.639E-006 .000 .767 .650 .523EXD -3.707E-009 .000 -.015 -.082 .935CPI -.113 .084 -.385 -1.347 .193
a. Dependent Variable: PL
4.3 INTERPRETATION OF RESULTS
85
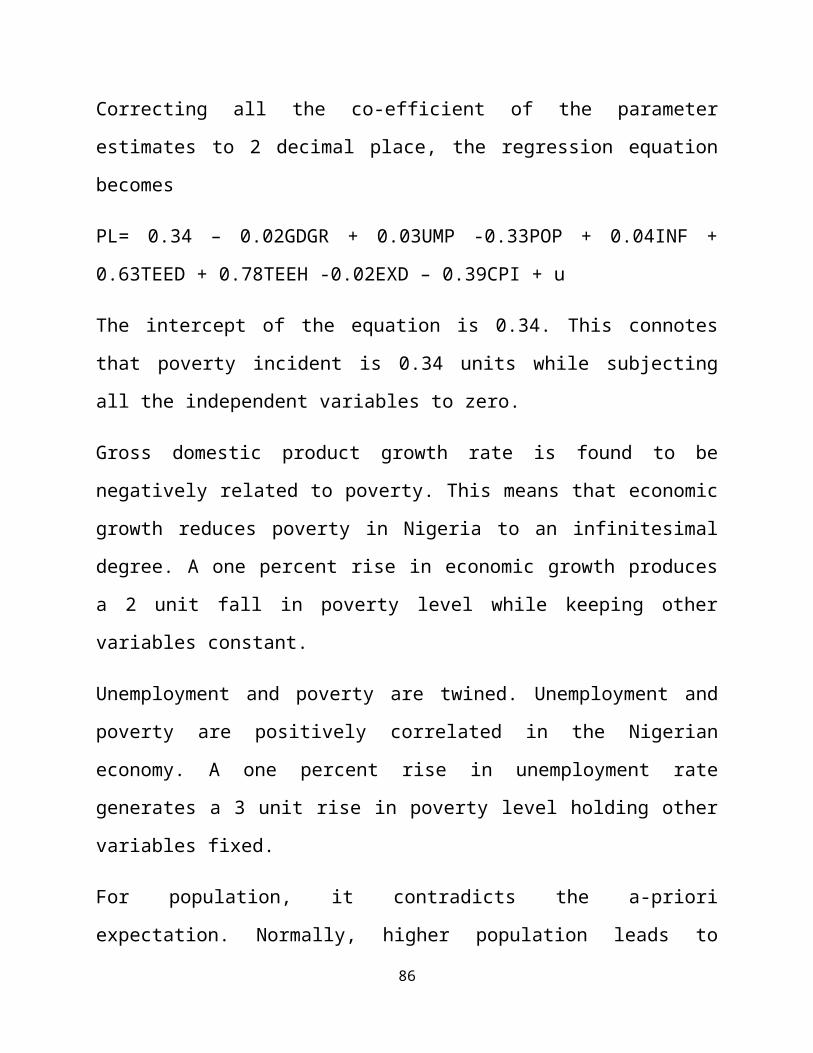
Correcting all the co-efficient of the parameter
estimates to 2 decimal place, the regression equation
becomes
PL= 0.34 – 0.02GDGR + 0.03UMP -0.33POP + 0.04INF +
0.63TEED + 0.78TEEH -0.02EXD – 0.39CPI + u
The intercept of the equation is 0.34. This connotes
that poverty incident is 0.34 units while subjecting
all the independent variables to zero.
Gross domestic product growth rate is found to be
negatively related to poverty. This means that economic
growth reduces poverty in Nigeria to an infinitesimal
degree. A one percent rise in economic growth produces
a 2 unit fall in poverty level while keeping other
variables constant.
Unemployment and poverty are twined. Unemployment and
poverty are positively correlated in the Nigerian
economy. A one percent rise in unemployment rate
generates a 3 unit rise in poverty level holding other
variables fixed.
For population, it contradicts the a-priori
expectation. Normally, higher population leads to
86

higher poverty incidence, but reverse is the case in
the Nigerian setting where population is found to
reduce poverty. A one percent rise in population leads
to a 33 unit fall in poverty level holding other
variables constant. This can largely be attributed to
rise in the per capita income over years.
Inflation remained a causal factor of poverty in
Nigeria. A percent rise in inflation rate results in a
4 unit rise in poverty level. Rise in the price of
basic goods of life makes it difficult to be purchased
a common man or household.
Total expenditure on education and health negated the
a-priori expectation. Education and health are supposed
to be agents of poverty reduction. A percent rise in
education expenditure and health expenditure produces a
63 and 78 unit rise in poverty level respectively
keeping other variables fixed. This clearly showed that
the government has not put maximum attention to human
capital development which is very crucial for poverty
reduction and wealth creation.
87

External debt and corruption affects poverty
negatively. A percent rise in external debt and a unit
rise in the corruption transparency index generate a 2
unit fall and 39 unit fall in poverty level while
keeping other variables unchanged.
All the explanatory variables are statistically
insignificant as their probability values are higher
than the standard 0.05.
The co-efficient of determination is 0.847. This
indicates that 84.7 percent of the total variation in
poverty level is explained by changes in the
independent variables stated in the model. The 15.3
percent unexplained variation is caused by other
factors affecting poverty which are included in the
model.
The probability of f-statistics is 0.00 which is less
than the standard 0.05. This connotes that the overall
influence of all the explanatory variables on poverty
level is statistically significant.
4.4 RESEARCH FINDINGS AND IMPLICATION
88

From the regression results above, it can be deduced
that unemployment and inflation rate propagates poverty
in Nigeria. An unemployed man is an average poor man
because he has no source of income to afford the basic
life-requirement commodity. The fight against poverty
can be won by creating employment opportunities for the
youths and other destitute.
Inflation is the persistent and appreciable increase in
the general price of all goods and services sustained
in an economy over a specific point in time. For
inflation to exist, the price increment must affect all
commodities in the economy, the price increment must
affect all the sectors of the economy and the price
increment must be have been persistent in such an
economy. One of the main effects of inflation is that
it makes basic goods and services to be unaffordable by
a common man as a result of the increase in its price.
Little wonder it was found from the results that high
inflation stimulates the intensity of poverty
incidence.
Abubakar (2002) alluded that low economic growth causes
poverty in Nigeria. Though, from the results gotten,
89

GDP growth rate was found to have influenced poverty
reduction negatively within the reviewed years, but
high or low growth rate of GDP has not reflected in the
material wellbeing of the people. As at today, Nigeria
is ranked as the largest economy in Africa and yet
still ranked as one of the poorest nation in the world.
This confirms is that the country’s huge wealth and
resources are being spent and used by the few elites,
thus rendering the masses into penury. Economic growth,
per capita income or GDP should and must be abandoned
as criteria of development because it neglects
paramount developmental issues in its computation.
Normally, increase in population should generate high
poverty incidence. Countries with high population are
perceived to be poor. In the Nigeria setting,
population has not contributed to poverty during the
estimated year. This can be linked to adoption of
family planning practices, reduction in the number of
children be given birth to in a household and the like.
Health and education expenditure being components of
human capital development is expected to reduce
poverty. One of the factors that distinguish developed
90

nations from the developing one is the amount of
investment devoted to human capital development. The
results obtained indicate that increase in health and
education expenditure raises poverty level. This is
attributed to the inadequate funding to the sector,
mismanagement of resources allocated to the sector,
embezzlement of funds meant for rehabilitation and
infrastructures by top officials in the sector. Another
reason is low budgetary allocation to both sectors.
Since 1980, the education sector and health sector have
not received above 10 percent allocation of the
national budget.
External debt is the fund, money, grants a country lend
from other foreign countries and agencies. The impact
of external debt could either be positive or negative
depending on the managerial expertise and ability of
the receiving country. A properly managed debt incurred
can boost economic growth and reduce poverty if the
funds are channeled in the right way and are dispensed
judiciously on productive things. On the other hand,
external debt can retard growth and raise poverty if
the funds acquired are expended on less-prioritized
91
projects. It can be said to a certain degree, that
external debt reduced poverty incidence insignificantly
in Nigeria within the years estimated.
Corruption impedes retards and paralyzes economic
growth and development of any country. Based on
economic theory, corruption propels poverty. This
connotes that the money that needs to be enjoined by
the ‘many’ goes to the hand of the ‘few elite’. On the
other hand, corruption contributes to economic growth
only if the funds siphoned are spent productively on
reasonable projects.
CHAPTER FIVE
5.1 SUMMARY OF RESEARCH STUDY
The principal goal of every nation is to achieve a
sustainable level of economic development but there are
myriads of factor that could hinder its attainment such
as poverty, unemployment, population explosion, income
92

inequality, corruption etc. Poverty and unemployment
are interrelated. Both menaces are impediments to
economic growth in Nigeria.
Almost 70 percent of Nigerians are below the poverty
line while 92 percent of the same people earn less than
$2 dollar daily. The major causes of poverty in Nigeria
are unemployment, environmental degradation, population
explosion, corruption, debt burden, ignorance,
illiteracy and inadequate health. Several
administrations have formulated various policies and
programmers like DFRRI, NAPEP, NDE, NEEDS, FEAP and the
like. But as formidable as these initiatives were, they
are have failed to eradicate poverty to the barest
minimum. Their failure can largely be attributed to
inadequate co-ordination and planning, bureaucracy,
greed on the part of those that initiated them, poor
delivery to the target group. Based on the report of
the NBS, poverty is prevalent in the North West
geopolitical zone and particularly in the rural regions
of the country.
The national bureau of statistics revealed that 65
percent of the youths are unemployed thereby has led to
93

the under-utilization of human resource in Nigeria. The
major cause of unemployment in the Nigerian economy has
been attributed to the unabsorptive capacity of the
unemployed into the labour market. Unemployment has
been recognized as the hallmark of poverty. The
implication of unemployment is, but not limited to loss
of national output.
Though Nigeria is regarded as having the largest
economy in Africa, but in aspect of economic and human
development, the country’s position has not been
remarkable. The indices of human development and
multidimensional poverty rankings have showed that
Nigeria is still undeveloped in comparison to other
African countries such as Egypt, Libya, Equatorial
Guinea and South Africa.
The study reviewed the synergy among poverty,
unemployment, human development and growth between
1985-2013. The Ordinary Least Square Regression \
Technique via the Statistical Package for Social
Science was adopted. The poverty level was used as the
explained variable while the explanatory variables are
GDP growth rate, unemployment rate, population,
94

inflation rate, total education expenditure, total
health expenditure, external debt burden and corruption
transparency index. The regression results showed that
unemployment and inflation are the main causes of
poverty in Nigeria.
5.2 CONCLUSION
The Nigerian economy is paradoxical in nature: wealthy
nation but poor inhabitants. Despite the country’s
large size of GDP, the growth recorded is not pro-
people and has not reflected meaningfully into the
material well-being of the citizens.
For Nigeria to attain the sustainable level of economic
development, the government must formulate an all-
encompassing policy that will cover poverty
alleviation, job creation and revitalization of
education and health sectors.
5.3 POLICY RECOMMENDATION
95

Based on the research findings, the following policy
are forwarded and recommended for consideration as
regard the betterment of the Nigerian economy.
a.There should be a participatory approach in
programme planning, implementation and evaluation
of poverty and unemployment programmes. Stable
macroeconomic policies such as rising inclusive
growth, stable exchange rate, single-digit
inflation rate and low interest rate and
consistency in government policies is needed to
achieve the minimization of poverty and
unemployment.
b.An enabling environment should be created for
private investment to strive as this will go a long
way to reducing unemployment via usage of local
skilled manpower. The problem of incessant
insecurity should be addressed seriously as this
poses a threat to foreign and local investment.
c.There should be a population policy that will limit
population growth to a level that will match the
employment generation capacity of the economy.
96
d.Skill acquisition should be made a priority and be
included in the curricula of tertiary institutions
so that graduates will be provider of employment
rather than a seeker. Government should provide
soft loans, grants, aids and credit facilities so
that people who have completed their acquisition
training can establish theirs in a small/medium
way.
e.The fight against corruption should be intensified
so that resources and funds misallocated and
mismanaged would be ventured into poverty and
unemployment reduction programmers.
f.The agricultural sector should be revitalized,
restructured and made attractive enough for youths
to engage in it.
g.Basic infrastructures should be put in place in the
rural areas so as to avoid the situation of rural-
urban migration and urban congestion.
h.Government should prioritize human capital
development as this is the panacea to the
developmental challenges faced in Nigeria.
Budgetary allocation to the education and health
sectors should be more than twenty percent as97
proposed by the United Nations. Provision of
adequate and necessary facilities needed in both
sectors should be implemented.
98