Abstract While it is widely appreciated that prostate
cancers vary substantially in their propensity to pro-
gress to a life-threatening stage, the molecular events
responsible for this progression have not been identi-
fied. Understanding these molecular mechanisms could
provide important prognostic information relevant to
more effective clinical management of this heteroge-
neous cancer. Hence, through genetic linkage analyses,
we examined the hypothesis that the tendency to
develop aggressive prostate cancer may have an
important genetic component. Starting with 1,233
familial prostate cancer families with genome scan data
available from the International Consortium for Pros-
tate Cancer Genetics, we selected those that had at
least three members with the phenotype of clinically
aggressive prostate cancer, as defined by either high
tumor grade and/or stage, resulting in 166 pedigrees
(13%). Genome-wide linkage data were then pooled to
perform a combined linkage analysis for these families.
Linkage signals reaching a suggestive level of signifi-
cance were found on chromosomes 6p22.3 (LOD =
3.0), 11q14.1–14.3 (LOD = 2.4), and 20p11.21–q11.21
(LOD = 2.5). For chromosome 11, stronger evidence
of linkage (LOD = 3.3) was observed among pedigrees
with an average at diagnosis of 65 years or younger.
Other chromosomes that showed evidence for
heterogeneity in linkage across strata were chromo-
some 7, with the strongest linkage signal among
pedigrees without male-to-male disease transmission
(7q21.11, LOD = 4.1), and chromosome 21, with
the strongest linkage signal among pedigrees that
had African American ancestry (21q22.13–22.3;
LOD = 3.2). Our findings suggest several regions that
may contain genes which, when mutated, predispose
men to develop a more aggressive prostate cancer
phenotype. This provides a basis for attempts to iden-
tify these genes, with potential clinical utility for men
with aggressive prostate cancer and their relatives.
Introduction
There is much evidence that prostate cancer, the most
frequent of all cancers in men (Jemal et al. 2004), has a
familial, if not genetic, etiology. This evidence is sup-
ported by a variety of study designs, including case–
control, cohort, twin, and family-based studies
(Gronberg 2003; Schaid 2004), although linkage studies
to find genes associated with high prostate cancer risk
have been disappointing. Early linkage results impli-
cated targeted candidate regions for prostate cancer
susceptibility loci, including HPC1 on chromosome
1q23–25 (Smith et al. 1996; Xu 2000; Carpten et al.
2002), PCAP on chromosome 1q42–43 (Berthon et al.
1998), CAPB on chromosome 1p36 (Gibbs et al. 1999),
chromosome 8p22–23 (Xu et al. 2001), HPC2 on
chromosome 17p (Tavtigian et al. 2001), HPC20 on
chromosome 20q13 (Berry et al. 2000), and HPCX
on chromosome Xq27–28 (Xu et al. 1998). A few of the
targeted linkage studies have led to the identification
The names of all authors and their affiliations are listed in theAcknowledgements. The fact that Dr Schaid’s name is given herefor purposes of correspondence should not be taken to imply thathe played the sole leading part in writing this article.
D. J. Schaid (&)Harwick 7, Mayo Clinic College of Medicine,200 First ST SW, Rochester, MN 55905, USAe-mail: [email protected]
Hum Genet (2006) 120:471–485
DOI 10.1007/s00439-006-0219-9
123
ORIGINAL INVESTIGATION
Pooled genome linkage scan of aggressive prostate cancer: resultsfrom the International Consortium for Prostate Cancer Genetics
Daniel J. Schaid Æ Investigators of the International Consortiumfor Prostate Cancer Genetics
Received: 8 March 2006 / Accepted: 5 June 2006 / Published online: 25 August 2006� Springer-Verlag 2006
of candidate susceptibility genes including RNASEL
(HPC1) on chromosome 1 (Carpten et al. 2002),
ELAC2 (HPC2) on chromosome 17 (Tavtigian et al.
2001), and MSR1 on chromosome 8 (Xu et al. 2002).
Despite these promising findings, however, confirma-
tory studies for these genes have provided mixed
results. A number of studies provide strong support,
both functional and epidemiological, while other
studies suggest that the roles of these genes, in terms of
individual risks and/or prevalence of mutations, might
be small (Ostrander and Stanford 2000; Schaid 2004).
In addition to targeted linkage analyses, at least 12
genome linkage scans based on microsatellite markers
have now been performed (Easton et al. 2003; Matsui
et al. 2004; Schaid 2004; Camp et al. 2005). Overall, the
cumulative data across all of these studies show some
suggestive evidence for linkage to almost every chro-
mosome. Although there is some overlap among
studies for chromosomal regions that show suggestive
to moderate evidence for linkage, there is no evidence
for a single (or a common few) major susceptibility
loci. In total, these studies illustrate the difficulty in
finding consistent linkage results across different
studies and emphasize the likely large amount of
genetic heterogeneity of prostate cancer risk. Fur-
thermore, these results suggest that if linkage analysis
is to be used successfully to identify prostate cancer
susceptibility genes, innovative approaches to address
such extensive genetic heterogeneity will be required.
The diagnosis of prostate cancer is common—in the
U.S. approximately one in six men is diagnosed with
prostate cancer in his lifetime. The development of
prostate cancer is even more common—estimates from
autopsy studies indicate that between 40 and 70% of
men over age 70 will have cancer in their prostates, at
least in the form of histologically identifiable lesions. It
is clear that only a subset of these lesions are detected
clinically and that only a subset of these clinically de-
tected cancers will progress to life-threatening disease.
A recent study of the use of prostate-specific antigen
(PSA) to screen for prostate cancer estimated that
15–37% of men are overdiagnosed with prostate can-
cer, meaning that they have clinically insignificant
prostate cancer that otherwise would not be detected
in their lifetime (Etzioni et al. 2002). Correspondingly,
identification of genetic factors that affect the aggres-
siveness of prostate cancers is an important question
both mechanistically and clinically. Most previous at-
tempts to identify prostate cancer susceptibility genes
using linkage analysis have focused on families with
multiple members affected with prostate cancers
regardless of clinical-pathologic characteristics. The
few studies that focused on families with men
diagnosed with clearly aggressive disease have been
hampered by the small number of families available
within individual study samples. To overcome these
limitations, we used genome-wide linkage to evaluate
evidence for linkage in a set of unique families, each
with at least three men affected with aggressive pros-
tate cancer.
From a genetic perspective, it is unclear whether so-
called clinically insignificant cancers share the same
molecular risk factors as their aggressive counterparts.
If they do, it is important to understand the molecular
determinants of risk for all prostate cancers, although
such factors would likely be extremely common, since
the disease is so common, at least in most western
populations. On the other hand, if genetic susceptibility
for more aggressive prostate cancer is mediated through
different, or additional, mechanisms, it is important to
characterize those specific mechanisms and identify the
genes involved. From a clinical perspective, it is
important to understand the predisposition to an
aggressive form of the disease, because such cancers can
cause disability and death if not effectively treated.
Supporting our hypothesis that the more aggressive
prostate cancers are more likely to have a genetic cause,
several studies have found linkage of Gleason grade to
a number of genomic regions. Gleason grade is used to
measure prostate tumor differentiation and is consid-
ered a measure of cancer aggressiveness. Although the
Gleason sum scale ranges from 2 to 10, most tumors are
scored in a much more narrow range, most commonly 6
and 7. Using Gleason grade in quantitative trait linkage
analyses, the reported linkage regions include chro-
mosomes 5q31–33, 7q32, and 19q12 (Witte et al. 2000;
Neville et al. 2002, 2003; Paiss et al. 2003), 9q34 (Neville
et al. 2003), 4 (Slager et al. 2003), and 1p13–q21, 5p13–
q11, and 6q23 (Slager et al. 2006). Furthermore, two
recent studies reported interesting linkage signals from
genome linkage scans restricted to men with clinically
aggressive prostate cancer. One recent study (Chang
et al. 2005) reported suggestive evidence for linkage on
chromosome X (HLOD = 2.54) and on chromosome 22
(HLOD = 2.06), while another (Stanford et al. 2006)
found suggestive evidence for linkage on chromosome
22 (dominant HLOD = 2.18). Although neither study
found a LOD score greater than 3.0, the criterion typ-
ically used to define statistically significant linkage, it is
intriguing that both studies were consistent for their
findings on chromosome 22. Since the above-mentioned
studies were carried out on limited numbers of families,
the power to detect linkage in restricted subsets of
families with aggressive disease was limited.
Because it has not been possible to discover prostate
cancer susceptibility genes, and considering our
472 Hum Genet (2006) 120:471–485
123
hypothesis that aggressive prostate cancer may be
more genetically homogeneous, we used the Interna-
tional Consortium for Prostate Cancer Genetics (IC-
PCG) to pool pedigrees that had at least three men
with aggressive prostate cancer. Pooling was necessary
to obtain a sufficiently large sample size to perform a
genome-wide linkage scan. Other pooled analyses by
the ICPCG have been used to evaluate linkage for
prostate cancer not restricted to the aggressive phe-
notype on chromosomes 1 (Xu 2000) and 20 (Schaid
and Chang 2005), as well as a pooled genome linkage
scan (Xu et al. 2005).
Methods
Ascertainment of pedigrees
The ICPCG study sample has been described in detail
elsewhere (Schaid and Chang 2005; Xu et al. 2005).
Eleven research groups participated in this combined
linkage analysis of aggressive prostate cancer pedi-
grees, providing 166 pedigrees. Although the methods
of pedigree ascertainment and confirmation of prostate
cancer diagnoses differed somewhat across the groups,
only men with aggressive prostate cancer diagnosis
confirmed by medical records or death certificates were
included in this analysis.
Definition of aggressive disease
Clinical data were used to classify affected men into
three groups according to the aggressiveness of their
prostate cancer. The classification criteria, presented in
Table 1, were developed by the ICPCG Epidemiology
subcommittee and are similar to those used in other
recent linkage analyses of clinically significant disease
(Chang et al. 2005; Stanford et al. 2006). Men with
aggressive prostate cancer were those who had at least
one of the following characteristics: regional or distant
stage (stage T3, T4, N1, or M1, based on the radical
prostatectomy specimen for patients treated with sur-
gery; otherwise, based on clinical stage); tumor Glea-
son grade at diagnosis ‡ 7 (or poorly differentiated
grade if no Gleason grade was available); pretreatment
PSA at diagnosis ‡ 20 ng/ml; death from metastatic
prostate cancer before age 65 years (if deceased).
Pedigrees were included in the analyses if they had
three or more men with aggressive disease, of whom at
least two men had aggressive disease and genotype
data. Men with aggressive disease were coded as af-
fected, and all other subjects were coded as unknown
phenotype (i.e., men with clinically insignificant and
moderate disease did not contribute their phenotypes
to the linkage analyses). This approach avoids the
complication of unaffected men who have not been
screened for prostate cancer, and avoids attempting to
model the unknown parameters that might influence
the penetrance of less aggressive prostate cancers.
Hence, we focused solely on evidence for genetic
linkage to aggressive disease.
Each participating group submitted to the Data
Coordinating Center (DCC) summary information
about each pedigree, including mean age at diagnosis
of aggressive disease, number of men with aggressive
disease who had genotype data, hereditary prostate
cancer (HPC), and male-to-male transmission of
prostate cancer. A pedigree was classified as HPC if it
met the criteria of Carter et al. (1993). At least one of
the following three criteria must have been met: (1)
three consecutive generations of prostate cancer along
a line of descent; (2) at least three first-degree relatives
with a diagnosis of prostate cancer; (3) two or more
relatives with a diagnosis of prostate cancer at age £55
Table 1 Definition of prostate cancer aggressiveness
Insignificant: a subject was classified as having had clinically insignificant disease if he had all of the following characteristics:• Clinically unapparent tumor at diagnosis (stage A, NOS, T1a, T1b, or T1c)• Tumor in only one lobe if radical prostatectomy was done (T2a)• No evidence of non-localized disease (node negative NX or N0; no metastasis, M0, confined to prostate, T2a)• Tumor Gleason grade at diagnosis < 6; if no Gleason grade, then not moderately or poorly differentiated• Pretreatment PSA at diagnosis < 4 ng/ml• If deceased, prostate cancer not listed as primary cause of death on death certificateAggressive: a subject was classified as having had aggressive disease if he had any of the following characteristics:• Regional or distant stage (stage T3, T4, N1, or M1, based on pathology if radical prostatectomy was done; otherwise, clinical stage)• Tumor Gleason grade at diagnosis ‡ 7• Poorly differentiated grade (if no Gleason grade available)• Pretreatment PSA at diagnosis ‡ 20 ng/ml• If deceased, death from metastatic prostate cancer before age 65 yearsModerate: a subject was classified as having had moderate disease if clinical data were available and he did not meet the criteria forinsignificant or aggressive disease
Hum Genet (2006) 120:471–485 473
123

years. Furthermore, because linkage of prostate cancer
susceptibility to chromosome X has been reported (Xu
et al. 1998), pedigrees were classified according to
male-to-male transmission (yes versus no). Pedigrees
classified as ‘‘yes’’ were consistent with autosomal
dominant transmission, allowing for incomplete pene-
trance. For example, pedigrees were classified as ‘‘yes’’
if a father and son both had prostate cancer, or if the
father was unaffected, but paternal cousins both had
prostate cancer. All other pedigrees were classified as
‘‘no’’; this means that the ‘‘no’’ group includes pedi-
grees that have a clear pattern of X-linked transmission
and pedigrees that did not have sufficient information
to distinguish incomplete penetrance for an autosomal
dominant susceptibility allele versus X-linked trans-
mission (e.g., nuclear families with unaffected fathers).
Genotyping and consensus genetic map
The participating groups used a total of 1,322 micro-
satellite markers, although the genotype methods and
the sets of markers differed across the groups. Details
of the genotype methods and construction of a con-
sensus map are given elsewhere (Xu et al. 2005).
Briefly, a consensus map was created by aligning all
markers to the draft human reference sequence
(physical position) based on the Human hg13 assembly
(released November 14, 2002). Ten of these markers
could not be uniquely located in the human reference
sequence and were dropped from the combined anal-
ysis. The genetic positions of the aligned markers were
determined from the deCode map (Kong et al. 2002).
Among the 1,312 mapped markers, the deCode genetic
position was available for 964 markers. The genetic
positions for the remaining 348 markers, where only
physical positions were available, were estimated by
interpolation between the flanking markers where
both physical positions and deCode positions were
available.
Statistical analyses
Linkage analyses were performed by each of the 11
groups using common methods of analysis. Output files
from Genehunter-Plus (Kruglyak et al. 1996; Kong and
Cox 1997) containing pedigree-specific linkage infor-
mation at 1 cM intervals across the genome were sent
to the ICPCG DCC. The analyses were developed and
approved by members of the ICPCG and are described
in detail elsewhere (Schaid and Chang 2005). Both
parametric and non-parametric linkage analyses were
performed. For parametric analyses, dominant and
recessive models were used. The dominant model, the
same as that used to map HPC1 (Smith et al. 1996), had
two liability classes. Men with aggressive prostate
cancer were placed in the first liability class with pen-
etrances of 0.001 and 1.0 for non-carriers and carriers,
respectively. All other subjects were placed in a second
uninformative liability class, i.e., assigned penetrance
of 0.5 for all genotypes. Hence, analyses were for
aggressive affecteds only, yet other family members
with genotypes helped to infer the missing genotypes
among parents. The frequency of the susceptibility
allele was set at 0.003. The recessive model was similar
to the dominant model, except that the susceptibility
allele frequency was set at 0.15, and the penetrances
for heterozygous carriers and homozygous non-carriers
were assumed to be equivalent. These model-based
analyses allowed for a fraction of linked pedigrees by
computing heterogeneity LOD scores using the algo-
rithm of HOMOG, estimating a single fraction of
linked pedigrees (a) for all positions on a chromosome
(HLOD-DOM for the dominant model and HLOD-
REC for the recessive model). For the non-parametric
analyses, Kong and Cox LOD scores for the linear
(KCLOD-LIN) and exponential (KCLOD-EXP)
allele-sharing models were calculated by the ASM
software (Kong and Cox 1997). Pedigrees were
weighted equally, and the score function ‘‘all’’ was
used. All linkage results were based on multipoint
calculations by the Genehunter-Plus software (Krugl-
yak et al. 1996; Kong and Cox 1997).
Because some studies suggest that early age at
prostate cancer diagnosis increases the likelihood of a
genetic etiology, and some families fit an autosomal
dominant mode of transmission (see reviews by
Gronberg 2003; Schaid 2004) we attempted to create
genetically homogeneous subsets. To do this, we
stratified pedigrees according to mean age at diagnosis
of aggressive prostate cancer (£ 65, > 65 years), num-
ber of men with both aggressive prostate cancer and
genotype data per pedigree (< 4 versus 4+), evidence
of HPC for any type of prostate cancer, as defined
elsewhere (Carter et al. 1993), and racial ancestry.
Furthermore, pedigrees were classified according to
male-to-male transmission of any form of prostate
cancer (‘‘yes’’ versus ‘‘no’’).
Like others, we computed the maximum LOD
scores within subsets. However, using this strategy
alone can be misleading. The magnitude of the maxi-
mum LOD score depends on the number of pedigrees
and their information content. Strata with more
informative pedigrees, and a larger number of them,
can give larger linkage signals than other less-
informative strata. Thus, it would be incorrect to
interpret the results to indicate that only the strata with
474 Hum Genet (2006) 120:471–485
123

large linkage signals show evidence for linkage.
Furthermore, examining multiple subsets can inflate
the false-positive rate. To avoid these problems, there
should be significant heterogeneity of the linkage sig-
nals across strata, because one would not expect to find
heterogeneity in the absence of linkage. Hence, to aid
our interpretations, we tested for statistically signifi-
cant different linkage signals across strata by likelihood
ratio statistics, constructed as follows. For the para-
metric HLOD statistics, we allowed each stratum to
have its own parameter representing the fraction of
linked pedigrees within the stratum (ak), yet we as-
sumed that all strata share the same position of linkage
on a chromosome (h). For K strata there were (K+1)
parameters to estimate. Under the null hypothesis of
homogeneity across strata, there were only two
parameters to estimate, the common value of a and h.
By maximizing the HLOD functions under the null
hypothesis (HLODnull) and under the alternative
hypothesis (HLODalt), we computed a likelihood ratio
statistic, 2(HLODalt – HLODnull), and used the v2K�1
distribution to determine probability values. Similar
likelihood ratio statistics were computed using the KC
LOD scores.
To illustrate the amount of heterogeneity of linkage,
we present the estimated a parameters for each stra-
tum. Statistically significant heterogeneity can arise
from differences in the a parameters. However, the
estimated a’s must be viewed cautiously, because they
are most likely biased. Bias can occur when the as-
sumed penetrance is not correct (e.g., when penetrance
varies over etiologically relevant genes), when the
phenocopy rate is misspecified, and the likelihood used
in HOMOG is not correct for estimating a (Whitte-
more and Halpern 2001).
We summarized our linkage results based on the
proposed guidelines for reporting linkage results of a
genome-wide screen: a cutoff of LOD = 3.30 as ‘‘sig-
nificant’’ evidence for linkage, and a cutoff of
LOD = 1.86 as ‘‘suggestive’’ evidence for linkage
(Lander and Kruglyak 1995). Based on asymptotic
arguments, a LOD score of 3.30 is expected to occur
0.05 times in a genome screen using a fully informative
marker set and a LOD score of 1.86 is expected to
occur once by chance.
Although computing P-values for extreme linkage
statistics by simulations is an ideal way to evaluate the
statistical significance of large LOD scores, we could
not compute these by the usual methods that rely on
the raw genotype and phenotype data. The data were
collected during a period of time when informed con-
sents did not request sending data to a central location,
and some institutions felt that they would need to
reconsent participants in order to submit their raw data
to a central location. To overcome this limitation, we
computed empirical P-values in a limited (i.e., con-
servative) manner. To compute permutation P-values,
we use the rapid permutation strategy for score sta-
tistics proposed by Lin (2005). He showed that under
the null hypothesis, and conditional on the data, per-
mutation P-values can be computed by multiplying an
observed score statistic for an observation (in our case,
each pedigree is an observation) by a standard normal
random variable, and then computing the desired
summary statistic. In our application, the NPL scores
per pedigree are score statistics for the Kong and Cox
allele-sharing models (both linear and exponential)
(Kong and Cox 1997). So, for each of 10,000 simula-
tions, we generated a random normal variable per
pedigree, multiplied the observed NPL scores by the
random variable, computed the summary NPL over all
pedigrees, and then determined the maximum sum-
mary statistic over all positions on a chromosome. The
method by Lin is appropriate when the different sta-
tistics (e.g., maximum LOD scores per chromosome)
have the same null distribution. However, this is not
the case, because longer chromosomes are more likely
to have larger LOD scores than shorter chromosomes,
because longer chromosomes have less dependence
due to more recombinations. This can be verified by
asymptotic approximations given elsewhere (Feingold
et al. 1993). Hence, we computed permutation P-values
separately for each chromosome, and then used Ben-
jamini and Hochberg’s (Benjamini and Hochberg
1995) step-up method to determine P-values corrected
for testing multiple chromosomes while controlling the
false-discovery rate. An advantage of this approach is
that by conditioning on the observed NPL scores, it
implicitly conditions on the linkage information in a
pedigree, in contrast to other approaches that assume
fully informative markers for simulations. A limitation,
however, is that it is well known that NPL summary
statistics have less power than the Kong and Cox LOD
scores when linkage information is not complete.
Hence, our reported permutation P-values are likely
too large, compared to what might be achieved with
the raw data.
Results
The characteristics of the 166 aggressive prostate can-
cer pedigrees from the 11 groups of the ICPCG are
summarized in Table 2. Among these pedigrees, 44%
had a mean age at diagnosis of 65 years or younger,
27% had at least four men with aggressive prostate
Hum Genet (2006) 120:471–485 475
123
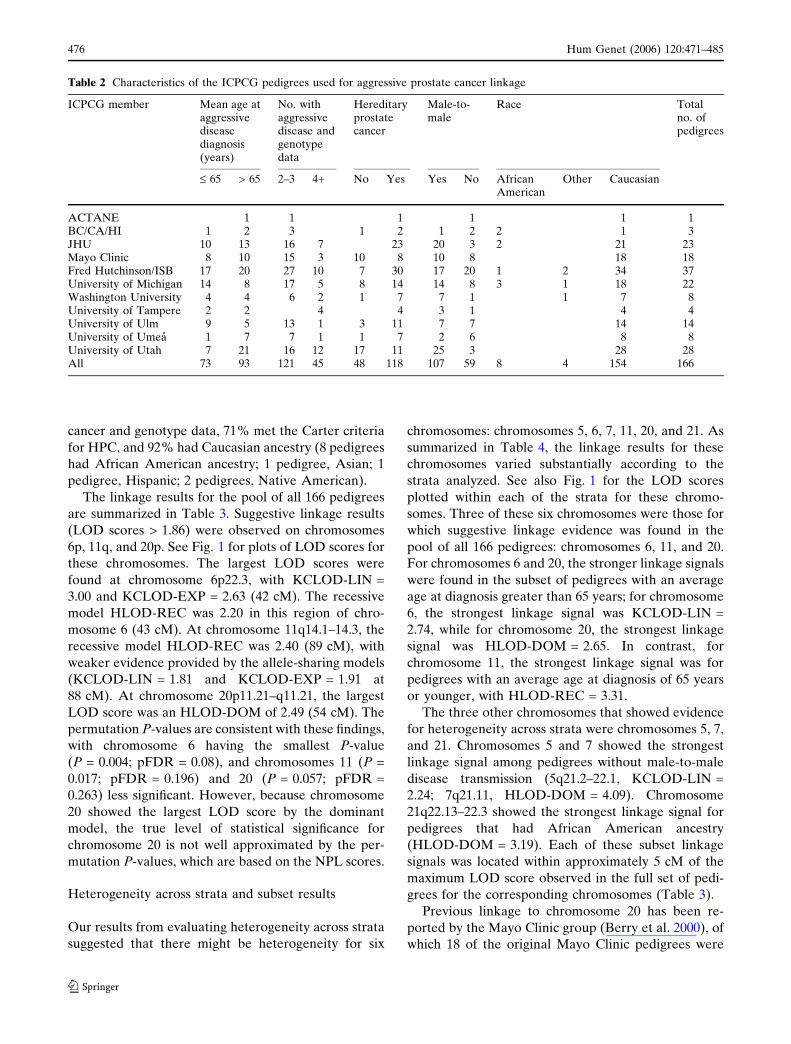
cancer and genotype data, 71% met the Carter criteria
for HPC, and 92% had Caucasian ancestry (8 pedigrees
had African American ancestry; 1 pedigree, Asian; 1
pedigree, Hispanic; 2 pedigrees, Native American).
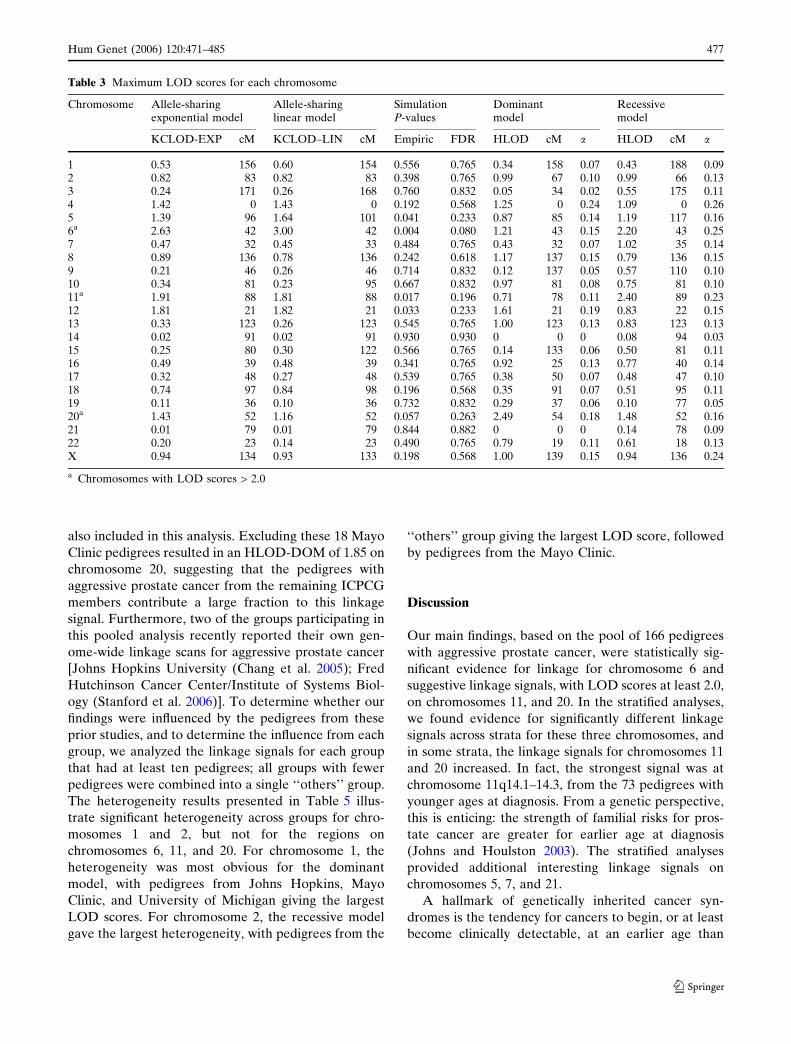
The linkage results for the pool of all 166 pedigrees
are summarized in Table 3. Suggestive linkage results
(LOD scores > 1.86) were observed on chromosomes
6p, 11q, and 20p. See Fig. 1 for plots of LOD scores for
these chromosomes. The largest LOD scores were
found at chromosome 6p22.3, with KCLOD-LIN =
3.00 and KCLOD-EXP = 2.63 (42 cM). The recessive
model HLOD-REC was 2.20 in this region of chro-
mosome 6 (43 cM). At chromosome 11q14.1–14.3, the
recessive model HLOD-REC was 2.40 (89 cM), with
weaker evidence provided by the allele-sharing models
(KCLOD-LIN = 1.81 and KCLOD-EXP = 1.91 at
88 cM). At chromosome 20p11.21–q11.21, the largest
LOD score was an HLOD-DOM of 2.49 (54 cM). The
permutation P-values are consistent with these findings,
with chromosome 6 having the smallest P-value
(P = 0.004; pFDR = 0.08), and chromosomes 11 (P =
0.017; pFDR = 0.196) and 20 (P = 0.057; pFDR =
0.263) less significant. However, because chromosome
20 showed the largest LOD score by the dominant
model, the true level of statistical significance for
chromosome 20 is not well approximated by the per-
mutation P-values, which are based on the NPL scores.
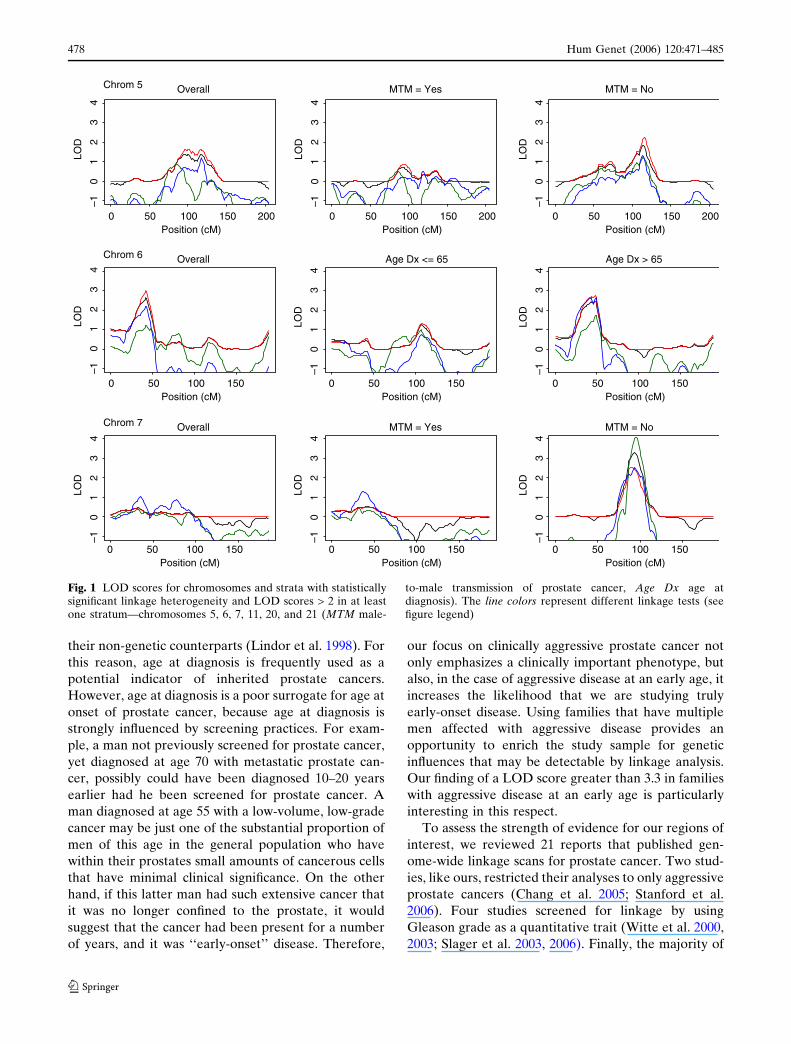
Heterogeneity across strata and subset results
Our results from evaluating heterogeneity across strata
suggested that there might be heterogeneity for six
chromosomes: chromosomes 5, 6, 7, 11, 20, and 21. As
summarized in Table 4, the linkage results for these
chromosomes varied substantially according to the
strata analyzed. See also Fig. 1 for the LOD scores
plotted within each of the strata for these chromo-
somes. Three of these six chromosomes were those for
which suggestive linkage evidence was found in the
pool of all 166 pedigrees: chromosomes 6, 11, and 20.
For chromosomes 6 and 20, the stronger linkage signals
were found in the subset of pedigrees with an average
age at diagnosis greater than 65 years; for chromosome
6, the strongest linkage signal was KCLOD-LIN =
2.74, while for chromosome 20, the strongest linkage
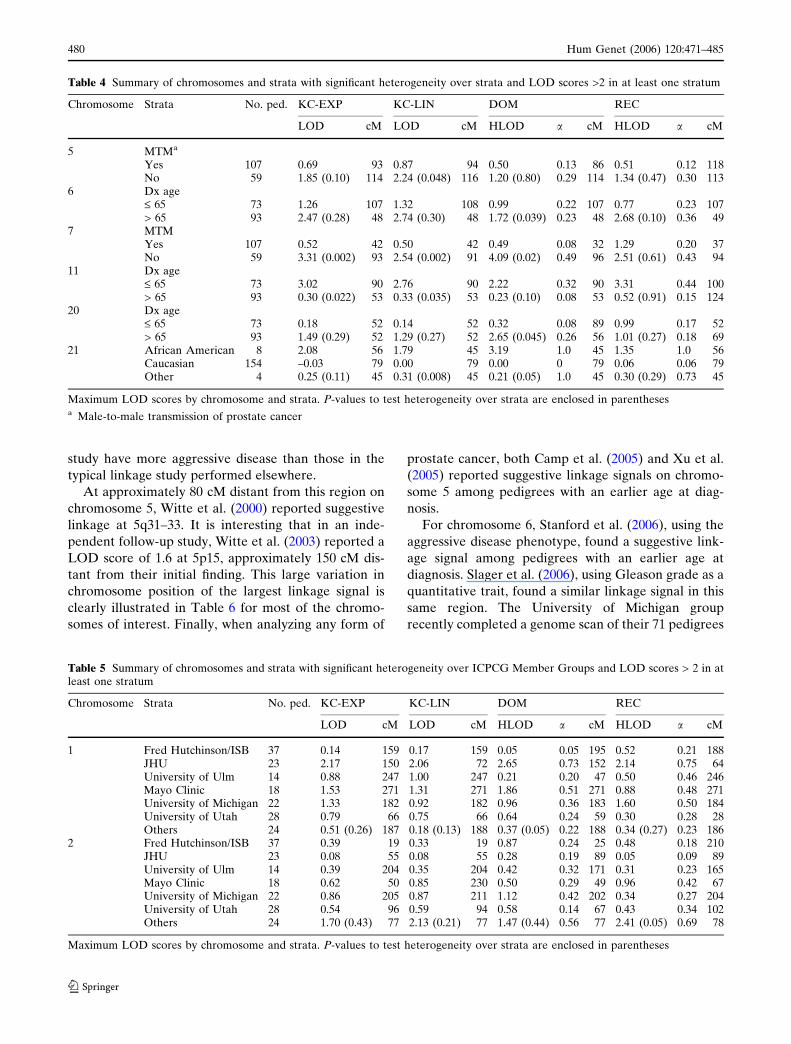
signal was HLOD-DOM = 2.65. In contrast, for
chromosome 11, the strongest linkage signal was for
pedigrees with an average age at diagnosis of 65 years
or younger, with HLOD-REC = 3.31.
The three other chromosomes that showed evidence
for heterogeneity across strata were chromosomes 5, 7,
and 21. Chromosomes 5 and 7 showed the strongest
linkage signal among pedigrees without male-to-male
disease transmission (5q21.2–22.1, KCLOD-LIN =
2.24; 7q21.11, HLOD-DOM = 4.09). Chromosome
21q22.13–22.3 showed the strongest linkage signal for
pedigrees that had African American ancestry
(HLOD-DOM = 3.19). Each of these subset linkage
signals was located within approximately 5 cM of the
maximum LOD score observed in the full set of pedi-
grees for the corresponding chromosomes (Table 3).
Previous linkage to chromosome 20 has been re-
ported by the Mayo Clinic group (Berry et al. 2000), of
which 18 of the original Mayo Clinic pedigrees were
Table 2 Characteristics of the ICPCG pedigrees used for aggressive prostate cancer linkage
ICPCG member Mean age ataggressivediseasediagnosis(years)
No. withaggressivedisease andgenotypedata
Hereditaryprostatecancer
Male-to-male
Race Totalno. ofpedigrees
£ 65 > 65 2–3 4+ No Yes Yes No AfricanAmerican
Other Caucasian
ACTANE 1 1 1 1 1 1BC/CA/HI 1 2 3 1 2 1 2 2 1 3JHU 10 13 16 7 23 20 3 2 21 23Mayo Clinic 8 10 15 3 10 8 10 8 18 18Fred Hutchinson/ISB 17 20 27 10 7 30 17 20 1 2 34 37University of Michigan 14 8 17 5 8 14 14 8 3 1 18 22Washington University 4 4 6 2 1 7 7 1 1 7 8University of Tampere 2 2 4 4 3 1 4 4University of Ulm 9 5 13 1 3 11 7 7 14 14University of Umea 1 7 7 1 1 7 2 6 8 8University of Utah 7 21 16 12 17 11 25 3 28 28All 73 93 121 45 48 118 107 59 8 4 154 166
476 Hum Genet (2006) 120:471–485
123
also included in this analysis. Excluding these 18 Mayo
Clinic pedigrees resulted in an HLOD-DOM of 1.85 on
chromosome 20, suggesting that the pedigrees with
aggressive prostate cancer from the remaining ICPCG
members contribute a large fraction to this linkage
signal. Furthermore, two of the groups participating in
this pooled analysis recently reported their own gen-
ome-wide linkage scans for aggressive prostate cancer
[Johns Hopkins University (Chang et al. 2005); Fred
Hutchinson Cancer Center/Institute of Systems Biol-
ogy (Stanford et al. 2006)]. To determine whether our
findings were influenced by the pedigrees from these
prior studies, and to determine the influence from each
group, we analyzed the linkage signals for each group
that had at least ten pedigrees; all groups with fewer
pedigrees were combined into a single ‘‘others’’ group.
The heterogeneity results presented in Table 5 illus-
trate significant heterogeneity across groups for chro-
mosomes 1 and 2, but not for the regions on
chromosomes 6, 11, and 20. For chromosome 1, the
heterogeneity was most obvious for the dominant
model, with pedigrees from Johns Hopkins, Mayo
Clinic, and University of Michigan giving the largest
LOD scores. For chromosome 2, the recessive model
gave the largest heterogeneity, with pedigrees from the
‘‘others’’ group giving the largest LOD score, followed
by pedigrees from the Mayo Clinic.
Discussion
Our main findings, based on the pool of 166 pedigrees
with aggressive prostate cancer, were statistically sig-
nificant evidence for linkage for chromosome 6 and
suggestive linkage signals, with LOD scores at least 2.0,
on chromosomes 11, and 20. In the stratified analyses,
we found evidence for significantly different linkage
signals across strata for these three chromosomes, and
in some strata, the linkage signals for chromosomes 11
and 20 increased. In fact, the strongest signal was at
chromosome 11q14.1–14.3, from the 73 pedigrees with
younger ages at diagnosis. From a genetic perspective,
this is enticing: the strength of familial risks for pros-
tate cancer are greater for earlier age at diagnosis
(Johns and Houlston 2003). The stratified analyses
provided additional interesting linkage signals on
chromosomes 5, 7, and 21.
A hallmark of genetically inherited cancer syn-
dromes is the tendency for cancers to begin, or at least
become clinically detectable, at an earlier age than
Table 3 Maximum LOD scores for each chromosome
Chromosome Allele-sharingexponential model
Allele-sharinglinear model
SimulationP-values
Dominantmodel
Recessivemodel
KCLOD-EXP cM KCLOD–LIN cM Empiric FDR HLOD cM a HLOD cM a
1 0.53 156 0.60 154 0.556 0.765 0.34 158 0.07 0.43 188 0.092 0.82 83 0.82 83 0.398 0.765 0.99 67 0.10 0.99 66 0.133 0.24 171 0.26 168 0.760 0.832 0.05 34 0.02 0.55 175 0.114 1.42 0 1.43 0 0.192 0.568 1.25 0 0.24 1.09 0 0.265 1.39 96 1.64 101 0.041 0.233 0.87 85 0.14 1.19 117 0.166a 2.63 42 3.00 42 0.004 0.080 1.21 43 0.15 2.20 43 0.257 0.47 32 0.45 33 0.484 0.765 0.43 32 0.07 1.02 35 0.148 0.89 136 0.78 136 0.242 0.618 1.17 137 0.15 0.79 136 0.159 0.21 46 0.26 46 0.714 0.832 0.12 137 0.05 0.57 110 0.1010 0.34 81 0.23 95 0.667 0.832 0.97 81 0.08 0.75 81 0.1011a 1.91 88 1.81 88 0.017 0.196 0.71 78 0.11 2.40 89 0.2312 1.81 21 1.82 21 0.033 0.233 1.61 21 0.19 0.83 22 0.1513 0.33 123 0.26 123 0.545 0.765 1.00 123 0.13 0.83 123 0.1314 0.02 91 0.02 91 0.930 0.930 0 0 0 0.08 94 0.0315 0.25 80 0.30 122 0.566 0.765 0.14 133 0.06 0.50 81 0.1116 0.49 39 0.48 39 0.341 0.765 0.92 25 0.13 0.77 40 0.1417 0.32 48 0.27 48 0.539 0.765 0.38 50 0.07 0.48 47 0.1018 0.74 97 0.84 98 0.196 0.568 0.35 91 0.07 0.51 95 0.1119 0.11 36 0.10 36 0.732 0.832 0.29 37 0.06 0.10 77 0.0520a 1.43 52 1.16 52 0.057 0.263 2.49 54 0.18 1.48 52 0.1621 0.01 79 0.01 79 0.844 0.882 0 0 0 0.14 78 0.0922 0.20 23 0.14 23 0.490 0.765 0.79 19 0.11 0.61 18 0.13X 0.94 134 0.93 133 0.198 0.568 1.00 139 0.15 0.94 136 0.24
a Chromosomes with LOD scores > 2.0
Hum Genet (2006) 120:471–485 477
123
their non-genetic counterparts (Lindor et al. 1998). For
this reason, age at diagnosis is frequently used as a
potential indicator of inherited prostate cancers.
However, age at diagnosis is a poor surrogate for age at
onset of prostate cancer, because age at diagnosis is
strongly influenced by screening practices. For exam-
ple, a man not previously screened for prostate cancer,
yet diagnosed at age 70 with metastatic prostate can-
cer, possibly could have been diagnosed 10–20 years
earlier had he been screened for prostate cancer. A
man diagnosed at age 55 with a low-volume, low-grade
cancer may be just one of the substantial proportion of
men of this age in the general population who have
within their prostates small amounts of cancerous cells
that have minimal clinical significance. On the other
hand, if this latter man had such extensive cancer that
it was no longer confined to the prostate, it would
suggest that the cancer had been present for a number
of years, and it was ‘‘early-onset’’ disease. Therefore,
our focus on clinically aggressive prostate cancer not
only emphasizes a clinically important phenotype, but
also, in the case of aggressive disease at an early age, it
increases the likelihood that we are studying truly
early-onset disease. Using families that have multiple
men affected with aggressive disease provides an
opportunity to enrich the study sample for genetic
influences that may be detectable by linkage analysis.
Our finding of a LOD score greater than 3.3 in families
with aggressive disease at an early age is particularly
interesting in this respect.
To assess the strength of evidence for our regions of
interest, we reviewed 21 reports that published gen-
ome-wide linkage scans for prostate cancer. Two stud-
ies, like ours, restricted their analyses to only aggressive
prostate cancers (Chang et al. 2005; Stanford et al.
2006). Four studies screened for linkage by using
Gleason grade as a quantitative trait (Witte et al. 2000,
2003; Slager et al. 2003, 2006). Finally, the majority of
Position (cM)
LOD
0 50 100 150
Position (cM)0 50 100 150
Position (cM)0 50 100 150
Position (cM)0 50 100 150
Position (cM)0 50 100 150
Position (cM)0 50 100 150
Position (cM)0 50 100 150
200
–10
12
34
LOD
–10
12
34
LOD
–10
12
34
LOD
–10
12
34
LOD
–10
12
34
LOD
–10
12
34
LOD
–10
12
34
Position (cM)
LOD
0 50 100 150 200
–10
12
34
Position (cM)
LOD
0 50 100 150 200
–10
12
34
Chrom 5 Overall MTM = Yes MTM = No
Chrom 6 Overall Age Dx <= 65 Age Dx > 65
Chrom 7 Overall MTM = Yes MTM = No
Fig. 1 LOD scores for chromosomes and strata with statisticallysignificant linkage heterogeneity and LOD scores > 2 in at leastone stratum—chromosomes 5, 6, 7, 11, 20, and 21 (MTM male-
to-male transmission of prostate cancer, Age Dx age atdiagnosis). The line colors represent different linkage tests (seefigure legend)
478 Hum Genet (2006) 120:471–485
123

studies—15—analyzed any type of prostate cancer
(Smith et al. 1996; Suarez et al. 2000; Goddard et al.
2001; Hsieh et al. 2001; Cunningham et al. 2003; Ed-
wards et al. 2003; Janer et al. 2003; Lange et al. 2003;
Schleutker et al. 2003; Wiklund et al. 2003; Xu et al.
2003; Gillanders et al. 2004; Matsui et al. 2004; Camp
et al. 2005; Xu et al. 2005). These studies are not all
independent, because some represent expanded accrual
over prior studies, and some represent analyses com-
bined over multiple groups. Many of these reports are
from members of the ICPCG; the report by Xu et al.
(2005) is a pooled analysis of any form of prostate
cancer among 1,233 pedigrees from ten groups of the
ICPCG. To quantify the linkage evidence as LOD
scores, results reported as P-values were converted to
LOD scores for this discussion. This conversion is
LOD ¼ v21;1�2P log10ðeÞ=2 where v2
1;1�2P is the quantile
of a chi-square distribution with one degree of freedom,
at the percentile 1–2P, P is the P-value, and e is the base
of the natural logarithm. A summary of chromosomes
that had LOD scores at least 2.0 for our chromosomes
of interest is given in Table 6.
For chromosome 5, Stanford et al. (2006)—who
restricted their analyses to the aggressive disease
phenotype—found a suggestive linkage signal among
pedigrees classified as not having HPC (following Car-
ter’s criteria). A number of studies have found similar
evidence for linkage near this same region. Slager et al.
(2006) reported a similar linkage signal using Gleason
grade as a quantitative trait, Goddard et al. (2001)
found similar linkage evidence using Gleason grade as a
covariate, and Wiklund et al. (2003) found similar evi-
dence among men from Sweden. It is worth emphasiz-
ing that in this Swedish study approximately two-thirds
of the men were diagnosed with prostate cancer before
1990 when PSA was introduced as an aid to early
detection, and 79% of the men had clinical symptoms at
diagnosis. This suggests that the men in the Swedish
Position (cM)
LOD
0 50 100 150
–10
12
34
Position (cM)
LOD
0 50 100 150
–10
12
34
Position (cM)
LOD
0 50 100 150
–10
12
34
Position (cM)
LOD
0 20 40 60 80 100
–10
12
34
Position (cM)
LOD
0 20 40 60 80 100
–10
12
34
Position (cM)
LOD
0 20 40 60 80 100
–10
12
34
Position (cM)
LOD
0 20 40 60 80Position (cM)
0 20 40 60 80
–10
12
34
LOD
–10
12
34
Position (cM)0 20 40 60 80
LOD
–10
12
34
Position (cM)0 20 40 60 80
LOD
–10
12
34
Chrom 11Overall Age Dx <= 65 Age Dx > 65
KCLOD-EXPKCLOD-LINHLOD-DOMHLOD-REC
Chrom 20Overall Age Dx <= 65 Age Dx > 65
Chrom 21Overall African American Caucasian Other Race
Fig. 1 continued
Hum Genet (2006) 120:471–485 479
123
study have more aggressive disease than those in the
typical linkage study performed elsewhere.
At approximately 80 cM distant from this region on
chromosome 5, Witte et al. (2000) reported suggestive
linkage at 5q31–33. It is interesting that in an inde-
pendent follow-up study, Witte et al. (2003) reported a
LOD score of 1.6 at 5p15, approximately 150 cM dis-
tant from their initial finding. This large variation in
chromosome position of the largest linkage signal is
clearly illustrated in Table 6 for most of the chromo-
somes of interest. Finally, when analyzing any form of
prostate cancer, both Camp et al. (2005) and Xu et al.
(2005) reported suggestive linkage signals on chromo-
some 5 among pedigrees with an earlier age at diag-
nosis.
For chromosome 6, Stanford et al. (2006), using the
aggressive disease phenotype, found a suggestive link-
age signal among pedigrees with an earlier age at
diagnosis. Slager et al. (2006), using Gleason grade as a
quantitative trait, found a similar linkage signal in this
same region. The University of Michigan group
recently completed a genome scan of their 71 pedigrees
Table 4 Summary of chromosomes and strata with significant heterogeneity over strata and LOD scores >2 in at least one stratum
Chromosome Strata No. ped. KC-EXP KC-LIN DOM REC
LOD cM LOD cM HLOD a cM HLOD a cM
5 MTMa
Yes 107 0.69 93 0.87 94 0.50 0.13 86 0.51 0.12 118No 59 1.85 (0.10) 114 2.24 (0.048) 116 1.20 (0.80) 0.29 114 1.34 (0.47) 0.30 113
6 Dx age£ 65 73 1.26 107 1.32 108 0.99 0.22 107 0.77 0.23 107> 65 93 2.47 (0.28) 48 2.74 (0.30) 48 1.72 (0.039) 0.23 48 2.68 (0.10) 0.36 49
7 MTMYes 107 0.52 42 0.50 42 0.49 0.08 32 1.29 0.20 37No 59 3.31 (0.002) 93 2.54 (0.002) 91 4.09 (0.02) 0.49 96 2.51 (0.61) 0.43 94
11 Dx age£ 65 73 3.02 90 2.76 90 2.22 0.32 90 3.31 0.44 100> 65 93 0.30 (0.022) 53 0.33 (0.035) 53 0.23 (0.10) 0.08 53 0.52 (0.91) 0.15 124
20 Dx age£ 65 73 0.18 52 0.14 52 0.32 0.08 89 0.99 0.17 52> 65 93 1.49 (0.29) 52 1.29 (0.27) 52 2.65 (0.045) 0.26 56 1.01 (0.27) 0.18 69
21 African American 8 2.08 56 1.79 45 3.19 1.0 45 1.35 1.0 56Caucasian 154 –0.03 79 0.00 79 0.00 0 79 0.06 0.06 79Other 4 0.25 (0.11) 45 0.31 (0.008) 45 0.21 (0.05) 1.0 45 0.30 (0.29) 0.73 45
Maximum LOD scores by chromosome and strata. P-values to test heterogeneity over strata are enclosed in parenthesesa Male-to-male transmission of prostate cancer
Table 5 Summary of chromosomes and strata with significant heterogeneity over ICPCG Member Groups and LOD scores > 2 in atleast one stratum
Chromosome Strata No. ped. KC-EXP KC-LIN DOM REC
LOD cM LOD cM HLOD a cM HLOD a cM
1 Fred Hutchinson/ISB 37 0.14 159 0.17 159 0.05 0.05 195 0.52 0.21 188JHU 23 2.17 150 2.06 72 2.65 0.73 152 2.14 0.75 64University of Ulm 14 0.88 247 1.00 247 0.21 0.20 47 0.50 0.46 246Mayo Clinic 18 1.53 271 1.31 271 1.86 0.51 271 0.88 0.48 271University of Michigan 22 1.33 182 0.92 182 0.96 0.36 183 1.60 0.50 184University of Utah 28 0.79 66 0.75 66 0.64 0.24 59 0.30 0.28 28Others 24 0.51 (0.26) 187 0.18 (0.13) 188 0.37 (0.05) 0.22 188 0.34 (0.27) 0.23 186
2 Fred Hutchinson/ISB 37 0.39 19 0.33 19 0.87 0.24 25 0.48 0.18 210JHU 23 0.08 55 0.08 55 0.28 0.19 89 0.05 0.09 89University of Ulm 14 0.39 204 0.35 204 0.42 0.32 171 0.31 0.23 165Mayo Clinic 18 0.62 50 0.85 230 0.50 0.29 49 0.96 0.42 67University of Michigan 22 0.86 205 0.87 211 1.12 0.42 202 0.34 0.27 204University of Utah 28 0.54 96 0.59 94 0.58 0.14 67 0.43 0.34 102Others 24 1.70 (0.43) 77 2.13 (0.21) 77 1.47 (0.44) 0.56 77 2.41 (0.05) 0.69 78
Maximum LOD scores by chromosome and strata. P-values to test heterogeneity over strata are enclosed in parentheses
480 Hum Genet (2006) 120:471–485
123

with aggressive prostate cancer. Their inclusion criteria
were more liberal than those used in this study, because
Lange et al. (2006) included pedigrees with only two
men with aggressive disease. They had 49 such pedi-
grees, while 22 of their pedigrees with at least three men
with aggressive disease overlapped with this current
pooled analysis. Their strongest signal, on chromosome
15q, was driven entirely by the 49 families with only two
men with aggressive prostate cancer, while their second
largest linkage signal, on chromosome 6p, was similar
for those families included versus those not included in
this current pooled analysis. Their 49 excluded pedi-
grees had a LOD score of approximately 1.2 in the
chromosome 6p22–23 region (E.M. Lange, personal
communication). When analyzing any form of prostate
cancer, the ACTANE group (Edwards et al. 2003)
found a LOD score over 1.0 on 6p for a large number of
families that did not meet the more strict criteria of this
pooled analysis. Furthermore, Janer et al. (2003) found
a linkage signal approximately 100 cM distant from
these other reports. Cunningham et al. (2003) found a
strong linkage signal on 6p among men with an older
age at diagnosis. These regions varied from our region
at 6p22.3—at approximately 50 cM—that had a LOD
score of 3.0. This region is approximately 20 cM distant
to HLA, which resides at 6p21.3. Perhaps this ties with
the speculation that immunity and inflammatory
mechanisms play a critical role in the development of
prostate cancer (Nelson et al. 2004).
For chromosome 7, Stanford et al. (2006), using the
aggressive disease phenotype, found a suggestive
linkage signal among pedigrees with at least five men
with prostate cancer. The linkage signal, however, was
approximately 90 cM distant from a prior report by
this group that found suggestive linkage for chromo-
some 7 when analyzing any form of prostate cancer
(Janer et al. 2003). In contrast, when restricted to men
with an aggressive disease and an older age at diag-
nosis, Paiss et al. (2003) reported a suggestive linkage
signal that was only about 35 cM from that reported by
Stanford et al. When analyzing Gleason grade as a
quantitative trait, Witte et al. found linkage signals at
approximately 130 cM (Witte et al. 2000, 2003), much
closer to the position of 96 cM reported by Janer et al.
Further support for chromosome 7q32 comes from
finding an increased allelic imbalance in primary
prostate tumors (Neville et al. 2002).
For chromosome 11, both Schleutker et al. (2003)
and Witte et al. (2003) reported interesting LOD
scores at about the same locations, and an ICPCG
pooled analysis confirmed these findings (Xu et al.
2005). Although Schleutker et al. (2003) did not restrict
their pedigrees to only men with aggressive disease,
they did skew their selected pedigrees to have as many
affected men as possible (at least 3 per pedigree), and
out of the 13 pedigrees used in their initial findings for
chromosome 11, 4 met the present criteria for aggres-
sive prostate cancer to be included in our current
Table 6 Summary of published LOD scores at least 2.0 for chromosomes 5, 6, 7, 11, and 20
Chromosome Type of PC LOD cM Nearest marker Stratum or covariate Reference
5 Aggressive 2.0 69 D5S2500 HPC = no Stanford et al. (2006)Gleason as QTL 2.1 65 D5S407 Slager et al. (2006)Gleason as QTL 2.4 147 D5S1480 Witte et al. (2000)Any 2.3 56 D5S1457 Gleason as covariate Goddard et al. (2001)Any 2.2 65 D5S407 All pedigrees Wiklund et al. (2003)Any 2.1 110 D5S1503 Dx age £ 69 Camp et al. (2005)Any 2.3 77 D5S2858 All pedigrees Xu et al. (2005)Any 2.0 179 D5S1456 Dx age £ 65 Xu et al. (2005)
6 Aggressive 2.2 125 D6S1040 Dx age £ 58 Stanford et al. (2006)Gleason as QTL 2.1 137 D6S292 Slager et al. (2006)Any 3.9 185 D6S281 Dx age ‡ 66 Cunningham et al. (2003)Any 2.5 25 D6S1281 All pedigrees Janer et al. (2003)
7 Aggressive 3.2 7 D7S3056 N. affected ‡ 5 Stanford et al. (2006)Aggressive 2.1 42 D7S1824 Dx age > 65 Paiss et al. (2003)Gleason as QTL 2.2 130 D7S1804 Witte et al. (2000)Gleason as QTL 2.1 130 D7S1804 Expansion of above study Witte et al. (2003)Any 2.3 96 D7S2212 All pedigrees Janer et al. (2003)
11 Any 3.4 88 D11S901 All pedigrees Schleutker et al. (2003)Any 2.2 102 D11S898 All pedigrees Xu et al. (2005)Any 2.1 123 D11S4464 All pedigrees Witte et al. (2003)
20 Aggressive 2.6 27 ATTC013 MTM = no Stanford et al. (2006)Any 4.8 78 D20S196 All pedigrees Cunningham et al. (2003)
MTM male-to-male transmission of prostate cancer, HPC hereditary prostate cancer
Hum Genet (2006) 120:471–485 481
123

analyses. Furthermore, like the Swedish families, many
of the Finnish families were diagnosed prior to the use
of PSA screening that started in early 1990s in Finland.
Among the original families used for linkage, 32% of
the patients were diagnosed before 1990, and 42% had
clinical symptoms at diagnosis.
For chromosome 20, Stanford et al. (2006), using the
aggressive disease phenotype, found a suggestive
linkage signal among pedigrees without male-to-male
transmission. The position of this linkage signal was
about 30 cM distant from the large linkage signal that
Cunningham et al. (2003) reported when analyzing any
form of prostate cancer. Unfortunately, the findings by
Cunningham et al. could not be replicated by a pooled
ICPCG study; a LOD score of 0.06 was found among
1,076 pedigrees not included in the original Mayo
Clinic study (Schaid and Chang 2005). These results
suggest that focusing on aggressive prostate cancer
may reveal linkage that is not apparent among all types
of prostate cancers.
Our finding of a linkage signal for chromosome 21
among eight pedigrees with African American ancestry
is intriguing, yet no other studies reported LOD scores
greater than 2.0 for chromosome 21. This suggests that
our finding may be spurious. A possible cause of a
spurious finding is that the founders of our pedigrees,
typically parent and grand-parent generations, do not
have DNA available for genotyping. Hence, our sta-
tistical analyses depend on estimated allele frequen-
cies. Because each group had few non-Caucasian
pedigrees, each group estimated allele frequencies in
the pool of all their pedigrees. If these allele frequen-
cies differed between the majority of the Caucasian
pedigrees and the African American pedigrees, then
this could lead to bias, and possibly falsely inflated
LOD scores in the African American pedigrees.
In contrast to our summary of linkage signals that
have been reported for our regions of interest, it is
worthwhile to consider reported linkage signals for the
aggressive disease phenotype that we did not detect.
Using a similarly defined aggressive disease phenotype,
Chang et al. found a LOD score of 2.5 for chromosome
X and a LOD score of 2.1 for chromosome 22 (Chang
et al. 2005). They also found interesting, yet less
striking, signals on chromosomes 3 and 9. Stanford
et al. also found an interesting signal on chromosome
22, a LOD score of 2.2 (Stanford et al. 2006). The
University of Michigan group, that also focused on
aggressive prostate cancer, recently found a LOD score
of 3.5 at chromosome 15q12 (Lange et al. 2006). Other
regions reported to have suggestive linkage signals
when analyzing Gleason grade as a quantitative trait
are chromosomes 4 and 15 (Slager et al. 2003),
chromosome 9 (Witte et al. 2003) and chromosome 19
(Witte et al. 2000; Neville et al. 2002, 2003).
In summary, our linkage findings for aggressive
prostate cancer that seem to be most consistent with
prior published studies are chromosomes 5q, 6p, 7q,
and 11q. These results suggest that prostate cancer
aggressiveness might be controlled by multiple genes.
Although the major strength of our study is the large
number of pedigrees with aggressive prostate cancer,
we recognize that our selection criteria means our
conclusions are likely to be relevant more for disease
with an earlier age at disease onset; requiring meta-
static disease or death from prostate cancer implies an
earlier age at onset, because it takes time for metas-
tases and death to occur. Nonetheless, we chose our
study design because we believed it would enrich for
HPC. Like many genetically complex traits, resolving
the genetic basis of prostate cancer is likely to require
large studies, much like ours based on the ICPCG, as
well as novel experimental designs and analyses. Our
findings provide directions for future studies to target
candidate genes for aggressive prostate cancer, based
on our strongest linkage findings for chromosomes 6
and 11, and possibly 20.
Acknowledgments We would like to express our gratitude tothe many families who participated in this study and to themany urologists who kindly assisted us by providing informa-tion and access to their patients. All members of the ICPCGare supported by the U.S. Public Health Service (USPHS),National Institutes of Health (CA89600). Additional support toparticipating groups, or members within groups, follows. AC-TANE Group: Genotyping and statistical analysis for this studyand recruitment of U.K. families was supported by CancerResearch U.K. Additional support was provided by the Pros-tate Cancer Charitable Trust (now Prostate Cancer ResearchFoundation), The Times Christmas Appeal, and the Institute ofCancer Research. Genotyping was conducted in the Jean RookGene Cloning Laboratory, which is supported by BREAK-THROUGH Breast Cancer-Charity 328323. The funds for theABI 377 used in this study were generously provided by thelegacy of the late Marion Silcock. We thank Mrs Sheila Sealand Mrs Anita Hall for kindly storing and logging the samplesthat were provided. D.F.E. is a principal research fellow ofCancer Research U.K. Recruitment of Australian PC-affectedfamilies was funded by National Health and Medical ResearchCouncil grant 940934 and was further supported by Tattersall’sand the Whitten Foundation; infrastructure was provided by theCancer Council Victoria. We acknowledge the work of studycoordinator Margaret Staples; the research team of BernadetteMcCudden, John Connal, Richard Thorowgood, Chris Costa,Melodie Kevan, and Sue Palmer; and Jolanta Karpowicz, forDNA extractions. The Texas study of familial PC was initiatedby the Department of Epidemiology, M.D. Anderson CancerCenter. M.B. was supported by NCI post-doctoral fellowship inCancer Prevention R25. Additional support to W.D.F. wassupplied by grant DAMD-17-00-10033. BC/CA/HI Group:USPHS CA67044. JHU Group: USPHS CA58236 (W.B.I.),CA95052-01 (J.X.), CA106523-01A1 (J.X.). Genotyping for the
482 Hum Genet (2006) 120:471–485
123

JHU, Michigan, Tampere, and Umea groups were performedby Elizabeth Gillanders, MaryPat Jones, Derk Gildea, EricaRiedesel, Julie Albertus, Diana Freas-Lutz, Carol Markey, JohnCarpten, and Jeff Trent at the National Human Genome Re-search Institute, NIH. Mayo Clinic Group: USPHS CA72818.Michigan Group: USPHS CA079596. Fred Hutchinson/ISBGroup: USPHS CA78835 (E.A.O.), CA080122 (J.L.S.), andfrom the Prostate Cancer Foundation and the Fred HutchinsonCancer Research Center. Tampere Group: Medical ResearchFund of Tampere University Hospital, Reino Lahtikari Foun-dation, Finnish Cancer Organizations, Sigrid Juselius Founda-tion and Academy of Finland (grant number 201480). UlmGroup: Deutsche Krebshilfe, grant number 70-3111-V03. UmeaGroup: Grants from the Swedish Cancer Society (Cancerfon-den) and Stiftelsen for Strategisk Forskning. Utah Group: NIHNational Cancer Institute grant number R01 CA90752 (toL.A.C.). National Institutes of Health grant number K07CA98364 (to N.J.C.). Data collected for this publication wasassisted by the Utah Cancer Registry supported by NationalInstitutes of Health Contract NO1-PC-35141, Surveillance,Epidemiology and End Results (SEER) Program, with addi-tional support from the Utah Department of Health and theUniversity of Utah. Partial support for all datasets within theUtah Population Database (UPDB) was provided by the Uni-versity of Utah Huntsman Cancer Institute. Public HealthServices research grant number M01-RR00064 from the Na-tional Center for Research Resources. Genotyping serviceswere provided by the Center for Inherited Disease Research(CIDR). CIDR is fully funded through a federal contract fromthe National Institutes of Health to The Johns Hopkins Uni-versity, contract number N01-HG-65403. Washington UniversityGroup: Urological Research Foundation.Mayo ClinicAuthors: Daniel J. Schaid, Shannon K. McDonnell, KatherineE. Zarfas, Julie M. Cunningham, Scott Hebbring, StephenN. ThibodeauAffiliations: Mayo Clinic, Rochester, MN, USA (D.J.S., S.K.M,K.E.Z, J.M.C., S.H., and S.N.T.)ACTANEAuthors: Rosalind A. Eeles, Douglas F. Easton, William D.Foulkes, Jacques Simard, Graham G. Giles, John L. Hopper,Lovise Mahle, Pal Moller, Michael Badzioch, D. Timothy Bishop,Chris Evans, Steve Edwards, Julia Meitz, Sarah Bullock,Questa Hope, Michelle Guy, The ACTANE ConsortiumAffiliations: Institute of Cancer Research and Royal MarsdenNational Health Service Trust Foundation Hospital, Sutton, UK(R.A.E., S.E., J.M., S.B., Q.H., and M.G.); Cancer Research U.K.Genetic Epidemiology Unit, Strangeways Research Labs, Cam-bridge, UK (D.F.E. and C.E.); Program in Cancer Genetics,Departments of Oncology and Human Genetics, McGill Uni-versity, Montreal, Canada (W.D.F.); Cancer Genomics Labora-tory, Centre hospitalier de l’Universite Laval Research Centre,Sainte-Foy, QC, Canada (J. Simard); Cancer EpidemiologyCentre, Cancer Council Victoria (G.G.G.), and Centre forGenetic Epidemiology, University of Melbourne, Carlton,Australia (J.L.H.); Unit of Medical Genetics, Norwegian RadiumHospital, Oslo, Norway (L.M. and P.M.); Cancer ResearchU.K. Genetic Epidemiology Laboratory, St. James’ UniversityHospital, Leeds, UK (T.B.); MD Anderson Cancer Center,Houston, TX, USA (M.B)BC/CA/HIAuthors: Chih-lin Hsieh, Jerry Halpern, Raymond R. Balise,Ingrid Oakley-Girvan, Alice S. WhittemoreAffiliations: University of Southern California, Los Angeles, USA(C.-l.H.); Stanford University School of Medicine, Stanford, USA
(J.H., R.N.B., and A.S.W.); Northern California Cancer Center,Union City and Stanford, USA (I.O.-G.)Data Coordinating CenterAuthors: Jianfeng Xu, Latchezar Dimitrov, Bao-Li Chang,Tamara S. Adams, Aubrey R. Turner, Deborah A. MeyersAffiliations: Center for Human Genomics, Wake Forest Univer-sity School of Medicine, Winston-Salem, NC, USA (J.X., L.D.,B.-L.C., T.S.A., A.R.T., and D.A.M.)Fred Hutchinson Cancer Research Center/Institute for SystemsBiologyAuthors: Danielle M. Friedrichsen, Kerry Deutsch, Suzanne -Kolb, Marta Janer, Leroy Hood, Elaine A. Ostrander, JanetL. StanfordAffiliations: Divisions of Human Biology (D.M.F.) and PublicHealth Sciences (S.K. and J.L.S.), Fred Hutchinson Cancer Cen-ter, and Institute for Systems Biology (K.D., M.J., and L.H.),Seattle, USAJohns Hopkins UniversityAuthors: Charles M. Ewing, Marta Gielzak, Sarah D. Isaacs,Patrick C. Walsh, Kathleen E. Wiley, William B. IsaacsAffiliations: Department of Urology, Johns Hopkins MedicalInstitutions (C.M.E., M.G., S.D.I. P.C.W., K.E.W., and W.B.I),and Inherited Disease Research Branch, National Human Gen-ome Research Institute, NIH (J.B.-W.), Baltimore, USAUniversity of MichiganAuthors: Ethan M. Lange, Lindsey A. Ho, Jennifer L. Beebe-Dimmer, David P. Wood, Kathleen A. CooneyAffiliations: Departments of Genetics and Biostatistics, Universityof North Carolina, Chapel Hill, USA (E.M.L. and L.A.H);Departments of Internal Medicine and Urology, University ofMichigan, Ann Arbor, USA (J.L.B.-D., D.P.W, and K.A.C.)National Institutes of HealthAuthors: Daniela SeminaraAffiliations: Cancer Genetics Branch, National Human GenomeResearch Institute, (E.A.O.), National Cancer Institute (NCI)(D.S.), and Inherited Disease Research Branch, National HumanGenome Research Institute, (J.B-W.), National Institutes ofHealth, Bethesda, USAUniversity of Tampere and Tampere University HospitalAuthors: Tarja Ikonen, Agnes Baffoe-Bonnie, Henna Fredriks-son, Mika P. Matikainen, Teuvo LJ Tammela, Joan Bailey-Wilson, Johanna SchleutkerAffiliations: University of Tampere and Tampere UniversityHospital, Tampere, Finland (T.I., H.F., M.P.M. T.L.T., and J.Schleutker); Fox Chase Cancer Center, Division of PopulationScience, Philadelphia, USA (A.B.-B.)University of UlmAuthors: Christiane Maier, Kathleen Herkommer, Josef J.Hoegel, Walther Vogel, Thomas PaissAffiliations: Abteilung Humangenetik, Universitat Ulm, Ulm,Germany (C.M., J.J.H., and W.V.), and Urologische Universi-tatsklinik und Poliklinik, Abteilung fur Urologie und Kinder-urologie (K.H. and T.P.), Ulm, GermanyUniversity of UmeaAuthors: Fredrik Wiklund, Monica Emanuelsson, Elisa-beth Stenman, Bjorn-Anders Jonsson, Henrik GronbergAffiliations: Department of Radiation Sciences, Oncology,University of Umea, Umea, Sweden (F.W., M.E., E.S., B.-A.J.,and H.G.)University of UtahAuthors: Nicola J. Camp, James Farnham, Lisa A. Cannon-Al-brightAffiliations: Division of Genetic Epidemiology, Department ofBiomedical Informatics, University of Utah, Salt Lake City, USA(N.J.C., J.F., and L.C.A)
Hum Genet (2006) 120:471–485 483
123
Washington UniversityAuthors: William J. Catalona, Brian K. Suarez, and Kimberly A.RoehlAffiliations: Department of Urology and the Robert H. LurieComprehensive Cancer Center, Northwestern University Fein-berg School of Medicine, Chicago, IL, USA (W.J.C.); Depart-ment of Psychiatry, Washington University School of Medicine,St. Louis, MO, USA (B.K.S and K.A.R.)
References
Benjamini Y, Hochberg Y (1995) Controlling the false discoveryrate: a practical and powerful approach to multiple testing.J R Stat Soc B 57:289–300
Berry R, Schroeder J, French A, McDonnell S, Peterson B,Cunningham J, Thibodeau S, Schaid D (2000) Evidence fora prostate cancer-susceptibility locus on chromosome 20.Am J Hum Genet 67:82–91
Berthon P, Valeri A, Cohen-Akenine A, Drelon E, Paiss T,Wohr G, Latil A, Millasseau P, Mellah I, Cohen N, BlancheH, Bellane-Chantelot C, Demenais F, Teillac P, Le Duc A,de Petriconi R, Hautmann R, Chumakov I, Bachner L,Maitland NJ, Lindereeau R, Vogel W, Fournier G, ManginP, Cussenot O (1998) Predisposing gene for early-onsetprostate cancer, localized on chromosome 1q42.2–43. Am JHum Genet 62:1416–1424
Camp NJ, Farnham JM, Cannon-Albright LA (2005) Genomicsearch for prostate cancer predisposition loci in Utah pedi-grees. Prostate 65:365–374
Carpten J, Nupponen N, Isaacs S, Sood R, Robbins C, Xu J,Faruque M, et al (2002) Germline mutations in the ribo-nuclease L gene in families showing linkage with HPC1. NatGenet 30:181–184
Carter B, Bova G, Beaty T, Steinberg G, Childs B, Isaacs W,Walsh P (1993) Hereditary prostate cancer: epidemiologicand clinical features. J Urol 150:797–802
Chang BL, Isaacs SD, Wiley KE, Gillanders EM, Zheng SL,Meyers DA, Walsh PC, Trent JM, Xu J, Isaacs WB (2005)Genome-wide screen for prostate cancer susceptibility genesin men with clinically significant disease. Prostate 64:356–361
Cunningham JM, McDonnell SK, Marks A, Hebbring S,Anderson SA, Peterson BJ, Slager S, French A, Blute ML,Schaid DJ, Thibodeau SN (2003) Genome linkage screen forprostate cancer susceptibility loci: results from the MayoClinic Familial Prostate Cancer Study. Prostate 57:335–346
Easton DF, Schaid DJ, Whittemore AS, Isaacs WJ (2003) Whereare the prostate cancer genes?—A summary of eight gen-ome wide searches. Prostate 57:261–269
Edwards S, Meitz J, Eeles R, Evans C, Easton D, Hopper J,Giles G, Foulkes WD, Narod S, Simard J, Badzioch M,Mahle L (2003) Results of a genome-wide linkage analysisin prostate cancer families ascertained through the AC-TANE consortium. Prostate 57:270–279
Etzioni R, Penson DF, Legler JM, di Tommaso D, Boer R, GannPH, Feuer EJ (2002) Overdiagnosis due to prostate-specificantigen screening: lessons from U.S. prostate cancer inci-dence trends. J Natl Cancer Inst 94:981–990
Feingold E, Brown PO, Siegmund D (1993) Gaussian models forgenetic linkage analysis using complete high-resolutionmaps of identity by descent. Am J Hum Genet 53:234–251
Gibbs M, Stanford JL, McIndoe RA, Jarvik GP, Kolb S, GoodeEL, Chakrabarti L, Schuster EF, Buckley VA, Miller EL,Brandzel S, Li S, Hood L, Ostrander EA (1999) Evidence
for a rare prostate cancer-susceptibility locus at chromo-some 1p36. Am J Hum Genet 64:776–787
Gillanders EM, Xu J, Chang BL, Lange EM, Wiklund F, Bailey-Wilson JE, Baffoe-Bonnie A, et al (2004) Combined gen-ome-wide scan for prostate cancer susceptibility genes.J Natl Cancer Inst 96:1240–1247
Goddard KA, Witte JS, Suarez BK, Catalona WJ, Olson JM(2001) Model-free linkage analysis with covariates confirmslinkage of prostate cancer to chromosomes 1 and 4. Am JHum Genet 68:1197–1206
Gronberg H (2003) Prostate cancer epidemiology. Lancet361:859–864
Hsieh C-L, Oakley-Girvan I, Balise RR, Halpern J, GallagherRP, Wu AH, Kolonel LN, O’Brien LE, Lin IG, Van DenBerg DJ, Teh CZ, West DW, Whittemore AS (2001) Agenome screen of families with multiple cases of prostatecancer: evidence of genetic heterogeneity. Am J Hum Genet69:148–158
Janer M, Friedrichsen DM, Stanford JL, Badzioch MD, Kolb S,Deutsch K, Peters MA, Goode EL, Welti R, DeFrance HB,Iwasaki L, Li S, Hood L, Ostrander EA, Jarvik GP (2003)Genomic scan of 254 hereditary prostate cancer families.Prostate 57:309–319
Jemal A, Tiwari RC, Murray T, Ghafoor A, Samuels A, Ward E,Feuer EJ, Thun MJ (2004) Cancer statistics, 2004. CACancer J Clin 54:8–29
Johns LE, Houlston RS (2003) A systematic review and meta-analysis of familial prostate cancer risk. BJU Int 91:789–794
Kong A, Cox NJ (1997) Allele-sharing models: LOD scores andaccurate linkage tests. Am J Hum Genet 61:1179–1188
Kong A, Gudbjartsson D, Sainz J, Jonsdottir G, Gudjonsson S,Richardsson B, Sigurdardottir S, Barnard B, Hallbeck B,Masson M, Shlien A, Palsson S, Frigge M, Thorgeirsson T,Gulcher J, Stefansson K (2002) A high-resolution recombi-nation map of the human genome. Nat Genet 31:241–247
Kruglyak L, Daly MJ, Reeve-Daly MP, Lander ES (1996)Parametric and nonparametric linkage analysis: a unifiedmultipoint approach. Am J Hum Genet 58:1347–1363
Lander E, Kruglyak L (1995) Genetic dissection of complextraits: guidelines for interpreting and reporting results.Nature Genet 11:241–247
Lange EM, Gillanders EM, Davis CC, Brown WM, CampbellJK, Jones M, Gildea D, Riedesel E, Albertus J, Freas-LutzD, Markey C, Giri V, Dimmer JB, Montie JE, Trent JM,Cooney KA (2003) Genome-wide scan for prostate cancersusceptibility genes using families from the University ofMichigan prostate cancer genetics project finds evidence forlinkage on chromosome 17 near BRCA1. Prostate 57:326–334
Lange EM, Ho LA, Beebe-Dimmer JL, Wang Y, GillandersEM, Trent JM, Lange LA, Wood DP, Cooney KA (2006)Genome-wide linkage scan for prostate cancer suscepti-bility genes in men with aggressive disease: significantevidence for linkage at chromosome 15q12. Hum Genet119:400–407
Lin DY (2005) An efficient Monte Carlo approach to assessingstatistical significance in genomic studies. Bioinformatics21:781–787
Lindor NM, Greene MH, Program tMFC (1998) The concisehandbook of family cancer syndromes. J Natl Cancer Inst14:1039–1071
Matsui H, Suzuki K, Ohtake N, Nakata S, Takeuchi T, Yama-naka H, Inoue I (2004) Genomewide linkage analysis offamilial prostate cancer in the Japanese population. J HumGenet 49:9–15
484 Hum Genet (2006) 120:471–485
123

Nelson WG, De Marzo AM, DeWeese TL, Isaacs WB (2004)The role of inflammation in the pathogenesis of prostatecancer. J Urol 172:S6–S11; discussion S11–S12
Neville PJ, Conti DV, Paris PL, Levin H, Catalona WJ, SuarezBK, Witte JS, Casey G (2002) Prostate cancer aggressive-ness locus on chromosome 7q32–q33 identified by linkageand allelic imbalance studies. Neoplasia 4:424–431
Neville PJ, Conti DV, Krumroy LM, Catalona WJ, Suarez BK,Witte JS, Casey G (2003) Prostate cancer aggressivenesslocus on chromosome segment 19q12–q13.1 identified bylinkage and allelic imbalance studies. Genes ChromosomesCancer 36:332–339
Ostrander EA, Stanford JL (2000) Genetics of prostate cancer:too many loci, too few genes. Am J Hum Genet 67:1367–1375
Paiss T, Worner S, Kurtz F, Haeussler J, Hautmann RE,Gschwend JE, Herkommer K, Vogel W (2003) Linkage ofaggressive prostate cancer to chromosome 7q31–33 in Ger-man prostate cancer families. Eur J Hum Genet 11:17–22
Schaid D (2004) The complex genetic epidemiology of prostatecancer. Hum Mol Genet 13(Review Issue):R103–R121
Schaid DJ, Chang BL (2005) Description of the InternationalConsortium For Prostate Cancer Genetics, and failure toreplicate linkage of hereditary prostate cancer to 20q13.Prostate 63:276–290
Schleutker J, Baffoe-Bonnie AB, Gillanders E, Kainu T, JonesMP, Freas-Lutz D, Markey C, Gildea D, Riedesel E, Al-bertus J, Gibbs KD Jr, Matikainen M, Koivisto PA, Tam-mela T, Bailey-Wilson JE, Trent JM, Kallioniemi OP (2003)Genome-wide scan for linkage in Finnish hereditary pros-tate cancer (HPC) families identifies novel susceptibility lociat 11q14 and 3p25–26. Prostate 57:280–289
Slager S, Schaid D, Cunningham J, McDonnell S, Marks A,Peterson B, Hebbring S, Anderson S, French A, ThibodeauS (2003) Confirmation of linkage of prostate canceraggressiveness with chromosome 19q. Am J Hum Genet72:759–762
Slager SL, Zarfas KE, Brown WM, Lange EM, McDonnell SK,Wojno KJ, Cooney KA (2006) Genome-wide linkage scanfor prostate cancer aggressiveness loci using families fromthe University of Michigan Prostate Cancer Genetics Pro-ject. Prostate 66:173–179
Smith JR, Freije D, Carpten JD, Gronberg H, Xu J, Isaacs SD,Brownstein MJ, Bova GS, Guo H, Bujinovszky P, NusskernDR, Damber JE, Bergh A, Emanuelsson M, KallioniemiOP, Walker-Daniels J, Bailey-Wilson JE, Beaty TH, MeyersDA, Walsh PC, Collins FS, Trent JM, Isaacs WB (1996)Major susceptibility locus for prostate cancer on chromo-some 1 suggested by a genome-wide search. Science274:1371–1374
Stanford J, McDonnell S, Friedrichsen D, Carlson E, Kolb S,Deutsch K, Janer M, Hood L, Ostrander E, Schaid D(2006) Prostate cancer and genetic susceptibility: a gen-ome scan incorporating disease aggressiveness. Prostate66:317–325
Suarez BK, Lin J, Burmester JK, Broman KW, Weber JL,Banerjee TK, Goddard KAB, Witte JS, Elston RC, Cata-lona WJ (2000) A genome screen of multiplex prostatecancer sibships. Am J Hum Genet 66:933–944
Tavtigian S, Simard J, Teng D, Abtin V, Baumgard M, Beck A,Camp N, et al (2001) A strong candidate prostate cancersusceptibility gene at chromosome 17p. Nat Genet 27:172–180
Whittemore AS, Halpern J (2001) Problems in the definition,interpretation, and evaluation of genetic heterogeneity. AmJ Hum Genet 68:457–465
Wiklund F, Gillanders EM, Albertus JA, Bergh A, Damber JE,Emanuelsson M, Freas-Lutz DL, Gildea DE, Goransson I,Jones MS, Jonsson BA, Lindmark F, Markey CJ, RiedeselEL, Stenman E, Trent JM, Gronberg H (2003) Genome-wide scan of Swedish families with hereditary prostatecancer: suggestive evidence of linkage at 5q11.2 and 19p13.3.Prostate 57:290–297
Witte J, Goddard K, Conti D, Elston R, Lin J, Suarez B, BromanK, Burmester J, Weber J, Catalona W (2000) Genomewidescan for prostate cancer-aggressiveness loci. Am J HumGenet 67:92–99
Witte JS, Suarez BK, Thiel B, Lin J, Yu A, Banerjee TK, Bur-mester JK, Casey G, Catalona WJ (2003) Genome-widescan of brothers: replication and fine mapping of prostatecancer susceptibility and aggressiveness loci. Prostate57:298–308
Xu J (2000) Combined analysis of hereditary prostate cancerlinkage to 1q24–25: results from 772 hereditary prostatecancer families from the International Consortium forProstate Cancer Genetics. Am J Hum Genet 66:945–957
Xu J, Meyers D, Freije D, Isaacs S, Wiley K, Nusskern D, EwingC, et al (1998) Evidence for a prostate cancer susceptibilitylocus on the X chromosome. Nat Genet 20:175–179
Xu J, Zheng SL, Hawkins GA, Faith DA, Kelly B, Isaacs SD,Wiley KE, Chang B, Ewing CM, Bujinovszky P, CarptenJD, Bleecker ER, Walsh PC, Trent JM, Meyers DA, IsaacsWB (2001) Linkage and association studies of prostatecancer susceptibility: evidence for linkage at 8p22–23. Am JHum Genet 69:341–350
Xu J, Zheng SL, Komiya A, Mychaleckyj JC, Isaacs SD, Hu JJ,Sterling D, et al (2002) Germline mutations and sequencevariants of the macrophage scavenger receptor 1 gene areassociated with prostate cancer risk. Nat Genet 32:321–325
Xu J, Gillanders EM, Isaacs SD, Chang BL, Wiley KE, ZhengSL, Jones M, Gildea D, Riedesel E, Albertus J, Freas-LutzD, Markey C, Meyers DA, Walsh PC, Trent JM, Isaacs WB(2003) Genome-wide scan for prostate cancer susceptibilitygenes in the Johns Hopkins hereditary prostate cancerfamilies. Prostate 57:320–325
Xu J, Dimitrov L, Chang BL, Adams TS, Turner AR, MeyersDA, Eeles RA, et al (2005) A combined genomewidelinkage scan of 1,233 families for prostate cancer-suscepti-bility genes conducted by the international consortium forprostate cancer genetics. Am J Hum Genet 77:219–229
Hum Genet (2006) 120:471–485 485
123