plants
animals
monera
fungi
protistsprotozoa
invertebrates
vertebrates
mammalsFive kingdom
system(Haeckel, 1879)

We will use MEGA to make phylogenetic trees

Open the alignment editor…
Choose DNA or protein…
Paste in sequences in the fasta format or as a multiple sequence alignment…

You can use a set of protein or DNA sequences in the fasta format obtained from HomoloGene

Use MEGA to make phylogenetic trees
Trees show the evolutionary relationships among proteins, or DNA sequences, or species…

Charles Darwin’s 1859 book (On the Origin of SpeciesBy Means of Natural Selection, or the Preservationof Favoured Races in the Struggle for Life) introducedthe theory of evolution.
To Darwin, the struggle for existence induces a naturalselection. Offspring are dissimilar from their parents(that is, variability exists), and individuals that are morefit for a given environment are selected for. In this way,over long periods of time, species evolve. Groups of organisms change over time so that descendants differstructurally and functionally from their ancestors.
Introduction

At the molecular level, evolution is a process ofmutation with selection.
Molecular evolution is the study of changes in genesand proteins throughout different branches of the tree of life.
Phylogeny is the inference of evolutionary relationships.Traditionally, phylogeny relied on the comparisonof morphological features between organisms. Today,molecular sequence data are also used for phylogeneticanalyses.
Introduction
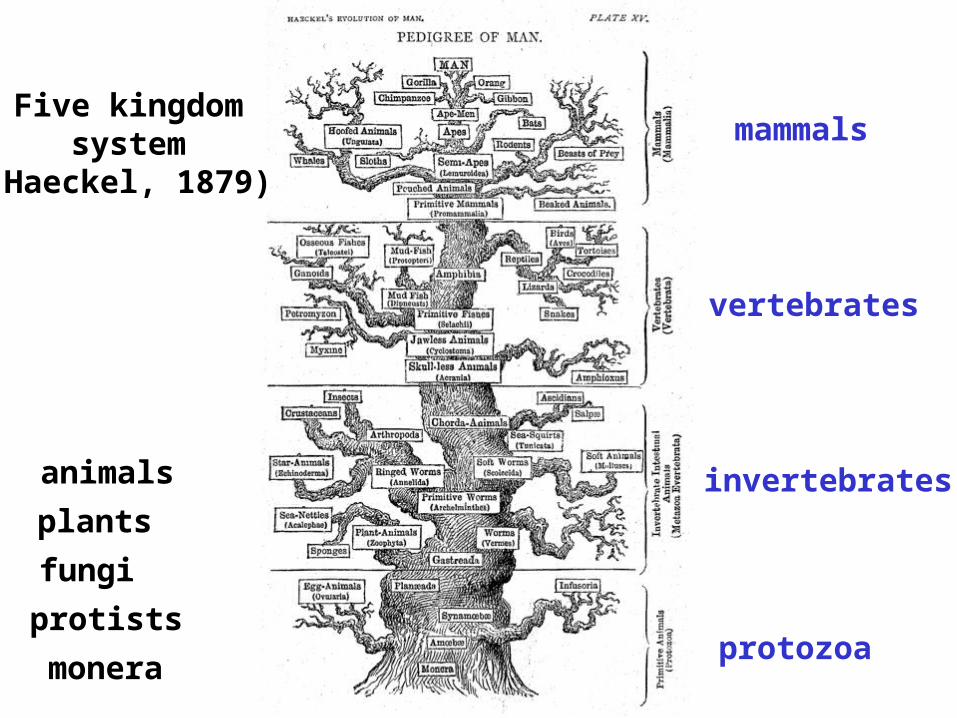
Phylogeny can answer questions such as:
Goals of molecular phylogeny
• How many genes are related to my favorite gene?• How related are whales, dolphins & porpoises to cows?• Where and when did HIV or other viruses originate?• What is the history of life on earth?• Was the extinct quagga more like a zebra or a horse?

In the 1960s, sequence data were accumulated forsmall, abundant proteins such as globins,cytochromes c, and fibrinopeptides. Some proteinsappeared to evolve slowly, while others evolved rapidly.
Linus Pauling, Emanuel Margoliash and others proposed the hypothesis of a molecular clock:
For every given protein, the rate of molecular evolution is approximately constant in all evolutionary lineages
Implications: If protein sequences evolve at constant rates, they can be used to estimate the times that sequences diverged. This is analogous to datinggeological specimens by radioactive decay.
Molecular clock hypothesis

A
B
C
D
E
F
G
HI
time
6
2
1 1
2
1
2
6
1
2
2
1
A
BC
2
1
2
D
Eone unit
Molecular phylogeny uses trees to depict evolutionaryrelationships among organisms. These trees are basedupon DNA and protein sequence data.

A
B
C
D
E
F
G
HI
time
6
2
1 1
2
1
2
6
1
2
2
1
A
BC
2
1
2
D
Eone unit
Tree nomenclature
taxon
taxon

A
B
C
D
E
F
G
HI
time
6
2
1 1
2
1
2
6
1
2
2
1
A
BC
2
1
2
D
Eone unit
Tree nomenclature
taxon
operational taxonomic unit (OTU) such as a protein sequence

A
B
C
D
E
F
G
HI
time
6
2
1 1
2
1
2
6
1
2
2
1
A
BC
2
1
2
D
Eone unit
Tree nomenclature
branch (edge)
Node (intersection or terminating pointof two or more branches)

A
B
C
D
E
F
G
HI
time
6
2
1 1
2
1
2
6
1
2
2
1
A
BC
2
1
2
D
Eone unit
Tree nomenclature
Branches are unscaled... Branches are scaled...
…branch lengths areproportional to number ofamino acid changes
…OTUs are neatly aligned,and nodes reflect time

A
B
C
D
E
F
G
HI
time
6
2
1 1
2
1
2
6
1
2
2
1
A
BC
22
D
Eone unit
Tree nomenclature
bifurcatinginternal node
multifurcatinginternalnode

Examples of multifurcation: failure to resolve the branching orderof some metazoans and protostomes
Rokas A. et al., Animal Evolution and the Molecular Signature of RadiationsCompressed in Time, Science 310:1933 (2005), Fig. 1.

A
B
C
D
E
F
G
HI
time
6
2
1 1
2
1
2
Tree nomenclature: clades
Clade ABF (monophyletic group)
A
B
C
D
E
F
G
HI
time
6
2
1 1
2
1
2
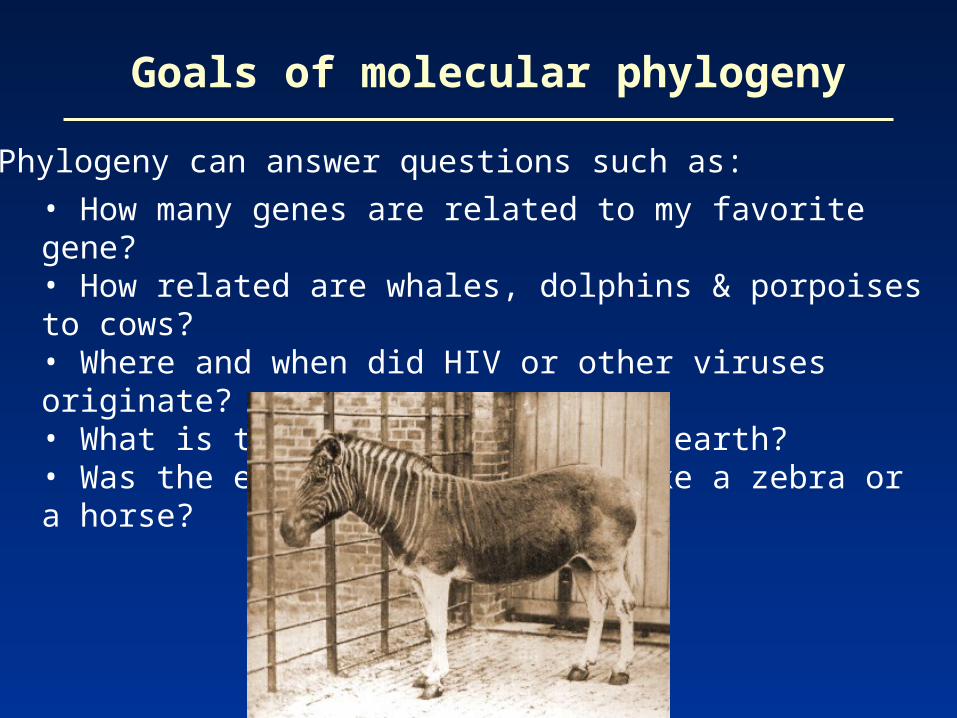
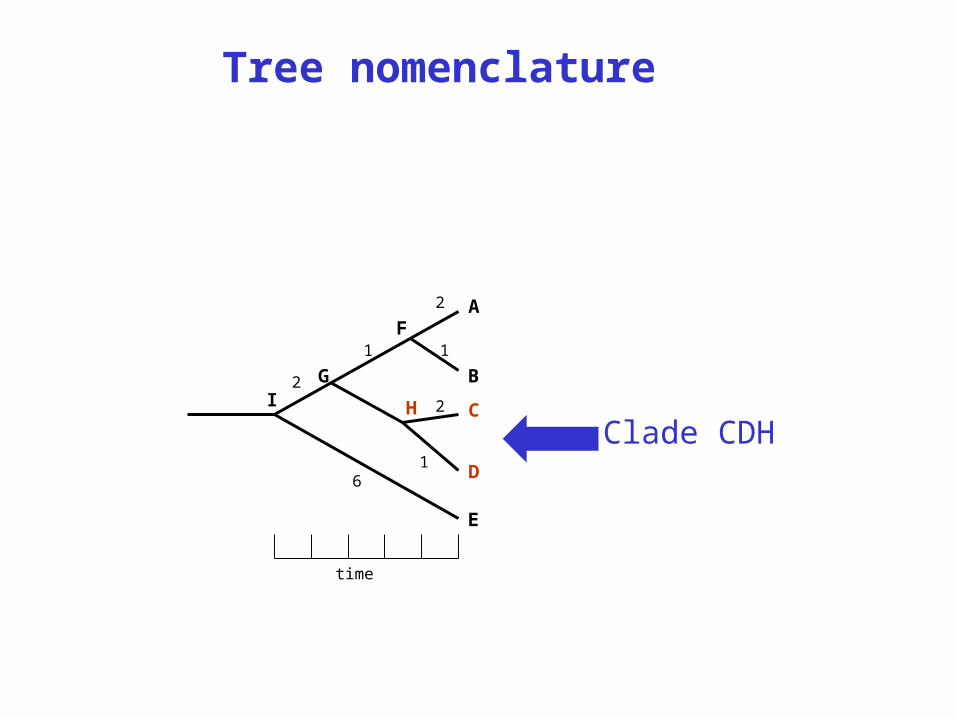
Tree nomenclature
Clade CDH
A
B
C
D
E
F
G
HI
time
6
2
1 1
2
1
2
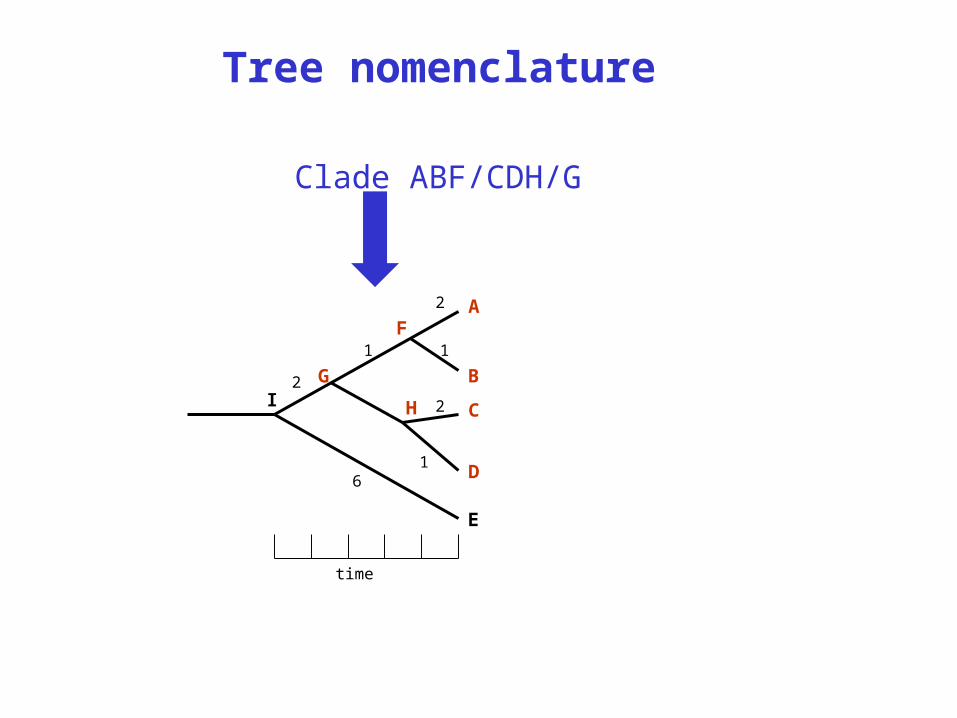
Tree nomenclature
Clade ABF/CDH/G

Examples of clades
Lindblad-Toh et al., Nature 438: 803 (2005), fig. 10

The root of a phylogenetic tree represents thecommon ancestor of the sequences. Some treesare unrooted, and thus do not specify the commonancestor.
A tree can be rooted using an outgroup (that is, ataxon known to be distantly related from all otherOTUs).
Tree roots
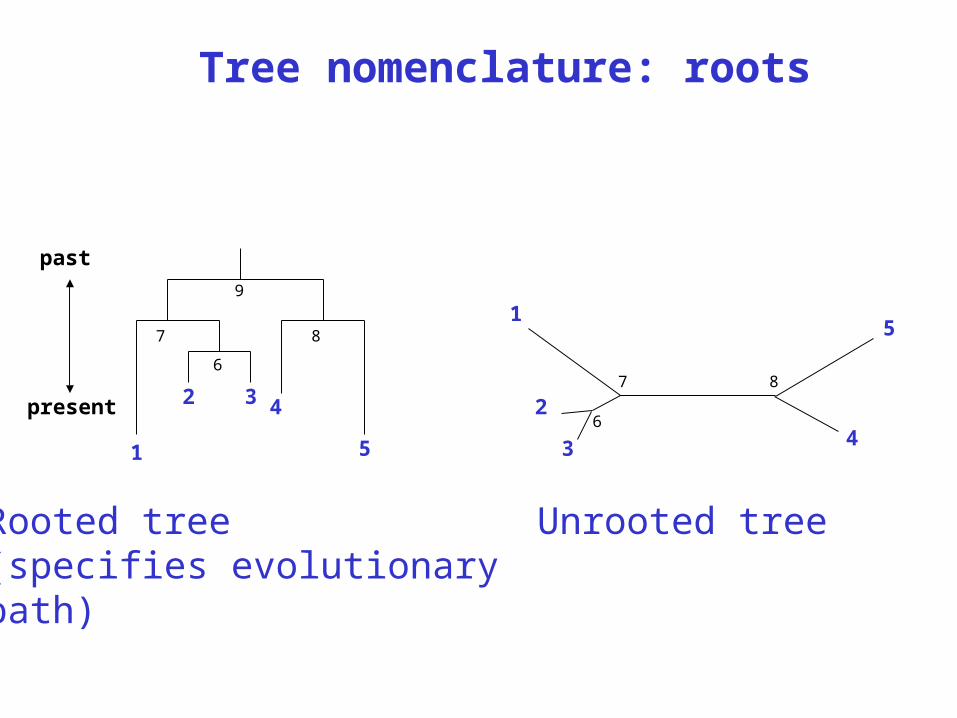
Tree nomenclature: roots
past
present
1
2 3 4
5
6
7 8
9
4
5
87
1
2
36
Rooted tree(specifies evolutionarypath)
Unrooted tree

Tree nomenclature: outgroup rooting
past
present
1
2 3 4
5
6
7 8
9
Rooted tree
1
2 3 4
5 6
Outgroup(used to place the root)
7 9
10
root
8

Numbers of possible trees extremely large for >10 sequences
Number Number of Number of of OTUs rooted trees unrooted trees
2 1 13 3 14 15 35 105 1510 34,459,425 10520 8 x 10²¹ 2 x 10²⁰

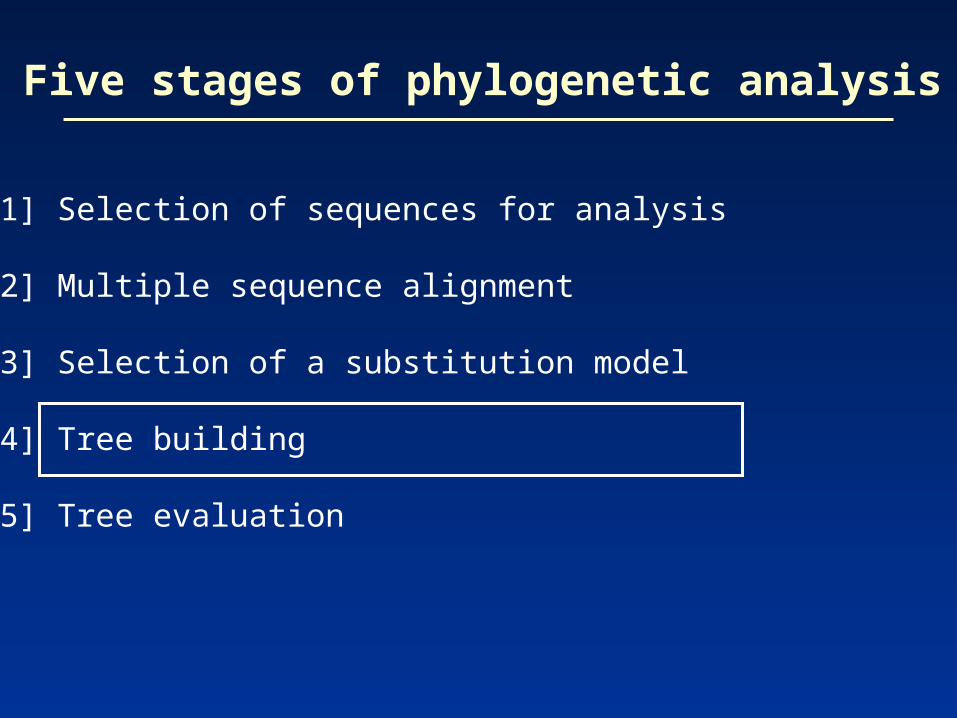
[1] Selection of sequences for analysis
[2] Multiple sequence alignment
[3] Selection of a substitution model
[4] Tree building
[5] Tree evaluation
Five stages of phylogenetic analysis

For phylogeny, DNA can be more informative.
--The protein-coding portion of DNA has synonymousand nonsynonymous substitutions. Thus, some DNAchanges do not have corresponding protein changes.
Stage 1: Use of DNA, RNA, or protein


For phylogeny, DNA can be more informative.
--Some substitutions in a DNA sequence alignment canbe directly observed: single nucleotide substitutions,sequential substitutions, coincidental substitutions.
Stage 1: Use of DNA, RNA, or protein
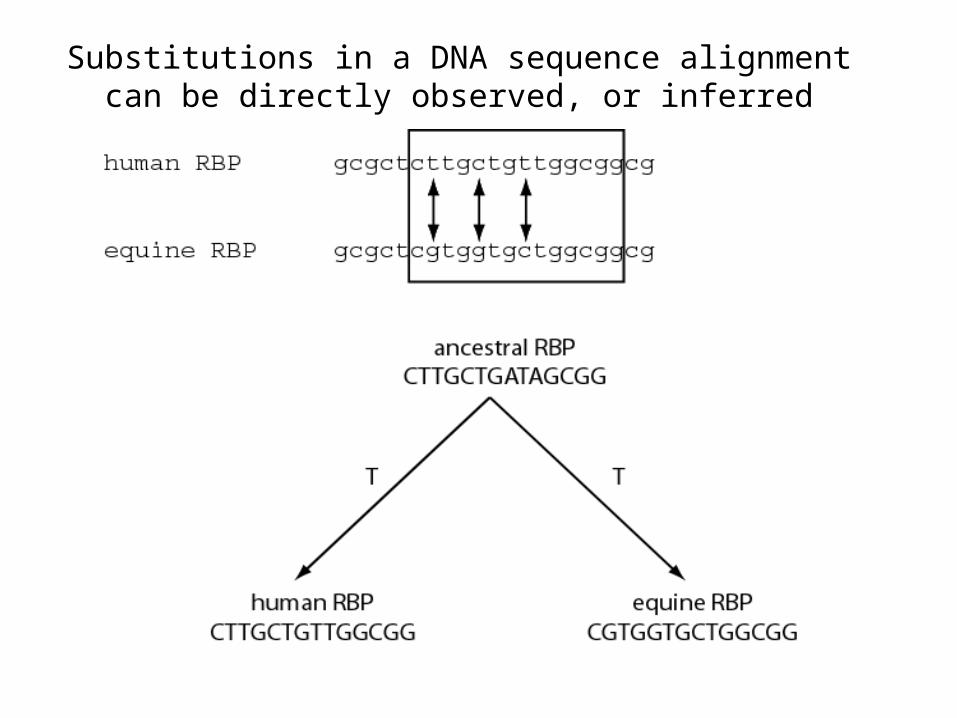
Substitutions in a DNA sequence alignment can be directly observed, or inferred


For phylogeny, DNA can be more informative.
--Noncoding regions (such as 5’ and 3’ untranslatedregions) may be analyzed using molecular phylogeny.
--Pseudogenes (nonfunctional genes) are studied bymolecular phylogeny
--Rates of transitions and transversions can be measured. Transitions: purine (A G) or pyrimidine (C T) substitutionsTransversion: purine pyrimidine
Stage 1: Use of DNA, RNA, or protein

For phylogeny, protein sequences are also often used.
--Proteins have 20 states (amino acids) instead of onlyfour for DNA, so there is a stronger phylogenetic signal.
Nucleotides are unordered characters: any onenucleotide can change to any other in one step.
An ordered character must pass through one or moreintermediate states before reaching the final state.
Amino acid sequences are partially ordered character states: there is a variable number of states betweenthe starting value and the final value.
Stage 1: Use of DNA, RNA, or protein

[1] Selection of sequences for analysis
[2] Multiple sequence alignment
[3] Selection of a substitution model
[4] Tree building
[5] Tree evaluation
Five stages of phylogenetic analysis

The fundamental basis of a phylogenetic tree is a multiple sequence alignment.
(If there is a misalignment, or if a nonhomologoussequence is included in the alignment, it will still be possible to generate a tree.)
Consider the following alignment of orthologous globins (see Fig. 3.2)
Stage 2: Multiple sequence alignment
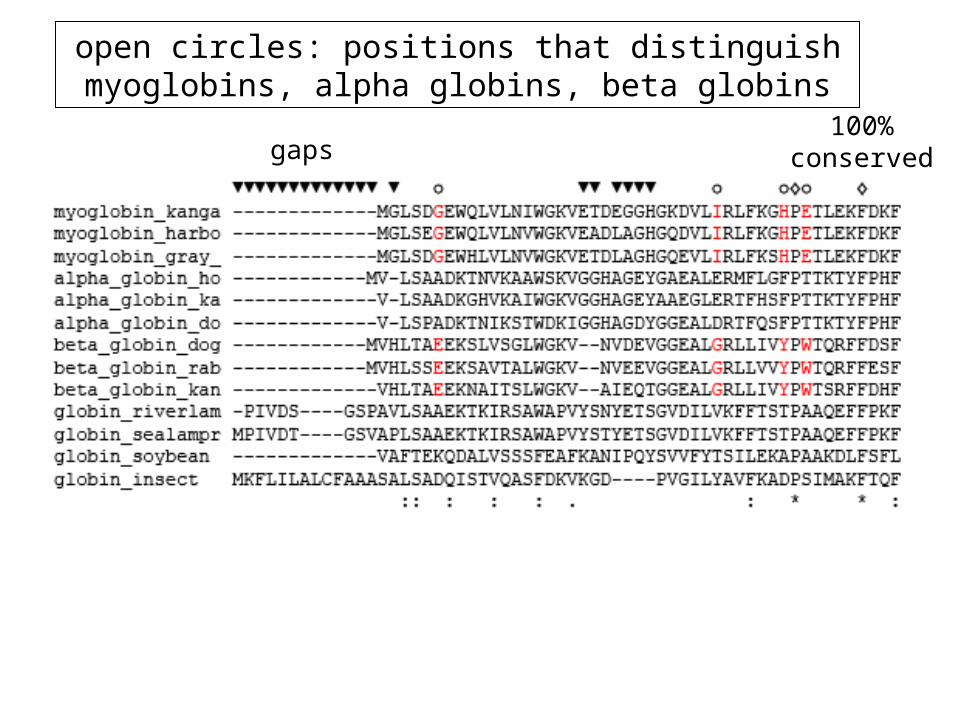
gaps100%
conserved
open circles: positions that distinguish myoglobins, alpha globins, beta globins

[1] Confirm that all sequences are homologous
[2] Adjust gap creation and extension penalties as needed to optimize the alignment
[3] Restrict phylogenetic analysis to regions of the multiple sequence alignment for which data are available for all taxa (delete columns having incomplete data or gaps).
Stage 2: Multiple sequence alignment

[1] Selection of sequences for analysis
[2] Multiple sequence alignment
[3] Selection of a substitution model
[4] Tree building
[5] Tree evaluation
Five stages of phylogenetic analysis

Stage 4: Tree-building methods: distance
The simplest approach to measuring distances between sequences is to align pairs of sequences, andthen to count the number of differences. The degree ofdivergence is called the Hamming distance. For analignment of length N with n sites at which there aredifferences, the degree of divergence D is:
D = n / N
But observed differences do not equal genetic distance!Genetic distance involves mutations that are notobserved directly.

Stage 4: Tree-building methods: distance
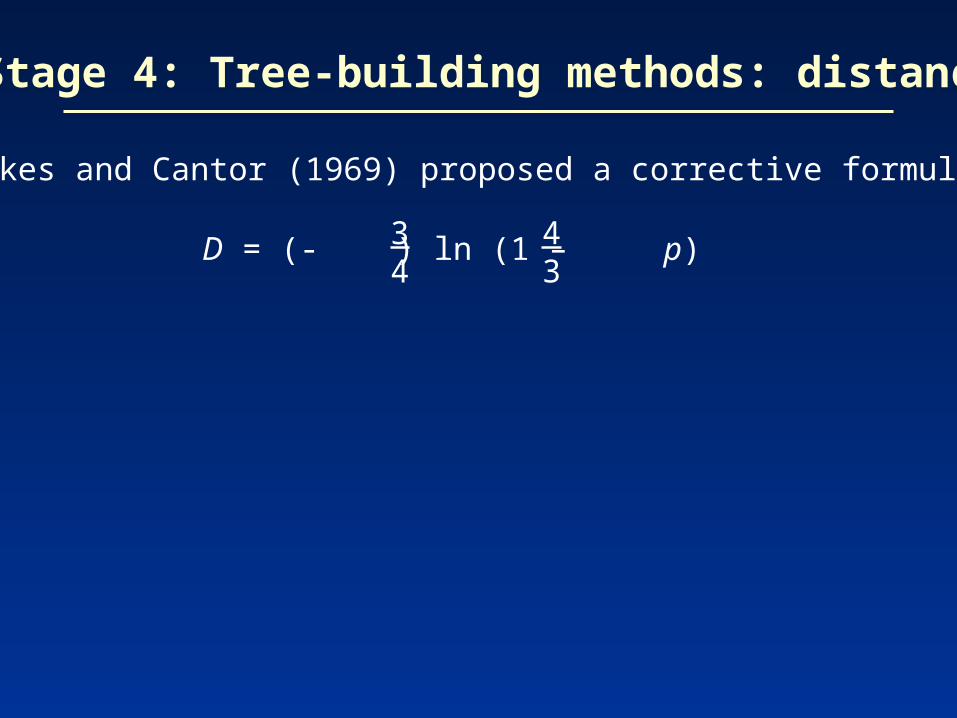
Jukes and Cantor (1969) proposed a corrective formula:
D = (- ) ln (1 – p)34
43
This model describes the probability that one nucleotidewill change into another. It assumes that each residue is equally likely to change into any other (i.e. the rate oftransversions equals the rate of transitions). In practice,the transition is typically greater than the transversionrate.

Models of nucleotide substitution
A G
T C
transition
transition
transversiontransversion

A
Jukes and Cantor one-parameter model of nucleotide substitution (=)
G
T C

A
Kimura model of nucleotide substitution (assumes ≠ )
G
T C
Stage 4: Tree-building methods: distance
Jukes and Cantor (1969) proposed a corrective formula:
D = (- ) ln (1 – p)34
43

Stage 4: Tree-building methods: distance
Jukes and Cantor (1969) proposed a corrective formula:
D = (- ) ln (1 – p)34
43
Consider an alignment where 3/60 aligned residues differ.The normalized Hamming distance is 3/60 = 0.05.The Jukes-Cantor correction is
D = (- ) ln (1 – 0.05) = 0.05234
43
When 30/60 aligned residues differ, the Jukes-Cantor correction is more substantial:
D = (- ) ln (1 – 0.5) = 0.8234
43

Each model can affect the topology and branch lengths of the tree
p-distance correction

Poisson correction
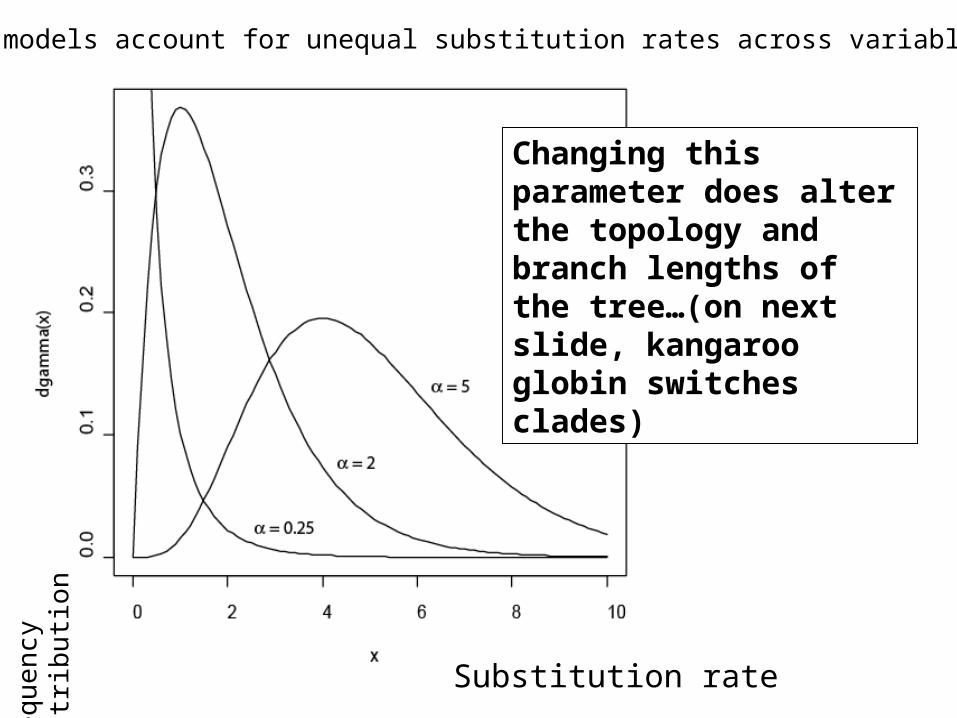
Gamma models account for unequal substitution rates across variable sites
Changing this parameter does alter the topology and branch lengths of the tree…(on next slide, kangaroo globin switches clades)
Substitution rate
Fre
quen
cy
dist
ribu
tion

= 0.25
= 1
= 5
[1] Selection of sequences for analysis
[2] Multiple sequence alignment
[3] Selection of a substitution model
[4] Tree building
[5] Tree evaluation
Five stages of phylogenetic analysis

Distance-based methods involve a distance metric,such as the number of amino acid changes betweenthe sequences, or a distance score. Examples ofdistance-based algorithms are UPGMA and neighbor-joining.
Character-based methods include maximum parsimonyand maximum likelihood. Parsimony analysis involvesthe search for the tree with the fewest amino acid(or nucleotide) changes that account for the observeddifferences between taxa.
Stage 4: Tree-building methods

We can introduce distance-based and character-based tree-building methods by referring to a group of orthologous globin proteins.
Stage 4: Tree-building methods


Distance-based treeCalculate the pairwise alignments;if two sequences are related,put them next to each other on the tree

Character-based tree: identify positions that best describe how characters (amino acids) are derived from common ancestors
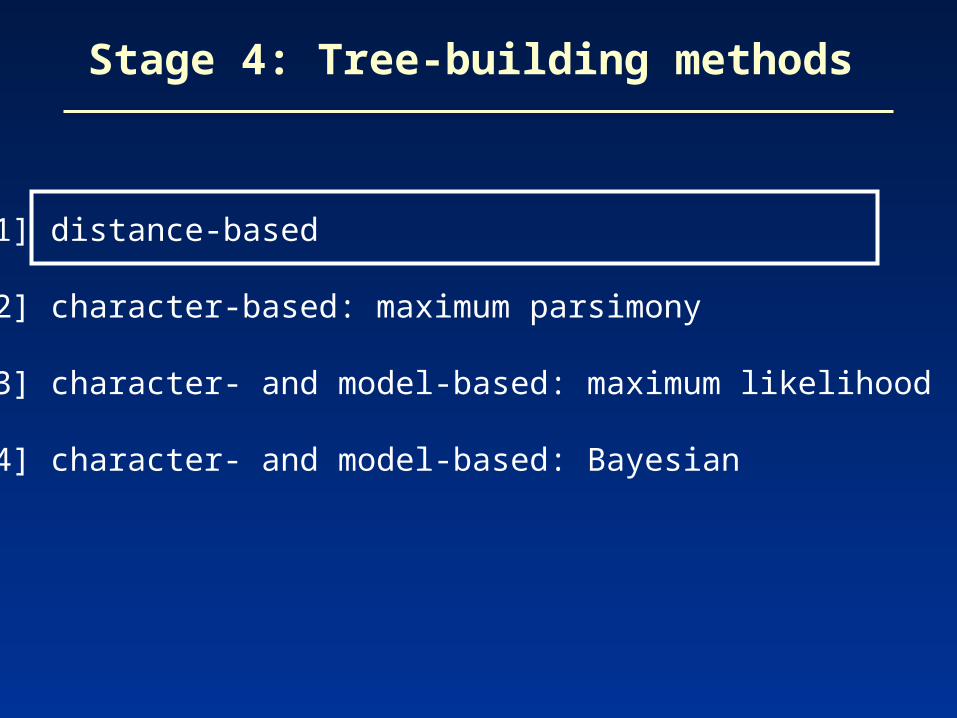
[1] distance-based
[2] character-based: maximum parsimony
[3] character- and model-based: maximum likelihood
[4] character- and model-based: Bayesian
Stage 4: Tree-building methods

How to use MEGA to make a tree
[1] Enter a multiple sequence alignment (.meg) file[2] Under the phylogeny menu, select one of these four methods…
Neighbor-Joining (NJ)Minimum Evolution (ME)Maximum Parsimony (MP)UPGMA
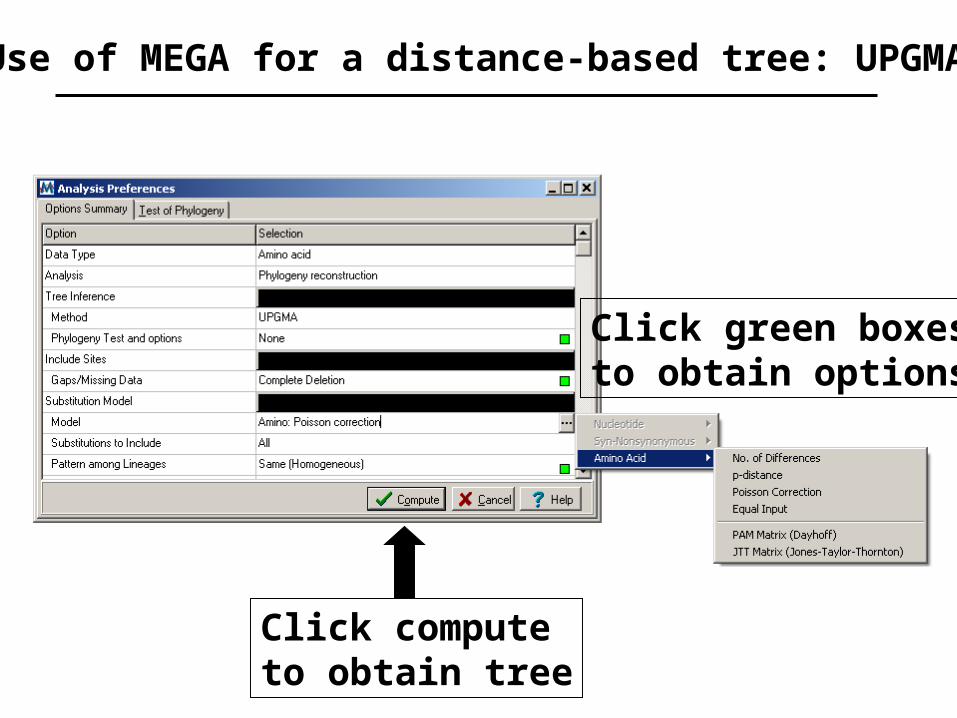
Use of MEGA for a distance-based tree: UPGMA
Click computeto obtain tree
Click green boxesto obtain options

Use of MEGA for a distance-based tree: UPGMA

Use of MEGA for a distance-based tree: UPGMA
Flipping branches around a node createsan equivalent topology

Tree-building methods: UPGMA
UPGMA is unweighted pair group methodusing arithmetic mean
1 2
3
4
5
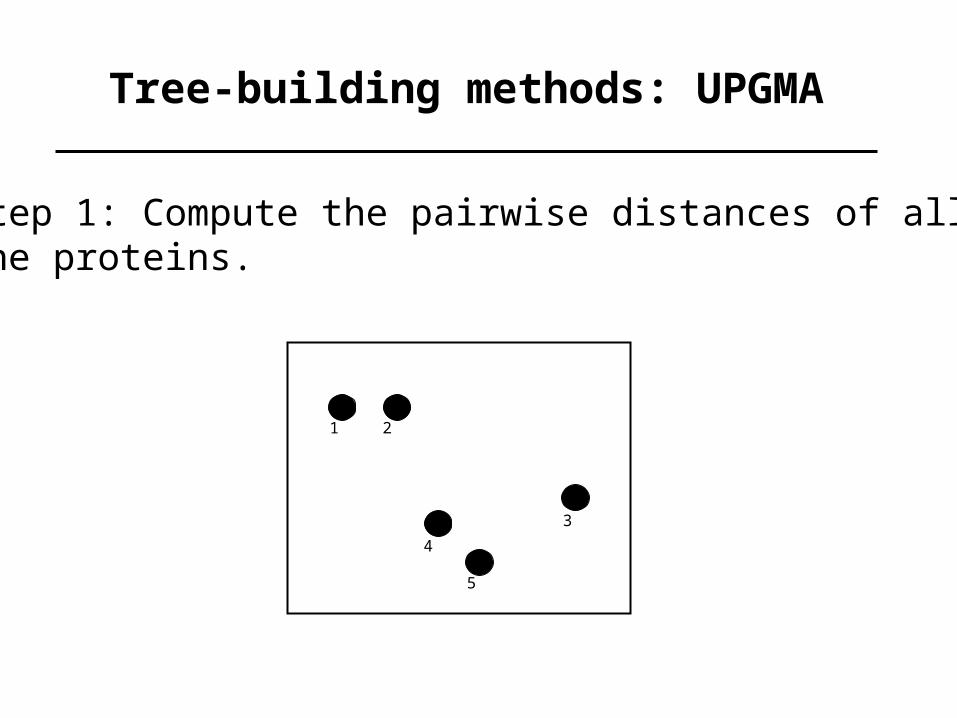
Tree-building methods: UPGMA
Step 1: Compute the pairwise distances of allthe proteins.
1 2
3
4
5

Tree-building methods: UPGMA
Step 2: Find the two proteins with the smallest pairwise distance. Cluster them.
1 2
3
4
5
1 2
6

Tree-building methods: UPGMA
Step 3: Do it again. Find the next two proteins with the smallest pairwise distance. Cluster them.
1 2
3
4
5
1 2
6
4 5
7
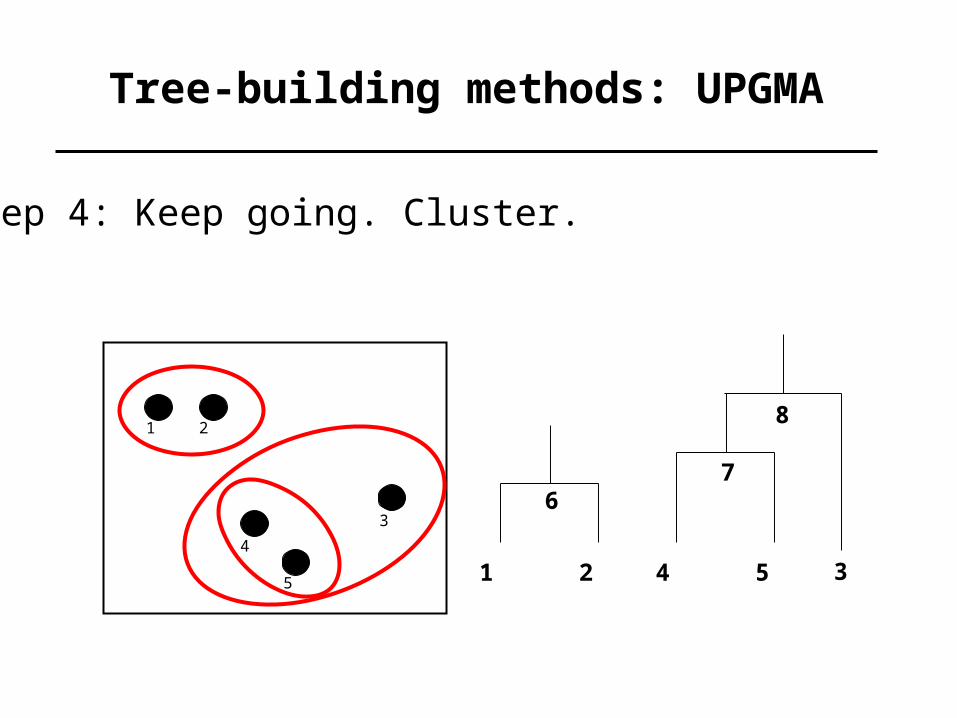
Tree-building methods: UPGMA
Step 4: Keep going. Cluster.
1 2
3
4
5 1 2
6
4 5
7
3
8
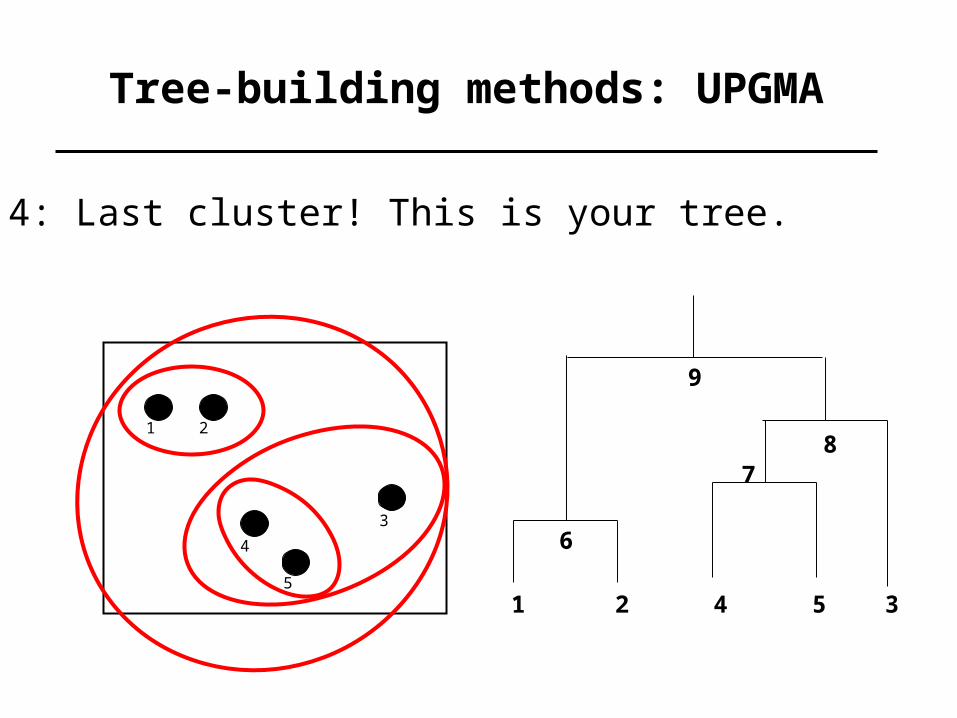
Tree-building methods: UPGMA
Step 4: Last cluster! This is your tree.
1 2
3
4
5
1 2
6
4 5
7
3
8
9

UPGMA is a simple approach for making trees.
• An UPGMA tree is always rooted.• An assumption of the algorithm is that the molecular clock is constant for sequences in the tree. If there are unequal substitution rates, the tree may be wrong.• While UPGMA is simple, it is less accurate than the neighbor-joining approach (described next).
Distance-based methods: UPGMA trees

The neighbor-joiningmethod of Saitou and Nei(1987) Is especially usefulfor making a tree having a large number of taxa.
Begin by placing all the taxa in a star-like structure.
Making trees using neighbor-joining

Tree-building methods: Neighbor joining
Next, identify neighbors (e.g. 1 and 2) that are most closelyrelated. Connect these neighbors to other OTUs via aninternal branch, XY. At each successive stage, minimizethe sum of the branch lengths.

Tree-building methods: Neighbor joining
Define the distance from X to Y by
dXY = 1/2(d1Y + d2Y – d12)
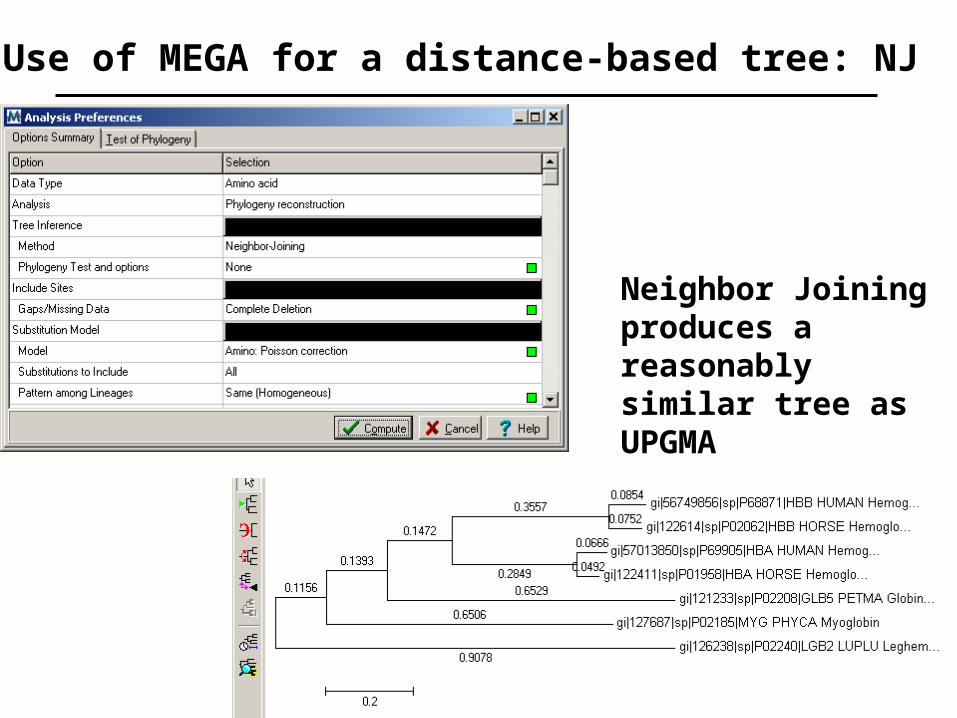
Use of MEGA for a distance-based tree: NJ
Neighbor Joining produces areasonably similar tree asUPGMA
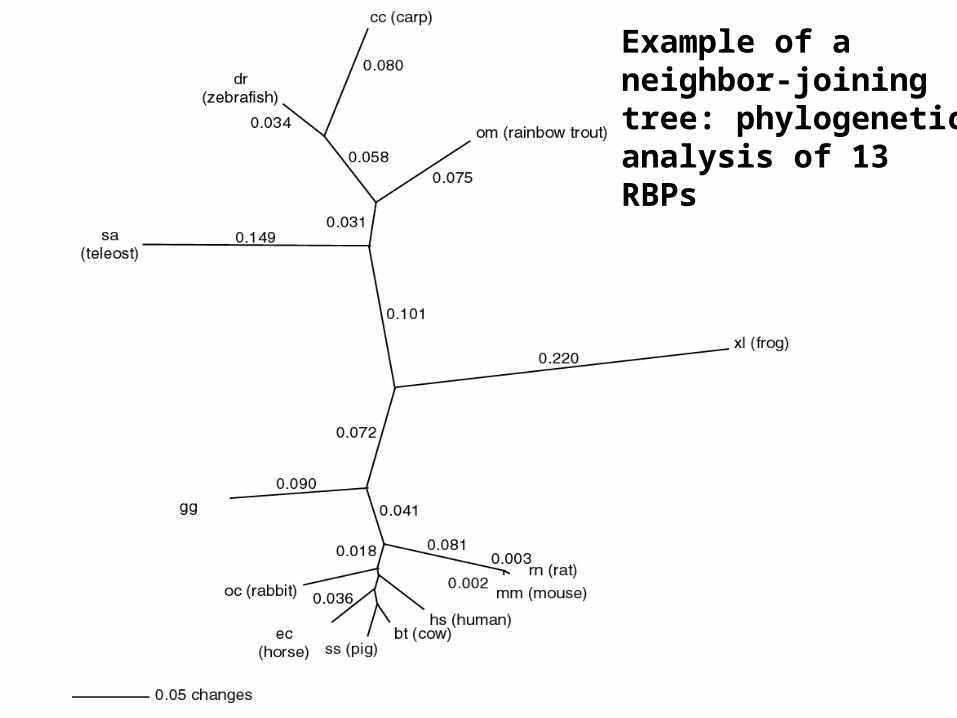
Example of aneighbor-joiningtree: phylogeneticanalysis of 13RBPs

We will discuss four tree-building methods:
[1] distance-based
[2] character-based: maximum parsimony
[3] character- and model-based: maximum likelihood
[4] character- and model-based: Bayesian
Stage 4: Tree-building methods

Tree-building methods: character based
Rather than pairwise distances between proteins,evaluate the aligned columns of amino acidresidues (characters).

The main idea of character-based methods is to findthe tree with the shortest branch lengths possible.Thus we seek the most parsimonious (“simple”) tree.
• Identify informative sites. For example, constant characters are not parsimony-informative.
• Construct trees, counting the number of changesrequired to create each tree. For about 12 taxa orfewer, evaluate all possible trees exhaustively; for >12 taxa perform a heuristic search.
• Select the shortest tree (or trees).
Making trees using character-based methods

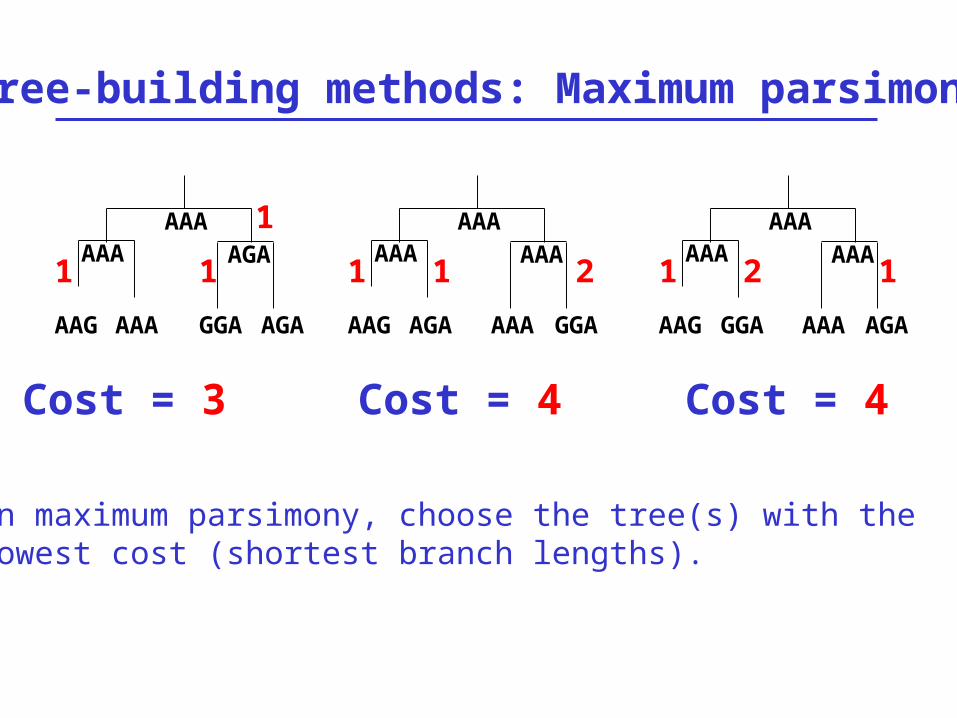
As an example of tree-building using maximum parsimony, consider these four taxa:
AAGAAAGGAAGA
How might they have evolved from a common ancestor such as AAA?
AAG AAA GGA AGA
AAAAAA
1 1AGA
AAG AGA AAA GGA
AAAAAA
1 2AAA
AAG GGA AAA AGA
AAAAAA
1 1AAA
1 2
Tree-building methods: Maximum parsimony
Cost = 3 Cost = 4 Cost = 4
1
In maximum parsimony, choose the tree(s) with the lowest cost (shortest branch lengths).

MEGA for maximum parsimony (MP) trees
Options include heuristic approaches,and bootstrapping

MEGA for maximum parsimony (MP) trees
In maximum parsimony, there may be more than one treehaving the lowest total branch length. You may computethe consensus best tree.

MEGA for maximum parsimony (MP) trees
Bootstrap values show the percent of times each cladeis supported after a large number (n=500) of replicatesamplings of the data.
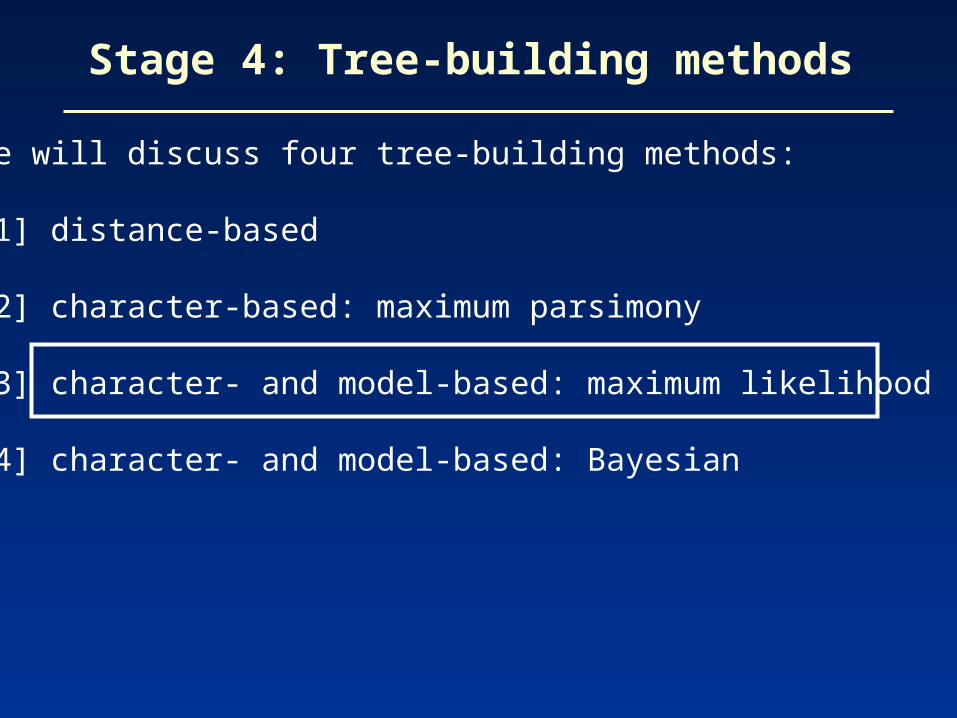
We will discuss four tree-building methods:
[1] distance-based
[2] character-based: maximum parsimony
[3] character- and model-based: maximum likelihood
[4] character- and model-based: Bayesian
Stage 4: Tree-building methods
Maximum likelihood is an alternative to maximumparsimony. It is computationally intensive. A likelihoodis calculated for the probability of each residue inan alignment, based upon some model of thesubstitution process.
What are the tree topology and branch lengths that have the greatest likelihood of producing the observed data set?
ML is implemented in the TREE-PUZZLE program,as well as PAUP and PHYLIP.
Making trees using maximum likelihood

(1) Reconstruct all possible quartets A, B, C, D. For 12 myoglobins there are 495 possible quartets.
(2) Puzzling step: begin with one quartet tree. N-4 sequences remain. Add them to the branches systematically, estimating the support for each internal branch. Report a consensus tree.
Maximum likelihood: Tree-Puzzle
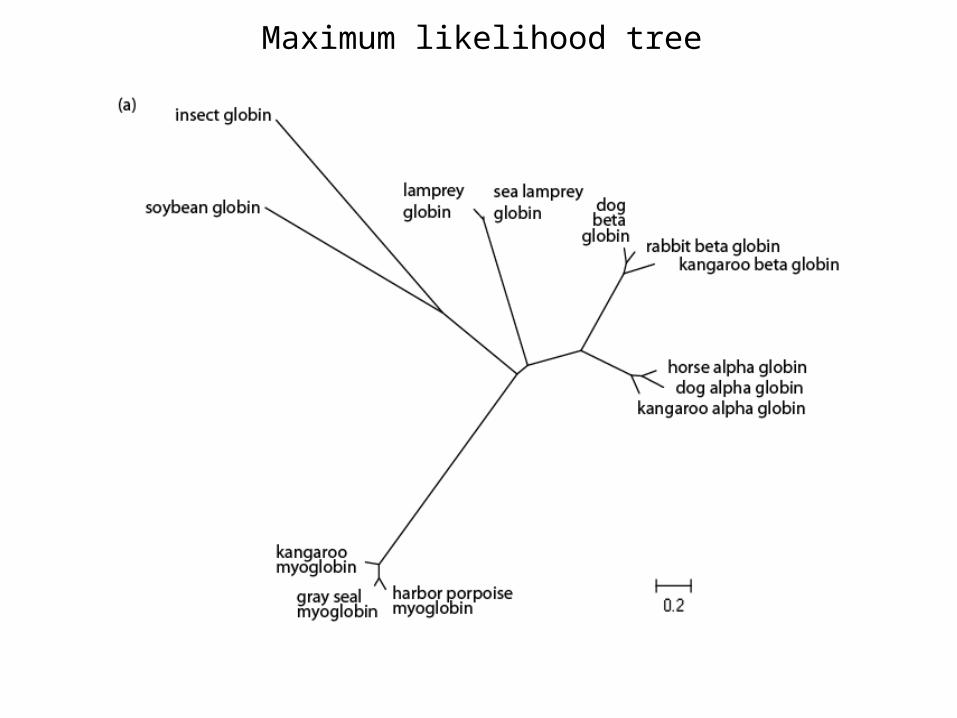
Maximum likelihood tree

Quartet puzzling
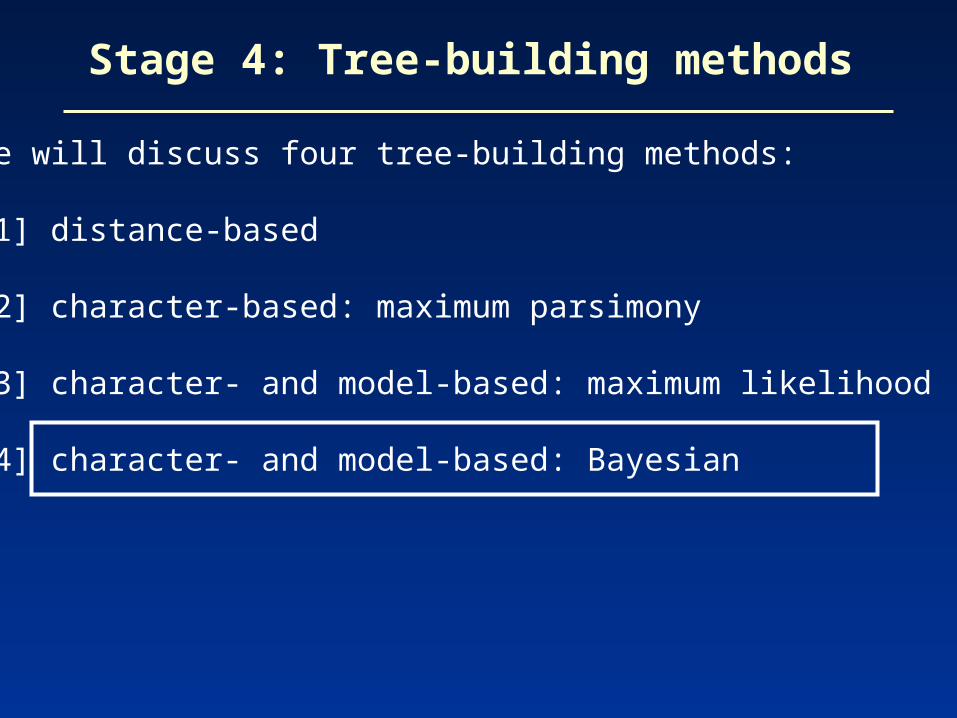
We will discuss four tree-building methods:
[1] distance-based
[2] character-based: maximum parsimony
[3] character- and model-based: maximum likelihood
[4] character- and model-based: Bayesian
Stage 4: Tree-building methods
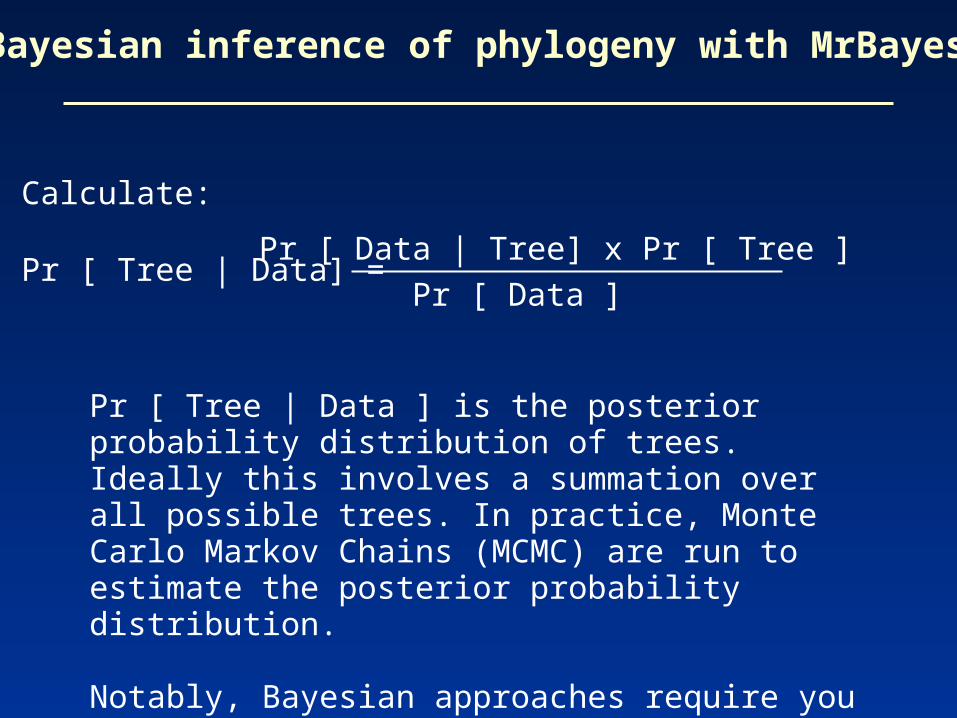
Calculate:
Pr [ Tree | Data] =
Bayesian inference of phylogeny with MrBayes
Pr [ Data | Tree] x Pr [ Tree ]
Pr [ Data ]
Pr [ Tree | Data ] is the posterior probability distribution of trees. Ideally this involves a summation over all possible trees. In practice, Monte Carlo Markov Chains (MCMC) are run to estimate the posterior probability distribution.
Notably, Bayesian approaches require you to specify prior assumptions about the model of evolution.

[1] Selection of sequences for analysis
[2] Multiple sequence alignment
[3] Selection of a substitution model
[4] Tree building
[5] Tree evaluation
Five stages of phylogenetic analysis

Bootstrapping is a commonly used approach tomeasuring the robustness of a tree topology.Given a branching order, how consistently doesan algorithm find that branching order in a randomly permuted version of the original data set?
To bootstrap, make an artificial dataset obtained by randomly sampling columns from your multiple sequence alignment. Make the dataset the same size as the original. Do 100 (to 1,000) bootstrap replicates.Observe the percent of cases in which the assignmentof clades in the original tree is supported by the bootstrap replicates. >70% is considered significant.
Stage 5: Evaluating trees: bootstrapping

In 61% of the bootstrapresamplings, ssrbp and btrbp(pig and cow RBP) formed adistinct clade. In 39% of the cases, another protein joinedthe clade (e.g. ecrbp), or oneof these two sequences joinedanother clade.