Journal of Anxiety Disorders 22 (2008) 622–634
Physiological correlates of eye movement desensitization
and reprocessing
Ulf O.E. Elofsson a,*, Bo von Scheele b, Tores Theorell a, Hans Peter Sondergaard a
a National Institute for Psychosocial Factors and Health (IPM) & Karolinska Institutet, Stockholm, Swedenb Institute for Psychophysiological Behavioral Medicine, Soderhamn, Sweden
Received 15 January 2007; received in revised form 23 May 2007; accepted 31 May 2007
Abstract
Eye movement desensitization and reprocessing (EMDR) is an established treatment for post-traumatic stress disorder (PTSD).
However, its working mechanism remains unclear. This study explored physiological correlates of eye movements during EMDR in
relation to current hypotheses; distraction, conditioning, orienting response activation, and REM-like mechanisms.
During EMDR therapy, fingertip temperature, heart rate, skin conductance, expiratory carbon dioxide level, and blood pulse
oximeter oxygen saturation, were measured in male subjects with PTSD. The ratio between the low and high frequency components
of the heart rate power spectrum (LF/HF) were computed as measures of autonomic balance. Respiratory rate was calculated from
the carbon dioxide trace.
Stimulation shifted the autonomic balance as indicated by decreases in heart rate, skin conductance and LF/HF-ratio, and an
increased finger temperature. The breathing frequency and end-tidal carbon dioxide increased; oxygen saturation decreased during
eye movements.
In conclusion, eye movements during EMDR activate cholinergic and inhibit sympathetic systems. The reactivity has
similarities with the pattern during REM-sleep.
# 2007 Elsevier Ltd. All rights reserved.
Keywords: Eye movement desensitization and reprocessing; Post-traumatic stress disorder; Orienting response; Autonomic physiology; Heart rate
variability; Respiration
1. Introduction
Since its inception 1988, eye movement desensitiza-
tion and reprocessing (EMDR) has provoked much
discussion. It is, however, an established treatment
modality for post-traumatic stress disorder (PTSD), and
has been shown to be roughly equally effective in
* Corresponding author at: Eksatravagen 128, SE-756 55 Uppsala,
Sweden. Tel.: +46 18 462610; fax: +46 8 344143.
E-mail address: [email protected]
(U.O.E. Elofsson).
0887-6185/$ – see front matter # 2007 Elsevier Ltd. All rights reserved.
doi:10.1016/j.janxdis.2007.05.012
comparison with behavioral exposure treatment (Brad-
ley, Greene, Russ, Dutra, & Westen, 2005). If the
treatment is indeed effective, the question arises whether
the eye movements per se are necessary for the effect.
This has lead to investigations where subjects have been
treated with the EMDR protocol minus eye movements.
This has shown diverging results. Renfrey and Spates
(1994), discussed in Cahill, Carrigan, and Frueh (1999),
for instance, did not find any added effect of eye
movements on therapeutic effect. However, Wilson et al.
found that eye movements were effective, compared with
two control conditions (Wilson, Silver, Covi, & Foster,
1996).

U.O.E. Elofsson et al. / Journal of Anxiety Disorders 22 (2008) 622–634 623
The hypotheses regarding the putative effect of eye
movements have been manifold; it has been suggested
that the eye movements during the procedure fits in a
model of ‘‘respondent conditioning, emotional inter-
ference with learning, and operant conditioning’’; in
other words that conditioning and distraction plays a
major role during the treatment (Dyck, 1993).
Alternatively, it has been proposed that dual attention
stimulation elicits the orienting response (Armstrong
& Vaughan, 1996) and thus reduces avoidance and
allows entry of new trauma-related information into
the cognitive processing system. The orienting
response is elicited by novel stimuli of any kind,
and is characterized physiologically by a lower
threshold for sensory stimuli and an initial inhibition
of bodily functions that might disturb the perception
of stimuli; respiration and heart rate is lowered,
skin conductance is increased, and skin temperature
goes down due to peripheral vasoconstriction
(Ohman, Hamm, & Hugdahl, 2000). The orienting
response is also characterized by a fast habituation. In
addition, Stickgold has recently suggested that eye
movement stimulation, possibly through repeated
orienting responses, produce a neurobiological state,
similar to that of ‘Rapid Eye Movement’-
sleep (REM-sleep), which in turn might involve
cortical integration of traumatic memories (Stickgold,
2002).
One way of exploring the hypotheses is to study
physiological correlates during EMDR sessions. Few
previous studies have looked at physiological effects of
eye movement stimulation, especially in naturalistic
settings. Wilson et al. reported changed respiration,
decreased heart rate, and decreased skin conductance
during EMDR-treatment compared with two control
conditions (Wilson et al., 1996). Similarly, Barrowcliff
et al. found that eye movements, compared with two
control conditions, significantly reduced skin conduc-
tance during exposure to white noise (Barrowcliff, Gray,
MacCulloch, Freeman, & MacCulloch, 2003), and Sack
has presented a study of heart rate during EMDR-
treatment wherein heart rate dropped during eye
movements (Sack, 2005).
The present study aimed at studying physiological
effects of eye movements during EMDR-treatment of
chronic PTSD. Physiological variables to measure were
chosen on the basis that they could be non-invasively
measured, without severe interference with the treat-
ment, and because they are commonly used as indexes
for de-arousal and/or are expected to be involved in the
physiological pathways active in the proposed working
models of EMDR.
2. Methods and materials
2.1. Participants
The present study included 13 male refugees, with a
mean age of 37.5 years (S.D. = 5.5). They were all
diagnosed with PTSD, and were distressed by memories
of traumatic events, typically after torture and/or war
experiences. The Clinician Administered PTSD Scale
(CAPS) diagnostic instrument for PTSD (Blake et al.,
1995) was used for assessment, and the participants’
mean score on the CAPS interview was 72.7 points
(S.D. = 13.5). In the assessment of PTSD, DSM-IV
criteria were used, as well as the requirement that a
symptom was present at least once a week and with an
intensity of at least 2 (moderate). Diagnosis and
treatment was carried out by the last author.
The patients were included in the study if they had 10
or more previous treatment sessions without recovery
(in order to avoid subjects with spontaneous recovery)
and were without organic brain disorder, substance
abuse, psychosis, or suicidality.
2.2. Procedures
Before the EMDR-treatment began, electrodes and
sensors were placed and the physiological variables
were allowed to stabilize (ideally a flat trend curve).
The EMDR-treatment essentially followed the
guidelines outlined by Shapiro (1995). In short, the
treatment protocol consists of three phases. During the
Target assessment phase, the distressing issue or
memory to be assessed during the session is presented
and the most vivid image of the memory is identified (as
well as related emotions and body sensations). The
therapist also obtains the client’s negative belief about
the event together with a desired positive cognition for
this same event. A validity of cognition (VoC) rating is
used to estimate the validity of the positive cognition
(on a 1–7 scale, where 1 represents completely false and
7 completely true). The degree of anxiety/disturbance
that the picture/feeling/sensation/cognition evokes is
rated by a Subjective Units of Distress Scale (SUDS)
from 0 to 10, where 0 represents no distress and 10
represents the highest distress possible. Next the actual
EMDR reprocessing procedures are applied during the
Desensitization phase. The client is instructed to focus
on the image, negative thought, and body sensations,
while following the therapists upraised two fingers as
they move from side to side. The client is then asked to
‘‘Blank it out and take a deep breath’’, and pause for a
moment to report their experience and level of

U.O.E. Elofsson et al. / Journal of Anxiety Disorders 22 (2008) 622–634624
disturbance on a SUD scale. Based on patient feedback,
focus is directed to new images, feelings, or body
sensations as such arise and the stimulation sets are
repeated until desensitization is complete, as indicated
by a SUD’s rating of 0 or 1, or no progress is reported.
Finally, during the Installation phase, the desired
cognition is concentrated upon during the eye move-
ments until a VoC rating of 6 or 7 (completely true) is
obtained (or no progress is reported). This cognition and
the original issue are then linked together during the eye
movements by keeping both in mind, and finally a body
scan is completed, checking for any negative body
sensations. If there are any signs of tension, the eye
movements are again induced, while the client
concentrates on these sensations until they have
dissipated. If SUDs do not decrease sufficiently, the
patient is stabilized with the ‘‘safe place’’ procedure
before the session is ended.
2.3. Physiological assessment
The physiological variables measured were fingertip
skin temperature (FT), heart rate (HR), skin conduc-
tance (SC), expiratory carbon dioxide levels (CO2), and
blood pulse oximeter oxygen saturation (SpO2). Data
was sampled using the I-330 DSP12 physiologic
monitoring system (J&J Engineering Inc., Poulsbo,
WA, USA) and a customized software application
developed in the PDS-environment (J&J Engineering
Inc.). All variables where stored at 1 s intervals.
CO2 and SpO2 were obtained using a Capnocheck1
Plus oxycapnometer (Sims Bci Inc., Waukesha, WI,
USA). Oxygen saturation was measured photometri-
cally with a sensor on the patient’s left middle finger.
Expiratory CO2 was collected from the left nostril using
a nasal catheter (6 in. � 1/8 in. � 1/323 in.) which was
attached to the distal end of the capnometer sample line.
End-tidal CO2 (EtCO2) and respiration rate (RR)
were computed using the recorded CO2 wave data.
FT was measured with a thermistor taped to the right
little finger tip.
Skin conductance was recorded by means of constant
voltage using Ag/AgCl-electrodes placed on the second
phalanx of the patient’s right index finger and ring
finger.
Electrocardiogram (ECG) data were sampled at
256 Hz with two Ag/AgCl electrodes placed on the
patient’s wrists. The HR was computed by the hardware
based on interbeat data obtained from the ECG trace.
Indices of sympathetic and parasympathetic drives
were obtained from frequency analysis of the heart rate
variability. Frequency analysis was made on mean value
subtracted HR data using the periodogram function of
the signal analysis tool pack library in the Matlab ver. 6
suite (MathWorks, Natick, MA, USA). Obtained power
spectra were divided into spectral bands and the powers
in the low frequency band (LF: 0.04–0.15 Hz) and in the
high frequency band (HF: 0.15–0.40 Hz) were calcu-
lated by integrating the power spectral density in the
respective frequency bands. After normalization by
dividing the obtained band power with total power
minus the very low frequency band power (VLF: 0.003–
0.04), LF/HF-ratios were calculated as estimates of
sympathovagal balance (Malliani, Pagani, Lombardi, &
Cerutti, 1991).
Data were manually controlled for artifacts and with
regard to heart rate, ectopic or premature heart beats
were identified using an automatized detection method.
Artifacts were rejected from the data stream based on
individual criteria for each variable, i.e. for oxygen
saturation, temperature, and skin conductance, a
number of artifacts were caused by glitching sensors
that were easily detected through obvious non-
physiological changes. For heart rate, corrections were
carried out if it was possible to establish a firm rule for
the imputation. Regarding heart rata data, an automatic
iterative filter was applied that replaced data points
deviating more than 20% from the mean of the
surrounding values. A maximum of 5% erroneous
values at single data points were accepted.
2.4. Data analysis
To be included in the analysis a treatment session had
to meet the following criteria: (i) include an at least 50 s
long period of stable physiological recordings preced-
ing the assessment phase; (ii) include an at least 50 s
long period of physiological recordings occurring at
least 60 s after the ending of the installation phase; (iii)
contain a minimum of four stimulation sets that are at
least 50 s in length and preceded by likewise 50 s long
phases of no stimulation; (iv) have at least four
stimulation sets with a duration of 50 s or longer that are
followed by 50 s or more of no stimulation; and (v) have
an installation phase that does not include ‘‘safe place’’-
procedures.
In order to assess physiological changes during eye
movement stimulation, the following measurement
periods were defined: (A) a 50 s long sequence
occurring after the variables had stabilized but before
the assessment phase had begun (Baseline, BL); (B)
final 30 s prior to stimulation (Pre-stimulation, PRE);
(C) first 50 s of ongoing stimulation (Stimulation, S);
(D) final 30 s of stimulation (Stimulation end, SE); (E)

U.O.E. Elofsson et al. / Journal of Anxiety Disorders 22 (2008) 622–634 625
50 s following stimulation (Post-stimulation, POST);
(F) a 50 s long sequence occurring at least 60 s after the
installation phase had ended (Post-baseline, POSTBL).
Periods B–E were further divided into 10 s long
segments.
First, mean response time-courses were calculated
for each session, from 30 s prior to the onset of
stimulation sets (B) until 50 s post-onset (C) and from
last 30 s of stimulation (D) until 50 s post-stimulation
(E). Treatment sessions means were further combined
into individual means for each participant.
Since data are obtained from repeated stimulation
sets, measurements from the pre-onset baseline values
(B and D) collected during the 30 s prior to stimulation-
onset can be contaminated by the tail of the prior
stimulation set, and hence baseline values were only
calculated when there was at least 20 s between the end
of the prior stimulation set and the start of the 30-s pre-
onset baseline period. In order to minimize such
transitional effects data were only obtained from B/C
and D/E pairs with at least 50 s long pre-phases, thus
preventing transitional changes shorter than 20 s from
affecting the result.
The accuracy and repeatability of HRV measures in
the frequency domain obtained from ultra-short records
is questionable (Schroeder et al., 2004; Thong, Li,
McNames, Aboy, & Goldstein, 2003), although
improved if the mean of several recordings are used
(Schroeder et al., 2004). To detect a given frequency, the
signal must be observed for at least one period of this
frequency and one cannot say exactly at which time the
signal had this frequency. Because of this, recordings of
the heart rate trace are recommended to last at least 10
times the period of the lower frequency boundary of the
investigated component (Task Force of the European
Society of Cardiology the North American Society of
Pacing Electrophysiology, 1996). Due to the nature of
the EMDR protocol, with relatively short stimulation
sets, this was not achievable in the present study. Instead
HRV data was analyzed on 50 s long segments of HR
recordings. This record length equals two times the
lower frequency boundary of the LF-span. However, for
the purposes of the present study, this short recording
length was acceptable. First, the high number of
samplings reduces the error caused by the short
recording length, second, since we are not interested
in power for a specific frequency but for broader
spectra, the consequence of this error on the result is less
severe. Accordingly, LF and HF data for all phases (B–
E) had to be computed for full 50 s long periods with no
further subdivisions, as was the longest period
compatible with a sufficient sample size.
Data were analyzed using STATISTICA 6.0 (Stat-
Soft Inc.). Statistical differences were examined by
analysis of variance (ANOVA) for repeated measures,
followed by homogeneity group post hoc comparison
(Duncan, significance level set at p = 0.05) in order to
contrast BL with PostBL, baseline with session phases
and stimulation phases with pre- and post-stimulation
phases. Log transformations were applied for the
variance analysis of HRV power data.
Physiological changes over the entire EMDR
session were accessed through the comparison between
BL and PostBL levels. Furthermore, for each session
and variable a linear regression analysis was performed
on mean values of all 30 s long pre-stimulation periods
as well as for all stimulation sets from which mean
values were obtained for the interval between 20 and
50 s of stimulation (For HRV-measures full 50 s long
periods were used). In order to test for session trends the
proportion of regression slopes among all sessions of a
certain sign was compared with a hypothetical random
proportion of 0.5 with an equal number of cases using
the ‘Difference between two proportions test’ (t-test;
STATISTICA 6.0). Differences between pre- and
during-stimulation phases were assessed by applying
the same test on the proportions obtained for the pre-
stimulation and during-stimulation period, respec-
tively.
3. Results
All in all data from 13 individuals and 30 sessions
were eligible and thus included in the analysis. The
mean number of sessions included per individual was
2.27 (S.D. = 1.22; range = 1–5), with a mean session
duration of 55.0 min (S.D. = 12.96). Because of missing
values in some parameters, the degrees of freedom vary,
however. The mean number of stimulation sets per
session was 19.7 (S.D. = 11.0), with a mean stimulation
duration of 44.2 s (S.D. = 10.8) and a mean interval of
58.7 s (S.D. = 21.9). The frequency of eye movements
was typically 60 min�1 for the movement forth and
back.
3.1. Within session trends
Reported SUDs ratings showed a significant
decrease from 6.83 (S.D. = 2.57) when scored during
the assessment phase to 2.88 (S.D. = 1.87) at the end of
the EMDR-session (n = 17; t = 6.07; p < 0.0001), thus
indicating at least partial desensitization. However, of
17 treatment sessions from which both pre- and post-
EMDR scores where retrieved, complete desensitiza-
U.O.E. Elofsson et al. / Journal of Anxiety Disorders 22 (2008) 622–634626
tion (as defined by SUDs of 0–1) occurred only in three.
VoC scores increased from 4.10 (S.D. = 1.58) to 5.29
(S.D. = 1.59) over the EMDR-session (n = 14;
t = �2.65; p < 0.05).
Baseline levels before and after session treatment
differed significantly in FT and SC, both showing an
increase, and in HR, which decreased (Table 1).
However, during exposure to trauma, SC did not show
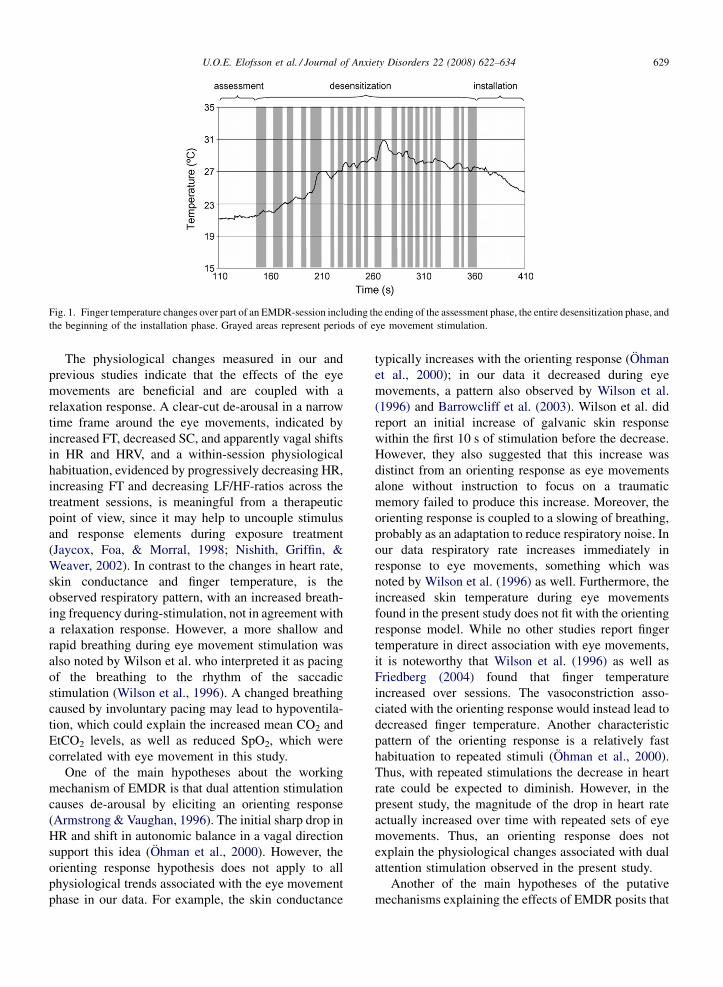
any significant trends while FT and HR did (Table 2).
The FT had stabilized before the eye movements began,
and increased consistently during the treatment phase,
as indicated by the proportion of positive regression
slopes (Fig. 1), while the HR appeared to decrease
successively more only for each eye movement
stimulation set, as indicated by a high proportion of
negative regression slopes, and not for the periods in
between.
Also the HRV measures showed significant within
treatment phase trends (Table 2). The relative balance
between LF and HF gradually shifted towards the HF
side, shown by the proportions of positive regression
slopes which were high for normalized HF and low
for normalized LF and LF/HF. As with HR, these
regressions were only apparent for stimulation
phases.
3.2. Physiological changes during-stimulation
Significant time effects were noticed for all
physiological variables (Table 1 and Fig. 2).
RR increased significantly during the stimulation
phase. On termination of the stimulation RR showed a
sharp drop and returned to baseline level. (Subjects
were asked to take a deep breath after eye move-
ments.)
The oxycapnometric measurement indicated a small
reduction in SpO2 and an increase in mean CO2 as well
as EtCO2 during eye movements.
When compared to pre-stimulation phases HR was
significantly decreased after 10 s of stimulation. The
lowered level remained during the entire stimulation
period and was immediately followed by a sharp but
transient increase in HR when the eye movements
stopped (an example of the HR changes occurring
during a stimulation set is given in Fig. 3). As
mentioned above, the drop in HR on stimulation start
appeared to become more and more pronounced as the
session progressed. The deceleration in HR was
accompanied by a change in HRV (Table 3). The
overall HR variance typically decreased and the high
frequency component became more prominent as
indicated by a decreased LF/HF.
FT showed an increase during eye movements,
indicating an increased peripheral blood flow, and
decreased slowly after the stimulation phase ended.
During-stimulation, the SC showed a pattern of
decline, indicating sympathetic nervous system de-
arousal. The transition from stimulation to post-
stimulation was characterized by a sharp increase in SC.
4. Discussion
In the present study, we have found that the eye
movements during the EMDR-procedure are accom-
panied by a number of physiological changes. At the
start of eye movements, the sympathetic drive is
decreased as indicated by a fall in skin conductance and
an increase in skin temperature, while the parasympa-
thetic/vagal influence is increased, shown by heart rate
deceleration and a changed balance between high
frequency and low frequency heart rate variability.
Respiration changes as well, the rate increases, the
mean of exhaled as well the end-tidal carbon dioxide
levels increase, and with some latency, the oxygen
saturation, measured by a photometric method,
decreases. Moreover, besides changes in immediate
association with the eye movements, within-session
trends are also found for the stimulation phases with
successively decreasing heart rate, increasing fingertip
temperature, and a decreasing LF/HF-ratio.
Few previous studies have followed physiological
changes directly linked to the eye movement stimula-
tion or across EMDR-treatment sessions. Wilson et al.
found a pattern of change during EMDR-stimulation in
accordance with the present data, with decreased HR
(during initial sets) and reduced galvanic skin response
(GSR), when applying single session EMDR-treatments
to subjects distressed by disturbing memories (Wilson
et al., 1996). The sharp increase in parasympathetic tone
(as indicated by the root mean square of successive
differences of adjacent inter-beat intervals (RMSSD))
and decrease in HR at stimulation-onset reported by
Sack are also in accordance with our findings (Sack,
2005). Furthermore, Barrowcliff et al. found that
arousal caused by white noise and measured as skin
conductance was lowered during eye movements in
comparison with a control condition (Barrowcliff et al.,
2003), and Montgomery and Ayllon found a non-
significant, but consistent, decrease in HR when
exposure was combined with saccadic eye movements
compared to exposure only in subjects meeting the
criteria for PTSD (Montgomery & Ayllon, 1994).
Dunn et al., studying physiological responses to eye
movements compared with fixed stare in a non-clinical

U.O
.E.
Elo
fsson
eta
l./Jou
rna
lo
fA
nxiety
Diso
rders
22
(20
08
)6
22
–6
34
62
7
Table 1
Mean, standard deviation and homogeneity group indication for all measured physiological variables pre- (B), during (C, D) and post- (E) dual attention stimulation sets and pre- (A) and post- (F) the
entire EMDR-session (Baselines)a
Variable Baseline Pre-stimulation Stimulation Stimulation end Post-stimulation Main effects
(variable � phase)
A
BL
F
PostBL
B1 �30
to 20 s
B2 �20
to 10 s
B3 �10
to 0 s
C1
0–10 s
C2
10–20 s
C3
20–30 s
C4
30–40 s
C5
40–50 s
D1 �30
to 20 s
D2 �20
to 10 s
D3 �10
to 0 s
E1
0–10 s
E2
10–20 s
E3
20–30 s
E4
30–40 s
E4
40–50 s
F (d.f.) P-value
CO2 (%) 2.95 2.94 2.86 2.85 2.83 3.00 2.98 3.02 3.02 3.08 3.02 2.98 3.03 2.76 2.90 2.89 2.84 2.79 1.78 (10) 0.03
0.41 0.43 0.46 0.46 0.35 0.40 0.50 0.47 0.49 0.49 0.51 0.52 0.51 0.51 0.67 0.61 0.56 0.52
bc abc abc abc ab bc abc bc bc cb bc abc bc ab,c abc abc abc ab
EtCO2 (%) 4.62 4.48 4.61 4.58 4.51 4.57 4.72 4.78 4.81 4.90 4.81 4.73 4.63 4.54 4.49 4.57 4.61 4.57 2.61 (10) 0.001
0.19 0.52 0.40 0.38 0.34 0.31 0.30 0.27 0.34 0.50 0.46 0.31 0.19 0.27 0.54 0.32 0.22 0.40
abcd a abcd abcd ab abcd bcde cdeb deb eb,c de bcde abcd abcb abb abcd abcd abcd
RR (bpm) 15.72 15.38 15.23 15.71 16.45 17.44 18.44 18.49 19.51 19.78 19.50 19.82 20.31 19.75 16.13 15.90 15.10 16.50 4.92 (10) <0.001
4.02 4.04 2.80 2.64 2.23 3.49 4.37 4.43 4.02 3.99 4.08 4.56 4.67 3.79 3.20 3.37 3.93 3.69
ab abc a a ab abcd bcdeb bcdeb cdeb,c deb,c cdec dec ec dec abb abb ab abb
SpO2 (%) 95.27 95.65 95.10 95.05 95.17 95.11 95.07 94.95 94.83 94.97 94.89 94.91 94.92 94.88 94.68 95.01 95.26 95.23 2.10 (10) 0.008
0.97 0.90 0.77 0.86 0.86 0.82 0.91 1.19 1.36 1.22 1.26 1.13 1.15 1.14 1.06 0.64 0.66 0.81
cd d abc abc abcd abc abc abc abc abc abc abc abc abc ac abc bcd bcd
HR (bpm) 81.52 77.97 78.99 78.95 79.49 78.77 77.60 77.79 77.30 77.68 77.45 77.37 77.14 78.87 79.30 77.66 77.46 78.71 2.86 (12) <0.001
10.27 7.70 9.43 9.01 9.05 9.52 9.20 9.58 9.53 9.41 9.73 9.90 9.79 9.85 9.21 9.28 9.12 8.74
a bcdec bcdc bcdec bc bcdec cdeb,c bcdec deb,c bcdec deb,c deb,c eb,c bcdec bcc cdeb,c deb,c bcdec
SC (mMho) 12.70 14.02 14.03 14.00 13.91 13.74 13.62 13.52 13.27 14.02 13.46 13.43 13.43 13.54 13.81 13.85 13.76 13.94 6.06 (12) <0.001
5.09 6.10 6.13 6.10 5.98 5.83 5.72 5.66 5.58 6.10 5.69 5.72 5.67 5.69 5.84 5.88 5.85 6.05
a dc cc cc cc cc bcc bcc bcc bb,c bcc bcc bcc bcc cc cc bcc cc
FT (8C) 30.60 30.94 31.34 31.29 31.25 31.28 31.35 31.45 31.56 31.65 31.44 31.46 31.51 31.54 31.47 31.44 31.42 31.39 8.90 (12) <0.001
3.19 2.77 3.01 3.01 2.99 2.98 2.95 2.96 2.97 2.99 2.88 2.88 2.90 2.89 2.89 2.91 2.96 2.92
a bc cdec cdec cc cdc cdec cdefc efb,c fb,c cdefc cdefc cdefc defc cdefc cdefc cdefc cdefc
Duncan post hoc test; significance level set at p = 0.05.a ANOVA with repeated measures univariate design. Phases with no common letters are significantly different from each other.b Stimulation phase differs from a pre-stimulation phase OR a post-stimulation phase differs from a stimulation phase.c Phase mean differs from the pre-baseline level.

U.O.E. Elofsson et al. / Journal of Anxiety Disorders 22 (2008) 622–634628
Table 2
Within session trends estimated by the proportion of positive linear regression slopes among all eligible sessionsa
Variable N Phase R, mean (S.D.) b, mean (S.D.) % +b P P (between)
CO2 22 Pre-stimulation 0.21 (0.16) �0.01 (0.04) 45.5 0.76 0.53
Stimulation 0.28 (0.18) 0.03 (0.09) 54.5 0.76
EtCO2 22 Pre-stimulation 0.29 (0.17) 0.01 (0.09) 54.5 0.76 0.76
Stimulation 0.36 (0.12) �0.01 (0.16) 50.0 1.00
RR 22 Pre-stimulation 0.25 (0.12) 0.02 (0.90) 36.4 0.37 0.37
Stimulation 0.29 (0.10) 0.06 (1.45) 50.0 1.00
SaO2 22 Pre-stimulation 0.35 (0.14) �0.03 (0.25) 36.4 0.37 0.13
Stimulation 0.39 (0.23) 0.11 (0.36) 59.1 0.55
HR 20 Pre-stimulation 0.38 (0.19) 0.02 (1.26) 31.6 0.26 0.04
Stimulation 0.39 (0.25) �1.54 (3.22) 5.3 0.004
SC 30 Pre-stimulation 0.47 (0.24) 0.08 (0.61) 66.7 0.20 1.00
Stimulation 0.59 (0.23) �0.05 (0.64) 66.7 0.20
FT 25 Pre-stimulation 0.54 (0.20) 0.16 (0.14) 80.0 0.03 0.71
Stimulation 0.50 (0.22) 0.18 (0.12) 84.0 0.01
Tot. power 20 Pre-stimulation 0.33 (0.25) �1.47 (5.27) 47.4 0.87 0.34
Stimulation 0.39 (0.23) �2.16 (5.67) 31.6 0.27
LF 20 Pre-stimulation 0.30 (0.21) �0.74 (2.43) 36.8 0.42 0.48
Stimulation 0.38 (0.00) �1.22 (4.24) 26.3 0.14
HF 20 Pre-stimulation 0.31 (0.25) �0.63 (3.04) 47.4 0.87 1.00
Stimulation 0.28 (0.21) �0.22 (0.67) 47.4 0.87
NLF 20 Pre-stimulation 0.29 (0.21) 0.54 (3.86) 31.6 0.27 0.04
Stimulation 0.36 (0.20) �2.82 (5.84) 5.3 0.004
NHF 20 Pre-stimulation 0.29 (0.22) �0.69 (3.75) 63.2 0.42 0.02
Stimulation 0.32 (0.21) 2.64 (6.53) 94.7 0.004
LF/HF 20 Pre-stimulation 0.28 (0.21) 0.10 (0.74) 47.4 0.87 0.006
Stimulation 0.39 (0.22) �0.,50 (0.56) 5.3 0.004
N = number of sessions included in the analysis; R = mean linear regression coefficient � the standard deviation of the mean; b = mean slope of the
regression line � the standard deviation of the mean; % +b = proportion of positive slopes; P = significance level for the comparison with a
hypothetical 50% proportion; P (between) = significance level for the comparison between the proportions obtained for pre-stimulation and
stimulation regressions, respectively. (Difference between two proportions t-test).a Within session trends for the last 30 s before the onset of dual attention stimulation (pre-stimulation) and for a 30 s long period starting 20 s into
the stimulation phase (stimulation).
sample of college students, did not present data linked
directly to stimulation sets but reported a decreased HR
from pre- to post-treatment and no significant trend in
GSR (Dunn, Schwartz, Hatfield, & Wiegele, 1996). The
same pattern of change in HR and GSR over repeated
eye movement sets was also reported by Wilson et al.
(1996). In contrast to our study, Dunn et al. did not find a
significant trend in FT (Dunn et al., 1996). However,
increasing FT across eye movement sessions have been
reported both by Wilson et al. (1996) and by Friedberg
(2004), the latter studying patients treated for fibro-
myalgia with EMD (i.e. a treatment protocol using eye
movements but which differs from EMDR in some
ways). The ambiguous results regarding the FT within-
session trend could possibly be attributed to differences
in clinical background of the subjects studied and/or to
the temporal distance between the measure taking and
the actual stimulation. As was noted in the present
study, the increase in FT was closely linked to the
saccadic eye movements and almost immediately
started to decrease when stimulation ended. Dunn
et al. compared FT readings from pre-treatment with
post-treatment measures, both obtained when the
subjects focused on a negative image, and did not
report the elapsed time from the last stimulation set to
the post-session recording. Thus, increased finger
temperature seems to be a general effect of eye
movements.
U.O.E. Elofsson et al. / Journal of Anxiety Disorders 22 (2008) 622–634 629
Fig. 1. Finger temperature changes over part of an EMDR-session including the ending of the assessment phase, the entire desensitization phase, and
the beginning of the installation phase. Grayed areas represent periods of eye movement stimulation.
The physiological changes measured in our and
previous studies indicate that the effects of the eye
movements are beneficial and are coupled with a
relaxation response. A clear-cut de-arousal in a narrow
time frame around the eye movements, indicated by
increased FT, decreased SC, and apparently vagal shifts
in HR and HRV, and a within-session physiological
habituation, evidenced by progressively decreasing HR,
increasing FT and decreasing LF/HF-ratios across the
treatment sessions, is meaningful from a therapeutic
point of view, since it may help to uncouple stimulus
and response elements during exposure treatment
(Jaycox, Foa, & Morral, 1998; Nishith, Griffin, &
Weaver, 2002). In contrast to the changes in heart rate,
skin conductance and finger temperature, is the
observed respiratory pattern, with an increased breath-
ing frequency during-stimulation, not in agreement with
a relaxation response. However, a more shallow and
rapid breathing during eye movement stimulation was
also noted by Wilson et al. who interpreted it as pacing
of the breathing to the rhythm of the saccadic
stimulation (Wilson et al., 1996). A changed breathing
caused by involuntary pacing may lead to hypoventila-
tion, which could explain the increased mean CO2 and
EtCO2 levels, as well as reduced SpO2, which were
correlated with eye movement in this study.
One of the main hypotheses about the working
mechanism of EMDR is that dual attention stimulation
causes de-arousal by eliciting an orienting response
(Armstrong & Vaughan, 1996). The initial sharp drop in
HR and shift in autonomic balance in a vagal direction
support this idea (Ohman et al., 2000). However, the
orienting response hypothesis does not apply to all
physiological trends associated with the eye movement
phase in our data. For example, the skin conductance
typically increases with the orienting response (Ohman
et al., 2000); in our data it decreased during eye
movements, a pattern also observed by Wilson et al.
(1996) and Barrowcliff et al. (2003). Wilson et al. did
report an initial increase of galvanic skin response
within the first 10 s of stimulation before the decrease.
However, they also suggested that this increase was
distinct from an orienting response as eye movements
alone without instruction to focus on a traumatic
memory failed to produce this increase. Moreover, the
orienting response is coupled to a slowing of breathing,
probably as an adaptation to reduce respiratory noise. In
our data respiratory rate increases immediately in
response to eye movements, something which was
noted by Wilson et al. (1996) as well. Furthermore, the
increased skin temperature during eye movements
found in the present study does not fit with the orienting
response model. While no other studies report finger
temperature in direct association with eye movements,
it is noteworthy that Wilson et al. (1996) as well as
Friedberg (2004) found that finger temperature
increased over sessions. The vasoconstriction asso-
ciated with the orienting response would instead lead to
decreased finger temperature. Another characteristic
pattern of the orienting response is a relatively fast
habituation to repeated stimuli (Ohman et al., 2000).
Thus, with repeated stimulations the decrease in heart
rate could be expected to diminish. However, in the
present study, the magnitude of the drop in heart rate
actually increased over time with repeated sets of eye
movements. Thus, an orienting response does not
explain the physiological changes associated with dual
attention stimulation observed in the present study.
Another of the main hypotheses of the putative
mechanisms explaining the effects of EMDR posits that

U.O.E. Elofsson et al. / Journal of Anxiety Disorders 22 (2008) 622–634630
Fig. 2. Trend data for all measured physiological variables over the onset and ending of dual attention stimulation. Data represents the average of
individual mean values for alignment points relative the starting and ending positions of eye movement stimulation sets with a resolution of 1 s.
the orienting response might lead to REM-like states
(Stickgold, 2002). According to Stickgold the eye
movements might kick-start the innate memory
processing system in the brain activated during
REM-sleep (Stickgold, 2002). This hypothesis is
plausible because PTSD patients show REM-sleep
deprivation due to extreme arousal caused by night-
mares, which tend to wake them up during REM-sleep.
Even if such a response might not be explained by the
orienting response – as assumed by Stickgold – there are

U.O.E. Elofsson et al. / Journal of Anxiety Disorders 22 (2008) 622–634 631
Fig. 3. A typical example of the heart rate (HR) pattern before (�30 to 0 s) and during (0–50 s) a dual attention stimulation set. As the stimulation
start the mean HR and overall variance decrease, and the HR variability changes.
other possibilities such as reciprocal activation by eye
movements of brain areas involved in REM-sleep.
However, apparently the patients receiving dual
attention stimulation are not sleeping, so even if dual
attention stimulation would induce a neurophysiologic
state similar to REM-sleep, it cannot be expected to
yield the full range of autonomic changes associated
with REM-sleep. Moreover, in contrast to the orienting
response, which is a well defined reflex, testable using a
Table 3
Mean value, standard deviation and homogeneity group indication for he
movement stimulation sets and before and after the entire EMDR-session
Measure Band Baseline Stimulation
Pre Post �50 to 0 s
Power, Bpm^2 Total 18.59 18.31 20.30
19.10 13.70 12.42
n.p. n.p. n.p.
LF 10.62 8.54 11.04
10.33 7.18 7.72
ab ab b
HF 4.61 1.74 2.99
8.38 1.23 3.72
n.p. n.p. n.p.
NU LF 72.29 73.49 77.32
13.75 14.45 10.58
n.p. n.p. n.p.
HF 24.77 23.50 20.01
13.10 12.70 9.65
n.p. n.p. n.p.
Ratio LF/HF 5.01 5.70 6.61
4.43 5.20 4.49
a ab bb
Abbreviations: NU = normalized units; LF = low frequency span between 0
ANOVA with repeated measure multivariate design (d.f. = 12). Phases with n
post hoc-test; significance level set at p = 0.05). n.p. = no post hoc-test pera A during-stimulation phase differs from a pre-stimulation phase or a pb A phase mean differs from the pre-baseline level.
few autonomic measures, REM-sleep is a complex state
defined in relation to other sleep stages and has no well
defined static autonomic profile. Although REM-sleep
is a predominantly parasympathetic (vagal) state
(Murali, Svatikova, & Somers, 2003; Stickgold,
2002) – reflected in a decreased cardiac activity, as
well as by lowered SC compared with wakefulness
(Kobayashi, Koike, Hirayama, Ito, & Sobue, 2003) – it
is also characterized by rapid fluctuations in autonomic
art rate variability parameters before, during and after saccadic eye
Post-stimulation Main effects
0–50 s �50 to 0 s 0–50 s F P-value
13.74 13.72 19.98 1.74 0.14
10.34 10.81 11.80
n.p. n.p. n.p.
6.78 7.05 10.46 2.92 0.02
6.34 7.16 6.99
aa aa ba
2.62 2.66 3.28 1.42 0.23
4.07 4.23 4.46
n.p. n.p. n.p.
70.27 72.78 77.45 2.07 0.08
13.44 10.81 10.50
n.p. n.p. n.p.
25.96 23.31 19.96 1.74 0.14
12.02 8.78 9.92
n.p. n.p. n.p.
4.27 4.94 6.15 2.51 0.04
2.46 2.54 3.33
aa ab ba
.04 and 0.15 Hz; HF = high frequency span between 0.15 and 0.4 Hz.
o common letters are significantly different from each other. (Duncan
formed.
ost-stimulation phase differs from a stimulation phase.

U.O.E. Elofsson et al. / Journal of Anxiety Disorders 22 (2008) 622–634632
tone (Murali et al., 2003) associated with the rapid eye
movement bursts. It is hardly surprising that studies of
heart rate variability during REM-sleep have shown
conflicting results (Monti, Medigue, Nedelcoux, &
Escourrou, 2002). Thus, the rejection or acceptance of
the REM-sleep hypothesis of EMDR is not within the
reach of the present study. Still, as a working model, the
REM-sleep hypothesis does have explanatory power
when applied to our data. One of the most consistent
pattern of REM-sleep is a depressed thermoregulatory
response, with a decreased difference between core and
peripheral temperature (Glotzbach & Heller, 2000). The
immediate increase of skin temperature during eye
movements and the decrease immediately after eye
movements support the REM-related hypothesis
because the thermoregulatory control of core-to-
peripheral temperature is suspended in REM-sleep,
and episodes of phasic REM-sleep is closely linked to
rapid temperature increases in the extremities, at least
during non-extreme ambient temperatures (Dewasmes,
Bothorel, Candas, & Libert, 1997; Henane, Buguet,
Roussel, & Bittel, 1977). Furthermore, the eye move-
ments during REM-sleep are associated with hypo-
ventilation and rapid shallow breathing (Douglas,
White, Pickett, Weil, & Zwillich, 1982; Gould et al.,
1988; Millman et al., 1988), and due to a decrease in
minute ventilation the levels of end-tidal PCO2 is
increased (Schafer & Schlafke, 1998). Also end
respiratory PO2 decreases during REM-sleep (Douglas,
White, Pickett et al., 1982), and at least patients with
respiratory disorders become more hypoxemic during
bursts of eye movements (Douglas et al., 1979; Douglas,
White, Pickett et al., 1982). The ventilatory responses to
both hypoxemia (Douglas, White, Weil, Pickett, Martin
et al., 1982) and hypercapnea (Douglas, White, Weil,
Pickett, & Zwillich, 1982) are also decreased during
REM-sleep, so the normal defenses against the
development of such states are impaired. Thus, when
comparing the typical autonomic pattern for REM-sleep
with the physiological changes observed during induced
eye movements in the present study, we find similarities
in several measured variables, including a vagal shift as
indicated by decreased heart rate and skin conductance,
a change in the respiratory pattern with an increased
frequency and a tendency for the subject to become
more hypercapnic and hypoxemic, and finally a change
in finger temperature.
Since the present study followed a naturalistic
design, without control conditions, other explanations
than the eye movements per se to the observed
physiological changes cannot be excluded; redirection
of inner focus may have physiological manifestations
and one must also consider the possibility of placebo
effects. On the other hand, placebo effects tend to
habituate; in contrast with the effects of eye movements
found in this study. At least some of the measured
parameters are likely to be affected by changes in bodily
and behavioral functions directed by the treatment
protocol. For example, between stimulation sets, the
subjects were talking, while they were silent during the
actual eye movements. Speaking is known to interfere
with cardiovascular functions as well as respiration.
Bernardi et al. found that free talking, compared to
spontaneous breathing, increased HR and LF power and
a non-significant tendency to increased total variability
(Bernardi et al., 2000). They attributed these changes to
increased respiratory rate. However, in our study the
respiratory rate increased during eye movements,
making the putative effect of silence during-stimulation
sets on at least the HRV less likely to have contributed to
the result.
This study and previous studies has demonstrated a
number of effects of eye movements during EMDR or
other conditions. Eye movements might not be
necessary for desensitization, as shown by the equally
good treatment results during behavioral exposure
(Bradley et al., 2005). However, eye movements might
involve another mechanism of desensitization, and in
consequence, might be applicable in different patient
groups who cannot tolerate behavioral exposure.
Further, the added burden of many hours of homework
associated with behavioral exposure should be con-
sidered as well (Rothbaum, Astin, & Marsteller, 2005).
It is also interesting to note that Christman et al. found
that bilateral eye movements enhance the retrieval of
episodic memories (Christman, Garvey, Propper, &
Phaneuf, 2003). This is consistent with the clinical
experience that eye movements often are accompanied
by retrieval of previously forgotten or disregarded
information. New information activated during treat-
ments sessions often serves to reframe the traumatic
experience. Other studies of the eye movement
component have indicated a reduction in negative
affect, and decrease in the vividness of negative
imagery, which may also be viewed as concomitants
of the desensitization effect observed in this study (e.g.,
Andrade, Kavanagh, & Baddeley, 1997; Barrowcliff
et al., 2003; Kavanagh, Freese, Andrade, & May, 2001;
van den Hout, Muris, Salemink, & Kindt, 2001).
In future research, it seems important to replicate this
study and see whether the eye movements can be tied
more directly to treatment effects in other groups with
PTSD. With regard to the increased breathing, increased
CO2, and decreased SpO2, it would also be interesting to
U.O.E. Elofsson et al. / Journal of Anxiety Disorders 22 (2008) 622–634 633
study metabolic activity in the brain during EMDR in
order to see whether the effects are related to increased
oxygen consumption during eye movements due to
increased brain activity, or if they are explained better
by the cholinergic shift caused by the eye movements.
The present study shows the importance of further
studies of eye movements as well as dismantling studies
of EMDR. The association of treatment effects and eye
movements or alternative stimulation have been
addressed by Wilson et al., who found no effect of a
tapping or a time interval condition on symptoms as
well as physiology (Wilson et al., 1996). Further studies
are needed to extricate the precise roles of alternative
forms of bilateral stimulation. In future studies, a
control condition leading to a shift of attention should
be included in order to examine the possibility that eye
movements are confounded by shift of attention. Brain
activity during eye movements and EMDR sessions
should be explored, however difficult that might be. It is
also desirable in future studies to compare physiological
measurements during behavioral exposure and EMDR.
Acknowledgements
Fredrik Garpe, Ulf Hansson, Solveig Eriksson
Ohman och Ingrid von Scheele are gratefully acknowl-
edged for valuable help during data collection. This
investigation was supported by a grant from The
Swedish Foundation for Health Care Sciences and
Allergy Research (The Vardal Foundation).
No funders or sponsors were involved in the
planning, design, or interpretation of the study.
The corresponding author had full access to all of the
data in the study and takes full responsibility for the
integrity of the data and the accuracy of the data analysis.
References
Andrade, J., Kavanagh, D., & Baddeley, A. (1997). Eye-movements
and visual imagery: a working memory approach to the treatment
of post-traumatic stress disorder. British Journal of Clinical
Psychology, 36, 209–223.
Armstrong, M. S., & Vaughan, K. (1996). An orienting response
model of eye movement desensitization. Journal of Behavior
Therapy and Experimental Psychiatry, 27(1), 21–32.
Barrowcliff, A. L., Gray, N. S., MacCulloch, S., Freeman, T. C. A., &
MacCulloch, M. J. (2003). Horizontal rhythmical eye movements
consistently diminish the arousal provoked by auditory stimuli.
British Journal of Clinical Psychology, 42, 289–302.
Bernardi, L., Wdowczyk-Szulc, J., Valenti, C., Castoldi, S., Passino,
C., Spadacini, G., et al. (2000). Effects of controlled breathing,
mental activity and mental stress with or without verbalization on
heart rate variability. Journal of the American College of Cardiol-
ogy, 35(6), 1469.
Blake, D. D., Weathers, F. W., Nagy, L. M., Kaloupek, D. G., Gusman,
F. D., Charney, D. S., et al. (1995). The development of a
Clinician-Administered PTSD Scale. Journal of Traumatic Stress,
8(1), 75–90.
Bradley, R., Greene, J., Russ, E., Dutra, L., & Westen, D. (2005). A
multidimensional meta-analysis of psychotherapy for PTSD.
American Journal of Psychiatry, 162(2), 214–227.
Cahill, S. P., Carrigan, M. H., & Frueh, B. C. (1999). Does EMDR work?
And if so, Why? A critical review of controlled outcome and
dismantling research. Journal of Anxiety Disorders, 13(1–2), 33.
Christman, S. D., Garvey, K. J., Propper, R. E., & Phaneuf, K. A.
(2003). Bilateral eye movements enhance the retrieval of episodic
memories. Neuropsychology, 17(2), 221–229.
Dewasmes, G., Bothorel, B., Candas, V., & Libert, J. P. (1997). A
short-term poikilothermic period occurs just after paradoxical
sleep onset in humans: characterization changes in sweating
effector activity. Journal of Sleep Research, 6(4), 252–258.
Douglas, N. J., Calverley, P. M., Leggett, R. J., Brash, H. M., Flenley,
D. C., & Brezinova, V. (1979). Transient hypoxaemia during sleep
in chronic bronchitis and emphysema. Lancet, 1(8106), 1–4.
Douglas, N. J., White, D. P., Pickett, C. K., Weil, J. W., & Zwillich, C.
W. (1982a). Respiration during sleep in normal man. Thorax, 37,
840–844.
Douglas, N. J., White, D. P., Weil, J. W., Pickett, C. K., Martin, R. J.,
Hudgel, D. W., et al. (1982b). Hypoxic ventilatory response
decreases during sleep in normal men. American Review of
Respiratory Disease, 125(3), 286–289.
Douglas, N. J., White, D. P., Weil, J. W., Pickett, C. K., & Zwillich, C.
W. (1982c). Hypercapnic ventilatory response in sleeping adults.
American Review of Respiratory Disease, 126(5), 758–762.
Dunn, T. M., Schwartz, M., Hatfield, R. W., & Wiegele, M. (1996).
Measuring effectiveness of eye movement desensitization and
reprocessing (EMDR) in non-clinical anxiety: a multi-subject,
yoked-control design. Journal of Behavior Therapy and Experi-
mental Psychiatry, 27(3), 231–239.
Dyck, M. J. (1993). A proposal for a conditioning model of eye
movement desensitization treatment for posttraumatic stress dis-
order. Journal of Behavior Therapy and Experimental Psychiatry,
24(3), 201–210.
Friedberg, F. (2004). Eye movement desensitization in fibromyalgia: a
pilot study. Complementary Therapies in Nursing & Midwifery,
10, 245–249.
Glotzbach, S. F., & Heller, H. C. (2000). Temperature regulation. In:
M. H. Kryger, T. Roth, & W. C. Dement (Eds.), Principles and
practice of sleep medicine (3rd ed., pp. 289–304). Philadelphia:
Saunders.
Gould, G. A., Gugger, M., Molloy, J., Tsara, V., Shapiro, C. M., &
Douglas, N. J. (1988). Breathing pattern and eye movement
density during REM sleep in humans. American Review of
Respiratory Disease, 138, 874–877.
Henane, R., Buguet, A., Roussel, B., & Bittel, J. (1977). Variations in
evaporation and body temperatures during sleep in man. Journal of
Applied Physiology, 42(1), 50–55.
Jaycox, L. H., Foa, E. B., & Morral, A. R. (1998). Influence of
emotional engagement and habituation on exposure therapy for
PTSD. Journal of Consulting and Clinical Psychology, 66(1),
185–192.
Kavanagh, D., Freese, S., Andrade, J., & May, J. (2001). Effects of
visuospatial tasks on desensitization to emotive memories. British
Journal of Clinical Psychology, 40(Pt 3), 267–280.
Kobayashi, R., Koike, Y., Hirayama, M., Ito, H., & Sobue, G. (2003).
Skin sympathetic nerve function during sleep—a study with

U.O.E. Elofsson et al. / Journal of Anxiety Disorders 22 (2008) 622–634634
effector responses. Autonomic Neuroscience: Basic and Clinical,
103(1–2), 121–126.
Malliani, A., Pagani, M., Lombardi, F., & Cerutti, S. (1991). Cardi-
ovascular neural regulation explored in the frequency domain.
Circulation, 84(2), 482–492.
Millman, R. P., Knight, H., Kline, L. R., Shore, E. T., Chung, D. C., &
Pack, A. I. (1988). Changes in compartmental ventilation in
association with eye movements during REM sleep. Journal of
Applied Physiology, 65(3), 1196–1202.
Montgomery, R. W., & Ayllon, T. (1994). Eye movement desensitiza-
tion across subjects: subjective and physiological measures of
treatment efficacy. Journal of Behavior Therapy and Experimental
Psychiatry, 25(3), 217–230.
Monti, A., Medigue, C., Nedelcoux, H., & Escourrou, P. (2002).
Autonomic control of the cardiovascular system during sleep in
normal subjects. European Journal of Applied Physiology, 87(2),
174–181.
Murali, N. S., Svatikova, A., & Somers, V. K. (2003). Cardiovascular
physiology and sleep. Frontiers in Bioscience, 8, 636–652.
Nishith, P., Griffin, M. G., & Weaver, T. L. (2002). Utility of the heart
rate response as an index of emotional processing in a female rape
victim with posttraumatic stress disorder. Cognitive and Beha-
vioral Practice, 9(4), 302–307.
Ohman, A., Hamm, A., & Hugdahl, K. (2000). Cognition, and the
autonomic nervous system. Orienting, anticipation, and condition-
ing. In: J Cacioppo, L. Tassinary, & G. Berntson (Eds.), Handbook
of psychophysiology. Cambridge: Cambridge University Press.
Renfrey, G., & Spates, C. R. (1994). Eye movement desensitization: a
partial dismantling study. Journal of Behavior Therapy and
Experimental Psychiatry, 25(3), 231–239.
Rothbaum, B., Astin, M., & Marsteller, F. (2005). Prolonged exposure
versus eye movement desensitization and reprocessing (EMDR)
for PTSD rape victims. Journal of Traumatic Stress, 18(6), 607–
616.
Sack, M. (2005). Alternations in autonomic tone during trauma
therapy with EMDR. Paper presented at the ISTSS annual meet-
ing.
Schroeder, E. B., Whitsel, E. A., Evans, G. W., Prineas, R. J.,
Chambless, L. E., & Heiss, G. (2004). Repeatability of heart rate
variability measures. Journal of Electrocardiology, 37(3), 172.
Schafer, T., & Schlafke, M. E. (1998). Respiratory changes associated
with rapid eye movements in normo- and hypercapnia during
sleep. Journal of Applied Physiology, 85(6), 2213–2219.
Shapiro, F. (1995). Eye movement desensitization and reprocessing:
basic principles, protocols, and procedures. New York: Guilford
Press.
Stickgold, R. (2002). EMDR: a putative neurobiological mechanism
of action. Journal of Clinical Psychology, 58(1), 61–75.
Task Force of the European Society of Cardiology the North American
Society of Pacing Electrophysiology. (1996). Heart rate variabil-
ity: standards of measurement, physiological interpretation, and
clinical use. Circulation, 93, 1043–1065.
Thong, T., Li, K., McNames, J., Aboy, M., & Goldstein, B. (2003).
Accuracy of ultra-short heart rate variability measures.. Paper
presented at the Annual International Conference of the IEEE
Engineering in Medicine and Biology.
van den Hout, M., Muris, P., Salemink, E., & Kindt, M. (2001).
Autobiographical memories become less vivid and emotional after
eye movements. British Journal of Clinical Psychology, 40(Pt 2),
121–130.
Wilson, D. L., Silver, S. M., Covi, W. G., & Foster, S. (1996). Eye
movement desensitization and reprocessing: effectiveness and
autonomic correlates. Journal of Behavior Therapy and Experi-
mental Psychiatry, 27(3), 219–229.