


2nd Mercosur Congress on Chemical Engineering
4th Mercosur Congress on Process Systems Engineering
1
PHASE EQUILIBRIA OF SOYBEAN OIL, CASTOR OIL AND THEIR
FATTY ACID ETHYL ESTERS WITH CARBON DIOXIDE AT HIGH
PRESSURES
P. M. Ndiaye1*, F. W. Tavares
1, C. Dariva
2, D. Oliveira
2, J. V. Oliveira
2
1Escola de Química - Universidade Federal do Rio de Janeiro 2Departamento de Engenharia de Alimentos – URI-Campus de Erechim
Abstract. This work provides experimental data of binary and ternary systems involving carbon dioxide,
ethanol, soybean oil, castor oil and their fatty acid ethyl esters. The experiments were conducted in a high-
pressure variable-volume view cell in the temperature range of 13-70 oC, for carbon dioxide overall
composition ranging from 5 to 45 wt% and pressures up to 270 bar. The performance of the Peng-Robinson
and SAFT equations of state in representing the experimental data was evaluated and results show that for
fatty acid esters both models provide satisfactory representation of experimental data, while for the vegetable
oils the SAFT-EoS show better performance when compared to the Peng-Robinson EoS.
Keywords: Vegetable oils, Carbon dioxide and Thermodynamics modeling.
1. Introduction
The merits of biodiesel as an alternative to mineral diesel comprise a non-toxic, biodegradable product,
obtained from a renewable source. Besides, biodiesel possess higher cetane number compared to diesel from
petroleum, and favorable combustion emissions profile, such as reduced levels of particulate matter and carbon
monoxide and, under some conditions, nitrogen oxides (McCormick et al., 2001) Because of these environmental
benefits, which mean reduction of environmental investments, and also due to the relief reliance on import needs,
biodiesel fuel can get expected as a good alternative to petroleum-based fuel.
Conventionally, transesterification has been performed using alkaline catalysts (mainly NaOH and KOH),
which suffers from several drawbacks: it is energy intensive, recovery of glycerol may be difficult, the alkaline
catalyst has to be removed from the product, alkaline wastewater requires treatment, and free fatty acids and
water interfere with the reaction. Besides, in the alkaline route, formation of soaps consumes the catalyst and
reduces the catalytic efficiency, as well as causes an increase in viscosity, formation of gels, and difficulty in
separations (Ma and Hanna, 1999).
The use of enzyme-catalyzed transesterification methods can overcome these problems, since oils with a
high acid content can also be used without a pre-treatment and no enzymatic activity loss is observed.
Furthermore, the free fatty acids contained in oil and fats wastes can be completely converted to fatty acid esters
and the by-product, glycerol, can be easily recovered without any complex process (Zhang et al., 2003).
The establishment of the Brazilian National Program on Biodiesel and the expectation of commercial
availability of the product within two years throughout the country, have prompted several studies on biodiesel
production using different techniques and a variety of vegetable and animal oils and fats. Among several raw
* To whom all correspondence should be addressed.
Current Address PEQ, COPPE, UFRJ - Centro de Tecnologia, Bl.G, sala G115, 21 945-970 Rio de Janeiro – Brazil
E-mail: [email protected]
2nd Mercosur Congress on Chemical Engineering
4th Mercosur Congress on Process Systems Engineering
2
materials available, castor oil is one of the most prominent. Besides the advantage of being a native growing
plant in Brazil, castor plant is versatile concerning the climate and ground types. Regarding soybean oil, it is a
raw material plenty available almost worldwide.
Methanol has been the most commonly used alcohol to perform transesterification in alkali, acid and
enzyme-catalyzed reactions (Ma and Hanna, 1999). However, in the Brazilian context, ethanol has been the
natural choice because Brazil is the world’s biggest ethanol producer, with a well-established technology of
production, large industrial plant capacity installed throughout the country, and also due to the fact that ethanol
also comes from a renewable resource.
Carbon dioxide, either as an expanded liquid or as a supercritical fluid, may be a viable replacement for a
variety of conventional organic solvents in reaction systems (Oliveira and Oliveira 2001). Numerous studies have
shown that many reactions can be conducted in liquid or supercritical CO2 and, in some cases, rates and
selectivities achieved are greater than those obtained in normal liquid or gas phase reactions. (Oliveira and
Oliveira 2000), Nevertheless, commercial exploitation of this technology has been limited. One factor that may
contribute to this reluctance is the complex phase behavior expected for these high-pressure multicomponent
systems, and a lack of experimental information. Thus, understanding the phase behavior is essential for the
design of any supercritical fluid reaction system.
In this context, this work is aimed at reporting phase equilibrium experimental data of binary systems that
consist of carbon dioxide and two vegetable oils (soybean and castor), their respective fatty acid ethyl esters
(FAEE), and a ternary system formed by carbon dioxide ethanol and castor oil. Performances of the Peng-
Robinson (Peng and Robinson, 1976) and SAFT (Huang and Radosz 1990, 1991) equations of state in
representing the phase behavior experimentally observed are evaluated.
2. Experimental Section
2.1.Materials.
Carbon dioxide (99.5% in liquid phase) was supplied by White Martins S.A. Ethyl alcohol PA (Merck)
was used without further treatment. The vegetable oils (refined soybean oil - Soya, and pharmaceutical castor oil
- Delaware) were stored at dry place and protected against light until the experiments. The fatty acid composition
of soybean oil was determined using a gas chromatograph (Agilent 6850 Series GC System). The following
instrumentation and conditions were used: capillary column DB-23 Agilent (50% cyanopropyl-
methylpolysiloxane, 60 m x 0.25 mm i.d. x 0.25 µm film thickness); split ratio: 1:50; injection volume: 1.0 µL.
Column temperature was programmed from 175 °C to 215 °C - 5 °Cmin-1. Helium was the carrier gas, and the
injection and detector temperatures were 250 °C and 280 °C, respectively. The fatty acid composition of castor
oil was determined using a gas chromatograph (HP 5890) with flame ionization detector, using a modified
polyethylene glycol column (FFAP 2 - 25 m x 0.20 mm i.d. x 0.30 µm film thickness); split ratio 1:50; injection
volume: 0.2 µL. Column temperature was programmed from 180 oC to 210
oC at 2
oCmin
-1. Hydrogen was the
carrier gas, and the injection and detector temperatures were 250 °C and 280 °C, respectively. Chemical
compositions for the vegetable oils used in this work are presented in Table 1.
2nd Mercosur Congress on Chemical Engineering
4th Mercosur Congress on Process Systems Engineering
3
FAEE products were obtained by enzyme-catalyzed reaction according to the experimental scheme
described elsewhere (Oliveira et al., 2003). Fatty acid ethyl ester samples from castor oil were analyzed through a
GC/MSD (Shimadzu QP5050A), using a capillary column PE-5 (20 m x 0.18 mm i.d. x 0.25 µm film thickness),
split mode (split ratio 1:20), injection volume: 0.5 µL. The column temperature gradient programming was: 200
to 300 ºC - 5 °Cmin-1. Helium was the carrier gas, and the injection and detector temperatures were, respectively,
290 ºC and 300 ºC. The identification of the compounds was accomplished through the injection of ethyl
ricinoleate (Sigma, 25 mg mL-1) as internal standard. In the case of FAEE from soybean oil, the same equipment
and experimental conditions were employed, but using a capillary column DB-5 (30 m x 0.25 mm i.d. x 0.25 µm
film thickness). The identification of the compounds was accomplished through injection of authentic standards
(ethyl palmitate, stearate, oleate, linoleate and linolenate) (Sigma) and squalene (Sigma) as internal standard,
comparing the mass spectra and GC retention times. The detection was done in SCAN mode (at 70 eV). All
analyzes were replicate at least three times.
Table 1. Chemical composition of vegetable oils used in this work.
Composition / wt % Fatty acid
Soybean oil Castor oil
Palmitic 11.3 ± 0.1 1.4 ± 0.2
Stearic 3.5 ± 0.1 0.9 ± 0.2
Oleic 23.6 ± 0.1 3.5 ± 0.2
Linoleic 54.7 ± 0.1 4.9 ± 0.2
Linolenic 6.9 ± 0.1 0.3 ± 0.1
Ricinoleic - 88.9 ± 1.4
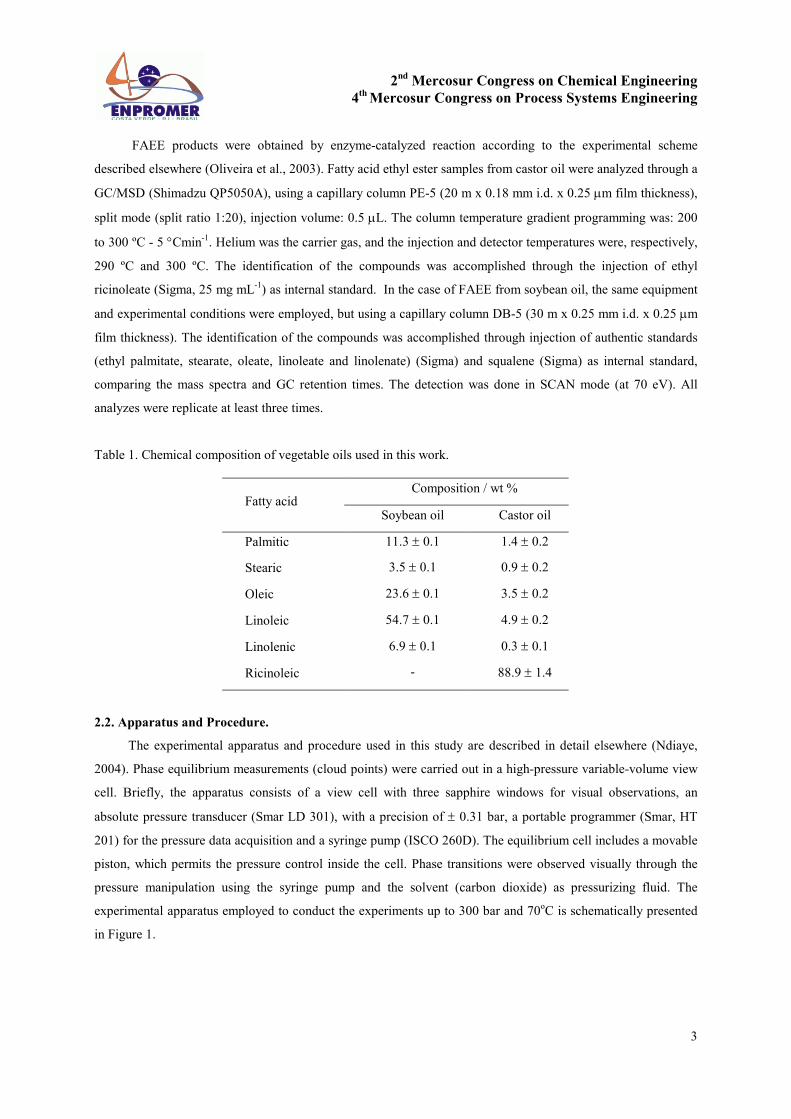
2.2. Apparatus and Procedure.
The experimental apparatus and procedure used in this study are described in detail elsewhere (Ndiaye,
2004). Phase equilibrium measurements (cloud points) were carried out in a high-pressure variable-volume view
cell. Briefly, the apparatus consists of a view cell with three sapphire windows for visual observations, an
absolute pressure transducer (Smar LD 301), with a precision of ± 0.31 bar, a portable programmer (Smar, HT
201) for the pressure data acquisition and a syringe pump (ISCO 260D). The equilibrium cell includes a movable
piston, which permits the pressure control inside the cell. Phase transitions were observed visually through the
pressure manipulation using the syringe pump and the solvent (carbon dioxide) as pressurizing fluid. The
experimental apparatus employed to conduct the experiments up to 300 bar and 70oC is schematically presented
in Figure 1.
2nd Mercosur Congress on Chemical Engineering
4th Mercosur Congress on Process Systems Engineering
4
Figure 1. Schematic diagram of the experimental apparatus. A - cylinder of gas; B - syringe bomb; C -
equilibrium cell; D - sapphire windows; E - magnetic agitator; F - light source; G - pressure
transducer; H - source of energy; I - pressure indicator, J - feeding valve; K - valve; L,M - sphere
valves; N - valve of pressurization of the cell; O - relief valve; P -check valve; Q - thermocouple, R -
temperature indicator.
Initially, a precise amount of the heavy component was weighed on a precision scale balance (Ohaus
Analytical Standard with 0.0001g accuracy) and loaded into the equilibrium cell. The cell was then flushed with
low-pressure carbon dioxide to remove any residual air. A known amount of solvent was loaded into the
equilibrium cell using the syringe pump, resulting in an accuracy of ± 0.005 g in solvent loadings. The mixture
was then continuously mixed by means of a magnetic stirrer. The temperature control was turned on, and once
the desired temperature (controlled within 0.1 oC) had been reached, the system pressure was increased until the
visualization of a one-phase system in the cell. At this point, the system was kept at least 30 min to allow
stabilization, and then the pressure was slowly decreased (typically at a rate of 1-5 bar/min) until a new phase
was observed. This procedure was repeated at least three times for each temperature and global composition
resulting in an overall average pressure measurement reproducibility of 0.70 bar.
3.Thermodynamic Modeling
In this work, two equations of state were employed for representing the phase equilibrium experimental
data: the Peng-Robinson-EoS and the SAFT-EoS. In the Peng-Robinson model, the conventional quadratic van
der Waals mixing rules with two binary interaction parameters were used.
The use of cubic equations of state to represent the phase behavior of vegetable oils presents some
difficulties due to the lack of experimental information about pure component critical properties and acentric
factors. In this work, the Constantinou-Gani group contribution method (Constantinou and Gani, 1994) was
employed to estimate the critical constants and acentric factors of triglycerides and related FAEE mixtures. It was
adopted the pseudo-component approach, weighing the individual values from each component according to their
compositions, presented in Table 1. Table 2 lists the properties of the pure compounds employed in this work
along with the values found for the triglycerides and related FAEE mixtures. The parameters for pure carbon
dioxide and ethanol were taken from the literature (Poiling et al. 2001)
2nd Mercosur Congress on Chemical Engineering
4th Mercosur Congress on Process Systems Engineering
5
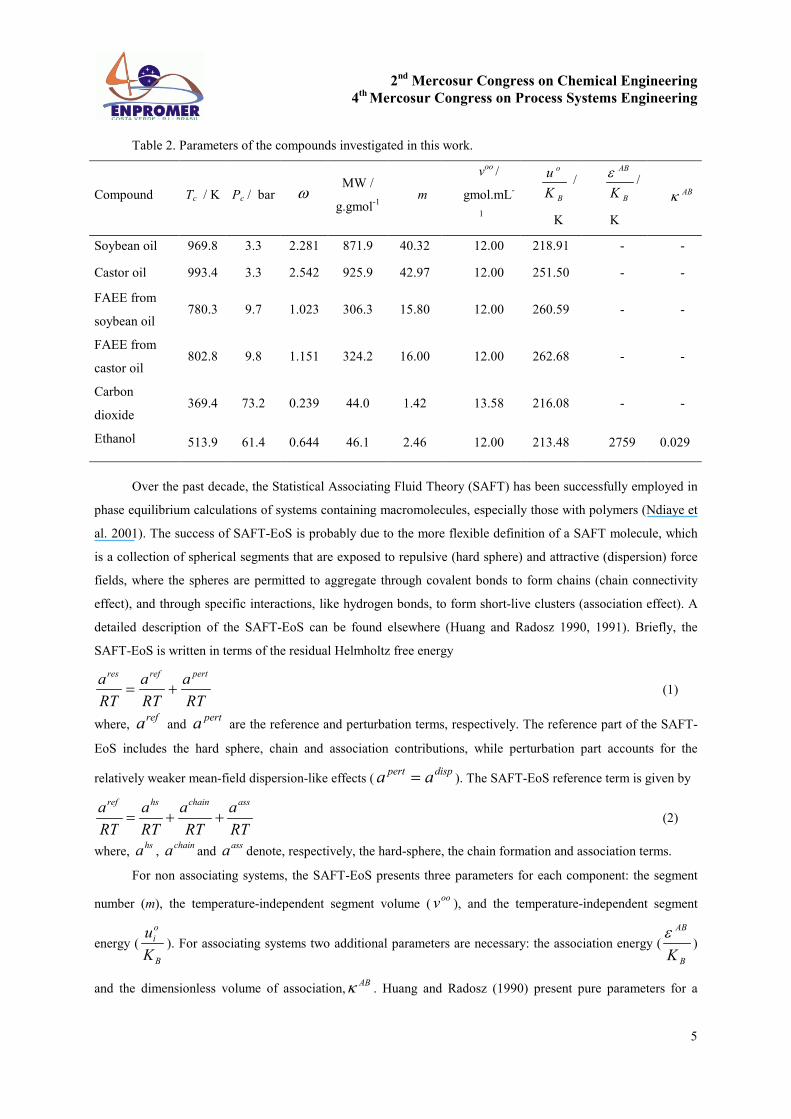
Table 2. Parameters of the compounds investigated in this work.
Compound Tc / K Pc / bar ω MW /
g.gmol-1
m
voo
/
gmol.mL-
1
B
o
K
u /
K
B
AB
K
ε/
K
ABκ
Soybean oil 969.8 3.3 2.281 871.9 40.32 12.00 218.91 - -
Castor oil 993.4 3.3 2.542 925.9 42.97 12.00 251.50 - -
FAEE from
soybean oil 780.3 9.7 1.023 306.3 15.80 12.00 260.59 - -
FAEE from
castor oil 802.8 9.8 1.151 324.2 16.00 12.00 262.68 - -
Carbon
dioxide 369.4 73.2 0.239 44.0 1.42 13.58 216.08 - -
Ethanol 513.9 61.4 0.644 46.1 2.46 12.00 213.48 2759 0.029
Over the past decade, the Statistical Associating Fluid Theory (SAFT) has been successfully employed in
phase equilibrium calculations of systems containing macromolecules, especially those with polymers (Ndiaye et
al. 2001). The success of SAFT-EoS is probably due to the more flexible definition of a SAFT molecule, which
is a collection of spherical segments that are exposed to repulsive (hard sphere) and attractive (dispersion) force
fields, where the spheres are permitted to aggregate through covalent bonds to form chains (chain connectivity
effect), and through specific interactions, like hydrogen bonds, to form short-live clusters (association effect). A
detailed description of the SAFT-EoS can be found elsewhere (Huang and Radosz 1990, 1991). Briefly, the
SAFT-EoS is written in terms of the residual Helmholtz free energy
RT
a
RT
a
RT
a pertrefres
+= (1)
where, refa and
perta are the reference and perturbation terms, respectively. The reference part of the SAFT-
EoS includes the hard sphere, chain and association contributions, while perturbation part accounts for the
relatively weaker mean-field dispersion-like effects (disppert aa = ). The SAFT-EoS reference term is given by
RT
a
RT
a
RT
a
RT
a asschainhsref
++= (2)
where, hsa ,
chaina and assa denote, respectively, the hard-sphere, the chain formation and association terms.
For non associating systems, the SAFT-EoS presents three parameters for each component: the segment
number (m), the temperature-independent segment volume (oov ), and the temperature-independent segment
energy (
B
o
i
K
u). For associating systems two additional parameters are necessary: the association energy (
B
AB
K
ε)
and the dimensionless volume of association,ABκ . Huang and Radosz (1990) present pure parameters for a
2nd Mercosur Congress on Chemical Engineering
4th Mercosur Congress on Process Systems Engineering
6
series of substances, as well as general correlations for evaluation of these parameters when experimental data are
not available.
Here, following the same strategy discussed for the PR-EoS modeling, oils and FAEE were treated as
pseudocomponents. The volume segment was fixed at 12 mL/mol, as suggested by Huang and Radosz (1990) for
macromolecules. The segment number (m) and the energy parameter (
B
o
i
K
u) were estimated by fitting the
equation to experimental data of compressed liquid density (Acosta et al., 1996). SAFT parameters for carbon
dioxide and ethanol were taken from the literature (Huang and Radosz, 1990). Rigorously, among the substances
investigated in this work, ricinoleic acid (major fatty acid constituent of castor oil) molecules and ethanol may be
able to self- or cross-associate due to the presence of hydroxyl groups. However, because triricinolein is a
macromolecule, steric impediments may hinder possible self and cross association. In this way, only ethanol was
considered to be able to self-associate. Table 2 presents the parameters of SAFT-EoS employed in this work.
The binary interaction parameters for both the PR-EoS and the SAFT-EoS were estimated by regression
of the experimental data using a maximum likelihood objective function, weighing each experimental point
according to its precision (Noronha et al., 1987). In this work, a global temperature estimation procedure was
accomplished by fitting each set of binary experimental data. The binary interaction parameters for PR (kij and lij)
and SAFT (kij) equations presented in Table 3.
Table 3. Binary interaction parameters for the PR and SAFT EoS.
PR-EoS SAFT-EoS
System kij lij kij
CO2/Ethanol 0.105 -0.023 0.108
CO2/Castor oil -0.035 0.480 0.035
CO2/Soybean oil -0.041 0.350 0.080
CO2/FAEE castor oil 0.058 0.120 0.024
CO2/FAEE soybean oil -0.007 0.410 0.027
Ethanol/Castor oil -0.080 -0.017 -0.062
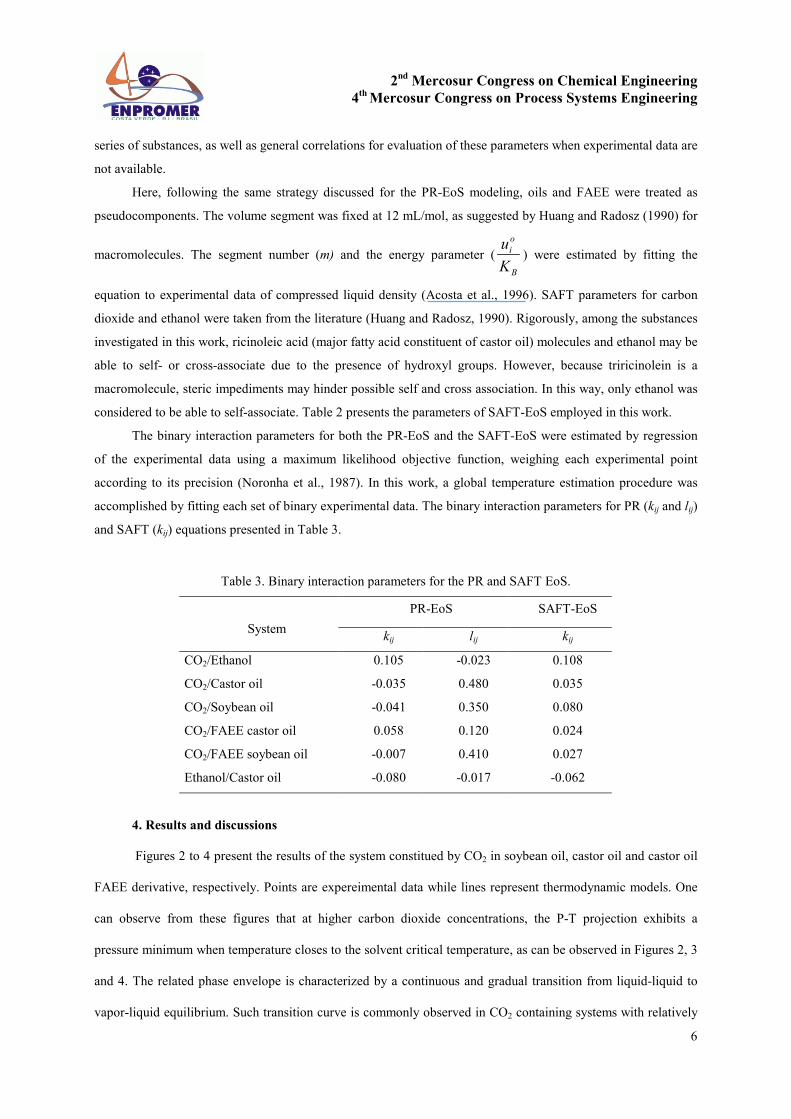
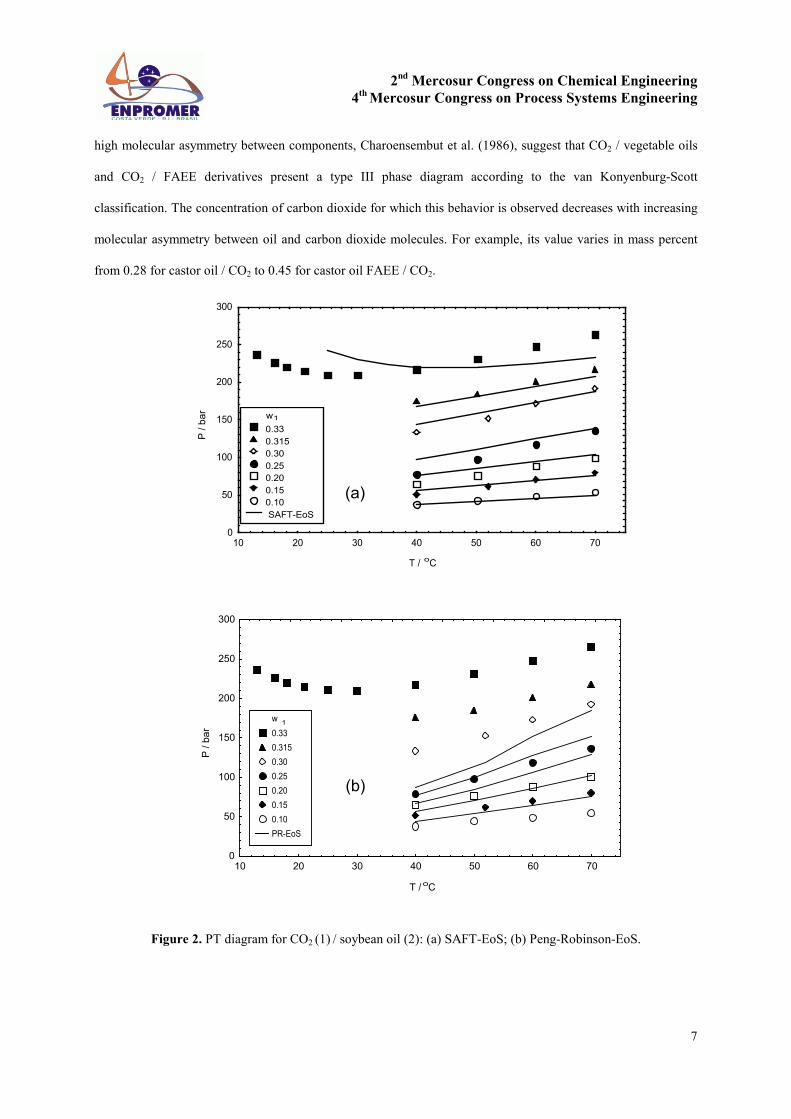
4. Results and discussions
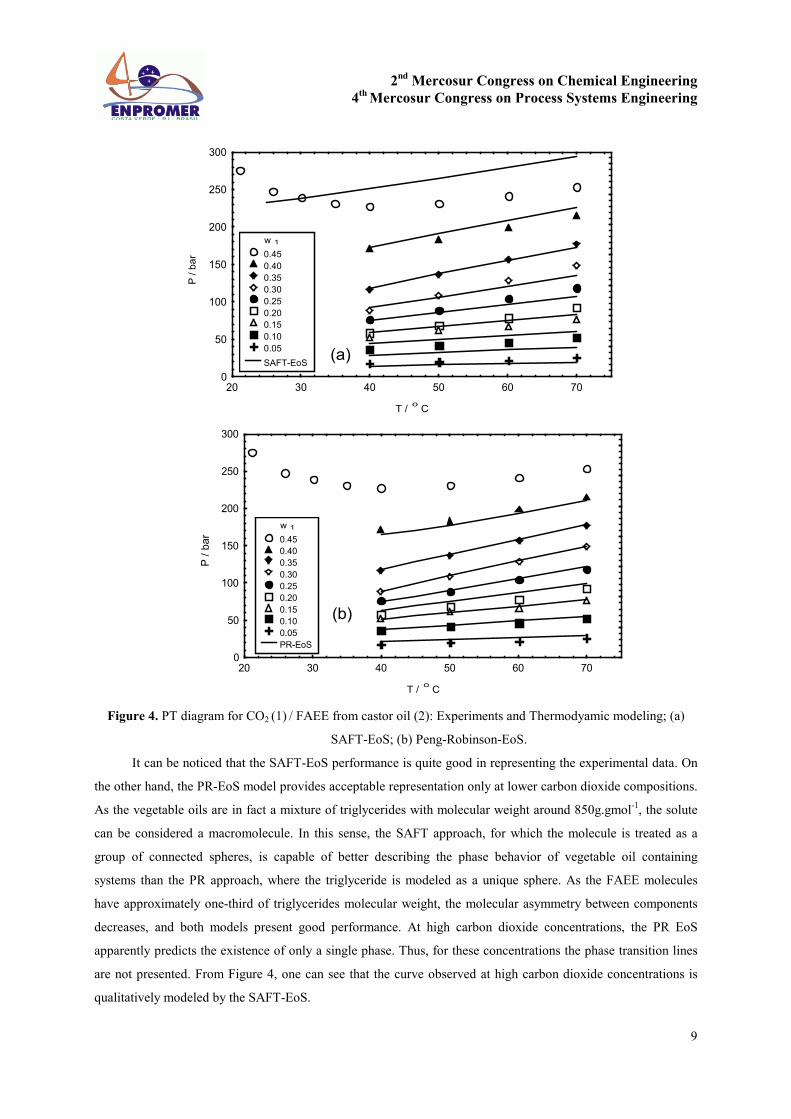
Figures 2 to 4 present the results of the system constitued by CO2 in soybean oil, castor oil and castor oil
FAEE derivative, respectively. Points are expereimental data while lines represent thermodynamic models. One
can observe from these figures that at higher carbon dioxide concentrations, the P-T projection exhibits a
pressure minimum when temperature closes to the solvent critical temperature, as can be observed in Figures 2, 3
and 4. The related phase envelope is characterized by a continuous and gradual transition from liquid-liquid to
vapor-liquid equilibrium. Such transition curve is commonly observed in CO2 containing systems with relatively
2nd Mercosur Congress on Chemical Engineering
4th Mercosur Congress on Process Systems Engineering
7
high molecular asymmetry between components, Charoensembut et al. (1986), suggest that CO2 / vegetable oils
and CO2 / FAEE derivatives present a type III phase diagram according to the van Konyenburg-Scott
classification. The concentration of carbon dioxide for which this behavior is observed decreases with increasing
molecular asymmetry between oil and carbon dioxide molecules. For example, its value varies in mass percent
from 0.28 for castor oil / CO2 to 0.45 for castor oil FAEE / CO2.
T / oC
P / bar
0
50
100
150
200
250
300
10 20 30 40 50 60 70
w1
0.33
0.315
0.30
0.25
0.20
0.15
0.10
SAFT-EoS
(a)
T / oC
P / bar
0
50
100
150
200
250
300
10 20 30 40 50 60 70
w1
0.33
0.315
0.30
0.25
0.20
0.15
0.10
PR-EoS
(b)
Figure 2. PT diagram for CO2 (1) / soybean oil (2): (a) SAFT-EoS; (b) Peng-Robinson-EoS.
2nd Mercosur Congress on Chemical Engineering
4th Mercosur Congress on Process Systems Engineering
8
T / o C
P / bar
0
50
100
150
200
250
300
20 30 40 50 60 70 80
w1
0.28
0.25
0.20
0.15
0.10
0.05
SAFT-EoS
(a)
T / o C
P / bar
0
50
100
150
200
250
300
20 30 40 50 60 70 80
w1
0.28
0.25
0.20
0.15
0.10
0.05
PR-EoS
(b)
Figure 3. PT diagram for CO2 (1) / castor oil (2): Experiments and Thermodyamic modeling; (a) SAFT-EoS; (b)
Peng-Robinson-EoS.
2nd Mercosur Congress on Chemical Engineering
4th Mercosur Congress on Process Systems Engineering
9
T / o C
P / bar
0
50
100
150
200
250
300
20 30 40 50 60 70
w 1
0.45
0.40
0.35
0.30
0.25
0.20
0.15
0.10
0.05
SAFT-EoS (a)
T / o C
P / bar
0
50
100
150
200
250
300
20 30 40 50 60 70
w 1
0.45
0.40
0.35
0.30
0.25
0.20
0.15
0.10
0.05
PR-EoS
(b)
Figure 4. PT diagram for CO2 (1) / FAEE from castor oil (2): Experiments and Thermodyamic modeling; (a)
SAFT-EoS; (b) Peng-Robinson-EoS.
It can be noticed that the SAFT-EoS performance is quite good in representing the experimental data. On
the other hand, the PR-EoS model provides acceptable representation only at lower carbon dioxide compositions.
As the vegetable oils are in fact a mixture of triglycerides with molecular weight around 850g.gmol-1, the solute
can be considered a macromolecule. In this sense, the SAFT approach, for which the molecule is treated as a
group of connected spheres, is capable of better describing the phase behavior of vegetable oil containing
systems than the PR approach, where the triglyceride is modeled as a unique sphere. As the FAEE molecules
have approximately one-third of triglycerides molecular weight, the molecular asymmetry between components
decreases, and both models present good performance. At high carbon dioxide concentrations, the PR EoS
apparently predicts the existence of only a single phase. Thus, for these concentrations the phase transition lines
are not presented. From Figure 4, one can see that the curve observed at high carbon dioxide concentrations is
qualitatively modeled by the SAFT-EoS.
2nd Mercosur Congress on Chemical Engineering
4th Mercosur Congress on Process Systems Engineering
10
Conclusions
Experimental data of phase equilibrium of vegetable oils and their fatty acid ethyl esters in carbon
dioxide at high pressures are presented in this work. Results show that systems investigated seem to exhibit a type
III phase behavior according to the van Konyenburg-Scott classification. Transition pressures are relatively high
and sensitive to carbon dioxide concentration and temperature. The SAFT-EoS with one binary interaction
parameter presented better performance in correlating experimental data than the Peng-Robinson EoS with two
binary interaction parameters.
References
McCormick, R.L., Graboski, M.S., Alleman, T.L., Herring A.M. (2001) Impact of biodiesel source material and chemical
structure on emissions of criteria pollutants from heavy-duty engine. Environ. Sci. Technol., 35, 1742.
Ma, F., Hanna, M.A. (1999). Biodiesel production: a review. Bioresour. Technol., 70, 1.
Zhang, Y., Dubé, M.A., McLean, D.D., Kates, M. (2003). Biodiesel production from waste cooking oil: 1. Process design
and technological assessment. Bioresour. Technol. 89, 1.
Oliveira, D., Oliveira, J.V. (2001). Enzymatic alcoholysis of palm kernel oil in n-hexane and SC-CO2. J. Supercrit. Fluids,
19 (2), 141.
Peng, S.Y., Robinson, D. B. (1976). A new two-constant equation of state. Ind. Eng. Chem. Fund. 8, 59.
Huang, S.H., Radosz, (1990). M. Equation of state for small, large, polydisperse and association molecules. Ind. Chem. Eng.
Res. 29, 2284.
Huang, S.H.; Radosz, M. (1991). Equation of state for small large, polydisperse and associating molecules: extention to fluid
mixtures. Ind. Chem. Eng. Res. 30, 1994.
Oliveira, D., Di Luccio, M., Faccio, C.;,Dalla Rosa, C., Bender, J.P., Lipke, N., Menoncin, S., Amroginski, C.;,Oliveira, J.V.
(2004). Optimization of enzymatic production of biodiesel from Castor oil in organic solvent medium. Appl. Biochem.
Biotechnol. 115, 771.
Ndiaye, P.M. (2004) Equiliíbrio de fases de óleos vegetais e de Biodiesel em CO2, propano e n-butano, Doctoral Thesis,
Escola de Química, UFRJ, Brazil.
Constantinou, L., Gani R. (1994). New group contribution method for estimating properties of pure compounds. AIChE J,
40, 1697.
Poling, B.E., Prausnitz, J.M., O’Connell, J.P. (2001) The Properties of Gases and Liquids., McGraw-Hill., 5th Edition: New
York.
Ndiaye, P.M., Dariva, C., Oliveira, J.V., Tavares, F.W., (2001). Phase behavior of isotactic polypropylene/c4-solvents at high
pressure. experimental data and saft modeling, J. Supercrit. Fluids, 21, 93-103
Acosta, G.M., Smith Jr, R. L., Arai, K. (1996). High-pressure PVT behavior of natural fats and oils, trilaurin, triolein, and n-
tridecane from 303 K to 353 K from atmospheric pressure to 150 MPa. J. Chem. Eng. Data, 41, 961.
Noronha, F.B., Monteiro, J.L., Lobão, M.W., Santos, T. J., Pinto, J.C.S.; (1987). Estima: Um pacote computacional para
Estimação de Parâmetros e Projeto de Experimentos, PEQ/COPPE/UFRJ.
Charoensembut,A, A. Martin, J., Kobayashi, R. (1986). Application of a Generalized Multiproperty Apparatus to Measure
Phase Equilibrium and Vapor Phase Densities of Supercritical Carbon Dioxide in n-Hexadecane System up to 26 MPa.
Fluid Phase Equilibria, 31, 89-104.
Acknowledgments
The authors thank CNPq, FAPERGS, FAPERJ and ANP/FINEP/PETROBRAS for the financial support.


![Castor Oil Report Preview eBook[1]](https://static.cupdf.com/doc/110x72/552700455503461c368b4632/castor-oil-report-preview-ebook1.jpg)


![Castor Seed Oil- Processing[1]](https://static.cupdf.com/doc/110x72/546abb76b4af9f7a2c8b4889/castor-seed-oil-processing1.jpg)
