PESTICIDE USAGE SURVEY REPORT 273
ORCHARDS
IN THE
UNITED KINGDOM
2016
D. Garthwaite, I. Barker, L. Ridley, A. Mace, G. Parrish, R. MacArthur & Y. Lu
Land Use & Sustainability Team Fera Science Ltd.
Sand Hutton York
YO41 1LZ

ii
A NATIONAL STATISTICS SURVEY
National Statistics are produced to high professional standards set out in the Code of Practice for Official Statistics. They are free from any political interference. The United Kingdom Statistics Authority (UKSA) has a statutory duty to assess National Statistics for compliance with this Code of Practice. Further information is available from the Office for National Statistics website (http://www.ons.gov.uk/ons/index.html). The statistics undergo regular quality assurance reviews to ensure that they meet customers’ needs. The UKSA has designated these statistics as National Statistics, in accordance with the Statistics and Registration Service Act 2007 and signifying compliance with the Code of Practice for Official Statistics. Designation can be broadly interpreted to mean that the statistics: • meet identified user needs; • are well explained and readily accessible; • are produced according to sound methods; and • are managed impartially and objectively in the public interest. Once statistics have been designated as National Statistics it is a statutory requirement that the Code of Practice shall continue to be observed. If you have any enquiries or feedback on the statistics included in this report, they can be directed to the contact given below: Pesticide Usage Survey Team – e-mail: [email protected] Telephone: 01904 462 032 Alternatively please contact: Fera Science Ltd. at: [email protected] DATA USES
The data are used for a number of purposes including:
• Quantifying pesticide usage and changes in the use of active substances over time;
• Policy, including assessing the economic and/or environmental implications of the introduction of new active substances and the withdrawal/non-authorisation of pesticide products (the data reported to organisations such as the OECD and EU enabling the UK to honour international agreements); evaluating changes in growing methods and Integrated Pest Management where this has an impact on pesticide usage;
• Informing the pesticide risk assessment (authorisation) process
• Informing the targeting of monitoring programmes for residues in food and the environment;
• Contributing to assessing the impact of pesticide use, principally as part of the Pesticides Forum’s Annual Report;
• Responding to enquiries (for example, Parliamentary Questions, correspondence, queries under the Freedom of Information Act or Environmental Information Regulations, etc.);
• Providing information to assist research projects which can support all of the above activities;
• Training/teaching programmes which are designed to improve practice in the use of pesticides by the farming/training industries;
• Informing the Wildlife Incident Investigation Scheme (WIIS) programme to help identify potential misuse of pesticides.
REVISIONS POLICY This report presents a comprehensive summary of data for orchard crops grown and taken to harvest in 2016. We will provide information on any revisions we make to the report or the datasets if any inaccuracies or errors occur. Details of any revisions, including the date upon which they were changed, will appear on the following website: https://secure.fera.defra.gov.uk/pusstats/surveys/index.cfm

iii
CONTENTS Page Executive Summary 1 Introduction 2 Trends 3 Crops 4 Pesticide Usage 5 Pesticide Usage on Pome Fruits 6 Dessert Apples (Cox) 6 Dessert Apples (others) 11 Culinary Apples 16 Cider Apples & Perry Pears 21 Pears 26 Pesticide Usage on Stone Fruits & Nuts 32 Plums 32 Cherries 36 Other Orchard crops (including nuts) 40 Appendix 1 – Foliar Application Tables 43 Appendix 2 – Definitions 59 Appendix 3 – Methodology 60 Appendix 4 – Standard Error Calculations 63 Appendix 5 – First Raising Factors for Orchard Crops 67 Acknowledgements 68 References 68

1
EXECUTIVE SUMMARY This report contains information on orchard crops including dessert apples (Cox and others), culinary apples (Bramley & others), cider apples & perry pears, pears, plums, cherries and other orchard crops including nuts. Data on pesticide usage on these were collected during the winter of 2016/2017 from 3,110 examples (orchards) grown on 293 holdings throughout the United Kingdom. Orchards grown on the sampled 293 holdings accounted for 31% of the total area of orchard crops grown in the United Kingdom during the 2016 season (autumn 2015, spring & summer 2016). Organic holdings were included in the survey and accounted for 10% of the holdings surveyed. The area of crops surveyed in each region was proportional to the area of orchard crops grown in that region. The data on the area of pesticide treatments and the amount of active substances applied have been raised to give national usage estimates. Fungicides, including copper products for bacterial canker control on some crops, accounted for 66% of the total pesticide-treated area of orchard crops in the United Kingdom in 2016, insecticides 11%, herbicides 9%, growth regulators 6%, sulphur 2% (used as a pesticide for powdery mildew control) and acaricides less than 1%. Other pesticides, including the commodity chemical urea (used for leaf destruction in the autumn to prevent the spread of disease), growth stimulants (harpin protein, mainly for frost protection), biological control agents (primarily Anthocoris spp. for pear sucker control), physical control agents (natural plant extracts), disinfectants and repellents (kaolin) comprised a further 6%. By weight applied fungicides accounted for 72% of pesticides used, other pesticides (urea, repellents, disinfectants, growth stimulants and physical controls) 12%, sulphur 6%, herbicides 7%, insecticides 2%, growth regulators and acaricides less than 1% each. The most extensively used fungicide formulation was captan, being used on 74,751 ha; thiacloprid was the most extensively used insecticide being applied to 15,007 ha; the herbicide glyphosate was applied to 28,849 ha and the gibberellins were the most extensively used growth regulators, being applied to 15,941 ha of orchard crops. Potassium phosphonate was recorded for the first time in 2016, being a co-formulant with some dithianon products. Penthiopyrad, prohexadione and cyantraniliprole were among new active substances encountered on orchard crops for the first time in 2016.
There were large increases in the use of the insecticides acetamiprid and spinosad since 2014, presumably reflecting the impact of the withdrawal of chlorpyrifos, and the use of alternative insecticides in some crops as part of anti-resistance strategies. The neonicotinoids, (thiacloprid and acetamiprid) accounted for 25% of the insecticide-treated area, diamides (chlorantraniliprole) 20%, diacylhydrazines (methoxyfenozide) 15%, other insecticides (including flonicamid and spinosad) accounting for 11%, oxadiazines (indoxacarb) 8% and carbamates (pirimicarb) 2%. Chlorpyrifos, which accounted for 34% of the area treated in 2014, was only applied to 8% of the treated area in 2016 following its withdrawal from use during the survey period, and a resultant decrease in weight applied from 15,343 kg in 2014 to 2,853 kg in 2016, a reduction of 81% since 2014. The only major increases in pesticide usage in the principal 10 active substances were of glyphosate, increasing by 30% in terms of area treated, myclobutanil 19% and pyraclostrobin by 7%. Since 2014, the area of orchard crops grown in England, Wales and Northern Ireland has increased by 11%. The area treated with pesticides has also increased by 3%, however the weight applied has decreased by 5%. Over this period, the use of insecticides has increased by 7%, fungicides by 2%, herbicide usage by 20% and acaricide usage by 8%. Much of the increase is due to increased areas of dessert apples, which are relatively intensively treated, and a combination of increased areas and more intensive usage on crops such as cherries and pears.

2
INTRODUCTION The Expert Committee on Pesticides (ECP) advises government on all aspects of pesticide use. In order to discharge this function, the Committee must regularly monitor the usage of all pesticides. It needs accurate data on the usage of individual pesticides. Pesticide usage data are now also required under the EU Statistics Regulation (1185/2009/EC). As part of the on-going process for obtaining data, the Pesticide Usage Survey Teams of Fera Science Ltd., a joint venture between Capita PLC and the Department for Environment, Food & Rural Affairs (Defra), Science & Advice for Scottish Agriculture (SASA), a division of the Scottish Government’s Agriculture and Rural Economy Directorate and the Agri-Food & Biosciences Institute (AFBI), Department of Agriculture, Environment and Rural Affairs, Northern Ireland (DAERA), conducted surveys of pesticide usage in orchard crops in 2015/16 by visiting holdings throughout the United Kingdom during the winter of 2016/17. Since 2010, all surveys of pesticide usage in agriculture and horticulture have been fully co-ordinated by the survey teams of England & Wales, Scotland and Northern Ireland. The methodology used for sample selection and the collection of data from sample holdings is identical in each region. Reports are produced of pesticide usage throughout the United Kingdom. All teams have undertaken recent United Kingdom Statistics Authority (UKSA) audits and the data are accredited as National Statistics. This is the third survey of pesticide usage on orchard crops in the United Kingdom. The previous report for the United Kingdom was published in 2015 covering pesticide usage on orchard crops in 2014 (Garthwaite et. al., 2015). Additional data on crop agronomy and fruit storage is collected for all surveys but is not presented within the report. For additional data relating to the surveys please refer to the contacts below. Information on all aspects of pesticide usage in the United Kingdom, or for Wales or the Defra regions of England, may be obtained from the Pesticide Usage Survey Team at Fera Science Ltd., Sand Hutton, York, UK YO41 1LZ. For further information please contact: The survey team – e-mail: [email protected] Telephone: 01904 462 032 Or visit the website: https://secure.fera.defra.gov.uk/pusstats/surveys/index.cfm Alternatively, please contact: Fera Science Ltd. at: [email protected] Further data relating specifically to Scotland may be obtained from the Pesticide Usage Survey Team at Science and Advice for Scottish Agriculture, Edinburgh. Also available at: http://www.sasa.gov.uk/pesticides/pesticide-usage/pesticide-usage-survey-reports Copies of reports on pesticide usage in Northern Ireland may be obtained from Her Majesty's Stationery Offices. Also available at:
https://www.afbini.gov.uk/articles/pesticide-usage-monitoring-reports Recently-published reports for the United Kingdom, Great Britain, England & Wales and Northern Ireland can also be viewed and downloaded on the Internet at: https://secure.fera.defra.gov.uk/pusstats/surveys/index.cfm Alternatively, pesticide data for the UK can be extracted using the search tool – PUSSTATS:
https://secure.fera.defra.gov.uk/pusstats/

3
TRENDS
0
2,000
4,000
6,000
8,000
10,000
12,000
2012 2014 2016
He
ctar
es g
row
nFigure 1 - Change in the area of orchard crops grown in the United Kingdom - 2012 -
2016 1
Dessert apples (Cox)
Dessert apples (others)
Culinary apples
Cider apples & perry pears
Pears
Plums
Cherries
Other orchard crops (incl. nuts)
0
50,000
100,000
150,000
200,000
250,000
300,000
350,000
400,000
450,000
2012 2014 2016
Are
a tr
eate
d (h
ecta
res)
Figure 2 - Changes in the pesticide-treated area of orchard crops in the United Kingdom -2012 - 20161,2
Acaricides
Fungicides
Insecticides
Herbicides
Growth regulators
Sulphur
Other pesticides
0
50
100
150
200
250
300
350
2012 2014 2016
Ton
ne
s o
f act
ive
subs
tanc
e
Figure 3 - Changes in the weight of pesticides applied to orchard crops in the United Kingdom - 2012 - 20161,2
Acaricides
Fungicides
Insecticides
Herbicides
Growth regulators
Sulphur
Other pesticides
1 Data for 2012 excludes information from Scotland 2 Within Figures 2 & 3, other pesticides include biological control agents, repellents, urea, disinfectants, growth stimulants and physical
control agents.

4
CROPS Information is given concerning eight types of orchard crops; dessert apples (Cox and others), culinary apples, cider apples & perry pears, pears, plums, cherries and other orchard crops including nuts. Data on pesticide usage were collected from 3,110 examples (orchards) grown on 293 holdings throughout the United Kingdom. The sample accounted for 31% of the total area of orchard crops grown in the United Kingdom during the 2016 season. Fruit crops grown under permanent polythene and glasshouse structures are excluded from this report but are included within the team’s survey of protected crops. Cherry crops grown for part of the time under Spanish tunnels or nets are included in the survey.
1%
6%
37%
<1%<1%
15%
30%
<1%2% <1%
7%
Figure 4 - Regional distribution of orchard crops in the United Kingdom - 2016
East Midlands
Eastern
London & South East
North East
North West
South West
West Midlands
Yorkshire & the Humber
Wales
Scotland
Northern Ireland
7%
23%
15%
8%
38%
3%
4%
2%
Figure 4a - Relative areas of the different orchard crops in the United Kingdom - 2016
Dessert apples (Cox)
Dessert apples (others)
Culinary apples
Pears
Cider apples & perry pears
Plums
Cherries
Other orchard crops (incl. nuts)
0
10
20
30
40
50
60
70
EastMidlands
Eastern London &South East
North East NorthWest
South West WestMidlands
Yorkshire& the
Humber
Wales Scotland NorthernIreland
Pe
rcen
tage
of t
otal
Figure 4b - Comparison of regional distribution and treated area of orchard crops in the United Kingdom - 2016
Area grown
Area treated
For maps of the United Kingdom showing individual Government Office regions, please visit the following website: http://www.ons.gov.uk/ons/guide-method/geography/beginner-s-guide/maps/index.html Please note - All Pie-Charts within this report should be read clockwise from the top, as both the pie segments and the contents of the key appear in the same order.

5
PESTICIDE USAGE
1%
6%
65%
<1%
<1%5%
16%
<1%
1%
<1%
6%
Figure 5 - Regional distribution of pesticide usage on orchard crops in the United Kingdom - 2016 - percentage area treated
East Midlands
Eastern
London & South East
North East
North West
South West
West Midlands
Yorkshire & the Humber
Wales
Scotland
Northern Ireland
0
10
20
30
40
50
60
70
80
Acaricides Insecticides Fungicides Urea Growthregulators
Herbicides Sulphur Biologicalcontrols
Pe
rcen
tage
of t
otal
Figure 6 - Usage of pesticides on orchard crops in the United Kingdom - 2016
Area treated
Weight applied
0
5
10
15
20
25
30
35
40
Acaricides Insectic ides Fungicides Sulphur Growthregulators
Herbicides All pesticides
Nu
mbe
r of a
pplic
atio
ns
Figure 7 - Average number of applications made to orchard crops in the United Kingdom - 2016
Spray rounds
Products
Active substances

6
PESTICIDE USAGE ON POME FRUITS Dessert apples (Cox)
• 1,704 hectares of dessert apples (Cox) grown in the United Kingdom
• 69,491 treated hectares
• 44.32 tonnes applied
• 4% of dessert apples (Cox) remained untreated
• Dessert apples (Cox) received on average 17 fungicides, 5 growth regulators, 4 insecticides and 2 herbicides
In line with many of the other fruit crops included in this report, Cox apples are treated with a range of fungicides throughout the season to control a range of fungal pathogens, particularly scab and powdery mildew. The grower’s aim is to give continuous protection to the crop throughout the season by using regular applications of a range of active substances. A variety of active substances with different modes of action minimise disease resistance and control an increased range of pathogens. Cox apples continued to be reported on separately to other dessert apples due to the difference in the way that they are treated, particularly in respect of the usage of plant growth regulators.
0
10
20
30
40
50
60
70
80
90
Acaricides Insecticides Fungicides Growthregulators
Herbicides Sulphur Urea All otherpesticides
Pe
rcen
tage
of t
otal
Figure 8 - Usage of pesticides on dessert apples (Cox) - 2016
Area treated
Weight applied
0
5
10
15
20
25
30
35
40
45
50
Jan Feb Mar Apr May Jun Jul Aug Sep Oct Nov Dec
Pe
rcen
tage
of a
pplic
atio
ns
Figure 9 - Timing of pesticide applications on dessert apples (Cox) - 2016
Acaricides
Fungicides
Insecticides
Herbicides
Growth regulators
Sulphur

7
Dessert apples (Cox) – Fungicides
• Formulation area treated: 47,163 hectares
• Weight of active substances applied: 36.6 tonnes
• The five most common formulations were:
Formulation area treated
(ha)
Weight of a.s. applied (kg)
Proportion of fungicide-
treated area
Proportion of area grown
Average number of
applications (where applied)
Average proportion of
maximum product label
rate
Captan 8,957 13,168 0.19 0.92 5.69 0.85
Myclobutanil 7,387 444 0.16 0.94 4.61 0.67
Penconazole 3,532 146 0.07 0.73 2.85 0.83
Dithianon 3,294 1,623 0.07 0.77 2.51 0.79
Difenoconazole 2,184 108 0.05 0.62 2.08 0.99
53%33%
4%
3%7%
Figure 10 - Dessert apples - Cox - Reasons for use of fungicides (where given)
scab
mildew
mildew/scab
storage rots
other diseases

8
Dessert apples (Cox) – Growth regulators
• Formulation area treated: 6,969 hectares
• Weight of active substances applied: 0.33 tonnes
• The five most common formulations were:
Formulation area treated
(ha)
Weight of a.s. applied (kg)
Proportion of growth
regulator –treated area
Proportion of area grown
Average number of
applications (where applied)
Average proportion of
maximum product label
rate
Gibberellins 3,609 11 0.51 0.52 4.05 0.58
Paclobutrazol 1,751 150 0.25 0.29 3.56 0.34
Prohexadione 984 102 0.14 0.40 1.46 0.46
Prohexadione-calcium 393 39 0.06 0.11 2.09 0.79
6-benzyladenine 121 17 0.02 0.07 1.00 0.94
56%
22%
14%
7%
<1%
Figure 11- Dessert apples - Cox- Reasons for use of growth regulators (where given)
growth control
skin finish
thinning
growth control/skin finish
fruit set

9
Dessert apples (Cox) – Insecticides
• Formulation area treated: 7,330 hectares
• Weight of active substances applied: 0.89 tonnes
• The five most common formulations were:
Formulation area treated
(ha)
Weight of a.s. applied (kg)
Proportion of insecticide –treated area
Proportion of area grown
Average number of
applications (where applied)
Average proportion of
maximum product label
rate
Thiacloprid 1,801 300 0.25 0.74 1.42 0.92
Chlorantraniliprole 1,742 60 0.24 0.67 1.53 0.99
Methoxyfenozide 1,240 146 0.17 0.53 1.36 0.82
Indoxacarb 894 64 0.12 0.42 1.25 0.95
Flonicamid 834 58 0.11 0.43 1.15 0.99
26%
22%
12%
11%
6%
23%
Figure 12 - Dessert apples - Cox - Reasons for use of insecticides (where given)
codling moth
caterpillars
rosy apple aphid
aphids
blossom weevil
other pests

10
Dessert apples (Cox) – Herbicides In line with all other crops presented in this report, herbicides are generally applied to a strip at the base of the trees in order to keep the area clear of weeds. The areas reported for herbicide usage are the full orchard area. However, the reported weight of herbicides applied takes into account the proportion of treated strip within each orchard and reflects the actual weight of herbicides used.
• Formulation area treated: 4,505 hectares
• Weight of active substances applied: 3.0 tonnes
• The five most common formulations were:
Formulation area treated
(ha)
Weight of a.s. applied (kg)
Proportion of herbicide –treated area
Proportion of area grown
Average number of
applications (where applied)
Average proportion of
maximum product label
rate
Glyphosate 2,245 1,633 0.50 0.84 1.56 0.33
Dicamba/MCPA/mecoprop-P 810 673 0.18 0.28 1.67 0.48
2,4-D 692 402 0.16 0.33 1.22 0.42
Propyzamide 230 88 0.05 0.14 1.00 0.23
Glufosinate-ammonium 180 56 0.04 0.11 1.00 0.41
88%
5%4%
2% 1% <1%<1%
Figure 13 - Dessert apples - Cox - Reasons for use of herbicides (where given)
general weed control
grass weeds
thistles
cleavers
nettles
mayweed
fat hen
Dessert apples (Cox) – Other pesticides All other pesticide groups applied to Cox apples together accounted for 5% or less of the total treated area and 8% of the weight applied. The discrepancy between the area treated and the weight applied is due to the use of urea, applied at relatively high rates per hectare. Other pesticide groups included urea, acaricides and growth stimulants. However, in terms of weight applied, urea accounted for 99.2 % of the total weight of other pesticides applied. The use of sulphur, primarily for rust mite control, accounted for less than 1% of the treated area and less than 1% of the weight applied.

11
Dessert apples (others)
• 5,670 hectares of dessert apples (other) grown in the United Kingdom
• 230,578 treated hectares
• 136.5 tonnes applied
• 9% of dessert apples (other) remained untreated
• Dessert apples (other) received on average 17 fungicides, 5 insecticides, 3 growth regulators and 2 herbicides
• Gala (and clones) and Braeburn were the two main varieties grown, accounting for 43% and 17% of the total respectively
0
10
20
30
40
50
60
70
80
90
Acaricides Insecticides Fungicides Growthregulators
Herbicides Sulphur Urea All otherpesticides
Pe
rcen
tage
of t
otal
Figure 14 - Usage of pesticides on dessert apples (others) - 2016
Area treated
Weight applied
0
5
10
15
20
25
30
35
40
45
50
Jan Feb Mar Apr May Jun Jul Aug Sep Oct Nov Dec
Pe
rcen
tage
of a
pplic
atio
ns
Figure 15 - Timing of pesticide applications on dessert apples (others) - 2016
Acaricides
Fungicides
Insecticides
Herbicides
Growth regulators
Sulphur

12
Dessert apples (others) – Fungicides
• Formulation area treated: 165,896 hectares
• Weight of active substances applied: 111.0 tonnes
• The five most common formulations were:
Formulation area treated
(ha)
Weight of a.s. applied (kg)
Proportion of fungicide-
treated area
Proportion of area grown
Average number of
applications (where applied)
Average proportion of
maximum product label
rate
Captan 32,831 49,281 0.20 0.84 6.89 0.84
Myclobutanil 24,453 1,532 0.15 0.80 5.41 0.70
Penconazole 13,783 564 0.08 0.74 3.27 0.82
Dithianon 10,676 5,667 0.06 0.70 2.68 0.86
Difenoconazole 10,216 508 0.06 0.70 2.58 0.99
56%
22%
5%
5%
4%
2%6%
Figure 16 - Dessert apples - (others) - Reasons for use of fungicides (where given)
scab
mildew
powdery mildew
mildew/scab
canker
storage rots
other diseases
Sulphur accounted for less than 1% of the overall area of dessert apples (others) but 1% of the weight applied. It was used primarily for the control of rust mites, powdery mildew and other diseases.

13
Dessert apples (others) – Growth regulators
• Formulation area treated: 9,500 hectares
• Weight of active substances applied: 0.51 tonnes
• The five most common formulations were:
Formulation area treated
(ha)
Weight of a.s. applied (kg)
Proportion of growth
regulator –treated area
Proportion of area grown
Average number of
applications (where applied)
Average proportion of
maximum product label
rate
Gibberellins 3,565 9 0.36 0.23 2.77 0.48
Paclobutrazol 2,073 161 0.21 0.12 3.11 0.31
Prohexadione 1,821 171 0.18 0.25 1.31 0.40
Prohexadione-calcium 690 69 0.07 0.09 1.34 0.80
6-benzyladenine 626 73 0.06 0.11 1.00 0.78
50%
27%
18%
<1% 2% 1%
Figure 17 - Dessert apples - (others) - Reasons for use of growth regulators (where given)
growth control
skin finish
thinning
fruit set
fruit set/skin finish
growth control/skin finish

14
Dessert apples (others) – Insecticides
• Formulation area treated: 24,381 hectares
• Weight of active substances applied: 2.7 tonnes
• The five most common formulations were:
Formulation area treated
(ha)
Weight of a.s. applied (kg)
Proportion of insecticide –treated area
Proportion of area grown
Average number of
applications (where applied)
Average proportion of
maximum product label
rate
Thiacloprid 6,092 1,027 0.25 0.70 1.53 0.94
Chlorantraniliprole 5,994 207 0.25 0.65 1.62 0.99
Methoxyfenozide 3,689 432 0.15 0.56 1.16 0.81
Flonicamid 2,730 185 0.11 0.43 1.11 0.97
Indoxacarb 2,209 144 0.09 0.32 1.18 0.87
31%
20%20%
15%
5%
5%4%
Figure 18 - Dessert apples - (others) - Reasons for use of insecticides (where given)
codling moth
rosy apple aphid
caterpillars
aphids
tortrix
blossom weevil
woolly aphid

15
Dessert apples (others) – Herbicides
• Formulation area treated: 17,277 hectares
• Weight of active substances applied: 9.3 tonnes
• The five most common formulations were:
Formulation area treated
(ha)
Weight of a.s. applied (kg)
Proportion of herbicide –treated area
Proportion of area grown
Average number of
applications (where applied)
Average proportion of
maximum product label
rate
Glyphosate 7,025 4,387 0.42 0.78 1.56 0.30
Dicamba/MCPA/mecoprop-P 3,202 2,092 0.19 0.37 1.53 0.38
2,4-D 2,644 1,500 0.16 0.38 1.24 0.40
Propyzamide 990 357 0.06 0.16 1.03 0.21
Glufosinate-ammonium 912 212 0.05 0.14 1.12 0.31
89%
4%
3%
2% 2%
Figure 19 - Dessert apples - (others) - Reasons for use of herbicides (where given)
general weed control
grass weeds
thistles
cleavers
nettles
Dessert apples (others) – Other pesticides
All other pesticide groups applied to dessert apples (others) accounted for 5% of the total treated area and included urea, acaricides and growth stimulants. However, in terms of weight, urea accounted for 8% of the total weight of active substances applied.

16
Culinary apples The culinary apple and Bramley apple reports have been combined this year for the first time. The area of other culinary apples (excluding Bramley) is now so small that grower confidentiality is at risk by reportin g them as a separate crop category.
• 3,672 hectares of culinary apples grown in the United Kingdom, of which Bramley apples comprised 99% of the total
• 121,373 treated hectares
• 68.5 tonnes applied
• 6% of culinary apples remained untreated
• Culinary apples received on average 15 fungicides, 4 insecticides, 3 growth regulators and 2 herbicides
• 39% of the area of culinary apples was grown in Northern Ireland
0
10
20
30
40
50
60
70
80
90
Acaricides Insecticides Fungicides Growthregulators
Herbicides Sulphur Urea All otherpesticides
Pe
rcen
tage
of t
otal
Figure 20 - Usage of pesticides on culinary apples -2016
Area treated
Weight applied
0
10
20
30
40
50
60
70
Jan Feb Mar Apr May Jun Jul Aug Sep Oct Nov Dec
Pe
rcen
tage
of a
pplic
atio
ns
Figure 21 - Timing of pesticide applications on culinary apples - 2016
Acaricides
Fungicides
Insecticides
Herbicides
Growth regulators
Sulphur

17
Culinary apples – Fungicides
• Formulation area treated: 85,758 hectares
• Weight of active substances applied: 56.7 tonnes
• The five most common formulations were:
Formulation area treated
(ha)
Weight of a.s. applied (kg)
Proportion of fungicide-
treated area
Proportion of area grown
Average number of
applications (where applied)
Average proportion of
maximum product label
rate
Captan 14,244 19,136 0.17 0.77 5.01 0.67
Myclobutanil 10,084 630 0.12 0.69 3.98 0.69
Dithianon 7,202 3,515 0.08 0.57 3.42 0.82
Mancozeb 6,926 9,864 0.08 0.42 4.54 0.59
Pyrimethanil 6,833 2,251 0.08 0.80 2.31 0.76
77%
10%
4%
2%
2% 2% 3%
Figure 22 - Culinary apples - Reasons for use of fungicides (where given)
scab
mildew
general disease cont
storage rots
mildew/scab
canker
other diseases
The use of sulphur accounted for 1% of the area of Bramley apples treated, but for 2% of the total weight of pesticides applied, reflecting the relatively high rate of application of this product.

18
Culinary apples – Growth regulators
• Formulation area treated: 7,439 hectares
• Weight of active substances applied: 0.51 tonnes
• The five formulations encountered were:
Formulation area treated
(ha)
Weight of a.s. applied (kg)
Proportion of growth
regulator –treated area
Proportion of area grown
Average number of
applications (where applied)
Average proportion of
maximum product label
rate
Paclobutrazol 2,522 217 0.34 0.18 3.64 0.34
Prohexadione 2,042 194 0.27 0.34 1.62 0.41
Gibberellins 1,612 4 0.21 0.24 1.79 0.50
Prohexadione-calcium 1,242 95 0.16 0.22 1.54 0.61
Metamitron 88 23 0.01 0.02 1.00 0.80
88%
9%
1% <1%1%
Figure 23 - Culinary apples - Reasons for use of growth regulators (where given)
growth control
skin finish
fruit set/skin finish
thinning
fruit set/growth control

19
Culinary apples – Insecticides
• Formulation area treated: 12,977 hectares
• Weight of active substances applied: 1.4 tonnes
• The five most common formulations were:
Formulation area treated
(ha)
Weight of a.s. applied (kg)
Proportion of insecticide –treated area
Proportion of area grown
Average number of
applications (where applied)
Average proportion of
maximum product label
rate
Chlorantraniliprole 2,375 80 0.18 0.45 1.42 0.97
Methoxyfenozide 2,348 299 0.18 0.47 1.35 0.88
Thiacloprid 2,125 360 0.16 0.40 1.46 0.94
Cypermethrin 2,114 50 0.16 0.33 1.72 0.94
Flonicamid 1,880 131 0.14 0.42 1.21 1.00
19%
16%
15%12%
7%3%
2%2%
2%
22%
Figure 24 - Culinary apples - Reasons for use of insecticides (where given)
aphids
caterpillars
codling moth
rosy apple aphid
codling/tortrix
blastobasis
blossom weevil
aphids/caterpillars
woolly aphid
other pests

20
Culinary apples – Herbicides
• Formulation area treated: 10,265 hectares
• Weight of active substances applied: 5.2 tonnes
• The five most common formulations were:
Formulation area treated
(ha)
Weight of a.s. applied (kg)
Proportion of herbicide –treated area
Proportion of area grown
Average number of
applications (where applied)
Average proportion of
maximum product label
rate
Glyphosate 4,986 2,748 0.49 0.86 1.56 0.29
Dicamba/MCPA/mecoprop-P 2,284 1,300 0.22 0.41 1.50 0.32
2,4-D 846 487 0.08 0.21 1.12 0.40
MCPA 623 228 0.06 0.11 1.51 0.21
Propyzamide 258 87 0.03 0.07 1.00 0.20
90%
5%
3%2% <1%
Figure 25 - Culinary apples - Reasons for use of herbicides (where given)
general weed control
grass weeds
blw
thistles
cleavers
Culinary apples – Other pesticides All other pesticide groups applied to culinary apples accounted for 3% of the total treated area and included urea, acaricides and growth stimulants. However, in terms of weight applied, urea accounted for 6% of the total.

21
Cider apples & perry pears
• 9,617 hectares of cider apples & perry pears grown in the United Kingdom
• 95,658 treated hectares
• 60.4 tonnes applied
• 24% of cider apples & perry pears remained untreated
• Many of the untreated crops included older, traditional type orchards, that were both grazed (e.g. by sheep) and grassed to the tree base
• Cider apples & perry pears received on average 6 fungicides, 1 insecticide, 2 herbicides and 1 sulphur
application
0
10
20
30
40
50
60
70
80
Acaricides Insecticides Fungicides Growthregulators
Herbicides Sulphur Urea
Pe
rcen
tage
of t
otal
Figure 26 - Usage of pesticides on cider apples and perry pears - 2016
Area treated
Weight applied
0
10
20
30
40
50
60
70
80
90
Jan Feb Mar Apr May Jun Jul Aug Sep Oct Nov Dec
Pe
rcen
tage
of a
pplic
atio
ns
Figure 27 - Timing of pesticide applications on cider apples & perry pears - 2016
Acaricides
Fungicides
Insecticides
Herbicides
Growth regulators
Sulphur

22
Cider apples & perry pears – Fungicides
• Formulation area treated: 66,020 hectares
• Weight of active substances applied: 39.9 tonnes
• The five most common formulations were:
Formulation area treated
(ha)
Weight of a.s. applied (kg)
Proportion of fungicide-
treated area
Proportion of area grown
Average number of
applications (where applied)
Average proportion of
maximum product label
rate
Dodine 18,641 16,509 0.28 0.71 2.72 0.89
Dithianon 8,792 4,659 0.13 0.32 2.85 0.69
Myclobutanil 8,116 685 0.12 0.35 2.41 0.94
Dithianon/pyraclostrobin 6,115 2,380 0.09 0.32 2.00 0.97
Penconazole 5,555 260 0.08 0.34 1.70 0.93
69%
26%
3% 1% 1% <1%
Figure 28 - Cider apples & perry pears - Reasons for use of fungicides (where given)
scab
mildew
blossom wilt
mildew/scab
powdery mildew
other diseases

23
Cider apples & perry pears – Sulphur
• Formulation area treated: 3,759 hectares
• Weight of active substances applied: 10.8 tonnes The only reason specified for sulphur usage was mildew control. Cider apples & perry pears – Growth regulators
• Formulation area treated: 675 hectares
• Weight of active substances applied: 0.14 tonnes
• The five formulations encountered were:
Formulation area treated
(ha)
Weight of a.s. applied (kg)
Proportion of growth
regulator –treated area
Proportion of area grown
Average number of
applications (where applied)
Average proportion of
maximum product label
rate
2-chloroethylphosphonic acid 412 120 0.61 0.04 1.00 0.81
Prohexadione-calcium 149 12 0.22 0.01 1.36 0.64
1-naphthylacetic acid 53 1 0.08 0.01 1.00 volumetric
6-benzyladenine 53 7 0.08 0.01 1.00 0.87
Prohexadione 7 1 0.01 0.00 1.00 0.49
Fruit ripening was the main reason specified for 80% of applications and growth control the remaining 20%.

24
Cider apples & perry pears – Insecticides
• Formulation area treated: 9,743 hectares
• Weight of active substances applied: 2.1 tonnes
• The five most common formulations were:
Formulation area treated
(ha)
Weight of a.s. applied (kg)
Proportion of insecticide –treated area
Proportion of area grown
Average number of
applications (where applied)
Average proportion of
maximum product label
rate
Thiacloprid 2,965 382 0.30 0.26 1.19 0.72
Chlorpyrifos 2,616 1,369 0.27 0.27 1.00 0.55
Methoxyfenozide 1,630 223 0.17 0.17 1.00 0.95
Chlorantraniliprole 954 32 0.10 0.09 1.10 0.96
Flonicamid 622 43 0.06 0.06 1.03 0.98
30%
27%
16%
13%
3%
3% 3%
5%
Figure 29 - Cider apples & perry pears - Reasons for use of insecticides (where given)
caterpillars
blossom weevil
rosy apple aphid
sawfly
aphids
caterpillars/sawfly
weevil
other pests

25
Cider apples & perry pears – Herbicides
• Formulation area treated: 14,097 hectares
• Weight of active substances applied: 5.3 tonnes
• The five most common formulations were:
Formulation area treated
(ha)
Weight of a.s. applied (kg)
Proportion of herbicide –treated area
Proportion of area grown
Average number of
applications (where applied)
Average proportion of
maximum product label
rate
Glyphosate 8,475 3,298 0.60 0.63 1.40 0.21
2,4-D 2,283 668 0.16 0.19 1.22 0.21
Dicamba/MCPA/mecoprop-P 1,687 759 0.12 0.16 1.10 0.26
2,4-D/glyphosate 776 352 0.06 0.08 1.00 0.23
Glufosinate-ammonium 673 133 0.05 0.07 1.00 0.26
Almost all (94%) herbicide usage was for general weed control with 5% being for nettle/dock control and 1% for thistle control. Cider apples & perry pears – Other pesticides Other pesticides encountered included urea and acaricides. Usage of acaricides was minimal. Urea accounted for 1% of the overall treated area and 3% of the weight applied.

26
Pears
• 1,907 hectares of pears grown in the United Kingdom
• 68,353 treated hectares
• 64.4 tonnes applied
• 3% of pears remained untreated
• Pears received on average 15 fungicides, 7 growth regulators, 3 sulphur applications, 3 insecticides, 2 herbicides and 1 acaricide
0
10
20
30
40
50
60
Acaricides Insecticides Fungicides Growthregulators
Herbicides Sulphur Urea All otherpesticides
Pe
rcen
tage
of t
otal
Figure 30 - Usage of pesticides on pears - 2016
Area treated
Weight applied
0
10
20
30
40
50
60
70
80
Jan Feb Mar Apr May Jun Jul Aug Sep Oct Nov Dec
Pe
rcen
tage
of a
pplic
atio
ns
Figure 31 - Timing of pesticide applications on pears - 2016
Acaricides
Fungicides
Insecticides
Herbicides
Growth regulators
Sulphur

27
Pears – Fungicides
• Formulation area treated: 32,089 hectares
• Weight of active substances applied: 31.7 tonnes
• The five most common formulations were:
Formulation area treated
(ha)
Weight of a.s. applied (kg)
Proportion of fungicide-
treated area
Proportion of area grown
Average number of
applications (where applied)
Average proportion of
maximum product label
rate
Captan 13,338 20,217 0.42 0.95 7.35 0.85
Copper oxychloride 2,848 2,731 0.09 0.74 2.02 0.40
Dithianon 2,697 1,483 0.08 0.61 2.31 0.87
Dodine 2,645 2,251 0.08 0.75 1.85 0.85
Pyrimethanil 1,813 543 0.06 0.57 1.67 0.71
71%
8%
6%
5%
3%7%
Figure 32 - Pears - Reasons for use of fungicides (where given)
scab
storage rots
canker/scab
canker
mildew
other diseases

28
Pears – Sulphur
• Formulation area treated: 4,221 hectares
• Weight of active substances applied: 10.8 tonnes
34%
15%13%
13%
10%
7%
6%
2%
Figure 33 - Pears - Reasons for use of sulphur (where given)
scab
disease/pear sucker
pear sucker
blister mite
pear midge
powdery mildew
scab/blister mite
rust mites
Pears – Growth regulators
• Formulation area treated: 12,340 hectares
• Weight of active substances applied: 0.4 tonnes
• The five formulations encountered were:
Formulation area treated
(ha)
Weight of a.s. applied (kg)
Proportion of growth
regulator –treated area
Proportion of area grown
Average number of
applications (where applied)
Average proportion of
maximum product label
rate
Gibberellins 7,047 24 0.57 0.85 4.30 0.66
Paclobutrazol 4,284 282 0.35 0.51 4.38 0.26
Prohexadione 652 40 0.05 0.29 1.19 0.49
Prohexadione-calcium 250 14 0.02 0.13 1.00 0.45
Gibberellic acid 96 1 0.01 0.03 1.45 1.00
58%18%
17%
6%
1%
Figure 34 - Pears - Reasons for use of growth regulators (where given)
growth control
fruit set/skin finish
skin finish
fruit set
fruit set/growth control

29
Pears – Insecticides
• Formulation area treated: 5,022 hectares
• Weight of active substances applied: 1.0 tonnes
• The five most common formulations were:
Formulation area treated
(ha)
Weight of a.s. applied (kg)
Proportion of insecticide –treated area
Proportion of area grown
Average number of
applications (where applied)
Average proportion of
maximum product label
rate
Chlorantraniliprole 1,609 56 0.32 0.57 1.49 0.99
Methoxyfenozide 1,119 138 0.22 0.48 1.21 0.85
Thiacloprid 586 101 0.12 0.23 1.32 0.96
Chlorpyrifos 509 244 0.10 0.27 1.00 0.50
Indoxacarb 379 23 0.08 0.16 1.24 0.82
37%
14%10%
10%
7%
5%
4%
4%
9%
Figure 35 - Pears - Reasons for use of insecticides (where given)
codling moth
pear sucker
winter moth
caterpillars
pear midge
codling/tortrix
tortrix
aphids
other pests

30
Pears – Acaricides
• Formulation area treated: 750 hectares
• Weight of active substances applied: <0.1 tonnes
• The two formulations encountered were:
Formulation area treated
(ha)
Weight of a.s. applied (kg)
Proportion of acaricide –treated area
Proportion of area grown
Average number of
applications (where applied)
Average proportion of
maximum product label
rate
Spirodiclofen 677 97 0.90 0.35 1.01 0.99
Abamectin 73 1 0.10 0.03 1.16 0.86
95%
5%
<1%
Figure 36 - Pears - Reasons for use of acaricides (where given)
pear sucker
other pests
rust mites
The reasons for use show that active substances, such as abamectin and spirodiclofen, whilst registered primarily for acaricide usage and classified within this report as acaricides, can have both acaricidal and insecticidal uses.

31
Pears – Herbicides
• Formulation area treated: 5,170 hectares
• Weight of active substances applied: 3.2 tonnes
• The five most common formulations were:
Formulation area treated
(ha)
Weight of a.s. applied (kg)
Proportion of herbicide –treated area
Proportion of area grown
Average number of
applications (where applied)
Average proportion of
maximum product label
rate
Glyphosate 2,473 1,692 0.48 0.84 1.51 0.32
Dicamba/MCPA/mecoprop-P 1,139 803 0.22 0.37 1.60 0.41
2,4-D 678 453 0.13 0.28 1.28 0.46
Glufosinate-ammonium 342 83 0.07 0.15 1.22 0.32
Propyzamide 197 67 0.04 0.08 1.00 0.20
90%
8%
1% 1%
Figure 37 - Pears - Reasons for use of herbicides (where given)
general weed control
nettles
grass weeds
thistles
Pears – Other pesticides Urea accounted for 9% of the area of pesticides used on pears, biological control agents 2%, repellents 1% and growth stimulants less than one percent. By weight applied, urea comprised 13% of the total. The only biological control agents recorded on pears were the predatory bugs Anthocoris spp, used for the control of pear sucker.

32
PESTICIDE USAGE ON STONE FRUITS AND NUTS Plums
• 888 hectares of plums grown in the United Kingdom
• 8,715 treated hectares
• 3.3 tonnes applied
• 27% of plums remained untreated
• Plums received on average 10 fungicides, 6 insecticides, 2 herbicides and 2 growth regulators
0
5
10
15
20
25
30
35
40
45
Acaricides Insecticides Fungicides Growthregulators
Herbicides Sulphur Urea All otherpesticides
Pe
rce
ntag
e o
f tot
al
Figure 38 - Usage of pesticides on plums - 2016
Area treated
Weight applied
0
5
10
15
20
25
30
35
40
45
Jan Feb Mar Apr May Jun Jul Aug Sep Oct Nov Dec
Pe
rcen
tage
of a
pplic
atio
ns
Figure 39 - Timing of pesticide applications on plums - 2016
Fungicides
Insecticides
Herbicides
Growth regulators

33
Plums – Fungicides
• Formulation area treated: 3,658 hectares
• Weight of active substances applied: 1.1 tonnes
• The five most common formulations were:
Formulation area treated
(ha)
Weight of a.s. applied (kg)
Proportion of fungicide-
treated area
Proportion of area grown
Average number of
applications (where applied)
Average proportion of
maximum product label
rate
Fenbuconazole 920 62 0.25 0.54 1.91 0.91
Myclobutanil 841 74 0.23 0.37 2.59 0.77
Copper oxychloride 562 482 0.15 0.34 1.88 0.35
Cyprodinil/fludioxonil 545 152 0.15 0.38 1.63 0.72
Boscalid/pyraclostrobin 463 110 0.13 0.35 1.51 0.95
17%
17%
16%14%
12%
12%
12%
Figure 40 - Plums - Reasons for use of fungicides (where given)
powdery mildew/scab
canker
botrytis
botrytis/brown rot
blossom wilt
scab/storage rots
blossom wilt/brown rot

34
Plums – Insecticides
• Formulation area treated: 2,567 hectares
• Weight of active substances applied: 0.38 tonnes
• The five most common formulations were:
Formulation area treated
(ha)
Weight of a.s. applied (kg)
Proportion of insecticide –treated area
Proportion of area grown
Average number of
applications (where applied)
Average proportion of
maximum product label
rate
Methoxyfenozide 539 63 0.21 0.48 1.26 0.98
Thiacloprid 483 63 0.19 0.45 1.20 0.91
Diflubenzuron 397 53 0.15 0.32 1.42 0.92
Spinosad 370 44 0.14 0.31 1.33 0.98
Deltamethrin 190 1 0.07 0.18 1.16 volumetric
42%
31%
11%
7%
5%4%
Figure 41 - Plums - Reasons for use of insecticides (where given)
plum moth
aphids
codling moth
spotted-wing drosophila
caterpillars
plum sawfly/scale

35
Plums – Herbicides
• Formulation area treated: 942 hectares
• Weight of active substances applied: 0.7 tonnes
• The five most common formulations were:
Formulation area treated
(ha)
Weight of a.s. applied (kg)
Proportion of herbicide –treated area
Proportion of area grown
Average number of
applications (where applied)
Average proportion of
maximum product label
rate
Glyphosate 453 343 0.48 0.34 1.52 0.34
Dicamba/MCPA/mecoprop-P 157 128 0.17 0.09 1.91 0.47
2,4-D 129 109 0.14 0.11 1.35 0.40
Pendimethalin 101 55 0.11 0.11 1.00 0.42
Propyzamide 43 14 0.05 0.05 1.00 0.19
General weed control (99%) and thistle control were the only reasons specified for herbicide usage. Plums – Other pesticides
All other pesticide groups applied to plums accounted for 16% of the total treated area and included urea, growth stimulants, physical controls, disinfectants and acaricides. Urea accounted for 11% of the area treated. In terms of weight applied urea accounted for 27% of the weight of all pesticides applied to plums.

36
Cherries
• 902 hectares of cherries grown in the United Kingdom
• 21,928 treated hectares
• 14.9 tonnes applied
• 1% of cherries remained untreated
• Cherries received on average 14 fungicides, 7 insecticides, 2 herbicides and 3 growth stimulants
0
10
20
30
40
50
60
Acaricides Insecticides Fungicides Growthregulators
Herbicides Urea All otherpesticides
Pe
rce
ntag
e o
f tot
al
Figure 42 - Usage of pesticides on cherries - 2016
Area treated
Weight applied
0
10
20
30
40
50
60
70
Jan Feb Mar Apr May Jun Jul Aug Sep Oct Nov Dec
Pe
rcen
tage
of a
pplic
atio
ns
Figure 43 - Timing of pesticide applications on cherries - 2016
Fungicides
Insecticides
Herbicides
Acaricides

37
Cherries – Fungicides
• Formulation area treated: 9,438 hectares
• Weight of active substances applied: 4.9 tonnes
• The five most common formulations were:
Formulation area treated
(ha)
Weight of a.s. applied (kg)
Proportion of fungicide-
treated area
Proportion of area grown
Average number of
applications (where applied)
Average proportion of
maximum product label
rate
Copper oxychloride 2,502 2,788 0.27 0.75 3.71 0.48
Fenhexamid 1,793 1,328 0.19 0.86 2.32 0.99
Boscalid/pyraclostrobin 1,752 436 0.19 0.84 2.32 0.99
Cyprodinil/fludioxonil 1,620 278 0.17 0.82 2.18 0.39
Fenbuconazole 1,362 67 0.14 0.85 1.77 0.99
41%
18%
14%
10%
7%
2% 8%
Figure 44 - Cherries - Reasons for use of fungicides (where given)
botrytis
blossom wilt
storage rots
botrytis/brown rot
canker
brown rot
other diseases

38
Cherries – Insecticides
• Formulation area treated: 5,571 hectares
• Weight of active substances applied: 0.66 tonnes
• The five most common formulations were:
Formulation area treated
(ha)
Weight of a.s. applied (kg)
Proportion of insecticide –treated area
Proportion of area grown
Average number of
applications (where applied)
Average proportion of
maximum product label
rate
Spinosad 999 113 0.18 0.65 1.70 0.94
Cyantraniliprole 933 84 0.17 0.62 1.67 1.00
Indoxacarb 756 44 0.14 0.61 1.37 0.92
Thiacloprid 739 103 0.13 0.79 1.04 0.93
Pirimicarb 650 176 0.12 0.44 1.65 0.97
67%
19%
9%
1%
4%
Figure 45 - Cherries - Reasons for use of insecticides (where given)
spotted-wing drosophila
aphids
cherry blackfly
spotted-wing drosophila/tortrix
other pests
In 2016, the control of spotted-wing drosophila on cherries accounted for 67% of reasons given for insecticide use, in contrast with only 7% in 2014; this reflects the increasing importance of this newly emerging pest.

39
Cherries – Herbicides
• Formulation area treated: 2,824 hectares
• Weight of active substances applied: 2.0 tonnes
• The five most common formulations were:
Formulation area treated
(ha)
Weight of a.s. applied (kg)
Proportion of herbicide –treated area
Proportion of area grown
Average number of
applications (where applied)
Average proportion of
maximum product label
rate
Glyphosate 1,199 933 0.42 0.77 1.73 0.34
Dicamba/MCPA/mecoprop-P 605 484 0.21 0.24 2.74 0.46
Glufosinate-ammonium 373 173 0.13 0.27 1.51 0.62
Pendimethalin 241 183 0.09 0.27 1.00 0.58
Propyzamide 189 197 0.07 0.21 1.00 0.61
General weed control accounted for 96% of all herbicide applications with grass weed control accounting for the remaining 4%. Cherries – Other pesticides The growth stimulant harpin protein, used to prevent fruit split, accounted for 2% of the total area of cherries treated, but less than 1% of the weight applied. Other groups recorded included urea (16% of the area treated, 49% of the weight of all pesticides applied), acaricides, biological controls, molluscicides, disinfectants and growth stimulants. Phytoseiulus persimilis was the only biological control agent recorded on cherries.

40
Other orchard crops including nuts
• 561 hectares of other orchard crops including nuts grown in the United Kingdom
• 3,879 treated hectares
• 2.2 tonnes applied
• 30% of other orchard crops including nuts remained untreated
• Other orchard crops including nuts received on average 6 fungicides, 1 insecticide and 1 herbicide
• Other orchard crops included apricots, hazelnuts, quinces, walnuts, sweet chestnut, almond and peaches
• Inputs on other orchard crops including nuts varied widely, reflecting the diversity of fruit types included in this category
0
5
10
15
20
25
30
35
40
45
50
Acaricides Insecticides Fungicides Herbicides Sulphur Urea All otherpesticides
Pe
rcen
tage
of t
otal
Figure 46 - Usage of pesticides on other orchard crops including nuts - 2016
Area treated
Weight applied
0
10
20
30
40
50
60
Jan Feb Mar Apr May Jun Jul Aug Sep Oct Nov Dec
Pe
rcen
tage
of a
pplic
atio
ns
Figure 47 - Timing of pesticide applications on other orchard crops including nuts -2016
Fungicides
Insecticides
Herbicides
Sulphur

41
Other orchard crops including nuts – Fungicides
• Formulation area treated: 1,365 hectares
• Weight of active substances applied: 0.34 tonnes
• The five most common formulations were:
Formulation area treated
(ha)
Weight of a.s. applied (kg)
Proportion of fungicide -
treated area
Proportion of area grown
Average number of
applications (where applied)
Average proportion of
maximum product label
rate
Myclobutanil 582 33 0.43 0.28 3.75 2.46
Boscalid/pyraclostrobin 302 74 0.22 0.28 1.95 0.98
Cyprodinil/fludioxonil 223 78 0.16 0.28 1.43 0.91
Tebuconazole 166 23 0.12 0.18 1.65 0.90
Copper oxychloride 62 115 0.05 0.09 1.23 1.30
Most fungicide applications, 42%, were used for mildew control, with 37% for blossom wilt and 21% for scab. Other orchard crops including nuts – Herbicides
• Formulation area treated: 753 hectares
• Weight of active substances applied: 0.52 tonnes
• The five formulations encountered were:
Formulation area treated
(ha)
Weight of a.s. applied (kg)
Proportion of herbicide-
treated area
Proportion of area grown
Average number of
applications (where applied)
Average proportion of
maximum product label
rate
Glyphosate 430 329 0.57 0.40 1.91 0.43
2,4-D 110 74 0.15 0.19 1.02 0.32
Dicamba/MCPA/mecoprop-P 106 91 0.14 0.19 1.00 0.50
Glufosinate-ammonium 106 32 0.14 0.19 1.00 0.40
Pendimethalin 2 2 0.00 0.00 1.00 0.67
Other orchard crops including nuts – Insecticides
• Formulation area treated: 717 hectares
• Weight of active substances applied: <0.1 tonnes
• The five formulations encountered were:
Formulation area treated
(ha)
Weight of a.s. applied (kg)
Proportion of insecticide -treated area
Proportion of area grown
Average number of
applications (where applied)
Average proportion of
maximum product label
rate
Lambda-cyhalothrin 343 3 0.48 0.33 1.85 0.95
Thiacloprid 218 39 0.30 0.20 1.94 1.00
Indoxacarb 106 3 0.15 0.19 1.00 1.00
Bacillus thuringiensis var. kurstaki 35 13 0.05 0.06 1.00 1.00
Chlorpyrifos 6 3 0.01 0.01 1.00 0.50

42
Other orchard crops including nuts – Other pesticides Other pesticides recorded on other orchard crops including nuts were urea, growth stimulants, acaricides and physical controls. They accounted for 21% of the area treated and 31% of the weight applied.

43
APPENDIX 1 – FOLIAR APPLICATION TABLES Table 1 Area of orchard crops grown in the United Kingdom, 2016 (hectares)
East
Midlands Eastern London & South East
North East
North West
South West
West Midlands
Yorkshire & the
Humber
Wales Scotland Northern Ireland
United Kingdom
Dessert apples (Cox) 28 330 1,101 . 6 94 145 . . . . 1,704
Dessert apples (others) 42 470 4,041 19 62 495 479 . . 32 29 5,670
Culinary apples 155 298 1,591 22 1 44 110 . . 3 1,447 3,672
Pears 2 266 1,438 . 5 81 103 . 1 5 6 1,907
Cider apples & perry pears 57 . 13 . . 2,939 6,159 95 354 . . 9,617
Plums . 170 453 . 81 88 64 . 1 28 3 888
Cherries . 10 540 . . 8 315 . . 30 . 902
Other top fruit (incl. nuts) . 34 412 . 11 . 103 . . . . 561
All crops 285 1,578 9,589 41 166 3,748 7,479 95 356 98 1,484 24,921

44
Table 2 Treated area of orchard crops in the United Kingdom, 2016, by crop group (spray hectares)
Chemical group Dessert apples Culinary apples Pears Cider apples
& perry pears Plums Cherries Other orchard
crops (incl. nuts)
Total all orchard crops
Cox others Acaricides 185 847 272 750 36 15 142 6 2,253 Insecticides 7,330 24,381 12,977 5,022 9,743 2,567 5,571 717 68,308 Fungicides 47,163 165,896 85,758 32,089 66,020 3,658 9,438 1,365 411,387
Growth regulators 7,019 9,943 7,527 675 12,376 77 92 . 37,709 Herbicides 4,455 16,834 10,177 14,097 5,133 942 2,824 753 55,214 Sulphur 180 691 545 4,221 3,759 21 . 212 9,628 Urea 3,156 11,985 4,111 6,446 1,329 965 3,402 536 31,929 Biological controls . . . 1,548 . . 88 . 1,636 All other pesticides 3 <1 5 768 . 471 372 290 1,909 All pesticides 69,491 230,578 121,373 68,353 95,658 8,715 21,927 3,879 619,973 Area grown 1,704 5,670 3,672 1,907 9,617 888 902 561 24,921
Table 2a Treated weight of orchard crops in the United Kingdom, 2016, by crop group (kg active substance applied)
Chemical group Dessert apples Culinary apples Pears Cider apples
& perry pears Plums Cherries Other orchard
crops (incl. nuts)
Total all orchard crops
Cox others Acaricides 27 128 37 97 4 2 27 <1 322 Insecticides 885 2,733 1,381 975 2,129 384 616 62 9,165 Fungicides 36,563 110,993 56,681 31,742 39,939 1,066 4,939 344 282,266 Growth regulators 339 612 536 141 370 26 2 . 2,026 Herbicides 2,956 9,239 5,141 5,276 3,171 662 2,029 528 29,003 Sulphur 215 1,396 740 10,809 10,825 16 . 593 24,594 Urea 3,385 11,393 4,046 2,106 8,466 892 7,286 665 38,240 Biological controls . . . . . . . . . All other pesticides <1 <1 <1 8,798 . 277 26 12 9,116 All pesticides 44,370 136,494 68,562 59,944 64,904 3,325 14,925 2,204 394,732

45
Table 3 Usage of pesticides on orchard crops in the United Kingdom, 2016 - percentage area of crops treated with pesticides
Insecticides Acaricides Biological control agents
Fungicides Sulphur Herbicides Growth regulators
Not treated
Dessert apples (Cox) 95.5 8.8 . 96.4 8.7 85.8 75.9 3.6
Dessert apples (others) 85.9 12.6 . 90.4 5.9 81.9 59.3 8.8
Culinary apples 89.6 7.1 . 93.3 6.5 88.3 61.4 6.3
Pears 63 0.4 . 75.4 27.8 67.9 5.5 23.7
Cider apples & perry pears 90.4 36.8 42.6 96.6 67.4 87.7 86.6 3.2
Plums 69.9 1.4 . 60.2 2.3 36.3 6.7 27.1
Cherries 93.8 13.6 4.9 96.1 . 87.1 10 1.4
Other orchard crops (incl. nuts) 67.5 1.1 . 40.8 18.9 40 . 29.7
All crops 77.9 8 3.4 84 19.3 75.8 37.1 14.2
Table 4a Usage of pesticides on orchard crops in the United Kingdom, 2016 – mean number of spray rounds applied to treated crops Insecticides Acaricides Biological
control agents Fungicides Sulphur Herbicides Growth
regulators All
pesticides
Dessert apples (Cox) 4.4 1.2 . 17.1 1.2 2.2 4.7 19.7
Dessert apples (others) 4.7 1.1 . 17.2 2.7 2.3 2.9 20.1
Culinary apples 3.5 1.1 . 14.5 1.8 1.8 3.3 16.9
Pears 1.4 1 . 6.2 1.4 1.7 1.1 8.1
Cider apples & perry pears 3 1 1.8 13.8 3.1 1.9 7.1 17.7
Plums 5.6 1 . 7.9 1 2 2 11.1
Cherries 7 1 . 11.1 . 2.4 1 15.8
Other orchard crops (incl. nuts) 1.4 1 . 5.8 2 1.4 . 6.1
All crops 4.4 1.1 1.8 14.1 2.4 2.1 3.9 17

46
Table 4b Usage of pesticides on orchard crops in the United Kingdom, 2016 – mean number of products applied to treated crops
Insecticides Acaricides Biological control agents
Fungicides Sulphur Herbicides Growth regulators
All pesticides
Dessert apples (Cox) 4.6 1.2 . 31.4 1.2 3.5 5.5 43.5
Dessert apples (others) 5 1.1 . 32.1 2.7 3.7 3.1 42.6
Culinary apples 3.6 1.1 . 24.2 1.8 2.9 3.5 32.6
Pears 1.4 1 . 8.7 1.4 2 1.3 11.7
Cider apples & perry pears 3 1 1.8 17.1 3.1 2.9 7.9 32.8
Plums 5.6 1.2 . 8.3 1 3.4 2 15.9
Cherries 7.6 1 . 11.5 . 4.2 1 22.7
Other orchard crops (incl. nuts) 1.6 1 . 6.8 2 1.6 . 7.7
All crops 4.6 1.1 1.8 23.1 2.4 3.3 4.3 32.8
Table 4c Usage of pesticides on orchard crops in the United Kingdom, 2016 – mean number of active substances applied to treated crops
Insecticides Acaricides Biological control agents
Fungicides Sulphur Herbicides Growth regulators
All pesticides
Dessert apples (Cox) 4.6 1.2 . 34.7 1.2 5.3 5.5 48.3
Dessert apples (others) 5 1.1 . 35 2.7 5.5 3.1 47
Culinary apples 3.6 1.1 . 26.8 1.8 4.2 3.5 36.5
Pears 1.4 1 . 9.7 1.4 2.4 1.3 13
Cider apples & perry pears 3 1 1.8 18.9 3.1 4.4 7.9 35.9
Plums 5.6 1.2 . 10.4 1 5.4 2 19.1
Cherries 7.6 1 . 15.8 . 7.2 1 29.4
Other orchard crops (incl. nuts) 1.6 1 . 9.8 2 1.8 . 10
All crops 4.6 1.1 1.8 25.8 2.4 5 4.3 36.9

47
Table 5 Estimated usage of pesticides on orchard crops grown in the United Kingdom, 2016 (spray hectares)
1 Copper fungicides are also used for their bactericidal activity against bacterial canker in cherries and plums
2 Other fungicides include Bacillus subtilis, copper sulphate, mancozeb/metalaxyl-m and thiophanate-methyl
Dessert apples
- Cox Dessert apples
- others Culinary apples Pears
Cider apples & perry pears Plums Cherries
Other orchard crops
(incl. nuts)
Total all orchard crops
Fungicides
Boscalid/pyraclostrobin 1,591 6,584 3,985 1,760 578 463 1,752 302 17,015
Bupirimate 1,189 2,371 834 15 1,537 . . . 5,946
Captan 8,957 32,831 14,244 13,338 5,370 4 <1 6 74,751
Copper oxychloride1 2,149 8,285 2,708 2,848 1,192 562 2,502 62 20,307
Cyflufenamid 2,020 5,746 1,790 132 1,352 . . . 11,039
Cyprodinil/fludioxonil 393 1,291 904 327 6 545 1,620 223 5,310
Difenoconazole 2,184 10,216 4,206 1,014 3,634 . . . 21,254
Dithianon 3,294 10,676 7,202 2,697 8,793 . . . 32,662 Dithianon/potassium phosphonate (phosphite)
1,943 4,572 3,127 1,006 . . . . 10,648
Dithianon/pyraclostrobin 741 2,173 1,619 330 6,115 . . . 10,979
Dodine 2,064 8,265 6,342 2,645 18,641 . . . 37,957
Fenbuconazole 192 1,034 2,857 170 1,281 920 1,362 16 7,831
Fenhexamid . . <1 . . 322 1,793 6 2,122
Fludioxonil 406 1,298 569 696 . . . . 2,969
Kresoxim-methyl 2,025 6,615 1,988 23 562 . . . 11,212
Mancozeb 51 2,198 6,926 613 47 . . . 9,835
Meptyldinocap 1,306 3,642 773 9 498 . . . 6,228
Myclobutanil 7,387 24,453 10,084 1,291 8,116 841 402 582 53,157
Penconazole 3,532 13,783 4,751 238 5,555 . . . 27,859
Penthiopyrad 1,119 4,307 2,368 260 841 . . . 8,895
Potassium hydrogen carbonate 1,473 2,810 401 162 436 . . . 5,282
Pyrimethanil 2,168 9,192 6,833 1,813 1,415 1 <1 2 21,425
Tebuconazole 954 3,546 1,220 701 53 . . 166 6,639
Other fungicides2 25 9 27 . . . 6 . 67
All fungicides 47,162 165,897 85,757 32,089 66,020 3,659 9,436 1,365 411,387 Sulphur 180 689 545 4,221 3,759 21 . 212 9,627
Urea 3,156 11,985 4,111 6,446 1,329 965 3,402 542 31,935

48
Table 5 (cont.) Estimated usage of pesticides on orchard crops grown in the United Kingdom, 2016 (spray hectares)
Dessert apples - Cox
Dessert apples - others
Culinary apples
Pears Cider apples & perry pears
Plums Cherries Other orchard
crops (incl. nuts)
Total all orchard crops
Acaricides
Spirodiclofen 133 442 203 677 13 4 26 . 1,499
Other acaricides 1 52 405 69 73 23 11 116 6 754
All acaricides 185 847 272 750 36 15 142 6 2,253
Insecticides
Acetamiprid 114 650 159 . 140 169 568 . 1,800
Chlorantraniliprole 1,742 5,994 2,375 1,609 954 . . . 12,675
Chlorpyrifos 462 1,262 689 509 2,616 183 . 6 5,727
Cyantraniliprole . 16 <1 4 . 93 933 . 1,047
Cypermethrin 48 927 2,114 23 . . . . 3,112
Diflubenzuron 48 55 27 102 . 397 1 . 631
Flonicamid 834 2,730 1,880 69 622 . . . 6,135
Indoxacarb 894 2,209 979 379 257 14 756 106 5,594
Lambda-cyhalothrin . 91 . 114 . 48 309 343 905
Methoxyfenozide 1,240 3,689 2,348 1,119 1,630 539 <1 . 10,565
Pirimicarb 66 293 172 1 190 15 650 . 1,388
Pyrethrins 4 54 . 4 277 56 615 . 1,009
Spinosad 22 26 3 8 . 370 999 6 1,434
Thiacloprid 1,801 6,092 2,125 586 2,965 483 739 218 15,007
Other insecticides 2 55 294 107 92 495 199 0 38 1,280
All insecticides 7,330 24,382 12,976 9,743 5,022 2,566 5,570 717 68,308
1Other acaricides include abamectin, clofentezine, fenpyroximate and tebufenpyrad 2 Other insecticides include Bacillus thuringiensis var. kurstaki, Cydia pomonella granulovirus, deltamethrin, fatty acids, fenoxycarb and polysaccharides

49
Table 5 (cont.) Estimated usage of pesticides on orchard crops grown in the United Kingdom, 2016 (spray hectares)
Dessert apples
- Cox Dessert apples
- others Culinary apples Pears
Cider apples & perry pears Plums Cherries
Other orchard crops
(incl. nuts)
Total all orchard crops
Herbicides
2,4-D 692 2,644 846 678 2,283 129 43 110 7,426
2,4-D/glyphosate 45 615 126 . 777 . . . 1,563
Dicamba/MCPA/mecoprop-P 810 3,202 2,284 1,139 1,687 157 605 106 9,990
Fluroxypyr 74 366 211 81 50 . 3 . 785
Glufosinate-ammonium 180 912 224 342 673 35 373 106 2,845
Glyphosate 2,245 7,025 4,986 2,473 8,475 453 1,199 430 27,286
MCPA . 6 623 . 48 . . . 677
Pendimethalin 83 282 67 77 7 101 241 2 859
Propyzamide 230 990 258 198 . 43 189 . 1,907
Other herbicides 1 72 547 97 412 132 . . . 1,260
All herbicides 4,455 16,833 10,177 14,096 5,134 942 2,824 753 55,214
1Other herbicides include 2,4-D/MCPA, amitrole, carfentrazone-ethyl, clopyralid, clopyralid/triclopyr, dicamba/mecoprop-p, diquat, florasulam/pyroxsulam, fluazifop-p-butyl, isoxaben, metribuzin, metsulfuron-methyl/tribenuron-methyl and napropamide
50
Table 5 (cont.) Estimated usage of pesticides on orchard crops grown in the United Kingdom, 2016 (spray hectares)
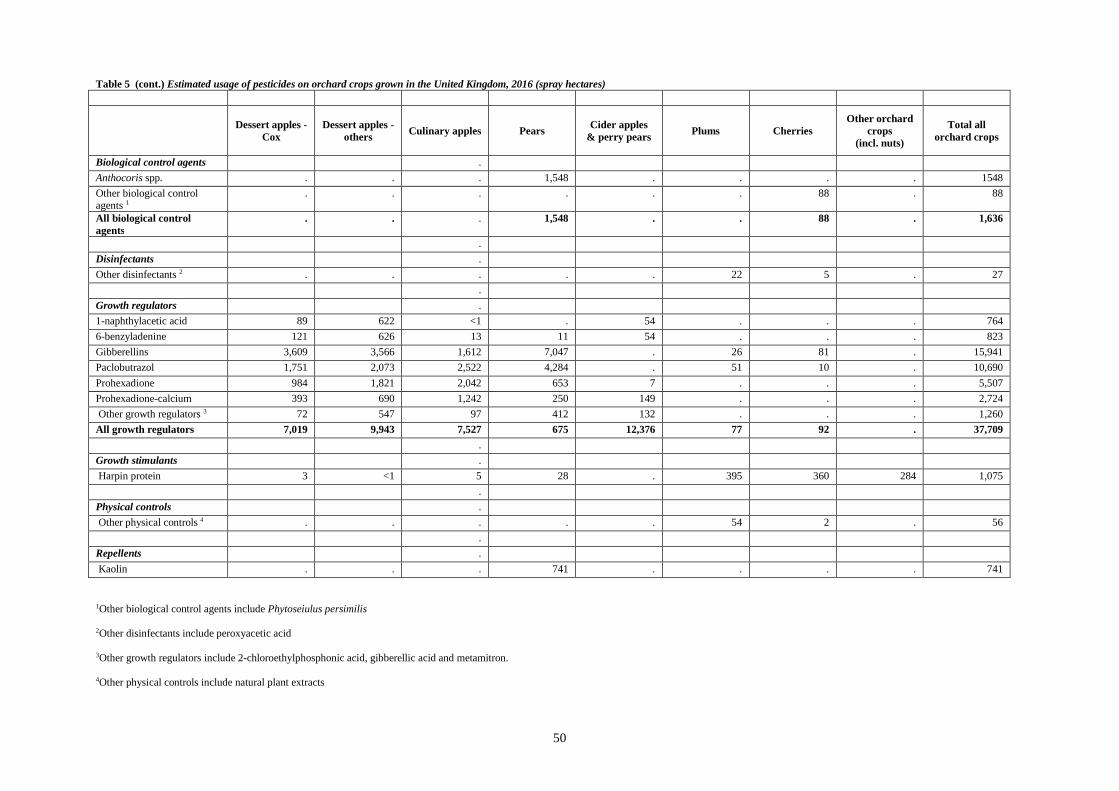
1Other biological control agents include Phytoseiulus persimilis 2Other disinfectants include peroxyacetic acid 3Other growth regulators include 2-chloroethylphosphonic acid, gibberellic acid and metamitron. 4Other physical controls include natural plant extracts
Dessert apples -
Cox Dessert apples -
others Culinary apples Pears Cider apples
& perry pears Plums Cherries Other orchard
crops (incl. nuts)
Total all orchard crops
Biological control agents .
Anthocoris spp. . . . 1,548 . . . . 1548
Other biological control agents 1
. . . . . . 88 . 88
All biological control agents
. . . 1,548 . . 88 . 1,636
.
Disinfectants .
Other disinfectants 2 . . . . . 22 5 . 27
.
Growth regulators .
1-naphthylacetic acid 89 622 <1 . 54 . . . 764
6-benzyladenine 121 626 13 11 54 . . . 823
Gibberellins 3,609 3,566 1,612 7,047 . 26 81 . 15,941
Paclobutrazol 1,751 2,073 2,522 4,284 . 51 10 . 10,690
Prohexadione 984 1,821 2,042 653 7 . . . 5,507
Prohexadione-calcium 393 690 1,242 250 149 . . . 2,724
Other growth regulators 3 72 547 97 412 132 . . . 1,260
All growth regulators 7,019 9,943 7,527 675 12,376 77 92 . 37,709
.
Growth stimulants .
Harpin protein 3 <1 5 28 . 395 360 284 1,075
.
Physical controls .
Other physical controls 4 . . . . . 54 2 . 56
.
Repellents .
Kaolin . . . 741 . . . . 741

51
Table 6 Estimated usage of pesticides on orchard crops grown in the United Kingdom, 2016 (kg active substance)
Dessert apples -
Cox Dessert apples -
others Culinary apples Pears Cider apples
& perry pears Plums Cherries Other orchard
crops (incl. nuts)
Total all orchard crops
Fungicides
Boscalid/pyraclostrobin 476 1,988 1,159 536 157 110 436 74 4,935
Bupirimate 97 222 91 1 142 . . . 554
Captan 13,168 49,281 19,136 20,217 7,646 7 2 10 109,466
Copper oxychloride1 2,705 8,982 4,177 2,731 1,012 482 2,788 115 22,993
Cyflufenamid 50 141 45 3 30 . . . 269
Cyprodinil/fludioxonil 173 619 450 163 3 152 278 78 1,916
Difenoconazole 108 508 210 51 177 . . . 1,054
Dithianon 1,623 5,667 3,515 1,483 4,659 . . . 16,947
Dithianon/potassium phosphonate (phosphite)
3,296 7,626 5,315 1,715 . . . . 17,952
Dithianon/pyraclostrobin 295 863 610 132 2,380 . . . 4,279
Dodine 1,702 6,899 5,267 2,251 16,509 . . . 32,627
Fenbuconazole 9 57 143 9 75 63 67 <1 424
Fenhexamid . . <1 . . 179 1,328 9 1,517
Fludioxonil 91 292 123 156 . . . . 662
Kresoxim-methyl 202 659 198 2 56 . . . 1,116
Mancozeb 77 3,156 9,864 836 72 . . . 14,004
Meptyldinocap 267 738 155 2 86 . . . 1,248
Myclobutanil 444 1,532 630 78 685 74 40 33 3,516
Penconazole 146 564 190 12 260 . . . 1,172
Penthiopyrad 168 643 347 39 126 . . . 1,322
Potassium hydrogen carbonate
10,643 17,055 2,549 688 5,393 . . . 36,329
Pyrimethanil 672 2,987 2,251 543 467 <1 <1 <1 6,921
Tebuconazole 132 509 177 93 5 . . 23 938
Other fungicides 2 18 7 81 . . . . .
All fungicides 36,562 110,993 56,680 31,742 39,939 1,066 4,938 342 282,265
Sulphur 215 1,394 740 10,809 10,825 16 . 593 24,593 Urea 3,385 11,393 4,046 2,106 8,466 892 7,286 665 38,240
1 Copper fungicides are also used for their bactericidal activity against bacterial canker in cherries and plums.
2 Other fungicides include Bacillus subtilis, copper sulphate, mancozeb/metalaxyl-m and thiophanate-methyl

52
Table 6 (cont.) Estimated usage of pesticides on orchard crops grown in the United Kingdom, 2016 (kg active substance)
Dessert apples -
Cox Dessert apples -
others Culinary apples Pears
Cider apples & perry pears Plums Cherries
Other orchard crops
(incl. nuts)
Total all orchard crops
Acaricides
Spirodiclofen 19 62 28 97 2 <1 4 . 212
Other acaricides 1 7 66 9 0 2 0 23 . 109
All acaricides 26 128 37 97 4 . 27 . 321
Insecticides
Acetamiprid 7 42 12 . 9 9 42 . 120
Chlorantraniliprole 60 207 80 56 32 . . . 436
Chlorpyrifos 214 556 332 244 1,369 135 . 3 2,853
Cyantraniliprole . 2 <1 <1 . 8 84 . 94
Cypermethrin 1 23 50 <1 . . . . 74
Diflubenzuron 6 7 4 15 . 53 <1 . 85
Flonicamid 58 185 131 5 43 . . . 422
Indoxacarb 64 144 69 23 8 <1 44 3 356
Lambda-cyhalothrin . <1 . 1 . <1 3 3 8
Methoxyfenozide 146 432 299 138 223 63 <1 . 1,301
Pirimicarb 18 81 40 <1 48 1 176 . 364
Pyrethrins <1 3 . <1 15 4 51 . 74
Spinosad 2 3 <1 1 . 44 113 <1 163
Thiacloprid 300 1,027 360 101 382 63 103 39 2,375
Other insecticides 2 7 20 4 390 0 3 0 13 439
All insecticides 884 2,732 1,380 974 2,128 383 616 61 9,165
1Other acaricides include abamectin, clofentezine, fenpyroximate and tebufenpyrad 1Other insecticides include Bacillus thuringiensis var. kurstaki, Cydia pomonella granulovirus, deltamethrin, fatty acids, fenoxycarb and polysaccharides

53
Table 6 (cont.) Estimated usage of pesticides on orchard crops grown in the United Kingdom, 2016 (kg active substance)
Dessert apples
- Cox Dessert apples
- others Culinary apples Pears Cider apples
& perry pears Plums Cherries Other orchard
crops (incl. nuts)
Total all orchard crops
Herbicides
2,4-D 402 1,500 487 453 668 109 39 74 3,732
2,4-D/glyphosate 28 399 81 . 352 . . . 860
Dicamba/MCPA/mecoprop-P 673 2,092 1,300 803 759 128 484 91 6,329
Fluroxypyr 5 30 25 9 3 . <1 . 73
Glufosinate-ammonium 56 212 47 83 133 9 173 32 745
Glyphosate 1,633 4,387 2,748 1,692 3,298 343 933 329 15,362
MCPA . 1 228 . 50 . . . 280
Pendimethalin 59 167 48 51 4 55 183 2 569
Propyzamide 89 357 87 67 . 14 197 . 810
Other herbicides 1 11 92 89 9 13 4 19 . 241 All herbicides 2,955 9,237 5,140 5,275 3,171 662 2,028 528 29,000 1Other herbicides include 2,4-D/MCPA, amitrole, carfentrazone-ethyl, clopyralid, clopyralid/triclopyr, dicamba/mecoprop-p, diquat, florasulam/pyroxsulam, fluazifop-p-butyl, isoxaben, metribuzin, metsulfuron-methyl/tribenuron-methyl and napropamide

54
Table 6 (cont.) Estimated usage of pesticides on orchard crops grown in the United Kingdom, 2016 (kg active substance)
Dessert apples - Cox
Dessert apples - others
Culinary apples
Pears Cider apples & perry pears
Plums Cherries Other orchard crops
(incl. nuts)
Total all orchard crops
Other disinfectants
Other disinfectants1 . . . . . 3 <1 . 4
Growth regulators
1-naphthylacetic acid 1 6 <1 . <1 . . . 8
6-benzyladenine 17 73 2 2 7 . . . 100
Gibberellins 11 9 4 24 . <1 <1 . 48
Paclobutrazol 150 161 217 282 . 26 1 . 837
Prohexadione 102 171 194 40 <1 . . . 508
Prohexadione-calcium 39 69 95 14 12 . . . 229
Other growth regulators2 20 123 25 120 8 . . . 296
All growth regulators 339 612 536 139 370 26 1 0 2,026
Growth stimulant
Harpin protein <1 <1 <1 4 . 5 18 <1 28
Other physical control agents
Other physical control agents3 0 0 0 0 0 269 8 . 277
Molluscicides & repellents
Kaolin . . . 8,794 . . . . 8,794
1Other disinfectants include peroxyacetic acid 2Other growth regulators include 2-chloroethylphosphonic acid, gibberellic acid and metamitron 3Other physical control agents include natural plant extracts

55
1Not encountered in 2014
Table 7 Estimated area (ha) of application of the fifty most extensively used active substances on all orchard crops surveyed in 2016 in the United Kingdom
Active substance Area treated 2016 (ha)
Area treated 2014 (ha)
% change on 2014 Movement
1 Captan 74,751 80,973 -8 �
2 Dithianon 54,288 52,185 4 �
3 Myclobutanil 53,157 44,580 19 �
4 Dodine 37,957 39,962 -5 �
5 Urea 31,935 41,244 -23 �
6 Glyphosate 28,849 22,121 30 �
7 Pyraclostrobin 27,994 26,093 7 �
8 Penconazole 27,859 38,811 -28 �
9 Pyrimethanil 21,425 20,627 4 �
10 Difenoconazole 21,254 20,698 3 �
11 Copper oxychloride 20,307 21,313 -5 �
12 Boscalid 17,015 14,351 19 �
13 Gibberellins 15,941 19,252 -17 �
14 Thiacloprid 15,007 8,252 82 �
15 Chlorantraniliprole 12,675 9,593 32 �
16 Kresoxim-methyl 11,212 9,007 24 �
17 Cyflufenamid 11,039 8,240 34 �
18 MCPA 10,692 12,489 -14 �
19 Paclobutrazol 10,690 15,990 -33 �
20 Potassium phosphonate (phosphite)1 10,648 0 . �
21 Methoxyfenozide 10,565 9,000 17 �
22 Mecoprop-P 10,237 12,391 -17 �
23 Dicamba 10,237 12,335 -17 �
24 Mancozeb 9,857 9,404 5 �
25 Sulphur 9,626 11,275 -15 �
26 2,4-D 9,013 2,752 228 �
27 Penthiopyrad1 8,895 0 . �
28 Fludioxonil 8,279 2,674 210 �
29 Fenbuconazole 7,831 8,717 -10 �
30 Tebuconazole 6,639 4,275 55 �
31 Meptyldinocap 6,228 5,405 15 �
32 Flonicamid 6,135 8,206 -25 �
33 Bupirimate 5,946 7,626 -22 �
34 Chlorpyrifos 5,727 24,249 -76 �
35 Indoxacarb 5,594 2,731 105 �
36 Prohexadione1 5,507 0 . � 37 Cyprodinil 5,310 2,621 103 � 38 Potassium hydrogen carbonate 5,282 4,819 10 �
39 Cypermethrin 3,112 2,026 54 �
40 Glufosinate-ammonium 2,845 4,411 -35 �
41 Prohexadione-calcium 2,724 6,089 -55 �
42 Fenhexamid 2,122 2,062 3 �
43 Propyzamide 1,907 846 125 � 44 Acetamiprid 1,800 86 1,991 � 45 Anthocorids 1,511 1,268 19 �
46 Spirodiclofen 1,499 1,481 1 �
47 Spinosad 1,434 271 429 �
48 Pirimicarb 1,388 2,716 -49 �
49 Harpin protein 1,075 1,965 -45 �
50 Cyantraniliprole1 1,047 0 . �

56
Table 8 Estimated amount (kg) of the fifty most extensively used active substances on all orchard crops surveyed in 2016 in the United Kingdom
Active substance Amount used 2016 (kg) Amount used 2014 (kg) % change on 2014 Movement
1 Captan 109,466 121,957 -10 �
2 Urea 38,124 49,782 -23 �
3 Potassium hydrogen carbonate 36,329 29,519 23 �
4 Dodine 32,627 35,749 -9 �
5 Sulphur 24,592 26,687 -8 �
6 Copper oxychloride 22,993 20,877 10 �
7 Dithianon 21,287 25,026 -15 �
8 Glyphosate 15,878 12,505 27 �
9 Potassium phosphonate (phosphite) 1 14,681 0 .
�
10 Mancozeb 14,018 14,576 -4 �
11 Kaolin 8,794 10,420 -16 �
12 Pyrimethanil 6,921 6,266 10 �
13 MCPA 5,477 5,506 -1 �
14 Pyraclostrobin 4,787 4,771 0 �
15 2,4-D 4,080 1,258 224 �
16 Myclobutanil 3,516 3,113 13 �
17 Boscalid 3,358 2,831 19 � 18 Chlorpyrifos 2,853 15,343 -81 �
19 Thiacloprid 2,375 1,192 99 �
20 Fenhexamid 1,517 1,337 13 �
21 Fludioxonil 1,429 392 265 �
22 Penthiopyrad1 1,322 0 . � 23 Methoxyfenozide 1,301 1,205 8 �
24 Meptyldinocap 1,248 1,119 12 �
25 Penconazole 1,171 1,578 -26 � 26 Cyprodinil 1,150 571 101 �
27 Kresoxim-methyl 1,116 896 25 �
28 Difenoconazole 1,054 990 6 �
29 Tebuconazole 938 646 45 �
30 Mecoprop-P 881 899 -2 �
31 Paclobutrazol 837 1,166 -28 �
32 Propyzamide 810 400 103 �
33 Glufosinate-ammonium 745 1,100 -32 �
34 Pendimethalin 569 197 188 �
35 Bupirimate 553 740 -25 �
36 Prohexadione1 508 0 . �
37 Chlorantraniliprole 436 333 31 �
38 Fenbuconazole 424 455 -7 �
39 Flonicamid 422 572 -26 � 40 Pirimicarb 364 675 -46 � 41 Indoxacarb 356 186 92 �
42 Dicamba 305 327 -7 �
43 Fatty acids 298 168 77 �
44 Natural plant extracts1 277 0 . �
45 Cyflufenamid 269 202 33 �
46 Prohexadione-calcium 229 577 -60 �
47 Spirodiclofen 212 207 2 �
48 Spinosad 163 32 415 �
49 Metamitron1 149 0 . �
50 2-chloroethylphosphonic acid 146 39 274 �
1Not encountered in 2014
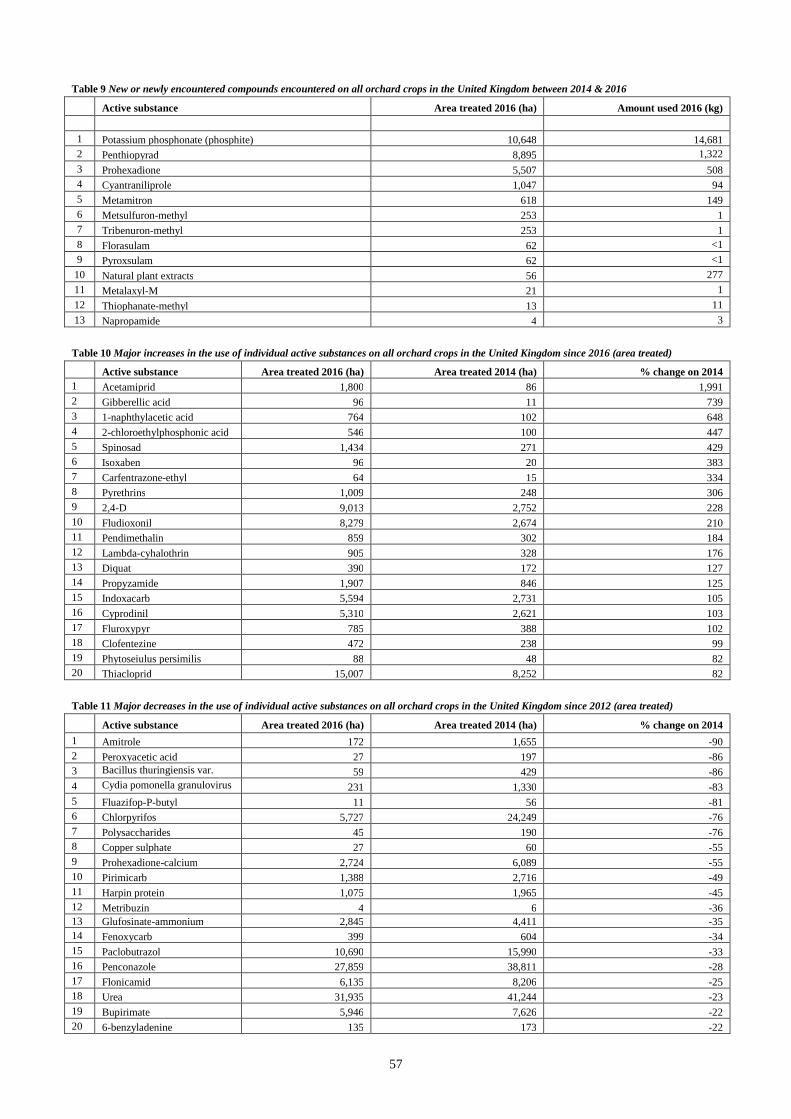
57
Table 9 New or newly encountered compounds encountered on all orchard crops in the United Kingdom between 2014 & 2016
Active substance Area treated 2016 (ha) Amount used 2016 (kg)
1 Potassium phosphonate (phosphite) 10,648 14,681 2 Penthiopyrad 8,895 1,322
3 Prohexadione 5,507 508 4 Cyantraniliprole 1,047 94 5 Metamitron 618 149 6 Metsulfuron-methyl 253 1 7 Tribenuron-methyl 253 1 8 Florasulam 62 <1
9 Pyroxsulam 62 <1
10 Natural plant extracts 56 277
11 Metalaxyl-M 21 1
12 Thiophanate-methyl 13 11
13 Napropamide 4 3
Table 10 Major increases in the use of individual active substances on all orchard crops in the United Kingdom since 2016 (area treated)
Active substance Area treated 2016 (ha) Area treated 2014 (ha) % change on 2014 1 Acetamiprid 1,800 86 1,991 2 Gibberellic acid 96 11 739 3 1-naphthylacetic acid 764 102 648 4 2-chloroethylphosphonic acid 546 100 447 5 Spinosad 1,434 271 429 6 Isoxaben 96 20 383 7 Carfentrazone-ethyl 64 15 334 8 Pyrethrins 1,009 248 306 9 2,4-D 9,013 2,752 228 10 Fludioxonil 8,279 2,674 210 11 Pendimethalin 859 302 184 12 Lambda-cyhalothrin 905 328 176 13 Diquat 390 172 127 14 Propyzamide 1,907 846 125 15 Indoxacarb 5,594 2,731 105 16 Cyprodinil 5,310 2,621 103 17 Fluroxypyr 785 388 102 18 Clofentezine 472 238 99 19 Phytoseiulus persimilis 88 48 82 20 Thiacloprid 15,007 8,252 82
Table 11 Major decreases in the use of individual active substances on all orchard crops in the United Kingdom since 2012 (area treated)
Active substance Area treated 2016 (ha) Area treated 2014 (ha) % change on 2014
1 Amitrole 172 1,655 -90 2 Peroxyacetic acid 27 197 -86 3 Bacillus thuringiensis var.
kurstaki 59 429 -86
4 Cydia pomonella granulovirus
231 1,330 -83 5 Fluazifop-P-butyl 11 56 -81 6 Chlorpyrifos 5,727 24,249 -76 7 Polysaccharides 45 190 -76 8 Copper sulphate 27 60 -55 9 Prohexadione-calcium 2,724 6,089 -55 10 Pirimicarb 1,388 2,716 -49 11 Harpin protein 1,075 1,965 -45 12 Metribuzin 4 6 -36 13 Glufosinate-ammonium 2,845 4,411 -35 14 Fenoxycarb 399 604 -34 15 Paclobutrazol 10,690 15,990 -33 16 Penconazole 27,859 38,811 -28 17 Flonicamid 6,135 8,206 -25 18 Urea 31,935 41,244 -23 19 Bupirimate 5,946 7,626 -22 20 6-benzyladenine 135 173 -22

58
Table 12 Comparison of pesticide usage on all orchard crops in the United Kingdom, 2010 - 2016, area treated (ha) and amount used (t)
Chemical 20121 2014 2016
ha t ha t ha t
Acaricides 2,087 <1 1,943 <1 2,253 <1
Insecticides 63,919 18 71,151 20 68,308 9
Biological control agents 4,520 . 1,397 . 1,636 .
Fungicides 402,792 295 395,932 274 411,387 282
Sulphur 11,929 32 11,275 27 9,628 25
Growth regulators 43,590 2 42,286 2 37,709 2
Herbicides 46,635 24 45,834 23 55,214 29
Molluscicides & repellents 939 13 879 10 745 9
Urea 21,301 30 41,244 50 31,929 38
Other pesticides 2,295 1 2,502 <1 1,164 <1
Total - all pesticides 600,006 407 614,442 407 619,973 395
Area grown (ha) 22,458 23,433 24,921
1Data for 2012 excludes information from Scotland

59
APPENDIX 2 – DEFINITIONS a) 'Pesticide' is used throughout this report to include commercial formulations containing active substances of insecticides, acaricides, molluscicides, fungicides, herbicides, desiccants, soil sterilants, nematicides and growth regulators. b) 'Treated area' is the gross area treated with a pesticide, including all repeat applications. For Tables 7 – 11 this includes repeat applications of individual active substances. All other figures relate to the areas treated with each product, which may include a single or multiple active substances. c) 'Reason for application' indicated in the text is the grower's stated reason for use of that particular pesticide on that crop and may not always seem entirely appropriate. d) Where individual pesticides are mentioned in the text, they are listed in descending order of use by hectares treated. e) The term “formulation(s)” used within the text is used here to describe either single active substances or mixtures of active substances contained within an individual product. It does not refer to any of the solvents, pH modifiers, adjuvants also contained within a product that contribute to its efficacy. f) For the purposes of this survey the total area of orchard crops was taken as the sum of the areas of the following crops: dessert apples (Cox), dessert apples (others), culinary apples (Bramley), culinary apples (others), pears, cider apples & perry pears, plums, cherries and other orchard crops (including nuts). g) Where indicated in the report “Cox” refers to “Cox’s Orange Pippin” and “Bramley” refers to “Bramley’s Seedling”. h) Where referred to as a pesticide group, other “pesticides” includes urea, physical control agents, growth stimulants, repellents and disinfectants. i) Volumetric rates – some products are applied using a standard dilution rate in a set volume of water. As growers’ water volume rates/hectare vary it is not possible to compare the actual rates with a pre-set maximum product rate. j) Pesticide applications include those applied prior to planting, or in some cases to crops that failed and were subsequently re-planted, and as these are associated with that crop they may appear as inappropriate uses. k) Where highlighted in the text the amount of active substance is calculated from the weight of product applied per hectare multiplied by the proportion of each individual active substance within a product. Arthropod biological control agents are applied by number rather than weight, so the weight of biological control agents refers only to preparations of bacterial and fungal origin. l) Non-registered pesticides, including biological control agents, are those that do not require to be and have not been put through, HSE’s pesticide approval process. They include macro-biological control agents such as predatory mites and parasitic wasps, physical control agents and disinfectants used for general cleansing and disinfection which are subject to the biocidal products regime. m) Physical control agents, such as maltodextrin, which is based on potato starch, work by blocking insect spiracles, causing death by suffocation. Other physical control agents include garlic, which repels and prevents insect pests landing on the crop. n) Products based on copper, commonly copper oxychloride, whilst listed as fungicides and used as fungicides on apple for canker control also have bactericidal activity on crops such as plums and cherries. o) Within this report herbicide usage consists primarily of applications made to a strip at the base of the trees to keep the area clear of weeds. The areas reported for herbicide usage are the full orchard area. However, the reported weight of herbicides applied considers the proportion of treated strip within each orchard and reflects the actual weight of herbicides used.

60
APPENDIX 3 – METHODOLOGY
METHODS
The samples of holdings to be surveyed were selected using data from the Agricultural Census Returns, June 2015 for England & Wales (Anon., 2016a, 2016b), for Scotland (Anon., 2016c) and Northern Ireland (Anon, 2016d). The samples were drawn from the census returns to represent the area of all orchard crops grown throughout England, Scotland, Wales and Northern Ireland. For England the sample was selected within each of the eight Government Office Regions (GORs), the Welsh Assembly Government provided a further sample, which represented the area grown in Wales, and for Scotland the country was divided into 11 land-use regions (Wood, 1931). As part of the Long-Term Service Agreement with Defra, there is a requirement for an overall maximum of 5% Relative Standard Error (RSE) by area treated for all the surveys conducted by the survey team. In the 2014 survey (the last time orchard crops were surveyed), the RSE was 6.2%. As the RSE were close to the overall target of 5% it was not felt necessary to reduce the sample size for the 2014 survey. The samples were stratified according to the total area of all orchard crops grown in each region and by size group based on the total area of orchard crops grown on each holding. The area of orchard crops sampled in each size group and each region was proportional to the total area of orchard crops grown on holdings of each size group in each region. All three survey teams followed the same methodology for data collection and used the same forms and instructions for their completion. The size groups, based on the total orchard area are as follows: <10ha (A); >10-<=20 ha (B); >20-<=30 ha (C); >30-<=80 ha (D); and >80 ha (E). For the purposes of this survey the total area of orchard crops was taken as the sum of the areas of the following crops: dessert apples (Cox), dessert apples (others), culinary apples (Bramley), culinary apples (others), pears, cider apples & perry pears, plums, cherries and other orchard crops (including nuts). An introductory letter was sent to the occupiers of the selected holdings explaining the purpose of the survey. A total of 293 holdings were surveyed during the winter of 2016/17 and data collected from the grower by an experienced pesticide usage surveyor. Where a holding listed in the original sample was not able to provide data it was replaced with another from the same size group and region, held on a reserve list. Within England and Wales a total of 330 holdings were contacted, of which 28 (8%) were not growing orchard crops commercially. Of the 302 premises growing orchard crops, 20 (6%) were unwilling to help with the survey; a further 6 (2%) either provided data after the deadline or were willing to help at a later date. A total of 227 orchard premises in the United Kingdom provided farm assurance data for the survey and of these 22 (10%) were registered organic on all or part of their holding. Commercial farm management software and in-house electronic record keeping systems are now used extensively within many areas of agriculture and horticulture. Electronic record keeping was used by 46% of the holdings contacted in England & Wales, with these records accounting for 69% of the total area of orchards grown and 83% of the total area treated. Of those using electronic record keeping 75% used commercial farm management software systems with the remaining 25% using in-house computer systems developed by the growers themselves. Where possible, and in order to minimise the burden on individual growers, pesticide usage data were emailed or posted by the growers back to the survey teams. In a few cases, and normally on smaller holdings, information was collected over the telephone. In total, data from 42% of the number of holdings in England & Wales were collected using non-visit methodologies, which together accounted for 34% of the area grown. One of the requirements placed on growers by their customers is the membership of farm assurance schemes. These schemes require detailed pesticide records (computer based or hand written) which ensure traceability and can be examined by crop assurance auditors at any time, but normally at least once each year. These records are used extensively by members of the survey team. Of the 227 holdings visited in the United Kingdom where assurance information was available, 59% were members of one or more crop assurance schemes, including those who supplied direct to cider manufacturers with their own protocols in place. However, in terms of area grown, membership of a crop assurance scheme or grower group on these farms accounted for 82% of the total area surveyed.

61
The Questionnaire
The questionnaire for the main part of the survey consisted of two forms, which were completed during an interview with the grower.
Form 1 summarised the areas of orchard crops grown on the designated holding during the 2015/2016 season.
Form 2 dealt with all aspects of pesticide usage on the individual crops grown on the holding and harvested in 2016, a separate form being used for each field/crop combination. These included pesticides applied prior to planting, or in some cases to crops that failed and were subsequently re-planted; as these are associated with that crop they may appear as inappropriate uses. Certain agronomic details that may have influenced pesticide usage (including inter-row and tree base percentages, tree type, orchard management, fruit storage, use of adjuvants and the volume of spray applied) were also recorded on form 2.
Raising factors
The pesticide usage data collected from each holding were raised by a ratio of two factors to give an estimate of regional usage using a standard ratio raising statistical technique; the first factor being dependent on farm size group and region (see Appendix 5) and the second dependent on crop area and region. The data were further adjusted by a third factor to compensate for regions in which specific crops were not sampled and to make estimates of total pesticide usage related to the national cropping areas in the United Kingdom (Thomas, 1999).
The raising factors were based on the areas of orchard crops grown and harvested in 2016 as recorded in the June Survey of Agriculture and Horticulture for England & Wales (Anon., 2017a, b), Scotland (Anon., 2017c) and Northern Ireland (Anon., 2017d). These, combined with data from the Defra Horticulture Statistics (HS) (Anon., 2017e), allowed estimates of the total area of individual orchard crops grown in the United Kingdom in 2016 to be made. In contrast to previous surveys, information on the area of ‘Other culinary apples were not available from the HS data, and for the purposes of this survey ‘Bramley’ and ‘Other culinary apples’ have been combined as ‘Culinary apples’.
Whilst we have confidence in the methodologies used for the pesticide usage surveys and the data collected from
individual farmers and growers (see Appendix 4), the raised estimates for individual crops will be subject to higher
standard errors simply because available data on National and Regional areas for individual crops is much more limited.
Where possible the survey team will use data collected as part of the June Survey to make estimates of national &
regional pesticide usage as this survey is subject to the same strict methodologies as our own. However, where these
estimates are not available then other sources of data such as the HS or a combination of June Survey data and our own
observations will be used and these data may therefore be associated with a higher standard error.
Neither the June Survey nor the HS data make regional estimates of individual orchard crops; these data therefore must
be estimated using a combination of our first raising factor, rf1, and the sampled area. In calculating our second raising
factor we ensured that the sum of all orchard crops grown within a region was proportional to the sampled area. A
comparison of the HS estimates and the June Survey shows that the June Survey area is the larger of the two. As the
original sampling frame was obtained using the June Survey data we have used this as our guide to the total area of
orchards, rather than using the HS estimates for the UK. However, the HS estimates have been useful in estimating the
relative proportions of each crop grown.
Throughout our data manipulations it was felt that estimates of other dessert apples and cherries underestimated the total
area grown within the UK. However, the absence of other reliable data sets and the potential for oversampling these
crops within this survey has meant that our existing estimates are likely to be the best available.

62
Rounding
Due to rounding of figures, the sum of constituent items in the tables may not agree exactly with the totals shown.
Error checking
Extensive checks are made on the data before, at the time of and following data entry. Data checking routines are used to verify the authenticity of the data collected including: the approval status of all crop/pesticide combinations; high and low rates of application; the methods of application used to apply pesticides; crop growth stages at the time of application; the timing of pesticide applications and consistency within a tank mix.
Further checks are made on the integrity of the relational database used to store the raw data collected ensuring that links to product databases are in place prior to the production of the report. The product databases used for the pesticide usage surveys are maintained alongside the commercial product database, LIAISON, which is used extensively by agronomists and the major farm management software companies.
Where inconsistencies are found, for example where there are high rates of application or non-approved product usage, these are checked first against the farm records and secondly with the grower and amended if necessary.
Reports are written and checked within the team after which they are sent to reviewers within the Working Party on Pesticide Usage Surveys for their comments and checking.
The final report is pre-announced and published via the ONS Publication Hub and the Fera Science Ltd. website in line with the Code of Practice for Official Statistics.
Data limitations and use of data
Our experience has shown that the proposed face to face interview and ‘main contact plus reserves approach’ delivers the highest quality data and minimises non- response bias; no other approach is likely to yield fit for purpose data to meet the quality requirements of the UKSA Code of Practice for Official Statistics. Drawing a fresh stratified random sample each year is clearly an appropriate survey methodology. The population of horticultural growers sampled for the PUS is much smaller than the number of arable holdings in England, so that, especially in the strata of larger enterprises, the same growers come around often so this sample is already closer to a panel than a sample from a larger population might be. These larger enterprises are vital to the statistical validity of the survey in that individually they can represent a significant proportion of the total area of orchards grown. As part of this survey Fera Science Ltd. has implemented the UK Statistics Authority Code of Practice for Official Statistics, published in 2009. Whilst all eight principles apply, we acknowledge, the following: • Integrity – in particular, that statistical reports must be issued separately from other statements or comments about the
figures, that the public interest prevails. • Confidentiality – the identity of individuals or their information is not revealed, information is kept secure and
respondents are informed how their confidentiality will be protected. • Proportionate burden - seeking participation through informed consent. • Accessibility – to all users, providing information on the quality and reliability of the statistics, adopting formats that
enhance clarity and consistency, disseminate in formats that encourage analysis and re-use. In accordance with the UKSA Code of Practice for Official Statistics, we work with Defra and HSE statisticians to build on our existing extensive and effective relationships with users of the surveys to further enhance user engagement. There are a broad spectrum of users and stakeholders across policy, research, agricultural supply industry (including consultancies), farming and horticultural businesses, NGOs and members of the public. Over the years we have an excellent record of listening to our users and incorporating their feedback into the way we collect and report our statistics.

63
APPENDIX 4 – STANDARD ERROR CALCULATIONS
Analysis of pesticide orchard usage survey The aim of the analysis of the results was to provide an estimate of the pesticide usage associated within each region and nationally. Estimates are derived from pesticide usage survey data which are stratified by region and holding size. The survey reports the mass of pesticide applied and the area to which it is applied. The survey information is combined with the total cultivated area within each stratum to provide an estimate of the total mass of pesticide used by region and nationally, and of the area sprayed. Each estimate (E) is provided with a standard error (se). In general we expect, with approximately 95% confidence, that the true quantity of pesticide used will lie within the interval:
Estimation method We are provided with information about holdings in J regions. Holdings are assigned one of K size classes. L holdings are surveyed within each stratum (j,k). In addition the total area and number of holdings in each stratum from which samples have been taken is reported. Hence, we are given:
: the total area of the stratum (in holdings of size class k, in region j)
: the total number of holdings in the stratum
: number of holdings surveyed within the stratum
: area of each holding surveyed within the stratum
: area of each holding sprayed within the surveyed stratum
: mass of pesticide applied to each holding in the surveyed stratum
Then we estimate: : mean area sprayed per area surveyed within the stratum
: mean mass applied per area surveyed within the stratum
: the between-holding standard deviation of the area sprayed per area surveyed within the stratum
: the between holding standard deviation of the mass sprayed per area surveyed within the stratum
: estimated total area sprayed in a region
: standard error of estimated total area sprayed in a region
: estimated total mass applied in a region
: standard error of estimated total mass applied in a region
: estimated total area sprayed nationally : standard error of estimated total area sprayed nationally
: estimated total mass applied nationally : standard error of estimated total mass applied nationally
Estimates are provided using the following formulas

64
Estimators
Equation 1
Equation 2
Equation 3
Equation 4
Equation 5
Equation 6
Equation 7
Equation 8
Equation 9
Equation 10
Equation 11
Equation 12
Equation 13

65
Equation 14
Standard errors , , and are estimated by a first order Taylor approximation [1] (Equations 9,10,13,14)
with a finite population correction [i] (Equations 9 and 10) 95% confidence intervals for estimates , , and as estimated as mean±1.96×standard error. Estimates of use derived from this survey were based on a stratification by region only because of a number of strata (region and size) which contained no holdings or a low number of holdings (less than 5). A number of survey entries were removed because they had an area reported as zero of zero: one each from Eastern, London & South East, North East, North West, South West, Wales, Yorkshire & the Humber, and three from Scotland. This resulted in the following numbers of holdings surveyed within each region. Table 1: Number of holdings in survey and census
Region Number of holdings: in PUS survey in census
East Midlands 5 147 Eastern 22 334 London & South East 86 700 North East 0 39 North West 3 117 Northern Ireland 53 210 Scotland 8 203 South West 41 1082 Wales 4 76 West Midlands 60 671 Yorkshire & the Humber 1 108 There were an insufficient number of holdings surveyed to make estimates for a number of regions. Hence, for the purpose of estimating pesticide use, North East, North West, Yorkshire & the Humber were combined into ‘North’. Upper and lower confidence intervals were not reported where the relative standard error was estimated to be larger than 30% Estimates of area of application and mass applied by region and nationally are provided in Tables 2 and 3.
Assumptions
1) The survey is unbiased. This means that there is no correlation between the use of pesticides on the holding and
the probability of holdings being included or excluded from a survey. The simplest way of achieving this is to
sample holdings at random from the population of holdings within a stratum.
2) Samples are not correlated between strata. This means that if by chance the holdings sampled from one stratum
have a higher average pesticide use than the population within the stratum, then this provides no information
about the relation between samples and populations in other strata.
3) The values of number of holdings per strata are correct.
4) The size of the potential error in estimates of the total area of holdings [se(H)] within each stratum is small
compared with the standard error of the estimates for the ratios “mean area sprayed per area surveyed within the

66
stratum” and “mean mass applied per area surveyed within the stratum” [se(R)]. For uncorrelated errors “small”
might mean rse(H)<0.3×rse(R)2
5) The error associated with estimates , , , and is assumed to be described by a normal distribution
Table 2: Estimates of area treated
Region Total Area (Ha)
Number of
holdings
Number of holdings surveyed
Estimate (Ha)
s.e.. (Ha)
RSE (%)
95% C.I (Ha)
East Midlands 315 147 5 4652 2619 56 NA NA Eastern 1754 334 22 41951 5337 13 31491 52410 London & S.E. 9912 700 86 338568 16302 4.8 306617 370519 North 440 264 4 2708 2256 83 NA NA Northern Ireland 1484 210 53 34915 1294 3.7 32378 37451 Scotland 98 203 8 373 159 43 NA NA South West 3539 1082 41 21578 4232 20 13284 29873 Wales 356 76 4 2647 1370 52 NA NA West Midlands 7024 671 60 92952 7510 8.1 78233 107672
National 24923 3687 283 540344 19597 3.6 501933 578755
Table 3: Estimates of mass of treatment applied
Region Total Area (Ha)
Number of
holdings
Number of holdings surveyed
Estimate (Kg)
s.e.. (Kg)
RSE (%)
95% C.I (Kg)
East Midlands 315 147 5 1968 1219 62 NA NA Eastern 1754 334 22 27105 4100 15 19068 35142 London & S.E. 9912 700 86 187344 10431 5.6 166899 207789 North 440 264 4 320 318 99 NA NA Northern Ireland 1484 210 53 22508 1336 5.9 19888 25127 Scotland 98 203 8 111 76 69 NA NA South West 3539 1082 41 13959 3219 23 7650 20269 Wales 356 76 4 934 599 64 NA NA West Midlands 7024 671 60 51099 6281 12 38789 63409
National 24923 3687 283 305347 13385 4.4 279111 331582
1 BIPM, (2008). Evaluation of measurement data — Guide to the expression of uncertainty in measurement,
JCGM 100:2008
1 Isserlis, L. (1918). "On the value of a mean as calculated from a sample". Journal of the Royal Statistical Society. 81 (1): 75–81.
2 If given estimates of relative standard errors (rse) rse(R)=1 and rse(H)=0.3 then rse(R.H)=1.04

67
APPENDIX 5 – FIRST RAISING FACTORS FOR ORCHARD CROPS - 2016 Region/Country Farm size group rf1 Regional area (ha) Area surveyed (ha) Number of farms
visited East Midlands A 7.43 177 23.82 *
B 5.93 72 12.14 *
Eastern A 24.75 579 23.40 7 B 2.99 333 111.48 8 C 3.72 186 49.99 * D 1.42 458 321.87 6
London & South East A 11.20 1,326 118.37 24 B 4.37 882 201.60 14 C 2.73 997 365.69 15 D 2.28 2,441 1,071.57 23 E 2.30 4,266 1,851.47 11
North East A 110.00 44 0.40 *
North West A 103.57 145 1.40 * B 1.24 33 26.71 *
Northern Ireland A 2.86 457 160.06 28 B 2.37 464 195.53 16 C 2.68 245 91.39 * D 1.49 318 212.77 *
Scotland A 5.25 87 16.58 11
South West A 22.53 1,741 77.26 23 B 3.64 372 102.16 7 C 2.67 396 148.15 6 D 3.80 673 177.30 * E 1.37 358 260.95 *
Wales A 15.92 72 4.52 * D 0.98 76 77.90 * E 1.34 165 123.00 *
West Midlands A 18.71 1,225 65.46 13 B 4.68 769 164.21 12 C 5.29 1,070 202.41 8 D 2.59 2,374 917.29 21 E 2.41 1,587 658.19 6
Yorkshire & the Humber A 50.04 86 1.72 *
For confidentiality reasons a * has been used where 5 or less holdings have been sampled.
The first raising factor (rf1) is the largest of the three raising factors and gives an indication of the robustness of the sample with smaller numbers indicating a larger area sampled within each size group and region.

68
ACKNOWLEDGEMENTS
Thanks are due to all the growers who willingly participated in this survey, providing invaluable information upon which this report is based. Many thanks are also due to Jackie Hughes, Stephen Jess, Trudyann Kelly, Michael Lavery, David Matthews, Carol Monie, Gillian Reay, Johan Wardlaw, David Williams and Alan Withers for their role in the collection and provision of data; Yvonne Powell-Wainwright and Josephine Roberts for their role in maintaining the pesticides database; and Jennie Blackburn, Sarah Thompson and John Bleasdale for their help with the cropping areas of orchard crops in England & Wales respectively. Thanks also go to the members of the ECP Working Party on Pesticide Usage Surveys, Sarah Cook, Peter Gladders and Mike Lole, for their invaluable comments.
REFERENCES Anon. (2016a) Agricultural Statistics in England 2015. London: HMSO Anon. (2014b) Agricultural Statistics in Wales 2015. London: HMSO Anon. (2014c) Agricultural Statistics in Scotland 2015. Edinburgh: HMSO Anon. (2014d) Agricultural Statistics, Northern Ireland 2015. Belfast: HMSO Anon. (2017a) Agricultural Statistics in England 2016. London: HMSO Anon. (2017b) Agricultural Statistics in Wales 2016. London: HMSO Anon. (2017c) Agricultural Statistics in Scotland 2016. Edinburgh: HMSO Anon. (2017d) Agricultural Statistics, Northern Ireland 2016. Belfast: HMSO Anon. (2017e) Horticultural Statistics 2016, Defra, https://www.gov.uk/government/collections/horticultural-statistics, (last accessed 08.10.2017) Garthwaite, D.G., Barker, I., Laybourn, R., Huntly, A., Parrish, G., Hudson, S., Thygesen, H., & Macarthur, R . (2015) Pesticide Usage Survey Report 265 – Orchards in the United Kingdom, 2014. London: Defra Thomas, M. R., (1999), Guidelines for the Collection of Pesticide Usage Statistics within Agriculture and Horticulture, OECD, Eurostat, http://www.oecd.org/chemicalsafety/pesticides-biocides/2078031.pdf (last accessed 11.11.2017) Wood, H.J. (1931) An Agricultural Atlas of Scotland. London: George Gill & Sons