Performance Reporting:“Real” Accountability or Accountability “Lite”
Seventh Annual Survey 2003
Joseph C. Burke and Henrik MinassiansHigher Education Program
TheNelson A.RockefellerInstituteofGovernment


Performance Reporting:“Real” Accountability or Accountability “Lite”
Seventh Annual Survey 2003
Joseph C. Burke and Henrik Minassians
Higher Education Program
The Nelson A. Rockefeller Institute of GovernmentState University of New York
Albany, New York2003

The Nelson A. Rockefeller Institute of Government, the public policy research arm ofthe State University of New York, was established in 1982 to bring the resources of the64-campus SUNY system to bear on public policy issues. The Institute is activenationally in research and special projects on the role of state governments in Americanfederalism and the management and finances of both state and local governments in majorareas of domestic public affairs.
Copyright � 2003 by The Nelson A Rockefeller Institute ofGovernment
Address inquires to:
Joseph C. BurkeDirector
Higher Education ProgramThe Nelson A. Rockefeller Institute of Government411 State StreetAlbany, New York 12203-1003
Tel.: (518) 443-5835Fax: (518) 443-5845E-mail: [email protected]: http://rockinst.org/higheduc.htm
CONTENTS
Performance Reporting:“Real” Accountability or Accountability “Lite”
Seventh Annual Survey
Joseph C. Burke and Henrik Minassians
Introduction . . . . . . . . . . . . . . . . . . . . . . . . . . . . . . . . . . . . . 1
Performance Programs Prevail . . . . . . . . . . . . . . . . . . . . . . . . . . . . 2
The Questionnaire . . . . . . . . . . . . . . . . . . . . . . . . . . . . . . . . . . 2
Performance Budgeting and Performance Funding . . . . . . . . . . . . . . . . . 3
Methods of Initiation . . . . . . . . . . . . . . . . . . . . . . . . . . . . . . . . . 4
Performance Funding . . . . . . . . . . . . . . . . . . . . . . . . . . . . . . . . 5
Performance Budgeting . . . . . . . . . . . . . . . . . . . . . . . . . . . . . . . 7
State Report Cards Spur Performance Reporting . . . . . . . . . . . . . . . . . . 11
State Performance Programs and the State Report Card . . . . . . . . . . . . . . 14
State Scores and Sources of Successes and Shortcomings . . . . . . . . . . . . . 16
Impact on Campus Performance . . . . . . . . . . . . . . . . . . . . . . . . . . 17
A Common and Fatal Flaw . . . . . . . . . . . . . . . . . . . . . . . . . . . . . 20
Findings . . . . . . . . . . . . . . . . . . . . . . . . . . . . . . . . . . . . . . . 21
Conclusion . . . . . . . . . . . . . . . . . . . . . . . . . . . . . . . . . . . . . 21
References . . . . . . . . . . . . . . . . . . . . . . . . . . . . . . . . . . . . . 22
Appendix A . . . . . . . . . . . . . . . . . . . . . . . . . . . . . . . . . . . . . 23
Appendix B . . . . . . . . . . . . . . . . . . . . . . . . . . . . . . . . . . . . . 27
Appendix C . . . . . . . . . . . . . . . . . . . . . . . . . . . . . . . . . . . . . 32
iii


1
Performance Reporting:
“Real” Accountability or Accountability “Lite”
Seventh Annual Survey*
Joseph C. Burke and Henrik P. Minassians
§ Introduction
The Seventh Annual Survey of State Higher Education Finance Officers (SHEFOs) shows thecontinuing triumph of performance reporting and the continuing trials of performance budgetingand funding. Performance reporting spread to all but four states, while performance funding andbudgeting experienced deeper declines. The triumph of reporting had three apparent causes. First,the publication of Measuring UP 2000 and 2002 popularized performance reporting (The NationalCenter 2000, 2002). Second, continuing budget shortfalls eroded support for performance fundingand budgeting. Third, bad budgets encouraged some state policymakers to see performancereporting as the “no cost” accountability program — an alternative to performance funding andbudgeting.
We began our SHEFO Surveys in 1997 based on the belief that the maxim of “what getsmeasured is what gets valued” was only half right. Only what gets “funded,” “budgeted,” orpossibly “reported” can attract attention on college campuses and in state capitols and affect highereducation performance. We considered reporting only a possible inducement, requiring proof,while the attention given to funding or budgeting in state capitols and on college campuses islegendary.
This year’s survey confirms the conclusion that performance reporting is by far the preferredapproach to accountability for higher education. Clearly, it has covered the country, but is itsimpact on performance, planning, and policy making in higher education shallow or deep?Performance reports rely on information to improve performance. Information is powerful, but itsforce depends on its use. Our survey questions SHEFOs on the use of performance reports forplanning, policymaking, and budgeting and on its effect on performance. The SHEFO responsesprovide no clear conclusions, but they do offer clues on whether performance reporting as currentlyused represents real accountability or only accountability “lite.”
§ Summary of Results
Performance funding and performance budgeting flourished during the 1990s. Our surveysshowed that performance funding nearly doubled from 10 programs in 1997 to 19 in 2001. Theyalso revealed that performance budgeting more than doubled from 16 to 28 programs from 1997 to2000. The recent recession contributed to the decline in both programs. Performance funding fellby only one program last year, but lost three more this year. Performance budgeting slipped by oneprogram in both 2001 and 2002, but dropped a net of five in this year’s survey. Meanwhile,performance reporting jumped from 30 to 46 programs in the last three years.
* Study supported by the Ford Foundation.

Initially, we viewed performance reporting as a “halfway stop” on the road to performancebudgeting or funding. Information arouses attention, but money levers action. Some statisticssupported this conclusion. More than two-thirds of the states with performance funding andbudgeting in 1999 also had performance reporting. Moreover, the adoption of performancereporting preceded the initiation of 44 percent of the performance funding and 49 percent of theperformance budgeting programs.
This year’s survey confirms a conclusion suspected last year (Burke & Minassians 2002a). Farfrom being a precursor for other performance programs, performance reporting is now perceived asa less controversial and less costly alternative. All three of states that lost performance funding andfour of the five that ended performance budgeting in this year’s Survey already had performancereporting. The SHEFO from the fifth state said that the Legislature, after lobbying from theuniversity system, directed the shift from performance budgeting to performance reporting. All ofthose eight states that ended performance funding or budgeting retained only performancereporting. In a few short years, performance reporting has gone from the precursor to the preferredapproach to accountability.
This year, SHEFOs claimed that bad budgets spelled bad news for performance funding, whichoften relies on additional state allocations, and even for performance budgeting, which onlyconsiders performance in allocating state appropriations. The finance officers attributed most of thelosses in both of those programs to fiscal problems in their states. A recent Budget Update by theNational Conference of State Legislators (NCSL) supports their conclusions (2003). Its chartssuggest that most of the states dropping performance funding and budgeting this year faced moreserious fiscal problems than those that retained them (NCSL, pgs. 5-6, 18-19, 21-24).
§ The Questionnaire
Staff of the Higher Education Program at the Rockefeller Institute of Government has conductedtelephone surveys of SHEFOs or their designees for the last seven years, with an annual responserate of 100 percent. The polling generally came in May, June or July, although the Sixth Surveyoccurred in August. The questions focus on the current status, future prospects, and perceivedimpact of performance funding, budgeting, and reporting in the fifty states (See Appendix A for the2003 questionnaire).
The interviews begin with definitions that distinguish the performance funding fromperformance budgeting. The questioner then asks whether a state currently has performancefunding, budgeting, or reporting. If it has one or more of these programs, the interviewer asks thefinance officer to predict whether the program or programs will continue for the next five years. Ifno program exists, the question changes to the likelihood of adopting the policy. “Highly likely,”“likely,” “unlikely,” “highly unlikely,” and “cannot predict” constitute the choices for all of thesequestions. Interviews also ask whether legislation mandates performance funding, budgeting, orreporting and whether it prescribes their indicators. In addition, respondents identify the primaryinitiator of these programs, choosing from governor, legislature, coordinating or governing board,university or college systems or “other.” Two years ago, the survey started asking respondents toassess the effect of the three programs on improving campus performance. The options are great,considerable, moderate, minimal, no extent, or cannot judge the extent.
This year’s Survey added several new questions. The first asks whether the state allocations forperformance funding has been maintained, reduced, or suspended, because a decline in stateallocations. Two other questions inquired about the extent of consideration given by state
2
Higher Education Program — Rockefeller Institute of Government

government leaders and by coordinating or governing boards to the performance reports inplanning and policymaking.
§ Definitions
Performance funding and budgeting add institutional performance to the traditionalconsiderations in state allocations to public colleges and universities of current costs, studentenrollments, and inflationary increases. The latter represent input factors that ignore outputs andoutcomes, such as the quantity and quality of graduates and the range and benefits of services tostates and society. Some states previously adopted programs that front-ended funding to encouragedesired campus activities, which we call initiative funding. Performance funding and budgetingdepart from these earlier efforts by allocating resources for achieved rather than promised results(Burke & Serban 1997; Burke & Associates 2002).
Our annual surveys distinguish performance funding from performance budgeting by using thefollowing definitions:
• Performance funding ties specified state funding directly and tightly to the perfor-mance of public campuses on individual indicators. Performance funding focuses on thedistribution phase of the budget process.
• Performance budgeting allows governors, legislators, and coordinating or systemboards to consider campus achievement on performance indicators as one factor in de-termining allocations for public campuses. Performance budgeting concentrates on bud-get preparation and presentation, and often neglects, or even ignores, the distributionphase of budgeting.
In performance funding, the relationship between funding and performance is tight, automaticand formulaic. If a public college or university achieves a prescribed target or an improvement levelon defined indicators, it receives a designated amount or percent of state funding. In performancebudgeting, the possibility of additional funding due to good or improved performance dependssolely on the judgment and discretion of state, coordinating, or system officials.
The advantages and disadvantages of each is the reverse of the other. Performance budgeting isflexible but uncertain. Performance funding is certain but inflexible. Despite these definitions,confusion often arises in distinguishing the two programs. Moreover, at times, the connectionbetween state budgets and campus performance in performance budgeting almost disappears. Theallocations determined by either program are usually quite small, running from less than one toseldom more than five percent. Current costs, student enrollments, and inflationary increases stillset the lion’s share of state funding for public colleges and universities.
Performance reporting represents a third approach to accountability for higher education.These periodic reports recount statewide and often the institutional results mostly of public highereducation on priority indicators, similar to those found in performance funding and budgeting. Onthe other hand, since they have no formal link to allocations, performance reports can have a muchlonger list of indicators than performance budgeting and especially performance funding. Thereports are usually sent to governors, legislators, and campus leaders, and increasingly appear onthe websites of coordinating or system boards and of individual institutions. At times, they alsoinclude information directed to prospective undergraduate students and their parents. Performancereporting relies on information and publicity rather than funding or budgeting to encouragecolleges and universities to improve their performance (Burke & Minassians 2002b). It is less
3
Performance Reporting: “Real” Accountability or Accountability “Lite” — Seventh Annual Survey
controversial than performance funding or budgeting on campuses, which helps to explain – itsincreasing popularity in state capitols.
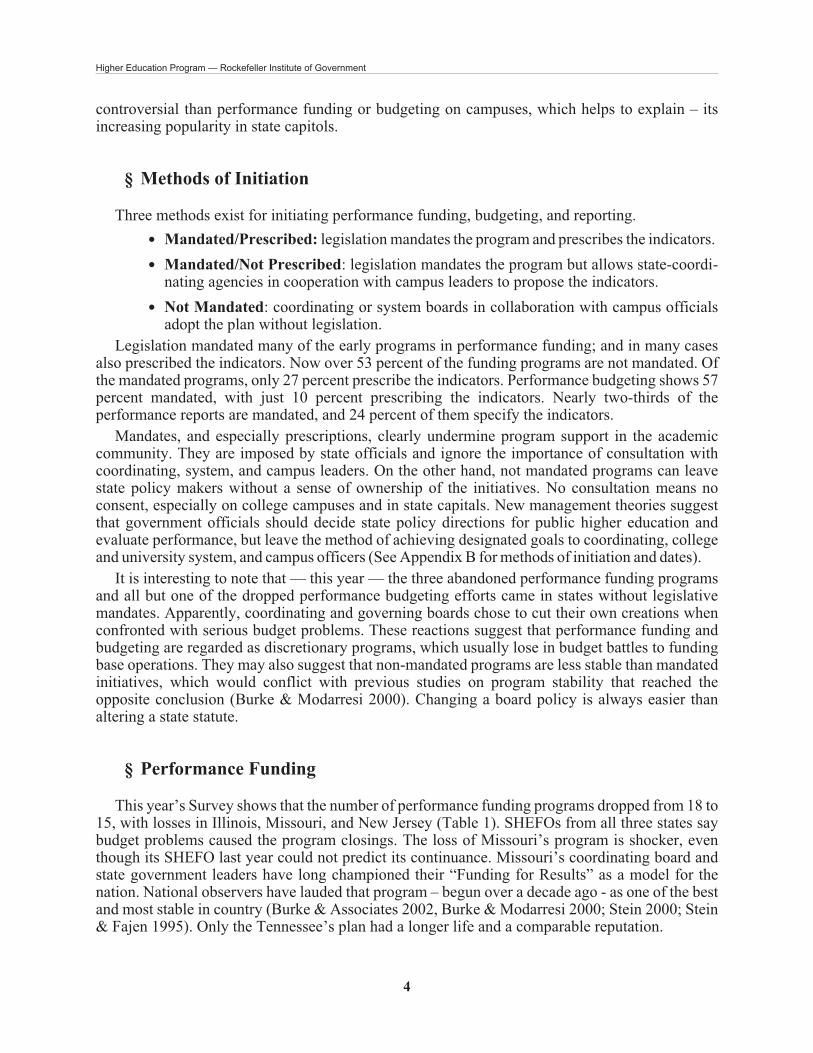
§ Methods of Initiation
Three methods exist for initiating performance funding, budgeting, and reporting.
• Mandated/Prescribed: legislation mandates the program and prescribes the indicators.
• Mandated/Not Prescribed: legislation mandates the program but allows state-coordi-nating agencies in cooperation with campus leaders to propose the indicators.
• Not Mandated: coordinating or system boards in collaboration with campus officialsadopt the plan without legislation.
Legislation mandated many of the early programs in performance funding; and in many casesalso prescribed the indicators. Now over 53 percent of the funding programs are not mandated. Ofthe mandated programs, only 27 percent prescribe the indicators. Performance budgeting shows 57percent mandated, with just 10 percent prescribing the indicators. Nearly two-thirds of theperformance reports are mandated, and 24 percent of them specify the indicators.
Mandates, and especially prescriptions, clearly undermine program support in the academiccommunity. They are imposed by state officials and ignore the importance of consultation withcoordinating, system, and campus leaders. On the other hand, not mandated programs can leavestate policy makers without a sense of ownership of the initiatives. No consultation means noconsent, especially on college campuses and in state capitals. New management theories suggestthat government officials should decide state policy directions for public higher education andevaluate performance, but leave the method of achieving designated goals to coordinating, collegeand university system, and campus officers (See Appendix B for methods of initiation and dates).
It is interesting to note that — this year — the three abandoned performance funding programsand all but one of the dropped performance budgeting efforts came in states without legislativemandates. Apparently, coordinating and governing boards chose to cut their own creations whenconfronted with serious budget problems. These reactions suggest that performance funding andbudgeting are regarded as discretionary programs, which usually lose in budget battles to fundingbase operations. They may also suggest that non-mandated programs are less stable than mandatedinitiatives, which would conflict with previous studies on program stability that reached theopposite conclusion (Burke & Modarresi 2000). Changing a board policy is always easier thanaltering a state statute.
§ Performance Funding
This year’s Survey shows that the number of performance funding programs dropped from 18 to15, with losses in Illinois, Missouri, and New Jersey (Table 1). SHEFOs from all three states saybudget problems caused the program closings. The loss of Missouri’s program is shocker, eventhough its SHEFO last year could not predict its continuance. Missouri’s coordinating board andstate government leaders have long championed their “Funding for Results” as a model for thenation. National observers have lauded that program – begun over a decade ago - as one of the bestand most stable in country (Burke & Associates 2002, Burke & Modarresi 2000; Stein 2000; Stein& Fajen 1995). Only the Tennessee’s plan had a longer life and a comparable reputation.
4
Higher Education Program — Rockefeller Institute of Government

Table 1. States with Performance Funding
Surveys Number (Percentage) States
First1997
10 states(20%)
Colorado, Connecticut, Florida, Kentucky,Minnesota, Missouri, Ohio, South Carolina,Tennessee, Washington
Second1998
13 states(26%)
Colorado, Connecticut, Florida, Illinois*, Indiana,Louisiana, Missouri, Ohio, Oklahoma, SouthCarolina, South Dakota, Tennessee, Washington
Third1999
16 states(32%)
California*, Connecticut, Florida, Illinois*, Kansas,Louisiana, Missouri, New Jersey, New York**,Ohio, Oklahoma, South Carolina, South Dakota,Tennessee, Texas, Virginia
Fourth2000
17 states(34%)
California*, Colorado, Connecticut, Florida,Illinois*, Kansas, Louisiana, Missouri, New Jersey,New York**, Ohio, Oklahoma, Pennsylvania,South Carolina, South Dakota, Tennessee, Texas
Fifth2001
19 states(38%)
Arkansas, California*, Colorado, Connecticut,Florida, Idaho, Illinois*, Kansas, Louisiana,Missouri, New Jersey, New York**, Ohio, Oregon,Pennsylvania, South Carolina, South Dakota,Tennessee, Texas
Sixth2002
18 States(36%)
Colorado, Connecticut, Florida, Idaho, Illinois*,Kansas, Louisiana, Missouri, New Jersey, NewYork**, Ohio, Oklahoma, Oregon, Pennsylvania,South Carolina, South Dakota, Tennessee, Texas
Seventh2003
15 States(30%)
Colorado, Connecticut, Florida, Idaho, Kansas,Louisiana, New York**, Ohio, Oklahoma, Oregon,Pennsylvania, South Carolina, South Dakota,Tennessee, Texas
* 2-year colleges only
** State University System Only
The NCSL Budget Update suggests that not all states with budget gaps and higher education cutsabandoned their performance funding programs (Appendix C, Table 1). For example, Tennessee,despite a $102 million cut for higher education, not only retained its program but also maintained itsfunding level at 5.45 percent of state operating support (NCSL 2003, p. 24). Other States withbudget problems kept their programs, while reducing or suspending funding. Idaho, Oklahoma,Ohio and South Carolina reduced, while Kansas, Oregon, South Dakota, and Texas suspendedfunding.
Despite the budget pressures and the preferences for performance reporting, the statistics oncontinuation on performance funding show the best percentages of highly likely in the last fewyears (Table 2). These ratings are surprising, given the consensus that state funding for highereducation will remain depressed for some time even after economic recovery. The highly likelynumber is the only good news on program continuation. Placement of one fifth of the currentprograms in the cannot predict category suggests a troubling future for performance funding. Thepresence of South Carolina in that group is nothing less than astonishing. Since 1996, thecoordinating commissioners and legislative leaders have vigorously championed their
5
Performance Reporting: “Real” Accountability or Accountability “Lite” — Seventh Annual Survey

controversial program in the face of almost universal criticism from national experts and campusofficials in South Carolina (Burke & Associates 2002, Chapter Nine). Now budget problems havepushed that program’s future into the cannot predict column.
Table 2. Likelihood of Continuing Performance Funding
2001
Highly Likely37%(7)
Colorado, Florida, Idaho, Illinois, Pennsylvania, Tennessee,Texas
Likely58%(11)
Arkansas, Connecticut, Kansas, Louisiana, Missouri, NewJersey, New York, Ohio, Oregon, South Carolina, SouthDakota
Cannot Predict5%(1)
California
2002
Highly Likely55.6%(10)
Colorado, Connecticut, Florida, Idaho, Louisiana,Oklahoma, Pennsylvania, South Dakota, Tennessee, Texas
Likely27.8%
(5)Illinois, Kansas, New York, Oregon, South Carolina
Unlikely5.6%(1)
Missouri
Cannot Predict11.1%
(2)New Jersey, Ohio
2003
Highly Likely60%(9)
Colorado, Connecticut, Florida, Idaho, Kansas, Oklahoma,Pennsylvania, South Dakota, Tennessee
Likely20%(3)
Louisiana, New York, Texas
Cannot Predict20%(3)
Ohio, Oregon, South Carolina
The best news on the future adoption is that Missouri is likely to readopt performance funding(Table 3). The next best news may well be that SHEFOs could not predict whether ten states wouldor would not adopt performance funding in the next five years. The unpredictables become goodnews, only when four times as many states are unlikely rather than likely to initiate the program.
6
Higher Education Program — Rockefeller Institute of Government

Table 3. Likelihood of Adopting Performance Funding* 2001
2001
Highly Likely9.5%(3)
Kentucky, Oklahoma, West Virginia
Likely13%(4)
Alaska, Utah, Virginia, Wisconsin
Unlikely26%(8)
Arizona, Indiana, Maryland, Nebraska, Nevada, New Mexico,Washington, Wyoming
Highly Unlikely16%(5)
Delaware, Iowa, Montana, New Hampshire, North Dakota
Cannot Predict35.5%(11)
Alabama, Georgia, Hawaii, Maine, Massachusetts, Michigan,Minnesota, Mississippi, North Carolina, Rhode Island,Vermont
2002
Likely6.3%(2)
Alaska, West Virginia
Unlikely28.1%
(9)Georgia, Maryland, Mississippi, Montana, North Carolina,Utah, Vermont, Washington, Wyoming
Highly Unlikely37%(12)
Alabama, Arizona, California, Delaware, Iowa, Kentucky,Nebraska, Nevada, New Hampshire, North Dakota, RhodeIsland, Wisconsin
Cannot Predict28.1%
(9)Arkansas, Hawaii, Indiana, Maine, Massachusetts, Michigan,Minnesota, New Mexico, Virginia
2003
Highly Likely3%(1)
New Mexico
Likely11%(4)
Alaska, Missouri, Utah, West Virginia
Unlikely40%(14)
Arizona, Georgia, Hawaii, Iowa, Maryland, Minnesota,Montana, Nebraska, North Carolina, North Dakota, RhodeIsland, Washington, Wisconsin, Wyoming
Highly Unlikely17%(6)
California, Delaware, Indiana, Kentucky, Nevada, NewHampshire
Cannot Predict29%(10)
Alabama, Arkansas, Illinois, Maine, Massachusetts, Michigan,Mississippi, New Jersey, Vermont, Virginia
*Percent based on the number of states without Performance Funding program.
§ Performance Budgeting
Five states — Arkansas, Illinois, Missouri, North Carolina and Virginia abandoned performancebudgeting since the last Survey; and Vermont never implemented its program from last year (Table
7
Performance Reporting: “Real” Accountability or Accountability “Lite” — Seventh Annual Survey
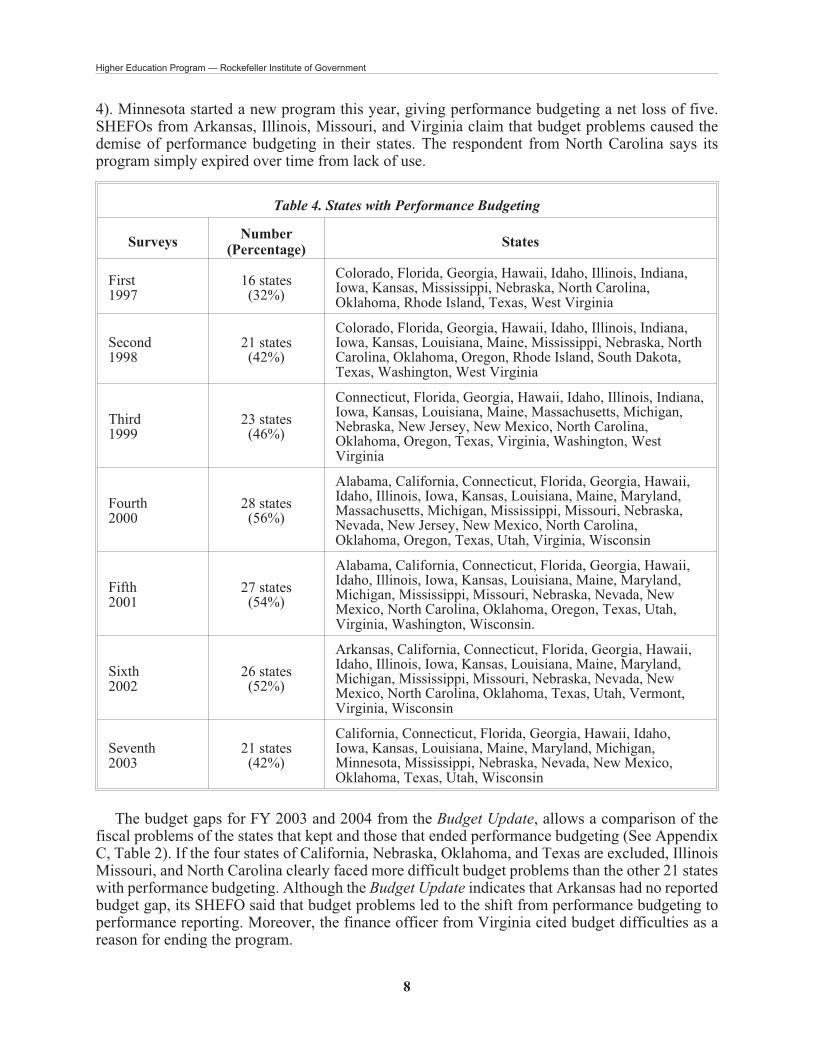
4). Minnesota started a new program this year, giving performance budgeting a net loss of five.SHEFOs from Arkansas, Illinois, Missouri, and Virginia claim that budget problems caused thedemise of performance budgeting in their states. The respondent from North Carolina says itsprogram simply expired over time from lack of use.
Table 4. States with Performance Budgeting
SurveysNumber
(Percentage)States
First1997
16 states(32%)
Colorado, Florida, Georgia, Hawaii, Idaho, Illinois, Indiana,Iowa, Kansas, Mississippi, Nebraska, North Carolina,Oklahoma, Rhode Island, Texas, West Virginia
Second1998
21 states(42%)
Colorado, Florida, Georgia, Hawaii, Idaho, Illinois, Indiana,Iowa, Kansas, Louisiana, Maine, Mississippi, Nebraska, NorthCarolina, Oklahoma, Oregon, Rhode Island, South Dakota,Texas, Washington, West Virginia
Third1999
23 states(46%)
Connecticut, Florida, Georgia, Hawaii, Idaho, Illinois, Indiana,Iowa, Kansas, Louisiana, Maine, Massachusetts, Michigan,Nebraska, New Jersey, New Mexico, North Carolina,Oklahoma, Oregon, Texas, Virginia, Washington, WestVirginia
Fourth2000
28 states(56%)
Alabama, California, Connecticut, Florida, Georgia, Hawaii,Idaho, Illinois, Iowa, Kansas, Louisiana, Maine, Maryland,Massachusetts, Michigan, Mississippi, Missouri, Nebraska,Nevada, New Jersey, New Mexico, North Carolina,Oklahoma, Oregon, Texas, Utah, Virginia, Wisconsin
Fifth2001
27 states(54%)
Alabama, California, Connecticut, Florida, Georgia, Hawaii,Idaho, Illinois, Iowa, Kansas, Louisiana, Maine, Maryland,Michigan, Mississippi, Missouri, Nebraska, Nevada, NewMexico, North Carolina, Oklahoma, Oregon, Texas, Utah,Virginia, Washington, Wisconsin.
Sixth2002
26 states(52%)
Arkansas, California, Connecticut, Florida, Georgia, Hawaii,Idaho, Illinois, Iowa, Kansas, Louisiana, Maine, Maryland,Michigan, Mississippi, Missouri, Nebraska, Nevada, NewMexico, North Carolina, Oklahoma, Texas, Utah, Vermont,Virginia, Wisconsin
Seventh2003
21 states(42%)
California, Connecticut, Florida, Georgia, Hawaii, Idaho,Iowa, Kansas, Louisiana, Maine, Maryland, Michigan,Minnesota, Mississippi, Nebraska, Nevada, New Mexico,Oklahoma, Texas, Utah, Wisconsin
The budget gaps for FY 2003 and 2004 from the Budget Update, allows a comparison of thefiscal problems of the states that kept and those that ended performance budgeting (See AppendixC, Table 2). If the four states of California, Nebraska, Oklahoma, and Texas are excluded, IllinoisMissouri, and North Carolina clearly faced more difficult budget problems than the other 21 stateswith performance budgeting. Although the Budget Update indicates that Arkansas had no reportedbudget gap, its SHEFO said that budget problems led to the shift from performance budgeting toperformance reporting. Moreover, the finance officer from Virginia cited budget difficulties as areason for ending the program.
8
Higher Education Program — Rockefeller Institute of Government
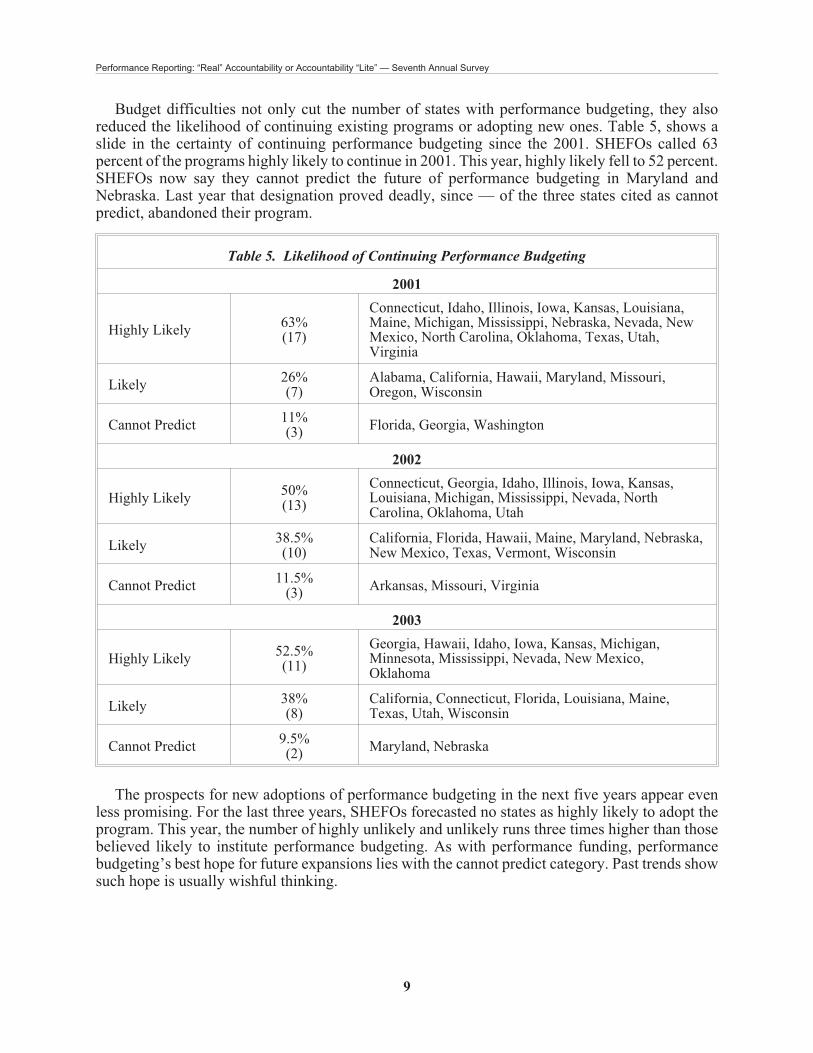
Budget difficulties not only cut the number of states with performance budgeting, they alsoreduced the likelihood of continuing existing programs or adopting new ones. Table 5, shows aslide in the certainty of continuing performance budgeting since the 2001. SHEFOs called 63percent of the programs highly likely to continue in 2001. This year, highly likely fell to 52 percent.SHEFOs now say they cannot predict the future of performance budgeting in Maryland andNebraska. Last year that designation proved deadly, since — of the three states cited as cannotpredict, abandoned their program.
Table 5. Likelihood of Continuing Performance Budgeting
2001
Highly Likely63%(17)
Connecticut, Idaho, Illinois, Iowa, Kansas, Louisiana,Maine, Michigan, Mississippi, Nebraska, Nevada, NewMexico, North Carolina, Oklahoma, Texas, Utah,Virginia
Likely26%(7)
Alabama, California, Hawaii, Maryland, Missouri,Oregon, Wisconsin
Cannot Predict11%(3)
Florida, Georgia, Washington
2002
Highly Likely50%(13)
Connecticut, Georgia, Idaho, Illinois, Iowa, Kansas,Louisiana, Michigan, Mississippi, Nevada, NorthCarolina, Oklahoma, Utah
Likely38.5%(10)
California, Florida, Hawaii, Maine, Maryland, Nebraska,New Mexico, Texas, Vermont, Wisconsin
Cannot Predict11.5%
(3)Arkansas, Missouri, Virginia
2003
Highly Likely52.5%(11)
Georgia, Hawaii, Idaho, Iowa, Kansas, Michigan,Minnesota, Mississippi, Nevada, New Mexico,Oklahoma
Likely38%(8)
California, Connecticut, Florida, Louisiana, Maine,Texas, Utah, Wisconsin
Cannot Predict9.5%(2)
Maryland, Nebraska
The prospects for new adoptions of performance budgeting in the next five years appear evenless promising. For the last three years, SHEFOs forecasted no states as highly likely to adopt theprogram. This year, the number of highly unlikely and unlikely runs three times higher than thosebelieved likely to institute performance budgeting. As with performance funding, performancebudgeting’s best hope for future expansions lies with the cannot predict category. Past trends showsuch hope is usually wishful thinking.
9
Performance Reporting: “Real” Accountability or Accountability “Lite” — Seventh Annual Survey

Table 6. Likelihood of Adopting Performance Budgeting* 2001
2001
Likely9%(2)
Alaska, West Virginia
Unlikely17%(4)
Delaware, Montana, New York, South Carolina
HighlyUnlikely
17%(4)
Arizona, New Hampshire, North Dakota, Rhode Island
Cannot Predict57%(13)
Arkansas, Colorado, Indiana, Kentucky, Massachusetts,Minnesota, New Jersey, Ohio, Pennsylvania, SouthDakota, Tennessee, Vermont, Wyoming
2002
Likely16.7%
(4)Alaska, Montana, Tennessee, West Virginia
Unlikely33.3%
(8)Alabama, Arizona, Delaware, Kentucky, North Dakota,Rhode Island, South Carolina, Washington
HighlyUnlikely
12.5%(3)
Colorado, New York, South Dakota
Cannot Predict37.5%
(9)Indiana, Massachusetts, Minnesota, New Hampshire,New Jersey, Ohio, Oregon, Pennsylvania, Wyoming
2003
Likely14%(4)
Alaska, Missouri, Washington, West Virginia
Unlikely31%(9)
Arizona, Arkansas, Indiana, New York, North Carolina,North Dakota, Pennsylvania, Rhode Island, Wyoming
HighlyUnlikely
14%(4)
Delaware, Kentucky, New Hampshire, South Dakota
Cannot Predict41%(12)
Alabama, Colorado, Illinois, Massachusetts, Montana,New Jersey, Ohio, Oregon, South Carolina, Tennessee,Vermont, Virginia
* Percent based on the number of states without Performance Budgeting program.
Not surprisingly in bad budget times, the effect of performance budgeting on state funding forpublic higher education declines. The question asks the extent of the effect of performancebudgeting on state funding for public higher education. Between 2001 and 2003, every one of thefavorable categories of great, considerable, and moderate extent declines and the considerableextent actually disappears in 2002 and 2003 (Table 7). In the last three years, the moderate categoryof effect on funding drops by nearly half.
This assessment of a relatively light effect on funding raises the question of why several statessaid they dropped the program because of budget cuts. One possible reason is that two of thosestates, Illinois and Missouri claimed that performance budgeting had a considerable effect onfunding allocations in 2001 and Illinois in 2002, although the SHEFO from Missouri dropped that
10
Higher Education Program — Rockefeller Institute of Government
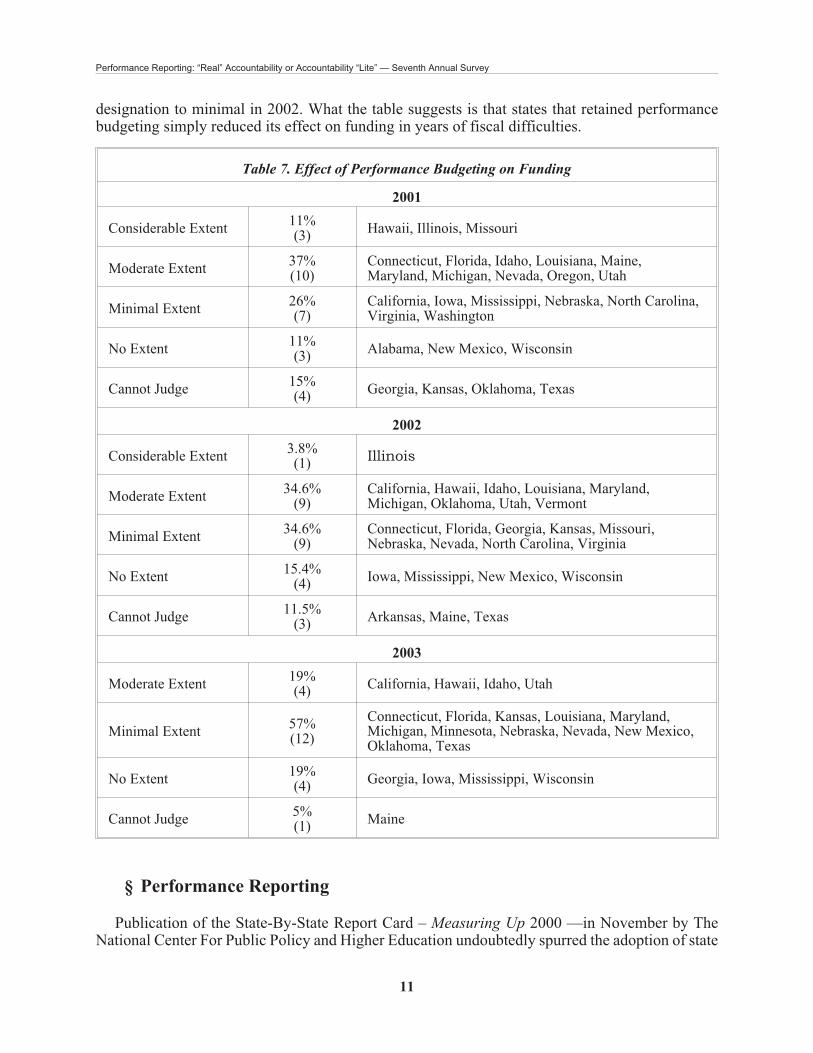
designation to minimal in 2002. What the table suggests is that states that retained performancebudgeting simply reduced its effect on funding in years of fiscal difficulties.
Table 7. Effect of Performance Budgeting on Funding
2001
Considerable Extent11%(3)
Hawaii, Illinois, Missouri
Moderate Extent37%(10)
Connecticut, Florida, Idaho, Louisiana, Maine,Maryland, Michigan, Nevada, Oregon, Utah
Minimal Extent26%(7)
California, Iowa, Mississippi, Nebraska, North Carolina,Virginia, Washington
No Extent11%(3)
Alabama, New Mexico, Wisconsin
Cannot Judge15%(4)
Georgia, Kansas, Oklahoma, Texas
2002
Considerable Extent3.8%(1)
Illinois
Moderate Extent34.6%
(9)California, Hawaii, Idaho, Louisiana, Maryland,Michigan, Oklahoma, Utah, Vermont
Minimal Extent34.6%
(9)Connecticut, Florida, Georgia, Kansas, Missouri,Nebraska, Nevada, North Carolina, Virginia
No Extent15.4%
(4)Iowa, Mississippi, New Mexico, Wisconsin
Cannot Judge11.5%
(3)Arkansas, Maine, Texas
2003
Moderate Extent19%(4)
California, Hawaii, Idaho, Utah
Minimal Extent57%(12)
Connecticut, Florida, Kansas, Louisiana, Maryland,Michigan, Minnesota, Nebraska, Nevada, New Mexico,Oklahoma, Texas
No Extent19%(4)
Georgia, Iowa, Mississippi, Wisconsin
Cannot Judge5%(1)
Maine
§ Performance Reporting
Publication of the State-By-State Report Card – Measuring Up 2000 —in November by TheNational Center For Public Policy and Higher Education undoubtedly spurred the adoption of state
11
Performance Reporting: “Real” Accountability or Accountability “Lite” — Seventh Annual Survey

performance reports. Our SHEFO Survey in 2000 — before the appearance of the first Report Card— showed only 30 states with performance reports. In the two years following publication ofMeasuring Up 2000, that number jumped to 44, nearly a 50 percent increase (Table 8). In 2002, theNational Center published the second Report Card, Measuring Up 2002 after our Survey that year.This year, SHEFOs say that three more states – Arkansas, Montana, and Nebraska – adoptedperformance reporting. However, a new SHEFO from Rhode Island says that State does not havethe program listed as started last year. That change gives a net increase of two programs to 46.
Table 8. States with Performance Reporting
Fourth2000
30 states(60%)
Alabama, Arizona, California, Colorado, Connecticut, Florida,Georgia, Hawaii, Idaho, Illinois, Kentucky, Louisiana,Maryland, Massachusetts, Mississippi, Missouri, New Jersey,New Mexico, North Dakota, Oregon, Rhode Island, SouthCarolina, South Dakota, Tennessee, Texas, Utah, Washington,West Virginia, Wisconsin, Wyoming
Fifth2001
39 states(78%)
Alabama, Alaska, Arizona, California, Colorado, Connecticut,Florida, Georgia, Hawaii, Idaho, Illinois, Kansas, Kentucky,Louisiana, Maine, Maryland, Massachusetts, Michigan,Minnesota, Mississippi, Missouri, New Jersey, New Mexico,North Carolina, North Dakota, Ohio, Oregon, Pennsylvania,Rhode Island, South Carolina, South Dakota, Tennessee,Texas, Utah, Virginia, Washington, West Virginia, Wisconsin,Wyoming
Sixth2002
44 states(88%)
Alabama, Alaska, Arizona, California, Colorado, Connecticut,Florida, Georgia, Hawaii, Idaho, Illinois, Indiana, Iowa,Kansas, Kentucky, Louisiana, Maine, Maryland,Massachusetts, Michigan, Minnesota, Mississippi, Missouri,New Hampshire, New Jersey, New Mexico, North Carolina,North Dakota, Ohio, Oklahoma, Oregon, Pennsylvania, RhodeIsland, South Carolina, South Dakota, Tennessee, Texas, Utah,Vermont, Virginia, Washington, West Virginia, Wisconsin,Wyoming
Seventh2003
46 states(92%)
Alabama, Alaska, Arizona, Arkansas, California, Colorado,Connecticut, Florida, Georgia, Hawaii, Idaho, Illinois, Indiana,Iowa, Kansas, Kentucky, Louisiana, Maine, Maryland,Massachusetts, Michigan, Minnesota, Mississippi, Missouri,Montana, Nebraska, New Hampshire, New Jersey, NewMexico, North Carolina, North Dakota, Ohio, Oklahoma,Oregon, Pennsylvania, South Carolina, South Dakota,Tennessee, Texas, Utah, Vermont, Virginia, Washington, WestVirginia, Wisconsin, Wyoming
Continuance of the current reporting programs seems beyond doubt (Table 9). SHEFOs see 80percent of states with the program as highly likely and 20 percent as likely to retain performancereporting. (The astronomical height of this rating becomes apparent when compared with the highlylikely continuance prediction of 60 percent for performance funding and 53 percent forperformance budgeting.) The current coverage of performance reporting makes future adoptionsdifficult. Replies from Delaware, Nevada, and Rhode Island see starting the program as unlikely,while the one from New York cannot predict the decision of that state.
12
Higher Education Program — Rockefeller Institute of Government

Table 9. Likelihood of Continuing Performance Reporting 2001
2001
Highly Likely85%(33)
Alaska, Arizona, California, Colorado, Connecticut,Florida, Georgia, Idaho, Illinois, Kansas, Kentucky,Louisiana, Maine, Maryland, Michigan, Minnesota,Mississippi, Missouri, New Mexico, North Carolina, NorthDakota, Ohio, Oregon, Pennsylvania, Rhode Island, SouthCarolina, South Dakota, Tennessee, Texas, Utah, Virginia,West Virginia, Wisconsin
Likely10%(4)
Alabama, Hawaii, Massachusetts, New Jersey
Unlikely2.5%(1)
Wyoming
Cannot Predict2.5%(1)
Washington
2002
Highly Likely70.5%(31)
Alabama, Alaska, Arizona, Connecticut, Florida, Georgia,Idaho, Illinois, Indiana, Iowa, Kansas, Kentucky,Louisiana, Michigan, Minnesota, Mississippi, Missouri,New Jersey, New Mexico, North Dakota, Ohio, Oklahoma,Pennsylvania, Rhode Island, South Carolina, SouthDakota, Tennessee, Utah, Virginia, West Virginia,Wisconsin
Likely25%(11)
California, Colorado, Maine, Maryland, Massachusetts,New Hampshire, New York, North Carolina, Oregon,Texas, Vermont, Washington
Cannot Predict4%(2)
Hawaii, Wyoming
2003
Highly Likely80%(37)
Alabama, Arizona, Arkansas, California, Colorado,Connecticut, Florida, Georgia, Hawaii, Idaho, Illinois,Indiana, Iowa, Kansas, Kentucky, Louisiana,Massachusetts, Michigan, Minnesota, Mississippi,Missouri, New Jersey, New Mexico, North Carolina, NorthDakota, Ohio, Oklahoma, Oregon, Pennsylvania,Tennessee, Utah, Vermont, Virginia, Washington, WestVirginia, Wisconsin, Wyoming
Likely20%(9)
Alaska, Maine, Maryland, Montana, Nebraska, NewHampshire, South Carolina, South Dakota, Texas
13
Performance Reporting: “Real” Accountability or Accountability “Lite” — Seventh Annual Survey

§ The Use of Performance Reports
Performance reports rely on information to improve higher education. The power of informationto lever improvement depends on its use. Our survey questions SHEFOs on the use of performancereports for planning and policy making by their own coordinating or system boards and by stateofficials. It also inquires about the coordinating boards level of use of performance reports inallocating resources to public colleges and universities. Planning, policymaking and budgeting arethe major ways that state governments or coordinating agencies influence performance in highereducation.
The replies from SHEFOs show that the use of performance reporting for planning andpolicymaking by coordinating or system boards is far less than desirable (Table 10). Nearly half ofthe SHEFOs say there own agencies only use these reports moderately in planning andpolicymaking. About another quarter cite minimal, no extent, or cannot judge. Only four percentclaim great and 20 percent considerable extent.
Table 10. Extent that Coordinating/System Governing Boards Consider
Performance Reports in their Planning & Policymaking, 2003
Great Extent4%(2)
Arizona, Iowa
Considerable Extent20%(9)
Alaska, Indiana, Kentucky, Missouri, North Carolina,Ohio, Vermont, West Virginia, Wisconsin
Moderate Extent48%(22)
Alabama, Arkansas, Connecticut, Florida, Georgia, Hawaii,Idaho, Illinois, Louisiana, Maine, Maryland,Massachusetts, Montana, New Hampshire, New Mexico,North Dakota, Oklahoma, Oregon, South Carolina, SouthDakota, Tennessee, Texas
Minimal Extent15%(7)
Kansas, Minnesota, Mississippi, New Jersey, Utah,Washington, Wyoming
No Extent6.5%(3)
California, Michigan, Virginia
Cannot Predict6.5%(3)
Colorado, Nebraska, Pennsylvania
If the use of reporting by coordinating or system agencies for planning and policymaking isdisappointing, that by state government is dismal (Table 11). No state ranks government use of theperformance reports for planning and policymaking as great extent; and only West Virginia rates itas considerable. Just 30 percent of the states even use their reports to a moderate extent for planningand policymaking. Fully 39 percent of the replies assess their use as minimal or no extent; andperhaps worst, 28 percent even cannot judge the extent of their use. Our recent book onperformance reporting — looking at the modest use of performance reports in planning andpolicymaking — puts that program in a category that political scientists call “symbolic policies”(Burke & Minassians 2002b). Symbolic policies appear to address problems, while having littlesubstantive effect.
14
Higher Education Program — Rockefeller Institute of Government

Table 11. Extent That Government Leaders Consider
Performance Reports in Their Planning & Policymaking, 2003
Considerable Extent2%(1)
West Virginia
Moderate Extent30%(14)
Alaska, Colorado, Connecticut, Florida, Georgia,Hawaii, Louisiana, Maryland, Michigan, Missouri,New Mexico, Oklahoma, South Dakota, Tennessee
Minimal Extent26%(12)
Alabama, California, Illinois, Iowa, Kentucky,Montana, Nebraska, New Jersey, North Carolina,North Dakota, Texas, Washington
No Extent13%(6)
Indiana, New Hampshire, Oregon, Pennsylvania,Virginia, Wisconsin
Cannot Judge28%(13)
Arizona, Arkansas, Idaho, Kansas, Maine,Massachusetts, Minnesota, Mississippi, Ohio, SouthCarolina, Utah, Vermont, Wyoming
If the effect of performance reporting on planning and policy making is far less than desired,SHEFOs estimates of its consideration in allocating state resources is more than expected (Table12). After all, several of them had suggested that some legislators now regarded performancereporting as a “no cost” alternative to performance funding or budgeting. Although 65 percent ofthe responses claim minimal or no extent and four percent cannot judge, nine percent sayperformance reports are considered to a considerable extent and 22 percent to a moderate extent inbudget allocations.
Table 12. Extent that Coordinating/System Governing Boards Consider
Performance Reports in the Allocation of Resources to Campuses 2003
Considerable Extent9%(4)
Colorado, North Carolina, South Dakota, WestVirginia
Moderate Extent22%(10)
Alaska, Florida, Hawaii, Illinois, Kentucky, Maryland,Missouri, Pennsylvania, South Carolina, Tennessee
Minimal Extent30%(14)
Alabama, California, Connecticut, Georgia, Idaho,Louisiana, Maine, Nebraska, New Mexico,Oklahoma, Texas, Utah, Wisconsin, Wyoming
No Extent35%(16)
Arizona, Arkansas, Indiana, Iowa, Kansas,Massachusetts, Michigan, Minnesota, Mississippi,Montana, New Hampshire, New Jersey, NorthDakota, Oregon, Virginia, Washington
Cannot Predict4%(2)
Ohio, Vermont
This estimate may well exaggerate the use of performance reporting in considering stateallocations. It seems highly unlikely that coordinating boards would give even this limited extent ofconsideration to performance reports in budgeting at a time of deep budget difficulties.
Of the four states listed as considering reports to a considerable extent in allocations, Coloradoand North Carolina faced large projected budget gaps for 2004. Moreover, four of the ten states
15
Performance Reporting: “Real” Accountability or Accountability “Lite” — Seventh Annual Survey

cited as moderate extent had large budget gaps either in 2003 or 2004 (NCSL 2003, pp. 5-6, 18-19.)In addition, coordinating boards in Illinois and Missouri abandoned both performance funding andbudgeting because of budget problems, but — in this same year — they are also named asconsidering performance reports to a moderate extent in budget allocations. A survey in our bookon performance reporting shows that the use of reports for budgeting by state, coordinating, andcampus leaders trailed the moderate use for planning and policy making (Burke & Minassians2000b, pp., 66-67)
One explanation for the unexpected number of states that considered the reports for allocationsis possible confusion of the effect of performance reporting with that of performance funding, sincethey often used the same indicators. Colorado and South Dakota, which also have performancefunding, constitute half of the four states where performance reports are cited as having aconsiderable effect on budgeting. Moreover, four of the ten in the moderate column also haveperformance funding: Florida, Pennsylvania, South Carolina, and Tennessee. In addition, Illinoisand Missouri had performance funding until this Year. On the other hand, SHEFOs in five otherstates with performance funding cited minimal or no extent, or cannot judge on the issue ofconsidering performance reports in state allocations.
Sorting out the confusion created by this response on considering performance reports inallocating resources requires more study. The best bet is that most policy makers probably viewperformance reporting as a “no cost” alternative to performance funding and budgeting. Still somemay see it as a milder version of performance budgeting, which allows them to considerperformance in budgeting without committing to a formal program.
§ Measuring UP and Performance Reporting
Obviously, the publication of Measuring Up 2000 enhanced the popularity of state performancereports (National Center for Public Policy and Higher Education 2000). Beginning in 2001, wetried to track whether that State By-State Report Card would lead to revisions in the contents ofstate performance reports. In 2002, we began asking the SHEFOs whether their state had revised itsperformance report based first on Measuring UP 2000 and then on Measuring Up 2002. If they hadmade changes, we asked the extent of those revisions. After two years of questions, two ReportCards, and extensive field work by the National Center, SHEFOs say just seven states have revisedtheir performance reports. Indiana, Oklahoma, Tennessee and West Virginia changed them to aconsiderable extent, Maryland to a moderate extent, and Hawaii to a minimal extent. The responsefrom Texas did not note the extent of the revision. This small number of revisions underscores theproblem of the lack of connection between the Measuring Up Report Cards that include onlystatewide performance reports and the state performance reports that also include system andinstitutional results. Our book on performance reporting proposes a limited list of commonindicators to connect the state reports and Measuring Up (Burke & Minassians 2002b).
§ Impact on Campus Performance
Of course, the bottom-line in assessing all performance programs is the extent to which eachimproves the performance of higher education. None of the three programs show the desired impacton improvement. In fairness, bad budget years are hardly fair times to test the relative impact ofreporting, funding, or budgeting on improvement. But even the percentages on extent of
16
Higher Education Program — Rockefeller Institute of Government
improvement before the recent recession hardly reach the level expected from programs withperformance in their title.
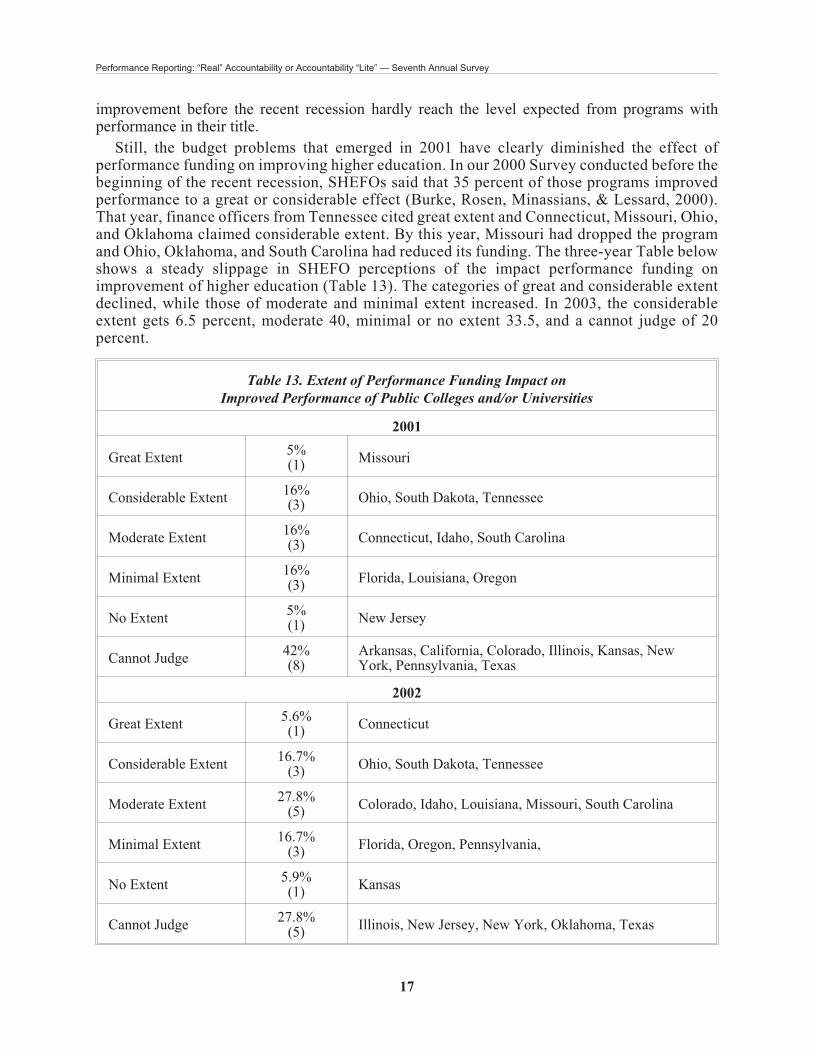
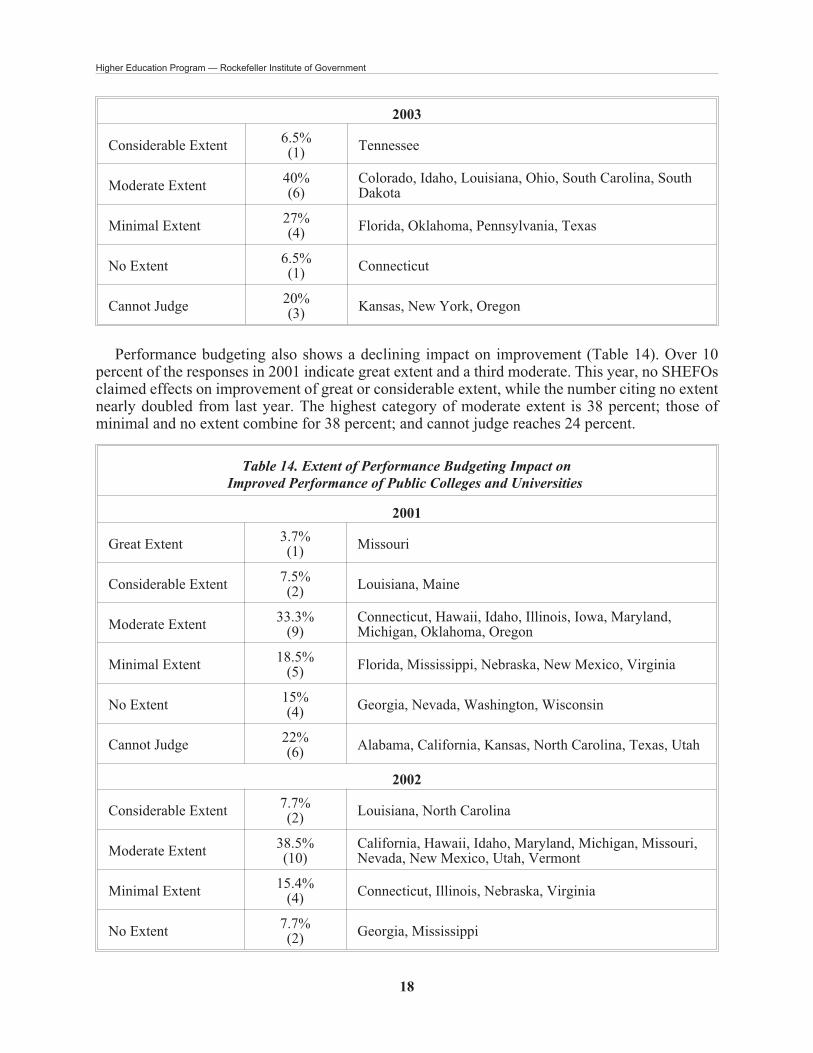
Still, the budget problems that emerged in 2001 have clearly diminished the effect ofperformance funding on improving higher education. In our 2000 Survey conducted before thebeginning of the recent recession, SHEFOs said that 35 percent of those programs improvedperformance to a great or considerable effect (Burke, Rosen, Minassians, & Lessard, 2000).That year, finance officers from Tennessee cited great extent and Connecticut, Missouri, Ohio,and Oklahoma claimed considerable extent. By this year, Missouri had dropped the programand Ohio, Oklahoma, and South Carolina had reduced its funding. The three-year Table belowshows a steady slippage in SHEFO perceptions of the impact performance funding onimprovement of higher education (Table 13). The categories of great and considerable extentdeclined, while those of moderate and minimal extent increased. In 2003, the considerableextent gets 6.5 percent, moderate 40, minimal or no extent 33.5, and a cannot judge of 20percent.
Table 13. Extent of Performance Funding Impact on
Improved Performance of Public Colleges and/or Universities
2001
Great Extent5%(1)
Missouri
Considerable Extent16%(3)
Ohio, South Dakota, Tennessee
Moderate Extent16%(3)
Connecticut, Idaho, South Carolina
Minimal Extent16%(3)
Florida, Louisiana, Oregon
No Extent5%(1)
New Jersey
Cannot Judge42%(8)
Arkansas, California, Colorado, Illinois, Kansas, NewYork, Pennsylvania, Texas
2002
Great Extent5.6%(1)
Connecticut
Considerable Extent16.7%
(3)Ohio, South Dakota, Tennessee
Moderate Extent27.8%
(5)Colorado, Idaho, Louisiana, Missouri, South Carolina
Minimal Extent16.7%
(3)Florida, Oregon, Pennsylvania,
No Extent5.9%(1)
Kansas
Cannot Judge27.8%
(5)Illinois, New Jersey, New York, Oklahoma, Texas
17
Performance Reporting: “Real” Accountability or Accountability “Lite” — Seventh Annual Survey
2003
Considerable Extent6.5%(1)
Tennessee
Moderate Extent40%(6)
Colorado, Idaho, Louisiana, Ohio, South Carolina, SouthDakota
Minimal Extent27%(4)
Florida, Oklahoma, Pennsylvania, Texas
No Extent6.5%(1)
Connecticut
Cannot Judge20%(3)
Kansas, New York, Oregon
Performance budgeting also shows a declining impact on improvement (Table 14). Over 10percent of the responses in 2001 indicate great extent and a third moderate. This year, no SHEFOsclaimed effects on improvement of great or considerable extent, while the number citing no extentnearly doubled from last year. The highest category of moderate extent is 38 percent; those ofminimal and no extent combine for 38 percent; and cannot judge reaches 24 percent.
Table 14. Extent of Performance Budgeting Impact on
Improved Performance of Public Colleges and Universities
2001
Great Extent3.7%(1)
Missouri
Considerable Extent7.5%(2)
Louisiana, Maine
Moderate Extent33.3%
(9)Connecticut, Hawaii, Idaho, Illinois, Iowa, Maryland,Michigan, Oklahoma, Oregon
Minimal Extent18.5%
(5)Florida, Mississippi, Nebraska, New Mexico, Virginia
No Extent15%(4)
Georgia, Nevada, Washington, Wisconsin
Cannot Judge22%(6)
Alabama, California, Kansas, North Carolina, Texas, Utah
2002
Considerable Extent7.7%(2)
Louisiana, North Carolina
Moderate Extent38.5%(10)
California, Hawaii, Idaho, Maryland, Michigan, Missouri,Nevada, New Mexico, Utah, Vermont
Minimal Extent15.4%
(4)Connecticut, Illinois, Nebraska, Virginia
No Extent7.7%(2)
Georgia, Mississippi
18
Higher Education Program — Rockefeller Institute of Government

Cannot Judge30.8%(8)
Arkansas, Florida, Iowa, Kansas, Maine, Oklahoma,Texas, Wisconsin
2003
Moderate Extent38%(8)
Hawaii, Idaho, Louisiana, Maryland, Michigan, Nevada,Oklahoma, Utah
Minimal Extent24%(5)
California, Connecticut, Nebraska, New Mexico, Texas
No Extent14%(3)
Georgia, Iowa, Wisconsin
Cannot Judge24%(5)
Florida, Kansas, Maine, Minnesota, Mississippi
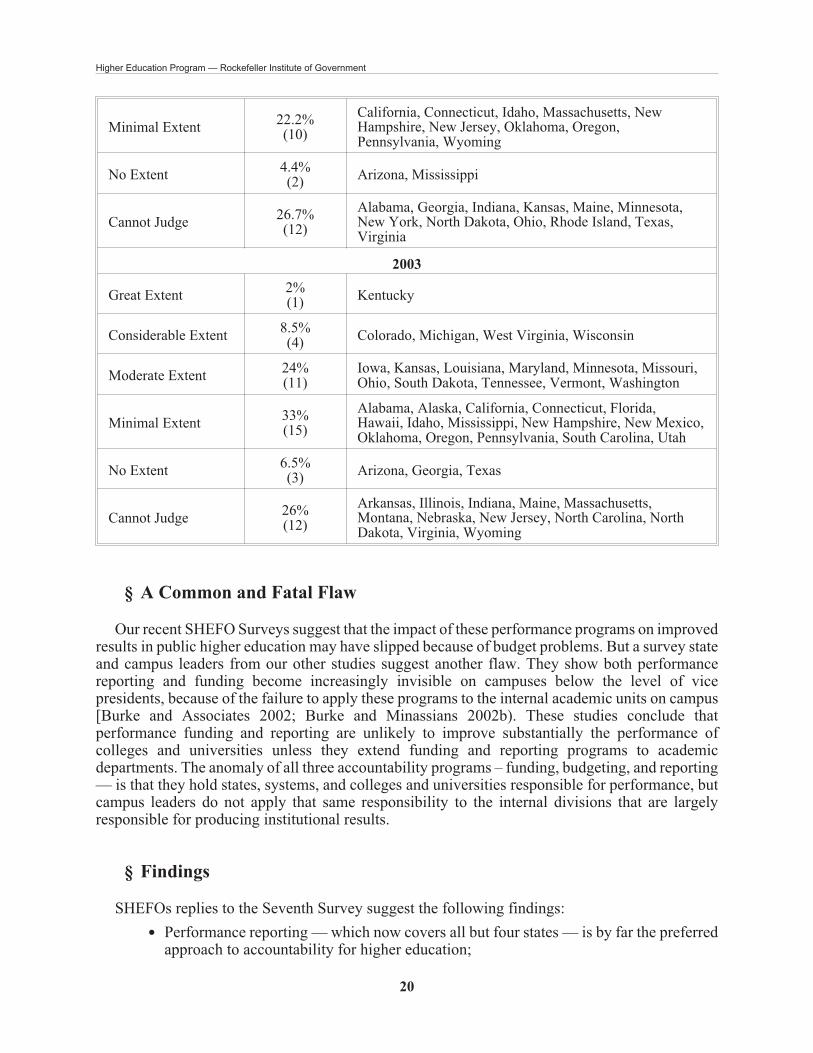
With so many new programs started in the last three years it is difficult to assess the trends of theperceived impact of performance reporting on higher education improvement. What is clear is thatSeventh SHEFO Survey shows positive effects of little over 10 percent for great and considerableextent combined and a moderate of just 24 percent, while the negative ratings of minimal and noextent reached nearly 40 percent and the cannot predict slipped slightly to 26 percent (Table 15). Animpact on improvement is hardly acceptable where the minimal and no extent exceed the great,considerable, and moderate effect combined.
Table 15. Extent of Performance Reporting Impact on
Improved Performance of Public Colleges and/or Universities
2001
Great Extent 0%
Considerable Extent 13%Kentucky, Michigan, Missouri, South Carolina, WestVirginia
Moderate Extent 36%Hawaii, Idaho, Illinois, Louisiana, Maryland, New Jersey,New Mexico, North Carolina, Pennsylvania, SouthDakota, Tennessee, Utah, Virginia, Wyoming
Minimal Extent 15%Arizona, California, Florida, Massachusetts, Mississippi,Wisconsin
No Extent 8% Alabama, Rhode Island, Washington
Cannot Judge 28%Alaska, Colorado, Connecticut, Georgia, Kansas, Maine,Minnesota, North Dakota, Ohio, Oregon, Texas
2002
Great Extent 0%
Considerable Extent13.3%
(6)Iowa, Michigan, North Carolina, South Carolina,Tennessee, West Virginia
Moderate Extent33.3%(15)
Alaska, Colorado, Florida, (Hawaii), Illinois, Kentucky,Louisiana, Maryland, Missouri, New Mexico, SouthDakota, Utah, Vermont, Washington, Wisconsin
19
Performance Reporting: “Real” Accountability or Accountability “Lite” — Seventh Annual Survey
Minimal Extent22.2%(10)
California, Connecticut, Idaho, Massachusetts, NewHampshire, New Jersey, Oklahoma, Oregon,Pennsylvania, Wyoming
No Extent4.4%(2)
Arizona, Mississippi
Cannot Judge26.7%(12)
Alabama, Georgia, Indiana, Kansas, Maine, Minnesota,New York, North Dakota, Ohio, Rhode Island, Texas,Virginia
2003
Great Extent2%(1)
Kentucky
Considerable Extent8.5%(4)
Colorado, Michigan, West Virginia, Wisconsin
Moderate Extent24%(11)
Iowa, Kansas, Louisiana, Maryland, Minnesota, Missouri,Ohio, South Dakota, Tennessee, Vermont, Washington
Minimal Extent33%(15)
Alabama, Alaska, California, Connecticut, Florida,Hawaii, Idaho, Mississippi, New Hampshire, New Mexico,Oklahoma, Oregon, Pennsylvania, South Carolina, Utah
No Extent6.5%(3)
Arizona, Georgia, Texas
Cannot Judge26%(12)
Arkansas, Illinois, Indiana, Maine, Massachusetts,Montana, Nebraska, New Jersey, North Carolina, NorthDakota, Virginia, Wyoming
§ A Common and Fatal Flaw
Our recent SHEFO Surveys suggest that the impact of these performance programs on improvedresults in public higher education may have slipped because of budget problems. But a survey stateand campus leaders from our other studies suggest another flaw. They show both performancereporting and funding become increasingly invisible on campuses below the level of vicepresidents, because of the failure to apply these programs to the internal academic units on campus[Burke and Associates 2002; Burke and Minassians 2002b). These studies conclude thatperformance funding and reporting are unlikely to improve substantially the performance ofcolleges and universities unless they extend funding and reporting programs to academicdepartments. The anomaly of all three accountability programs – funding, budgeting, and reporting— is that they hold states, systems, and colleges and universities responsible for performance, butcampus leaders do not apply that same responsibility to the internal divisions that are largelyresponsible for producing institutional results.
§ Findings
SHEFOs replies to the Seventh Survey suggest the following findings:
• Performance reporting — which now covers all but four states — is by far the preferredapproach to accountability for higher education;
20
Higher Education Program — Rockefeller Institute of Government

• Bad budgets for states and higher education continue to erode support for performancefunding and budgeting;
• More policy makers in state government and higher education agencies seem to see per-formance reporting as a “no cost” alternative to performance funding and budgeting;
• Still, the responses from some SHEFOs suggest that some policy makers may view per-formance reporting as an informal form of performance budgeting;
• Measuring Up 2002 continues to spur interests in statewide performance reporting, butonly a limited number of states are revising their reports to link them with those reportscards
• State governments are making only modest and coordinating and system boards onlymoderate use of performance reports in planning and policymaking.
• None of the three programs demonstrate the desirable impact on the improving perfor-mance, but performance funding shows more than budgeting or reporting.
§ Conclusion
Performance reporting has become by far the preferred approach to accountability. State policymakers see it as a less controversial and less costly alternative to performance funding andbudgeting. It relies on information rather than funding or budgeting as a lever to encourage desiredperformance in public higher education and its colleges and universities. But information ispowerful only if used. The findings from the Seventh SHEFO Survey and our recent book suggestthat performance reports are not widely used by state and campus policy makers. To date, reportingresembles more a symbolic than substantive reform. Only time will tell whether performancereporting represents “real” accountability that sets goals and seeks results or accountability “lite”that looks good but is less fulfilling.
21
Performance Reporting: “Real” Accountability or Accountability “Lite” — Seventh Annual Survey

§ References
Burke J.C. & Minassians, H. P., Performance Reporting: The Preferred ‘No Cost’ AccountabilityProgram: The Sixth Annual Report. Albany, NY: The Rockefeller Institute, 2002a.
Burke, J.C. & Minassians, H. P. Reporting Higher Education Results: Missing Links inPerformance. New Directions in Institutional Research, No. #116, December 2002b.
Burke, J.C. & Associates. Funding Public Colleges and Universities for Performance: Popularity,Problems, and Prospects. Albany, NY: The Rockefeller Institute, 2002.
Burke, J.C. & Minassians, H. P. Linking Resources to Campus Results: From Fad to Trend: TheFifth Annual Survey: 2001. Albany, NY: The Rockefeller Institute, 2001.
Burke, J.C. & Modarresi, S. (2000). “To Keep or Not to Keep Performance Funding: Signals fromStakeholders.” The Journal of Higher Education 71(4): 432 - 454.
Burke, J.C., Rosen, J., Minassians, H. & Lessard, T. Performance Funding and Budgeting: AnEmerging Merger? The Fourth Annual Survey (2000). Albany, NY: The Rockefeller Institute,2000.
Burke J.C. & Serban, A.M. Performance Funding and Budgeting for Public Higher Education:Current Status and Future Prospects. Albany, NY: Rockefeller Institute of Government, 1997.
National Conference of State Legislatures. State Budget UpDate. April, 2003. Denver, CO.http://www.ncsl.org.
The National Center For Public Policy And Higher Education, Measuring Up 2000: TheState-By-State Report Card For Higher Education. San Jose, CA: The National Center ForPublic Policy And Higher Education, 2000.
The National Center For Public Policy And Higher Education, Measuring Up 2002: TheState-By-State Report Card For Higher Education. San Jose, CA: The National Center ForPublic Policy And Higher Education, 2002.
Stein, R. B. “Missouri Coordinating Board for Higher Education Funding for Results,’ LessonsLearned from FIPSE Projects IV. Fund for the Improvement of Postsecondary Education 2000,2-9-220..
Stein, R. B. and Fajen, A. L. “Missouri’s Funding for Results Initiative.” In G. H. Gaither (ed.),Assessing Performance in an Age of Accountability: Case Studies. New Directions for HigherEducation, no 91. San Francisco: Jossey-Bass, 1995.
22
Higher Education Program — Rockefeller Institute of Government

Appendix A
SURVEY OF STATE HIGHER EDUCATION FINANCE OFFICERS
PERFORMANCE REPORTING, FUNDING, AND BUDGETING
MAY 2003
NAME: ___________________________
STATE: ___________________________ PHONE #: ____________________
Definitions:
PERFORMANCE FUNDING: Ties specified state funding directly and tightly to the performanceof public campuses on performance indicators.
PERFORMANCE BUDGETING: Allows governors, legislators, and coordinating or systemboards to consider campus achievement on performance indicators as one factor in determiningpublic campus allocations.
Section One: Performance Funding
1) Does your state currently have performance funding for public colleges and/or universities?
Yes � No �
If Yes,
2) What is the percent of funding allocated to performance funding for public colleges and/oruniversities in your state? %
3) Was it mandated by legislation? Yes � No �
4) Were the indicators prescribed by legislation? Yes � No �
5) Of the following, what individual or group(s) initiated performance funding?
Governor �
Legislature �
Coordinating board or agency �
University system(s) �
Other (please specify) �
23
Performance Reporting: “Real” Accountability or Accountability “Lite” — Seventh Annual Survey

6) How has the state allocation for Performance Funding been affected by decline in staterevenues?
Funding Maintained � Reduced � Suspended � Don't Know �
7) In your opinion, to what extent has performance funding improved the performance ofpublic colleges and/or universities in your state?
Great Extent � Considerable Extent � Moderate Extent �Minimal Extent � No Extent � Cannot Judge �
8) How likely is it that your state will continue performance funding for public highereducation over the next five years?
Highly Likely � Likely � Unlikely � Highly Unlikely �Cannot Predict �
If no,
9) How likely is it that your state will adopt performance funding for public higher educationin the next five years?
Highly Likely � Likely � Unlikely � Highly Unlikely �Cannot Predict �
Section Two: Performance Budgeting
10) Does your state currently have performance budgeting for public colleges and/oruniversities?
Yes � No �
If Yes,
11) Was it mandated by legislation?
Yes � No �
12) Were the indicators prescribed by legislation?
Yes � No �
24
Higher Education Program — Rockefeller Institute of Government
13) Of the following, what individual or group(s) initiated performance budgeting?
Governor �
Legislature �
Coordinating board or agency �
University system(s) �
Other (please specify) �
14) In your opinion, to what extent has performance budgeting improved the performance ofpublic colleges and/or universities in your state?
Great Extent � Considerable Extent � Moderate Extent �Minimal Extent � No Extent � Cannot Judge �
15) How likely is it that your state will continue performance budgeting for public highereducation over the next five years?
Highly Likely � Likely � Unlikely � Highly Unlikely �Cannot Predict �
16) How would you describe the actual effect of performance budgeting in your state on thefunding of public colleges and universities?
Great Effect � Considerable Effect � Moderate Effect �Minimal Effect � No Effect � Cannot Judge �
If no,
17) How likely is it that your state will adopt performance budgeting for public highereducation in the next five years?
Highly Likely � Likely � Unlikely � Highly Unlikely �Cannot Predict �
Section Three: Performance Reporting
18) Does your state currently have performance reporting for public higher education?
Yes � No �
If Yes,
19) Was it mandated by legislation? Yes � No �
20) Were the indicators prescribed by legislation? Yes � No �
25
Performance Reporting: “Real” Accountability or Accountability “Lite” — Seventh Annual Survey

21) Of the following, what individual or group(s) initiated performance reporting?
Governor �
Legislature �
Coordinating board or agency �
University system(s) �
Other (please specify) �
22) In your opinion, to what extent has performance reporting improved the performance ofpublic colleges and universities in your state?
Great Extent � Considerable Extent � Moderate Extent �Minimal Extent � No Extent � Cannot Judge �
23) How likely is it that your state will continue performance reporting for public highereducation over the next five years?
Highly Likely � Likely � Unlikely � Highly Unlikely �Cannot Predict �
24) In your opinion, to what extent do the coordinating and/or system governing boardsconsider performance reports in the allocation of resources to colleges and universities?
Great Extent � Considerable Extent � Moderate Extent �Minimal Extent � No Extent � Cannot Judge �
25) To what extent do the coordinating and/or system governing boards consider performancereports in their planning and policymaking?
Great Extent � Considerable Extent � Moderate Extent �Minimal Extent � No Extent � Cannot Judge �
26) To what extent, do state government leaders consider the performance reports in theirplanning and policymaking?
Great Extent � Considerable Extent � Moderate Extent �Minimal Extent � No Extent � Cannot Judge �
27) Has your State revised its performance report based on its scores on the state-by-state reportcard Measuring Up 2000 & 2002, published by the National Center for Public Policy andHigher Education?
Yes � No �
If Yes, to what extent?
Great Extent � Considerable Extent � Moderate Extent �Minimal Extent � No Extent � Cannot Judge �
26
Higher Education Program — Rockefeller Institute of Government
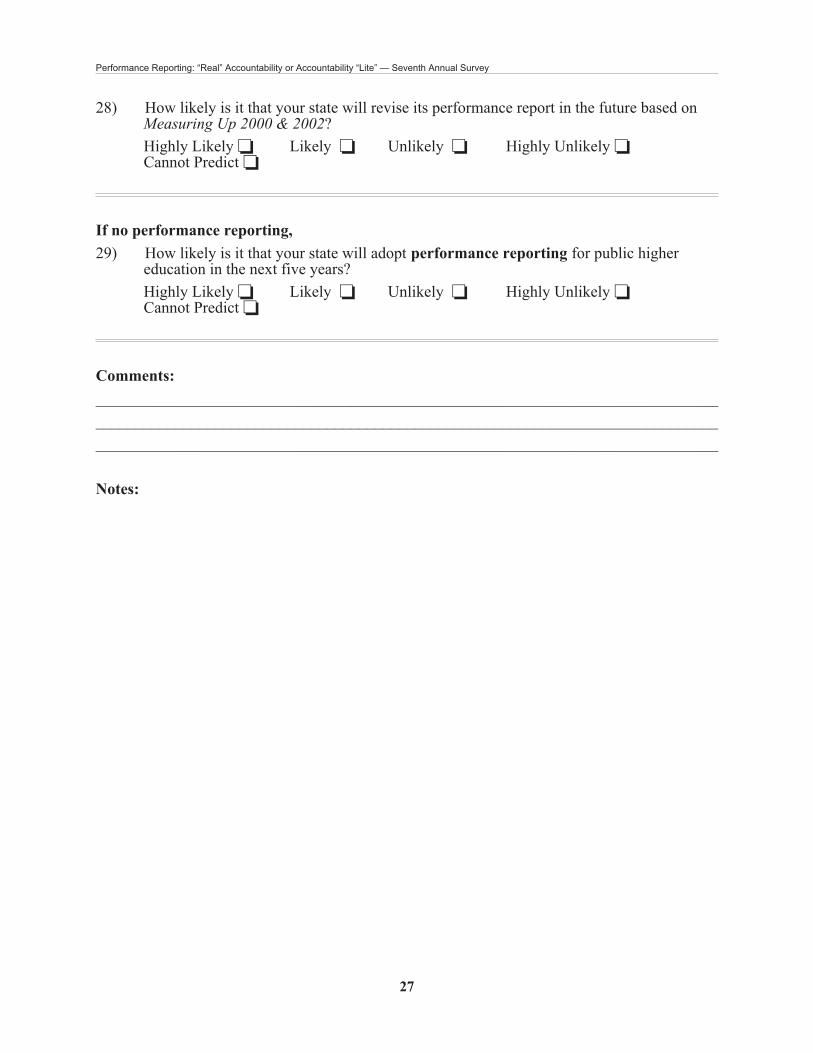
28) How likely is it that your state will revise its performance report in the future based onMeasuring Up 2000 & 2002?
Highly Likely � Likely � Unlikely � Highly Unlikely �Cannot Predict �
If no performance reporting,
29) How likely is it that your state will adopt performance reporting for public highereducation in the next five years?
Highly Likely � Likely � Unlikely � Highly Unlikely �Cannot Predict �
Comments:
______________________________________________________________________________
______________________________________________________________________________
______________________________________________________________________________
Notes:
27
Performance Reporting: “Real” Accountability or Accountability “Lite” — Seventh Annual Survey
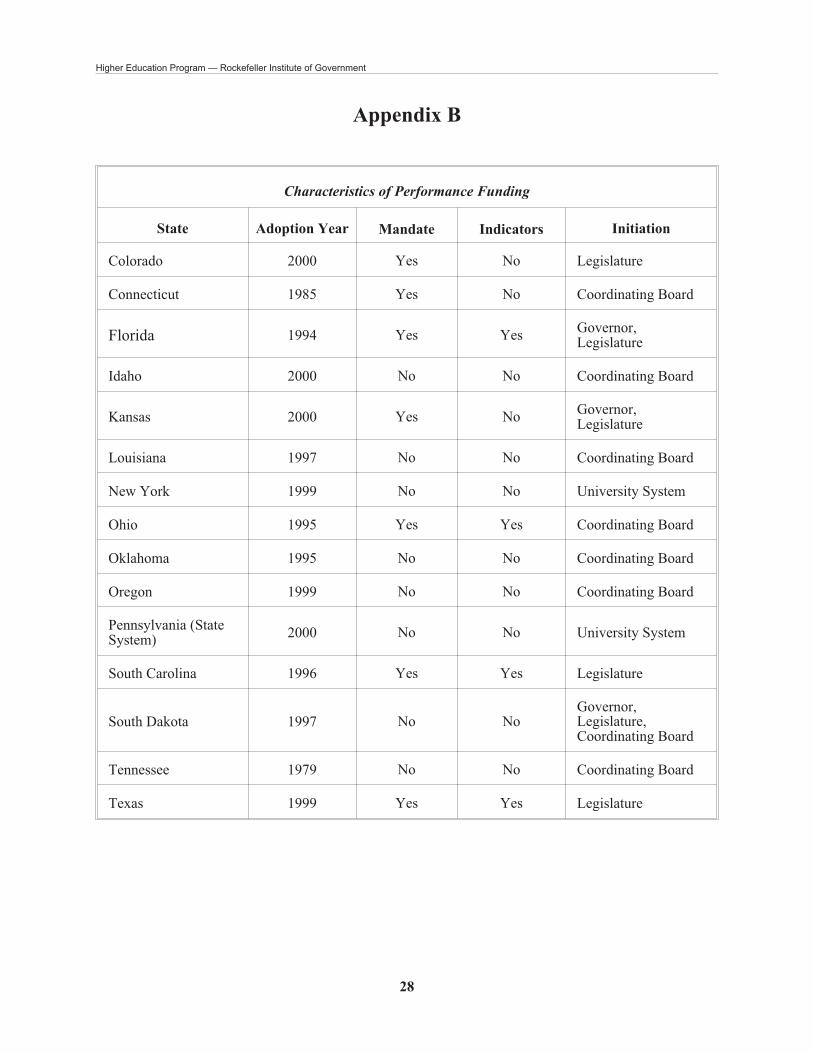
Appendix B
Characteristics of Performance Funding
State Adoption Year Mandate Indicators Initiation
Colorado 2000 Yes No Legislature
Connecticut 1985 Yes No Coordinating Board
Florida 1994 Yes YesGovernor,Legislature
Idaho 2000 No No Coordinating Board
Kansas 2000 Yes NoGovernor,Legislature
Louisiana 1997 No No Coordinating Board
New York 1999 No No University System
Ohio 1995 Yes Yes Coordinating Board
Oklahoma 1995 No No Coordinating Board
Oregon 1999 No No Coordinating Board
Pennsylvania (StateSystem)
2000 No No University System
South Carolina 1996 Yes Yes Legislature
South Dakota 1997 No NoGovernor,Legislature,Coordinating Board
Tennessee 1979 No No Coordinating Board
Texas 1999 Yes Yes Legislature
28
Higher Education Program — Rockefeller Institute of Government

Characteristics of Performance Budgeting
State Adoption Year Mandated Indicators Initiation
California 2000 No NoGovernor,System Boards
Connecticut 1999 Yes NoGovernor,University System
Florida 1994 Yes No Governor, Legislature
Georgia 1993 Yes No Governor
Hawaii 1975 Yes No Governor, Legislature
Idaho 1996 Yes No Legislature
Iowa 1996 Yes No Governor
Kansas 1995 No No Coordinating Board
Louisiana 1997 Yes No Legislature
Maine 1998 Yes No Governor
Maryland 2000 No No Governor
Michigan 1999 No No Governor
Minnesota 2003 Yes Yes Governor, Legislature
Mississippi 1992 Yes No Legislature
Nebraska 1991 No No Coordinating Board
Nevada 2000 No Yes Governor
New Mexico 1999 Yes No Legislature
Oklahoma 1991 No No Coordinating Board
Texas 1991 Yes Yes Legislature
Utah 2000 No NoLegislature,Coordinating Board
Wisconsin 2000 No No Coordinating Board
29
Performance Reporting: “Real” Accountability or Accountability “Lite” — Seventh Annual Survey

Performance Reporting
State Date AdoptionWas It (PR) Mandated
by Legislation?Were the Indicators (PR)
Prescribed by Legislation?
Alabama 1982 No No
Alaska 2000 Yes Yes
Arizona 1995 Yes No
Arkansas 2003 Yes No
California 1991 Yes No
Colorado 1996 Yes Yes
Connecticut 2000 Yes No
Florida 1991 Yes Yes
Georgia 2000 Yes No
Hawaii 1996 Yes No
Idaho 1991 Yes No
Illinois 1997 No No
Indiana 2002 No No
Iowa 2002 Yes No
Kansas 2001 Yes No
Kentucky 1997 Yes No
Louisiana 1997 Yes No
Maine 2000 No Yes
Maryland 1991 Yes No
Massachusetts 1997 Yes No
Michigan 2000 Yes No
Minnesota 2000 Yes Yes
Mississippi 1992 Yes No
Missouri 1992 No No
Montana 2003 No No
Nebraska 2003 No No
New Hampshire 2002 No No
New Jersey 1994 Yes Yes
New Mexico 1998 No No
North Carolina 1991 Yes No
30
Higher Education Program — Rockefeller Institute of Government

Performance Reporting (Continued)
State Date AdoptionWas It (PR) Mandated
by Legislation?Were the Indicators (PR)
Prescribed by Legislation?
North Dakota 1999 Yes No
Ohio 1999 No No
Oklahoma 2002 No No
Oregon 1997 No No
Pennsylvania 1997 No No
South Carolina 1992 Yes Yes
South Dakota 1995 No No
Tennessee 1989 No No
Texas 1997 Yes Yes
Utah 1995 Yes No
Vermont 2002 Yes No
Virginia 1995 Yes No
Washington 1997 Yes Yes
West Virginia 1991 Yes Yes
Wisconsin 1993 No No
Wyoming 1995 Yes Yes
31
Performance Reporting: “Real” Accountability or Accountability “Lite” — Seventh Annual Survey

Appendix C
Table 1. State Budget Gaps*
StateFY 2003 Current Estimated
Gap as Percentage of GeneralFund Budget
FY 2004 Current EstimatedGap as Percentage of General
Fund Budget
Colorado 0 0
Connecticut 0 0
Florida 0 0
Idaho 7.9 8.8
Kansas 2.4 5.1
Louisiana 0 8.5
New York 6.3 24
Ohio 0 7.1
Oklahoma 7.8 5.3
Oregon 18.5 17
Pennsylvania 3.4 0
South Carolina 8.6 7.5
South Dakota 0 0
Tennessee 5.2 N/A
Texas 5.8 12
Average 4.3 6.3
States Dropped
Illinois 6.5 13.6
Missouri 4.5 10.5
New Jersey 4.7 0
Average 5.3 12.05
* States with Performance Funding & States That Dropped Performance Funding
32
Higher Education Program — Rockefeller Institute of Government
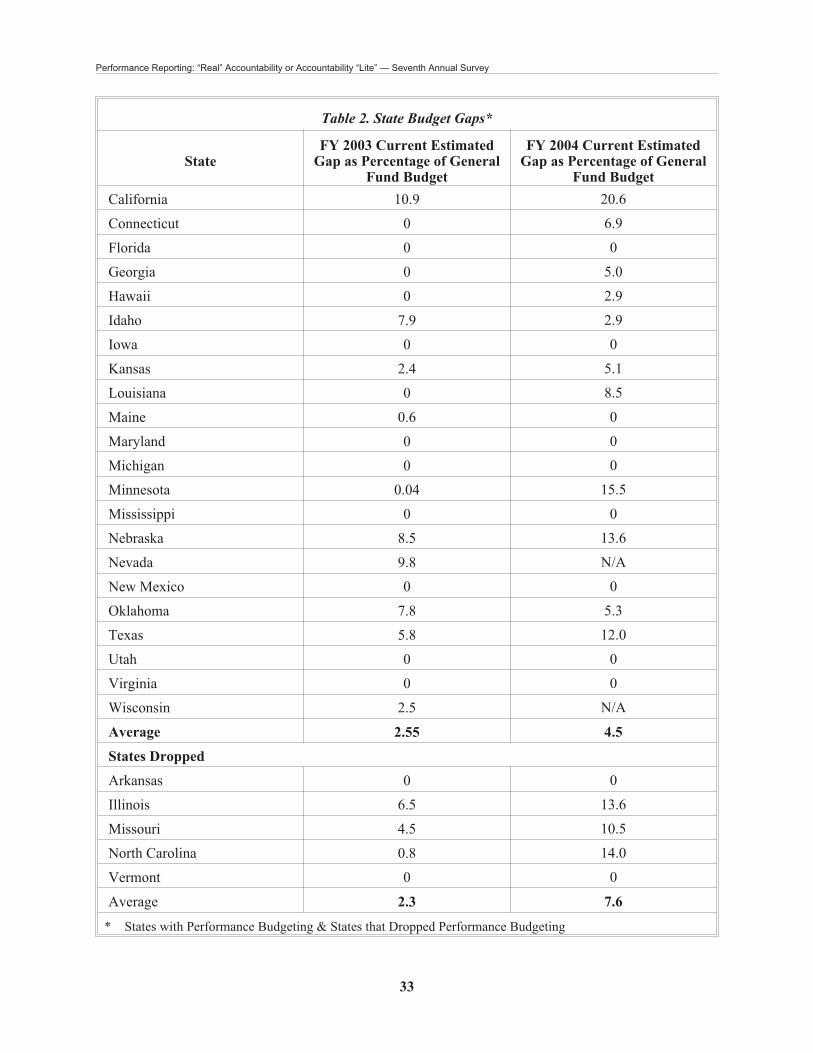
Table 2. State Budget Gaps*
StateFY 2003 Current Estimated
Gap as Percentage of GeneralFund Budget
FY 2004 Current EstimatedGap as Percentage of General
Fund Budget
California 10.9 20.6
Connecticut 0 6.9
Florida 0 0
Georgia 0 5.0
Hawaii 0 2.9
Idaho 7.9 2.9
Iowa 0 0
Kansas 2.4 5.1
Louisiana 0 8.5
Maine 0.6 0
Maryland 0 0
Michigan 0 0
Minnesota 0.04 15.5
Mississippi 0 0
Nebraska 8.5 13.6
Nevada 9.8 N/A
New Mexico 0 0
Oklahoma 7.8 5.3
Texas 5.8 12.0
Utah 0 0
Virginia 0 0
Wisconsin 2.5 N/A
Average 2.55 4.5
States Dropped
Arkansas 0 0
Illinois 6.5 13.6
Missouri 4.5 10.5
North Carolina 0.8 14.0
Vermont 0 0
Average 2.3 7.6
* States with Performance Budgeting & States that Dropped Performance Budgeting
33
Performance Reporting: “Real” Accountability or Accountability “Lite” — Seventh Annual Survey

TheNelson A.RockefellerInstituteofGovernment
The State Universityof New York
411 State StreetAlbany, New York 12203-1003
NONPROFITORG.
U.S. POSTAGEPAID
ALBANY, N.Y.PERMIT NO. 21


![CBM - [Document title] · 2019-02-27 · CBM’s seventh accountability report to Accountable Now is again very good, ... The Panel highlights the importance of CBM’s commitment](https://static.cupdf.com/doc/110x72/5f8c823a58680254c3234a6c/cbm-document-title-2019-02-27-cbmas-seventh-accountability-report-to-accountable.jpg)