Performance Measurement Performance Measurement Within NIATXWithin NIATX
Dennis McCartyOregon Health & Science UniversityUsing Performance and Outcome Measures to Improve TreatmentLos Angeles, CAMarch 21, 2008
March 21, 2008 NIATx Measures 2
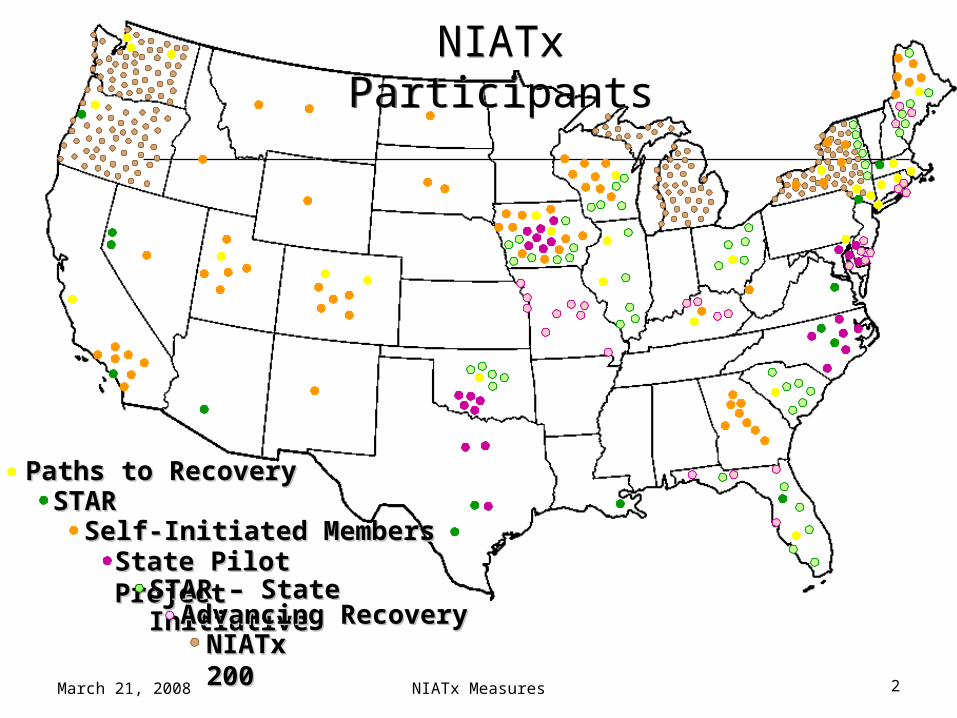
Paths to RecoveryPaths to Recovery STARSTAR
State Pilot ProjectState Pilot ProjectSelf-Initiated MembersSelf-Initiated Members
NIATx ParticipantsNIATx Participants
STARSTAR – State – State InitiativeInitiativeAdvancing RecoveryAdvancing Recovery
NIATx NIATx 200200
March 21, 2008 NIATx Measures 3
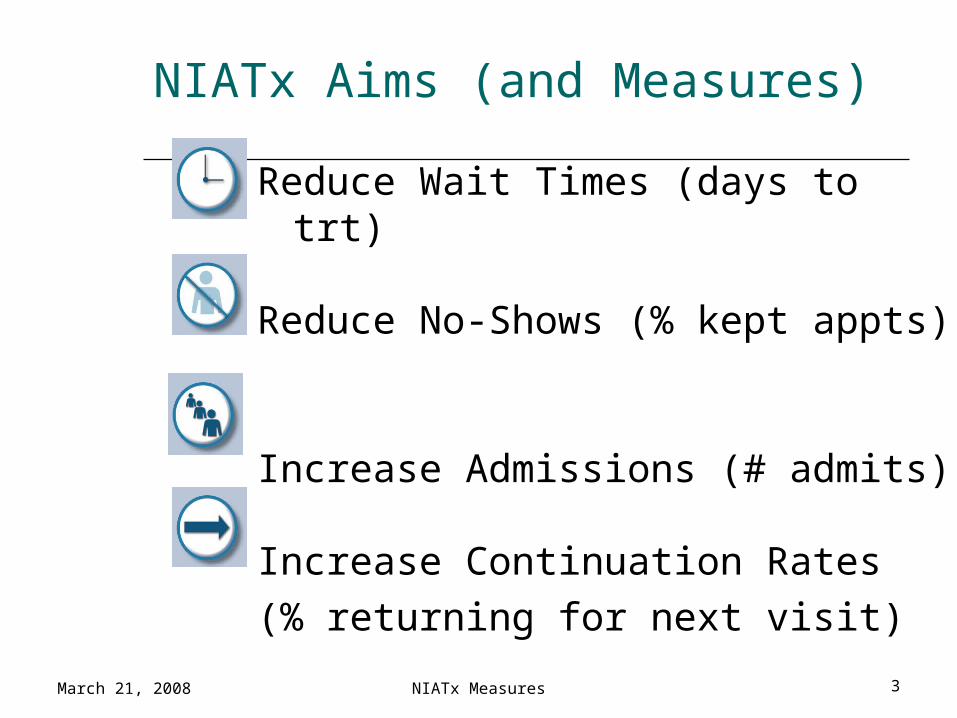
Reduce Wait Times (days to trt)
Reduce No-Shows (% kept appts)
Increase Admissions (# admits)
Increase Continuation Rates (% returning for next visit)
NIATx Aims (and Measures)

March 21, 2008 NIATx Measures 4
Acadia: Admissions and Revenues Increased
192336
516
804
0
200
400
600
800
1000
FY02 FY03 FY04 FY05 (annualizedfrom 5/05)
Persons Served in IOP
-$202,611
-$139,346
$208,639
-$225,000
-$150,000
-$75,000
$0
$75,000
$150,000
$225,000
$300,000
FY02 FY03 FY04
Outpatient Substance Abuse Services Net Profit or Loss

March 21, 2008 NIATx Measures 5
NIATX National Results: Days to NIATX National Results: Days to Treatment Declined 39% Treatment Declined 39% (McCarty et al, 2007)(McCarty et al, 2007)
5
10
15
20
Av
era
ge
da
ys
03Oct 03Dec 04Feb 04Apr 04Jun 04Aug 04Oct 04Dec
Contact to 1st TxAssessment to 1st Txtrend
March 21, 2008 NIATx Measures 6
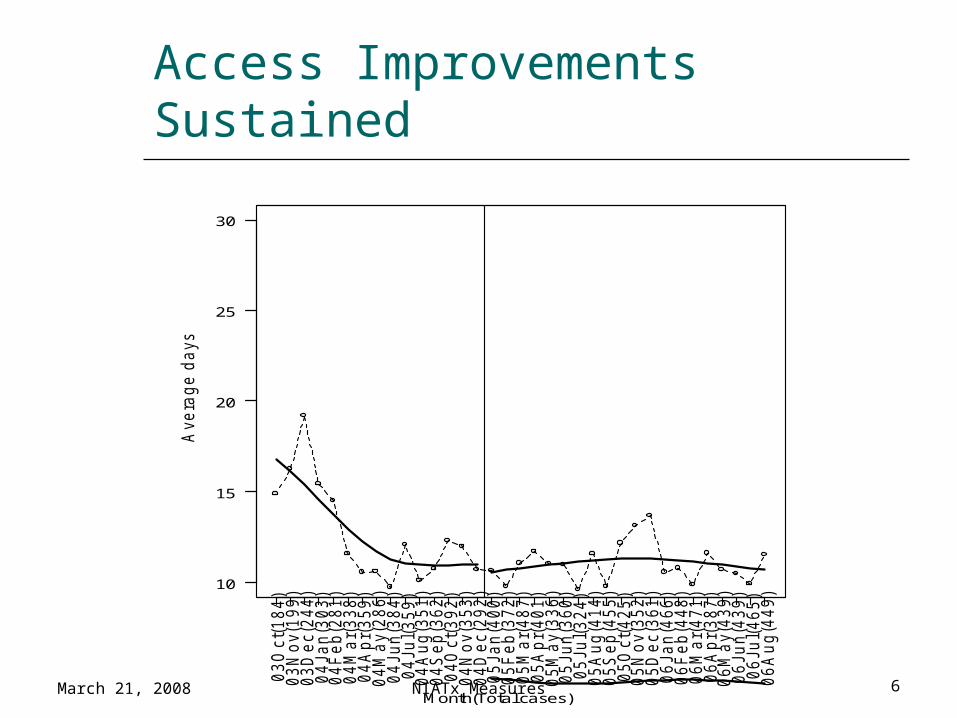
Access Improvements Sustained
10
15
20
25
30
Ave
rag
e d
ays
03
Oct(
18
4)
03
No
v(1
99
)0
3D
ec(2
44
)0
4Ja
n(3
03
)0
4F
eb
(28
1)
04
Ma
r(3
38
)0
4A
pr(
35
9)
04
Ma
y(2
86
)0
4Ju
n(3
84
)0
4Ju
l(3
59
)0
4A
ug
(35
1)
04
Se
p(3
62
)0
4O
ct(
39
2)
04
No
v(3
53
)0
4D
ec(2
92
)0
5Ja
n(4
00
)0
5F
eb
(37
2)
05
Ma
r(4
87
)0
5A
pr(
40
1)
05
Ma
y(3
36
)0
5Ju
n(3
60
)0
5Ju
l(3
24
)0
5A
ug
(41
4)
05
Se
p(4
55
)0
5O
ct(
42
5)
05
No
v(3
52
)0
5D
ec(3
61
)0
6Ja
n(4
66
)0
6F
eb
(44
8)
06
Ma
r(4
71
)0
6A
pr(
38
7)
06
Ma
y(4
39
)0
6Ju
n(4
39
)0
6Ju
l(4
65
)0
6A
ug
(44
9)
Month(Total cases)
March 21, 2008 NIATx Measures 7
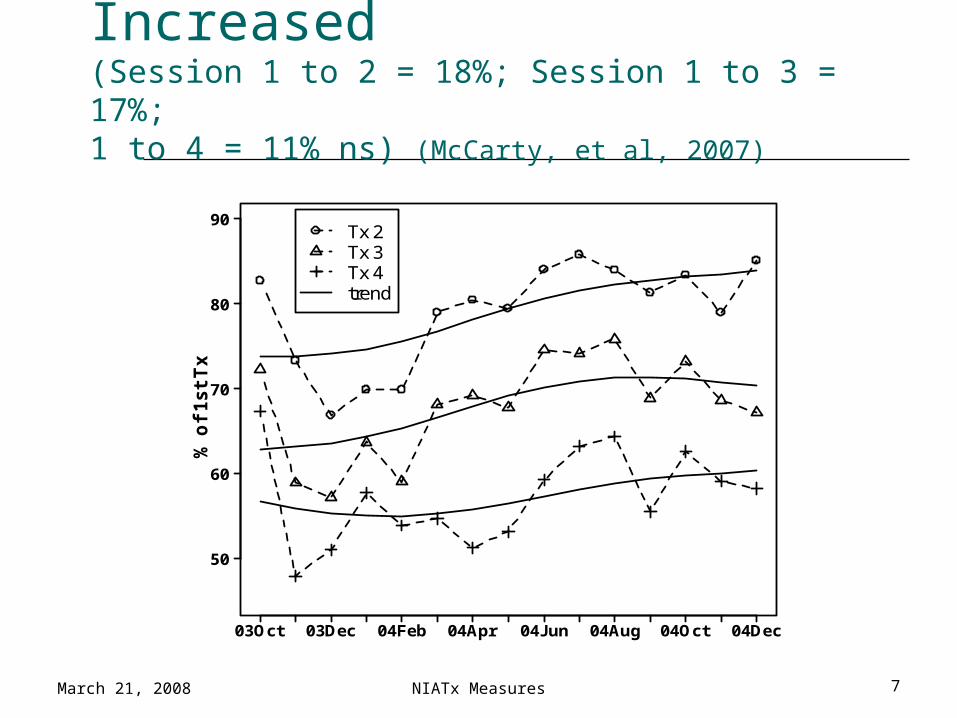
Retention in Care Increased(Session 1 to 2 = 18%; Session 1 to 3 = 17%; 1 to 4 = 11% ns) (McCarty, et al, 2007)
50
60
70
80
90%
of
1s
t T
x
03Oct 03Dec 04Feb 04Apr 04Jun 04Aug 04Oct 04Dec
Tx 2Tx 3Tx 4trend
March 21, 2008 NIATx Measures 8
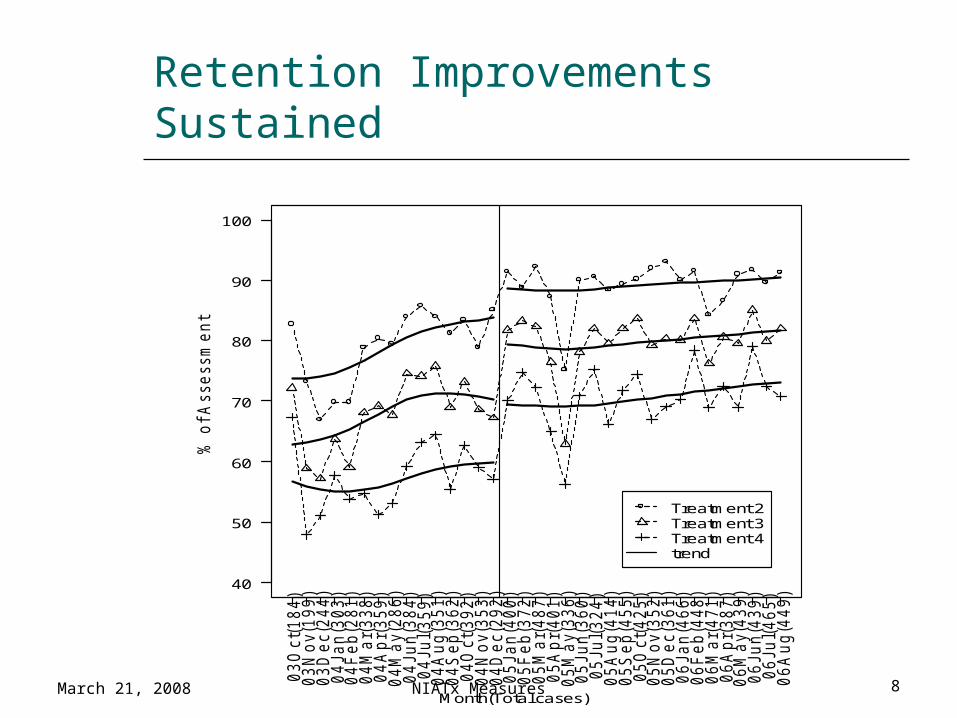
Retention Improvements Sustained
40
50
60
70
80
90
100%
of A
sse
ssm
en
t
03
Oct(
18
4)
03
No
v(1
99
)0
3D
ec(2
44
)0
4Ja
n(3
03
)0
4F
eb
(28
1)
04
Ma
r(3
38
)0
4A
pr(
35
9)
04
Ma
y(2
86
)0
4Ju
n(3
84
)0
4Ju
l(3
59
)0
4A
ug
(35
1)
04
Se
p(3
62
)0
4O
ct(
39
2)
04
No
v(3
53
)0
4D
ec(2
92
)0
5Ja
n(4
00
)0
5F
eb
(37
2)
05
Ma
r(4
87
)0
5A
pr(
40
1)
05
Ma
y(3
36
)0
5Ju
n(3
60
)0
5Ju
l(3
24
)0
5A
ug
(41
4)
05
Se
p(4
55
)0
5O
ct(
42
5)
05
No
v(3
52
)0
5D
ec(3
61
)0
6Ja
n(4
66
)0
6F
eb
(44
8)
06
Ma
r(4
71
)0
6A
pr(
38
7)
06
Ma
y(4
39
)0
6Ju
n(4
39
)0
6Ju
l(4
65
)0
6A
ug
(44
9)
Month(Total cases)
Treatment 2Treatment 3Treatment 4trend
March 21, 2008 NIATx Measures 9
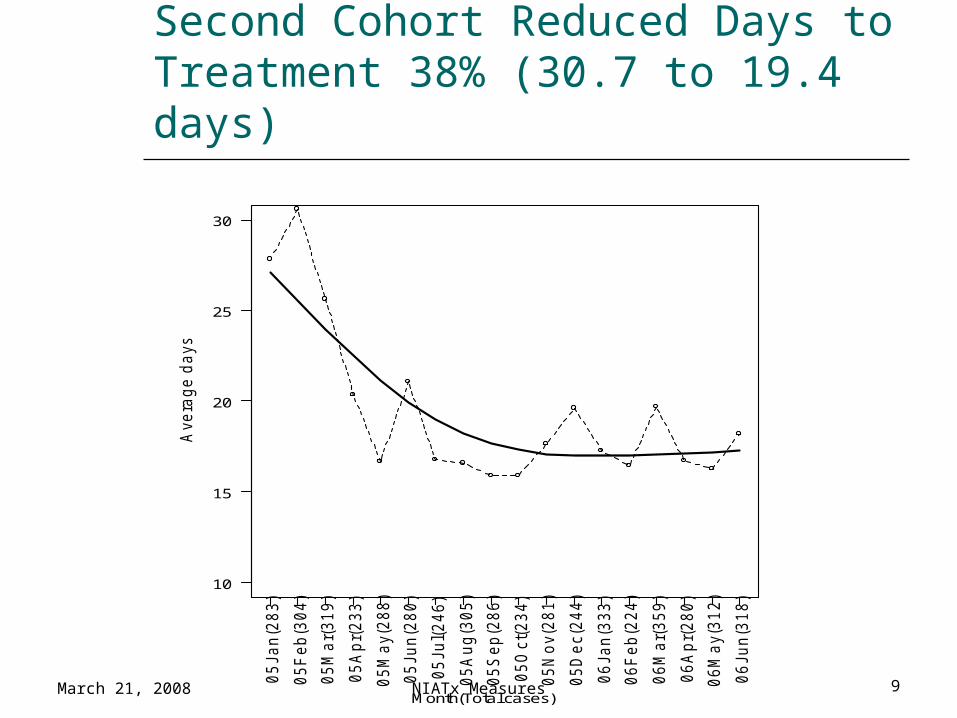
Second Cohort Reduced Days to Treatment 38% (30.7 to 19.4 days)
10
15
20
25
30
Ave
rag
e d
ays
05
Ja
n(2
83
)
05
Fe
b(3
04
)
05
Ma
r(3
19
)
05
Ap
r(2
33
)
05
Ma
y(2
88
)
05
Ju
n(2
80
)
05
Ju
l(2
46
)
05
Au
g(3
05
)
05
Se
p(2
86
)
05
Oct(
23
4)
05
No
v(2
81
)
05
De
c(2
44
)
06
Ja
n(3
33
)
06
Fe
b(2
24
)
06
Ma
r(3
59
)
06
Ap
r(2
80
)
06
Ma
y(3
12
)
06
Ju
n(3
18
)
Month(Total cases)
March 21, 2008 NIATx Measures 10
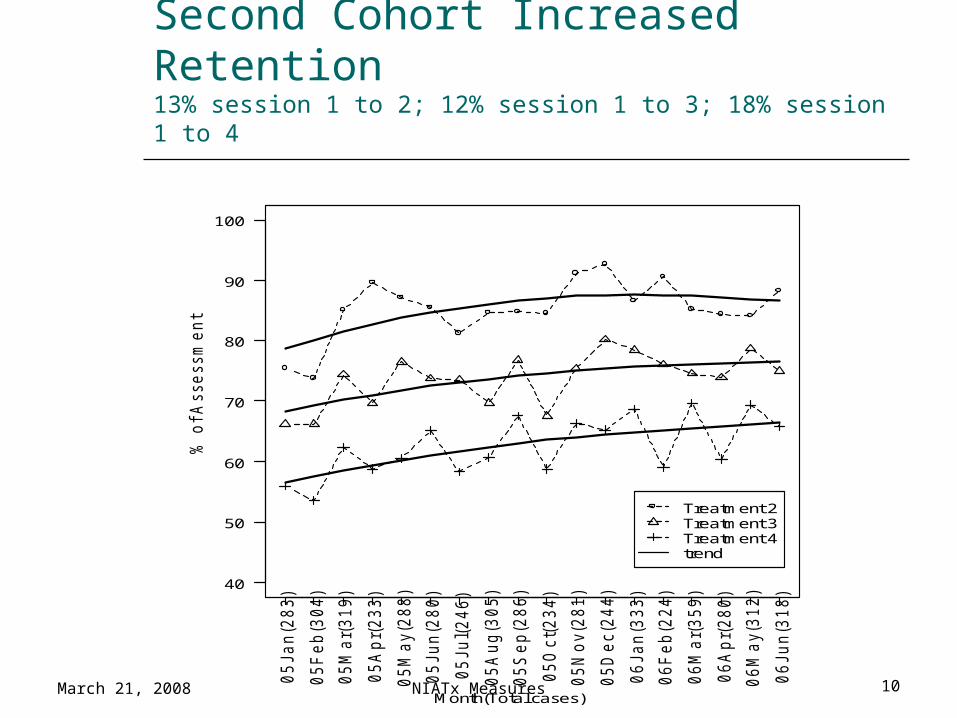
Second Cohort Increased Retention13% session 1 to 2; 12% session 1 to 3; 18% session 1 to 4
40
50
60
70
80
90
100
% o
f A
sse
ssm
en
t
05
Ja
n(2
83
)
05
Fe
b(3
04
)
05
Ma
r(3
19
)
05
Ap
r(2
33
)
05
Ma
y(2
88
)
05
Ju
n(2
80
)
05
Ju
l(2
46
)
05
Au
g(3
05
)
05
Se
p(2
86
)
05
Oct(
23
4)
05
No
v(2
81
)
05
De
c(2
44
)
06
Ja
n(3
33
)
06
Fe
b(2
24
)
06
Ma
r(3
59
)
06
Ap
r(2
80
)
06
Ma
y(3
12
)
06
Ju
n(3
18
)
Month(Total cases)
Treatment 2Treatment 3Treatment 4trend

March 21, 2008 NIATx Measures 11
IOM Reports on Crossing the Quality Chasm

March 21, 2008 NIATx Measures 12
IOM Six Dimensions of Quality
Safe Effectively Patient-Centered Timely Efficient Equitable
March 21, 2008 NIATx Measures 13
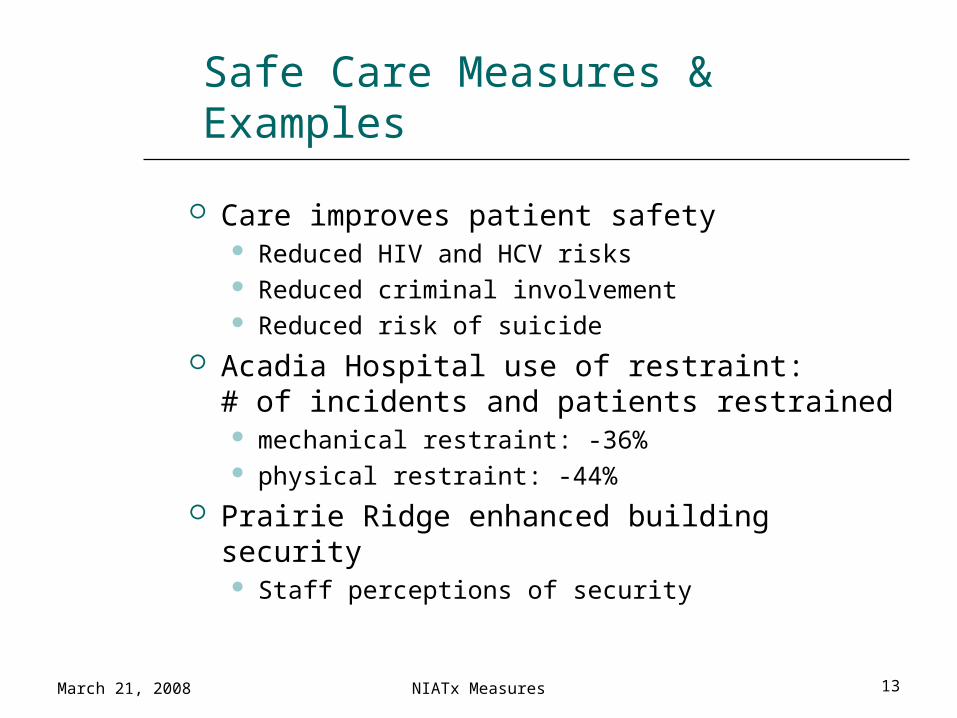
Safe Care Measures & Examples
Care improves patient safety Reduced HIV and HCV risks Reduced criminal involvement Reduced risk of suicide
Acadia Hospital use of restraint: # of incidents and patients restrained mechanical restraint: -36% physical restraint: -44%
Prairie Ridge enhanced building security Staff perceptions of security
March 21, 2008 NIATx Measures 14
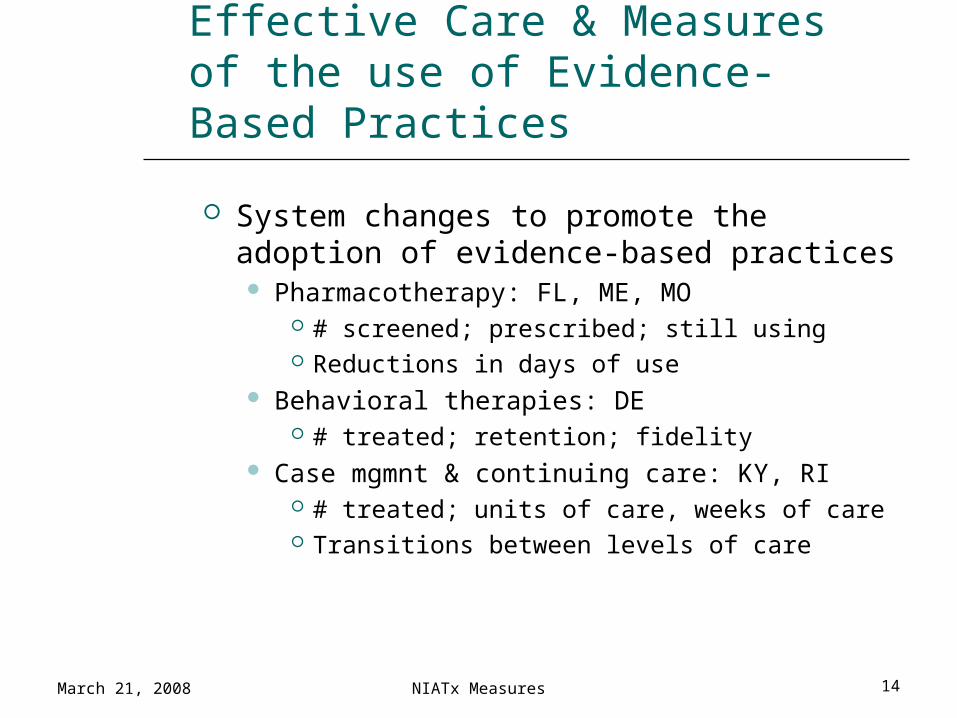
Effective Care & Measures of the use of Evidence-Based Practices
System changes to promote the adoption of evidence-based practices Pharmacotherapy: FL, ME, MO
# screened; prescribed; still using Reductions in days of use
Behavioral therapies: DE # treated; retention; fidelity
Case mgmnt & continuing care: KY, RI # treated; units of care, weeks of care Transitions between levels of care
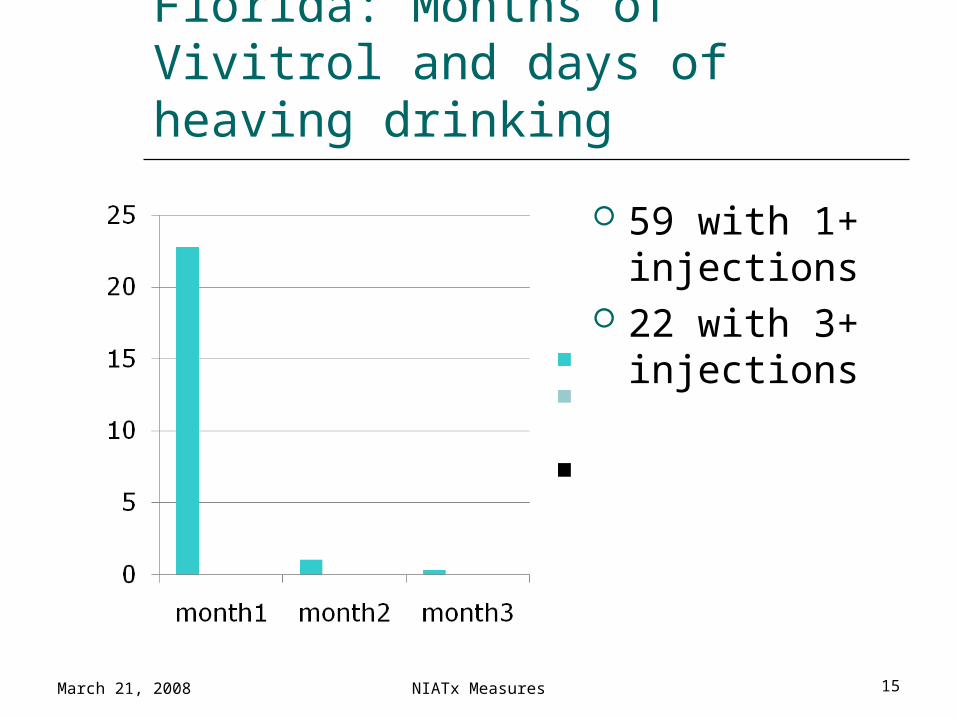
Florida: Months of Vivitrol and days of heaving drinking
59 with 1+ injections
22 with 3+ injections
March 21, 2008 NIATx Measures 15
March 21, 2008 NIATx Measures 16
Patient-Centered Care and Measures
Walkthroughs provide insight into patient barriers Treatment processes often inhibit
effective care Understand and know your
customers Customer satisfaction surveys Focus groups Suggestion boxes
March 21, 2008 NIATx Measures 17
Efficient Care and Measures
Enhanced retention reduces repeat admissions
Reduced no-show rates improve counselor productivity Productivity and efficiency measures
Timely admissions increase reimbursable units of care Billable units and total reimbursements
March 21, 2008 NIATx Measures 18
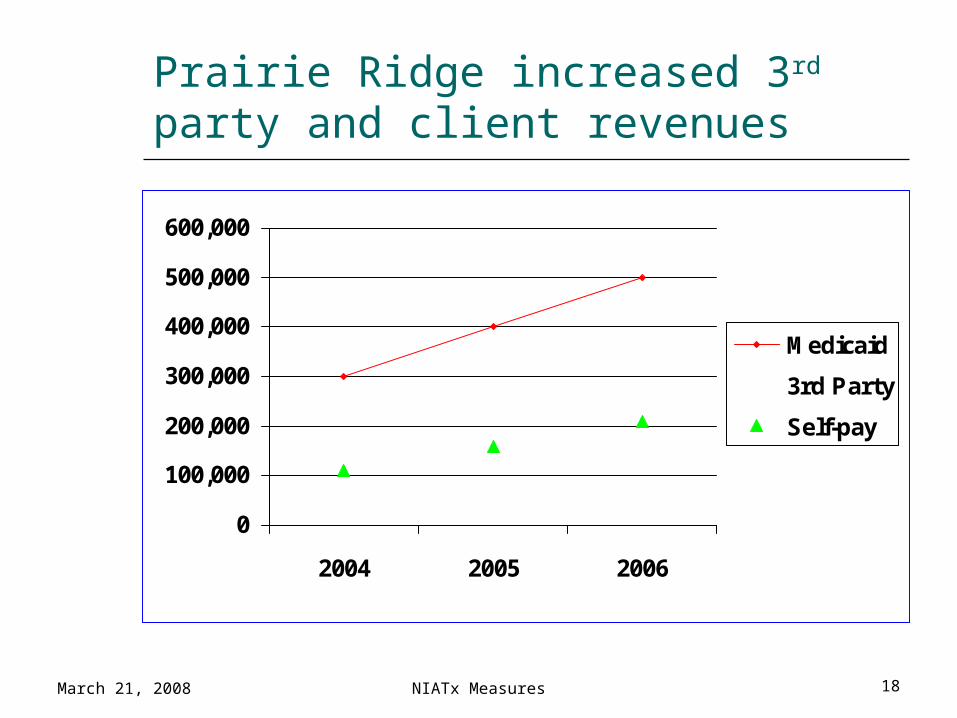
Prairie Ridge increased 3rd party and client revenues
0
100,000
200,000
300,000
400,000
500,000
600,000
2004 2005 2006
Medicaid
3rd Party
Self-pay

March 21, 2008 NIATx Measures 19
Connecticut Renaissance Reduced No Shows
0
10
20
30
40
50
60
Sept Oct Nov Dec Jan Feb
% No Shows
Appt reminders and follow ups
Letter of expectations
17% increase in revenues
Improved client and referral satisfaction
March 21, 2008 NIATx Measures 20
Timely Care and Measures
Delayed care is less effective Retention rates are higher among
patients admitted more quickly Delays reduce rather than improve
motivation for treatment Record date of first contact
Monitor days to admission and first treatment

March 21, 2008 NIATx Measures 21
Terros: % completing 4 sessions of care – faster admits = longer stays
02
04
06
08
01
00
number of days between assessment and first treatment
pe
rce
nt
1 7 14 21 22+
March 21, 2008 NIATx Measures 22
Equitable Care and Measures
Identify and address disparities in access and retention
Improve access to care for under-served groups
Analyze measures for disparities Terros: Younger clients less likely to complete 4
sessions

March 21, 2008 NIATx Measures 23
NIATx Measures: Summary
Simple measures Direct indicators of the process or
problem being addressed Collected automatically or with
minimal burden Monitor easy processes to begin Expand measures with experience Limit the number of key measures

March 21, 2008 NIATx Measures 24
Acknowledgements
Preparation of this presentation was supported through awards from Robert Wood Johnson Foundation: 46876 & 50165 The Center for Substance Abuse Treatment:
SAMHSA SC-05-110 The National Institute on Drug Abuse: R01
DA018282
The Network for the Improvement of Addiction Treatment provided data included in the presentation.

March 21, 2008 NIATx Measures 25
Acknowledgements (continued)
Thanks to NIATx colleagues Victor Capoccia, Elaine Cassidy, Frances Cotter, Jay Ford, David Gustafson, Todd Molfenter, Betta Owens
Special thanks to the NIATx Evaluation Team: Luke Bergmann, Eldon Edmundson, Marie Elwood, Carla Green, Kim Hoffman, Traci Rieckmann, Katie Riley, Marie Shea, and Jennifer Wisdom

March 21, 2008 NIATx Measures 26
Citations
Capoccia, et al. 2007. Making Stone Soup: Improvements in Clinic Access and Retention in Addiction Treatment. Joint Commission Journal on Quality and Patient Safety, 22 (2), 95 – 103.
McCarty, et al. 2007. The Network for the Improvement of Addiction Treatment (NIATx): Enhancing access and retention. Drug and Alcohol Dependence, 88, 138 – 145.