Performance Improvement in a Medical School: Defining Baseline Metrics – Pursuing Benchmark Targets

2
Diane Hills, Ph.D. Associate Dean for Academic Affairs
College of Osteopathic [email protected]
Mary Pat Wohlford-Wessels, Ph.D.
Assistant Dean for Academic Quality and Medicine Education Research College of Osteopathic Medicine [email protected]

3
Improving medical education requires systematic processes that support the review and assessment of the work we do.
The outcome of careful review supports effective strategic planning, resource allocation, resource utilization, faculty development, curricular change, research development and much more.
Introduction
4
This presentation builds upon last year’s AACOM presentation.
Last year DMU introduced its new performance improvement plan and processes. We presented our intent to implement a system of review framed within the Baldrige Quality Criteria.
Since last year, we have adopted the Baldrige criteria, and now collect and format our annual Performance Improvement (PI) report within the criteria.

5
Last year, we introduced session participants to:Our Committee StructureA Gantt Chart of PI activitiesProposed data utilizationHow we classified data sources into
meaningful categories

6
Developed AnnuallyDistributed to College and University Stakeholders2004 - represented initial efforts2005 – formatted using the Baldrige criteria and represented early benchmark development2006 – will focus on clinical education and post graduate perceptions (PGY1 and Residency Directors)
Performance Improvement Report
7
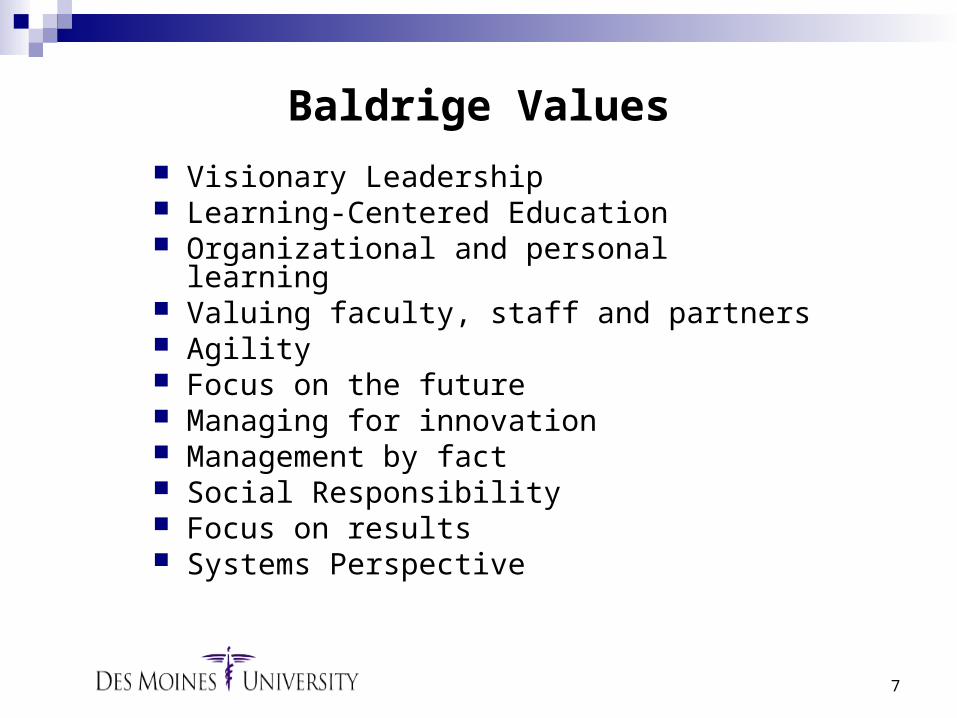
Baldrige Values
Visionary Leadership Learning-Centered Education Organizational and personal learning Valuing faculty, staff and partners Agility Focus on the future Managing for innovation Management by fact Social Responsibility Focus on results Systems Perspective
8
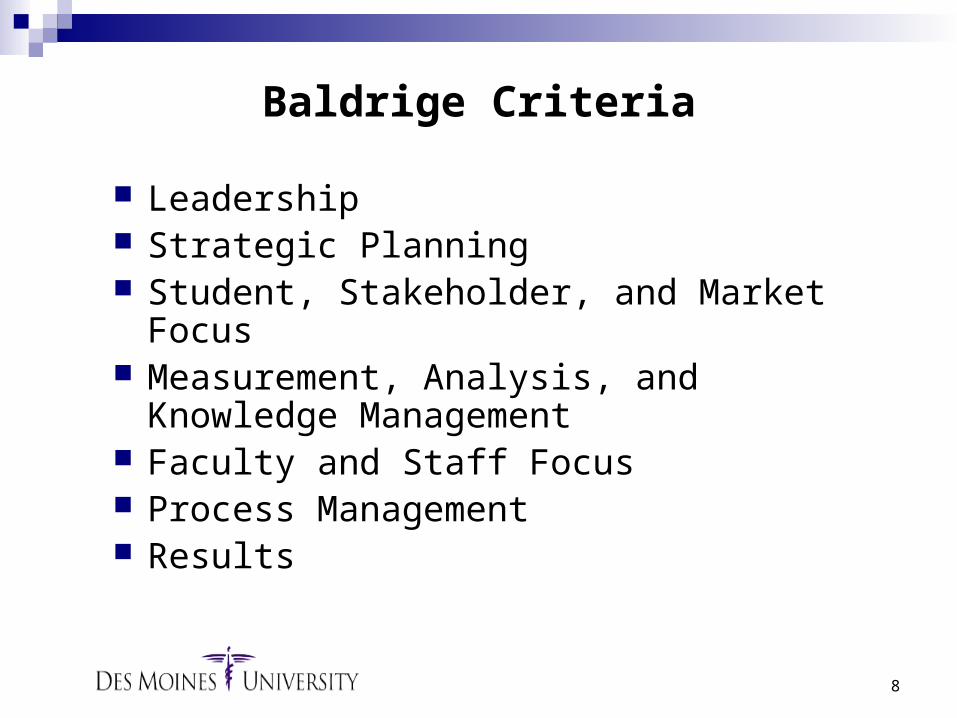
Baldrige Criteria
Leadership Strategic Planning Student, Stakeholder, and Market Focus Measurement, Analysis, and Knowledge
Management Faculty and Staff Focus Process Management Results
9
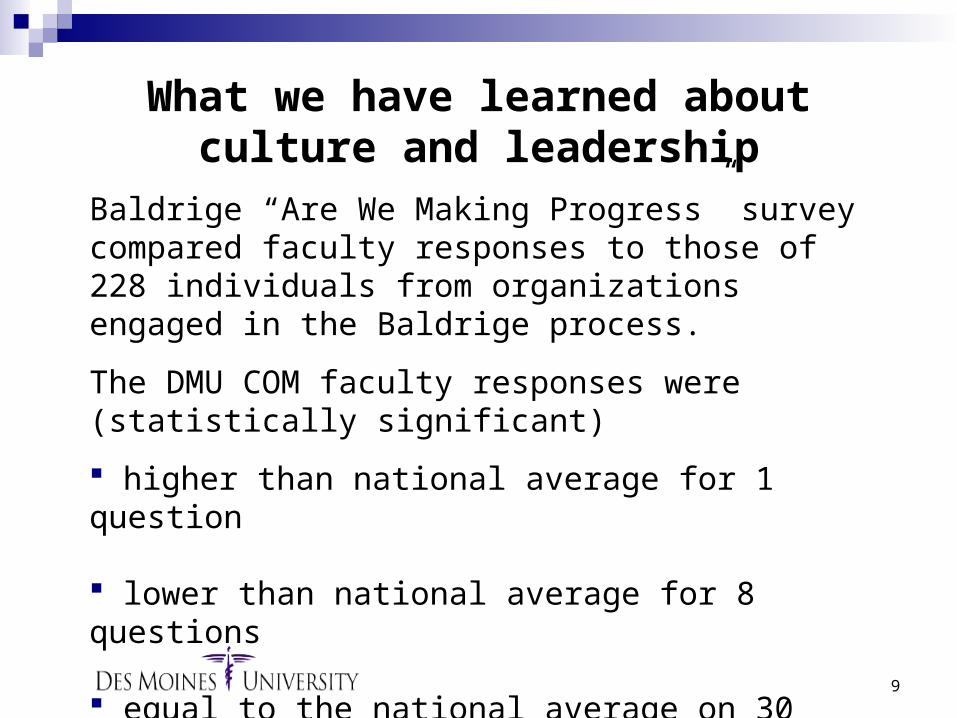
What we have learned about culture and leadership
Baldrige “Are We Making Progress” survey compared faculty responses to those of 228 individuals from organizations engaged in the Baldrige process.
The DMU COM faculty responses were (statistically significant)
higher than national average for 1 question
lower than national average for 8 questions
equal to the national average on 30 questions
10
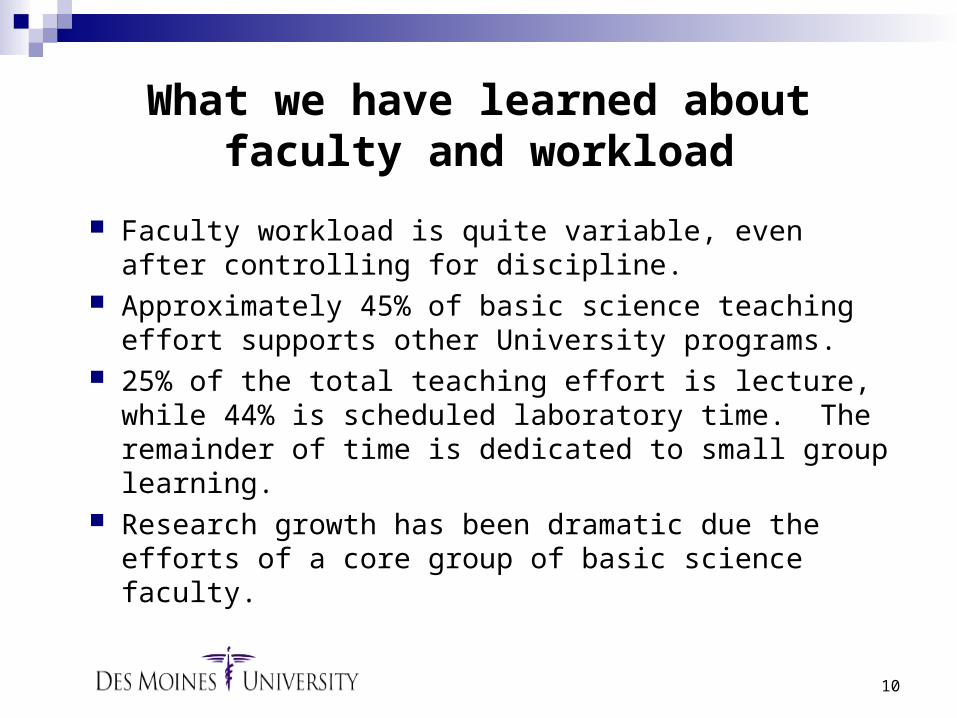
What we have learned about faculty and workload
Faculty workload is quite variable, even after controlling for discipline.
Approximately 45% of basic science teaching effort supports other University programs.
25% of the total teaching effort is lecture, while 44% is scheduled laboratory time. The remainder of time is dedicated to small group learning.
Research growth has been dramatic due the efforts of a core group of basic science faculty.

11
What we have learned about student outcomes and the curriculum
Students perform well on COMLEX 1 in terms of both pass rate and average score.
The pass rate and average score is lower on COMLEX 2 CE and lower still on COMLEX 3.
The curriculum for years 1 & 2 is well managed and faculty are responsive to needed improvement. Years 3 & 4 have received less review. New staff along with an enhanced focus will result in significant changes in the clinical portion of the curriculum.

12
What we have learned about OMM
A survey of 3rd year and graduating 4th year (n=192) students regarding their OMM training revealed: 83.2% are confident in their OMM training. 84% said only a small percentage (0-25%) of their DO
preceptors used OMM in their practice. 67.5% said that they rarely or never had an opportunity to use
OMM during the clinical portion of their training.
What does this mean for our curriculum? What should this mean for the profession?
13
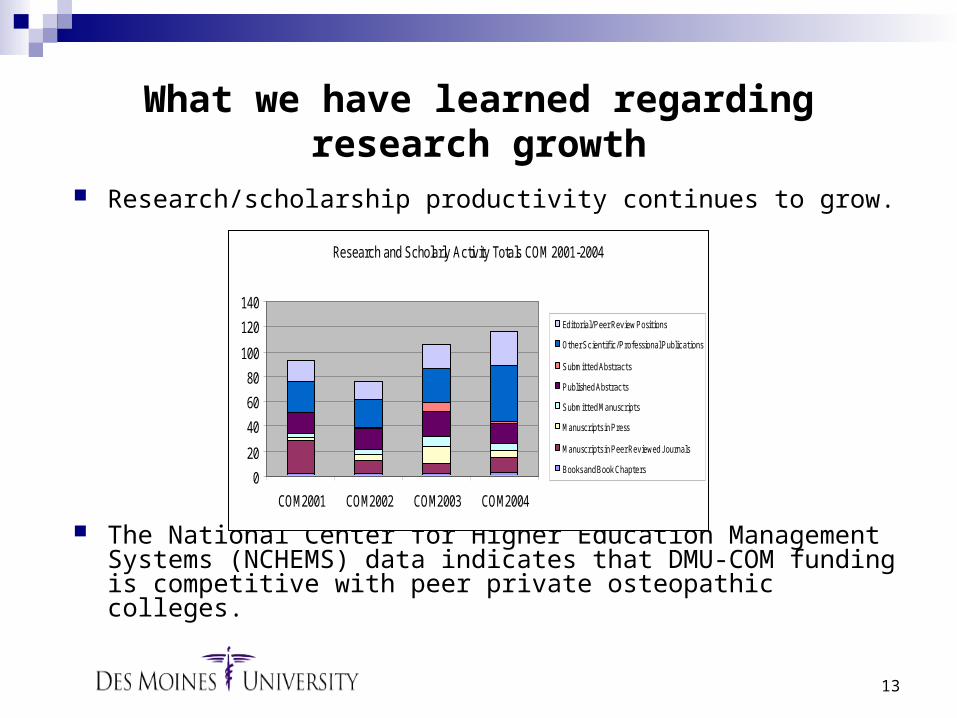
What we have learned regarding research growth
Research/scholarship productivity continues to grow.
The National Center for Higher Education Management Systems (NCHEMS) data indicates that DMU-COM funding is competitive with peer private osteopathic colleges.
Research and Scholarly Activity Totals COM 2001-2004
0
20
40
60
80
100
120
140
COM2001 COM2002 COM2003 COM2004
Editorial/Peer Review Positions
Other Scientific/Professional Publications
Submitted Abstracts
Published Abstracts
Submitted Manuscripts
Manuscripts in Press
Manuscripts in Peer Reviewed J ournals
Books and Book Chapters
14
The College Mission statement needed to be revised.
The Vision statement needed to be revised.
Values statements needed to be written.
What we have learned about our mission and vision

15
DMU-COM Data (03-04)
AAMC – Allopathic Medical School Data (04-05)
NBOME (03-04)
Residency Directors (05-06)
AACOM – Osteopathic Medical School Data (03-04)
NCHEMS (03-04)
Data Development and Growth

16
Where does DMU rank? DMU tracks public information on the following schools:
Arizona College of Osteopathic College of Osteopathic Medicine of the Pacific Touro University College of Osteopathic Nova Southeastern Chicago College of Osteopathic Medicine Des Moines University Pikeville College School of Osteopathic Medicine University of New England Michigan State University College of Osteopathic Medicine Kirksville College of Osteopathic Medicine UNDNJ School of Osteopathic Medicine New York College of Osteopathic Medicine Ohio University College of Osteopathic Medicine Oklahoma State University College of Osteopathic Medicine Philadelphia College of Osteopathic Medicine University of North Texas Health Sciences Center West Virginia School of Osteopathic Medicine

17
Where does DMU rank? Descriptive Statistics for COM Peer group (2002) Data Element Number
of schools reporting
Minimum Maximum Peer Group Mean
DMU DMU Position Relative to Peers
DMU Rank
In state tuition 17 7,802.00 30,433.00 23,115.11 25,475 Higher 9th out of 17
Out of state tuition 17 20,902.00 40,550.00 28,527.52 25,475 Lower
Room/board/ expenses
14 5,067.00 13,190.00 9,916.14 12,112 Higher 3rd out of 14
% students receiving grants 17 2% 81% 34% 23% Lower 9th out of 17
Average student indebtedness 17 81,303.00 153,966.00 122,666. 142,997 Higher 4th out of 17
Enrollment total 17 109 1135 561 802 Higher 3rd out of 17
% men 17 39% 71% 55% 56% Equal 6th out of 17
% women 17 29% 61% 44% 44% Equal 10th out of 17
% minority 17 6% 48% 24% 10% Lower 7th out of 17
% underrepresented minority 16 1% 22% 8% 6%
Lower 8th out of 16
Acceptance rate 17 6% 34% 17% 26% Higher 8th out of 17

18
Where does DMU rank?Characteristic of First Two Years of Medical Education
DMU Satisfied 01-02
All Seniors 01-02
DMU Satisfied 02-03
All Seniors 02-03
+/- DMU Satisfied 03-04
All Seniors 03-04
+/- DMU Position
Basic and Clinical Science Course Objectives were Made Clear to Students
82% 81% 88% 81% +7 86% 88% -2
Higher
Basic Science Courses Were Sufficiently Integrated
74% 73% 79% 74% +3 100% 83% +17 Higher
Course Objectives and Examination Content Matched Closely
75% 72% 80% 71% +9 88% 82% +6 Higher
Course Work Adequately Prepared Students for Clerkships
67% 70% 77% 70% +7 92% 82% +10
Higher
The First Two Years of Medical School were Well Organized
69% 70% 76% 65% +11 82% 75% +7 Higher
Students were Provided with Timely Feedback on Performance
69% 71% 77% 70% +7 74% 83% -9
Equal
There was Adequate Exposure to Patient Care During the First Two Years
48% 49% 47% 50% -3 90% 66% +24
Higher
There was Adequate Preparation for COMLEX Level I
79% 64% 79% 63% -16 48% 72% -24 Lower
19
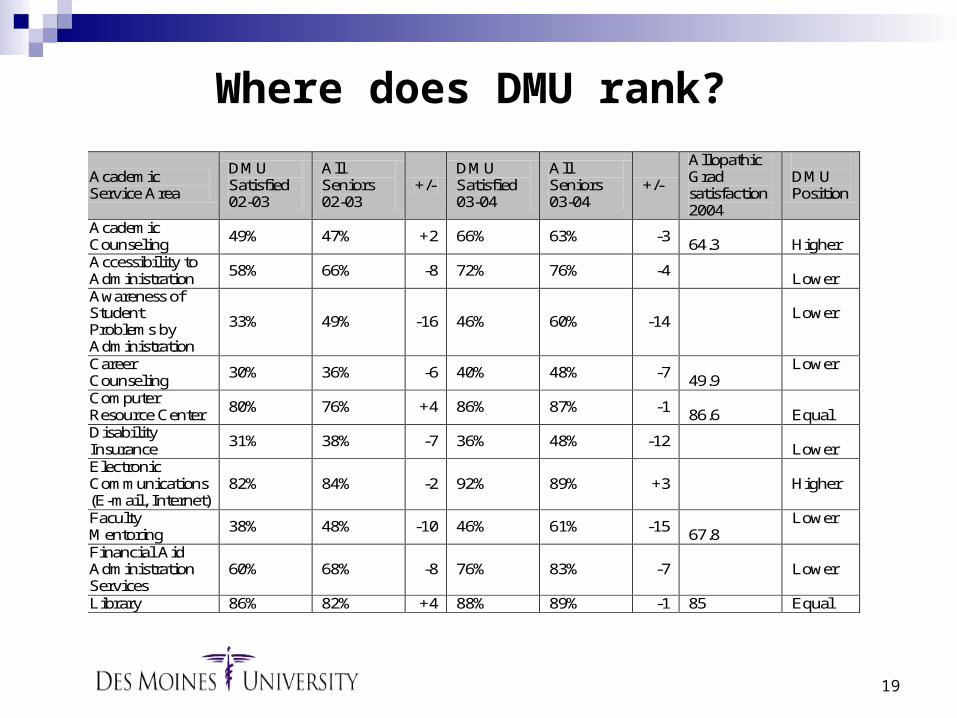
Where does DMU rank?
Academic Service Area
DMU Satisfied 02-03
All Seniors 02-03
+/- DMU Satisfied 03-04
All Seniors 03-04
+/-
Allopathic Grad satisfaction 2004
DMU Position
Academic Counseling
49% 47% +2 66% 63% -3 64.3
Higher
Accessibility to Administration
58% 66% -8 72% 76% -4
Lower Awareness of Student Problems by Administration
33% 49% -16 46% 60% -14
Lower
Career Counseling
30% 36% -6 40% 48% -7 49.9
Lower
Computer Resource Center
80% 76% +4 86% 87% -1 86.6
Equal
Disability Insurance
31% 38% -7 36% 48% -12
Lower Electronic Communications (E-mail, Internet)
82% 84% -2 92% 89% +3
Higher
Faculty Mentoring
38% 48% -10 46% 61% -15 67.8
Lower
Financial Aid Administration Services
60% 68% -8 76% 83% -7
Lower
Library 86% 82% +4 88% 89% -1 85 Equal

20
Begin to develop correlations between clinical experiences and student clinical outcomes.
Further collect and analyze graduate feedback (performance perceptions from graduates and residency directors)
Begin to develop assessment research methods to determine the effectiveness of utilizing patient simulators.
Next Steps
21
Continue to refine the Faculty Adequacy (Workload) Model
Use existing information about research productivity to develop research related targets
Investigate the use of faculty e-portfolios Investigate the use of student e-portfolios Continue to develop the Lecture Level
Database (LLDB) to better manage the assessment of objectives and competencies
Next Steps
22
Summary
The process adopted several years ago and perfected over the past two year has resulted in the college knowing more about outcomes and operations.
We have become more sophisticated in our collection and use of data.
We are using data more and more to make decisions.