PO Box 1390, Skulagata 4
120 Reykjavik, Iceland Final Project, March 2009
PROFITABILITY ANALYSIS OF ABALONE FARMING IN PORT
NOLLOTH, IN THE NORTHERN CAPE PROVINCE, SOUTH
AFRICA.
Adeleen Cloete
01 December 2009
Supervisors:
Pall Jensson, Professor
Faculty of Engineering
University of Iceland
Agnar Steinarsson
Marine Research Institute, Iceland
ABSTRACT The abalone industry in South Africa is known as one of the largest in the world. The country produced 1000
tons in 2008 (DEAT, 2008). Most of the abalone farms are located in the Western Cape Province due to the
suitable environmental conditions and established infrastructure. The growth of abalone aquaculture is expected
to continue. However, access to suitable coastal land and the dependence on wild harvest of seaweed may
restrict further development around main nodes of abalone farming. The government has proposed the
development of the Namaqualand Mariculture Park (NMP) in the Northern Cape province of South Africa. The
NMP concept involves the development of complementary marine aquaculture activities sharing common
infrastructure, where access to coastal land and good quality seawater is guaranteed. The running costs of the
Mariculture Park will be met by charging the tenant aquaculture operations a monthly rent. The NMP could
support a diverse number of mariculture operations but for the short term only an abalone land-based grow-out
farm would be established. The current project evaluated the feasibility of abalone farming as the first
aquaculture venture to be established in the NMP. In order to do this, a 120 ton production model was developed
and the results used as input for the profitability model. The results from the production model estimated that
70.000 spat needs to be purchased monthly to sustain the 120 tonne annual production of the farm. The main
result from the profitability model, the Net Present Value (NPV) for the two cash flow series was negative R 37
million and negative R 30 million, respectively. The Internal Rate of Return was less than the Marginal
Attractive Rate assumed for the current project, indicating that abalone farming with the current assumptions is
not a profitable venture. Sensitivity analysis indicated that the abalone farm is most sensitive to variations in the
sales price and the quantity of abalone sold. This is important as revenue earned must cover the cost incurred by
production. Relating this to the assumptions used for the current project, dried abalone requires larger animals
than those usually grown on the majority of abalone farms producing live animals. Abalone farming is capital
intensive and the longer production period for the current study leads to even higher production costs. High
production costs have been cited as one of the main reasons for the poor economic performance of abalone
aquaculture. The models can now be used to explore alternative production strategies taking into account
variables that have a noticeable effect on profitability of abalone farming.

Cloete
2 UNU-Fisheries Training Proramme
TABLE OF CONTENTS
1 Introduction .................................................................................................................................. 4
1.1 Objectives ................................................................................................................................... 4
2 Aquaculture in South Africa ....................................................................................................... 5
2.1 Challenges for marine aquaculture development in South Africa ............................................. 6
2.2 The Namaqualand Mariculture Park Concept, Northern Cape Province ................................. 6
2.3 Challenges related to Mariculture Park .................................................................................... 8
3 Abalone Farming .......................................................................................................................... 9
3.1 The South African abalone, Haliotis midae: description and distribution ................................ 9
3.2 Abalone physiology and water quality ....................................................................................... 9
3.3 Abalone aquaculture ................................................................................................................ 10
3.4 The abalone market.................................................................................................................. 11
4 Methodology ............................................................................................................................... 12
4.1 The Concept of Modelling ........................................................................................................ 12
4.2 Data collection for the abalone production model .................................................................. 12
4.3 Data Collection for the profitability model.............................................................................. 13
4.4 Abalone Farming Assumptions ................................................................................................ 13
4.5 Profitability analysis techniques .............................................................................................. 14
4.5.1 Investment and financing ................................................................................................ 14
4.5.2 Cash Flow........................................................................................................................ 15
4.5.3 Profitability measures ...................................................................................................... 15
4.5.4 Sensitivity Analysis (Analysis of key variables affecting Profitability) ......................... 16
5 Business Model for abalone farming ........................................................................................ 17
5.1 Abalone (H. midae) Production model .................................................................................... 17
5.2 Cash Flow Analysis Results ..................................................................................................... 18
5.2.1 Total Cash Flow and Capital ........................................................................................... 18
5.2.2 Equity and net cash flow ................................................................................................. 18
5.3 Sensitivity Analysis................................................................................................................... 20
6 Discussion .................................................................................................................................... 22
7 Conclusion ................................................................................................................................... 24
8 Recommendation/Future Research .......................................................................................... 24
8.1 Infrastructure adaptation for the short term ............................................................................ 25
List of References ................................................................................................................................ 26

Cloete
3 UNU-Fisheries Training Proramme
LIST OF FIGURES
Figure 1: South African marine aquiculture production by species in 2008 (DEAT, 2008). ... 5 Figure 2: Map of South Africa, indicating the Northern Cape Province ................................... 7
Figure 3: Concept of the Namaqualand Mariculture Park (adapted from Oellermann (2005)). 8 Figure 4: South African abalone, Haliotis midae (Oellermann 2005). ...................................... 9 Figure 5: South African abalone production (DEAT 2008). ................................................... 10 Figure 6: Cash flow from teh 120 tonne land based grow-out abalone farm simulated over the
planning period of 15 years...................................................................................................... 18
Figure 7: NPV of cash flow over the 15 year planning period. ............................................... 19 Figure 8: IRR of the abalone farm model. ............................................................................... 19 Figure 9: Sensitivity analysis of sales price, eqipment, sales volume, and fixed and variable
operational costs....................................................................................................................... 20 Figure 10: Proposed production strategy for hte NMP in the short term................................. 25
LIST OF TABLES
Table 1: Infrastructure provided by NMP. ............................................................................... 14 Table 2: Assumptions for abalone production model .............................................................. 17
Table 3: Production costs derived from the abalone production model .................................. 17 Table 4: Sensitivity analysis of sales price, equipment, sales volume, and fixed and variable
operational costs....................................................................................................................... 21

Cloete
4 UNU-Fisheries Training Proramme
1 INTRODUCTION
The abalone industry in South Africa is known as one of the largest in the world. The country
produced 1000 tonnes in 2008 (DEAT, 2008). Most of the abalone farms are located in the
Western Cape Province due to the suitable environmental conditions and established
infrastructure (DEAT, 2008; Hinrichson, 2007). The growth of abalone aquaculture is
expected to continue. However, access to suitable coastal land and the dependence on wild
harvest of seaweed/kelp may restrict further development around main nodes of abalone
farming (Troell et al., 2006).
The Northern Cape Province has potential for marine aquaculture. Nevertheless, the industry
is still poorly developed and only two species (abalone and oysters) were cultured in the
province during the year 2008. The establishment of Marine Aquaculture Development Zones
has been promoted by government in order to support and stimulate growth in the marine
aquaculture sector. This lead to the concept of the Namaqualand Mariculture Park (NMP) in
the Northern Cape province of South Africa. The NMP concept involves the development of
complementary marine aquaculture activities sharing common infrastructure, where access to
coastal land and good quality seawater is guaranteed. The NMP will offer mariculture
businesses a prepared site within the complex to develop for their operational needs
(Oellermann, 2005). The running costs of the Mariculture Park will be met by charging the
tenant aquaculture operations a monthly rent, a tariff per unit volume of seawater used by the
operations, as well as ad hoc fees for services (Oellermann, 2005). This will result in lower
individual operational costs by using shared resources.
The NMP could support a diverse number of mariculture operations especially the culture of
species that prefer temperate waters (Oellermann, 2005). Businesses proposed to operate out
of the Park include an abalone hatchery, abalone land based farming, abalone ranching (at sea
culture), oyster long-lining and a fin-fish (turbot) on-growing farm.
All these operations would not be established simultaneously, and for the short term an
abalone land- based grow-out farm would be established in the NMP. Local environmental
conditions are favourable for abalone farming, and it is estimated that the kelp bed habitat
could support 1000 tonnes of abalone production per year (DEAT, 2006; De Waal et al.,
2003).
1.1 Objectives
Develop a production model in Excel, for abalone land based grow-out farming in
Port Nolloth, Northern Cape Province of South Africa
Develop a profitablity model based on the assumption that an abalone grow-out
operation of 120 tonnes (economy of scale) is going to be established
Use profitability measures such as Net Present Value (NPV) and Internal Rate of
Return (IRR) to determine profitability over a planning period of 15 years
Carry out Risk Assessment on uncertainty factors
This study will proceed by giving background information on aquaculture in South Africa,
highlighting the importance of marine aquaculture, specifically abalone aquaculture.
Challenges relating to expansion of the marine aquaculture industry are discussed as well as
strategies from the government to mitigate these challenges. Governmental strategies
important for the current study include the development of Marine Aquaculture Development
Zones (MADZ). The NMP, as one of the MADZ, in the Northern Cape province of South
Africa is reviewed and the way forward discussed. Abalone land-based grow-out farming as

Cloete
5 UNU-Fisheries Training Proramme
the first venture to be established in the NMP for the short term is discussed. Abalone
aquaculture, biology and the market are discussed. The methodology of the current study is
related to profitability assessment techniques and simulation by using models. Production
cost inputs are determined by using a biological production model. Main results from the
profitability assessment are discussed, and recommendations are made.
2 AQUACULTURE IN SOUTH AFRICA
The total aquaculture production in South Africa in 2008 was approximately 3.000 tonnes
(DEAT, 2008). Aquaculture in South Africa can be divided into freshwater and marine
aquaculture, contributing 40% and 60% to total aquaculture production respectively.
Freshwater aquaculture species include trout, tilapia, African catfish, common carp, mullet,
largemouth bass, marron crayfish, Koi Carp and aquarium species. However, freshwater fish
culture is severely limited by the supply of suitable water (Hinrichson, 2007).
The total value of the marine aquaculture industry in 2008 was estimated to be R 300 million
rand (44 million U$ dollars) (DEAT, 2008). Commercial marine aquaculture in South Africa
began in the 1980s with the establishment of oyster, mussel and prawn farming (DEAT,
2006). Current marine aquaculture species include abalone (integrated with seaweed culture),
oyster, mussel, finfish, prawn and ornamental fish (Figure 1) (DEAT, 2008).
In terms of volume and value of production, abalone represents the largest sub-sector,
contributing 94% to the total value of marine aquaculture in South Africa. Marine
aquaculture is based on intensive production technologies with high input costs; therefore this
sector will focus on the production of high-value products (DEAT, 2006). Despite the
currently small size of the South African marine aquaculture sector, the industry is well
served by the country’s established infrastructure and aquaculture support services (DEAT,
2006).
South Africa's Marine Aquaculture Production (2008)
0
200
400
600
800
1.000
1.200
Abalone Mussel Oyster Prawn Finfish
Species cultured
Pro
du
cti
on
(to
ns)
Figure 1: South African marine aquiculture production by species in 2008 (DEAT,
2008).

Cloete
6 UNU-Fisheries Training Proramme
South Africa has well established fisheries. However, high value species fisheries such as
abalone and prawns are over-exploited (DEAT, 2006). So although there are opportunities for
aquaculture development, challenges cannot be excluded.
2.1 Challenges for marine aquaculture development in South Africa
The nature of the South African coastline limits opportunities for sea-based aquaculture to a
small number of sheltered bays and estuaries. Hence, the majority of aquaculture operations
are based on land (DEAT, 2006; 2007). Land-based, pump ashore operations have been
successfully developed for abalone and seaweed farming. Although South Africa possesses
favourable environmental conditions for aquaculture, coastal land is highly sought after and
aquaculture operations have to compete with other industries including tourism and real
estate (DEAT, 2006; 2007). High entry costs, an unsupportive regulatory environment and
limited human resource, also pose problems. The combination of these factors has lead to the
perception that marine aquaculture is a high-risk business (DEAT, 2006). The governmental
policy on marine aquaculture aims to increase production in South Africa by implementing
strategies to tackle some of these challenges. (DEAT, 2007). It was therefore proposed that
government secure suitable sites for aquaculture in regions with a high potential for such an
industry (DEAT, 2006).
2.2 The Namaqualand Mariculture Park Concept, Northern Cape Province
The Northern Cape province (Figure 2) is situated in northwest South Africa. It is the largest
and most sparsely populated of the provinces. The climate is arid to semi arid. The primary
land use within the province is stock and game farming and the coastal environment is unique
in that mining, particularly diamond mining, is virtually the sole economic activity (DEAT,
2006). Few employment alternatives exist for the labour force (DEAT, 2006; Oellermann,
2005).
Port Nolloth, the proposed site of the NMP is situated along the West Coast of this province.
The west coast of South Africa is affected by the cold water of the Benguela current
(Oellermann, 2005). Most of the coast near Port Nolloth has a water temperature range of 13
to 17 °C (Oellermann, 2005). Variations of inshore temperatures in the Benguela region are
relatively small; a 10-year mean shows a difference of 2°C during the coldest months and 4
°C during the warmest months (De Waal et al., 2003).

Cloete
7 UNU-Fisheries Training Proramme
Figure 2: Map of South Africa, indicating the Northern Cape Province
Although mariculture has been identified by many sources as potentially highly beneficial to
the Northern Cape Province’s economy, it is a relatively undeveloped industry sector in
South Africa. However, by developing a Mariculture Park in the Northern Cape, many of the
problems associated with setting up a mariculture business will be mitigated. In order to
create this enabling environment, the NMP will consist of basic infrastructure including
seawater pumps and reticulation, seawater storage ponds, a wetland for effluent water
treatment, an office and laboratory complex, paved access roads, site related services (power,
municipal water and refuse) and security (Figure 3) (Oellermann, 2005).
Port Nolloth

Cloete
8 UNU-Fisheries Training Proramme
Figure 3: Concept of the Namaqualand Mariculture Park (adapted from Oellermann (2005).
Water will be pumped from the sea and flow into the (two-hectare) storage ponds, while the
rest will flow directly to the mariculture operations, via a large reservoir (Oellermann, 2005).
The two ha ponds will be used as solar heating ponds, as well as oyster culture ponds. The
storage ponds serve as operational security for the NMP in case of complete pump failure
(Oellermann, 2005).
At the concept stage of a project the complexities of the interactions cannot be fully predicted
as is the case between tenant operations and the NMP Operating Company.
2.3 Challenges related to Mariculture Park
Port Nolloth (Figure 2) in the Northern Cape Province, is a logistically remote region in
regards to distance from airports, and other aquaculture services including processing
facilities.
Abalone grow-out farm
Seawater Storage
ponds
Other mariculture
operations
Effluent (Algae) water
treatment Ponds
NMP office
complex

Cloete
9 UNU-Fisheries Training Proramme
3 ABALONE FARMING
3.1 The South African abalone, Haliotis midae: description and distribution
The abalone is a marine gastropod mollusc of the genus Haliotis, which inhabits rocky
substrates in shallow waters along the coast (Figure 4) (Oellermann, 2005).
Figure 4: South African abalone, Haliotis midae (Oellermann 2005).
They can be found from the low tide mark to a depth of about 30 m. Their maximum
population density occurs at 10 metres where the seaweed on which they live grows
abundantly (Troell et al., 2006). Although six abalone species are found in South Africa, only
H. midae (perlemoen) is farmed commercially (Oellermann 2005). H. midae is distributed
along much of the South African coast, ranging from the cold waters of the Benguela
upwelling system in the west, to the warmer east coast which is influenced by the south
flowing Agulhas current (Oellermann 2005; Britz et al., 1997). Mean monthly sea
temperatures range from a minimum of 12–13° C in the west, to a maximum of 21° C in the
east (Britz et al., 1997). Abalone no longer naturally occur off the Northern Cape Coast,
although the fossil record shows the presence of abalone in the region some 30 000 years ago
(Oellermann 2005).
3.2 Abalone physiology and water quality
Maximisation of growth is an important factor for successful commercial aquaculture. A
variety of factors such as food quality, stocking density, and water quality are known to
influence the growth of abalone. Environmental temperature directly determines rates of
gonad development, larval development, feed consumption, ammonia excretion, oxygen
consumption, growth rate, and survival. Studies have shown that between 12 and 20° C
growth rate and food consumption increases and the food conversion ratio did not differ
significantly (Britz et al., 1997). Food consumption in most cultured poikilotherms, including
abalone, is primarily determined by temperature and body size (Britz et al., 1997). Between
20 and 24° C, growth and food consumption decline sharply, and FCR deteriorated. In
aquaculture where food is not limiting, temperature will be the primary environmental factor
determining growth rate (Britz et al., 1997). Also, ammonia excretion and oxygen
consumption rates in H. midae increased significantly above 20° C. The condition factor of
abalone decreased with increasing temperature. So it is fair to say that temperatures between
12 and 20° C are physiologically optimal for H. midae (Britz et al., 1997).
Abalone in the larger size-class are competitively superior, therefore, regular grading is
needed to prevent grazing competition.

Cloete
10 UNU-Fisheries Training Proramme
3.3 Abalone aquaculture
Abalone is one of the most prized seafood delicacies worldwide. Farming of abalone began in
the late 1950s and early 1960s in Japan and China (Abalone Consultants 2010). Triggered by
a decline in yields from wild fisheries, a rapid development of abalone cultivation took place
in the 1990s, and cultivation is now widespread in many countries including USA, Mexico,
South Africa, Chile, Australia, New Zealand, Japan, Korea, China and Taiwan (Brown et al.,
2008; 2009; Oellerman 2005).
Over-exploitation of wild abalone stocks by poaching and high market prices have been the
main drivers for the cultivation of abalone in South Africa (Troell et al. 2006). Access to
relatively cheap labour, together with favourable environmental conditions and infrastructure,
also facilitated the growth of the industry in South Africa (Figure 5) (Troell et al., 2006).
Abalone production 2000 - 2008
0
200
400
600
800
1000
1200
2000 2001 2002 2003 2004 2005 2006 2007 2008
Year
Pro
du
cti
on
(to
ns
)
Figure 5: South African abalone production 2000-2008 (DEAT 2008).
The abalone aquaculture industry in South Africa in 2008 is comprised of 14 land based
facilities, including 12 hatcheries, as well as an experimental abalone sea cage farm and a
ranching operation (DEAT 2008). Most farms pump seawater into land based tanks that are
operated in flow-through mode, though recirculation technology is also used (Britz, 1996).
Some farms have both hatchery and grow-out facilities whilst others rely on purchasing
juveniles from other hatcheries. Land-based abalone farming is associated with a high fixed
capital investment (equipment and buildings) ranging between R 1.6 million and R 30 million
for a 15 and 120 ton farm respectively (Troell 2006). Usually labour and feed costs account
for the majority of operating expenses (De Ionno 2006, Abalone Consultants 2010).
Feeds used in the farming of abalone include artificial (formulated) feed and their natural
food seaweed/kelp. The use of kelp or other seaweeds versus artificial feed on an abalone
farm is related to a number of possibly conflicting aspects such as price of feed, availability
and accessibility of fresh seaweed, food conversion ratio (FCR), cost of handling and storage
and final quality of abalone and culture environment (Troell et al., 2006). The Feed
Conversion Ratio (FCR) range for formulated feed is 5–9, whereas that of kelp is 12–17
(Troell et al., 2006). In general, abalone grow faster on formulated feed due to the higher
protein content than kelp until they reach about 50 mm shell length at two years of age. Most

Cloete
11 UNU-Fisheries Training Proramme
farms use such feed in the early stages. This is because juveniles of H. midae have size-
specific requirements for a higher protein diet (Britz and Hecht 1997). After 50 mm shell
length, farmers tend to prefer kelp or a combination of formulated feed and kelp for two
reasons: first, formulated feed promotes a higher incidence of sabellid infestation (shell
boring worm) and second, shell growth rates tend to be higher on kelp (Troell et al., 2006).
Maximum production capacity is not reached within the first 5 years of abalone growth and
farms will have fewer employees per tonne once full production capacity is reached. The
number of employees per tonne of abalone produced ranges from 0.46–1.62 (Troell et al.,
2006). In the start-up phase of a mariculture facility more part-time and more skilled workers
are required than when the facility is well established. Skilled personnel include engineers,
administrators, financial service providers, researchers and managers. The unskilled work is
mainly maintenance, harvesting, processing and security (Troell et al., 2006).
3.4 The abalone market
The main market for abalone is Asia; specifically China, Japan and Taiwan (Brown et al.,
2008; Oellerman 2005). An important additional market for abalone is the United States
mostly because of the large Chinese population (Brown et al., 2008). The demand for abalone
is still increasing, while the world-wide production of the wild abalone fisheries is declining.
The market differentiates abalone based on quality, but it is complex and often difficult to
understand. Products tend to be differentiated by brand names, species, and according to the
country of origin (Brown et al., 2008; Oellermann 2005).
The most sought-after abalone species is the Japanese Enzo (Haliotis discus hannai), but
South Africa, the Middle East and Australia are perceived as producing high quality abalone
as well (Brown 2008; Oellermann 2005; Zuniga 2009). South African abalone is well
received on the markets of Japan, Hong Kong and Singapore and producers have been
making experimental forays into the Chinese market (Oellermann 2005).
The different product forms of abalone on the market include live, canned, dried and frozen
and different quality criteria may apply to each (Brown et al. ,2008; Oellermann 2005). Japan
is the largest consumer of live, fresh and frozen abalone and China has a preference for
canned abalone (Brown et al., 2008). South African producers have focused on the
production of high quality live abalone (80–90 mm shell length) and lower quality specimens
are either sold frozen or canned. It takes about four years to grow an abalone from seed to
market size (approximately 80 mm shell length) (DEAT 2008).
Under normal market conditions, live animals are usually sold for a premium price.However,
the risks associated with delivering live product to the market are significant. During standard
freight procedures, there is a mortality rate of about 5% and drip-loss (dehydration due to
stress) can result in a decrease in live weight by as much as 15% during transport to the
markets in the Far East (Oellermann 2005). The costs of processing and handling live animals
combined with high airfreight costs and mortalities can make alternative marketing strategies
attractive.
Many of the Asian traditional recipes call for dried abalone as the traditional preparations
began years before refrigeration (Abalone consultants, 2010). This sector requires larger
animals (100 mm shell length) than are usually grown on the farms which means a longer
grow-out period (increased risk) and a greater capital investment per kilogram of product
(more tanks are required). The rewards include a 20–30% savings on production costs
(mainly transport costs) and the dried product can be stored during unfavourable market

Cloete
12 UNU-Fisheries Training Proramme
conditions (Oellermann 2005). The preparation process for drying abalone is highly labour
intensive and should not be confused with the sun dried product that sells for lower prices.
Currently abalone prices are driven by a few of the Asian nations, guided by their historical
and changing customs, preparations, populations and economies. An additional influence is
that of Asian populations living elsewhere in the world. Short term price variations are
expected as the economies of the Asian buyer countries grow and shrink.
Regardless of the form in which abalone is sold–dried, fresh, frozen, etc.—the abalone price
in shell in the same worldwide (Abalone Consultants 2010). The price for live abalone in
2005 was approximately 34.00 USD per kilogram. Frozen (USD 45.00/kg) and canned (US$
25 per 425 g tin) abalone fetch good prices, and in some instances even higher than live
abalone prices (Oellermann 2005). However, losses in weight associated with shucking and
evisceration, as well as processing costs, result in a lower price than live abalone per unit.
There are advantages and disadvantages related to different abalone product forms.
4 METHODOLOGY
4.1 The Concept of Modelling
A model can be referred to as a simplified representation of reality for the purpose of
experimenting with alternative strategies (Leung 1986). In most cases it costs less to derive
knowledge from the model than the real world, because the model may represent a system
which does not yet exists, as is the case with the abalone mariculture in South Africa.
Identifying important variables and their relationships by creating formulas, forms the basis
for modelling. Simulation models have only recently been used to evaluate the economic
feasibility of aquaculture ventures (Zuniga, 2009).
Aquaculture models are used with different applications in mind including economic
feasibility and optimisation of system design and operations (Leung, 1986). Different
software approaches have been used to attain specific objectives, in the current study
Microsoft Excel was used.
For the current study the abalone production model is important as the output from the
production model becomes the input for the profitability model. The profitability analysis
model can be defined as a simulation model of an initial investment and subsequent
operations over a specified time.
4.2 Data collection for the abalone production model
The collection of data for the production model is based on the assumption that a 120 tonne
abalone grow-out farm is going to be established. The main assumptions for the abalone
production model will be based on information from the Namaqualand Mariculture Park
Business Plan (Oellermann 2005). The information from the Namaqualand Mariculture
Business Plan will be supplemented by a review of publications on common production
practices for South African abalone and compulsory return statistics from South African
Abalone farmers to the National Department of Environmental Affairs (DEAT).
The DEAT monthly reporting system was developed to provide the department with reliable
information so that there is a better understanding of the ongoing operations and needs of the
abalone industry (DEAT 2008).

Cloete
13 UNU-Fisheries Training Proramme
The production model was created in Excel, based on a production model previously done for
Haliotis rufescens (California red abalone) but revised, by adapting appropriate assumptions,
for H. midae (Steinarsson, pers. comm).
4.3 Data Collection for the profitability model
The abalone prices and production costs (derived from the abalone production model) will be
used to calculate the profitability of abalone aquaculture in the Northern Cape Province (Lee
et al., 2003). The Namaqualand mariculture park business plan and a cost and profitability
survey conducted in 2008 for the South African Mariculture Industry by DEAT, will be the
main sources of information for the investment costs related to the abalone grow-out facility
(DEAT, 2008).
All cost inputs related to the current study are based on prices at the end of 2009. An
important adjustment from the Namaqualand Mariculture Business Plan that was written in
2005 is the price corrections for the investment costs. This was done by adding South African
inflation for the respective years from 2005 to the end of 2009. For the sake of consistency,
inflation was used throughout this study to adjust input costs to the end of 2009. All financial
data represented in this study is recorded in South African Rand. The South African Rand/US
Dollar exchange rate is R7.5.
4.4 Abalone Farming Assumptions
The production concept for land-based abalone grow-out farming is adapted from the NMP
concept (Figure 3).
Water will be pumped from the ocean to a seawater storage pond. The cost of pumping
seawater and related electricity usage will be included in the monthly rent paid to the NMP.
From the storage pond water will be passed through a mechanical drum filter to remove
sediment and particulate matter. Water from the pond is gravity fed to the grow-out tanks.
Effluent water from the tanks will be returned to the sea, via a water treatment wetland
system.
To produce 120 tons of abalone per annum, 887 tanks (5 m long x 2 m wide x 1.1 m deep)
will be constructed within a designated site in the NMP. Approximately 20 abalone holding
baskets (1 m²) will be suspended in each tank. Each basket will contain plates which will
provide the substrate for the abalone to attach themselves.
A monthly purchase of 70 000 abalone spat (approximately 10 mm in size) from an abalone
hatchery will be placed in holding baskets. The abalone will be fed a rotational diet consisting
of formulated feed up to 50 mm (two years), and kelp up to the harvest size of 100 mm shell
length.
Approximately 120 tons of live abalone will be produced per annum, harvested at 100 mm
shell length. The abalone will be sold to a local buyer to be processed and dried for the Asian
market. The anticipated value of product is approximately R 242 (price adjusted by inflation).
Abalone should grow approximately 1.6–1.8 mm per month at an average water temperature
between 16–18 °C (Oellermann, 2005). Abalone achieves market size (100 mm shell length)
in approximately 53 months.

Cloete
14 UNU-Fisheries Training Proramme
Operating costs are divided into fixed and variable costs (Appendix 2 b). The fixed operating
costs remain the same throughout most of the planning period. Variable operating costs
change with the size of the abalone production.
Abalone farming is labour intensive and in the current study the abalone farm employs 123
people over the entire production period. Variable labour costs are mostly unskilled
labourers. The fixed labour costs are skilled employees and semi-skilled employees.
The highest production cost incurred by land based abalone farming in the scope of the
current study is equipment (tanks and abalone holding baskets) in terms of fixed capital and
labour and feed related to ongoing production (Appendix 2 b).
4.5 Profitability analysis techniques
4.5.1 Investment and financing
Before starting an aquaculture venture, a fish farmer needs access to money for investment.
Investment costs can be categorized into buildings, equipment and other investment
(engineering and other construction costs).
Added to the investment costs are the working capital, and this accounts for the total capital
need of the project. Working capital is the amount of money needed to take care of operations
and debts until the first sales of abalone. The Northern Cape Government will fund the shared
infrastructure of the NMP (Table 1), this will lower the total capital need of the project. The
abalone operation would pay a predetermined yearly rent (R2.5 million rand) for the prepared
site.
Table 1: Infrastructure provided by NMP.
For the purposes of the current project a planning period of 15 years is deemed a satisfactory
period to evaluate the profitability of abalone farming. It is common to assume a 10 year
planning period for aquaculture farms as it is unlikely that an aquaculture enterprise would be
an attractive investment opportunity if it were not profitable after ten years (De Ionno et al.,
2006). The reason for the 15 year planning period is that abalone is a slow growing species
and the first sales will only be possible after a period of five years. For the financing of the
abalone operation, a loan will be supplemented by investment through equity (Oellermann
2005). In 2005 the Industrial Development Corporation of South Africa (IDC) has offered a
loan of up to 49% of the total investment required, at 11% interest rate, to be paid back over
15 years. Repayment of the loan will start in the first year of income (Oellermann 2005). The
interest rate offered by the IDC is related to the South African prime rate, adjusted up or
down, based on the risk attached to the project and the development impact, as well as some
other factors. The interest rate of South Africa in 2009 (11%) is reasonable to use for the
current study.
Shared initial infrastructure
provided by Government
Cost for whole Mariculture Park
Seawater Source R 13, 6 million
Seawater Outlet R 1, 1 million
General Engineering
(Landscaping and freshwater to
site)
R 1, 6 million
Power Supply and backup system R 5,0 million
Storage ponds R 6,0 million
Access and general infrastructure
(Entrance)
R 3, 7 million
EIA R 0,1 million
Cloete
15 UNU-Fisheries Training Proramme
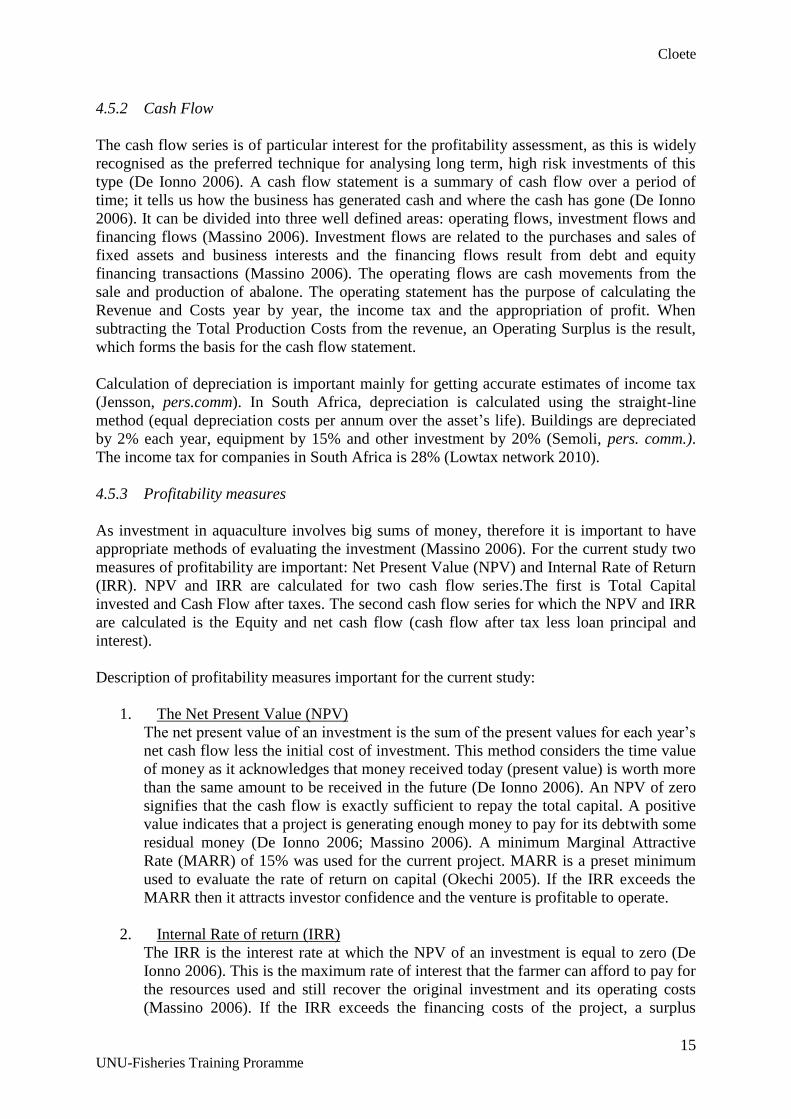
4.5.2 Cash Flow
The cash flow series is of particular interest for the profitability assessment, as this is widely
recognised as the preferred technique for analysing long term, high risk investments of this
type (De Ionno 2006). A cash flow statement is a summary of cash flow over a period of
time; it tells us how the business has generated cash and where the cash has gone (De Ionno
2006). It can be divided into three well defined areas: operating flows, investment flows and
financing flows (Massino 2006). Investment flows are related to the purchases and sales of
fixed assets and business interests and the financing flows result from debt and equity
financing transactions (Massino 2006). The operating flows are cash movements from the
sale and production of abalone. The operating statement has the purpose of calculating the
Revenue and Costs year by year, the income tax and the appropriation of profit. When
subtracting the Total Production Costs from the revenue, an Operating Surplus is the result,
which forms the basis for the cash flow statement.
Calculation of depreciation is important mainly for getting accurate estimates of income tax
(Jensson, pers.comm). In South Africa, depreciation is calculated using the straight-line
method (equal depreciation costs per annum over the asset’s life). Buildings are depreciated
by 2% each year, equipment by 15% and other investment by 20% (Semoli, pers. comm.).
The income tax for companies in South Africa is 28% (Lowtax network 2010).
4.5.3 Profitability measures
As investment in aquaculture involves big sums of money, therefore it is important to have
appropriate methods of evaluating the investment (Massino 2006). For the current study two
measures of profitability are important: Net Present Value (NPV) and Internal Rate of Return
(IRR). NPV and IRR are calculated for two cash flow series.The first is Total Capital
invested and Cash Flow after taxes. The second cash flow series for which the NPV and IRR
are calculated is the Equity and net cash flow (cash flow after tax less loan principal and
interest).
Description of profitability measures important for the current study:
1. The Net Present Value (NPV)
The net present value of an investment is the sum of the present values for each year’s
net cash flow less the initial cost of investment. This method considers the time value
of money as it acknowledges that money received today (present value) is worth more
than the same amount to be received in the future (De Ionno 2006). An NPV of zero
signifies that the cash flow is exactly sufficient to repay the total capital. A positive
value indicates that a project is generating enough money to pay for its debtwith some
residual money (De Ionno 2006; Massino 2006). A minimum Marginal Attractive
Rate (MARR) of 15% was used for the current project. MARR is a preset minimum
used to evaluate the rate of return on capital (Okechi 2005). If the IRR exceeds the
MARR then it attracts investor confidence and the venture is profitable to operate.
2. Internal Rate of return (IRR)
The IRR is the interest rate at which the NPV of an investment is equal to zero (De
Ionno 2006). This is the maximum rate of interest that the farmer can afford to pay for
the resources used and still recover the original investment and its operating costs
(Massino 2006). If the IRR exceeds the financing costs of the project, a surplus

Cloete
16 UNU-Fisheries Training Proramme
remains after paying back the capital and this surplus goes to the fish farmer as profit
(Okechi 2005).
4.5.4 Sensitivity Analysis (Analysis of key variables affecting Profitability)
All businesses operate in an environment loaded with risk, thus it is of the utmost importance
to evaluate the risks associated with a business before investing in it. Risk is associated with
the natural variation in factors affecting profitability over time, such as annual production,
prices and interest rates (Okechi 2005). In South Africa aquaculture is considered a high risk
business, as it involves high start up costs, and in the case of abalone farming, does not show
returns on investment until ten or more years into the venture. In order to compare the effects
of different variables on profitability, sensitivity analysis was used in the current study. If we
did not use sensitivity analysis, the model would only predict one possible outcome, which is
not a realistic result.
For the current study Impact Analysis was used to compare the effects of different variables
on profitability. Impact analysis deals with only one uncertain item at the time. All the
parameters used in sensitivity analysis were varied by an increase and decrease of 50% from
the base case assumptions used in the profitability model. Parameters used in sensitivity
analysis include sales price, sales quantity, fixed and variable operating costs.

Cloete
17 UNU-Fisheries Training Proramme
5 BUSINESS MODEL FOR ABALONE FARMING
5.1 Abalone (H. midae) Production model
Based on the assumptions in Table 2, a 120 tonne/annum abalone production model was
developed (Appendix 1).
The production model monitors one monthly cycle of spat input over the entire production
period of 53 months. The standing biomass at the end of this period, as a function of growth
(FCR and monthly growth rate), mortalities and drip-loss will be the basis for determining the
amount of monthly spat input to sustain the anticipated annual production of the abalone
farm. Monthly additions of 70 000 abalone spat (10 mm in size) are suitable to produce 120
tonnes of abalone annually. The total biomass at a chosen time is the number of abalone
multiplied by the individual weight (Zuniga 2009). The biomass turnover for the current
study is 80%, meaning that a biomass of 150 tonnes is needed to sustain a 120 tonne
production per year. A long grow-out time results in a low biomass turnover as is the case for
the current study. The length/weight conversion formula used in the production model is
based on a condition factor (CF) for H.midae and is equal to 5575 *(weight [g]/length
[mm]2.99
(Britz and Hecht, 1997).
The abalone is fed a rotational diet consisting of formulated feed up to a size of 50 mm shell
length (after two years), and kelp up to the harvest size of 100 mm (Troell et al., 2006). The
FCR for both formulated feed (5) and kelp (15) was derived from previous studies (Troell et
al., 2006). The amount of abalone feed needed per month is a function of the biomass at a
specific time and the FCR. A growth rate of 1.7 mm per month was assumed (Oellermann
2005). The specific growth rate formula used in the model is: Growth rate = (100 X [Ln final
weight - Ln initial weight]/experimental period in days) (Britz et al.,1997).
The stocking density per basket (density factor) allowed for the grading times to be
determined, as well as the number of tanks needed at a specific time of the production.
The model allowed for the amount and costs of inputs to be determined at specific times of
the production period.
Table 2: Assumptions for abalone production model
Assumption Value Size of Spat (mm) 10
Growth rate (mm/month) 1.7
FCR formulated feed (feed/growth) 5
FCR Kelp 15
Mortality (%/month) 0.2%
Drip loss (%) 5%
Table 3: Production costs derived from the abalone production model Quantity Price Total Cost
Number of spat per year 843 000 pa R1,20 R 1 million
Amount of Formulated feed (ton/year) 59 tons/annum R1.885/ton R 111 thousand
Kelp (ton/year) 1716
tons/annum
R 1.212/ton R 2 million
Number of abalone holding baskets 17 746 R269 R 8 million
Number of tank units 1526 R12.567/unit R 19 million

Cloete
18 UNU-Fisheries Training Proramme
5.2 Cash Flow Analysis Results
Cash Flow Analysis results for the land-based grow-out abalone farming over the planning
period of 15 years are shown in Figure 6.
Figure 6: Cash flow from teh 120 tonne land based grow-out abalone farm simulated over the
planning period of 15 years.
5.2.1 Total Cash Flow and Capital
The total fixed capital investment for the abalone farm is R 34 million, added to this is the
working capital of R 40 million (Appendix 2 a). The total capital required for the abalone
farm thus amounts to R 74 million as indicated in the year 2009 (Appendix 2 a). A
breakdown of the investment and operational costs are shown in appendix 2 b. There are no
sales of abalone for the first five years (2009–2013) (Appendix 2 a) implying no revenue to
cover the operational costs of the operation, therefore the cash flow is negative during these
years. From 2014 sale of abalone starts and cash flow becomes positive (Appendix 2 d).
There is a decrease in the cash flow in 2018, as the company starts paying tax. The cash flow
is R 17 million during the last years of the 15 year planning period. A salvage value of R 66
million was assumed at the end of the 15 year planning period.
5.2.2 Equity and net cash flow
In 2009, this cash flow series is the amount of equity, R 37 million, which is 50% of total
financing for the abalone farm (Appendix 2 c). From 2010 the series is the Net Cash flow
after payment of tax, financial cost (interest and loan management fee) and the loan
repayment (Appendix-cash flow sheet). It is negative for the first five years because there are
no revenues. The Net Cash Flow in 2024 during the last years of the 15 year planning period
amounts to R 8 million. The Net Present Value (NPV) is negative, negative R 37 and
negative R 30 million for Total Cash Flow and Net Cash Flow respectively, indicating that
the abalone farm is not generating enough money to pay for its debt. Thus, the venture is not
profitable under the current assumptions (Figure 7).

Cloete
19 UNU-Fisheries Training Proramme
Figure 7: NPV of cash flow over the 15 year planning period.
The Internal Rate of Return (IRR) for both Total and Net Cash flow series are 9 and 8%
respectively (Figure 8). The IRR is less than the 15% MARR for the current study, indicating
that it is not an attractive investment opportunity.
Figure 8: IRR of the abalone farm model.

Cloete
20 UNU-Fisheries Training Proramme
5.3 Sensitivity Analysis
Sensitivity analysis was done with all major investment costs including sales price, and
quantity of abalone sold. The parameters were varied by 50% (Table 4, Figure 9). The results
of the impact analysis indicate that the abalone operation is most sensitive to the sales price
of abalone. For example, if the sales prices of abalone are raised by about 35% the IRR is
15% which is an acceptable rate of return for the current project. The quantity of abalone sold
also has a noticeable effect on profitability.
Variations in the cost of equipment and operational costs (fixed and variable), did not have a
significant impact on the profitability of abalone farming. However, variations in variable
costs had more influence on the IRR of equity than the cost of equipment and fixed costs.
Figure 9: Sensitivity analysis of sales price, eqipment, sales volume, and fixed and variable
operational costs.

Cloete
21 UNU-Fisheries Training Proramme
Table 4: Sensitivity analysis of sales price, equipment, sales volume, and fixed and variable
operational costs.
Deviations Values IRR
Sales Price
IRR
Equipment
IRR
Sales
Quantity
IRR
Fixed
Cost
IRR
Variable
Cost
-50% 50% 0% 11% 0% 10% 11%
-40% 60% 0% 10% 0% 10% 11%
-30% 70% 0% 9% 0% 9% 10%
-20% 80% 1% 9% 3% 9% 9%
-10% 90% 5% 8% 6% 8% 8%
0 100% 8% 8% 8% 8% 8%
10% 110% 10% 7% 9% 7% 7%
20% 120% 12% 7% 11% 7% 6%
30% 130% 14% 6% 13% 6% 5%
40% 140% 16% 6% 14% 6% 4%
50% 150% 17% 5% 15% 5% 3%

Cloete
22 UNU-Fisheries Training Proramme
6 DISCUSSION
As abalone farming is the first venture anticipated to be established in the NMP, the current
study evaluated the feasibility of abalone land-based farming in the Northern Cape province
of South-Africa.
Using the collected data, projections for the facility were carried over a 15 year planning
period. The planning period can be increased but investor attractiveness decreases with a
longer waiting period. As shown in the profitability analysis, a considerable amount of total
capital (R 74 million) is needed for abalone land-based farming. The high capital investment
needed together with the long grow-out period prevents many entrepreneurs from starting a
farm. Returns are not achieved for 5 years after initial setup, this underpins the notion that
aquaculture is a high-risk venture (Troell et al., 2006).
It is important that the operation is able to return the capital investment with profit (Okechi
2005). The profitability indicator, NPV, is negative indicating that abalone farming with the
current assumptions is not profitable. The IRR is less than the Marginal Attractive Rate
(MARR) of 15% for the current study. This implies that it is not an attractive investment
opportunity.
There may be various reasons for the venture appearing to be unprofitable according to the
assumptions used in the current study. Various assumptions are made when forecasting both
in terms of biological and economic data that might be highly variable in reality. Some
studies suggest excluding highly variable factors like tax, land value, and borrowings in order
to focus on the profitability of the operation itself (De Ionno et al., 2006). For example, the
type of tax rates that are available depends on the structure of the operation (e.g. partnership,
company, trust, etc.) and there are differing tax laws between countries and states. Interest
rates on loans can also be highly variable. In some countries there are tax breaks for start-up
companies, this was not considered in the current study (Steinarsson, pers. comm).
The cost of constructing an intensive land-based abalone system can vary depending on many
factors including the site, size and preferred production strategy. A higher fixed capital
investment is needed to establish larger farms in order to achieve economies of scale. There
are noticeable advantages for facilities where economies of scale have been achieved and
investor confidence is not apparent until that goal is achieved. Generally, economy of scale is
not evident until facilities reach approximately 100 tonnes per annum (de Ionno et al., 2006;
Troell et al., 2006). For the current study an annual production of 120 tonnes annual
production was assumed.
In the current study, the capital investment was lowered, due to government funding
infrastructure related to the NMP (Table 1). The abalone operation paid a yearly rent for the
use of these infrastructure provided by the NMP. The amount of rent paid is calculated based
on the volume of seawater used by the operation, as well as Ad hoc fees for services. The rent
paid is assumed to be the same amount every year, and it is clear that in the start-up phase the
operational needs would be less compared to when maximum production capacity is reached.
This needs to be reviewed.
Different feeding strategies (formulated vs kelp), product form (live, frozen, canned, dried),
culture technology (flow-through and recirculation) and production strategy (grow-out,
hatchery) have implications on the profitability of aquaculture ventures. It does not imply that
if one farm is profitable using a certain production strategy, all will be. Every situation is

Cloete
23 UNU-Fisheries Training Proramme
unique and site-dependant. Appropriate management strategies maximise comparative
advantage to increase benefits and profits.
The highest production costs for the current study were equipment (number of tanks and
abalone holding baskets), labour and feed. Generally these are the highest costs related to
intensive land based aquaculture (Zuniga 2009; De Ionno 2006). These costs increase with
time.
For the current study, abalone is sold to a processor to be dried for the Asian markets.
Dried abalone is harvested at a larger size (100 mm shell length) than usually grown on farms
selling live abalone. This implies a higher capital investment (tanks) due to a longer grow-out
period. Significant production costs, such as electricity due to pumping of water, feed and
labour costs, will be even higher because of the longer grow-out period. High production
costs have been cited as one of the main reasons for the poor economic performance of
abalone culture in Chile (Zuniga 2009). As shown in the sensitivity analysis, variation in
abalone prices has the most significant effect on profitability. This is because the revenue
earned from selling abalone must cover the production and other operating costs in order for
the operation to be profitable. This highlights the importance of an effective production
strategy.
The majority of existing abalone farms in South Africa focus on the production of live
(80-90 mm shell length) abalone. Live abalone is harvested at a smaller size than dried
abalone, reducing labour and feed costs. Also, under normal circumstances live abalone
receive a premium price. Usually there are risks (mortalities and drip-loss) associated with
delivering live abalone to the market in the Far East. Existing abalone farms are located in
urban areas (in proximity to airports and aquaculture services), thus they have comparative
advantage, compared to logistically remote regions.
The current study only evaluated the effect of varying economic variables on the profitability
of abalone farming (Figure 9, Table 4). Biological variables are very important and further
studies of the effect of growth rate and mortalities are necessary. A low growth rate or a
decrease in growth rate means a longer production period and an increase in production costs.
It has been suggested that biological variables are more relevant than economic variables on
the economic performance of aquaculture ventures (Zuniga 2009).
The NMP proves to be a good concept as access to sites both on land and water is the biggest
constraint to aquaculture development in South Africa. There are added benefits like job
creation and attracting business to the Northern Cape Province. The principal challenges that
the South African government seeks to address are poverty and unemployment (DEAT,
2007), and a future challenge for aquaculture development will be to integrate social,
environmental and economic goals.
The current study does not take into account all the uncertainties associated with abalone
farming. The model can be used to explore different alternative strategies, taking into account
variables having a noticeable effect on profitability.

Cloete
24 UNU-Fisheries Training Proramme
7 CONCLUSION
The purpose of this study was to become familiar with profitability assessment techniques
and to use the knowledge in the future as a tool to assess the feasibility of new aquaculture
ventures. As aquaculture is a relatively new economic sector in South Africa, and
government aims to increase aquaculture production, profitability assessment techniques can
be a valuable tool. Aquaculture requires high capital investment and major financial
institutions and investors require a business plan indicating important profitability indicators.
Existing abalone farms in South Africa are profitable commercial ventures. These farms
maximise their comparative advantage ascribed to their proximity to airports and aquaculture
services by selling the abalone in live product form. Usually live abalone receives a premium
price compared to other products. Sensitivity analysis indicated that sales price have the most
significant influence on profitability. The key is to find an effective production strategy,
maximising profits gained from aquaculture ventures.
8 RECOMMENDATION/FUTURE RESEARCH
For the short term government can adapt the NMP infrastructure for abalone farming only,
without compromising the greater concept. In this way government would reduce the risk
involved with establishing infrastructure meant to serve an industrial sized operation without
the guarantee of returns in the short to medium term. It can be gradually built up to full
capacity, as additional aquaculture ventures are established.
As the NMP concept is not designed for abalone farming alone, it will utilise a larger space
than typically required for only abalone farming. The seawater storage ponds (2.0 ha)
described serve as operational security for the entire NMP, for a time period up to 48 hours
after complete pump failure. Without establishing any additional infrastructure, in the short
term, there is also the possibility to maximise the comparative advantage of having more
space by combining complementary aquaculture activities, like oyster culture, with the
abalone farmed in the seawater storage ponds. It is suggested that one storage pond can
support 20 oyster long-lines (Oellermann 2005). Oyster culture technology is proven in South
Africa and oysters are good aquaculture candidates as they are sedentary, require no feeding,
and can withstand a broad range of environmental conditions. Oysters are marketed locally
and can compensate for the long grow-out period of abalone, by earning revenue in the short
term.
Cloete
25 UNU-Fisheries Training Proramme
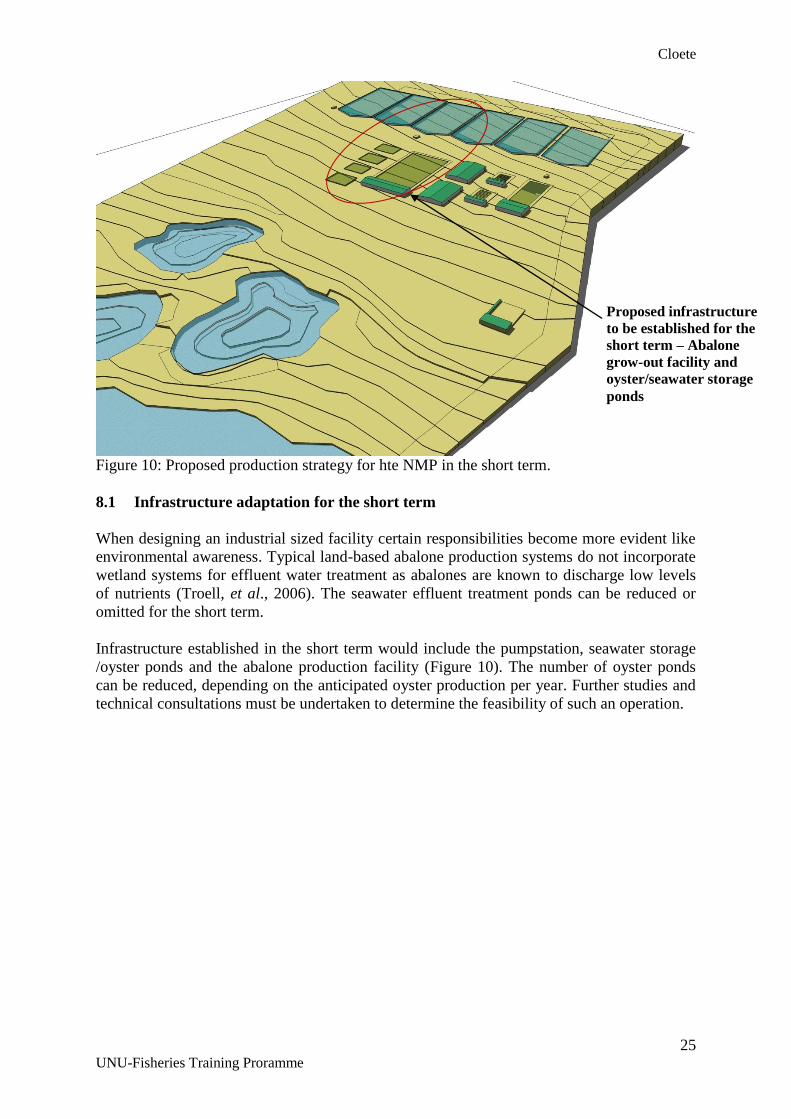
Figure 10: Proposed production strategy for hte NMP in the short term.
8.1 Infrastructure adaptation for the short term
When designing an industrial sized facility certain responsibilities become more evident like
environmental awareness. Typical land-based abalone production systems do not incorporate
wetland systems for effluent water treatment as abalones are known to discharge low levels
of nutrients (Troell, et al., 2006). The seawater effluent treatment ponds can be reduced or
omitted for the short term.
Infrastructure established in the short term would include the pumpstation, seawater storage
/oyster ponds and the abalone production facility (Figure 10). The number of oyster ponds
can be reduced, depending on the anticipated oyster production per year. Further studies and
technical consultations must be undertaken to determine the feasibility of such an operation.
Proposed infrastructure
to be established for the
short term – Abalone
grow-out facility and
oyster/seawater storage
ponds

Cloete
26 UNU-Fisheries Training Proramme
LIST OF REFERENCES
Abalone Consultants. 2010. http://www.fishtech.com/ [Access in 2009/2010]
Britz, 1996. Effect of dietary protein level on growth performance of South African abalone,
Haliotis midae, fed fishmeal-based semi-purified diets [Electronic Version]. Aquaculture
140: 55-61
Britz, P. J., Hecht, T. and Mangold, T. S. 1997. Effect of temperature on growth, feed
consumption and nutritional indices of Haliotis midae fed a formulated diet [Electronic
version]. Aquaculture 140: 75-85
Britz , P. J. and Hecht, T. 1997. Effect of dietary protein and energy level on growth and
body composition of South African abalone, Haliotis midae [Electronic version]. Aquaculture
156: 195-210
Brown, M. R., A. L. Sikes, N. G. Elliott and R. K. Tume. 2008. Physicochemical factors of
abalone quality: a review [Electronic Version]. Journal of Shellfish Research 27(4): 835-842.
De Ionno, P. N., Wines, G. L., Jones, P. L. and Collins, R.O. 2006. A bioeconomic evaluation
of a commercial scale recirculating finfish growout system – An Australian perspective
[Electronic version]. Aquaculture 259: 315 – 327.
DEAT. Department of Environmental Affairs and Tourism. 2006. Marine Aquaculture
Development Plan. Cape Town, South Africa.
DEAT. Department of Environmental Affairs and Tourism. 2007. Policy for the
Development of a Sustainable Marine Aquaculture Sector in South Africa. Cape Town. South
Africa.
DEAT. Department of environmental affairs and Tourism. 2008. Marine Aquaculture
Industry Report. Cape Town, South Africa
De Waal S.W.P., Branch G.M. and Navarro R. 2003. Interpreting evidence of dispersal by
Haliotis midae juveniles seeded in the wild [Electronic version]. Aquaculture 221: 299–310
Hinrichsen, E. 2007. Introduction to Aquaculture in the Western Cape: Edition 1. Division of
Aquaculture, Stellenbosch University Report. Republic of South Africa, Provincial
Government of the Western Cape, Department of Environmental Affairs and Development
Planning, Cape Town
Lee, W-C., Chen, Y-H., Lee, Y-C. and Chiu Liao, I. 2003. The competitiveness of the eel
aquaculture inTaiwan, Japan, and China [Electronic version]. Aquaculture 221: 115-124
Leung, P. 1986. Applications of Systems Modelling in Aquaculture [Electronic version].
Aquacultural Engineering 5: 171-182.
Massino, A. 2004. Financial and biological model for intensive culture of tilapia. United
Nations University Fisheries Training Programme. Reykjavik, UNU-Fisheries Training
Programme
Oellermann, L. K. 2005. Namaqualand Mariculture Business Plan. Unpublished

Cloete
27 UNU-Fisheries Training Proramme
Okechi, 2005. Profitability Assessment: A case study of African Catfish (Clarias gariepinus)
farming in the Lake Victoria basin, Kenya. United Nations University Fisheries Training
Programme. Reykjavik, UNU-Fisheries Training Programme.
The Low Tax Network. 2010.
http:/www.lowtax.net/lowtax/html/offon/southafrica/sasummary.html http [Access in 2010].
Troell. M., Robertson-Andersson, D., Anderson, R. J., Bolton, J.J., G. Maneveldt, G.,
Halling, C. and Probyn, T. 2006. Abalone farming in South Africa: An overview with
perspectives on kelp resources, abalone feed, potential for on-farm seaweed production and
socio-economic importance [Electronic Version]. Aquaculture 257: 266–281.
Zuniga, S. 2009. A dynamic simulation analysis of Japanese abalone (Haliotis discus hannai)
production in Chile [Electronic Version]. Aquaculture International. Springer
Science+Business Media B.V. 2009

Cloete
28 UNU-Fisheries Training Proramme
ACKNOWLEDGEMENTS
I would like to thank the UNU-FTP, Tumi, Thor and Sigga, this truly was an unbelievable
life experience. I would also like to express my gratitude towards my supervisors, Pall
Jensson for his guidance and support and Agnar Steinarsson for his valuable advice. Also a
special thanks to Belemani Semoli, for information shared during this period.
A special thanks to The Holar University College staff and all the lecturers for sharing their
knowledge with us.

Cloete
29 UNU-Fisheries Training Proramme
PRODUCTION MODEL
ABALONE FARMING (Haliotis midae)
Size of spat (mm) 10 Production (tons/year) 120.3
Spat per month 69,500 Hatch to market (years) 4.9
Growth (mm/month) 1.7 Biomass turnover (%) 85%
FCR formulated (feed/growth) 5.0 Biomass (tons) 141.5
FCR kelp (feed/growth) 15 Growth rate (%/day) 0.43%
Density factor (%) 100% Water flow (m3/hour) 2,037
Seawater (l/sec/ton) 4.0 Formulated feed (tons/year) 59
Mortality (%/month) 0.2% Kelp (tons/year) 1,716
Basket (m2) 1.0 Number (spat/year) 834,000
Baskets/tank 20 Number of baskets 30,512
Drain loss (%) 5% Number of tanks 1,526
Time Diameter Weight Number Biomass Growth Density Tanks Feed Seawater
Months mm g /month tons %/day kg/basket number kg/month m3/hr
0 10.0 0.2 69,500 0.01 1.75% 0.9 1 0.8 0.2
1 11.7 0.3 69,361 0.02 1.54% 1.0 1 1.2 0.3
2 13.4 0.4 69,222 0.03 1.33% 1.2 1 1.6 0.4
3 15.1 0.6 69,084 0.04 1.17% 1.3 2 2.0 0.6
4 16.8 0.8 68,946 0.06 1.05% 1.4 2 2.5 0.8
5 18.5 1.1 68,808 0.07 0.94% 1.6 2 3.0 1.1
6 20.2 1.4 68,670 0.10 0.86% 1.7 3 3.6 1.4
7 21.9 1.8 68,533 0.12 0.79% 1.9 3 4.3 1.8
8 23.6 2.2 68,396 0.15 0.73% 2.0 4 5.0 2.2
9 25.3 2.8 68,259 0.19 0.68% 2.2 4 5.8 2.7
10 27.0 3.4 68,122 0.23 0.64% 2.3 5 6.6 3.3
11 28.7 4.0 67,986 0.27 0.60% 2.4 6 7.4 3.9
12 30.4 4.8 67,850 0.32 0.56% 2.6 6 8.3 4.7
13 32.1 5.6 67,715 0.38 0.53% 2.7 7 9.3 5.5
14 33.8 6.6 67,579 0.44 0.51% 2.9 8 10.3 6.4
15 35.5 7.6 67,444 0.51 0.48% 3.0 8 11.3 7.4
16 37.2 8.7 67,309 0.59 0.46% 3.2 9 12.4 8.5
17 38.9 10.0 67,174 0.67 0.44% 3.3 10 13.6 9.7
18 40.6 11.4 67,040 0.76 0.42% 3.4 11 14.8 11.0
19 42.3 12.8 66,906 0.86 0.40% 3.6 12 16.0 12.4
20 44.0 14.5 66,772 0.96 0.39% 3.7 13 17.3 13.9
21 45.7 16.2 66,639 1.1 0.37% 3.9 14 18.6 15.5
22 47.4 18.1 66,505 1.2 0.36% 4.0 15 20.0 17.3
23 49.1 20.1 66,372 1.3 0.35% 4.2 16 21.4 19.2
24 50.8 22.2 66,240 1.5 0.33% 4.3 17 22.9 21.2
25 52.5 24.5 66,107 1.6 0.32% 4.4 18 73.2 23.3
26 54.2 27.0 65,975 1.8 0.31% 4.6 19 77.9 25.6
27 55.9 29.6 65,843 1.9 0.30% 4.7 21 82.7 28.0
28 57.6 32.3 65,711 2.1 0.29% 4.9 22 87.6 30.6
29 59.3 35.3 65,580 2.3 0.29% 5.0 23 92.7 33.3
30 61.0 38.4 65,449 2.5 0.28% 5.2 24 97.8 36.2
31 62.7 41.7 65,318 2.7 0.27% 5.3 26 103.1 39.2
32 64.4 45.1 65,187 2.9 0.26% 5.4 27 108.6 42.4
33 66.1 48.8 65,057 3.2 0.26% 5.6 28 114.1 45.7
34 67.8 52.6 64,927 3.4 0.25% 5.7 30 119.8 49.2
35 69.5 56.7 64,797 3.7 0.24% 5.9 31 125.6 52.9
36 71.2 60.9 64,667 3.9 0.24% 6.0 33 131.5 56.8
37 72.9 65.4 64,538 4.2 0.23% 6.2 34 137.5 60.8
38 74.6 70.1 64,409 4.5 0.23% 6.3 36 143.7 65.0
39 76.3 74.9 64,280 4.8 0.22% 6.4 37 149.9 69.4
40 78.0 80.1 64,151 5.1 0.22% 6.6 39 156.3 73.9
41 79.7 85.4 64,023 5.5 0.21% 6.7 41 162.8 78.7
42 81.4 90.9 63,895 5.8 0.21% 6.9 42 169.4 83.7
43 83.1 96.7 63,767 6.2 0.20% 7.0 44 176.1 88.8
44 84.8 102.8 63,640 6.5 0.20% 7.1 46 182.9 94.2
45 86.5 109.1 63,512 6.9 0.19% 7.3 48 189.9 99.7
46 88.2 115.6 63,385 7.3 0.19% 7.4 49 196.9 105.5
47 89.9 122.4 63,259 7.7 0.19% 7.6 51 204.1 111.5
48 91.6 129.4 63,132 8.2 0.18% 7.7 53 211.3 117.7
49 93.3 136.8 63,006 8.6 0.18% 7.9 55 218.7 124.1
50 95.0 144.3 62,880 9.1 0.18% 8.0 57 226.1 130.7
51 96.7 152.2 62,754 9.6 0.17% 8.1 59 233.7 137.5
52 98.4 160.3 62,629 10.0 0.17% 8.3 61 241.4 144.6
53 100.1 168.8 62,503 10.5 0.17% 8.4 63 249.1 151.9
Juvenile phase (1-10 g) 10% 11.9 0.66% 65.9 180 240 171
Grow-out phase (10-80 g) 152.8 0.23% 136.9 1,116 4,464 2,201
Total: Mortalities: 6,997 164.7 0.43% 127.0 1,297 4,704 2,372
Model made by Agnar Steinarsson, Marine Research Institute of Iceland.
Appendix 1: Abalone production model

Cloete
30 UNU-Fisheries Training Proramme
Appendix 2 (a): Summary of main assumptions and results
Assumptions and Results
2009 Discounting Rate 15% (MARR)
Investment: MRAND Planning Horizon years
Buildings 2.5
Equipment 100% 31.7 T ota l Cap. Equity
Other 0.0 NPV of Cash Flow -37 -30
T ota l 34.2 Inte rna l Ra te 9% 8%
Financing:
Working Capita l 40 Capita l/Equity
T ota l Financing 74 a fte r 10 years
Equity 100% 50%
Loan Repayments 10 years Minimum Cash Account 0
Loan Inte rest 100% 11%
Opera tions: 2010 2011 2012 2013 2014 2015 2016 2017 2018 2019 2020 2021 2022 2023 2024
Sa les Quantity 100% 0 0 0 0 0 120 120 120 120 120 120 120 120 120 120 T on/annum
Sales Price 100% 0 242,000 242,000 242,000 242,000 242,000 242,000 242,000 242,000 242,000 242,000 Rand/ton
Variable Cost 100% 64 Rand/kg
Fixed Cost 100% 4 MRAND/year
Inventory Build-up 0
Debtors (accounts rece ivable )25% of turnover
Creditors (accounts payable )15% of variable cost
D ividend 30% of profit
Deprecia tion Buildings 2%
Deprecia tion Equipm. 15%
Deprecia tion Other 20%
Loan Managem. Fees 2%
Income T ax 28%

Cloete
31 UNU-Fisheries Training Proramme
Appendix 2 (b): Breakdown of main investment costs
Breakdown of Main Assumptions
Investment Cost: Opera ting Costs:
Buildings: Variable Costs:
Site Preparation 953,386 Rand Purchase of spat 8.3 R/kg/year
Admin Buildings 471,300 " Feed (kelp) 17.3 "
Workshops, stores and ablutions 224,928 " Feed (formulated feed) 0.9 "
Splitting and packaging rooms 56,232 " Labour expenditure 23.0 "
Concrete Effluent channels 484,800 " Transport 0.8 "
Mixing Station reservoir 40,392 Electricity 3.8
Contingency ca 10% 223,104 " Repair and Maintenance 2.5 "
T ota l Buildings 2,454,142 Rand Consumables 2.1 "
Contingency ca 10% 5.7 R/kg/year
T ota l Variable Costs 64
Equipment Rand
Primary water source reticulation 115,117 "
Growout tanks 19,177,242 " Fixed Costs: R/year
Baskets 8,207,728 " Salaries 807,840 "
Air Blowers 430,848 " Administration costs 127,908 "
Industrial Lights 89,034 " Site Rental 2,501,412
Abalone handling equipment 40,392 " Insurance 296,551
Oxygen flow monitor & alarm system 30,374 Contingency 10% 373,371
Office equipment 71,359 " T ota l Fixed Costs 4,107,082 R/year
Mechanical Drum Filter 340,393 "
Dispatching/Packaging equipment 75,946 "
Miscellaneous equipment 284,764 "
Contingency ca 10% 2,886,319 "
T ota l Equipment 31,749,516 Rand
Other Investment (Provided by NMP) Rand
Seawater intake source "
Seawater outlet "
General Engineering "
Power Supply and backup system "
Storage pond "
Access & general infrastructure
EIA
Contingency ca 10%
T ota l 'other investment' 0

Cloete
32 UNU-Fisheries Training Proramme
Appendix 2 (c): Investment and financing
Investment
2009 2010 2011 2012 2013 2014 2015 2016 2017 2018 2019 2020 2021 2022 2023 2024 T ota l
Investment and Financing 1 2 3 4 5 6 7 8 9 10 11 12 13 14 15
Investment:
Buildings 2.5 2.4 2.4 2.3 2.3 2.2 2.2 2.1 2.1 2.0 2.0 1.9 1.9 1.8 1.8 1.7
Equipment 31.7 27.0 22.2 17.5 12.7 7.9 3.2 3.2 3.2 3.2 3.2 3.2 3.2 3.2 3.2 3.2
Other 0.0 0.0 0.0 0.0 0.0 0.0 0.0 0.0 0.0 0.0 0.0 0.0 0.0 0.0 0.0 0.0
Booked Va lue 34.2 29.4 24.6 19.8 15.0 10.1 5.3 5.3 5.2 5.2 5.1 5.1 5.0 5.0 4.9 4.9
Deprecia tion (Stra ight Line ):
Depreciation Buildings 2% 0.05 0.05 0.05 0.05 0.05 0.05 0.05 0.05 0.05 0.05 0.05 0.05 0.05 0.05 0.05 0.7
Depreciation Equipm. 15% 4.8 4.8 4.8 4.8 4.8 4.8 0.0 0.0 0.0 0.0 0.0 0.0 0.0 0.0 0.0 28.6
Depreciation Other 20% 0.0 0.0 0.0 0.0 0.0 0.0 0.0 0.0 0.0 0.0 0.0 0.0 0.0 0.0 0.0 0.0
T ota l Deprecia tion 4.8 4.8 4.8 4.8 4.8 4.8 0.0 0.0 0.0 0.0 0.0 0.0 0.0 0.0 0.0 29.2
Financing: 74.2
Equity 50% 37.1
Loans 50% 37.1
Loan 1
Repayment 10 0 0 0 0 0 3.7 3.7 3.7 3.7 3.7 3.7 3.7 3.7 3.7 3.7 37.1
Principal 37.1 37.1 37.1 37.1 37.1 37.1 33.4 29.7 26.0 22.3 18.6 14.8 11.1 7.4 3.7 0.0
Interest 11% 4.1 4.1 4.1 4.1 4.1 4.1 3.7 3.3 2.9 2.4 2.0 1.6 1.2 0.8 0.4 42.9
Loan Managem. Fees 2% 0.7

Cloete
33 UNU-Fisheries Training Proramme
Appendix 2 (d): Operations sheet
Operations
2009 2010 2011 2012 2013 2014 2015 2016 2017 2018 2019 2020 2021 2022 2023 2024 T ota l
Operations Statement
Sales 0 0 0 0 120 120 120 120 120 120 120 120 120 120 120 Ton/annum1200
Price 0 0 0 0 242,000 242,000 242,000 242,000 242,000 242,000 242,000 242,000 242,000 242,000 242,000 Rand/ton
Revenue 0.0 0.0 0.0 0.0 29.0 29.0 29.0 29.0 29.0 29.0 29.0 29.0 29.0 29.0 29.0 319.4 MRAND
Variable Cost 64 0.5 1.0 1.9 3.9 7.7 7.7 7.7 7.7 7.7 7.7 7.7 7.7 7.7 7.7 7.7 92.3
Net Profit Contribution -0.5 -1.0 -1.9 -3.9 21.3 21.3 21.3 21.3 21.3 21.3 21.3 21.3 21.3 21.3 21.3 227.2
Fixed Cost 4 3.8 4.1 4.1 4.1 4.1 4.1 4.1 4.1 4.1 4.1 4.1 4.1 4.1 4.1 4.1 61.3
Diverse Taxes 0.0
Opera ting Surplus (EBIT DA) -4.3 -5.1 -6.0 -8.0 17.2 17.2 17.2 17.2 17.2 17.2 17.2 17.2 17.2 17.2 17.2 165.9
Earnings Bfore Interest, Taxes, Depreciation and Amortization
Inventory Movement 0.0 0.0
Depreciation 4.8 4.8 4.8 4.8 4.8 4.8 0.0 0.0 0.0 0.0 0.0 0.0 0.0 0.0 0.0 29.3
Opera ting Ga in/Loss (EBIT ) -9.1 -9.9 -10.9 -12.8 12.4 12.4 17.2 17.2 17.2 17.2 17.2 17.2 17.2 17.2 17.2 119.4
Financial Costs (Interest + LMF) 0.7 4.1 4.1 4.1 4.1 4.1 4.1 3.7 3.3 2.9 2.4 2.0 1.6 1.2 0.8 0.4 43.6
Profit be fore T ax (EBT ) -0.7 -13.2 -14.0 -14.9 -16.9 8.3 8.3 13.5 13.9 14.3 14.7 15.1 15.5 15.9 16.3 16.7 93.0
Loss Transfer 0 -0.7 -13.9 -27.9 -42.8 -59.7 -51.4 -43.1 -29.6 -15.7 -1.4 0.0 0.0 0.0 0.0 0.0 0.0
Taxable Profit 0.0 0.0 0.0 0.0 0.0 0.0 0.0 0.0 0.0 0.0 13.3 15.1 15.5 15.9 16.3 16.7
Income Tax 28% 0.0 0.0 0.0 0.0 0.0 0.0 0.0 0.0 0.0 0.0 3.7 4.2 4.3 4.5 4.6 4.7 26.0
Profit a fte r T ax -0.7 -13.2 -14.0 -14.9 -16.9 8.3 8.3 13.5 13.9 14.3 11.0 10.9 11.2 11.5 11.8 12.1 66.9
Dividend 30% 0.0 0.0 0.0 0.0 0.0 2.5 2.5 4.0 4.2 4.3 3.3 3.3 3.4 3.4 3.5 3.6 38.0
Net Profit/Loss -0.7 -13.2 -14.0 -14.9 -16.9 5.8 5.8 9.4 9.7 10.0 7.7 7.6 7.8 8.0 8.2 8.4 28.9
Appendix 2 (e)

Cloete
34 UNU-Fisheries Training Proramme
Cash Flow
2009 2010 2011 2012 2013 2014 2015 2016 2017 2018 2019 2020 2021 2022 2023 2024 T ota l
Cash Flow
Opera ting Surplus (EBIT DA) 0 -4.3 -5.07 -6.04 -7.97 17.2 17.2 17.2 17.2 17.2 17.2 17.2 17.2 17.2 17.2 17.2 149
Debtor Changes 0.0 0 0 0 -7 0 0 0 0 0 0 0 0 0 0 -7
Creditor Changes 0.1 0 0 0 1 0 0 0 0 0 0 0 0 0 0 1
Cash Flow be fore T ax 0 -4.2 -5 -5.89 -7.68 10.5 17.2 17.2 17.2 17.2 17.2 17.2 17.2 17.2 17.2 17.2 143
Paid Taxes 0.0 0 0 0 0 0 0 0 0 0 4 4 4 4 5 21
Cash Flow a fte r T ax 0 -4.2 -5 -5.89 -7.68 10.5 17.2 17.2 17.2 17.2 17.2 13.5 13 12.9 12.7 12.6 126
Financial Costs (Interest + LMF) 1 4.1 4 4 4 4 4 4 3 3 2 2 2 1 1 0 43
Repayment 0 0.0 0 0 0 0 4 4 4 4 4 4 4 4 4 4 37
Free (Ne t) Cash Flow -1 -8.3 -9 -10 -12 6 9 10 10 11 11 8 8 8 8 9 58
Paid Dividend 0.0 0 0 0 0 2 2 4 4 4 3 3 3 3 4 31
Financing - Expenditure (WCap) 40 40
Cash Movement 39 -8.3 -9 -10 -12 6 7 7 6 6 7 4 4 5 5 5 58
Appendix 2 (f): Profitability sheet

Cloete
35 UNU-Fisheries Training Proramme
Profitability
2009 2010 2011 2012 2013 2014 2015 2016 2017 2018 2019 2020 2021 2022 2023 2024 T ota l
Profitability Measurements
NPV and IRR of T ota l Cash Flow 66
Cash Flow after Taxes 0 -4 -5 -6 -8 11 17 17 17 17 17 13 13 13 13 13 138
Loans -37 -37
Equity -37 -37
T ota l Cash Flow & Capita l -74 -4 -5 -6 -8 11 17 17 17 17 17 13 13 13 13 79 130
NPV Total Cash Flow 15% -74 -78 -82 -86 -90 -85 -77 -71 -65 -60 -56 -53 -51 -49 -47 -37
IRR Total Cash Flow 0% 0% 0% 0% 0% 0% 0% -13% -7% -3% 0% 2% 3% 4% 5% 9%
NPV and IRR of Ne t Cash Flow
Free (Net) Cash Flow -1 -8 -9 -10 -12 6 9 10 10 11 11 8 8 8 8 75 124
Equity -37 -37
Free (Ne t) Cash Flow & Equity -38 -8 -9 -10 -12 6 9 10 10 11 11 8 8 8 8 75 87
NPV Net Cash Flow 15% -38 -45 -52 -59 -65 -62 -58 -54 -51 -48 -45 -44 -42 -41 -40 -30
IRR Net Cash Flow 0% 0% 0% 0% 0% 0% 0% 0% 0% -8% -4% -2% -1% 1% 2% 8%


![The Novel ABALONE Photosensor Technology - sensl.comsensl.com/.../irp/2017_Ferenc_The_Novel_ABALONE_Photosensor_Technology.pdf · The novel ABALONE Photosensor Technology [1] has](https://static.cupdf.com/doc/110x72/5d5a3f8888c993d7478bb96c/the-novel-abalone-photosensor-technology-sensl-the-novel-abalone-photosensor.jpg)