Pavement Management ProgramPavement Management ProgramMaintenance DivisionMaintenance Division
Local Assistance DivisionLocal Assistance Division
Local Government Workgroup MeetingLocal Government Workgroup Meeting
January 10January 10thth, 2012, 2012
Presentation Topics
• Pavement data collection program at VDOT
• Scope and how the data is collected
• What distresses are collected
• How data is summarized
• QA of the data
• Brief discussion on the Pavement Management System• Brief discussion on the Pavement Management System
• Uses of pavement condition data in VDOT
• Demonstration of the data viewing software (Ivision)
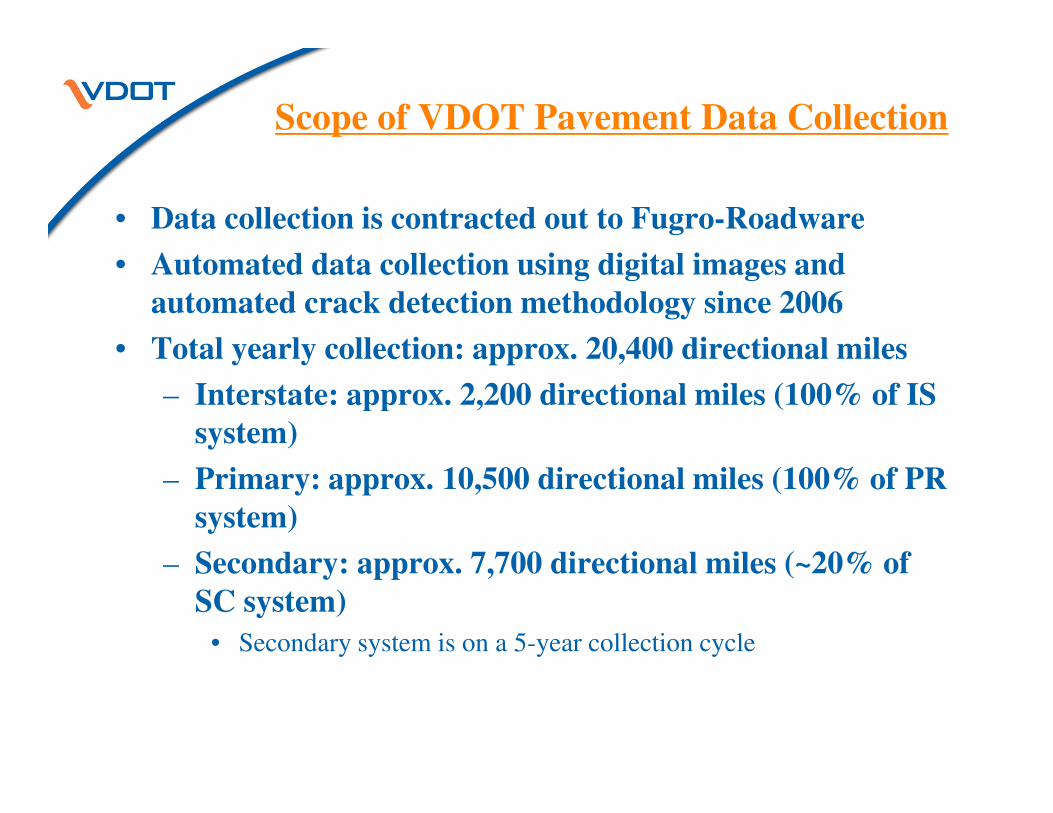
Scope of VDOT Pavement Data Collection
• Data collection is contracted out to Fugro-Roadware
• Automated data collection using digital images and
automated crack detection methodology since 2006
• Total yearly collection: approx. 20,400 directional miles
– Interstate: approx. 2,200 directional miles (100% of IS – Interstate: approx. 2,200 directional miles (100% of IS
system)
– Primary: approx. 10,500 directional miles (100% of PR
system)
– Secondary: approx. 7,700 directional miles (~20% of
SC system)
• Secondary system is on a 5-year collection cycle

Data Collection Vehicle
Automatic Road Analyzer (ARAN)
•Image recognitionsoftware
•Strobe-litpavement video
•Roughness•Texture•Rutting•Surface Distress•Ground Penetrating
Pavement
•Single view•Panoramic view•1300 x 1030 pixel•1920 x 1080 (HDTV)•Direct-to-digital•Custom angles
Photolog
•Inventory fromimagery
•Location determined•Offset measured•Height and widthmeasured
•Sign code recorded•Condition assessment
Assets
•Ground Penetrating Radar
•Inertial measurement unit•HPMS curve type•Long. Grade•Cross slope•Centerline mapping•Spatial referencing for GIS integration
Geometry & Spatial
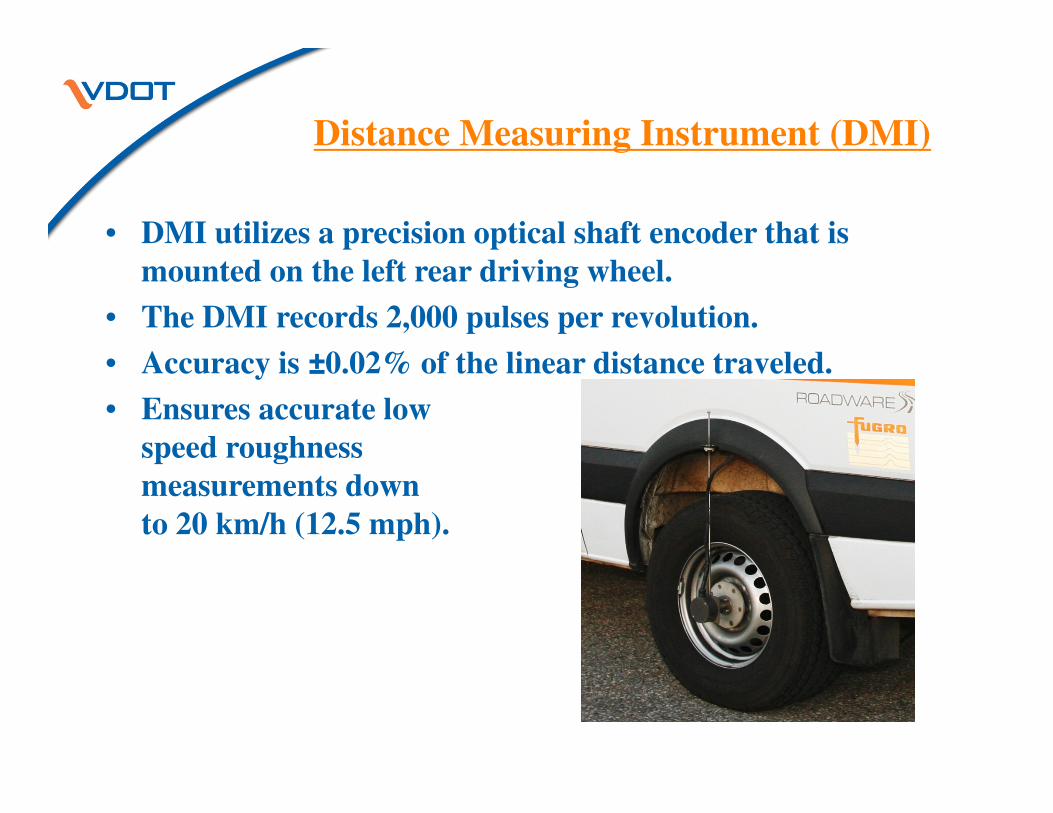
Distance Measuring Instrument (DMI)
• DMI utilizes a precision optical shaft encoder that is
mounted on the left rear driving wheel.
• The DMI records 2,000 pulses per revolution.
• Accuracy is ±0.02% of the linear distance traveled.
• Ensures accurate low• Ensures accurate low
speed roughness
measurements down
to 20 km/h (12.5 mph).
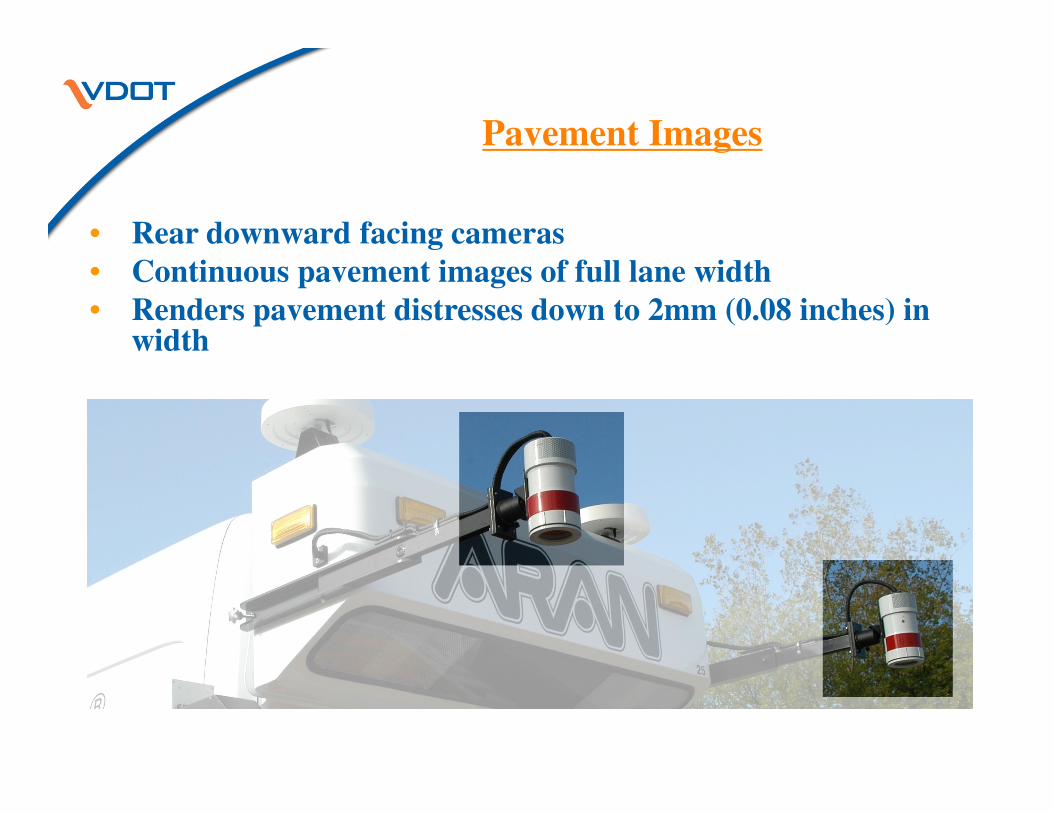
Pavement Images
• Rear downward facing cameras
• Continuous pavement images of full lane width
• Renders pavement distresses down to 2mm (0.08 inches) in width
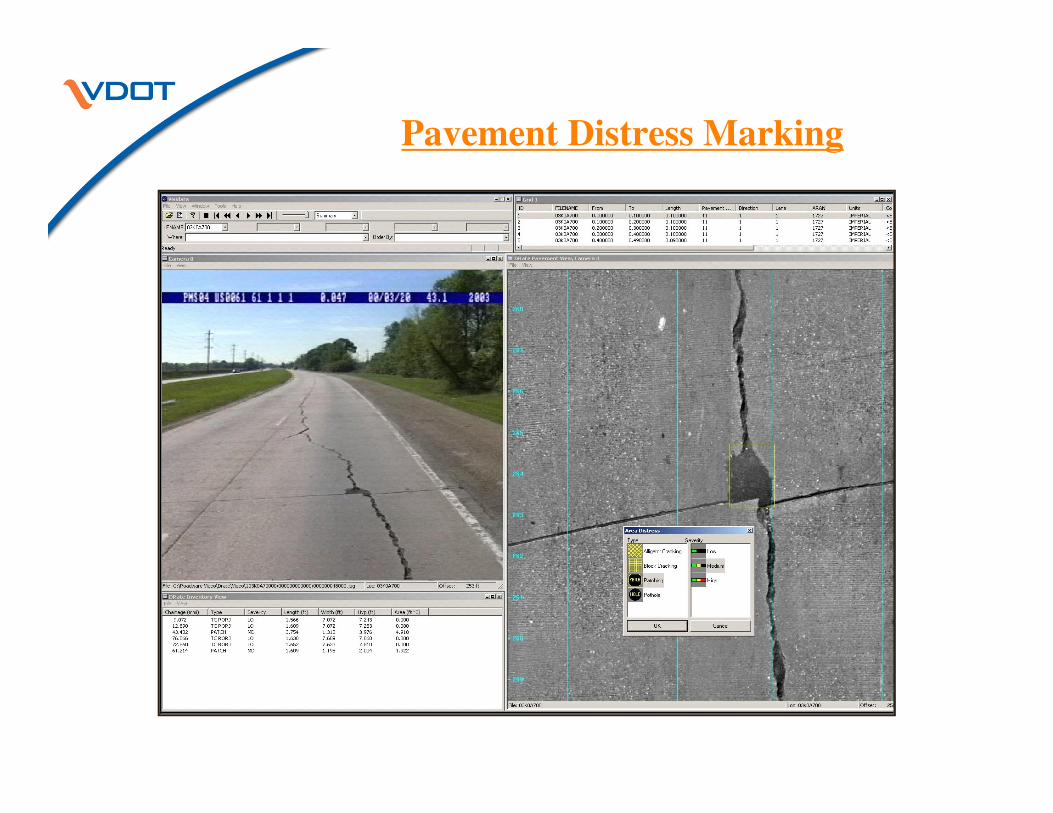
Pavement Distress Marking
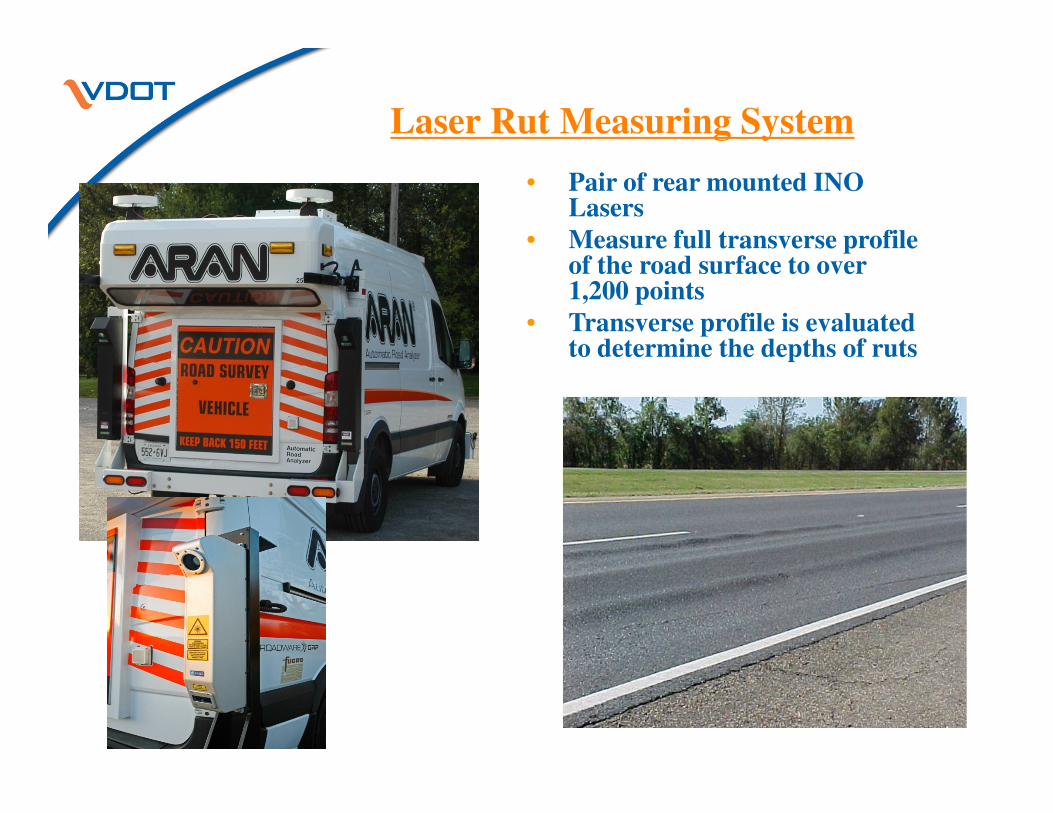
Laser Rut Measuring System
• Pair of rear mounted INO Lasers
• Measure full transverse profile of the road surface to over 1,200 points
• Transverse profile is evaluated to determine the depths of ruts

International Roughness Index (IRI)
• Laser SDP System
• 16 kHz laser in each
wheelpath
• Measures continuous
longitudinal profile of the
roadwayroadway

High Definition Right of Way Images
• True High Definition 1920 x 1080
CCD Camera
• Wide angle High Definition images
• A single image every 21 feet
(variable)
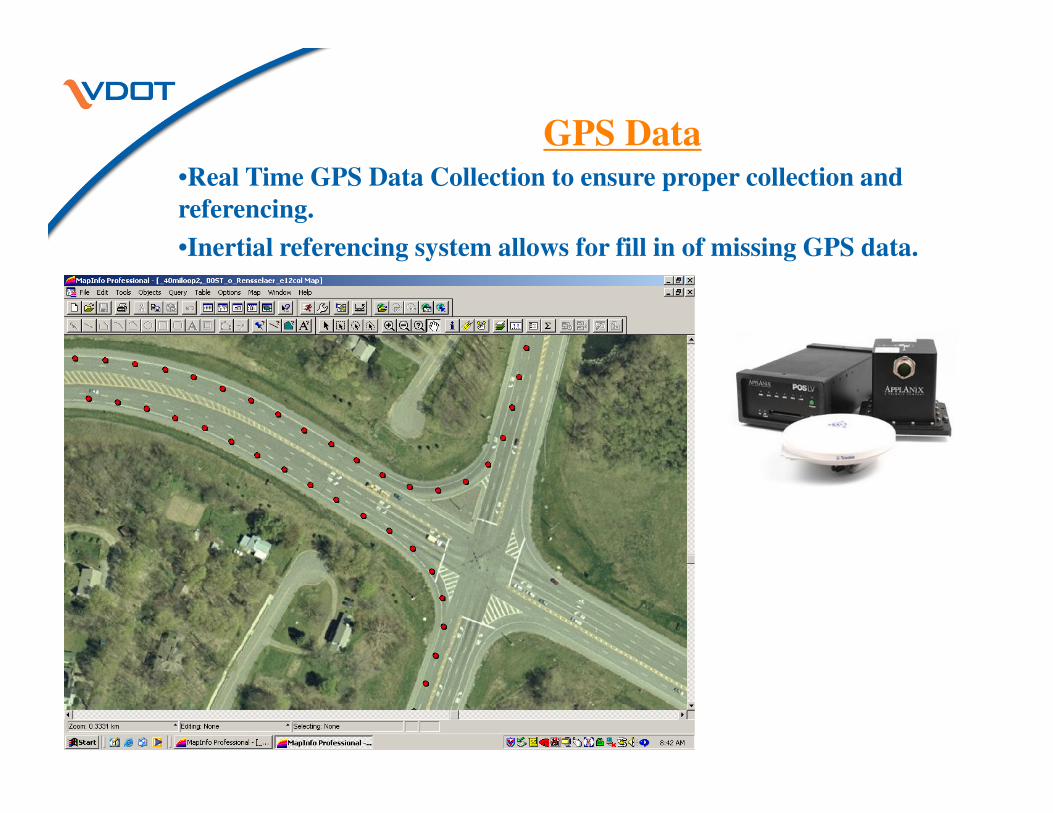
GPS Data•Real Time GPS Data Collection to ensure proper collection and
referencing.
•Inertial referencing system allows for fill in of missing GPS data.
Production Data: Data Collection Schedule
• VDOT’s Data Delivery Schedule– Collection Begins: November
• End of the paving season:
– Condition data reflects recent paving work
– Lane closures/deviations associated with construction are avoided
– Delivery of Condition Data• Interstate: April 15th• Interstate: April 15
• Primary: May 15th
• Secondary: June 15th
• Challenges– Weather Delays
• Data collection in NOVA and western Virginia difficult during winter months
– Sand/salt application; damp pavement; excessive rain
– GIS Network Definition• Accuracy of network data is critical for processing
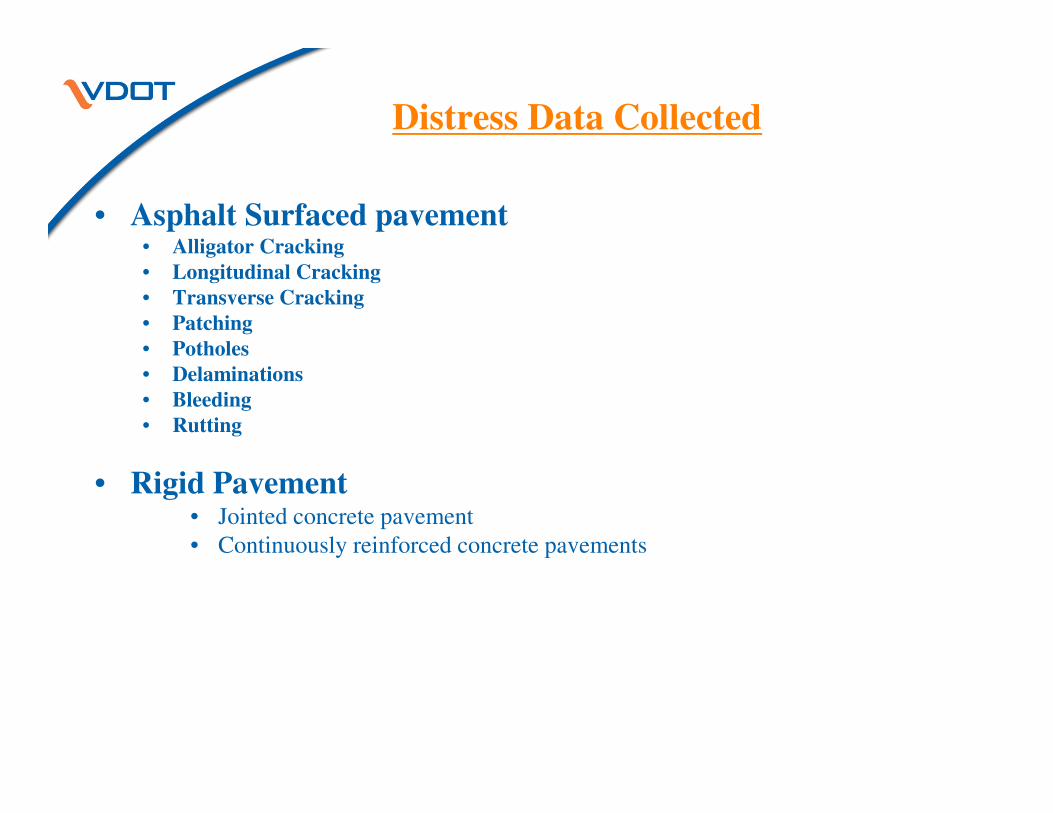
Distress Data Collected
• Asphalt Surfaced pavement• Alligator Cracking
• Longitudinal Cracking
• Transverse Cracking
• Patching
• Potholes
• Delaminations
• Bleeding• Bleeding
• Rutting
• Rigid Pavement• Jointed concrete pavement
• Continuously reinforced concrete pavements
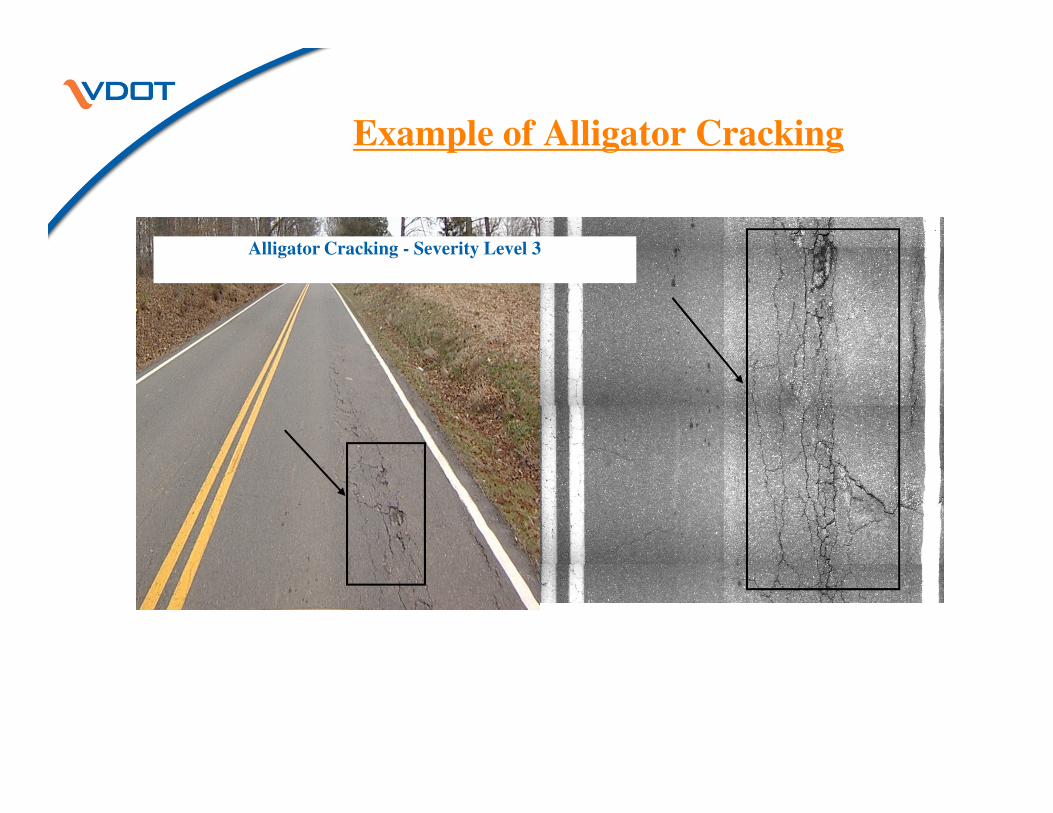
Example of Alligator Cracking
Alligator Cracking - Severity Level 3
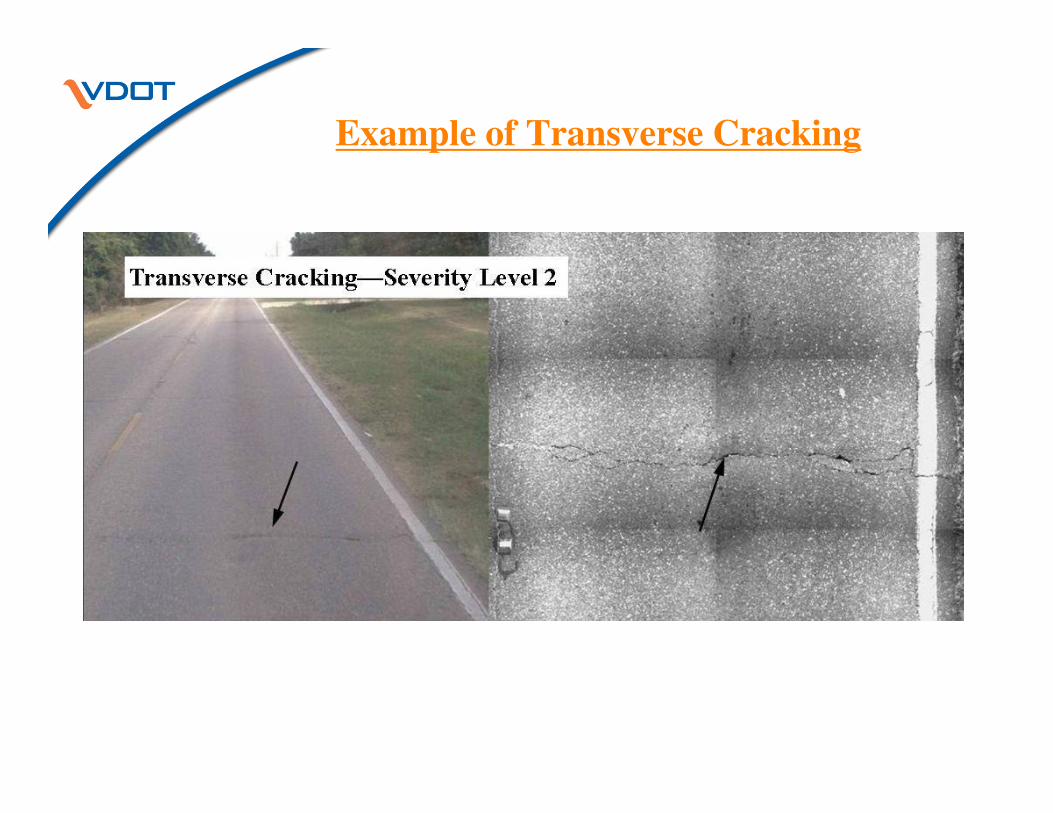
Example of Transverse Cracking
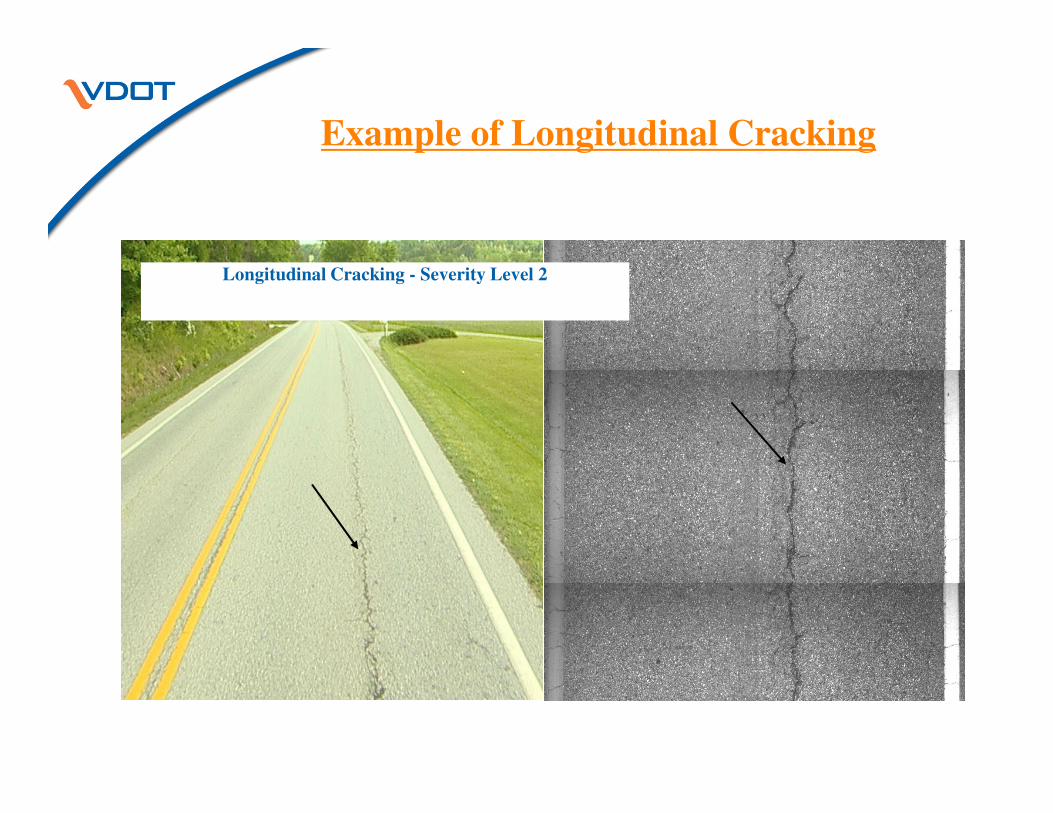
Example of Longitudinal Cracking
Longitudinal Cracking - Severity Level 2
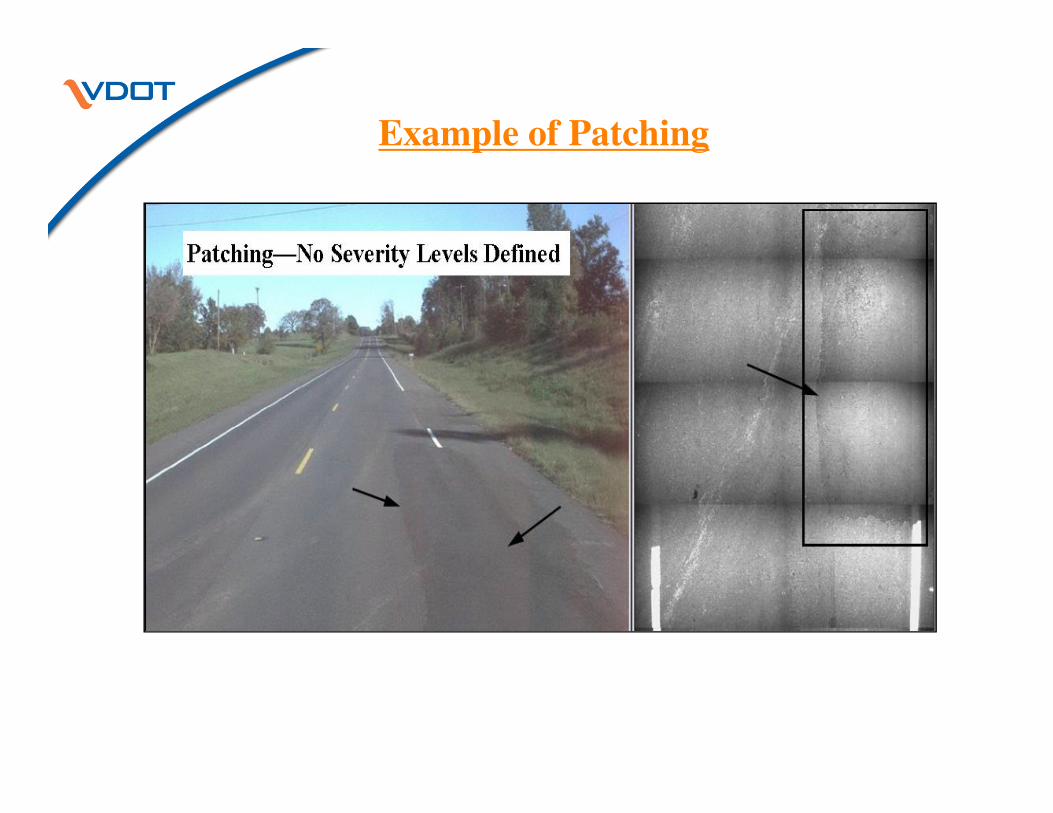
Example of Patching
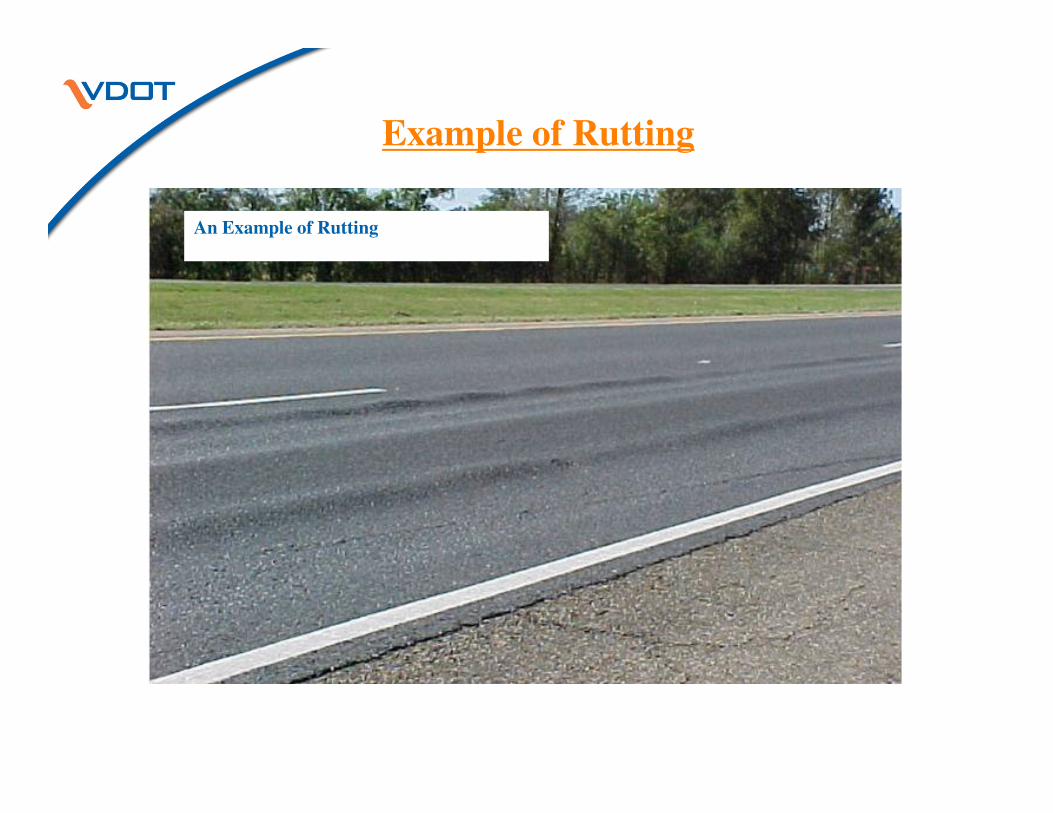
Example of Rutting
An Example of Rutting
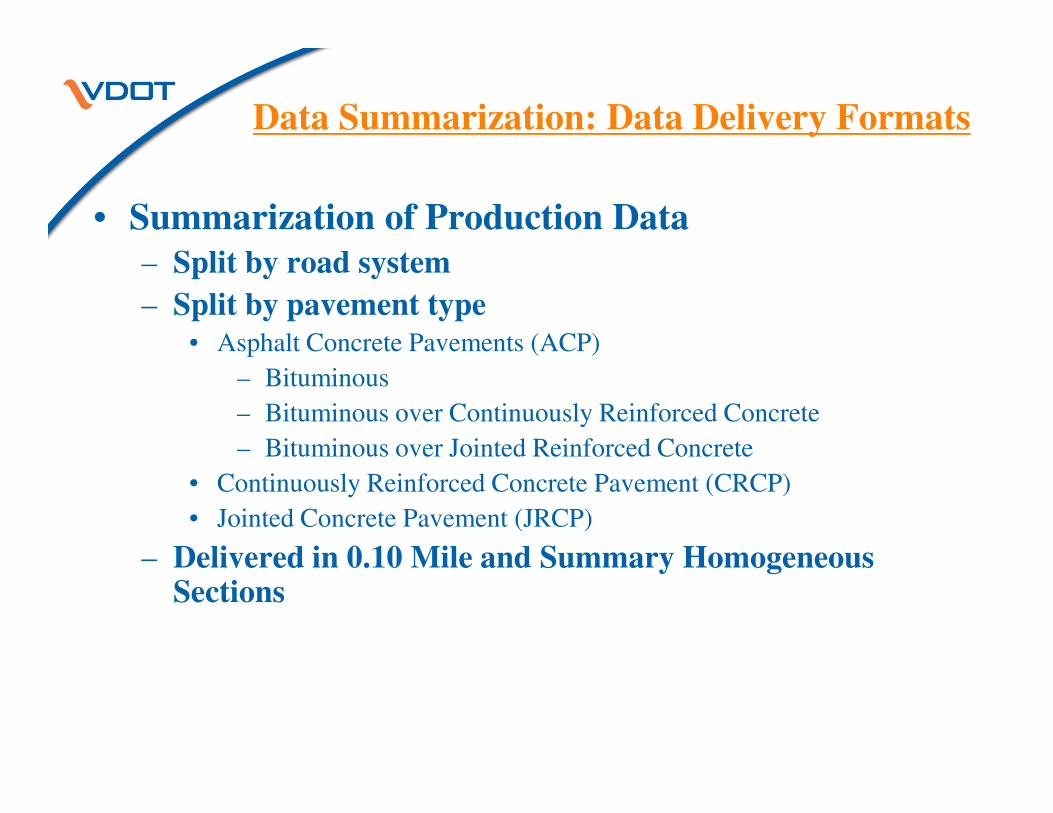
Data Summarization: Data Delivery Formats
• Summarization of Production Data
– Split by road system
– Split by pavement type
• Asphalt Concrete Pavements (ACP)
– Bituminous
– Bituminous over Continuously Reinforced Concrete– Bituminous over Continuously Reinforced Concrete
– Bituminous over Jointed Reinforced Concrete
• Continuously Reinforced Concrete Pavement (CRCP)
• Jointed Concrete Pavement (JRCP)
– Delivered in 0.10 Mile and Summary Homogeneous Sections
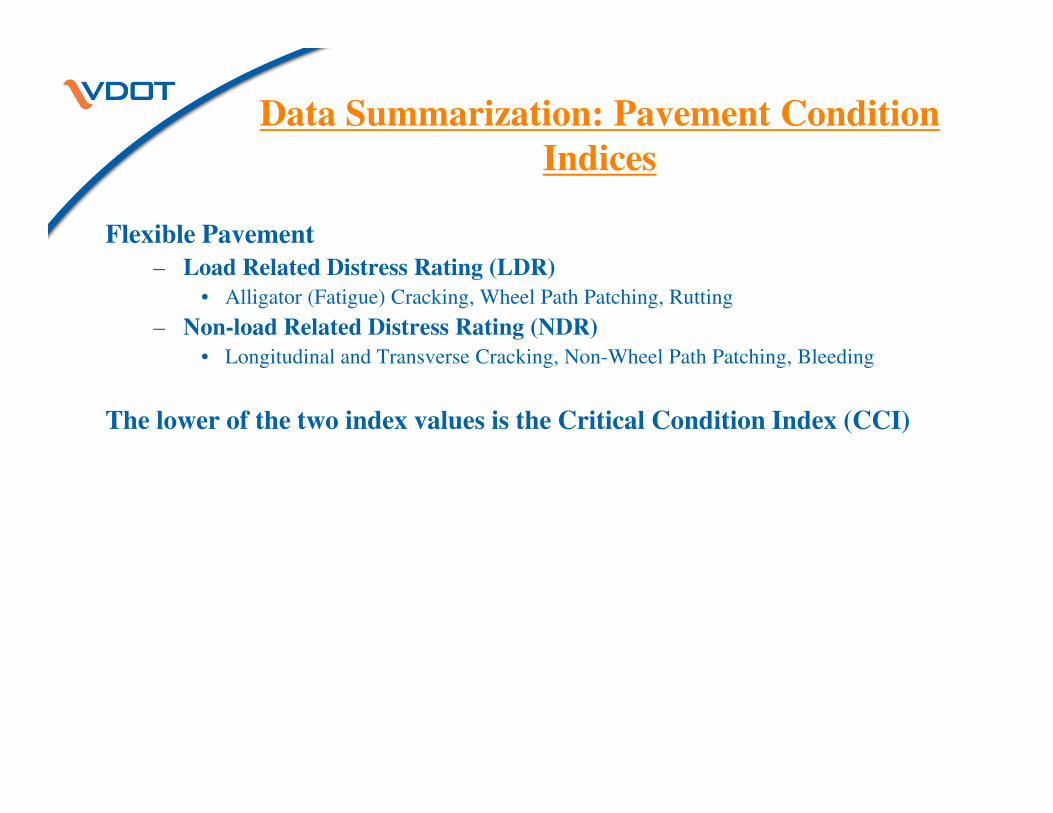
Data Summarization: Pavement Condition
Indices
Flexible Pavement
– Load Related Distress Rating (LDR)
• Alligator (Fatigue) Cracking, Wheel Path Patching, Rutting
– Non-load Related Distress Rating (NDR)
• Longitudinal and Transverse Cracking, Non-Wheel Path Patching, Bleeding
The lower of the two index values is the Critical Condition Index (CCI) The lower of the two index values is the Critical Condition Index (CCI)
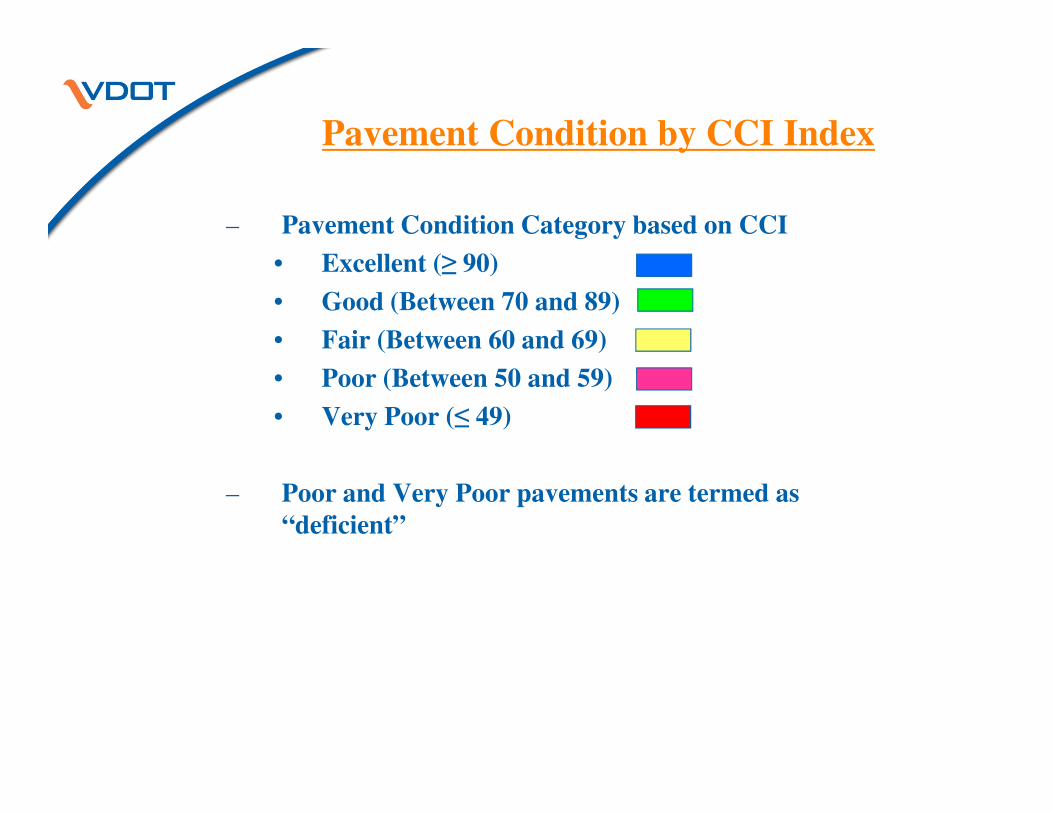
Pavement Condition by CCI Index
– Pavement Condition Category based on CCI
• Excellent (≥ 90)
• Good (Between 70 and 89)
• Fair (Between 60 and 69)
• Poor (Between 50 and 59)
• Very Poor (≤ 49) • Very Poor (≤ 49)
– Poor and Very Poor pavements are termed as
“deficient”
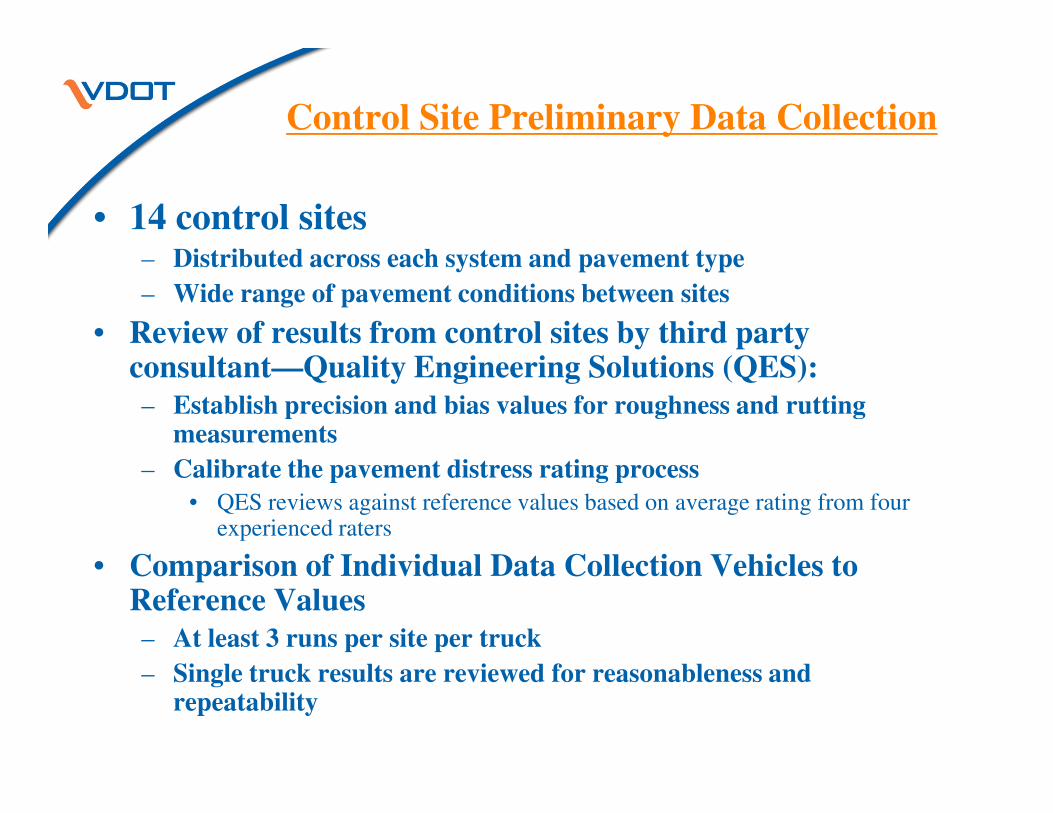
Control Site Preliminary Data Collection
• 14 control sites– Distributed across each system and pavement type
– Wide range of pavement conditions between sites
• Review of results from control sites by third party consultant—Quality Engineering Solutions (QES):
– Establish precision and bias values for roughness and rutting – Establish precision and bias values for roughness and rutting measurements
– Calibrate the pavement distress rating process
• QES reviews against reference values based on average rating from four experienced raters
• Comparison of Individual Data Collection Vehicles to Reference Values
– At least 3 runs per site per truck
– Single truck results are reviewed for reasonableness and repeatability
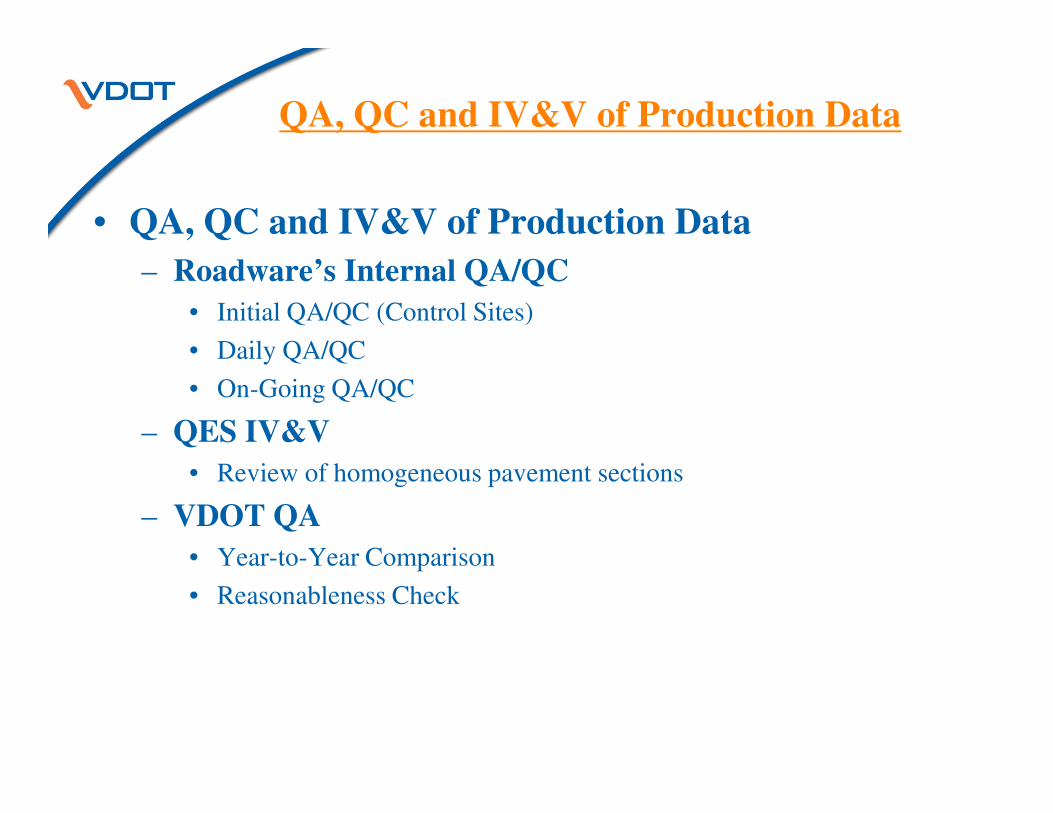
QA, QC and IV&V of Production Data
• QA, QC and IV&V of Production Data
– Roadware’s Internal QA/QC
• Initial QA/QC (Control Sites)
• Daily QA/QC
• On-Going QA/QC
– QES IV&V
• Review of homogeneous pavement sections
– VDOT QA
• Year-to-Year Comparison
• Reasonableness Check
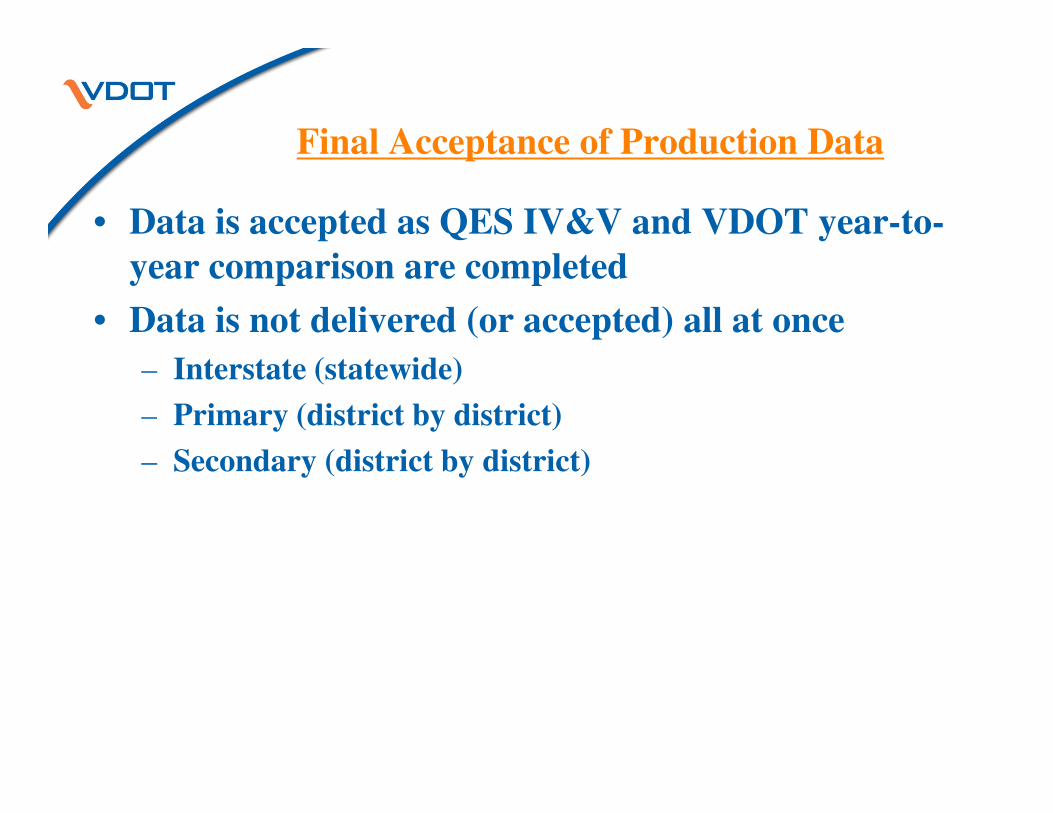
Final Acceptance of Production Data
• Data is accepted as QES IV&V and VDOT year-to-
year comparison are completed
• Data is not delivered (or accepted) all at once
– Interstate (statewide)
– Primary (district by district)– Primary (district by district)
– Secondary (district by district)
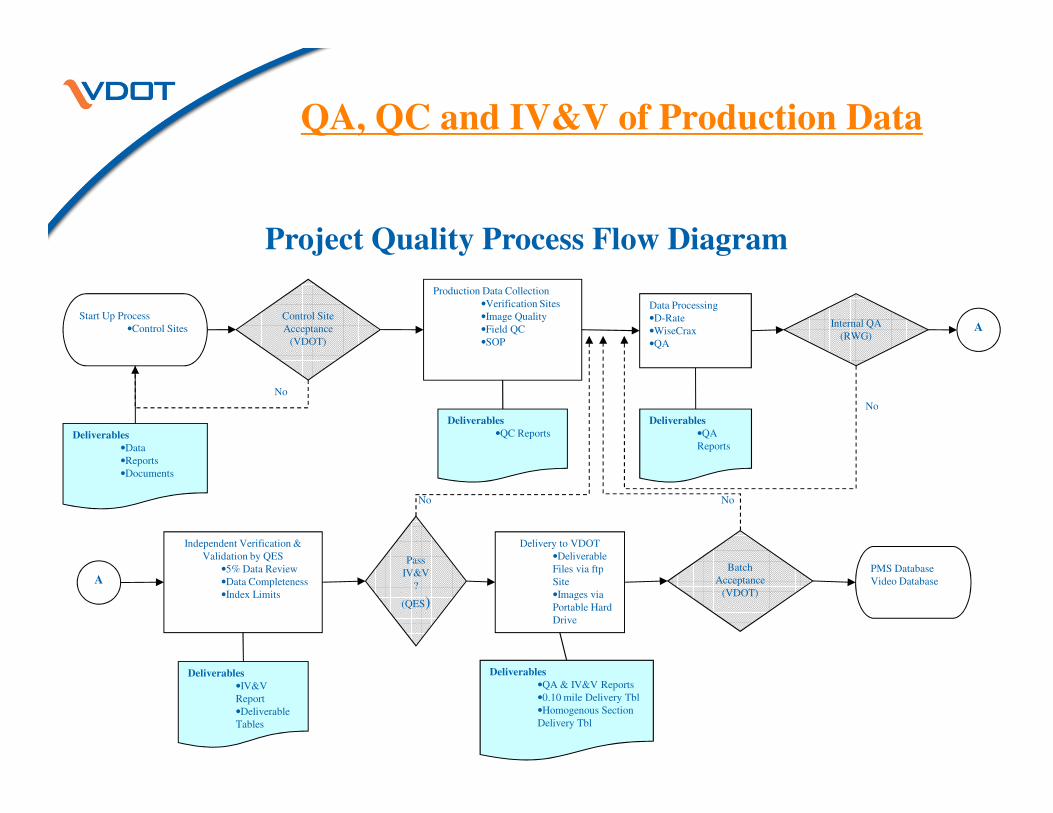
QA, QC and IV&V of Production Data
No
No
Start Up Process
•Control Sites
Control Site
Acceptance
(VDOT)
Production Data Collection
•Verification Sites
•Image Quality
•Field QC
•SOP
Data Processing
•D-Rate
•WiseCrax
•QA
Internal QA
(RWG)A
Project Quality Process Flow Diagram
NoNo
No
Independent Verification &
Validation by QES
•5% Data Review
•Data Completeness
•Index Limits
Pass
IV&V
?
(QES)
Delivery to VDOT
•Deliverable
Files via ftp
Site
•Images via
Portable Hard
Drive
Batch
Acceptance
(VDOT)
Deliverables
•QC ReportsDeliverables
•Data
•Reports
•Documents
Deliverables
•QA
Reports
PMS Database
Video DatabaseA
Deliverables
•IV&V
Report
•Deliverable
Tables
Deliverables
•QA & IV&V Reports
•0.10 mile Delivery Tbl
•Homogenous Section
Delivery Tbl

Pavement Management System (PMS)
• A tool to store, analyze, summarize and report data
• Serves as a repository of inventory, history and
condition data
• Used to identify M&R needs
• Used to develop budget requirements• Used to develop budget requirements
• Used to answer where, when and what treatments
are needed
• Used to export files for displaying maps in GIS
Data Reporting and Use
• State of the Pavement Report and GIS maps
• Legislative reports on Infrastructure System Condition
• Report to CTB by the Commissioner
• HPMS data reporting to FHWA
• Report to the Dashboard• Report to the Dashboard
• Prepare yearly paving schedule
• Performance measure for districts
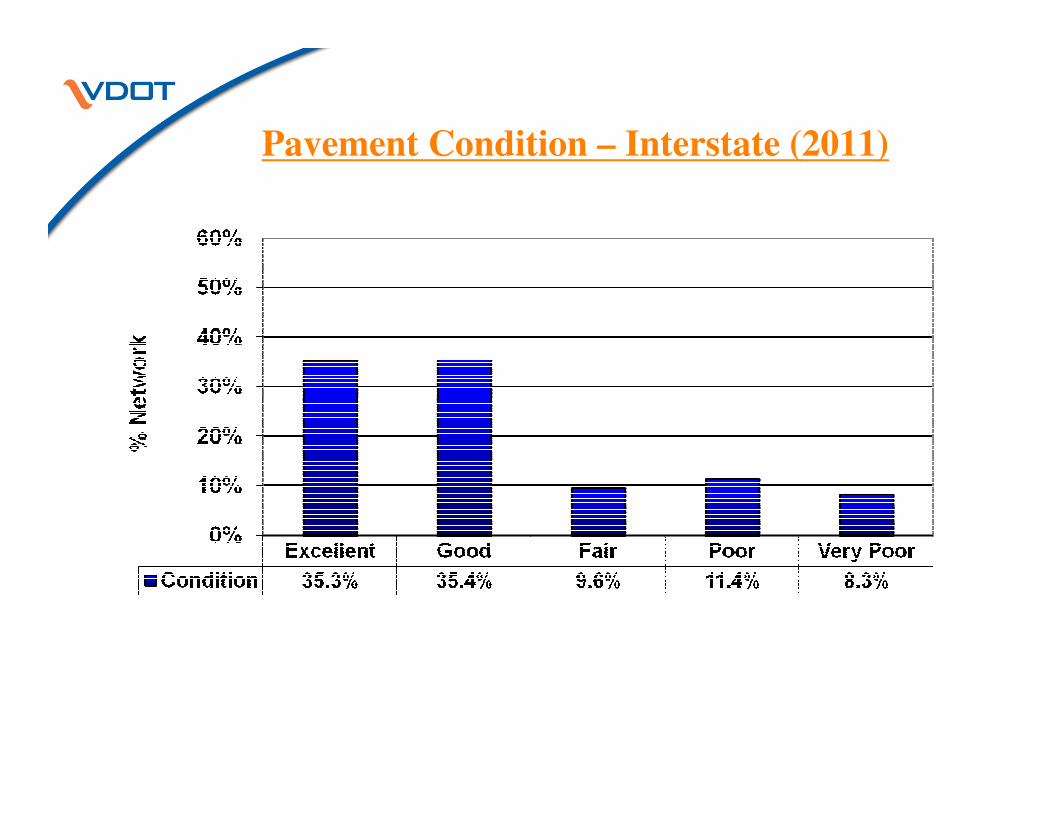
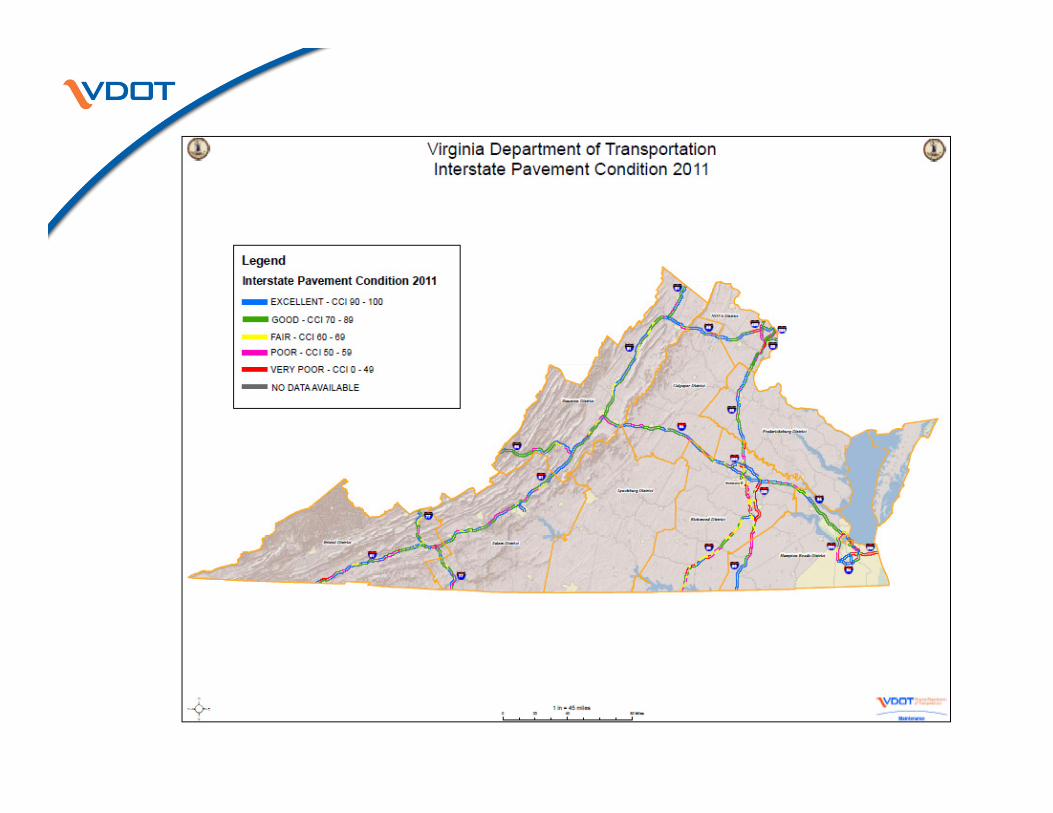
Pavement Condition – Interstate (2011)
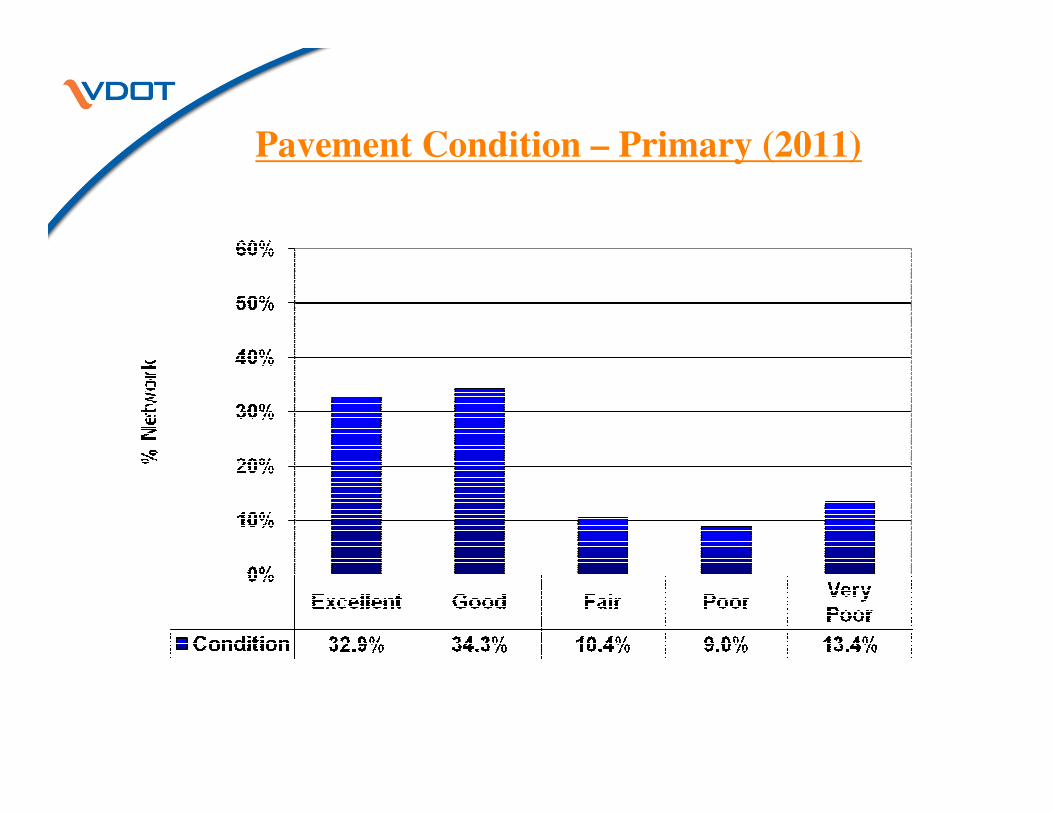
Pavement Condition – Primary (2011)
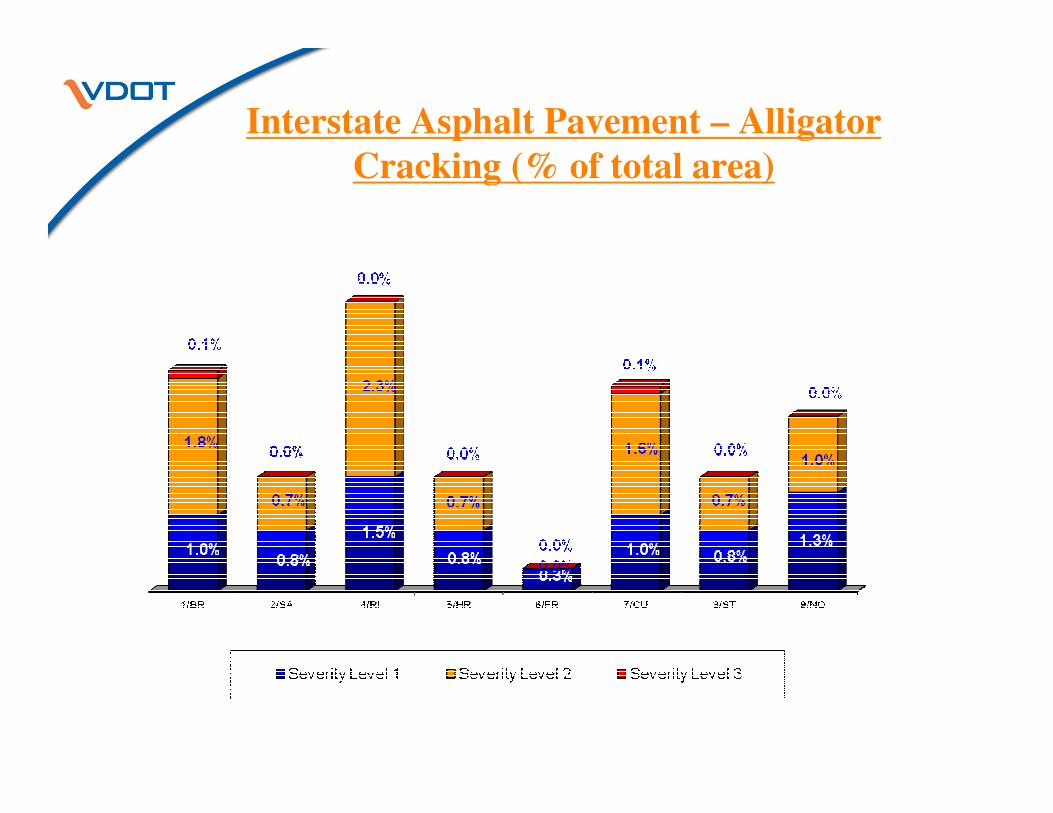
Interstate Asphalt Pavement – Alligator
Cracking (% of total area)
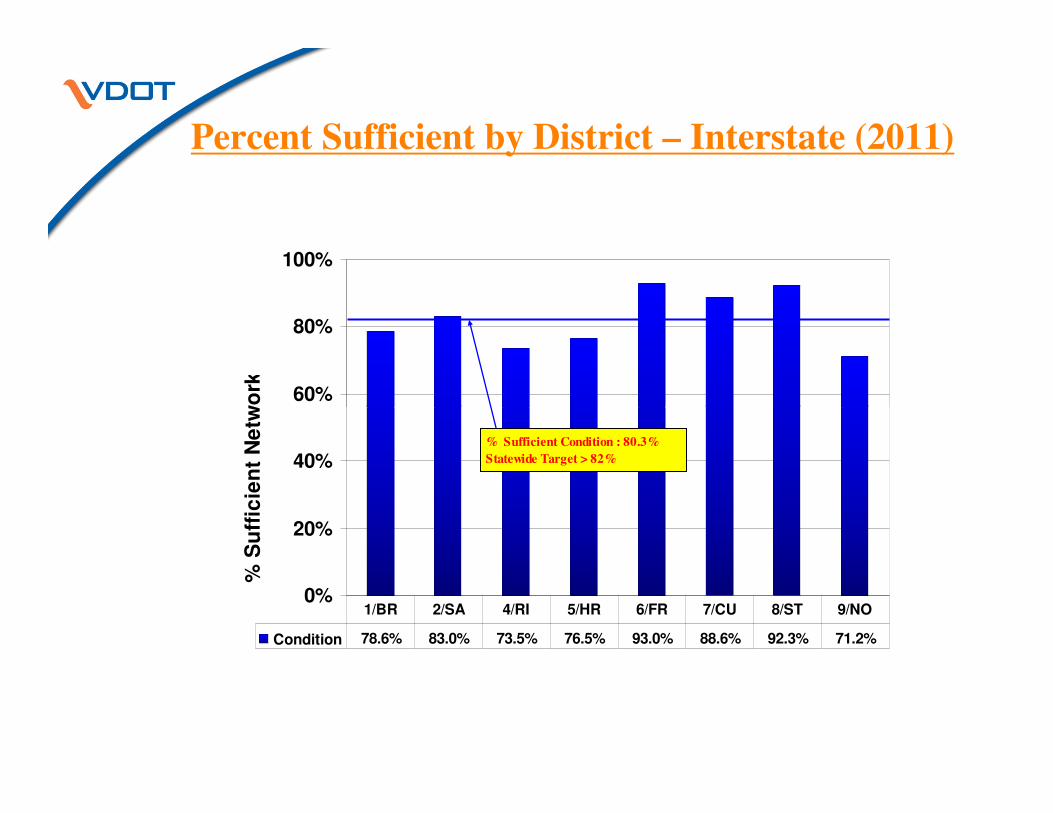
Percent Sufficient by District – Interstate (2011)
60%
80%
100%%
Su
ffic
ien
t N
etw
ork
0%
20%
40%
% S
uff
icie
nt
Ne
two
rk
Condition 78.6% 83.0% 73.5% 76.5% 93.0% 88.6% 92.3% 71.2%
1/BR 2/SA 4/RI 5/HR 6/FR 7/CU 8/ST 9/NO
% Sufficient Condition : 80.3%
Statewide Target > 82%
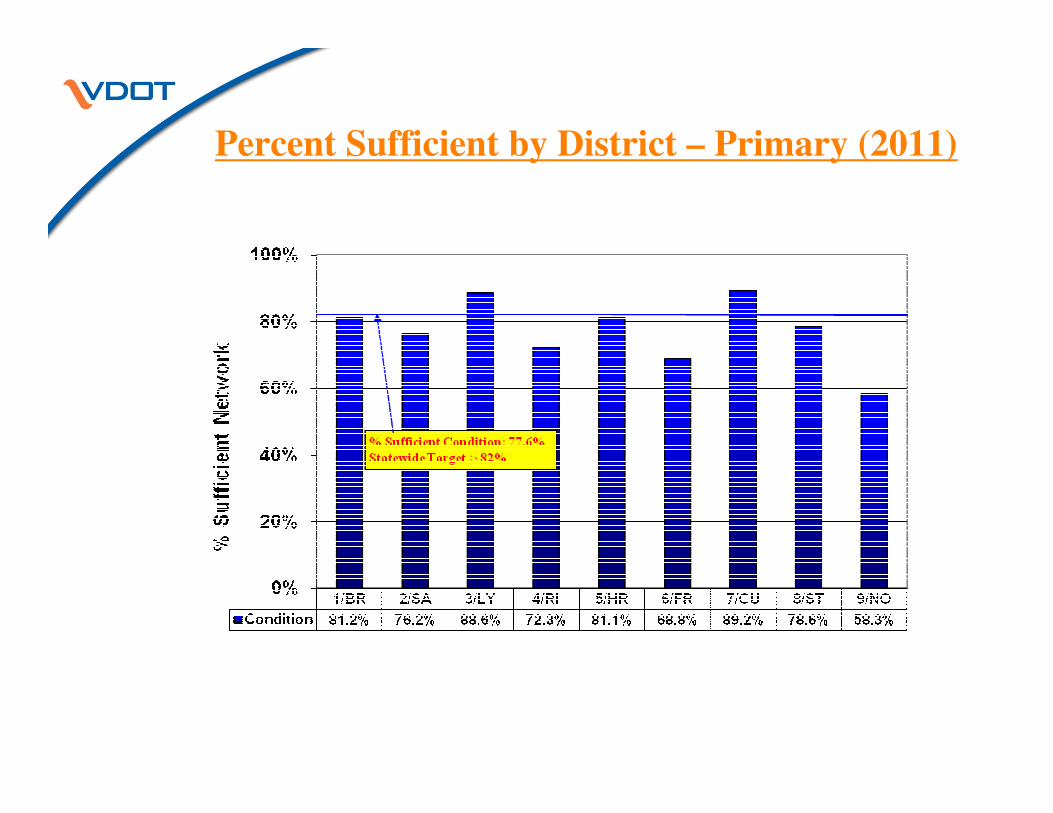
Percent Sufficient by District – Primary (2011)
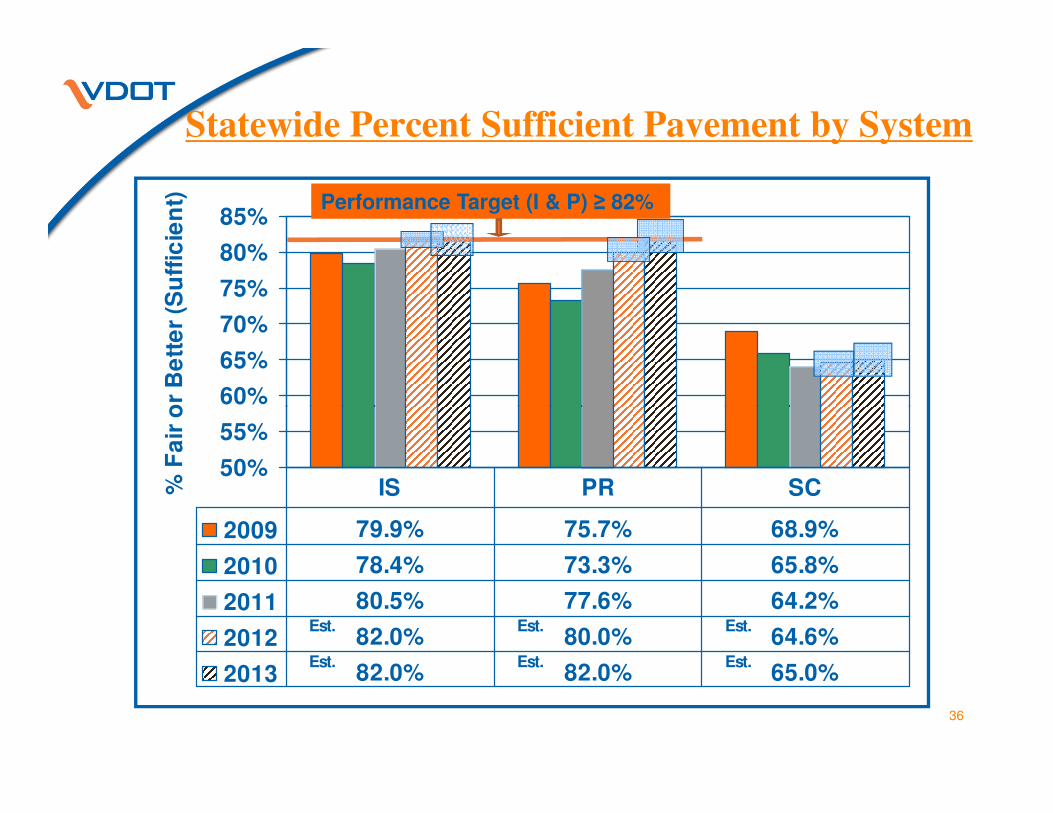
Statewide Percent Sufficient Pavement by System
60%
65%
70%
75%
80%
85%
% F
air
or
Be
tte
r (S
uff
icie
nt) Performance Target (I & P) ≥ 82%
36
50%
55%
60%
% F
air
or
Be
tte
r (S
uff
icie
nt)
2009 79.9% 75.7% 68.9%
2010 78.4% 73.3% 65.8%
2011 80.5% 77.6% 64.2%
2012 82.0% 80.0% 64.6%
2013 82.0% 82.0% 65.0%
IS PR SC
Est.
Est.
Est.
Est. Est.
Est.

Data Viewing Software
Data Viewing Software: IVision
http://ivisionhttp://ivision