The Affordable Care Act
An American Story
John J. Sarno, Esq.
Employers Association of New Jersey
www.eanj.org
1

Patient Protection and Affordable
Care Act
March 23, 2010
A New Era for America2

U.S. Supreme court heard oral argument on the
constitutionality of the Affordable Care Act on
March 26-28, 2012
3

NFIB v. SebeliusU.S. Supreme Court (2012)
Personal Mandate exceeds Congress’ power to
regulate commerce but is a valid tax
4
U.S. Health Care Spending
About 18% of the U.S. economy (in 1950, 5%)
Estimated $2.90 trillion in 2013
Most health care spending per capita in the world
5

6
Health Care Outcomes – U.S.
33rd among developed nations in infant mortality
(6.3/1,000)
50th in life-expectancy (78-years)

7
Estimated 46 million Americans lack health
care insurance (17% of U.S. population)
The Uninsured

8
9
Employer-Plan Crisis
Premiums have grown 4-times faster than
wages since 1999.
Average employee contribution has gone up
200% since 2000.
Out-of-pocket and co-payments have gone
up 115% since 2000.
Five Pillars of Reform
Insurance Reform
Consumer Protections
Personal Mandate
Subsidized Coverage
Health Insurance Marketplace (Exchange)
10

Insurance Reform
High-risk pool created (2010)
Dependent coverage to age 26 (2010)
Children with pre-existing conditions cannot be denied coverage (2010)
No denial for pre-existing conditions eliminated (2014)
No Charge for annual wellness visit (2014)
Guaranteed issue policy (2014)
Modified community ratio (2014)
80 – 85% medical loss ratio (2014)
Long-term insurance program (2014)
No pre-existing condition exclusions (2014)
11

All Plans Must Provide
Essential Health Benefits
“Essential Health Benefits” requires minimum set of benefits, with no lifetime of annual coverage limits
Ambulatory patient services
Emergency services
Hospitalization
Maternity and newborn care
Mental health and substance abuse coverage
Prescription drugs
Rehab services and medical devices
Preventative and wellness/chronic disease management
12
“Free” Preventive Care
No Co-Pays
No Out-Of-Pockets
No Deductibles
13

Health Delivery Reforms
Research on best provider practices
Research on comparative evidence outcomes
Pilot program that pays for outcomes on flat fee
basis rather than fee for service for treatments
Medical IT
Standards for extended living arrangements
Hospice, home-health reimbursement
14
15
Community Investment
Health Care Clinics
Primary Care Training
Grants to States
Diversity and Cultural Competency
Education Curricula Development in Health Sciences
Food Labeling

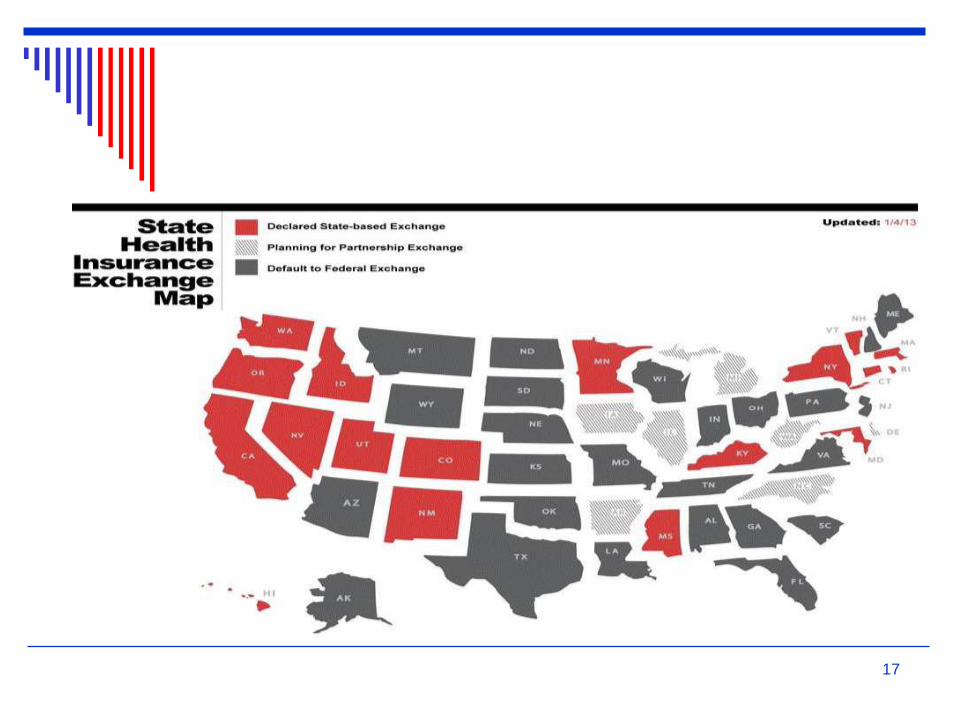
The Health Insurance Exchange
Healthcare.gov
Uninsured individuals not eligible for Medicare or Medicaid will be permitted to purchase insurance through state Exchanges (purchasing pools).
Individuals will be eligible for subsidies.
Employers with fewer than 100 employees will be permitted to enroll.
Employer eligibility may be expanded in 2017.
16
17
NJ Insurance Carriers
Horizon Blue Cross Blue Shield
AmeriHealth
United Healthcare
Health Republic of NJ
Oscar Insurance
18

Exchange Enrollment – N.J.
March, 2015
254,316 enrolled
23% - 18 – 34
15% - 35 – 44
22% - 45 – 54
33% - 55 – 64
19

20
Subsidies – NJ
85% eligible for subsidies
$306 – average tax credit
$780 million in total subsidies

FamilyCare (Medicaid) – NJ
(2014)
396,000 enrollment
2.2 billion in Federal Funds
Only 40% of NJ doctors participate in the
program
21

Types of Plans
Bronze 60% of costs
Silver 70% of costs
Gold 80% of costs
Platinum 90% of costs
Most popular in NJ – Silver, mid-level
80% of enrollees pay $100 or less per
month
22

Problems
Narrow or Inadequate Provider Networks
Price (not eligible for subsidy)
“Family Glitch”
23

The Political Process:
Follow the Money
6 lobbyists for every member of
Congress
Insurance Industry - $100 million
Pharma - $110 million
Providers - $80 million
Hospitals - $90 million
Medical Device - $30 million
24

The pharmaceutical industry alone spent
over $600,000 per day in lobbying (2.3
lobbyists per member of Congress)
25

The process produced a 1,129 – page bill and
9,625 pages of regulations
26

New Revenue for Business
and Industry
$200 billion – Pharma
$205 billion – Hospitals
$102 billion – Insurance companies
$38 billion – Insurance industry
27

Taxes and Fees (10-years)
$240 billion insurance and medical
device industries
$280 billion Medicaid discounts given by
hospitals and pharma
28
Tax on Investment Income
3.8% surtax on net investment income for
singles earning adjusted income over
$200,000; couples - $250,000
$23 billion Medicare tax increase of 0.990 -
$6.5 billion
29

Early Results
17% - uninsured before ACA
13% - 2014
16.4 million more Americans insured
3.54 billion in subsidies
30

Cost and Revenues
(estimated)
$4,600 – per person, per year in taxes,
subsidies
4,900 – new revenue for 4 major
industries
31

32

“Large” Employer Penalty
(2015)
Employers with 100 or more “full-time” employees will be penalized for not offering coverage or coverage that does not meet standards.
All employees counted in a calendar month (part-time, temporary, seasonal).
“Full-time” employee is someone who is employed to perform services on average of 30-hrs per week or 120 hrs/month.
Part-time employees are grouped together to create “full-time” equivalents.
Aggregate number of hours worked by part-time workers in any month and divide by 120 to determine number of full-time equivalents.
33

Penalty for not offering insurance or to
less than 70% of full-time employees and
at least one FTE receives a subsidy to pay
for insurance on the Exchange
$2,000 per full-time employee after first 80 employees
34

Affordability
Full-time employee cannot pay more than 9.5% of household income for his/her share of premium for single coverage. Lowest cost plan.
Safeharbor: Employer may use W-2 income for employee. (Box 1)
Rate of Pay Safeharbor – Hourly rate multiplied by 130 hrs/month. Determine affordability using monthly premium based on monthly wage. For salaried employee, monthly wage can be used. Does not apply where wages were reduced during the year.
35

Auditing and Enforcement
U.S. Department of Treasury (IRS)
U.S. Department of HHS
U.S. Department of Labor
Combined databases – Form W-2, Form
5500, Social Security Administration
database.
36
Challenges – Escalating
Prices
Fee for service
Supply of doctors
Hospital consolidations
37

Potential Solution
Accountable Care Organization (ACO)
38

The Wildcard
King v. Burwell
Argued March 3, 2015
Expected decision: June 30, 2015
39

Questions?
40
Thank You


![The Patient Protection and Affordable Care Act [PPACA = ACA]](https://static.cupdf.com/doc/110x72/56813484550346895d9b6444/the-patient-protection-and-affordable-care-act-ppaca-aca.jpg)