Particle-Induced Pulmonary Acute Phase ResponseCorrelates with Neutrophil Influx Linking InhaledParticles and Cardiovascular RiskAnne Thoustrup Saber1*, Jacob Stuart Lamson1, Nicklas Raun Jacobsen1, Gitte Ravn-Haren2, Karin
Sørig Hougaard1, Allen Njimeri Nyendi1, Pia Wahlberg3, Anne Mette Madsen1, Petra Jackson1,
Hakan Wallin1,4, Ulla Vogel1,5
1 The National Research Centre for the Working Environment, Copenhagen, Denmark, 2 National Food Institute, Technical University of Denmark, Søborg, Denmark,
3 Danish Technological Institute, Taastrup, Denmark, 4 Institute of Public Health, University of Copenhagen, Copenhagen, Denmark, 5 Department of Micro- and
Nanotechnology, Technical University of Denmark, Lyngby, Denmark
Abstract
Background: Particulate air pollution is associated with cardiovascular disease. Acute phase response is causally linked tocardiovascular disease. Here, we propose that particle-induced pulmonary acute phase response provides an underlyingmechanism for particle-induced cardiovascular risk.
Methods: We analysed the mRNA expression of Serum Amyloid A (Saa3) in lung tissue from female C57BL/6J mice exposedto different particles including nanomaterials (carbon black and titanium dioxide nanoparticles, multi- and single walledcarbon nanotubes), diesel exhaust particles and airborne dust collected at a biofuel plant. Mice were exposed to single ormultiple doses of particles by inhalation or intratracheal instillation and pulmonary mRNA expression of Saa3 wasdetermined at different time points of up to 4 weeks after exposure. Also hepatic mRNA expression of Saa3, SAA3 proteinlevels in broncheoalveolar lavage fluid and in plasma and high density lipoprotein levels in plasma were determined in miceexposed to multiwalled carbon nanotubes.
Results: Pulmonary exposure to particles strongly increased Saa3 mRNA levels in lung tissue and elevated SAA3 proteinlevels in broncheoalveolar lavage fluid and plasma, whereas hepatic Saa3 levels were much less affected. Pulmonary Saa3expression correlated with the number of neutrophils in BAL across different dosing regimens, doses and time points.
Conclusions: Pulmonary acute phase response may constitute a direct link between particle inhalation and risk ofcardiovascular disease. We propose that the particle-induced pulmonary acute phase response may predict risk forcardiovascular disease.
Citation: Saber AT, Lamson JS, Jacobsen NR, Ravn-Haren G, Hougaard KS, et al. (2013) Particle-Induced Pulmonary Acute Phase Response Correlates withNeutrophil Influx Linking Inhaled Particles and Cardiovascular Risk. PLoS ONE 8(7): e69020. doi:10.1371/journal.pone.0069020
Editor: Rory Edward Morty, University of Giessen Lung Center, Germany
Received March 11, 2013; Accepted June 2, 2013; Published July 24, 2013
Copyright: � 2013 Saber et al. This is an open-access article distributed under the terms of the Creative Commons Attribution License, which permitsunrestricted use, distribution, and reproduction in any medium, provided the original author and source are credited.
Funding: The Danish Working Environment Research Fund supported the study (NanoKem, grant #20060068816 and NanoPlast, grant 22-2007-03 and DanishCentre for Nanosafety grant 20110092173/3). The funders had no role in study design, data collection and analysis, decision to publish, or preparation of themanuscript.
Competing Interests: The authors have declared that no competing interests exist.
* E-mail: [email protected]
Introduction
Inhalation of particles by air pollution, smoking and occupa-
tional exposure cause pulmonary inflammation and are risk factors
for cardiovascular disease [1,2]. The mechanisms by which
particles induce cardiovascular diseases are not well understood.
It is a generally held view that the particle-induced pulmonary
inflammation leads to release of cytokines into the circulation that
triggers a liver-mediated acute phase response which, in turn,
promotes cardiovascular disease [2–5].
The acute phase response is a systemic response to acute and
chronic inflammatory states caused by a variety of factors
including bacterial infections, trauma, and infarction [6]. Acute
phase response and the accompanying inflammatory response are
strongly associated to increased risk of cardiovascular disease in
epidemiological studies [7–9]. For example periodontal pathogen
infection and virus infections are associated with risk of
cardiovascular disease [10,11]. Blood levels of the acute phase
proteins C-Reactive Protein (CRP) and Serum Amyloid A (SAA)
are among the strongest known risk factors for cardiovascular
diseases in prospective studies [12]. An association between air
pollution and CRP levels has been observed in large cross-
sectional and prospective studies [13,14]. This indicates that
particle-induced inflammation and acute phase response may be
important for cardiovascular disease.
The acute phase response is characterised by up- and down
regulation of blood levels of a variety of proteins, termed acute
phase proteins, such as CRP, SAA and fibrinogen [6]. In mice,
PLOS ONE | www.plosone.org 1 July 2013 | Volume 8 | Issue 7 | e69020
Saa3 is expressed in various tissues including lung and liver
whereas Saa1 and Saa2 are considered liver specific [15]. In
humans, SAA3 is a pseudogene [16] and SAA1 and SAA2 are
expressed both hepatically and extra-hepatically [17]. CRP is
expressed to a very limited extent in mice [18].
We have previously demonstrated that inhalation and instilla-
tion of the carbon black nanoparticle Printex 90 (NanoCB), and
the titanium dioxide nanoparticle UV-Titan L181 (NanoTiO2)
induce long-lasting pulmonary inflammation [19–23]. Unexpect-
edly, this was not accompanied by a hepatic acute phase response
[19,24]: In contrast, both pulmonary exposure to NanoCB and
NanoTiO2 induced a strong pulmonary acute phase response
[19,25,26]. Thus, instillation of NanoCB lead to increased gene
expression of several acute phase genes including Saa3, Saa2, Saa1,
Metallothionein 2 (Mt2), Ceruloplasmin (Cp), Metallothionein 1 (Mt1),
Orosomucoid 2 (Orm2), Orosomucoid 1 (Orm1), and Complement
component 3 (C3) 24 hours after exposure [25]. Pulmonary exposure
to NanoTiO2 lead to increased expression of 44 acute phase genes
including Saa1, Saa2, Saa3,C3, Il1b, C-C motif chemokine 4 (Ccl4), C-C
motif chemokine 17 (Ccl17), Chemokine (C-X-C motif) ligand 5.
(Cxcl5), S100 calcium-binding protein A8 (S100a8), S100 calcium
binding protein A9 (S100A9), and NF-kappa-B inhibitor alpha
(Nfkbia) 24 hours after exposure with dose-dependency in both
the number of differentially expressed acute phase genes and the
observed expression fold [26]. For both particle exposures, Saa3
was the most differentially expressed gene in murine lung tissue
with 65-fold increase following NanoCB deposition [25] and up to
100-fold increase following NanoTiO2 deposition [26], one day
after intratracheal instillation of 162 mg of particles. Thus, we here
use pulmonary Saa3 gene expression in lung tissue as a biomarker
of pulmonary acute phase response because of the large dynamic
range in Saa3 gene expression.
We hypothesize that pulmonary deposition of particles in the
lung triggers long-lasting pulmonary induction of acute phase
proteins including Saa3 followed by lung secretion of acute phase
proteins including SAA3 into blood. We propose that pulmonary
acute phase response may constitute a direct link between particle
inhalation and risk of cardiovascular disease and that air pollution-
induced cardiovascular disease may thus be a direct consequence
of pulmonary secretion of acute phase proteins that are known to
affect many aspects of homeostasis such as plaque progression [27–
29] and endothelial function [30].
Methods
Ethics StatementThe experiments were approved by the Danish ‘‘Animal
Experiments Inspectorate’’ and carried out following their
guidelines for ethical conduct and care when using animals in
research.
MiceC57BL/CJ female mice M&B or BomTac from later Taconic
Denmark were used.
The virgin mice were allowed to acclimatize for 2 weeks and the
time-mated mice were received on gestation day 3 (day of plug
GD1). All mice were given food (Altromin 1324) and water ad
libitum. The mice were group housed in polypropylene cages with
sawdust bedding and enrichment (removed during nursing) at
controlled temperature 2161uC and humidity 50610% with a
12-h light:12-h dark cycle.
ParticlesThe following materials were used in this study: carbon black
(NanoCB), titanium dioxide (NanoTiO2), diesel exhaust particles
(DEP), multiwalled carbon nanotubes (MWCNT), single-walled
carbon nanotubes (SWCNT1 and SWCNT2) and airborne dust
collected at a biofuel facility (boiler room and straw storage). The
NanoCB, Printex 90 was a gift from Degussa-Huls, Germany. The
NanoTiO2, UV-Titan L181 (Kemira Pigments, Finland) was a gift
from Boesens Fabrikker Aps, Denmark. The DEP was a standard
reference material (SRM) 2975 purchased from the National
Institute of Standards and Technology, USA. The MWCNT was
a gift from Mitsui, Japan. The SWCNT1 was purchased from
Sigma, USA. The SWCNT2 was purchased from Thomas Swan,
USA. Airborne dust was collected from a boiler room (Boiler dust)
and a straw storage hall (Straw dust) at a biofuel plant as described
previously [31].
Exposure of miceThe study consists of six parts. An overview of the studies is
given in Table 1. Study 1 is part of a larger set-up in which mice
were given a single intratracheal instillation of a range of different
types of particles. We have previously reported inflammatory and
DNA damaging effects in mice given NanoTiO2 [20,26] and
NanoCB [20,21] from this set-up.
Study 3–6 consist of experiments with mice that we have
reported of previously [20,22,23,31,32], and for which lung tissue
in this study was reanalyzed for Saa3 mRNA expression.
Exposure by intratracheal instillation. The instillation
procedure has been described in detail previously [20]. In brief,
the mice were given either 18 mg, 54 mg or 162 mg of particles
(corresponding to ca. 0.9, 2.8 and 8.4 mg/kg, respectively) by a
single i.t. instillation or 4 multiple instillations. After exposure,
tissue and BAL cells were for all studies prepared as described
previously [32].
For study 1 characterization of NanoCB and NanoTiO2 in
instillation vehicle have been published previously [20,33]. For the
rest of the particles in study 1 (MWCNT, SWCNT1, SWCNT2),
the average size of the materials in instillation vehicle were
analyzed by Dynamic Light Scattering (DLS) and the shapes of the
materials and the extent of agglomeration/aggregation in instil-
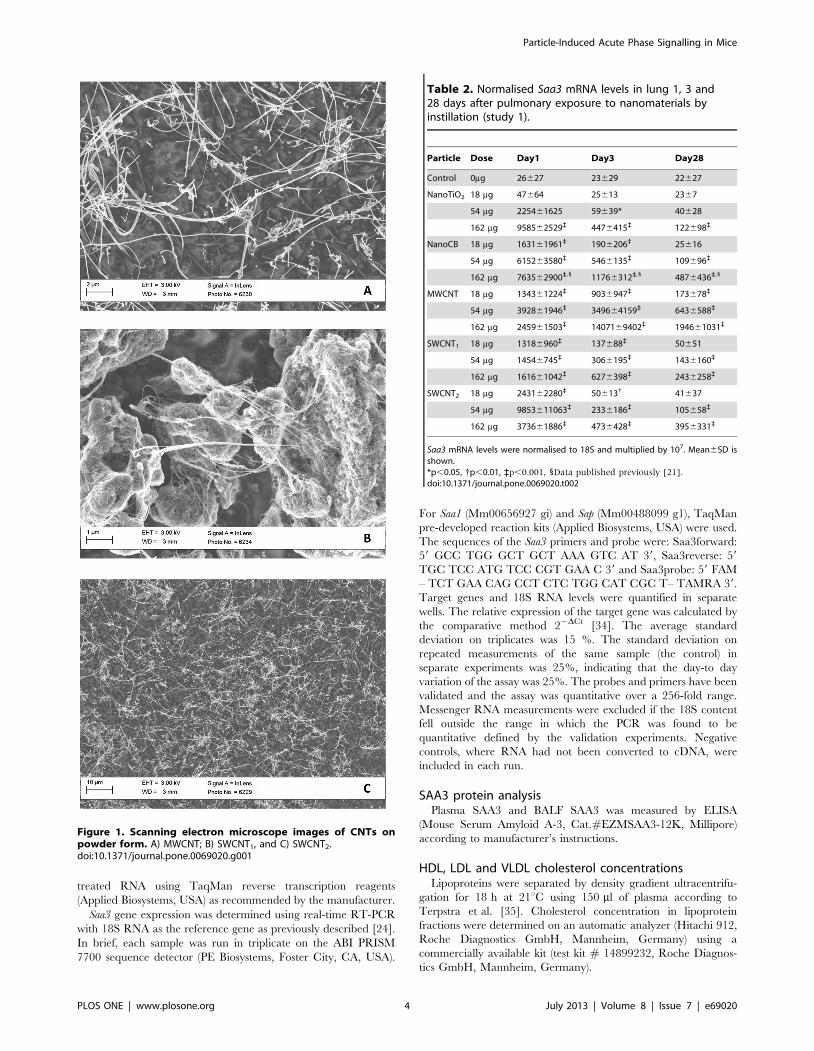
lation vehicle were characterized by scanning electron microscopy
(SEM). Electron microscopy was performed on both pristine
CNTS and CNTs in instillation vehicle. However, SEM pictures
of CNTs in vehicle were dominated by salt crystals from the saline
solution (results not shown). SEM pictures of the dry CNTs are
shown in Figure 1. SWCNT1 and SWCNT2 both appeared
bundled, hampering assessment of dimensions. This was true both
when evaluated as powders and in suspension for instillation. DLS
measurements of the CNTs suspensions indicated the presence of
agglomerates in the mm-range probably due to bundling of CNTs
and sedimentation (results not shown). A detailed characterization
of the particles from study 3–6 was reported previously
[20,22,24,31]. Selected data are summarized in Table 1.
Exposure by inhalation. Mice exposed by inhalation were
exposed in a 18 L nose-only exposure chamber as previously
described [22,23,32]. In brief, the particles were aerosolized by a
microfeeder with dispersion nozzle (Fraunhofer Institut fur
Toxikologie and Aerosolforschung, Hannover, Germany). The
number of particles was measured by a condensation particle
counter (TSI model 3022A). The particle concentration was
measured periodically during exposure by weighing of filters.
Particle-Induced Acute Phase Signalling in Mice
PLOS ONE | www.plosone.org 2 July 2013 | Volume 8 | Issue 7 | e69020
Set-up of studiesStudy 1. The set-up of the single intratracheal instillation of
nanomaterials has been described in detail for the NanoCB and
NanoTiO2 [20]. The mice exposed to the three types of CNTs
were exposed similarly. In brief, mice received a single intratra-
cheal instillation of 18, 54 and 162 mg of NanoTiO2, NanoCB,
MWCNT, SWCNT1 or SWCNT2 and were evaluated 1, 3 and
28 days after intratracheal instillation. Particles were suspended by
sonication in 0.9% NaCl MilliQ water containing 10% v/v
acellular BAL from C57BL/6 mice. The BAL fluid was prepared
by flushing unexposed mice twice to 0.6 ml 0.9% NaCl solution
yielding approximately 1 ml of BAL fluid. Acellular BAL was
prepared by centrifugation of BAL fluid at 400 g (10 min, 4uC).
The particles (4.05 mg/ml) were sonicated using a 400 W Branson
Sonifier S-450D (Branson Ultrasonics Corp., Danbury, CT, USA)
equipped with a disruptor horn (Model number: 101-147-037).
Total sonication time was 16 min, with alternating 10 s pulses and
10 s pauses at amplitude of 10% (8 min sonication in total).
Samples were continuously cooled on ice during the sonication
procedure. Vehicle control solutions were prepared containing
90% 0.9% NaCl MilliQ water and 10% acellular BAL fluid.
Lungs were snap frozen in liquid nitrogen and stored at 280uC.
Study 2. Because no plasma was saved from study 1 a
supplementary study was performed similarly to study 1 to obtain
plasma from mice intratracheally instilled with MWCNT and
control vehicle. In a separate experiment, blood was collected
from groups of 3 C57BL/6 mice 3 days after instillation of a single
dose of 18 mg, 54 mg, or 128 mg of MWCNT. Particle suspensions
were prepared as described for study 1. The reason for the
different highest dose (128 mg) was that these mice also were part
of another study.
Study 3. The design of the repeated exposure to NanoCB and
DEP has been described in detail elsewhere [24]. In brief, we
exposed C57 BL/6J virgin mice by inhalation to 20 mg/m3 DEP,
NanoCB or filtered air for 90 min on four consecutive days. The
particle numbers of NanoCB and DEP were ca. 8.06105/cm3 and
9.56105/cm3, respectively. One hour after the last exposure the
mice were killed and lungs were snap frozen in liquid nitrogen and
stored at 280uC.
Study 4. The design of the repeated exposure to NanoTiO2
has been described in detail elsewhere [23]. In brief, C57BL/6J
time-mated mice were exposed by inhalation 1h/day to 42 mg/
m3 NanoTiO2 on gestation days 8–18. The particle number
concentration was 1.7060.206106/cm3. Mice that did not give
birth (non-pregnant mice) were killed 5 days after the end of
exposure and lungs were snap frozen in liquid nitrogen and stored
at 280uC. Dams were killed 26–27 days after the last exposure
(after end of lactation) and tissue was treated as described above.
Study 5. The design of the repeated exposure to NanoCB has
been described in detail elsewhere [22]. In brief, C57BL/6J time-
mated mice were exposed by inhalation to 42 mg/m3 NanoCB for
1 h/day on gestation days (GD) 8–18. The particle number
concentration was 4.0960.036106/cm3. Mice with none or few
offspring were killed 5 days after the end of exposure and lungs
were snap frozen in liquid nitrogen and stored at 280uC. Dams
with larger litters were killed 24–25 days after the end of exposure
and tissue was treated as described previously.
Study 6. The design of the repeated exposure to boiler dust
and storage dust has been described in detail elsewhere [31]. In
brief, C57 BL/6J virgin mice were intratracheally instilled on four
consecutive days with 54 mg mg of airborne dust collected at a
biofuel plant in the straw storage hall or to dust collected in the
boiler room (total dose 216 mg/animal). Control mice were
exposed similarly to a 0.9% sodium chloride solution. Endpoints
were evaluated 1 hour after last exposure. Lungs were snap frozen
in liquid nitrogen and stored at 280uC.
Saa3 mRNA expression analysisHepatic and pulmonary RNA from the C57BL/6 was isolated
as described previously [24]. cDNA was prepared from DNase
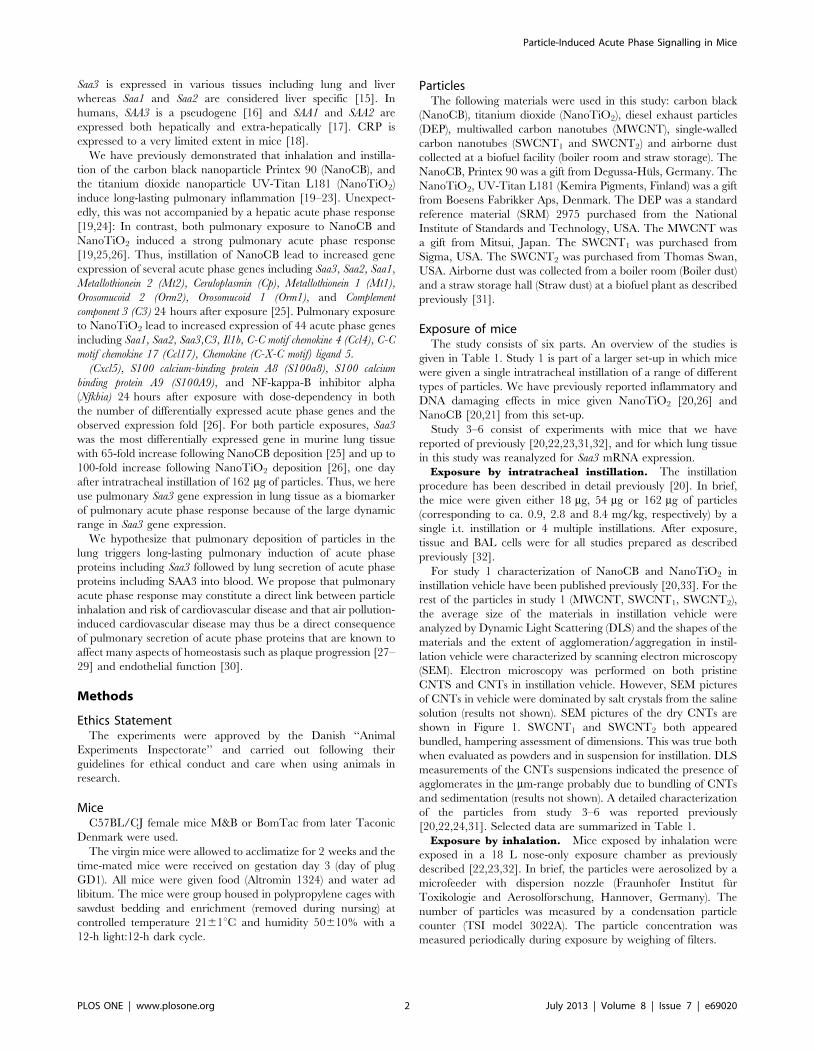
Table 1. Overview of studies and nanomaterials.
Study Exposure way Particles Deposited dose (mg) Declared particle size
Agglomerated size ininhalation aerosol orinstillation suspension Reference
1 Intratracheal NanoCB 18, 54, 162 14 nm 200 nm? [20]
instillation NanoTiO2 18, 54, 162 17 nm 100 nm?
MWCNT 18, 54, 162 40–50 nm61–4 mm ND1
SWCNT1 18, 54, 162 1.1 nm60.5–100mm ND1
SWCNT2 18, 54, 162 0.8–1.7nm6#1 mm ND1
2** Intratracheal MWCNT 18, 54, 128 40–50 nm61– 4 mm ND1
instillation
3 Inhalation NanoCB 75 14 nm 65 nm` [32]
DEP 19* 1.62 mm{ 215 nm`
4 Inhalation NanoTiO2 73 17 nm 97 nm` [19]
5 Inhalation NanoCB 287 14 nm 310 nm (bimodal;290 and 1500 nm)`
[22]
6 Intratracheal Boiler dust 216 ND1 ND1 [31]
instillation Storage dust 216 ND1 ND1
*Based on a deposition fraction similar to NanoTiO2,{ Mean diameter (number distribution) from National Institute of Standards and Technology, Certificate of Analysis,Standard Reference MaterialH 2975,` Geometric mean, 1 Not detetermined, ? Hydrodynamic size, ** Study 2 was an additional experiment performed to obtain plasmafrom MWCNT instilled mice and control animals.doi:10.1371/journal.pone.0069020.t001
Particle-Induced Acute Phase Signalling in Mice
PLOS ONE | www.plosone.org 3 July 2013 | Volume 8 | Issue 7 | e69020
treated RNA using TaqMan reverse transcription reagents
(Applied Biosystems, USA) as recommended by the manufacturer.
Saa3 gene expression was determined using real-time RT-PCR
with 18S RNA as the reference gene as previously described [24].
In brief, each sample was run in triplicate on the ABI PRISM
7700 sequence detector (PE Biosystems, Foster City, CA, USA).
For Saa1 (Mm00656927 gi) and Sap (Mm00488099 g1), TaqMan
pre-developed reaction kits (Applied Biosystems, USA) were used.
The sequences of the Saa3 primers and probe were: Saa3forward:
59 GCC TGG GCT GCT AAA GTC AT 39, Saa3reverse: 59
TGC TCC ATG TCC CGT GAA C 39 and Saa3probe: 59 FAM
– TCT GAA CAG CCT CTC TGG CAT CGC T– TAMRA 39.
Target genes and 18S RNA levels were quantified in separate
wells. The relative expression of the target gene was calculated by
the comparative method 22DCt [34]. The average standard
deviation on triplicates was 15 %. The standard deviation on
repeated measurements of the same sample (the control) in
separate experiments was 25%, indicating that the day-to day
variation of the assay was 25%. The probes and primers have been
validated and the assay was quantitative over a 256-fold range.
Messenger RNA measurements were excluded if the 18S content
fell outside the range in which the PCR was found to be
quantitative defined by the validation experiments. Negative
controls, where RNA had not been converted to cDNA, were
included in each run.
SAA3 protein analysisPlasma SAA3 and BALF SAA3 was measured by ELISA
(Mouse Serum Amyloid A-3, Cat.#EZMSAA3-12K, Millipore)
according to manufacturer’s instructions.
HDL, LDL and VLDL cholesterol concentrationsLipoproteins were separated by density gradient ultracentrifu-
gation for 18 h at 21uC using 150 ml of plasma according to
Terpstra et al. [35]. Cholesterol concentration in lipoprotein
fractions were determined on an automatic analyzer (Hitachi 912,
Roche Diagnostics GmbH, Mannheim, Germany) using a
commercially available kit (test kit # 14899232, Roche Diagnos-
tics GmbH, Mannheim, Germany).
Figure 1. Scanning electron microscope images of CNTs onpowder form. A) MWCNT; B) SWCNT1, and C) SWCNT2.doi:10.1371/journal.pone.0069020.g001
Table 2. Normalised Saa3 mRNA levels in lung 1, 3 and28 days after pulmonary exposure to nanomaterials byinstillation (study 1).
Particle Dose Day1 Day3 Day28
Control 0mg 26627 23629 22627
NanoTiO2 18 mg 47664 25613 2367
54 mg 225461625 59639* 40628
162 mg 958562529` 4476415` 122698`
NanoCB 18 mg 163161961` 1906206` 25616
54 mg 615263580` 5466135` 109696`
162 mg 763562900`,1 11766312`,1 4876436`,1
MWCNT 18 mg 134361224` 9036947` 173678`
54 mg 392861946` 349664159` 6436588`
162 mg 245961503` 1407169402` 194661031`
SWCNT1 18 mg 13186960` 137688` 50651
54 mg 14546745` 3066195` 1436160`
162 mg 161661042` 6276398` 2436258`
SWCNT2 18 mg 243162280` 50613{ 41637
54 mg 9853611063` 2336186` 105658`
162 mg 373661886` 4736428` 3956331`
Saa3 mRNA levels were normalised to 18S and multiplied by 107. Mean6SD isshown.*p,0.05, {p,0.01, `p,0.001, 1Data published previously [21].doi:10.1371/journal.pone.0069020.t002
Particle-Induced Acute Phase Signalling in Mice
PLOS ONE | www.plosone.org 4 July 2013 | Volume 8 | Issue 7 | e69020
Statistical analysisData are expressed as mean6SD. The data were analysed by
non-parametric two or three-way ANOVA with post-hoc Tukey-
type multiple comparisons test for effects showing statistical
significance in the overall ANOVA The significance level was
set to 0.05. The statistical analyses were performed in SAS version
9.2 (SAS Institute Inc., Cary, NC, USA).
Results
Induction of pulmonary acute phase response was assessed by
quantifying mRNA levels of the acute phase gene Saa3 as a marker
of acute phase response, as we have previously found that Saa3 is
the most differentially expressed gene following pulmonary
exposure to nanoparticles [19,25].
Intratracheal instillation of nanomaterialsPulmonary induction of the acute phase response was assessed
for five different nanomaterials after a single intratracheal
instillation (Study 1, Table 1). These nanomaterials were
NanoTiO2 and NanoCB, a multiwalled carbon nanotube
(MWCNT), and two SWCNT (SWCNT1, SWCNT2). Groups of
6 mice were exposed to doses of 18, 54 and 162 mg/animal and
the mice were killed 1, 3 and 28 days after instillation. Twenty-two
mice (controls) were instilled with the vehicle (10% mouse
broncheoalveolar lavage fluid (BALF) in 0.9% NaCl) at each time
point. Some of the results from NanoCB-instilled mice were
published previously [20,21]. Results from NanoTiO2-instilled
mice were also published previously [26], but Saa3 mRNA levels
were determined independently for the present study to ensure
comparability between exposures.
Saa3 mRNA expression.All particle exposures increased pulmonary Saa3 mRNA
expression in a time- and dose-dependent manner (Table 2). For
all particles, the strongest response was seen at the early time
points. The strongest response, a 600-fold increase in Saa3
expression was observed 3 days after exposure to MWCNT.
The highest dose of NanoTiO2 resulted in a 400-fold increase in
Saa3 mRNA expression in lung at day 1. At day 1, all instilled
nanoparticles except for SWCNT1 increased mRNA expression of
Saa3 100-fold or more. This may be compared to a 100-fold
induction observed in liver after intraperitoneal injection of
lipopolysaccharide [24]. Saa3 expression was still significantly
increased 28 days after exposure for all mice exposed to the
highest dose of all the tested materials and for mice exposed to
even the lowest dose of MWCNT. This indicates a long-lasting
induction of acute phase response.
MWCNT induced the strongest acute phase response in lung,
and mRNA expression of Saa3 was therefore also assessed in liver.
MWCNT exposure did not change Saa3 expression in liver at any
dose or time point (Figure 2B).
SAA3 protein levels in BALF and plasma. We determined
the SAA3 protein levels in BALF by ELISA in mice exposed to
MWCNT, because this material strongly induced pulmonary but
not the hepatic Saa3 expression.
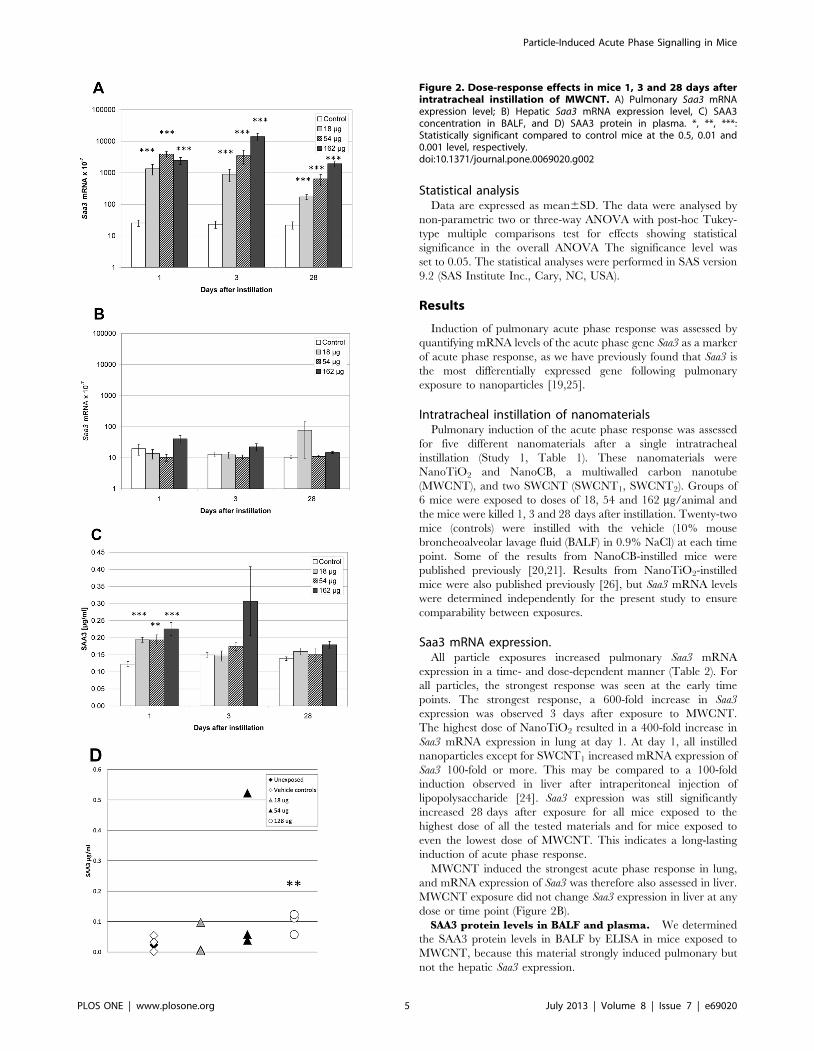
Figure 2. Dose-response effects in mice 1, 3 and 28 days afterintratracheal instillation of MWCNT. A) Pulmonary Saa3 mRNAexpression level; B) Hepatic Saa3 mRNA expression level, C) SAA3concentration in BALF, and D) SAA3 protein in plasma. *, **, ***:Statistically significant compared to control mice at the 0.5, 0.01 and0.001 level, respectively.doi:10.1371/journal.pone.0069020.g002
Particle-Induced Acute Phase Signalling in Mice
PLOS ONE | www.plosone.org 5 July 2013 | Volume 8 | Issue 7 | e69020
The day after exposure, SAA3 protein levels were higher in
BALF from MWCNT instilled animals at all doses compared to
vehicle instilled controls. No dose-response relationship was seen
(Figure 2C). At day 3 and day 28, no statistically significant
differences in SAA3 protein levels were detected in BAL.
We determined SAA3 protein in plasma from groups of 3 mice,
3 days after instillation of a single dose of 18 mg, 54 mg, or 128 mg
of MWCNT in a separate study (Study 2). Two control groups of
unexposed and vehicle exposed animals had similar plasma SAA3
levels. The highest dose of MWCNT instillation increased plasma
levels of SAA3 (p,0.01). One mouse instilled with 54 mg
presented with a very high level of SAA3 and was considered an
outlier. If the outlier was excluded, a dose-dependent increase in
plasma SAA3 levels was observed. Without the outlier, plasma
levels of SAA3 were 1.4-fold (p.0.05), 1.9-fold (p.0.05) and 3.8-
fold (p,0.01) higher in mice exposed to 18, 54 and 128 mg
MWCNT, respectively, compared to vehicle instilled and unex-
posed controls (Figure 2D). The used anti SAA-3 antibody was
raised against full length SAA-3. The cross-reactivity with SAA1
and SAA2 is unknown (Millipore, personal communication). The
true difference in SAA3 level may therefore be larger if there is
cross-reactivity to constitutively expressed SAA isoforms.
HDL, LDL and VLDL levels. SAA circulates in blood as a
component of HDL, and the classic acute phase response is
accompanied by a decrease in HDL-cholesterol [36]. We
determined the concentrations of cholesterol in HDL, very low
density lipoprotein (VLDL), and low density lipoprotein (LDL) in
plasma from mice exposed to MWCNT (Study 2). The
concentration of cholesterol in HDL in plasma from MWCNT
exposed mice was decreased to ca. 50% at all doses (but not
statistically significantly) compared to the HDL-cholesterol con-
centration of un-exposed and vehicle-exposed mice. The concen-
trations of cholesterol in VLDL and LDL were unaffected by
exposure (results not shown).
The results indicate that pulmonary exposure to these
nanomaterials induces pulmonary acute phase response that leads
to systemic circulation of the acute phase protein SAA3.
Pulmonary acute phase response may be a general response to
pulmonary deposition of particles. We therefore also assessed
pulmonary acute phase response in mice exposed to NanoTiO2,
NanoCB and DEP by inhalation and other types of particles by
pulmonary instillation.
Nose-only inhalation of particlesSaa3 mRNA levels were determined in lungs of mice exposed to
20 mg/m3 to DEP or NanoCB for 90 min for 4 consecutive days
(Study 3). One hour after the last exposure Saa3 mRNA levels
were 4.4-fold higher after exposure to NanoCB and 17.4-fold
increased after exposure to DEP compared to control mice
exposed to filtered air (p,0.001, Table 3). We have previously
reported that in these same mice, hepatic mRNA expression of
Saa3, Saa1, and Serum Amyloid P was unaffected by exposure [24].
Mice were exposed to 42 mg/m3 UV-Titan L181 (NanoTiO2)
by whole body inhalation 1 h/day for 11 days (Study 4) [23]. Mice
were killed 5 and 26–27 days after the last exposure. Pulmonary
Saa3 mRNA was increased 24-fold after 5 days (p,0.001) and 2.1-
fold after 26–27 days (p,0.001) compared to controls exposed to
filtered air. Saa3 mRNA levels in the liver were unaffected by
exposure (Table 4). We found no difference in Saa1 or Sap mRNA
expression in the liver at either time point and the pulmonary
expression was below detection level (data not shown).
In a similar exposure set-up mice were exposed to 42 mg/m3
NanoCB 1 h/day for 11 consecutive days, also by whole body
inhalation (Study 5) [22]. Exposed mice expressed 2.9-fold more
pulmonary Saa3 mRNA (p,0.001) than controls exposed to
filtered air five days after termination of exposure, and 1.9-fold
(p,0.01) more after 24–25 days. At this time point, Saa3 mRNA
was also increased 1.8-fold (p,0.05) in the liver (Table 4).
Thus, inhalation of particles also induced pulmonary acute
phase response that was detectable one month after exposure.
Intratracheal instillation of particles from a biofuel plantPulmonary Saa3 expression was also determined in mice
instilled with dust collected at a biofuel plant (Study 6) [31]. Mice
were instilled intratracheally with airborne dust collected at a
biofuel plant in the straw storage hall and in the boiler room.
Endpoints were determined 1 h after the last instillation. Each
mouse was instilled four times with 54 mg dust on four consecutive
days. Control mice were similarly instilled with vehicle (0.9%
NaCl). Instillation of dust increased expression of Saa3 statistically
significantly, 6-fold for storage hall dust and 11-fold for boiler
room dust (Table 3).
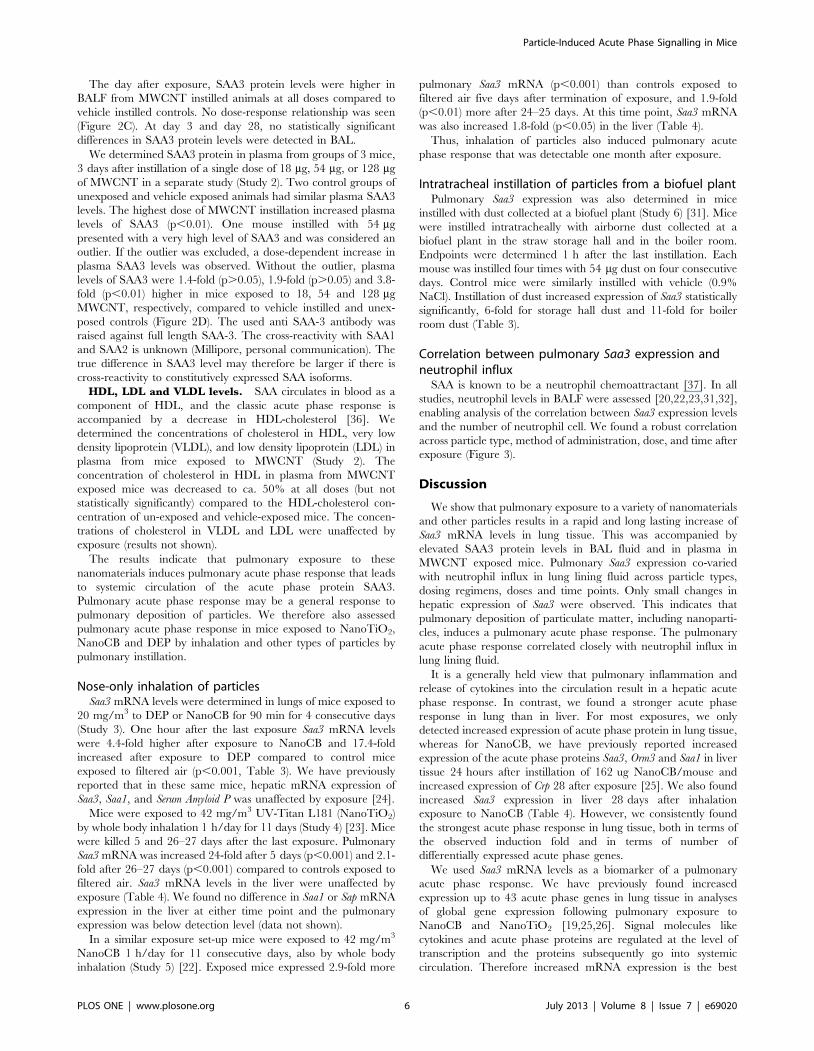
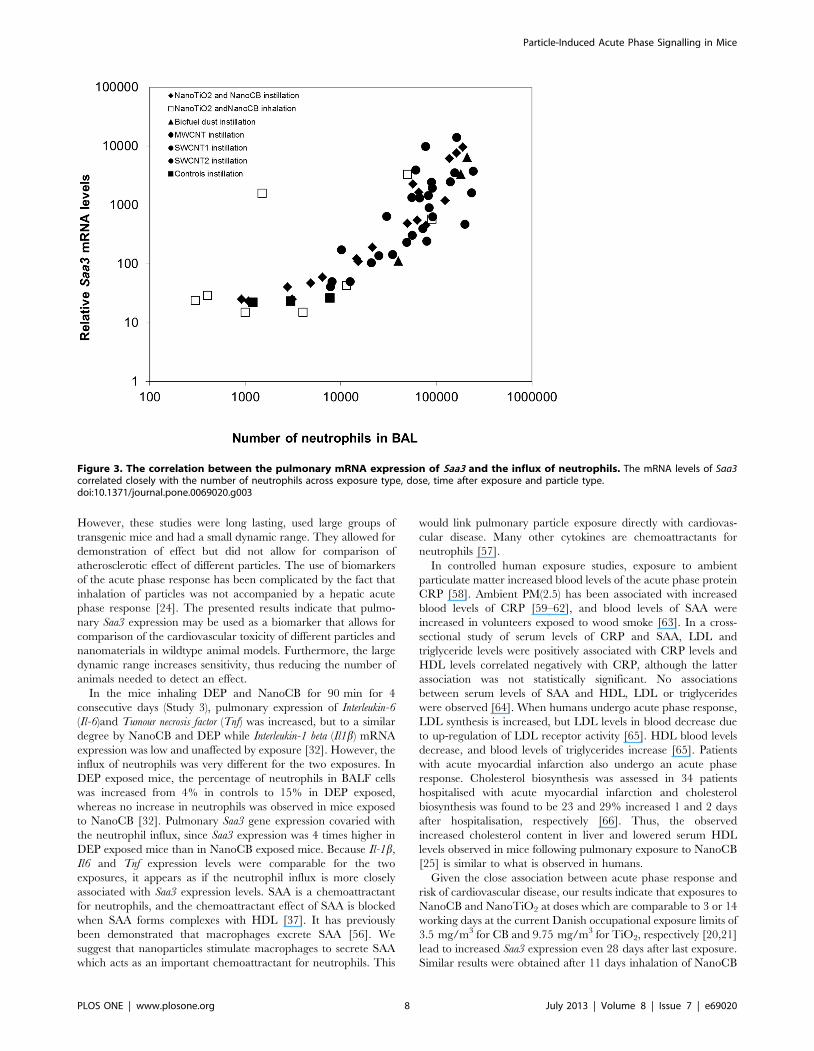
Correlation between pulmonary Saa3 expression andneutrophil influx
SAA is known to be a neutrophil chemoattractant [37]. In all
studies, neutrophil levels in BALF were assessed [20,22,23,31,32],
enabling analysis of the correlation between Saa3 expression levels
and the number of neutrophil cell. We found a robust correlation
across particle type, method of administration, dose, and time after
exposure (Figure 3).
Discussion
We show that pulmonary exposure to a variety of nanomaterials
and other particles results in a rapid and long lasting increase of
Saa3 mRNA levels in lung tissue. This was accompanied by
elevated SAA3 protein levels in BAL fluid and in plasma in
MWCNT exposed mice. Pulmonary Saa3 expression co-varied
with neutrophil influx in lung lining fluid across particle types,
dosing regimens, doses and time points. Only small changes in
hepatic expression of Saa3 were observed. This indicates that
pulmonary deposition of particulate matter, including nanoparti-
cles, induces a pulmonary acute phase response. The pulmonary
acute phase response correlated closely with neutrophil influx in
lung lining fluid.
It is a generally held view that pulmonary inflammation and
release of cytokines into the circulation result in a hepatic acute
phase response. In contrast, we found a stronger acute phase
response in lung than in liver. For most exposures, we only
detected increased expression of acute phase protein in lung tissue,
whereas for NanoCB, we have previously reported increased
expression of the acute phase proteins Saa3, Orm3 and Saa1 in liver
tissue 24 hours after instillation of 162 ug NanoCB/mouse and
increased expression of Crp 28 after exposure [25]. We also found
increased Saa3 expression in liver 28 days after inhalation
exposure to NanoCB (Table 4). However, we consistently found
the strongest acute phase response in lung tissue, both in terms of
the observed induction fold and in terms of number of
differentially expressed acute phase genes.
We used Saa3 mRNA levels as a biomarker of a pulmonary
acute phase response. We have previously found increased
expression up to 43 acute phase genes in lung tissue in analyses
of global gene expression following pulmonary exposure to
NanoCB and NanoTiO2 [19,25,26]. Signal molecules like
cytokines and acute phase proteins are regulated at the level of
transcription and the proteins subsequently go into systemic
circulation. Therefore increased mRNA expression is the best
Particle-Induced Acute Phase Signalling in Mice
PLOS ONE | www.plosone.org 6 July 2013 | Volume 8 | Issue 7 | e69020
evidence of the origin of an acute phase response. However, in
addition to the increased levels of SAA3 in BAL fluid reported
here, we have previously reported that the protein levels of two
acute phase protein, granulocyte colony-stimulating factor (G-
CSF) and granulocyte-macrophage colony-stimulating-factor
(GM-CSF) were increased 6-fold and 2.5-fold, respectively, in
lung tissue following instillation of NanoTiO2 [26] and 3-fold and
1.3-fold increased, respectively, following instillation of NanoCB
[38]. In both cases, G-CSF protein levels increased in a dose-
dependent manner with increasing exposure dose. Moreover,
dose-dependently increased protein levels of IL-1b, IL-6, and
CXCL1 were also found in lung tissue 28 days following
instillation of NanoCB [38]. In addition, Teeguarden et al [39]
exposed mice to different kinds of nanoparticles twice a week for
three weeks to a total dose of 240 mg by aspiration. Twenty-four
hours after last exposure the protein levels of the acute-phase
proteins C3, Fn1, S100A8 and S100A9 were increased in the lung
tissue in mice exposed to single-walled carbon nanotubes.
Moreover, the level of the acute-phase protein haptoglobin was
increased in BALF collected 24 h after a single intratracheal
instillation of 200 mg NanoCB/mouse [40].
CRP levels is a risk factor for cardiovascular disease [41]. It is
debated whether plasma levels of CRP and SAA are just passive
bystanders of disease or whether these acute phase proteins are
causally related to cardiovascular disease [42]. Genetic variations
and haplotypes in the CRP gene are associated with differences in
plasma CRP levels but not with the risk of coronary heart disease
[14,43]. This suggests that CRP levels in plasma are not causally
related to coronary heart disease [44,45] despite their prospective
association to risk of CHD in prospective studies [46]. Instead,
evidence suggests a causative role of SAA: In mice, SAA promotes
atherosclerosis directly [47], impairs endothelial dysfunction [30]
and is a chemoattractant of monocytes and neutrophils [37,48].
Strong inducers of SAA such as lipopolysaccharide [49] as well as
oral infection with periodontal pathogens accelerate the develop-
ment of atherosclerotic plaques both in APOE2/2 mice [50] and
in APOE+/2 heterozygotes [51]. It was recently demonstrated that
Lenti-virus mediated overexpression of SAA1 in APOE 2/2 mice
led to accelerated plaque progression. This indicates that SAA1 is
causal in plaque progression and thus leads to atherosclerosis [47].
Plaque progression may be caused by inhibition of reverse
cholesterol transport from macrophages to the liver [36]. During
acute phase response, SAA proteins are incorporated into HDL
substituting apoA-I. The acute phase HDL is less able to facilitate
reverse cholesterol transport from macrophages to faeces [52,53]
and promotes the formation of foam cells and subsequent plaque
progression. In line with this, adenovirus mediated overexpression
of murine SAA decreased macrophage-to-faeces reverse choles-
terol transport in vivo in mice [52]. SAA3 is a pseudogene in
humans. However, we found a close correlation between Saa1 and
Saa3 expression in murine lung tissue, and chose Saa3 as the
biomarker because of the larger dynamic range in gene expression.
We here report a close correlation between Saa3 gene
expression and neutrophil influx (Figure 3). It has previously been
shown that neutrophil influx in response to particle exposure
correlates with the total surface area of the deposited particles
[33,54]. Thus, we have indirectly established a link between total
inhaled surface area of particles and acute phase response and thus
cardiovascular risk.
Plaque progression in APOE 2/2 mice has been used as an
animal model of cardiovascular disease. Interestingly, inhalation of
diesel exhaust particles [55], aspiration of single walled carbon
nanotubes [27] and pulmonary instillation of TiO2 nanoparticles
[29] lead to increased plaque progression in APOE 2/2 mice.
Table 3. Relative Saa3 mRNA levels in lung and liver tissue after pulmonary deposition of particles.
Particle StudyExposureset-up Reference Liver Lung
Control Exposed Control Exposed
NanoCB 3 Inhalation: 461.5 h620 mg/m3 [32] 25637 1967.8 25630 111663*
DEP 3 Inhalation: 461.5 h620 mg/m3 [32] 25637 38616 25630 4356662*
Boiler dust 6 Intratracheal instillation: 4654 mg [31] ND{ ND{ 5636540 333763006*
Straw dust 6 Intratracheal instillation: 4654 mg [31] ND{ ND{ 5636540 6389`5520*
Saa3 mRNA levels were normalised to 18S and multiplied by 107. Mean6SD is shown. * p,0.001 compared to controls. { Not determined.doi:10.1371/journal.pone.0069020.t003
Table 4. Relative Saa3 mRNA levels in lung and liver tissue after pulmonary deposition of particles by inhalation.
Particle StudyExposureset-up Reference 4–5 days after exposure ,4weeks after exposure
Liver Lung Liver Lung
Control Exposed Control Exposed Control Exposed Control Exposed
NanoTiO2 4 11661 h642mg/m3
[23] 2016336 70651 24612 5706418{ 6056369 4866283 157664329 333763808`
(3306376)1 (238461722)1
NanoCB 5 1161 h642mg/m3
[22] 52627 116648 1568 43616{ 44633 79647* 1566 43616{
Saa3 mRNA levels were normalised to 18S and multiplied by 107. Mean6SD is shown. * p,0.05, {p,0.01, `p,0.001, 1One outlier has been removed in each group.doi:10.1371/journal.pone.0069020.t004
Particle-Induced Acute Phase Signalling in Mice
PLOS ONE | www.plosone.org 7 July 2013 | Volume 8 | Issue 7 | e69020
However, these studies were long lasting, used large groups of
transgenic mice and had a small dynamic range. They allowed for
demonstration of effect but did not allow for comparison of
atherosclerotic effect of different particles. The use of biomarkers
of the acute phase response has been complicated by the fact that
inhalation of particles was not accompanied by a hepatic acute
phase response [24]. The presented results indicate that pulmo-
nary Saa3 expression may be used as a biomarker that allows for
comparison of the cardiovascular toxicity of different particles and
nanomaterials in wildtype animal models. Furthermore, the large
dynamic range increases sensitivity, thus reducing the number of
animals needed to detect an effect.
In the mice inhaling DEP and NanoCB for 90 min for 4
consecutive days (Study 3), pulmonary expression of Interleukin-6
(Il-6)and Tumour necrosis factor (Tnf) was increased, but to a similar
degree by NanoCB and DEP while Interleukin-1 beta (Il1b) mRNA
expression was low and unaffected by exposure [32]. However, the
influx of neutrophils was very different for the two exposures. In
DEP exposed mice, the percentage of neutrophils in BALF cells
was increased from 4% in controls to 15% in DEP exposed,
whereas no increase in neutrophils was observed in mice exposed
to NanoCB [32]. Pulmonary Saa3 gene expression covaried with
the neutrophil influx, since Saa3 expression was 4 times higher in
DEP exposed mice than in NanoCB exposed mice. Because Il-1b,
Il6 and Tnf expression levels were comparable for the two
exposures, it appears as if the neutrophil influx is more closely
associated with Saa3 expression levels. SAA is a chemoattractant
for neutrophils, and the chemoattractant effect of SAA is blocked
when SAA forms complexes with HDL [37]. It has previously
been demonstrated that macrophages excrete SAA [56]. We
suggest that nanoparticles stimulate macrophages to secrete SAA
which acts as an important chemoattractant for neutrophils. This
would link pulmonary particle exposure directly with cardiovas-
cular disease. Many other cytokines are chemoattractants for
neutrophils [57].
In controlled human exposure studies, exposure to ambient
particulate matter increased blood levels of the acute phase protein
CRP [58]. Ambient PM(2.5) has been associated with increased
blood levels of CRP [59–62], and blood levels of SAA were
increased in volunteers exposed to wood smoke [63]. In a cross-
sectional study of serum levels of CRP and SAA, LDL and
triglyceride levels were positively associated with CRP levels and
HDL levels correlated negatively with CRP, although the latter
association was not statistically significant. No associations
between serum levels of SAA and HDL, LDL or triglycerides
were observed [64]. When humans undergo acute phase response,
LDL synthesis is increased, but LDL levels in blood decrease due
to up-regulation of LDL receptor activity [65]. HDL blood levels
decrease, and blood levels of triglycerides increase [65]. Patients
with acute myocardial infarction also undergo an acute phase
response. Cholesterol biosynthesis was assessed in 34 patients
hospitalised with acute myocardial infarction and cholesterol
biosynthesis was found to be 23 and 29% increased 1 and 2 days
after hospitalisation, respectively [66]. Thus, the observed
increased cholesterol content in liver and lowered serum HDL
levels observed in mice following pulmonary exposure to NanoCB
[25] is similar to what is observed in humans.
Given the close association between acute phase response and
risk of cardiovascular disease, our results indicate that exposures to
NanoCB and NanoTiO2 at doses which are comparable to 3 or 14
working days at the current Danish occupational exposure limits of
3.5 mg/m3 for CB and 9.75 mg/m3 for TiO2, respectively [20,21]
lead to increased Saa3 expression even 28 days after last exposure.
Similar results were obtained after 11 days inhalation of NanoCB
Figure 3. The correlation between the pulmonary mRNA expression of Saa3 and the influx of neutrophils. The mRNA levels of Saa3correlated closely with the number of neutrophils across exposure type, dose, time after exposure and particle type.doi:10.1371/journal.pone.0069020.g003
Particle-Induced Acute Phase Signalling in Mice
PLOS ONE | www.plosone.org 8 July 2013 | Volume 8 | Issue 7 | e69020
and NanoTiO2 at doses corresponding to 1.5 or 0.5 times the
current Danish occupational exposure limits. Also dust collected in
a biofuel facility with high exposure to both particles and
endotoxins increased Saa3 levels in lungs of exposed mice [31].
Human exposure levels at this plant were 0.62 mg/m3 dust and
1298 EU/m3 endotoxin in the storage hall and 1.18 mg/m3 dust
and 2178 EU/m3 endotoxin in the boiler room [31]. The 4 times
54 mg mg/animal administered to the animals over 4 days
corresponded to 2 weeks of exposure [31].
Conclusions
Pulmonary exposure to several nanomaterials and other
particles led to a pulmonary acute phase response characterised
by long-lasting increased expression of Saa3 mRNA and plasma
SAA3 protein. SAA has a key role in promotion of plaque
progression. We therefore propose that the pulmonary acute phase
response may constitute a causative link between particle
inhalation and risk of cardiovascular disease. The SAA is a potent
chemotactic factor for neutrophils and the mRNA levels of Saa3
correlated closely with the number of neutrophils in BAL fluid
across exposure type, dose and time after exposure and particle
type. Our results suggest that nanoparticles differ in their ability to
induce acute phase response and therefore that evaluation of the
potency to induce pulmonary acute phase response may allow for
the rating of different nanoparticles in relation to risk of
cardiovascular disease.
Acknowledgments
The technical assistance from Lourdes Pedersen, Elzbieta Christiansen,
Anne-Karin Jensen, Michael Guldbrandsen, Signe H. Nielsen and Lars
Bentzen is gratefully acknowledged.
Author Contributions
Conceived and designed the experiments: ATS UBV HW KSH NRJ.
Performed the experiments: NRJ PJ JSL GRH ANN AMM PW. Analyzed
the data: ATS UBV HW JSL GRH. Wrote the paper: ATS JSL UBV HW.
References
1. Pope CA III, Burnett RT, Thurston GD, Thun MJ, Calle EE, et al. (2004)
Cardiovascular mortality and long-term exposure to particulate air pollution:epidemiological evidence of general pathophysiological pathways of disease.
Circulation 109: 71–77.
2. Fang SC, Cassidy A, Christiani DC (2010) A Systematic Review of Occupational
Exposure to Particulate Matter and Cardiovascular Disease. InternationalJournal of Environmental Research and Public Health 7: 1773–1806.
3. Oberdorster G, Oberdorster E, Oberdorster J (2005) Nanotoxicology: anemerging discipline evolving from studies of ultrafine particles. Environ Health
Perspect 113: 823–839.
4. Taubes G (2002) Cardiovascular disease. Does inflammation cut to the heart of
the matter? Science 296: 242–245.
5. Packard RR, Libby P (2008) Inflammation in atherosclerosis: from vascular
biology to biomarker discovery and risk prediction. Clin Chem 54: 24–38.
6. Gabay C, Kushner I (1999) Mechanisms of disease: Acute-phase proteins and
other systemic responses to inflammation. New England Journal of Medicine340: 448–454.
7. Lowe GD (2001) The relationship between infection, inflammation, andcardiovascular disease: an overview. Ann Periodontol 6: 1–8.
8. Mezaki T, Matsubara T, Hori T, Higuchi K, Nakamura A, et al. (2003) Plasmalevels of soluble thrombomodulin, C-reactive protein, and serum amyloid A
protein in the atherosclerotic coronary circulation. Jpn Heart J 44: 601–612.
9. Libby P, Okamoto Y, Rocha VZ, Folco E (2010) Inflammation in
atherosclerosis: transition from theory to practice. Circ J 74: 213–220.
10. Pussinen PJ, Tuomisto K, Jousilahti P, Havulinna AS, Sundvall J, et al. (2007)
Endotoxemia, immune response to periodontal pathogens, and systemicinflammation associate with incident cardiovascular disease events. Arterioscle-
rosis Thrombosis and Vascular Biology 27: 1433–1439.
11. Estabragh ZR, Mamas MA (2013) The cardiovascular manifestations of
influenza: A systematic review. Int J Cardiol.
12. Ridker PM, Hennekens CH, Buring JE, Rifai N (2000) C-reactive protein and
other markers of inflammation in the prediction of cardiovascular disease inwomen. N Engl J Med 342: 836–843.
13. Hertel S, Viehmann A, Moebus S, Mann K, Brocker-Preuss M, et al. (2010)Influence of short-term exposure to ultrafine and fine particles on systemic
inflammation. European Journal of Epidemiology 25: 581–592.
14. Pai JK, Pischon T, Ma J, Manson JE, Hankinson SE, et al. (2004) Inflammatory
markers and the risk of coronary heart disease in men and women. N Engl J Med
351: 2599–2610.
15. Uhlar CM, Whitehead AS (1999) Serum amyloid A, the major vertebrate acute-
phase reactant. European Journal of Biochemistry 265: 501–523.
16. Chiba T, Han CY, Vaisar T, Shimokado K, Kargi A, et al. (2009) Serumamyloid A3 does not contribute to circulating SAA levels. Journal of Lipid
Research 50: 1353–1362.
17. Meek RL, Urielishoval S, Benditt EP (1994) Expression of Apolipoprotein
Serum Amyloid-A Messenger-Rna in Human Atherosclerotic Lesions and
Cultured Vascular Cells - Implications for Serum Amyloid-A Function.Proceedings of the National Academy of Sciences of the United States of
America 91: 3186–3190.
18. Whitehead AS, Zahedi K, Rits M, Mortensen RF, Lelias JM (1990) Mouse C-
reactive protein. Generation of cDNA clones, structural analysis, and inductionof mRNA during inflammation. Biochem J 266: 283–290.
19. Halappanavar S, Jackson P, Williams A, Jensen KA, Hougaard KS, et al. (2011)Pulmonary response to surface-coated nanotitanium dioxide particles includes
induction of acute phase response genes, inflammatory cascades, and changes inmicroRNAs: A toxicogenomic study. Environ Mol Mutagen 52: 425–439.
20. Saber AT, Jacobsen NR, Mortensen A, Szarek J, Jackson P, et al. (2012)
Nanotitanium dioxide toxicity in mouse lung is reduced in sanding dust from
paint. Part Fibre Toxicol 9: 4.
21. Bourdon JA, Saber AT, Jacobsen NR, Jensen KA, Madsen AM, et al. (2012)
Carbon black nanoparticle instillation induces sustained inflammation and
genotoxicity in mouse lung and liver. Part Fibre Toxicol 9: 5.
22. Jackson P, Hougaard KS, Boisen AM, Jacobsen NR, Jensen KA, et al. (2012)
Pulmonary exposure to carbon black by inhalation or instillation in pregnant
mice: effects on liver DNA strand breaks in dams and offspring. Nanotoxicology
6: 486–500.
23. Hougaard KS, Jackson P, Jensen KA, Sloth JJ, Loschner K, et al. (2010) Effects
of prenatal exposure to surface-coated nanosized titanium dioxide (UV-Titan). A
study in mice. Part Fibre Toxicol 7: 16.
24. Saber AT, Halappanavar S, Folkmann JK, Bornholdt J, Boisen AM, et al. (2009)
Lack of acute phase response in the livers of mice exposed to diesel exhaust
particles or carbon black by inhalation. Part Fibre Toxicol 6: 12.
25. Bourdon JA, Halappanavar S, Saber AT, Jacobsen NR, Williams A, et al. (2012)
Hepatic and pulmonary toxicogenomic profiles in mice intratracheally instilled
with carbon black nanoparticles reveal pulmonary inflammation, acute phase
response, and alterations in lipid homeostasis. Toxicol Sci 127: 474–484.
26. Husain M, Saber AT, Guo C, Jacobsen NR, Jensen KA, et al. (2013) Pulmonary
instillation of low doses of titanium dioxide nanoparticles in mice leads to
particle retention and gene expression changes in the absence of inflammation.
Toxicol Appl Pharmacol 269: 250–262.
27. Li Z, Hulderman T, Salmen R, Chapman R, Leonard SS, et al. (2007)
Cardiovascular effects of pulmonary exposure to single-wall carbon nanotubes.
Environmental Health Perspectives 115: 377–382.
28. Chen LC, Nadziejko C (2005) Effects of subchronic exposures to concentrated
ambient particles (CAPs) in mice: V. CAPs exacerbate aortic plaque
development in hyperlipidemic mice. Inhalation Toxicology 17: 217–224.
29. Mikkelsen L, Sheykhzade M, Jensen KA, Saber AT, Jacobsen NR, et al. (2011)
Modest effect on plaque progression and vasodilatory function in atherosclerosis-
prone mice exposed to nanosized TiO2. Part Fibre Toxicol 8: 32.
30. Wang X, Chai H, Wang Z, Lin PH, Yao Q, et al. (2008) Serum amyloid A
induces endothelial dysfunction in porcine coronary arteries and human
coronary artery endothelial cells. Am J Physiol Heart Circ Physiol 295:
H2399–H2408.
31. Madsen AM, Saber AT, Nordly P, Sharma AK, Wallin H, et al. (2008)
Inflammation but no DNA (deoxyribonucleic acid) damage in mice exposed to
airborne dust from a biofuel plant. Scand J Work Environ Health 34: 278–7.
32. Saber AT, Bornholdt J, Dybdahl M, Sharma AK, Loft S, et al. (2005) Tumor
necrosis factor is not required for particle-induced genotoxicity and pulmonary
inflammation. Arch Toxicol 79: 177–182.
33. Saber AT, Jensen KA, Jacobsen NR, Birkedal R, Mikkelsen L, et al. (2012)
Inflammatory and genotoxic effects of nanoparticles designed for inclusion in
paints and lacquers. Nanotoxicology 6: 453–471.
34. Livak KJ, Schmittgen TD (2001) Analysis of relative gene expression data using
real-time quantitative PCR and the 2(-Delta Delta C(T)) Method. Methods 25:
402–408.
35. Terpstra AH, Woodward CJ, Sanchez-Muniz FJ (1981) Improved techniques for
the separation of serum lipoproteins by density gradient ultracentrifugation:
visualization by prestaining and rapid separation of serum lipoproteins from
small volumes of serum. Anal Biochem 111: 149–157.
36. Feingold KR, Grunfeld C (2010) The acute phase response inhibits reverse
cholesterol transport. Journal of Lipid Research 51: 682–684.
Particle-Induced Acute Phase Signalling in Mice
PLOS ONE | www.plosone.org 9 July 2013 | Volume 8 | Issue 7 | e69020
37. Badolato R, Wang JM, Murphy WJ, Lloyd AR, Michiel DF, et al. (1994) Serum
amyloid A is a chemoattractant: induction of migration, adhesion, and tissue
infiltration of monocytes and polymorphonuclear leukocytes. J Exp Med 180:
203–209.
38. Jackson P, Hougaard KS, Vogel U, Wu D, Casavant L, et al. (2012) Exposure of
pregnant mice to carbon black by intratracheal instillation: toxicogenomic effects
in dams and offspring. Mutat Res 745: 73–83.
39. Teeguarden JG, Webb-Robertson BJ, Waters KM, Murray AR, Kisin ER, et al.
(2011) Comparative proteomics and pulmonary toxicity of instilled single-walled
carbon nanotubes, crocidolite asbestos, and ultrafine carbon black in mice.
Toxicol Sci 120: 123–135.
40. Chang CC, Chen SH, Ho SH, Yang CY, Wang HD, et al. (2007) Proteomic
analysis of proteins from bronchoalveolar lavage fluid reveals the action
mechanism of ultrafine carbon black-induced lung injury in mice. Proteomics 7:
4388–4397.
41. Kaptoge S, Di AE, Pennells L, Wood AM, White IR, et al. (2012) C-reactive
protein, fibrinogen, and cardiovascular disease prediction. N Engl J Med 367:
1310–1320.
42. Stulnig TM (2013) C-reactive protein, fibrinogen, and cardiovascular risk.
N Engl J Med 368: 84–85.
43. Elliott P, Chambers JC, Zhang W, Clarke R, Hopewell JC, et al. (2009) Genetic
Loci associated with C-reactive protein levels and risk of coronary heart disease.
JAMA 302: 37–48.
44. Vogel U, Jensen MK, Due KM, Rimm EB, Wallin H, et al. (2011) The NFKB1
ATTG ins/del polymorphism and risk of coronary heart disease in three
independent populations. Atherosclerosis 219: 200–204.
45. Vogel U (in press) Commentary. Atherosclerosis.
46. Danesh J, Whincup P, Walker M, Lennon L, Thomson A, et al. (2000) Low
grade inflammation and coronary heart disease: prospective study and updated
meta-analyses. BMJ 321: 199–204.
47. Dong Z, Wu T, Qin W, An C, Wang Z, et al. (2011) Serum Amyloid A Directly
Accelerates the Progression of Atherosclerosis in Apolipoprotein E-Deficient
Mice. Mol Med.
48. King VL, Thompson J, Tannock LR (2011) Serum amyloid A in atherosclerosis.
Curr Opin Lipidol 22: 302–307.
49. Gitlin JM, Loftin CD (2009) Cyclooxygenase-2 inhibition increases lipopolysac-
charide-induced atherosclerosis in mice. Cardiovascular Research 81: 400–407.
50. Lalla E, Lamster IB, Hofmann MA, Bucciarelli L, Jerud AP, et al. (2003) Oral
infection with a periodontal pathogen accelerates early atherosclerosis in
apolipoprotein E-null mice. Arteriosclerosis Thrombosis and Vascular Biology
23: 1405–1411.
51. Li L, Messas E, Batista EL, Levine RA, Amar S (2002) Porphyromonas
gingivalis infection accelerates the progression of atherosclerosis in a heterozy-
gous apolipoprotein E-deficient murine model. Circulation 105: 861–867.
52. Annema W, Nijstad N, Tolle M, de Boer JF, Buijs RVC, et al. (2010)
Myeloperoxidase and serum amyloid A contribute to impaired in vivo reverse
cholesterol transport during the acute phase response but not group IIA
secretory phospholipase A(2). Journal of Lipid Research 51: 743–754.
53. Jahangiri A, de Beer MC, Noffsinger V, Tannock LR, Ramaiah C, et al. (2009)
HDL remodeling during the acute phase response. Arterioscler Thromb VascBiol 29: 261–267.
54. Duffin R, Tran L, Brown D, Stone V, Donaldson K (2007) Proinflammogenic
effects of low-toxicity and metal nanoparticles in vivo and in vitro: highlightingthe role of particle surface area and surface reactivity. Inhal Toxicol 19: 849–
856.55. Bai N, Kido T, Suzuki H, Yang G, Kavanagh TJ, Kaufman JD, Rosenfeld ME,
van BC, Eeden SF (2011) Changes in atherosclerotic plaques induced by
inhalation of diesel exhaust. Atherosclerosis.56. RL, Eriksen N, Benditt EP (1992) Murine serum amyloid A3 is a high density
apolipoprotein and is secreted by macrophages. Proc Natl Acad Sci U S A 89:7949–7952.
57. A, Wuyts A, Proost P, Struyf S, Opdenakker G, van DJ (1996) Leukocytemigration and activation by murine chemokines. Immunobiology 195: 499–521.
58. Pope CA, III, Hansen ML, Long RW, Nielsen KR, Eatough NL, Wilson WE,
Eatough DJ (2004) Ambient particulate air pollution, heart rate variability, andblood markers of inflammation in a panel of elderly subjects. Environ Health
Perspect 112: 339–345.59. Riediker M, Cascio WE, Griggs TR, Herbst MC, Bromberg PA, Neas L,
Williams RW, Devlin RB (2004) Particulate matter exposure in cars is associated
with cardiovascular effects in healthy young men. Am J Respir Crit Care Med169: 934–940.
60. Peters A, Frohlich M, Doring A, Immervoll T, Wichmann HE, Hutchinson WL,Pepys MB, Koenig W (2001) Particulate air pollution is associated with an acute
phase response in men; results from the MONICA-Augsburg Study. Eur Heart J22: 1198–1204.
61. Delfino RJ, Staimer N, Tjoa T, Polidori A, Arhami M, Gillen DL, Kleinman
MT, Vaziri ND, Longhurst J, Zaldivar F, Sioutas C (2008) Circulatingbiomarkers of inflammation, antioxidant activity, and platelet activation are
associated with primary combustion aerosols in subjects with coronary arterydisease. Environ Health Perspect 116: 898–906.
62. Huttunen K, Siponen T, Salonen I, Yli-Tuomi T, Aurela M, Dufva H, Hillamo
R, Linkola E, Pekkanen J, Pennanen A, Peters A, Salonen RO, Schneider A,Tiittanen P, Hirvonen MR, Lanki T (2012) Low-level exposure to ambient
particulate matter is associated with systemic inflammation in ischemic heartdisease patients. Environ Res 116: 44–51.
63. Barregard L, Sallsten G, Gustafson P, Andersson L, Johansson L, Basu S,Stigendal L (2006) Experimental exposure to wood-smoke particles in healthy
humans: effects on markers of inflammation, coagulation, and lipid peroxida-
tion. Inhal Toxicol 18: 845–853.64. Danesh J, Muir J, Wong YK, Ward M, Gallimore JR, Pepys MB (1999) Risk
factors for coronary heart disease and acute-phase proteins. A population-basedstudy. Eur Heart J 20: 954–959.
65. Balci B (2011) The modification of serum lipids after acute coronary syndrome
and importance in clinical practice. Curr Cardiol Rev 7: 272–276.66. Pfohl M, Schreiber I, Liebich HM, Haring HU, Hoffmeister HM (1999)
Upregulation of cholesterol synthesis after acute myocardial infarction–ischolesterol a positive acute phase reactant? Atherosclerosis 142: 389–393.
Particle-Induced Acute Phase Signalling in Mice
PLOS ONE | www.plosone.org 10 July 2013 | Volume 8 | Issue 7 | e69020
![Airport emission particles: exposure characterization and ... · acute phase response, neutrophil influx, and genotoxicity [16–22]. Genotoxicity was observed even at very low doses](https://static.cupdf.com/doc/110x72/600c130b7d30d71bcf0ee5e4/airport-emission-particles-exposure-characterization-and-acute-phase-response.jpg)